Pavement e c n a Evaluation/ 3n 1e t n 0 2 DEPARTMENT OF...
46
Pavement Evaluation/ Maintenance Management Program 2013 Prospect State Prospect State Airport Airport Prospect State Airport Pavement Pavement Consultants Inc. Consultants Inc. Pavement Consultants Inc. DEPARTMENT OF AVIATION Prospect State Airport Prospect State Airport Prospect State Airport Pavement Evaluation/Maintenance Pavement Evaluation/Maintenance Management Program 2013 Management Program 2013 Pavement Evaluation/Maintenance Management Program 2013
Transcript of Pavement e c n a Evaluation/ 3n 1e t n 0 2 DEPARTMENT OF...

Pavement Evaluation/MaintenanceManagement Program2013
Prospect StateProspect StateAirportAirport
Prospect StateAirport
Pavement Pavement Consultants Inc.Consultants Inc.
Pavement Consultants Inc.
DEPARTMENT OF
AVIATION
Pro
spe
ct
Sta
te
Air
po
rtP
rosp
ec
t S
tate
A
irp
ort
Pro
spe
ct
Sta
te
Air
po
rtP
av
em
en
t E
va
lua
tio
n/
Ma
inte
na
nc
eP
av
em
en
t E
va
lua
tio
n/
Ma
inte
na
nc
eM
an
ag
em
en
t P
rog
ram
2
01
3M
an
ag
em
en
t P
rog
ram
2
01
3P
av
em
en
t E
va
lua
tio
n/
Ma
inte
na
nc
eM
an
ag
em
en
t P
rog
ram
2
01
3

Oregon Department of Aviation
2013 Pavement Evaluation / Maintenance
Management Program
Final Report – Individual Airports Functional Category 5, Central Climatic Zone
Prepared for:
State of Oregon Department of Aviation
3040 25th Street SE Salem, Oregon 97303‐1125
Prepared by:
Pavement Consultants Inc. 7714 58th Avenue N.E.
Seattle, Washington 98115‐6339
December 2013

i
Table of Contents Introduction ...................................................................................................................... 1 Pavement Inventory ............................................................................................................. 3 Records Review ........................................................................................................ 3 Network Definition .................................................................................................. 3 Branch and Section Names ...................................................................................... 4 Network Identifiers .................................................................................................. 5 Network Identification ................................................................................. 5 Zone ............................................................................................................. 5 Functional Category ..................................................................................... 5 Funding Group ............................................................................................. 5 Ownership .................................................................................................... 5 Climatic Region ............................................................................................ 6 Branch or Section Identifiers ................................................................................... 6 Branch Use ................................................................................................... 6 Pavement Rank ............................................................................................ 6 Surface Type ................................................................................................. 6 Structural and Construction History Data ................................................................ 6 Field Verification ...................................................................................................... 7 Inspection Schedule ............................................................................................................. 8 Detailed Inspection ................................................................................................. 8 Methodology ................................................................................................ 8 Pavement Condition Index Calculation ........................................................ 10 Monthly Drive‐By Inspection ................................................................................... 10 Record Keeping and Data Retrieval ..................................................................................... 12 Pavement Condition Prediction ............................................................................... 13 Typical Maintenance Requirements .................................................................................... 16 Appendix: Your Airport Report

ii
Table of Contents (continued)
List of Figures 1. Monthly Drive‐By Inspection Form .......................................................................... 11 2. Performance Curve for Category 5 AAC Runways – Central Oregon ...................... 13 3. Performance Curve for Category 5 AC Taxiways – Central Oregon......................... 14 4. Performance Curve for Category 5 ST Taxiways – Central Oregon ......................... 14 5. Performance Curve for Category 5 AC Aprons – Central Oregon ............................ 15 6. Performance Curve for Category 5 ST Aprons – Central Oregon ............................ 15
List of Tables 1. Pavement Condition Index Distress Types and Related Causes .............................. 9 2. Selection of Number of Sample Units to Inspect ..................................................... 10 3. Micro PAVER Reports ............................................................................................... 12 4. Unit Costs for the Various Work Plan Activities ...................................................... 16

Introduction The Oregon Department of Aviation has been collecting pavement condition information at eligible airports since the mid 1980s. In January 1995 the Federal Aviation Administration (FAA) mandated that any airport sponsor receiving and/or requesting federal funds for pavement improvement projects must have implemented a pavement maintenance management program. Through the Department’s system planning efforts, the airports included in the Department’s Pavement Evaluation / Maintenance Management Program have been complying with the intent of the law since the mid 1980s, well ahead of the FAA mandate. The information collected during this study ensures that your airport continues to comply with the Federal mandate. The developed pavement maintenance management program, as it relates to an individual airport, is described in this report. The Oregon Department of Aviation routinely provides information to airport owners and operators throughout the State that assists them in maintaining and operating their airports. The State addresses many issues as part of their planning process, one of which is to provide to each individual airport, on a three‐year cycle, a report on pavement condition. Through the statewide study, pavement maintenance management programs for all eligible airports in the state are efficiently and economically completed through the Department of Aviation’s Pavement Evaluation / Maintenance Management Program. Each airport owner or operator makes frequent decisions about the timing and type of maintenance and repair activities that should be completed on their pavements to maintain acceptable surface condition and adequate load‐carrying capacity. The pavement maintenance management program described in this document, and supplemented by the information contained in the attached report prepared specifically for your airport, will assist you in making necessary decisions about pavement maintenance and rehabilitation projects at your airport, and will ensure compliance with the Federal mandate. To develop a pavement maintenance management program for each eligible airport, the Department of Aviation elected to conduct pavement evaluations (visual inspections), and to implement the Micro PAVER pavement maintenance management software. These activities were completed as part of the Department’s Continuous Aviation System Plan efforts. Micro PAVER uses the evaluation results to efficiently identify pavements requiring maintenance and rehabilitation, and to establish project priorities. The software can also be used to assess overall pavement network condition, prepare and forecast the budgets required to maintain the network at an acceptable condition level, and identify required maintenance and rehabilitation activities. The federally mandated pavement maintenance management program identifies five major requirements:

2
Pavement inventory
Inspection schedule (detailed and monthly)
Record keeping
Information retrieval
Program funding The approach taken to meet these program requirements for your airport is described in this report.

3
Pavement Inventory The FAA‐mandated Pavement Inventory requirement specifies that information about each piece of pavement at an airport be compiled. This information is to include, at a minimum: pavement location, pavement dimensions, pavement surface type, and last construction date. The process used to develop this information is discussed under “Records Review”. Additionally, information is collected about the pavements at an airport so its pavement network can be defined. After the pavement network is defined, pavement inspections can be completed and a pavement maintenance management program can be developed. The methodology for defining the pavement network follows the Records Review discussion.
Records Review The first step in meeting FAA’s pavement maintenance management program requirement is to develop a maintenance and construction history for all pavements at an airport. For the past 28 years the Oregon Department of Aviation has, for its eligible airports, been conducting pavement evaluations to determine existing condition. In 1991 Pavement Consultants Inc. began assisting the Department in their efforts to compile and update that information. The information collected was used to develop a pavement maintenance management program for each eligible airport as described in this report, and your attached individual airport report. Previous State‐sponsored projects identified pavement layout, pavement construction history and pavement condition at each eligible airport. During this inspection cycle these documents were reviewed, and follow‐up inquiries on pavement construction history were directed to the Oregon Department of Aviation, the FAA, consultants and airport sponsors. Based on this review, pavement boundaries were identified at your airport and were placed on an AutoCAD‐generated base map (see Figure 1 in your attached airport report). The established base map fulfills the FAA "Pavement Inventory" requirement for locating pavements, identifying their dimensions, and identifying pavement type and age.
Network Definition Once the pavement history at an airport has been compiled, individual pavement features can be identified, a process called network definition. These pavement features are defined on the basis of: primary use, construction history, and traffic pattern. Each airport is divided into features according to the guidelines contained in the current edition of ASTM International‐Standard D5340, Standard Test Method for Airport Condition Index Surveys. The pavement features used in this project are defined as follows.
4
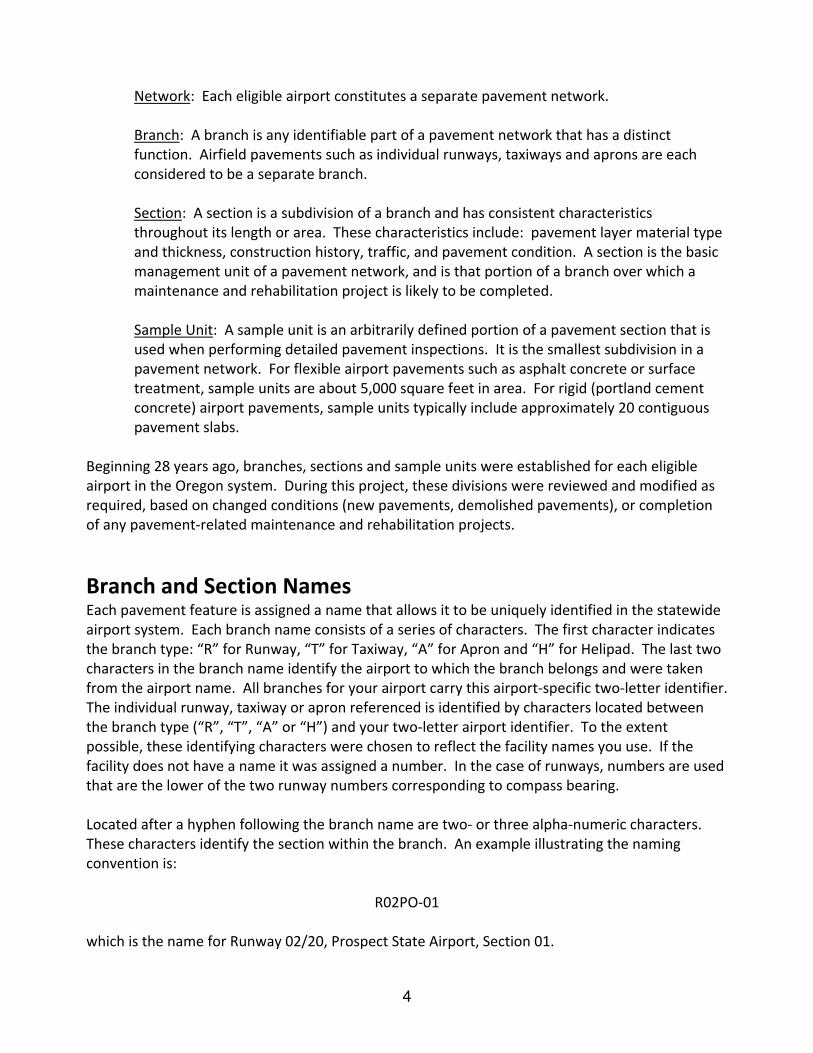
Network: Each eligible airport constitutes a separate pavement network. Branch: A branch is any identifiable part of a pavement network that has a distinct function. Airfield pavements such as individual runways, taxiways and aprons are each considered to be a separate branch. Section: A section is a subdivision of a branch and has consistent characteristics throughout its length or area. These characteristics include: pavement layer material type and thickness, construction history, traffic, and pavement condition. A section is the basic management unit of a pavement network, and is that portion of a branch over which a maintenance and rehabilitation project is likely to be completed. Sample Unit: A sample unit is an arbitrarily defined portion of a pavement section that is used when performing detailed pavement inspections. It is the smallest subdivision in a pavement network. For flexible airport pavements such as asphalt concrete or surface treatment, sample units are about 5,000 square feet in area. For rigid (portland cement concrete) airport pavements, sample units typically include approximately 20 contiguous pavement slabs.
Beginning 28 years ago, branches, sections and sample units were established for each eligible airport in the Oregon system. During this project, these divisions were reviewed and modified as required, based on changed conditions (new pavements, demolished pavements), or completion of any pavement‐related maintenance and rehabilitation projects.
Branch and Section Names Each pavement feature is assigned a name that allows it to be uniquely identified in the statewide airport system. Each branch name consists of a series of characters. The first character indicates the branch type: “R” for Runway, “T” for Taxiway, “A” for Apron and “H” for Helipad. The last two characters in the branch name identify the airport to which the branch belongs and were taken from the airport name. All branches for your airport carry this airport‐specific two‐letter identifier. The individual runway, taxiway or apron referenced is identified by characters located between the branch type (“R”, “T”, “A” or “H”) and your two‐letter airport identifier. To the extent possible, these identifying characters were chosen to reflect the facility names you use. If the facility does not have a name it was assigned a number. In the case of runways, numbers are used that are the lower of the two runway numbers corresponding to compass bearing. Located after a hyphen following the branch name are two‐ or three alpha‐numeric characters. These characters identify the section within the branch. An example illustrating the naming convention is:
R02PO‐01 which is the name for Runway 02/20, Prospect State Airport, Section 01.

5
The branches, sections and sample units identified for your airport are shown on Figure 2 in your attached individual airport report.
Network Identifiers Several designators are used to describe information about a particular airport included in the State System Plan. These designators include: network identification, zone, functional category, funding group, ownership and climatic region.
Network Identification Each airport in the statewide system is assigned a unique network identifier (name). This name is typically the name of the city in which the airport is located. The network identification name for your airport can be found in the appendices attached to your airport report. This network identification name is assigned so that an individual airport or a group of airports contained in the statewide database can be selected for evaluation. The statewide database contains information for all eligible airports in the State.
Zone Zones are used to allow individual airports within the statewide database to be separately selected for analysis. The FAA airport designator is used as the zone designator.
Functional Category Each airport is assigned a functional category based on its classification within the State System Plan. Each airport is assigned a functional category of either 1, 2, 3, 4 or 5 in accordance with the criteria set forth in the System Plan. These categories correspond to the following airport types: commercial service, business or high activity general aviation, regional general aviation, community general aviation, and low activity general aviation, respectively. The category assigned to your airport is listed in the appendices attached to your airport report. This category assignment allows groups of airports in different functional categories to be separately evaluated.
Funding Group Airports in the State are categorized as either NPIAS or non‐NPIAS. NPIAS designated airports are eligible for project funding under the FAA’s Airport Improvement Program (AIP). Being designated as NPIAS or non‐NPIAS in the database allows the Department to evaluate funding alternatives for the State airport system.
Ownership Airport ownership is designated as Public, State or Private. This designation allows the Department to evaluate funding allocations based on eligibility for State and/or Federal funding.

6
Climatic Region Each airport in the statewide system is assigned to one of three climatic regions ‐ eastern, central or coastal. Because climatic conditions can impact pavement performances, assigning airports to a climatic region allows pavement performance to be more accurately modeled resulting in more accurate pavement condition forecasts.
Branch or Section Identifiers Several designators are used to describe a branch or section’s function, importance or construction. These characteristics are: branch use, pavement rank, and surface type.
Branch Use Branch use identifies the primary use of each distinct pavement area. For each airport pavement included in this study, a branch use of "Runway", "Taxiway", "Apron" or “Helipad” is assigned, as appropriate.
Pavement Rank Pavement rank refers to the relative importance assigned to multiple facilities having the same branch use. Each pavement section is assigned a rank of primary (“P”), secondary (“S”) or tertiary (“T”) as appropriate. As an example, an airport with two runways might rank the more heavily used runway as primary and the lesser‐used runway as secondary. The pavement rank assigned to each pavement section at your airport can be found in the appendices attached to your individual airport report.
Surface Type Each pavement section is assigned a surface type designator based on the type of surface material present. Throughout the State seven (7) surface types were encountered: asphalt overlay over asphalt concrete (AAC), asphalt concrete (AC), asphalt concrete over cement treated base (ACT), asphalt overlay over portland cement concrete (APC), asphalt concrete over pozzolanic base (APZ), portland cement concrete (PCC), and surface treatment (ST). The surface type assigned to each pavement section at your airport is provided in the report appended to this document. Surface type identification fulfills one of FAA’s "Pavement Inventory" requirements.
Structural and Construction History Data Available construction records for each airport were obtained from the Oregon Department of Aviation, Federal Aviation Administration, or consultants. These records were reviewed to establish a last construction date for each pavement section. Additional information was requested from individual airport sponsors to update or clarify this information, as necessary. The last construction date and known construction history for each pavement section can be found on Figure 1 in your individual airport report. The last construction date is also identified in the reports found in the attached appendixes. For those pavement sections where information was

7
not available, a last construction date was assigned based on pavement condition. Last construction date identification fulfills the final FAA "Pavement Inventory" requirement.
Field Verification Information obtained through the records review and discussions with airport sponsors, Department of Aviation staff, FAA personnel and consultant staff was field‐verified to ensure that each facility is accurately mapped and properly subdivided into branches and sections. Modifications to the maps, and/or branch and section divisions, were made as necessary wherever discrepancies in airport geometry, paving materials, or construction history were found during the visual inspections.

8
Inspection Schedule The FAA's Pavement Maintenance Management Program guidelines require all airports seeking or receiving federal funds for pavement‐related projects to complete both detailed and drive‐by inspections. The guidelines require that detailed inspections be performed yearly, unless the inspections are conducted in accordance with the Pavement Condition Index methodology set forth in ASTM D5340, at which point detailed inspections are required once every three years. The Pavement Condition Index methodology is used to inspect Oregon’s airports. Each airport is inspected on a three‐year cycle thus complying with the FAA detailed inspection requirement. The drive‐by inspections required by the FAA are to be completed monthly. These inspections are cursory inspections that are performed to detect any unexpected changes in pavement condition. A description of the detailed inspection methodology, as well as an approach to completing the monthly drive‐by inspections, is provided below.
Detailed Inspection Methodology Pavement Condition Index (PCI) surveys were performed in October 2013 for all airports included in this year’s project. The surveys were performed using the Pavement Condition Index (PCI) methodology developed by the U.S. Army Corps of Engineers, and outlined in the current edition of ASTM D‐5340, Standard Test Method for Airport Condition Index Surveys. This document defines distress types, severity levels, and methods for measuring and recording distresses. The PCI procedure was developed to collect data that would provide engineers and managers with a numerical value indicating overall pavement condition, and that would reflect both pavement structural integrity and surface operational condition. The procedure was designed to be highly repeatable and was found to be well‐correlated with the judgment of experienced pavement engineers. A PCI survey is performed by measuring the amount and severity of certain defined distresses (defects) observed in a sample unit. Table 1 lists both the asphalt concrete and portland cement concrete pavement distress types considered in the PCI method, and also identifies their most common cause (load, climate/durability, other) as assigned by the Micro PAVER software. Load‐related distresses are apparent where the pavement has been over‐stressed by traffic loads applied to its surface. Climate/durability‐related distresses arise due to exposure to the environment. Other‐related distresses are caused by actions not related to load or climate such as fuel spills or construction deficiencies.

9
Table 1. Pavement Condition Index Distress Types and Related Causes.
Asphalt Concrete Portland Cement Concrete
Pavement Distress Related Cause Pavement Distress Related Cause
Alligator Cracking Load Blow‐Up Climate/Durability
Bleeding Other Corner Break Load
Block Cracking Climate/Durability Cracks: Longitudinal,
Transverse, and Diagonal
Load
Corrugation Other Durability ("D") Crack Climate/Durability
Depression Other Joint Seal Damage Climate/Durability
Jet Blast Erosion Other Patching, Small Other
Joint Reflection Cracking Climate/Durability Patching, Large and
Utility Cuts Other
Longitudinal and Transverse Cracking
Climate/Durability Popouts Other
Oil Spillage Other Pumping Other
Patching and Utility Cut Patching
Climate/Durability Scaling, Map Cracking,
Crazing Other
Polished Aggregate Other Settlement or Faulting Other
Raveling Climate/Durability Shattered Slab /
Intersecting Cracks Load
Rutting Load Shrinkage Cracks Other
Shoving Other Spalling (Longitudinal and Transverse Joint)
Other
Slippage Cracking Other Spalling (Corner) Other
Swell Other Alkali Silica Reaction
(ASR) Other
Weathering Climate/Durability
To obtain a statistically reliable PCI for a given pavement section it is not necessary to inspect all sample units in that section. A pre‐determined number of randomly chosen sample units are selected for inspection based on the total number of sample units in the section. The sampling rates used during this study are shown in Table 2. The sampling rates contained in Table 2 result in data that are reliable at a 92 percent confidence level.

10
Table 2. Selection of Number of Sample Units to Inspect.
Flexible Pavement Rigid Pavement
N n N n
1 1 1 1
2 ‐ 3 2 2 2
4 ‐ 6 3 3 ‐ 4 3
7 ‐ 13 4 5 ‐ 6 4
14 ‐ 38 5 7 ‐ 8 5
39 + 6 9 ‐ 11 6
12 ‐ 14 7
15 ‐ 19 8
20 ‐ 27 9
28 ‐ 38 10
39 ‐ 58 11
59 ‐ 104 12
105 ‐ 313 13
314 + 14
Where: N = Total number of sample units in a pavement section n = Number of sample units to be surveyed
Pavement Condition Index Calculation To calculate a PCI for a given sample unit, each distress type observed is assigned a deduct value based on its density (frequency of occurrence) in that sample area, and its severity. All deducts are summed and subsequently adjusted (corrected) for the number of different distresses found. This corrected deduct value is subtracted from 100, the PCI for a "perfect" pavement, to arrive at a PCI for that particular sample unit. The PCI for a pavement section is the area‐weighted average PCI value of all sample units evaluated in that section. Pavement Condition Ratings (PCRs) are associated with ranges of PCI values. The color‐coded Figure 3 in your attached individual airport report shows the PCRs and their associated PCI ranges, as well as the pavement condition at your airport in October 2013.
Monthly Drive‐By Inspection As part of the FAA‐mandated pavement maintenance management program, a monthly drive‐by inspection is required. This inspection is intended to identify abrupt changes in condition occurring since the last monthly inspection, and to record any maintenance activities completed during the previous month. This inspection can easily be accomplished by driving your airport and noting any changes or maintenance performed on the form provided in Figure 1. Each drive‐by inspection must note the date the inspection was completed, and record any maintenance performed since the last inspection. These records must be kept on‐file for five years.

11
Figure 1. Monthly Drive‐By Inspection Form. Airport: _________________________________________ Date: ___________________________________________ Inspector: _______________________________________
Branch* Section* Distresses Observed Maintenance Performed Since Last Inspection
* Refer to the “Airport Layout, Dimensions and Pavement Cross‐Sections” or “Pavement Branch,
Section and Sample Unit Layout” figures in your airport report.

12
Record Keeping and Data Retrieval The FAA pavement maintenance management program requires that compiled records be kept for five years. To facilitate record keeping and data retrieval at the State level, the Micro PAVER pavement maintenance management software was implemented. Micro PAVER provides the Oregon Department of Aviation with a method for storing data and generating reports. Micro PAVER was developed by the U.S. Army Construction Engineering Research Laboratory (USA‐CERL). The program uses the guidelines contained in the current edition of ASTM D5340 as its basis. The current version, Version 6.5.7, is a Windows‐based program that can store pavement condition information, as well as construction and maintenance history information. Using the data stored in the Micro PAVER database the user has many capabilities, including: evaluating current condition, predicting future condition, determining maintenance and rehabilitation needs, scheduling future inspections, and preparing budget estimates. The statewide database containing the information for all evaluated airports was updated during this project. Information for each individual airport can easily be extracted from the statewide database. The database allows required records to be stored indefinitely, thus meeting the FAA requirement that records be maintained for a five‐year period. Additionally, the software allows data to be retrieved quickly and efficiently. After data were entered into the State’s Micro PAVER database for each inspected airport, the software was used to analyze the stored data and to generate useful reports. The reports described in Table 3 were generated for your airport and are provided as appendices to your individual airport report.
Table 3. Micro PAVER Reports.
Report Name Report Description
Branch Condition
Lists information about each branch, including: network identification, branch identification, name, use, number of sections, total branch area and the average and area‐weighted average PCI for the entire branch.
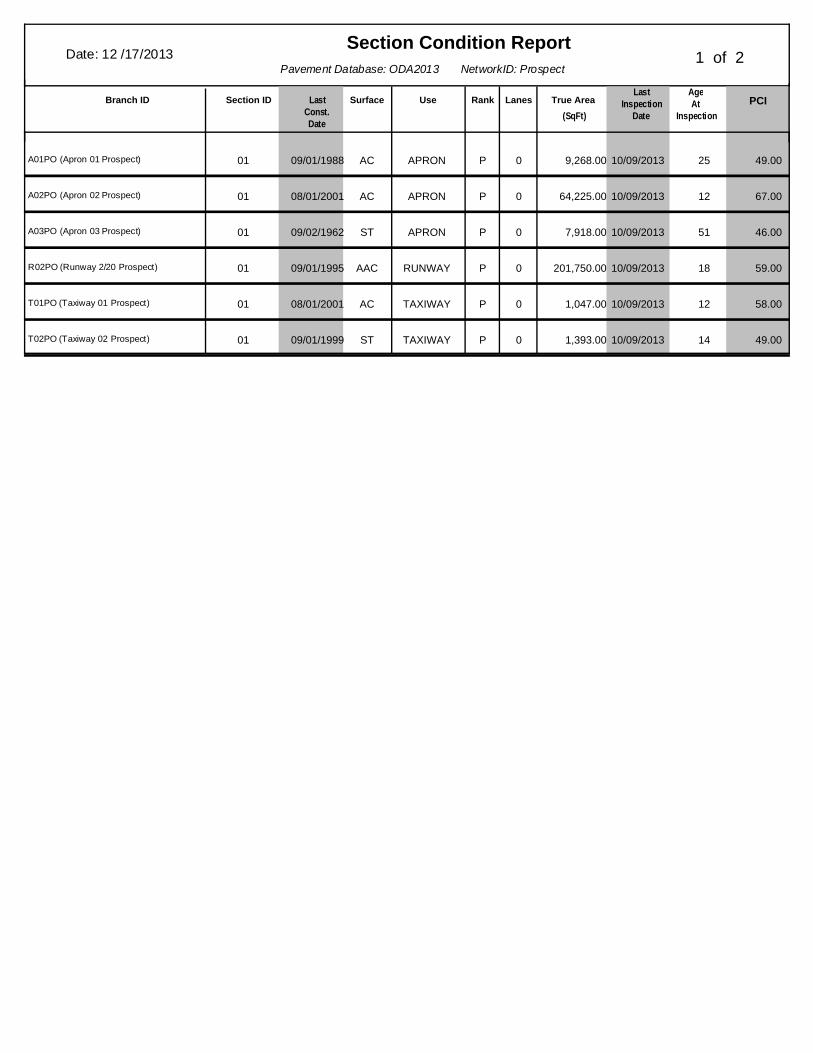
Section Condition
Provides information about each section, including: branch identification and section number, last construction date, surface type, use, rank, section area, last inspection date, age of pavement at last inspection and the PCI at the last inspection.
Network Maintenance
Applies the stored distress maintenance policy to the pavement network and identifies the type and cost of routine maintenance required across the entire network. Information in this report is listed by section.
Re‐Inspection Summarizes the distress data collected during the most recent inspection and provides the PCI for each sample unit inspected, as well as summary information about the section.

13
Pavement Condition Prediction To allow future pavement condition to be predicted, data collected throughout the State were used to generate "performance curves". The curves were developed based on surface type, use, airport functional category and climatic region. These curves (models) are used to predict future pavement condition by assuming the behavior of an individual pavement section is similar to the behavior of the pavement sections used to generate the "performance curve". Figures 2 through 8 show the “performance curves” used to model pavements in your airport’s functional category and climatic region.
Figure 2. Performance Curve for Category 5 AAC Runways – Central Oregon.
Pa
ve
me
nt
Co
nd
itio
n I
nd
ex
Age (years)
0
25
50
75
100
0 5 10 15 20

14
Figure 3. Performance Curve for Category 5 AC Taxiways – Central Oregon.
Figure 4. Performance Curve for Category 5 ST Taxiways – Central Oregon.
Pa
ve
me
nt
Co
nd
itio
n I
nd
ex
Age (years)
0
25
50
75
100
0 5 10 15 20 25 30 35 40
Pa
ve
me
nt
Co
nd
itio
n I
nd
ex
Age (years)
0
25
50
75
100
0 5 10 15 20 25 30

15
Figure 5. Performance Curve for Category 5 AC Aprons – Central Oregon.
Figure 6. Performance Curve for Category 5 ST Aprons – Central Oregon.
Pa
ve
me
nt
Co
nd
itio
n I
nd
ex
Age (years)
0
25
50
75
100
0 5 10 15 20 25 30 35 40
Pa
ve
me
nt
Co
nd
itio
n I
nd
ex
Age (years)
0
25
50
75
100
0 5 10 15 20 25 30

16
Typical Maintenance Requirements The Micro PAVER‐generated M&R Plan Report was used to identify when pavement maintenance and rehabilitation projects are required for a given pavement section, and what repair type is most appropriate. The repair strategies evaluated were:
Reconstruction (pavements with Pavement Condition Indices less than 40).
Overlay flexible pavements (runways with Pavement Condition Indices between 40 and 60, taxiways between 40 and 55, aprons between 40 and 50, and pavements exhibiting significant load‐related distress with PCIs above the critical PCI).
Global maintenance (fog seal, slurry seal or thin (2 inch) overlay) applied on a user‐specified interval (6 years for a fog seal, 6 years for a slurry seal, and 10 years for an overlay). The global maintenance type recommended is based on the distress types observed in the section during the visual inspections.
Routine maintenance, such as crack sealing and patching. The M&R Plan Report was generated for a 5‐year period beginning in June 2014. Included in the work plan are estimated costs for each recommended project. The costs are estimated by applying a unit cost for the recommended activity to the square foot area of the pavement section. The unit costs include adjustments for engineering and administration, mobilization, restriping and contingency. The unit costs used to develop the work plan activity cost are shown in Table 4. The recommended work plan for your airport is provided in your attached individual airport report.
Table 4. Unit Costs for the Various Work Plan Activities.
Activity Unit Unit Cost
Fog Seal SF $0.12
Slurry Seal SF $0.23
2” Asphalt Concrete Overlay SF $2.50
Reconstruction SF $4.80

Yo
ur A
irpo
rt Rep
ort

Prospect State Airport 12/2013
PROSPECT STATE AIRPORT
This report describes how your Pavement Maintenance Management Program (PMMP) was developed. Your Program was developed as part of the Oregon Continuous Aviation System Plan sponsored in part by the Oregon Department of Aviation and the Federal Aviation Administration (FAA). The information and data contained in this report ensures you are in compliance with the requirements of FAA Grant Assurance Number 11 which states that any airport requesting federal funds for pavement improvement projects must have implemented a
pavement maintenance management program.
DATA COLLECTION To determine how your pavements were constructed and their age, a records review was conducted. Figure PO‐1 shows the records review results. This figure identifies pavement boundaries, dimensions, pavement layer types, thicknesses and dates of construction. The most recent construction date for each pavement can also be found in the Section Condition Report in Appendix 2. Figure PO‐1 and the information contained in Appendices 1, 2 and 4 ensure that your airport complies with the “pavement inventory” requirement of FAA’s PMMP guidelines. The pavements at your airport were divided into branches, sections and sample units in accordance with the methodology outlined in the current edition of ASTM D5430, Standard Test Method for Airport Condition Index Surveys. The branches, sections and sample units established at your airport are shown in Figure PO‐2. A Branch Condition Report showing all branches, their associated areas, and their area‐weighted average condition is provided in Appendix 1. Additionally, the Appendix 2 Section Condition Report provides information used to define each branch and section in the Micro PAVER database. Using the branch, section and sample unit divisions established, a visual condition survey was conducted at Prospect State Airport in October 2013. During the inspection, pavement defects were identified and measured in accordance with the methodology outlined in ASTM D5430. This inspection ensures your airport complies with the “detailed inspection” requirement of FAA’s PMMP guidelines. After collection, the data were entered into the Micro PAVER software for analysis. These data are reproduced in the Re‐Inspection Report attached as Appendix 4. The Micro PAVER database updated during this project ensures your airport complies with the “record keeping and information retrieval” requirements of FAA’s PMMP guidelines.


Prospect State Airport 12/2013
RESULTS Using the data collected during the visual inspection, the Micro PAVER software was used to calculate an area‐weighted average Pavement Condition Index (PCI) for each pavement section inspected using the sample units evaluated. Using each section‘s PCI, a Pavement Condition Rating (PCR) was assigned. The PCIs measured during this inspection are shown in Table 1. The table also contains PCIs from past inspections as well as projected PCIs for 2018 and 2023. The projections were based on pavement deterioration models developed by Micro PAVER using the inspection data from other pavements in the same airport category as your airport, located in the same climatic region, and with the same surface type and use. The ASTM Standard which governs the methodology for conducting the visual inspections was modified in 2010 and could result in changes to the Pavement Condition Index for the current inspection relative to that from the previous inspections. So a slight increase in the PCI value over the PCI values from previous inspections is possible, even if no work has been completed on the pavement. The Branch Condition Report in Appendix 1 summarizes current pavement condition by branch while the Section Condition Report in Appendix 2 lists pavement condition by section. The current PCR is shown graphically in Figure PO‐3.
Table 1. Past, Present and Future Pavement Condition Indices.
Branch Section Inspections Forecast
2005 2009 2013 2018 2023
A01PO 1 67 65 49 44 38
A02PO 1 93 70 67 62 60
A03PO 1 50 53 46 38 33
R02PO 1 64 51 59 31 4
T01PO 1 93 72 58 44 31
T02PO 1 38 0 49 45 44
Section PCIs at Prospect State Airport range from a low of 46 (a PCR of “Poor”) to a high of 67 (a PCR of “Fair”). The area‐weighted average PCI for all airport pavements is 60, corresponding to an overall PCR of “Fair”. Figure PO‐4 shows how much pavement area is associated with each Pavement Condition Rating category and also shows pavement condition distribution from the inspections conducted in 2005 and 2009. The primary distresses observed during the inspection were: block cracking, and longitudinal and transverse cracking, with isolated occurrences of alligator cracking and raveling.
A graphical representation of the projected PCIs listed in Table 1 is shown in Figure PO‐5.


Prospect State Airport 12/2013
22.9
%
0.0%
73.9
%
2.8%
0.5%
0.0%
0.0%
0.0%
0.4%
25.7
%
73.4
%
0.0%
0.0%
0.5%
0.0%
0.0%
93.5
%
6.5%
0.0%
0.0%
0.0%
0%
10%
20%
30%
40%
50%
60%
70%
80%
90%
100%
Good Satisfactory Fair Poor Very Poor Serious Failed
Pav
emen
t A
rea
(%)
Pavement Condition Rating
Figure PO-4. Pavement Condition DistributionProspect State Airport
2005
2009
2013

Prospect State Airport 12/2013
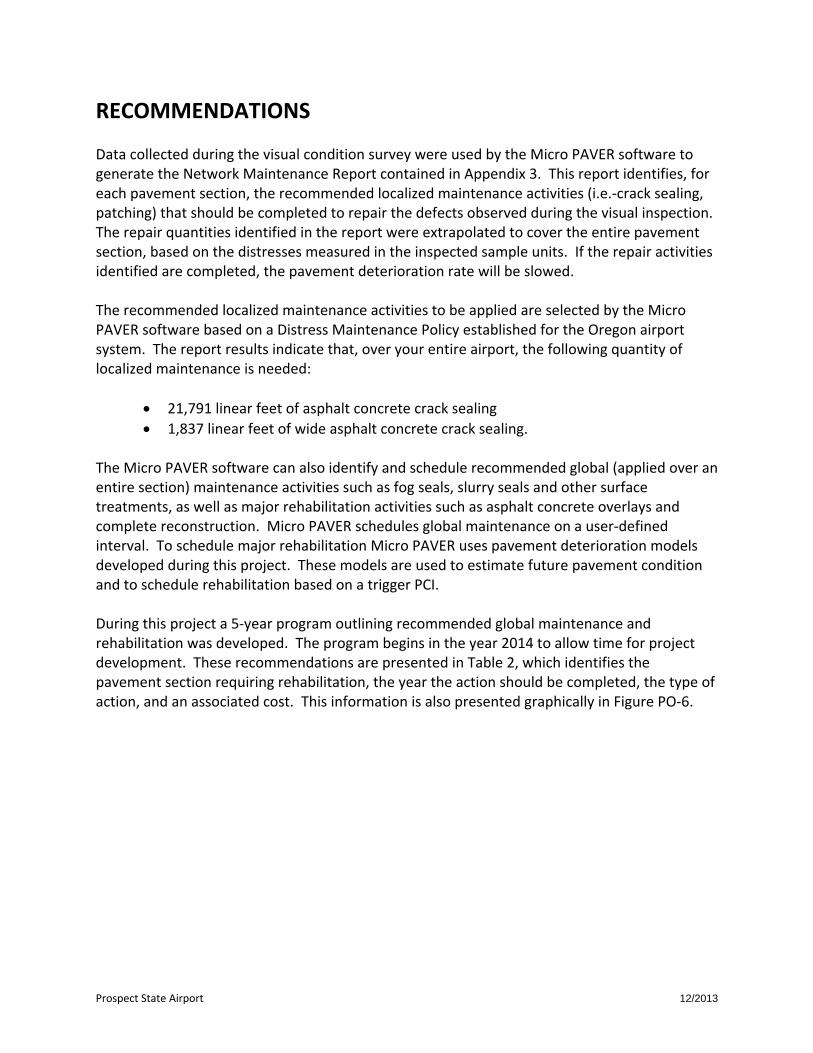
RECOMMENDATIONS Data collected during the visual condition survey were used by the Micro PAVER software to generate the Network Maintenance Report contained in Appendix 3. This report identifies, for each pavement section, the recommended localized maintenance activities (i.e.‐crack sealing, patching) that should be completed to repair the defects observed during the visual inspection. The repair quantities identified in the report were extrapolated to cover the entire pavement section, based on the distresses measured in the inspected sample units. If the repair activities identified are completed, the pavement deterioration rate will be slowed. The recommended localized maintenance activities to be applied are selected by the Micro PAVER software based on a Distress Maintenance Policy established for the Oregon airport system. The report results indicate that, over your entire airport, the following quantity of localized maintenance is needed:
21,791 linear feet of asphalt concrete crack sealing
1,837 linear feet of wide asphalt concrete crack sealing. The Micro PAVER software can also identify and schedule recommended global (applied over an entire section) maintenance activities such as fog seals, slurry seals and other surface treatments, as well as major rehabilitation activities such as asphalt concrete overlays and complete reconstruction. Micro PAVER schedules global maintenance on a user‐defined interval. To schedule major rehabilitation Micro PAVER uses pavement deterioration models developed during this project. These models are used to estimate future pavement condition and to schedule rehabilitation based on a trigger PCI. During this project a 5‐year program outlining recommended global maintenance and rehabilitation was developed. The program begins in the year 2014 to allow time for project development. These recommendations are presented in Table 2, which identifies the pavement section requiring rehabilitation, the year the action should be completed, the type of action, and an associated cost. This information is also presented graphically in Figure PO‐6.

Prospect State Airport 12/2013
Table 2. Five‐Year Global Maintenance and Rehabilitation Plan.
Year Branch Section Action Area (sf)
Unit Cost ($/sf)
Total Cost ($)
2014 A01PO 1 Slurry Seal 9,268 $0.23 $2,132
2014 A02PO 1 Slurry Seal 64,225 $0.23 $14,772
2014 A03PO 1 Slurry Seal 7,918 $0.23 $1,821
2014 R02PO 1 Slurry Seal 201,750 $0.23 $46,403
2014 T01PO 1 Slurry Seal 1,047 $0.23 $241
2014 T02PO 1 Slurry Seal 1,393 $0.23 $320
2014 Total $65,688
TOTAL $65,688
If the global maintenance and/or rehabilitation activities recommended in Table 2 are not completed, the localized maintenance activities identified in the Network Maintenance Report (Appendix 3) for that section should be done. Additionally, for those sections not listed in Table 2 as requiring global maintenance or rehabilitation, the localized maintenance activities outlined in the Network Maintenance Report should be completed. By completing the localized maintenance activities, pavement condition is improved, life is extended, deterioration is slowed and the length of time until major repair or rehabilitation is required is increased.
INSPECTION SCHEDULE To comply with the inspection schedule requirement of FAA Grant Assurance Number 11, a detailed visual inspection should be conducted every 3 years using the methodology described in ASTM D5430. The next scheduled detailed visual inspection should take place in 2016. In addition, the FAA requires that a drive‐by inspection be conducted monthly to detect unforeseen changes in pavement condition. The results of each drive‐by inspection should be recorded and kept in a file. At a minimum, the date of the inspection and an indication of any maintenance performed since the last drive‐by inspection should be recorded.


Appendix 1 Branch Condition Report

Pavement Database: ODA2013 NetworkID: Prospect
Branch Condition ReportDate: 12 /17/2013 1 of 2
(SqFt)
True AreaUse
Number ofSectionsBranch ID
PCIStandardDeviation
WeightedAverage
PCI
AveragePCI
Sum Section Length
(Ft)
Avg SectionWidth
(Ft)
A01PO (Apron 01 Prospect) 1 9,268.00 APRON 49.00 0.00 49.00200.00 70.00
A02PO (Apron 02 Prospect) 1 64,225.00 APRON 67.00 0.00 67.00635.00 115.00
A03PO (Apron 03 Prospect) 1 7,918.00 APRON 46.00 0.00 46.00200.00 60.00
R02PO (Runway 2/20 Prospect) 1 201,750.00 RUNWAY 59.00 0.00 59.004,035.00 50.00
T01PO (Taxiway 01 Prospect) 1 1,047.00 TAXIWAY 58.00 0.00 58.0025.00 35.00
T02PO (Taxiway 02 Prospect) 1 1,393.00 TAXIWAY 49.00 0.00 49.0025.00 45.00

Date: 12 /17/2013 Branch Condition ReportPavement Database: ODA2013
2 of 2
54.00
59.00
53.50
54.67
9.27
0.00
4.50
7.32
81,411.00
201,750.00
2,440.00
285,601.00
TotalArea(SqFt)
UseCategory
Numberof
Sections
ArithmeticAverage
PCI
AveragePCI
STD.
WeightedAverage
PCI
3
1
2
6All
TAXIWAY
RUNWAY
APRON 62.91
59.00
52.86
60.06

Appendix 2 Section Condition Report
Pavement Database: ODA2013 NetworkID: Prospect
Section Condition ReportDate: 12 /17/2013 1 of 2
AgeAt
Inspection
LastInspection
Date(SqFt)
True AreaLanesRankUseSurfaceLastConst.Date
Section IDBranch ID PCI
09/01/198801A01PO (Apron 01 Prospect) 10/09/2013 49.00AC APRON P 0 9,268.00 25
08/01/200101A02PO (Apron 02 Prospect) 10/09/2013 67.00AC APRON P 0 64,225.00 12
09/02/196201A03PO (Apron 03 Prospect) 10/09/2013 46.00ST APRON P 0 7,918.00 51
09/01/199501R02PO (Runway 2/20 Prospect) 10/09/2013 59.00AAC RUNWAY P 0 201,750.00 18
08/01/200101T01PO (Taxiway 01 Prospect) 10/09/2013 58.00AC TAXIWAY P 0 1,047.00 12
09/01/199901T02PO (Taxiway 02 Prospect) 10/09/2013 49.00ST TAXIWAY P 0 1,393.00 14

Date: 12 /17/2013 Section Condition ReportPavement Database: ODA2013
2 of 2
PCIStandardDeviation
58.00
59.00
49.00
46.00
54.67
66.48
59.00
49.00
46.00
60.06
3
1
1
1
6
66,665.00
201,750.00
9,268.00
7,918.00
285,601.00
AverageAge At
Inspection
Numberof
Sections
12.67
18.00
25.00
51.00
22.00All
over 40
21-25
16-20
11-15
TotalArea
(SqFt)
AgeCategory
ArithmeticAverage
PCI
WeightedAverage
PCI
9.00
0.00
0.00
0.00
8.02

Appendix 3 Network Maintenance Report

Network Maintenance Report 2013
Prospect State Airport
Network Branch Section Distress Severity ActionMaint.
QuantityUnit Unit Cost Work Cost
Section
Total Cost
Prospect A01PO 1 BLOCK CR H Crack Seal ‐ Wide Cracks 270 Ft $18.00 $4,861 $5,335
Prospect A01PO 1 BLOCK CR M Crack Sealing ‐ AC 270 Ft $0.75 $203
Prospect A01PO 1 L & T CR M Crack Sealing ‐ AC 362 Ft $0.75 $272
Prospect A03PO 1 BLOCK CR M Crack Sealing ‐ AC 1,930 Ft $0.75 $1,448 $1,628
Prospect A03PO 1 L & T CR M Crack Sealing ‐ AC 240 Ft $0.75 $180
Prospect R02PO 1 BLOCK CR H Crack Seal ‐ Wide Cracks 1,537 Ft $18.00 $27,672 $41,888
Prospect R02PO 1 BLOCK CR M Crack Sealing ‐ AC 1,537 Ft $0.75 $1,153
Prospect R02PO 1 L & T CR M Crack Sealing ‐ AC 17,418 Ft $0.75 $13,063
Prospect T01PO 1 L & T CR H Crack Seal ‐ Wide Cracks 30 Ft $18.00 $540 $566
Prospect T01PO 1 L & T CR M Crack Sealing ‐ AC 34 Ft $0.75 $26
$49,416TOTAL
NM‐1

Appendix 4 Re-Inspection Report

Re-inspection ReportODA2013Report Generated Date:December 17, 2013
Network: Prospect Prospect StateName:
Use: APRON SqFt9,268.00Area:Apron 01 ProspectName:A01POBranch:
01Section: of Last Const.:-To:Runway 02 EndFrom:1 09/01/1988Surface: AC Family: Zone: 64S Category: J Rank: POR-Cat5-AC-Central-AP-2012
Area: SqFt 200.00 70.00FtLength: Width: Ft9,268.00
Street Type:Shoulder: Grade: 0.00 Lanes: 0
Section Comments:
2Surveyed:2Total Samples:Last Insp. Date: 10/09/2013Conditions: PCI : 49Inspection Comments:
Sample Number: 01 Type: R Area: SqFt5,911.00 PCI = 38Sample Comments:43 BLOCK CRACKING L 886.00 SqFt Comments:43 BLOCK CRACKING M 886.00 SqFt Comments:43 BLOCK CRACKING H 886.00 SqFt Comments:48 LONGITUDINAL/TRANSVERSE CRACKING M 106.00 Ft Comments:
Sample Number: 02 Type: R Area: SqFt3,357.00 PCI = 68Sample Comments:48 LONGITUDINAL/TRANSVERSE CRACKING M 256.00 Ft Comments:

Re-inspection ReportODA2013Report Generated Date:December 17, 2013
Network: Prospect Prospect StateName:
Use: APRON SqFt64,225.00Area:Apron 02 ProspectName:A02POBranch:
01Section: of Last Const.:FenceTo:Taxiway 01, 02From:1 08/01/2001Surface: AC Family: Zone: 64S Category: J Rank: POR-Cat5-AC-Central-AP-2012
Area: SqFt 635.00 115.00FtLength: Width: Ft64,225.00
Street Type:Shoulder: Grade: 0.00 Lanes: 0
Section Comments:
5Surveyed:14Total Samples:Last Insp. Date: 10/09/2013Conditions: PCI : 67Inspection Comments:
Sample Number: 01 Type: R Area: SqFt4,993.00 PCI = 67Sample Comments:43 BLOCK CRACKING L 3,994.00 SqFt Comments:
Sample Number: 03 Type: R Area: SqFt5,000.00 PCI = 67Sample Comments:43 BLOCK CRACKING L 4,000.00 SqFt Comments:
Sample Number: 05 Type: R Area: SqFt5,000.00 PCI = 67Sample Comments:43 BLOCK CRACKING L 4,000.00 SqFt Comments:
Sample Number: 07 Type: R Area: SqFt5,000.00 PCI = 67Sample Comments:43 BLOCK CRACKING L 4,000.00 SqFt Comments:
Sample Number: 08 Type: R Area: SqFt5,000.00 PCI = 67Sample Comments:43 BLOCK CRACKING L 4,000.00 SqFt Comments:

Re-inspection ReportODA2013Report Generated Date:December 17, 2013
Network: Prospect Prospect StateName:
Use: APRON SqFt7,918.00Area:Apron 03 ProspectName:A03POBranch:
01Section: of Last Const.:-To:Runway 20 EndFrom:1 09/02/1962Surface: ST Family: Zone: 64S Category: J Rank: POR-Cat5-ST-Central-Ap-2012
Area: SqFt 200.00 60.00FtLength: Width: Ft7,918.00
Street Type:Shoulder: Grade: 0.00 Lanes: 0
Section Comments:
2Surveyed:2Total Samples:Last Insp. Date: 10/09/2013Conditions: PCI : 46Inspection Comments:
Sample Number: 01 Type: R Area: SqFt4,191.00 PCI = 46Sample Comments:43 BLOCK CRACKING M 3,352.00 SqFt Comments:48 LONGITUDINAL/TRANSVERSE CRACKING M 120.00 Ft Comments:
Sample Number: 02 Type: R Area: SqFt3,727.00 PCI = 46Sample Comments:43 BLOCK CRACKING M 2,981.00 SqFt Comments:48 LONGITUDINAL/TRANSVERSE CRACKING M 120.00 Ft Comments:

Re-inspection ReportODA2013Report Generated Date:December 17, 2013
Network: Prospect Prospect StateName:
Use: RUNWAY SqFt201,750.00Area:Runway 2/20 ProspectName:R02POBranch:
01Section: of Last Const.:Runway 20 EndTo:Runway 02 EndFrom:1 09/01/1995Surface: AAC Family: Zone: 64S Category: J Rank: POR-Cat5-AAC-Central-RW-2012
Area: SqFt 4,035.00 50.00FtLength: Width: Ft201,750.00
Street Type:Shoulder: Grade: 0.00 Lanes: 0
Section Comments:
6Surveyed:40Total Samples:Last Insp. Date: 10/09/2013Conditions: PCI : 59Inspection Comments:
Sample Number: 01 Type: R Area: SqFt5,000.00 PCI = 38Sample Comments:43 BLOCK CRACKING L 500.00 SqFt Comments:43 BLOCK CRACKING M 750.00 SqFt Comments:43 BLOCK CRACKING H 750.00 SqFt Comments:48 LONGITUDINAL/TRANSVERSE CRACKING M 85.00 Ft Comments:
Sample Number: 08 Type: R Area: SqFt5,000.00 PCI = 64Sample Comments:48 LONGITUDINAL/TRANSVERSE CRACKING M 485.00 Ft Comments:
Sample Number: 15 Type: R Area: SqFt5,000.00 PCI = 66Sample Comments:48 LONGITUDINAL/TRANSVERSE CRACKING M 440.00 Ft Comments:
Sample Number: 22 Type: R Area: SqFt5,000.00 PCI = 65Sample Comments:48 LONGITUDINAL/TRANSVERSE CRACKING M 460.00 Ft Comments:
Sample Number: 29 Type: R Area: SqFt5,000.00 PCI = 62Sample Comments:48 LONGITUDINAL/TRANSVERSE CRACKING M 540.00 Ft Comments:
Sample Number: 36 Type: R Area: SqFt5,000.00 PCI = 61Sample Comments:48 LONGITUDINAL/TRANSVERSE CRACKING M 580.00 Ft Comments:

Re-inspection ReportODA2013Report Generated Date:December 17, 2013
Network: Prospect Prospect StateName:
Use: TAXIWAY SqFt1,047.00Area:Taxiway 01 ProspectName:T01POBranch:
01Section: of Last Const.:Apron 02To:Runway 2/20From:1 08/01/2001Surface: AC Family: Zone: 64S Category: J Rank: POR-Cat5-AC-Central-TW-2012
Area: SqFt 25.00 35.00FtLength: Width: Ft1,047.00
Street Type:Shoulder: Grade: 0.00 Lanes: 0
Section Comments:
1Surveyed:1Total Samples:Last Insp. Date: 10/09/2013Conditions: PCI : 58Inspection Comments:
Sample Number: 01 Type: R Area: SqFt1,047.00 PCI = 58Sample Comments:41 ALLIGATOR CRACKING L 6.00 SqFt Comments:48 LONGITUDINAL/TRANSVERSE CRACKING M 34.00 Ft Comments:48 LONGITUDINAL/TRANSVERSE CRACKING H 30.00 Ft Comments:

Re-inspection ReportODA2013Report Generated Date:December 17, 2013
Network: Prospect Prospect StateName:
Use: TAXIWAY SqFt1,393.00Area:Taxiway 02 ProspectName:T02POBranch:
01Section: of Last Const.:Apron 02To:Runway 2/20From:1 09/01/1999Surface: ST Family: Zone: 64S Category: J Rank: POR-Cat5-ST-Central-TW-2012
Area: SqFt 25.00 45.00FtLength: Width: Ft1,393.00
Street Type:Shoulder: Grade: 0.00 Lanes: 0
Section Comments:
1Surveyed:1Total Samples:Last Insp. Date: 10/09/2013Conditions: PCI : 49Inspection Comments:
Sample Number: 01 Type: R Area: SqFt1,392.50 PCI = 49Sample Comments:43 BLOCK CRACKING L 1,392.00 SqFt Comments:52 RAVELING L 1,252.00 SqFt Comments:52 RAVELING M 139.00 SqFt Comments: