Pavement Design Based on Shakedown...
9
Transportation Research Record 1022 99 Pavement Design Based on Shakedown Analysis RICHARD W. SHARP ABSTRACT The realistic analysis of pavement performance requires an approach that recoq- n izes the incremental mode of failure of such structures when subjected to repeated moving loads. The theory of structural shakedown provides such an approach. Procedures for the analysis of the shakedown of layered continua are developed. Parametric studies demonstrate the application of the analysis to representative problems, and the results of field studies are examined. It is found that pavement shakedown may be both observed and accurately predicted. A more general relationship between pavement life and shakedown predictions is formulated; the theory is applied to typical design problems, and a generalized design procedure is presented. For economic reasons pavements are required to per- form at stress levels that exceed the elastic limit of their constituent materials. Further, such stress levels may be repeated 10 6 or more times during the 15- or 20-year life of the structure. Failure, therefore, occurs by gradual deterioration not sudden collapse. In modeling structural behavior, it is important that the analysis take into account the progressive accumulation of permanent strains during a pave- ment's service life. Recognition of the incremental model of failure permits the exploration of the substantial reserve of strength that exists between the elastic limit and the point of static collapse. Many authors have recognized that repeated load- ing may induce failure of a body through the gradual accumulation of permanent deformation at particular locations. Ultimately, material breakdown may occur, resulting in failure by 11 incremental collapse. 11 Other load sequences may instead induce yielding alternately in compression and tension, with an "alternating plasticity" failure as the final re- sult. Alternatively, a load sequence may be such that after a certain number of load cycles no fur- ther permanent strains develop and the material subsequently responds elastically. In this case, the body is said to have undergon e "shakedown" by a process of adaptation. This approach lends itself particularly to the analysis of pavements, in which incremental collapse is frequently observed. It is reasonable to expect that a pavement's life under traffic will be directly related to its resistance to incremental failure--and under ideal conditions, a satisfactory pavement will be one that shakes down. The theory of shakedown, first presented by Melan (1), has been widely applied to discrete structures s;ch as trusses and frames. Application to more complex structures has been confined primarily to plates (2-4), and it appears that apart from brief of the problem of a long strip footing (5,6) no numerical applications of the theory to general continua have been made. A method of analyzing the shakedown behavior of pavements is presented. Road test results demon- strate the application of this analysis to the pre- diction of pavement performance, and the paper con- cludes with a discussion of the design procedures that may be developed from such an approach. PAVEMENT MODEL The analysis of a general horizontally layered pave- ment subjected to wheel loads of varying magnitude, contact area, and spatial distribution represents a problem of considerable complexity. The following simplications have therefore been introduced: 1. The actual wheel loading (Figure 1) is ap- proximated for plan strain pavement by a roller loading (Figure 2). In the most critical region, the vertical plane through the centerline of the wheel- path, stresses will be modeled reasonably accurately; elsewhere stresses may be somewhat overestimated. A ApplrC2d n - lay<2r structurC2 EIC2Vation TransvC2rsC2 variatron rn posrtron (. ;a --- .... (-)·- __ ._ Contact arC2a OirC2c tion of ,- ., TravC21 ... _"r ___ ..., Plan FIGURE 1 General three- dimensional pavement and loading. conservative estimate of the load limit is therefore likely to be produced. 2. A large number of passes of the roller may be expected to give rise to a pattern of permanent deformation that is uniform over any horizontal plane. The distributions of both permanent deforma-
Transcript of Pavement Design Based on Shakedown...
Transportation Research Record 1022 99
Pavement Design Based on Shakedown Analysis RICHARD W. SHARP
ABSTRACT
The realistic analysis of pavement performance requires an approach that recoqn izes the incremental mode of failure of such structures when subjected to repeated moving loads. The theory of structural shakedown provides such an approach. Procedures for the analysis of the shakedown of layered continua are developed. Parametric studies demonstrate the application of the analysis to representative problems, and the results of field studies are examined. It is found that pavement shakedown may be both observed and accurately predicted. A more general relationship between pavement life and shakedown predictions is formulated; the theory is applied to typical design problems, and a generalized design procedure is presented.
For economic reasons pavements are required to perform at stress levels that exceed the elastic limit of their constituent materials. Further, such stress levels may be repeated 10 6 or more times during the 15- or 20-year life of the structure. Failure, therefore, occurs by gradual deterioration not sudden collapse.
In modeling structural behavior, it is important that the analysis take into account the progressive accumulation of permanent strains during a pavement's service life. Recognition of the incremental model of failure permits the exploration of the substantial reserve of strength that exists between the elastic limit and the point of static collapse.
Many authors have recognized that repeated loading may induce failure of a body through the gradual accumulation of permanent deformation at particular locations. Ultimately, material breakdown may occur, resulting in failure by 11 incremental collapse. 11
Other load sequences may instead induce yielding alternately in compression and tension, with an "alternating plasticity" failure as the final result. Alternatively, a load sequence may be such that after a certain number of load cycles no further permanent strains develop and the material subsequently responds elastically. In this case, the body is said to have undergone "shakedown" by a process of adaptation. This approach lends itself particularly to the analysis of pavements, in which incremental collapse is frequently observed. It is reasonable to expect that a pavement's life under traffic will be directly related to its resistance to incremental failure--and under ideal conditions, a satisfactory pavement will be one that shakes down.
The theory of shakedown, first presented by Melan (1), has been widely applied to discrete structures s;ch as trusses and frames. Application to more complex structures has been confined primarily to plates (2-4), and it appears that apart from brief examinat~;s of the problem of a long strip footing (5,6) no numerical applications of the theory to general continua have been made.
A method of analyzing the shakedown behavior of pavements is presented. Road test results demonstrate the application of this analysis to the prediction of pavement performance, and the paper concludes with a discussion of the design procedures that may be developed from such an approach.
PAVEMENT MODEL
The analysis of a general horizontally layered pavement subjected to wheel loads of varying magnitude, contact area, and spatial distribution represents a problem of considerable complexity. The following simplications have therefore been introduced:
1. The actual wheel loading (Figure 1) is approximated for plan strain pavement by a roller loading (Figure 2). In the most critical region, the vertical plane through the centerline of the wheelpath, stresses will be modeled reasonably accurately; elsewhere stresses may be somewhat overestimated. A
ApplrC2d
n - lay<2r structurC2
EIC2Vation
TransvC2rsC2 variatron rn posrtron
(. ;a --- .... (-)·- __ ._
Contact arC2a OirC2c tion of ,- ., TravC21 ... _"r ___ ...,
Plan
FIGURE 1 General threedimensional pavement and loading.
conservative estimate of the load limit is therefore likely to be produced.
2. A large number of passes of the roller may be expected to give rise to a pattern of permanent deformation that is uniform over any horizontal plane. The distributions of both permanent deforma-

100
Appl1<2d
n - lay<2r structur<2
FIGURE 2 Plane strain pavement and loading.
tion and residual stresses thus become functions of depth only.
3. The observations of several authors <2-21 suggest that the longitudinal variation of normal stresses due to a pneumatic tire may realistically be approximated by a trapezoidal distribution shown in Figure 3. The distribution of longitudinal shear stresses is more variable: however, for constant wheel velocities a trapezoidal variation is again an appropriate first approximation.
;(] 1111 [J-~~~;~;n V Apph<2d
lbf=B_j x ! ~alf L<2ngt h
FIGURE 3 Definition of pavement loading.
4. The conventional parameters of elastic modulus (E) and Poisson's ratio (v) serve as an adequate characterization of the stiffness of most pavement materials. More diversity of opinion exists regarding the description of material strength: the MohrCoulomb yield condition [parameters of cohesion (c) and angle of internal friction ($)I does, however, appear to offer simplicity along with a realistic modeling of behavior. A more detailed survey and discussion are presented elsewhere (10).
SHAKEDOWN ANALYSIS OF PAVEMENTS
Algorithms for determining the shakedown limits of discrete structures have existed for some time and are generally based on the techniques of linear programming. Continuous structures, however, are not so readily treated, and a means of solution was first presented by Maier (11). This approach, which also employs linear programming, has been applied by Sharp (10) to determine the shakedown limit of a plane strain layered continuum subjected to repeated moving surface loads.
Although it represents a vast improvement over step-by-step methods of elastoplastic analysis, the linear programming approach suffers from several shortcomings when applied to continua. Most significant among these is that the computing effort is approximately proportional to the cube of the number of constraints, so program execution time increases alarmingly as the yield surface is more accurately modeled.
A method of analysis that overcomes this difficulty, and permits the true Mohr-Coulomb yield surface to be used, has been developed by Sharp
Transportation Research Record 1022
( 10) • By considering stresses to consist of two components--elastic and residual--and adopting the convention of compressi1re stress positive, it is possible to reformulate the Mohr-Coulomb no-yield condition as
F(crXR':q = acr~R2 + 2hcr). + bi. 2 + 2gcrXR + 2fA
+ k > 0 (1)
where
>. load factor, crxR residual direct horizontal stress,
a cos2 $, h -(crZE - crXE) sin' $ (crZE + 0xE)'
b (oZE - (JxE>' + 4TE2 sin' $ (crZE
+ <JXE)''
q -2c sin$ cos $ 1
f -2c sin $ cos $ (azE + ozE) , k -4c2 cos2 $,
and (crXE• <JZE• TE) represents the plan strain state of stress at Point P(x,z) due to unit applied load, c is material cohesion (> 0) , and $ is material angle of internal friction (O-< $ < ~/2).
The region F < 0 en;;loses those combinations of load factor i. and-residual stress crxR for which failure at P(x,z) will not occur. The boundary to this domain
(2)
may then be seen to represent a general conic section.
For analysis purposes, the region of interest at each depth zj is that common to the p sampling points Xi : i = l, 2 ••• p. That is,
i.zj =max [>. : F(crXR• i., xi, zj) < o, (i = l, 2 .•• p)] (3)
Then the pavement shakedown limit (>.so) is given by
min >-so= j (Azjl (4)
Figure 4 shows a number of typical domains F(oxR• ;., Xi, z) and the determination of the value i. 2 •
The determination of >-max (x,z) may be most simply performed analytically by setting
di./dcrxR = o in F = o
to yield
(Sa)
for
R1, 2 = (c/{cos il>[l + (crzEfTE) tan$)}).:_ 0 (Sb)
A finite positive 1ralue of •max (x,z) = max !i.1, >.2) therefore exists in the region defined by (TE > ozE tan$ or TE< - crzE tan$). In many cases Equations
min Sa and Sb followed by the comparison •z = x [Amax (x,z)) are sufficient to obtain the required value. In other cases, as suggested by Figure 4, this test gives only an upper bound to >.z, and a simple algorithm to determine intersections of curves must be added to obtain the true value of Az.

Sharp
FIGURE 4 Typical shakedmm domains for depth z and the determination of Az.
The shakedown limit for the continuum is then found by
min "so z P·z> (6)
RESULTS ANO GENERALIZATIONS
The analysis just presented has been used to determine the shakedown limits of a number of representative pavement structures. Results for a homogeneous half-space (various angles of friction) are shown in Figure 5. First yield and static collapse loads are included for completeness.
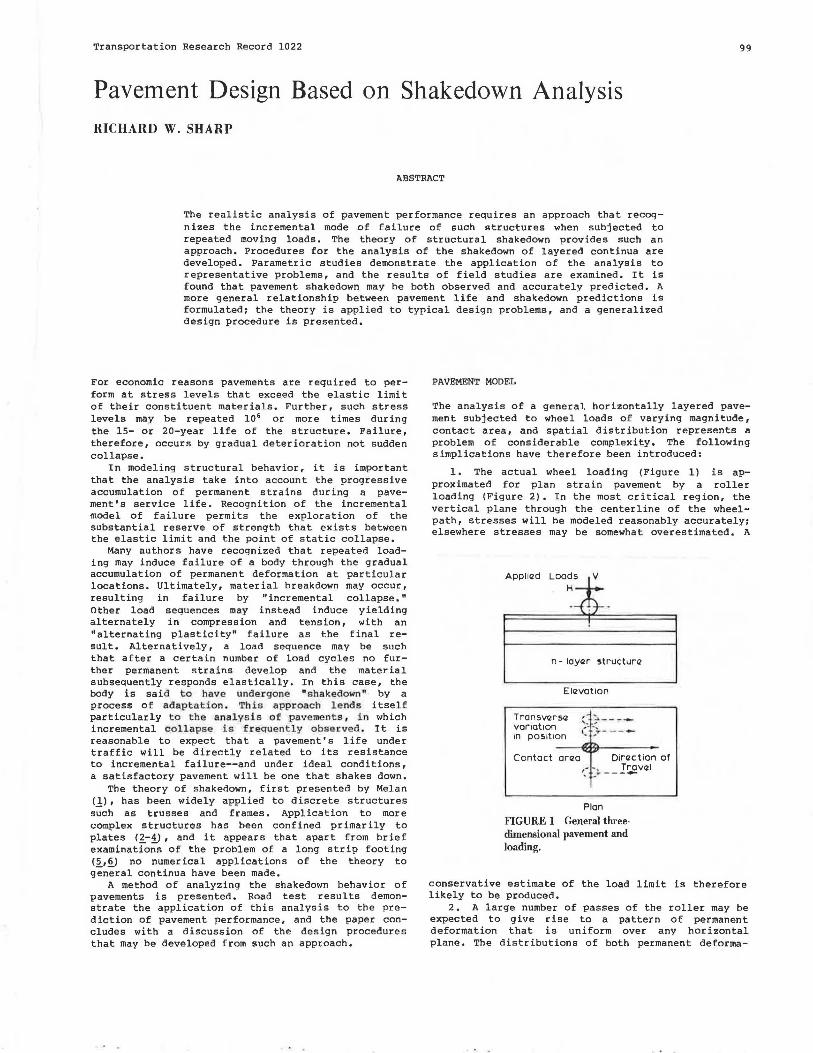
As a second example, Figure 6 shows values of the shakedown limit for a two-layer structure. The influence of layer thickness and relative layer stiffness on the structure's response to repeated moving loads is recorded, and the shape of the curves pro-
40
30 ->IU
Ol c '6 0 0 20 -'
"' u 0
L ::J (/)
10
Maximum prC2ssurrz
Homogrznrzous isotropic half - spacC2
= Static collapsrz load ( Rrzctangular load form b/B= I) from Prandtl (1921)
o'--~~~__.~~~~ ........ ~~~~-'-~ ... 0 10 20 30
Anglrz of Fr1ct1on ( dC2grrzC2s)
FIGURE 5 Influence of material friction angle on first yield, shakedown, and static collapse loads.
101
vides a pleasing consistency with observed behavior. For low values of surface layer stiffness, for example, little stress is attracted toward the surface, and fatigue of the subgrade tends to be the initial mode of failure. In contrast, extremely stiff surf ace layers themselves attract a large proportion of the stresses, caused by loading, and fatigue failure in this case is initiated within the top layer. A wide range of results is presented elsewhere (10), and further attention will be directed toward these in the discussion of design procedures that concludes this paper.
By way of verification, a more general "threedimensional" analysis been also developed and implemented. Although this will not be given detailed attention in this paper, it should be noted that both uniform and layered continua have been analyzed using the more general approach.
It is evident from the results that the shakedown limit of a pavement derived by three-dimensional analysis may be closely related to that obtained using a plane strain approach. In this way, the approximations used in developing the latter have been shown to be appropriate. Further, the plane strain analysis not only provides a suitable approximation to the more elaborate approach but is also generally conservative in its estimates, yielding a lower bound to the true shakedown limit.
The advantages of the plane strain method are, therefore, considerable. Not only are its estimates safe and reasonably accurate, but its formulation is simpler conceptually and its execution faster. Indeed, for a typical pavement analysis, the time required in computing is of the order of one-hundredth of that consumed in a corresponding three-dimensional analysis. For parametric studies and the development of design charts, then, the plane strain approximation provides a tool of far greater convenience and is really the only practical approach.
CASE STUDY 1: THE AASHO TESTS
The AASHO Road Test, conducted in the late 1950s by the Highway Research Board (HRB) in the United States, provides a large and valuable body of data concerning pavement performance and its relationship to traffic loading and thickness design. Some of this information, fully documented in the HRB Special Reports 61, A-G (g) , has been used to investigate the applicability of shakedown theory to the performance under traffic of asphaltic concrete pavements.
Table 1 gives the material strength and stiffness properties adopted for analysis, obtained from the HRB reports and an extensive testing program reported by Shook and Fang (13). Loading parameters are also included, the primary source of which information is Kent (14).
Pavement performance during the test was obtained by monitoring various indicators (rutting, cracking, patching, and longitudinal profile variations) and quantifying the measurements as a "present serviceability index" (p). The value of p may be regarded simply as a measure of pavement standard. For most pavement sections, p was found initially to be about 4.5, and the progressive deterioration of each section under traffic was reflected in declining values of p.
The performance of pavement is therefore given by the variation of p with time or number of axle applications. Failure was said to have been reached when p declined to a value of 1. 5; shakedown may also be detected by a stabilizing of the value of p after a certain number of load applications. Typical performance trends, and the means by which relative performance may be defined, are shown in Figure 7.
102
>cl 0
_ltJ__. D/ ~ u 40 1 '·•·•. -·•.<.< 28 <()()
~ :0·4·:ro. Eo,Co E :J 1·5 c 30 ~ 'C Cil
.;L. 0 .c. Ill 20 Ci 1{) c 0 iii c Cil 10 E i:5 Cil c 0
0 1 10 100 1000
Rczlat1vcz Stiffnczss E;Eo
FIGURE 6 Influence of layer thickness on shakedown limit of two-layer pavement.
TABLE l Material and Load Parameters for AASHO Road Test Studies
Material Elastic Parameters Failure Parameters E MPa (ks i)
Asphaltic Concrete 5000 (730)
Base 85 ( 1 2)
Sub-base 50 ( 7. 3)
Sub-grade 1 0 ( 1. 5)
Configuration Single
Load on Axle 8.2 10.2 Group (tonnes)
Maximum pressure 570 570 v kPa (psi)
Radius B mm
4
( 83) ( 83)
(ins) 105 120 ( 4. 1 ) ( 4. 7)
Numarals indicat12 pav12m12nt s12ction numb12rs
1 3. 6
610 ( 88)
130 ( 5. 1 )
I.., I"' 12 1 ... 1 0 I 'C
li'J
"ti
0.4
0.3
0.3
0.3
14.5
530 ( 77)
1 00 ( 3. 9)
c kPa (psi) ID o
4000 30 (580)
40 55 ( 5. 8)
30 45 ( 4. 4)
1 0 20 ( 1.5)
Tandem All i ~ 18 .1 21. 8
i b i } 8
570 610 b H ( 83) ( 88) 1f = o.s, µ = v= o.4
Pavement Loading' 110 120 (Plane ( 4. J) ( 4. 7)
Un1ail12d at 12nd of t12st
Strain)
~ 3 ii
I !181} I Shak12down P12rformanc12 d12fin12d
by final p and wn12th12r shal<adown occurs
0 Cil u > l.
"' If)
c Cil
"' Cil l.
2
"Fo1lur12"
333
603 57!1 I I I
~ 0 '--~~ ........ ~~~~~~ ...... ~~ 1 10 100 1000
Load Applicot1ons (103 axl12s)
Fail12d pav12m12nts P12rformonc12 d12fin12d by lifcz to p = 1·5
FIGURE 7 Typical performance trends-AASHO Road Test.
..
Sharp 103
2·4 -- ollad lJnfo11wd "" ~" ............ o,, "4J PaY<lrn<lnts Pavwmwnts 2·2
'\ </_,." a... o\ \
2·0 0
"' <. 1·8 > u 1·6 0 0 __J
ii 1·4 tj
i:::. 1·2 3:
80°/o confidwncw limits for prrzdiction \ of lifrz from shakrz- \ " down limit
'\! 1·0
08
10 100 Pavrzmrznt Lifrz (10 3 ax las)
Kw~ ta Load Grau~
D 185 32T e:. 225 40T 0 305 48T
• • • Solid marks lnd1cotrz shakrzdown has occurizd ~
u
.. , 0 ...
0
10001·5 2 3
"' -" 9. ~ - a. 0 .....
a. 0 ~ 'O O "' ., ~~ " ~ ., a.
4
S12rv1c12ability lndizx ( p) at End of Tast
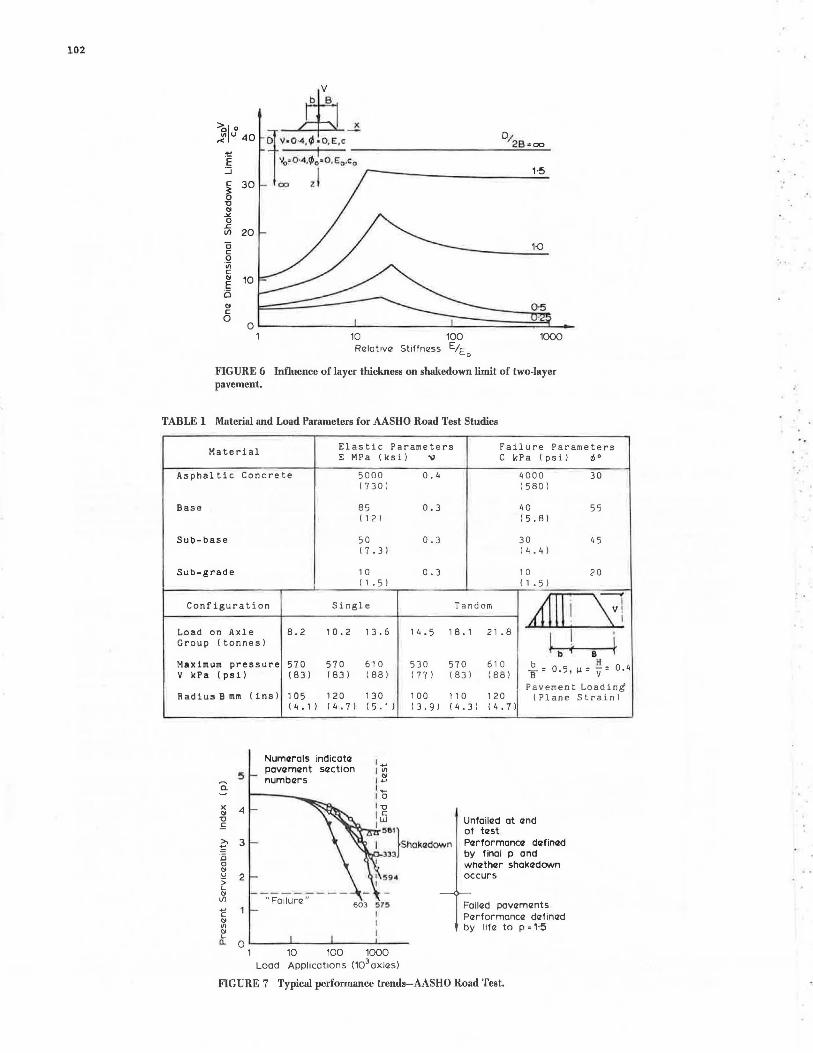
FIGURE 8 Pavement performance related to load ratio (V /V so).
Using the material and loading parameters as given, the 180 pavements comprising Loops 4, 5, and 6 of the Road Test were analyzed, and their shakedown limits, defined as the ratio of shakedown load to applied load (V so/Vl , determined. The shakedown limit, a measure of the fatigue strength of the pavement, may reasonably be expected to correlate with pavement life, and indeed this proved to be the case. For consistency with the S-N curves of fatigue studies, however, the approach adopted in Figure 8 was to plot dimensionless load (V/VsD• the inverse of shakedown limit) against performance. Despite the scatter in the results (characteristic of fatigue tests generally and to be expected in view of typical material variability), Figure 8 clearly shows that a lighter loading or higher shakedown limit is associated with a longer life. More significant, the line V = VsD clearly may be used to distinguish between those pavements that failed (V > VsDl and those that attained a stable state (V < Vsnl • Also shown in the region p > 1.5 are those pavements that had neither failed nor reached shakedown by the end of the testi of these little can be said except that
their relatively good performance is again associated with lower values of V/Vso•
CASE STUDY 2: SYDNEY REGION
A second case study was undertaken with the aims of verifying the results obtained in Case Study 1, and examining the applicability of the shakedown approach to Australian conditions. The test program involved the sampling of failed pavements at 18 locations and the testing of material from each pavement layer to determine stiffness (E,v) and strength (c,~)
parameters. Traffic life of the pavement was also determined from both field surveys and traffic volume records. Full documentation of the study is provided elsewhere (10).
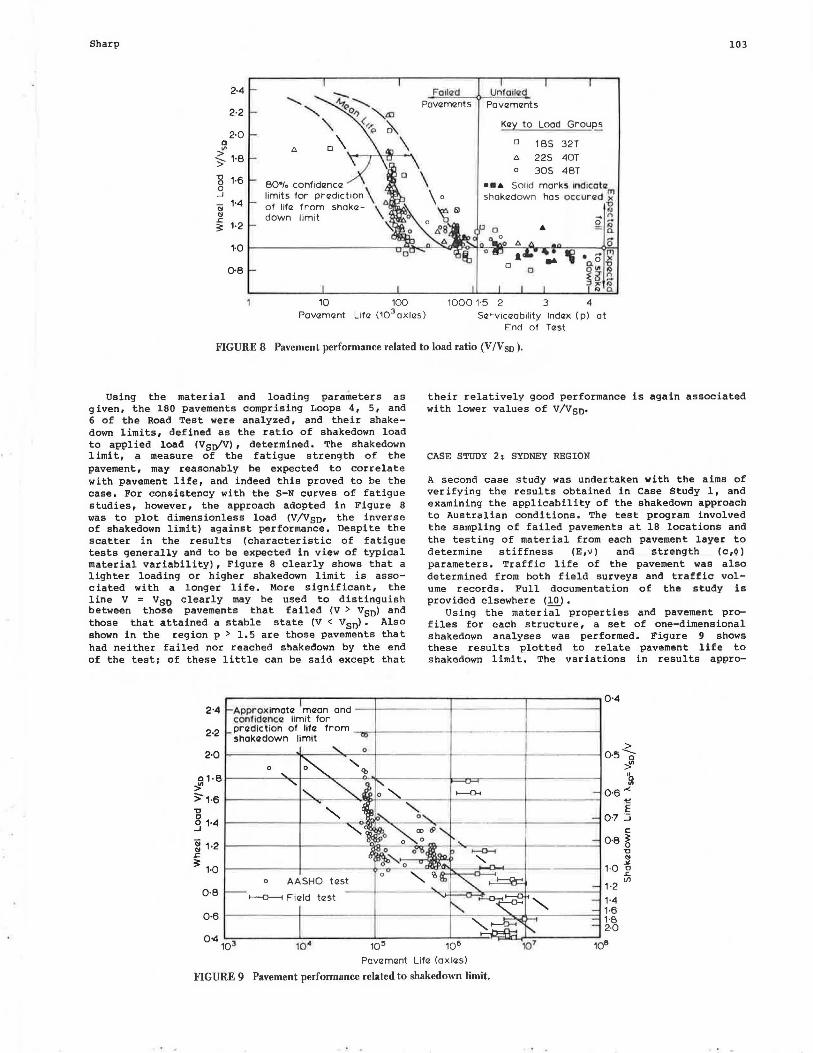
Using the material properties and pavement profiles for each structure, a set of one-dimensional shakedown analyses was performed. Figure 9 shows these results plotted to relate pavement life to shakedown limit. The variations in results appro-
Approximotrz mizon and --+---conf ldiznca limit for
2·2 pr<ldiction of lifrz from _ ......... ______ _,_ ____ ---!------ ---' shokadown limit
0 AASHO tast ~~;-----"'<;:i:!==r~'"-=---;:-:r;-l:------l 1 ·2
1--0--< Fiald tast 1·4 0 ·8
0·6 1------+------l-------1--.:........-__,,,,.,....,._-,.--- ---1 1·6 1·8 2·0
0~1~0~3 ____ __;1~0~,------110~5=------1~0~6,........_.::~;=i;ia....i....,,,........---........J,08 Pavrzm<lnt Lifrz (axl<ls)
FIGURE 9 Pavement performance related to shakedown limit.

104 Trans portation Research Record 1022
PR OFI LE MATERIAL E MPa " c kPa 11 0 l ksi l (psi)
flu s h Se al
Crushed Rock 70 0 . 3 80 50 Road base I 1 o l ( 1 2)
Gravel/Shale 50 0.3 80 30 Sub-base ( 7 . 3) ( 1 2)
Clay Sub-grade 20 0.35 40 15
LOAD FORM
__,, __ _
I 2. 9 I
b R
( 5. 8)
H o.s, µ =v = o. 4
V = 700 kPa (100 psi)
FIGURE 10 Flush·sealed pavement for development of design charts.
priate to certain sites are represented by error bars and the data from the AASHO Road Test are included for completeness. Although the possible magnitude of some errors is quite large, as might be expected for a field study of this type, the graph serves to demonstrate two important points. First, it is clear that data of this study are consistent with those of the much more controlled AASHO test. Second, Figure 9 allows an estimate of the relationship between life and shakedown limit to be made, and further permits an approximate design curve (lower bound to life) to be deduced. Despite the spread of data, it appears that this curve may be estimated with some confidence.
The study attempted to examine the relationship between the predictions of shakedown theory for pavement structures and the life of a number of local pavements under normal traffic conditions. In so doing, it demonstrated that
1. Pavement materials ma y be tested in the laboratory to yield useful information on both stiffness and strength properties .
2. The traffic life of a pavement may be estimated with some accuracy from readily available information. Data on heavy vehicle percentages and lane usage, both extremely important influences on life, are, however, rather limited and could benefit from further study.
3. The shakedown limit, obtained by the approximate (one-dimensional) means detailed previously, shows considerable promise as a means of estimating pavement life. Not only is the analytical approach consistent with features of normal pavement performance, but this study has shown that within the estimated limits of variation in pavement life and materials it may be used to predict the minimum expected life of a flexible pavement structure.
APPROACHES TO DESIGN
The process of engineering design involves the selection of dimensions and properties of components in order that the completed structure shall perform in a specified manner. In the case of pavement de-
sign, the properties of materials can often be defined within practical limits, and the aim of design is to select suitable layer thicknesses in order that the pavement should meet particular performance requirements. To those solutions from which satisfactory performance may be expected, a further step of optimization (economic or otherwise) may be applied.
It has already been demonstrated that the calculated shakedown limit of a pavement offers a valuable guide to its ultimate performance, expressed in terms of its serviceable life under traffic. However, the design of a pavement is complicated by the number of parameters that influence performance. Because the behavior of one particular material may be ideally described by four fundamental parameters (E,v,c,~)
and pavements typically consis t of three or more distinct materials, the task of formulating design procedures involves determining the influence of perhaps a dozen or more variables. This represents a considerable problem, and, in this section, some approaches to its solution are developed.
0 ·5 1·0
hse;R
1·5
FIGURE 11 Shakedown limit of flushsealed pavement (fixed properties) as function of thickness design.
2·0

Sharp
PROF'ILE MATERIAL E MPa '\I c kPa 115 0
( ksi) (psi)
h,..c Asphaltic 2000 0. 4 3000 35 Concrete (290) (440)
he Crushed Rock 70 0.3 80 50 Road base I 10 l ( 1 2)
Gravel/Shale 50 () . 3 80 30
hse Sub-base I 7. 3) I 1 2)
Clay Sub-grade 20 0.35 40 1 5 I 2. 9) I 5 . 8)
co
LOADF"ORM R b
ILJ Tl~Jv b 0. 5'
H 0 . 4 A µ = v =
v = 700 kPa
...... """'7 .....,, - I 1 00 psi)
FIGURE 12 Representative three-layer pavement for development of design charts.
Two Layers on Subgrade (fixed properties)
Sharp and Booker (15) present a first step toward design employing shakedown theory, examining the case of a single layer overlying a subgrade and the influence on performance of variations in layer stiffness and strength.
By fixing material properties for a representative flush-sealed pavement (Figure 10), it is possible to explore the influence of layer thicknesses alone. With only three variables (hB, hsB• and A), the results of the analyses lend themselves to graphic presentation using contours of constant shakedown limit (Asnl over a range of thickness combinations. Figure 11 shows the resulting design chart. For the given materials, a pavement with a shakedown limit of, for example, ASD = 0.65 may then be constructed using any one of the thickness combinations lying on that line. It may also be seen that the combination that optimizes construction cost can now be readily determined by graphic or other means.
Three Layers on Subqrade (fixed properties)
The case of three layers overlying a subgrade (Figure 12) may be treated in a similar manner. If once again material properties are known, then only four variables (hAC• hB, hsB• and A) are to be related. In this case it is preferable to keep the three thicknesses (hAC• hB, and hsBl together and prepare a family of charts, each one representing a particular value of Asn and hence a particular performance standard. Figures 13 and 14 show two typical charts for the given materials, and it may be noted that, when the required performance has been selected, a single chart is capable of presenting the range of suitable thickness designs.
As before, an optimum design may then be determined. Given the applicable cost function, a small number of calculations should serve to locate the most economical design and its associated costi if completeness is desired, superimposing contours of constant functional value will readily highlight that point at which cost is minimized.
2·0
1·5
hB YR 1·0
0·5
0·5 1·0 1·5
hSB/R
FIGURE 13 Design chart for three-layer pavement (fixed properties), performance standard ~SD = 0.6.
2·0
1·5
he; 'R 1·0
0·5
0 0
Ubgrod' ""o\lur a
). so = 1·0
0·5 1·0
C:-f'\ . r-:s ~ ... llbbOse ~Follura •
=-c ·6
1·5
hsa;R
FIGURE 14 Design chart for three-layer pavement (fixed properties), performance standard ~SD = 1.0_
105
2·0
2·0

106
TWo Layers on Subqrade (general materials)
Many existing pavements may be idealized as two-layer structures overlying a subgrade, Clearly most flushsealed designs fall into this category; however, many designs that include thick asphaltic concrete are also of this form. An asphalt-granular base-subgrade structure is here used as a demonstration.
With little loss of generality, typical values of Poisson's ratio (v) and friction angle (~) may be assigned to each material, leaving as variable the modulus, cohesion, and thickness of each layer, as given in Table 2.
Three further simplifications may be made at this point. First, it is shown elsewhere (10,15) that the shakedown performance of each layer may be examined individually, with results superimposed after analysis to yield the structure's shakedown limit. Attention will therefore be restricted to the subqrade; other layers may be treated in the same manner. Second, the shakedown limit may be normalized with respect to wheel load and layer cohesion. Third, pavement response is a function of modular ratios, rather than absolute values of modulus, because it is the modular ratio that determines the stress distribution within the structure. As a result the
Transportation Research Record 1022
number of variables under consideration is reduced to five: (EAclEsGl, (EJa/EsGl, ChAc/R), (ha/R), and P·soV/CsGl •
The detailed derivation of relationships between these variables is set out elsewhere (10). In summary, it is found that base relati;; stiffness (EB/'EsGl and base thickness (hB/'R) both exert approximately linear influences on the shakedown limit of the pavement. This enables the original five variables to be reduced to three, with relationships formalized as
F1 function (Asn• Ea/EsGl; F 2 function (F1, hafRl ; and
(hAc/R) ~ function (F2, EAc/EsGl •
This formulation, in which the effects of the variables are isolated by simple approximations, lends itself to presentation as a multiple-intercept chart occupying three quadrants. Figure 15 is such a chart.
The dotted lines in Figure 15 demonstrate the use of the chart in designing a pavement required to have a shakedown limit (Ago) of 1.75. The pavement is to carry traffic having a representative tire load equivalent to 560 kPa on an area of radius 100 mm, and the available materials (asphalt con-
TABLE 2 Fixed and Variable Parameters for Two-Layer Pavement Design
PAVEMENT
LOAD
Bos12 Thicknczss
Material Thickness Stiffness Strength
Asphal tic 1 hAC EAC '1:0.4 cAC Ill= 30 °
Concrete
Granu l ar i hB EB "'1)=0. 3 CB Ill= 50°
Base
Sub-grade 00 ESG 'll=0.35 cSG Ill= 1 5 °
I R • I• b •I b H
V1 i i'\lv 8:0.5 µ=v=o . 4
A=100mm, V:?OOkPa ...... ~ ~ ...... ( 4") (100 psi)
Bas12 Stiffnczss
10 20 30 40 50 ~ormalisczd Shakczdown Limit
p:lo:: AN=AsoV/csG U1
~05 2 3 ~ Shakczdown Limit Aso for V= 700kPa
CsG= 40kPa u £ I-..,
W:....-'--"''--...L..."'-"~ ....... _.__._.__.___,'--_,_~__.3 0 .c a. U1 <(
FIGURE 15 Design chart for two layers on suhgrade.
Sharp
crete, base course, existing subgrade) have stiffnesses of 1000 MPa, 200 MPa, and 20 MPa, respectively. The subgrade cohesion is found to be 28 kPa. Using these parameters, the normalized shakedown limit (AN) may be calculated as 35, and relative stiffnesses of 50 and 10 apply to asphalt and base course, respectively. Then, as Figure 15 shows, a base thickness of 200 mm requires 170 mm of asphalt, whereas a thicker base (for example, 400 mm) requires less asphalt--in this case, 90 mm. Here, 80 mm of asphalt bas been replaced by 20 0 mm of base course. It needs to be noted, however, that this ratio of replacement (or "material equivalency") depends on both material properties and the form of structure being considered and should not be blindly applied to other pavement design processes.
When the relationship between asphalt and base thickness has been determined in this manner, considerations of construction convenience and cost may be superimposed (as previously illustrated) in order to arrive at the final pavement design.
CONCLUSIONS
'rhe behavior of pavement structures under traffic loading is most appropriately analyzed by methods that take due account not only of finite material strength and the movement of loads but also of the gradual accumulation of plastic deformations within the structure. The theory of shakedown lends itself to this purpose.
Procedures have been developed whereby the shakedown behavior of continua such as pavements may be examined quantitatively. The results of parametic studies demonstrate the use of such procedures, and two case studies serve to confirm that pavement shakedown may be both observed and accurately predicted. A more general relationship between pavement life and shakedown predictions is then formulated.
The application of shakedown theory to a number of typical design problems follows, enabling a number of approaches to the construction of generalized design procedures to be developed.
ACKNOWLEDGMENTS
The financial support that made this work possible was provided by the University of Sydney and the Commissioner for Main Roads, New South Wales. Thanks are also due to the latter for permission to publish this paper. The guidance and suggestions of J .R. Booker and G.S. Donald are also gratefully acknowledged.
REFERENCES
1. E. Melan. Theorie statisch unbestimmter Systeme aus ideal-plastischen Baustoff. Sitzungsberichte der Akademie der Wissenschaften in Wien, Vol. Ila, 1936, pp. 145-195.
2. W.A.M. Alwis and P. Grundy. Shakedown of Plates
3.
4.
5.
6.
7.
8.
9.
10.
11.
12.
13.
14.
15.
107
Under Moving Loads. Proc., 7th Australian Conference on Mechanics of Structures and Materials, 1980, pp. 191-196. T. Belytschko. Plane Stress Shakedown Analysis by Finite Elements. International Journal of Mechanical Sciences, Vol. 14, 1972, pp. 619-625. J.A. Konig. Shakedown Theory of Plates. Archiwum Mechaniki Stosowanej, Vol. 21, No. 5, 1969, pp. 623-637. B.L. Aboustit and D.V. Reddy. Finite Element Linear Programming Approach to Foundation Shakedown. Proc., International Symposium on Soils Under Cyclic and Transient Loading, Swansea, Wales, U.K., 1980, pp. 727-738. G.N. Pande, w.s. Abdullah, and E.H. Davis. Shakedown of Elasto-Plastic Continua with Special Reference to Soil-Rock Structures. Proc., International Symposium on Soils Under Cyclic and Transient Loading, Swansea, Wales, U.K., 1980, pp. 739-746. A.H.D. Marwic~ ana H.J.F. Starks. Stresses Between Tyre and Road. Journal of Institution of Civil Engineers, Vol. 16, No. 7, 1941, pp. 309-325. R.P.H. Bonse and S.H. Kuhn. Dynamic Forces Exerted by Moving Vehicles on a Road Surface. Bull. 233, HRB, National Research Council, Washington, D.C., 1959, pp. 9-32. D.R. Freitag and A.J. Green. Distribution of Stresses on an Unyielding Surface Beneath a Pneumatic Tire. Bull. 342, HRB, National Research Council, Washington, D.C., lq62, pp. 14-23. R.W. Sharp. Shakedown Analysis Pavements. Ph.D. dissertation. Sydney, Australia, 1983.
and Design of University of.
G. Maier. Shakedown Theory in Perfect ElastoPlastici ty with Associated and Non-Associated Flow-Laws: a Finite Element, Linear Programming Approach. Meccanica, Vol. 4, No. 3, 1969, pp. 250-260. HRB Special Report 61A-G. The AASHO Road Test. HRB, National Research Council, Washington, D.C., 1961-1962. J.F. Shook and H.Y. Fang. Cooperative Materials Testing Program at the AASHO Road Test. In HRB Special Report 66: AASHO Road Test Technical Staff Papers, 1961, pp. 59-102. M.F. Kent. AASHO Road Test Vehicle Operating Costs Related to Gross Weight. In HRB Special report 73: The AASHO Road Test, Proceedings of a Conference Held May 16-18, 1962, St. Louis, Mo., HRB, National Research Council, Washington, D.C., pp. 149-165. R.W. Sharp and J.R. Booker. Shakedown of Pavements Under Moving Surface Loads. Journal of the Transportation Engineering Division, ASCE, 1984, Vol. 110, No. TEl, 1984, pp. 1-14.
Publication of this paper sponsored by Committee on Mechanics of Earth Masses and Layered Systems.