Paveley, RA; Mansour, NR; Hallyburton, I; Bleicher,...
12
Paveley, RA; Mansour, NR; Hallyburton, I; Bleicher, LS; Benn, AE; Mikic, I; Guidi, A; Gilbert, IH; Hopkins, AL; Bickle, QD (2012) Whole organism high-content screening by label-free, image-based bayesian classification for parasitic diseases. PLoS neglected trop- ical diseases, 6 (7). e1762. ISSN 1935-2727 DOI: 10.1371/jour- nal.pntd.0001762 Downloaded from: http://researchonline.lshtm.ac.uk/126371/ DOI: 10.1371/journal.pntd.0001762 Usage Guidelines Please refer to usage guidelines at http://researchonline.lshtm.ac.uk/policies.html or alterna- tively contact [email protected]. Available under license: http://creativecommons.org/licenses/by/2.5/
Transcript of Paveley, RA; Mansour, NR; Hallyburton, I; Bleicher,...
Paveley, RA; Mansour, NR; Hallyburton, I; Bleicher, LS; Benn, AE;Mikic, I; Guidi, A; Gilbert, IH; Hopkins, AL; Bickle, QD (2012)Whole organism high-content screening by label-free, image-basedbayesian classification for parasitic diseases. PLoS neglected trop-ical diseases, 6 (7). e1762. ISSN 1935-2727 DOI: 10.1371/jour-nal.pntd.0001762
Downloaded from: http://researchonline.lshtm.ac.uk/126371/
DOI: 10.1371/journal.pntd.0001762
Usage Guidelines
Please refer to usage guidelines at http://researchonline.lshtm.ac.uk/policies.html or alterna-tively contact [email protected].
Available under license: http://creativecommons.org/licenses/by/2.5/
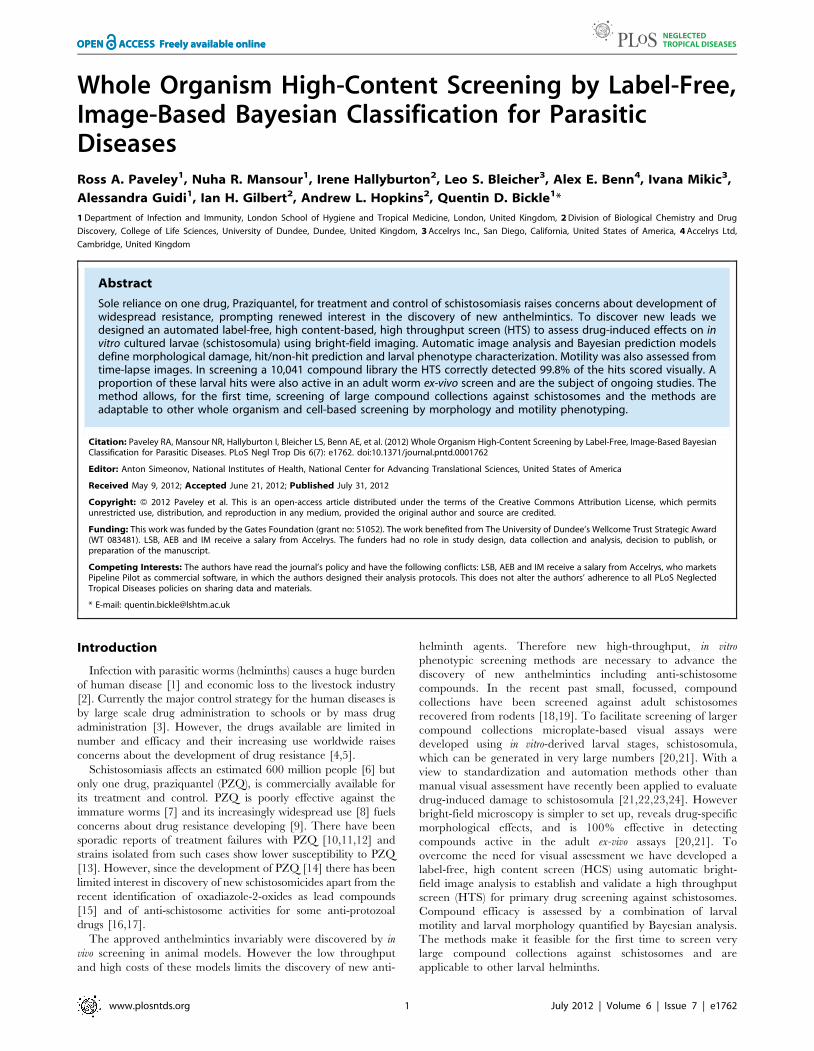
Whole Organism High-Content Screening by Label-Free,Image-Based Bayesian Classification for ParasiticDiseasesRoss A. Paveley1, Nuha R. Mansour1, Irene Hallyburton2, Leo S. Bleicher3, Alex E. Benn4, Ivana Mikic3,
Alessandra Guidi1, Ian H. Gilbert2, Andrew L. Hopkins2, Quentin D. Bickle1*
1 Department of Infection and Immunity, London School of Hygiene and Tropical Medicine, London, United Kingdom, 2 Division of Biological Chemistry and Drug
Discovery, College of Life Sciences, University of Dundee, Dundee, United Kingdom, 3 Accelrys Inc., San Diego, California, United States of America, 4 Accelrys Ltd,
Cambridge, United Kingdom
Abstract
Sole reliance on one drug, Praziquantel, for treatment and control of schistosomiasis raises concerns about development ofwidespread resistance, prompting renewed interest in the discovery of new anthelmintics. To discover new leads wedesigned an automated label-free, high content-based, high throughput screen (HTS) to assess drug-induced effects on invitro cultured larvae (schistosomula) using bright-field imaging. Automatic image analysis and Bayesian prediction modelsdefine morphological damage, hit/non-hit prediction and larval phenotype characterization. Motility was also assessed fromtime-lapse images. In screening a 10,041 compound library the HTS correctly detected 99.8% of the hits scored visually. Aproportion of these larval hits were also active in an adult worm ex-vivo screen and are the subject of ongoing studies. Themethod allows, for the first time, screening of large compound collections against schistosomes and the methods areadaptable to other whole organism and cell-based screening by morphology and motility phenotyping.
Citation: Paveley RA, Mansour NR, Hallyburton I, Bleicher LS, Benn AE, et al. (2012) Whole Organism High-Content Screening by Label-Free, Image-Based BayesianClassification for Parasitic Diseases. PLoS Negl Trop Dis 6(7): e1762. doi:10.1371/journal.pntd.0001762
Editor: Anton Simeonov, National Institutes of Health, National Center for Advancing Translational Sciences, United States of America
Received May 9, 2012; Accepted June 21, 2012; Published July 31, 2012
Copyright: � 2012 Paveley et al. This is an open-access article distributed under the terms of the Creative Commons Attribution License, which permitsunrestricted use, distribution, and reproduction in any medium, provided the original author and source are credited.
Funding: This work was funded by the Gates Foundation (grant no: 51052). The work benefited from The University of Dundee’s Wellcome Trust Strategic Award(WT 083481). LSB, AEB and IM receive a salary from Accelrys. The funders had no role in study design, data collection and analysis, decision to publish, orpreparation of the manuscript.
Competing Interests: The authors have read the journal’s policy and have the following conflicts: LSB, AEB and IM receive a salary from Accelrys, who marketsPipeline Pilot as commercial software, in which the authors designed their analysis protocols. This does not alter the authors’ adherence to all PLoS NeglectedTropical Diseases policies on sharing data and materials.
* E-mail: [email protected]
Introduction
Infection with parasitic worms (helminths) causes a huge burden
of human disease [1] and economic loss to the livestock industry
[2]. Currently the major control strategy for the human diseases is
by large scale drug administration to schools or by mass drug
administration [3]. However, the drugs available are limited in
number and efficacy and their increasing use worldwide raises
concerns about the development of drug resistance [4,5].
Schistosomiasis affects an estimated 600 million people [6] but
only one drug, praziquantel (PZQ), is commercially available for
its treatment and control. PZQ is poorly effective against the
immature worms [7] and its increasingly widespread use [8] fuels
concerns about drug resistance developing [9]. There have been
sporadic reports of treatment failures with PZQ [10,11,12] and
strains isolated from such cases show lower susceptibility to PZQ
[13]. However, since the development of PZQ [14] there has been
limited interest in discovery of new schistosomicides apart from the
recent identification of oxadiazole-2-oxides as lead compounds
[15] and of anti-schistosome activities for some anti-protozoal
drugs [16,17].
The approved anthelmintics invariably were discovered by in
vivo screening in animal models. However the low throughput
and high costs of these models limits the discovery of new anti-
helminth agents. Therefore new high-throughput, in vitro
phenotypic screening methods are necessary to advance the
discovery of new anthelmintics including anti-schistosome
compounds. In the recent past small, focussed, compound
collections have been screened against adult schistosomes
recovered from rodents [18,19]. To facilitate screening of larger
compound collections microplate-based visual assays were
developed using in vitro-derived larval stages, schistosomula,
which can be generated in very large numbers [20,21]. With a
view to standardization and automation methods other than
manual visual assessment have recently been applied to evaluate
drug-induced damage to schistosomula [21,22,23,24]. However
bright-field microscopy is simpler to set up, reveals drug-specific
morphological effects, and is 100% effective in detecting
compounds active in the adult ex-vivo assays [20,21]. To
overcome the need for visual assessment we have developed a
label-free, high content screen (HCS) using automatic bright-
field image analysis to establish and validate a high throughput
screen (HTS) for primary drug screening against schistosomes.
Compound efficacy is assessed by a combination of larval
motility and larval morphology quantified by Bayesian analysis.
The methods make it feasible for the first time to screen very
large compound collections against schistosomes and are
applicable to other larval helminths.
www.plosntds.org 1 July 2012 | Volume 6 | Issue 7 | e1762
Materials and Methods
Ethics statement & animalsExperimentation was carried out under the United Kingdom
Animal’s Scientific Procedures Act 1986 with approval from the
London School of Hygiene and Tropical Medicine Ethics
committee. CD1 mice supplied by Charles River, UK were
maintained at St Mary’s Hospital, Imperial College London.
Parasite generationSchistosoma mansoni was maintained by routine passage and
schistosomula were prepared and cultured in M169 [25] as
previously described [21]. Adult worm ex-vivo drug testing was as
previously described [19].
CompoundsThe reference anti-schistosome compounds praziquantel (PZQ)
and dihydroartemisinin (DHA) were obtained from Sigma-Aldrich
(UK), methylclonazepam (MCZ) and Ro15-5458 (Ro15) were a
gift from Dr H. Stohler (Hoffman-La Roche, Basle, Switzerland),
oxamniquine (OX) was from Pfizer Ltd (Sandwich, UK) and
oltipraz (OPZ) from WHO Special Programme for Research and
Training in Tropical Diseases (WHO-TDR; Geneva, Switzer-
land). Compounds were dissolved in DMSO (Sigma-Aldrich, UK).
A 10,041 compound library comprising lead-like compounds was
provided by the Division of Biological Chemistry and Drug
Discovery, University of Dundee.
Plate set upThe last two columns of each test plate were reserved for
controls. The test compound solvent, DMSO, was used as the
negative control and added to 16 wells. Our initial testing of the
image analysis models revealed that OPZ induced the lowest
phenotype and motility scores reflecting the visual assessment that
OLT caused the most severe effects of all of the anti-schistosome
compounds tested. Therefore, OLT was chosen as the positive
reference standard and applied to 8 wells. PZQ, the current
therapy for schistosomiasis, induced intermediate phenotype and
motility scores and so 4 wells of PZQ were included on each plate
as an arbitrary check on plate performance.
Black 384-well clear-bottomed plates were selected for imaging
(PerkinElmer, UK Cat no 6007460). Into each well 0.5 ml of test
compound or DMSO was dry stamped using the Biomek FXp
(Beckman Coulter, High Wycombe, UK). When necessary a prior
intermediate dilution step in DMSO was carried out in V-
bottomed dilution plates (Greiner bio-one, UK, cat no 781280).
Schistosomula (120/well) were added to each well in 80 ml of
M169 media using a Matrix WellMate (Thermo Scientific,
Basingstoke, UK). Plates were then incubated in a Cytomat C2
automatic incubator (Thermo Scientific, UK) at 37uC, 5% CO2
for 3 days.
ImagingA Scara Robot (KiNEDx Robot KX-300-470, Peak Robotics,
Colorado, USA) controlled by Overlord 3 (Process Analysis and
Automation, Hemel Hempstead, UK) was used for all plate
movements. After 3 days culture schistosomula were redistributed
and disaggregated by using the Biomek FXp programmed to
aspirate and dispense 40 ml of the well contents in each of the 4
corners of each well (63). Bright-field images were collected using
an ImageXpressMicro HCS microscope (IXM; Molecular Devices,
Wokingham, UK) fitted with a PhotometricsCoolSnapHQ camera
(Roper Scientific, Germany). Focussing of the plate and well
bottom was achieved by the IXM high-speed laser auto-focus, with
a 25 mm offset to focus on the larvae.
For motility analysis 566 sec interval time-lapse images were
collected using a 46S Fluor 0.2NA Nikon objective. For detailed
morphology a 106Ph1 Plan Fluor DL 0.3NA Nikon objective was
used to collect 4 adjacent images, which were tiled together to
maximise larval numbers for phenotype analysis. After imaging,
the plates were visualized by two independent assessors using an
inverted microscope (LeitzDiavertWetzlar, Germany).
Statistical analysisDifferences in phenotype and motility scores were measured by
one-way ANOVA with a Dunn’s post-test to measure significant
differences between DMSO control wells and individual drug
treatments. Z factors for both the phenotype and motility scores
were measured on a per plate basis in Pipeline Pilot 8.5 (Accelrys
Inc., San Diego, USA) with an acceptable score being .0.5 [26].
Results
Development of automated image analysisProduction of image library. A library of ,20,000
schistosomula images showing a wide range of drug-induced
morphological effects was created by treating larvae with anti-
schistosome compounds [21]: PZQ, OPZ, MCZ, Ro15, OX,
DHA or culturing alone in M169 media (M169 controls) or media
containing 0.625% DMSO (DMSO controls). A concentration of
10 mg/ml of the anti-schistosome compounds was chosen as this
concentration induced a wide range of differing phenotypes. The
images were captured from 5 plates run on different occasions with
48 wells per condition being imaged on each plate.
Segmentation. Automated image analysis was undertaken in
Pipeline Pilot 8.5 to determine differences in larval phenotype and
motility after drug treatment. Initially, individual schistosomula
were segmented from the background as shown in Figure 1. It
was determined that 120 schistosomula per well gave an optimal
density of larvae to allow for segmentation of sufficient non-
touching parasites at 106 (morphology) and 46 (motility)
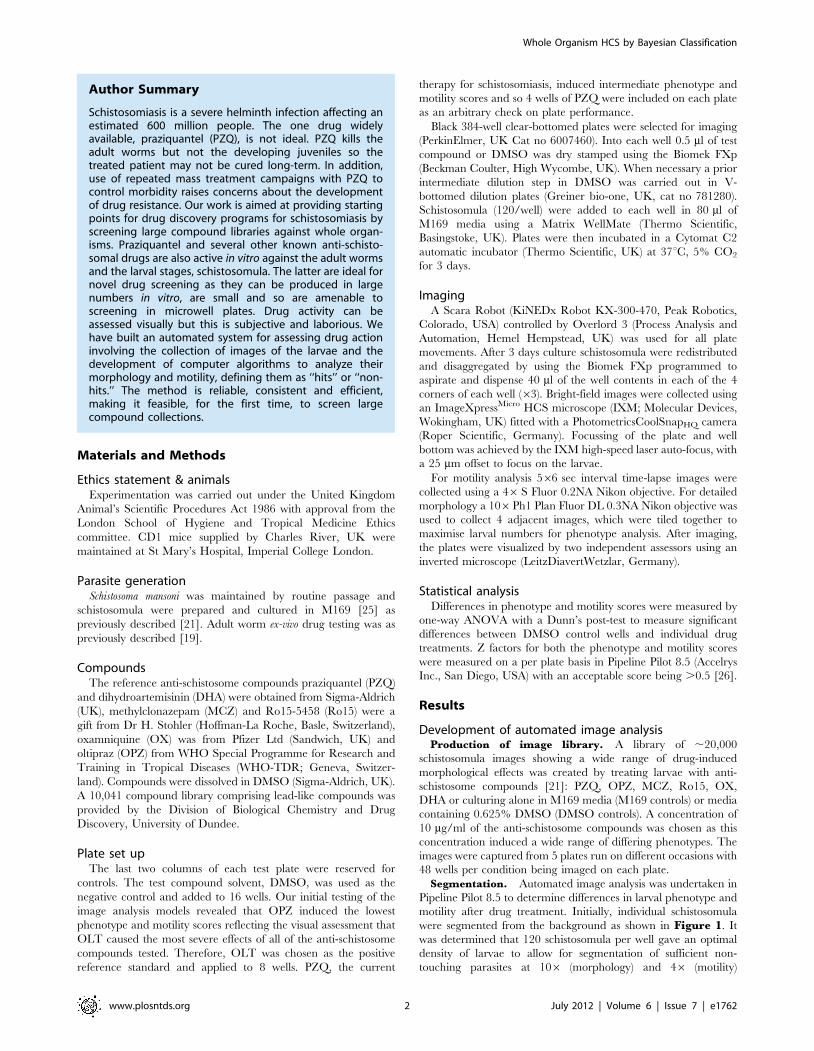
Author Summary
Schistosomiasis is a severe helminth infection affecting anestimated 600 million people. The one drug widelyavailable, praziquantel (PZQ), is not ideal. PZQ kills theadult worms but not the developing juveniles so thetreated patient may not be cured long-term. In addition,use of repeated mass treatment campaigns with PZQ tocontrol morbidity raises concerns about the developmentof drug resistance. Our work is aimed at providing startingpoints for drug discovery programs for schistosomiasis byscreening large compound libraries against whole organ-isms. Praziquantel and several other known anti-schisto-somal drugs are also active in vitro against the adult wormsand the larval stages, schistosomula. The latter are ideal fornovel drug screening as they can be produced in largenumbers in vitro, are small and so are amenable toscreening in microwell plates. Drug activity can beassessed visually but this is subjective and laborious. Wehave built an automated system for assessing drug actioninvolving the collection of images of the larvae and thedevelopment of computer algorithms to analyze theirmorphology and motility, defining them as ‘‘hits’’ or ‘‘non-hits.’’ The method is reliable, consistent and efficient,making it feasible, for the first time, to screen largecompound collections.
Whole Organism HCS by Bayesian Classification
www.plosntds.org 2 July 2012 | Volume 6 | Issue 7 | e1762

Whole Organism HCS by Bayesian Classification
www.plosntds.org 3 July 2012 | Volume 6 | Issue 7 | e1762

magnification. The mean6SD numbers of segmented larvae per
well over a 10,041 compound validation set were 29.468.5 at 46and 25.368.8 at 106.
Phenotyping protocol. The segmented larval images in the
image library were manually classified as a hit (severely damaged
or clearly dead) or non-hit using a custom interface (Fig. S1) built
in Pipeline Pilot 8.5. Numerous image descriptors including pixel
intensities, morphological and texture properties (Table S1) of the
,20,000 segmented larvae were calculated by Pipeline Pilot 8.5.
These properties were each divided into 25 bins spanning the
range of values from manually phenotyped larvae. The occurrence
of values in an individual bin for a given descriptor among the
non-hit larvae was compared to its occurrence among the hit
larvae. Descriptor, bin pairings, which were predominantly seen in
just ‘‘hit’’ or just ‘‘non-hit’’ larvae, were then considered to be
strong predictors of larval state. The collection of these predictors
constitutes our two class Laplacian-modified Bayesian categoriza-
tion model of the differences between larvae manually classified as
a hit or non-hit.
A second Bayesian categorization model was similarly con-
structed to classify drug-specific phenotypes. In this case image
descriptors of larvae treated with the specific anti-schistosome
compounds were used to generate a multi-category Bayesian
categorization model which predicts to which compound the larval
phenotype most closely corresponds, termed ‘drug treatment
class’. In any given test well the most frequent drug treatment class
ascribed to segmented larvae is taken as the class for the well.
For application of the automatic image analysis to subsequent
test wells, image descriptors were collected from individual
segmented larvae and then processed through the Bayesian
models. For each larva these models generate a larval phenotype
score, and its drug treatment class. The values per well were the
average phenotype score and the highest frequency treatment class
respectively. Based on empirical observations data collected from a
minimum of 10 segmented larvae was considered as reliable for
the mean phenotype score. Wells with fewer segmented larvae are
automatically rejected and reported as failures requiring manual
review (see Reporting section below).
Validation of the phenotype model using anti-
schistosome drugs. The screen was initially tested using a
total of 15 plates run on several different occasions, each
containing replicate columns of controls or anti-schistosome drugs.
The mean6SD raw Bayesian model scores generated ranged from
1.2161.02 for DMSO controls to 234.9262.46 for OPZ. The
phenotype score generated by this model reflects the probability
that a test larva being analysed is similar to the controls entered
into the model, with a score close to 0 demonstrating that the larva
is very similar to the control larvae and a highly negative score
demonstrating that it is very different to control larvae. It was
observed that scores generated for the DMSO control wells varied
a little between individual plates run at different times and with
different batches of schistosomula. To compensate for such
variation in the raw Bayesian model scores, individual test
compound scores from a particular plate were adjusted relative
to the corresponding controls on the same plate by subtracting the
DMSO control mean from the test score. To avoid working with
negative score values, which were incompatible with some of the
software, 40 was added to all larval scores including all controls
(235 being the highest score we have ever recorded from any
larva). The number derived was then divided by the mean value
for the DMSO control larvae. In this way the mean value for the
DMSO controls becomes 0 and the most severely disrupted, dead
larvae approach 21. The adjustment of test scores relative to the
DMSO controls on the same plate allowed the effects of test
compounds from the same library, but tested on different plates, to
be compared and ranked.
Figure 2A shows results from 5 representative plates of the 15
tested. Significant differences (p,0.001) were detected between
the mean phenotype scores of the controls and each of the anti-
schistosome drugs. OX had the least effect with phenotype scores
overlapping with the controls. There was no such overlap for the
other anti-schistosome drugs. As expected OPZ induced the lowest
phenotype score (20.7360.06) i.e. the most severe phenotype,
whilst PZQ induced a score of 20.3760.08. Z factor analysis
based on the positive (OPZ) and negative (DMSO) controls for 15
different standard test plates was evaluated to determine the
robustness of the phenotype assay between different imaging days
and batches of larvae. The resulting Z factor score was 0.5226
(Fig. 2B) demonstrating the suitability of this assay for HTS
screening.
Treatment class categorization based on anti-schistosome drug
larval morphology was also assessed with characteristic drug effects
being shown in Figure 2C. With the exception of Ro15, the
treatment class model successfully predicted $88% of wells treated
with anti-schistosome compounds and on average .50% of larvae
within the wells were correctly predicted (Fig. 2D).
Motility analysis protocol. Determination of larval motility
was carried out through the analysis of time-lapse images in
Pipeline pilot 8.5. Motile schistosomula frequently elongate and
then round up but tend not to translocate across the well bottom
so that, as also noted recently by Lee et al. 2012 [27], the centroids
of the parasites move only small distances in a given time.
Therefore, to assess motility, the cumulative change in area
occupied by individual larvae between time frames was calculated
(Fig. 3A). Larval boundaries that overlapped between successive
time frames defined individual larvae. Only larvae which co-
localized in 4 or 5 consecutive time frames and did not touch
adjacent segmented larvae were included in the analysis. The use
of 5 time-lapse images at 6 sec intervals was established
empirically and reflected the balance between the need for co-
localization of larvae in successive images, sufficient mean
movement and overall time for imaging a well. For a given larva
the cumulative change in area was divided by the average size of
the larva to allow for differences in parasite size. The final motility
score for a well was the average across all segmented larvae. Wells
with scores from fewer than 10 schistosomula were deemed
failures but were assessed manually during the reporting proce-
dures (see below).
Validation of the motility model using controls and
standard drugs. The motility model was assessed using the
Figure 1. Representative example of the segmentation of control and praziquantel treated schistosomula. Images for analysis werecaptured on an Images Xpressmicro (A). Initially an adaptive threshold was applied to each individual pixel within the image to highlight objectswithin the image (B). Objects highlighted by the threshold where then closed to encapsulate whole larvae using basic greyscale morphology. Foreach object, background and centre points were calculated so watershed segmentation could be applied to enhance segmentation of the larvae.Filters based on area, perimeter and form factor were then applied to the mask to remove any objects too large or small to be individual larvae takinginto account whether 106or 46 images were being analysed (C). The individual objects were then traced (D) before the mask (red) was applied tothe original image (E). The completed mask was then broken down to separate objects and applied to the original images so individual larvae couldbe segmented from the background.doi:10.1371/journal.pntd.0001762.g001
Whole Organism HCS by Bayesian Classification
www.plosntds.org 4 July 2012 | Volume 6 | Issue 7 | e1762
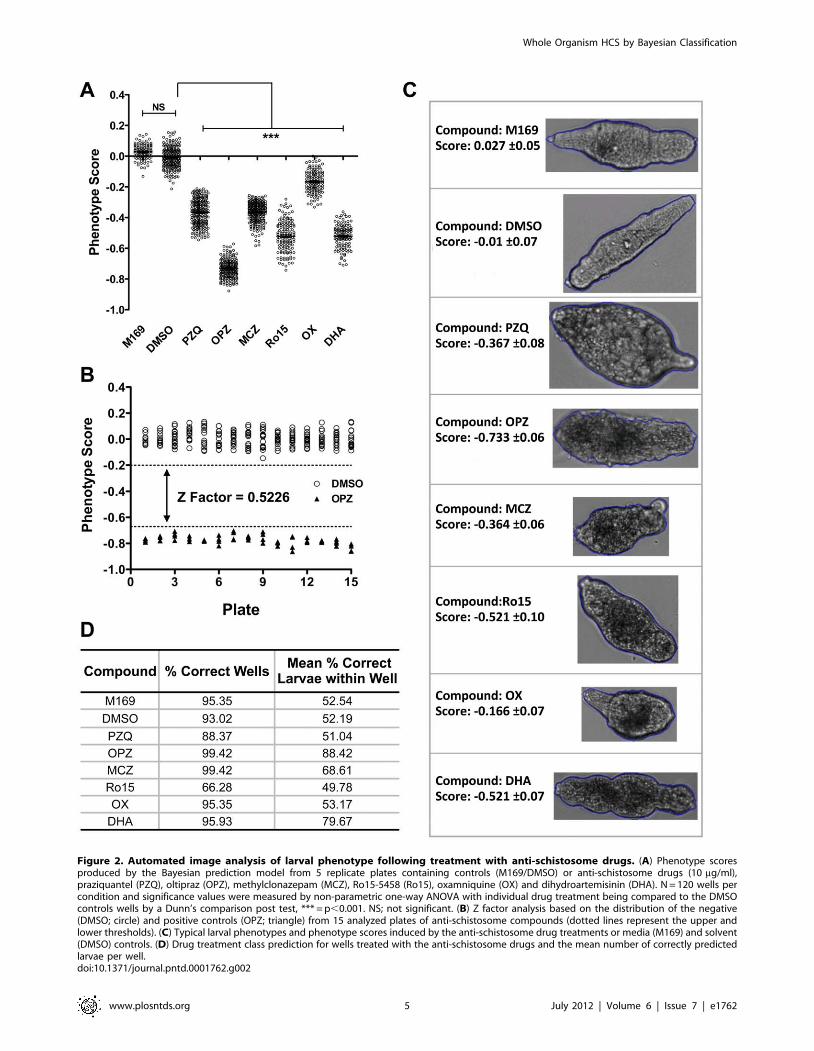
Figure 2. Automated image analysis of larval phenotype following treatment with anti-schistosome drugs. (A) Phenotype scoresproduced by the Bayesian prediction model from 5 replicate plates containing controls (M169/DMSO) or anti-schistosome drugs (10 mg/ml),praziquantel (PZQ), oltipraz (OPZ), methylclonazepam (MCZ), Ro15-5458 (Ro15), oxamniquine (OX) and dihydroartemisinin (DHA). N = 120 wells percondition and significance values were measured by non-parametric one-way ANOVA with individual drug treatment being compared to the DMSOcontrols wells by a Dunn’s comparison post test, *** = p,0.001. NS; not significant. (B) Z factor analysis based on the distribution of the negative(DMSO; circle) and positive controls (OPZ; triangle) from 15 analyzed plates of anti-schistosome compounds (dotted lines represent the upper andlower thresholds). (C) Typical larval phenotypes and phenotype scores induced by the anti-schistosome drug treatments or media (M169) and solvent(DMSO) controls. (D) Drug treatment class prediction for wells treated with the anti-schistosome drugs and the mean number of correctly predictedlarvae per well.doi:10.1371/journal.pntd.0001762.g002
Whole Organism HCS by Bayesian Classification
www.plosntds.org 5 July 2012 | Volume 6 | Issue 7 | e1762

15 plates of anti-schistosome compounds described above. The
mean6SD raw motility scores ranged from 1.3560.19 for DMSO
to 0.07160.02 for OPZ. As for the phenotype analysis, motility
scores for test compounds were adjusted to compensate for plate to
plate variation between the control larvae. For this, the DMSO
control motility mean was subtracted from the test score and
divided by the DMSO control motility mean for a given plate.
Figure 3B shows results from 5 representative plates. Motility
scores for DMSO controls were significantly (p,0.001) different
from all of the anti-schistosome compounds and there was no
overlap of motility scores apart from for 3 OX wells. OPZ and
DHA induced the greatest effect on motility whilst PZQ treatment
resulted in only a partial restriction in motility. Z factor analysis
using the OPZ positive control and DMSO negative controls wells
showed this assay to be suitable for high throughput screening
(Fig. 3C) with a Z Factor score of 0.5765.
Combined analysis & hit threshold definition. Although
the phenotype and motility algorithms each worked well in
distinguishing drug-treated from control parasites, combined
analysis of both measures has the potential to provide even more
robust discrimination. Figure 4A shows a plot of both scores for a
set of 3 plates containing anti-schistosome compounds tested at
10 mM, which is the concentration we routinely use for primary
screening. The scores for all of the anti-schistosome drugs apart
from DHA and Ro15 clustered distinctly from the controls with
OPZ showing the most severe effects. However, the DHA and
Ro15 scores were clustered with the controls, in contrast to their
effects at 10 mg/ml (35.2 and 25.4 mM, respectively) which are
shown in Figures 2 & 3.
All the wells treated with anti-schistosome compounds were also
visually assessed for hit status based on the hit criterion of $70%
damaged or dead larvae per well as previously described [21]. All
of the wells of anti-schistosome compounds apart from DHA and
Ro15 were recorded as hits (Fig. 4B). Based on these results,
thresholds for phenotype and motility scores, which reliably
delineated visual hit/non-hit wells treated with 10 mM anti-
schistosome drugs, were selected as 20.15 for the phenotype and
20.35 for the motility scores (Fig. 4B).
We next tested the platform against a random selection of
compounds which had been screened as hits/non-hits in a primary
in vitro S. mansoni adult worm assay for the WHO-TDR Helminth
Drug Initiative [19]. The larval algorithm scores for all of the adult
hits fell below 20.25 phenotype and 20.8 motility scores i.e. well
within the hit threshold levels (Fig. S2).
Plate reporting. An automatically-generated, interactive,
reporting system was developed within Pipeline Pilot 8.5 to allow
Figure 3. Automated image analysis of larval motility following treatment with anti-schistosome compounds. Original images werefirstly segmented as described Figure 1 and then the cumulative change in area for each individual larva measured over 5 time frames. The scoresfor individual larvae were averaged to generate a motility score per well. (A) Illustration of differences in larval motility between a high motility well(DMSO) with low overlap between larval location in successive time frames (red boundaries), a medium motility well (PZQ; praziquantel) and lowmotility wells with almost perfect overlap between successive time frame boundaries (DHA; dihydroartemisinin & OPZ; oltipraz). (B) Representativemotility scores from 5 plates of anti-schistosome compounds (10 mg/ml), n = 120 wells per condition and significance values were measured by non-parametric one-way ANOVA with individual drug treatments being compared to the DMSO controls wells using a Dunn’s comparison post test,*** = p,0.001. NS; not significant. (C) Z factor analysis based on the distribution of the negative (DMSO; open circle) and positive controls (OPZ;closed triangle) from 15 plates (dotted lines represent upper and lower thresholds).doi:10.1371/journal.pntd.0001762.g003
Whole Organism HCS by Bayesian Classification
www.plosntds.org 6 July 2012 | Volume 6 | Issue 7 | e1762

manual assessment of images and analysis scores on a per plate
basis (Fig. S3). Reports allow the recall of images and all well
scores in order to remove false positives (commonly due to
crystallization of test compounds). Acceptable assay performance is
assessed by confirmation of the viability of the control larvae
(mean raw phenotype score .25 and motility score .0.6) and an
acceptable Z factor score of .0.5. Plates that did not conform to
these scores would be considered failures.
Validation using a 10,041 lead compound libraryFollowing preliminary assessment of appropriate screening
concentration/hit rate, the 10,041 compound library was screened
at 10 mM. All of the plates were also visually scored by two
independent assessors [21]. Using the HCS hit thresholds defined
above, all the visual hits (379) apart from four were determined to
be hits by the automatic analysis (Figs. 5A & B). Three of the
failures were ascribed scores which fell just outside the hit
threshold and one failed to segment due to the parasites remaining
aggregated. The hit region also contained 109 wells which were
visual non-hits (i.e. false positives by HCS). Of these, 86 were wells
containing compound crystals. All of these were readily rejected as
hits on manual review of the corresponding images in the
automated HCS plate reports by marking the ‘‘Non-Hit check-
box’’ (Fig. S3E). Overall, during the manual plate reading, 780
wells were found to have crystals, of which 130 were deemed to be
hits. Importantly, all of these fell in the HCS hit region. A novel
phenotypic effect (internal vacuolation) was also identified during
visual assessment/plate reporting for a number of compounds, a
proportion of which were scored as hits by the HCS. Visually,
larval viability was not considered sufficiently reduced to designate
these as hits and none of the compounds were active in the adult
assay. Z factor scores were reviewed to assess plate performance
during screening (Fig. 5C) all of which were within an acceptable
range.
Hits from the screen were also analysed and grouped according
to larval phenotype by the Bayesian categorization model to
determine which anti-schistosome compound they most resem-
bled. From the 378 hits, 175 were ascribed to the OPZ treatment
class, 60 to PZQ, 13 to MCZ, 83 to Ro15, 34 to OX and 13 to
DHA.
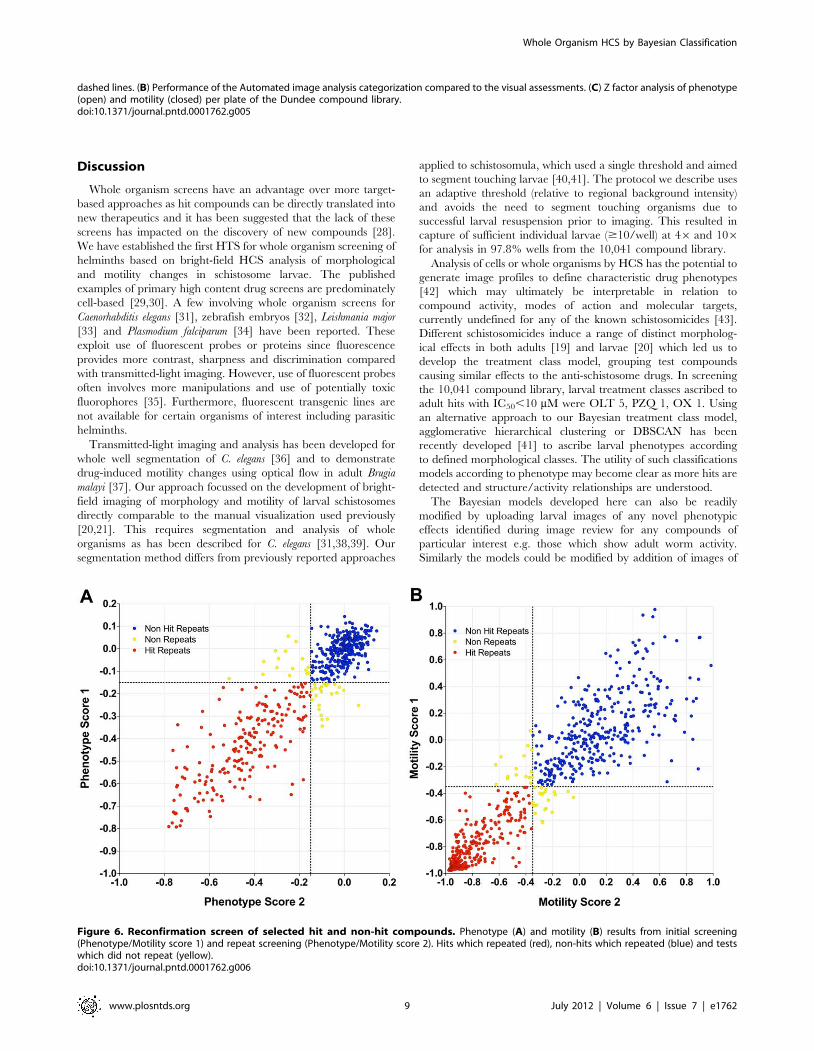
Repeat validationThe assay was further validated by re-testing a selection (796) of
hits and non-hits from the 10,041 compound library along with
compounds from the WHO-TDR set. There was a high level of
concordance between the initial and repeat testing (92.3% for
morphology, Fig. 6A; 95.2% for motility, Fig. 6B).
Secondary screening of compounds: Adult assayIn vitro testing against ex-vivo adult worms is a crucial secondary
screen since the adult worm is the key target of drug action.
Preliminary testing of a few of the larval hits in the secondary adult
worm assay [19] at 10 mM yielded a very low hit rate and so the
hits were all tested at 20 mM which gave 45 adult hits. Plotting the
larval phenotype and motility scores for these hits (Fig. 7) showed
that the majority corresponded to severe larval phenotypes but a
few were scattered throughout the hit threshold region. The
number of hits ascribed to different treatment classes were OPZ
28, PZQ 6, DHA 4, Ro15 4, OX 2 and MCZ 1. Subsequent IC50
testing of the adult hits identified 7 compounds which had IC50s
of ,10 mM and which are the subject of on-going studies. These
compounds were attributed the drug treatment classes OLT 5,
PZQ 1, OX 1.
Figure 4. Combined phenotype and motility analysis compared with visual hit assessment for larvae treated with known anti-schistosome compounds. (A) Combined phenotype and motility scores for larvae treated with 10 mM praziquantel (PZQ; red), oltipraz (OPZ;black), methylclonazepam (MCZ; orange), Ro15-5458 (Ro15; blue), oxamniquine (OX; purple) dihydroartemisinin (DHA; yellow) and controls (M169;aqua & DMSO; green). (B) Visual assessment of hits (red) or non-hits (blue) for the wells shown in (A) with a visual hit defined as $70% damaged ordead schistosomula within a well [21]. Based on this, the dotted line shows the thresholds selected for definition of the hit region (20.15 for thephenotype score and 20.35 for the motility score). N = 1500 wells across 5 plates containing anti-schistosome drugs.doi:10.1371/journal.pntd.0001762.g004
Whole Organism HCS by Bayesian Classification
www.plosntds.org 7 July 2012 | Volume 6 | Issue 7 | e1762
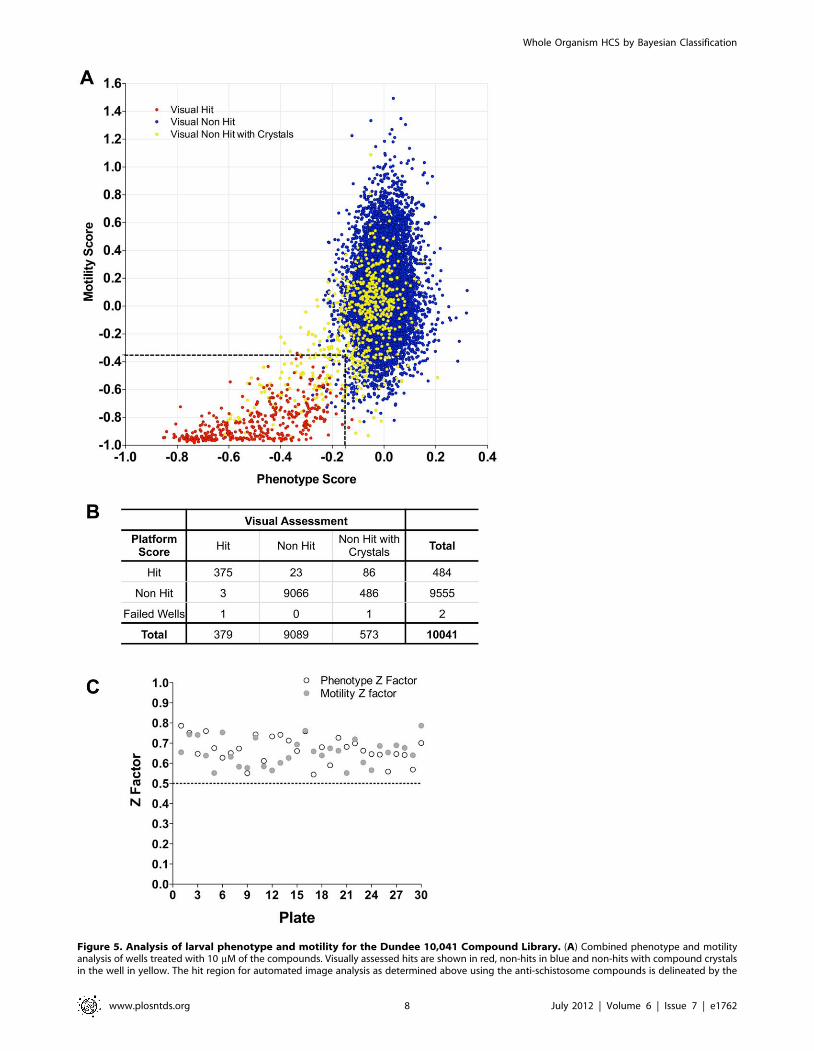
Figure 5. Analysis of larval phenotype and motility for the Dundee 10,041 Compound Library. (A) Combined phenotype and motilityanalysis of wells treated with 10 mM of the compounds. Visually assessed hits are shown in red, non-hits in blue and non-hits with compound crystalsin the well in yellow. The hit region for automated image analysis as determined above using the anti-schistosome compounds is delineated by the
Whole Organism HCS by Bayesian Classification
www.plosntds.org 8 July 2012 | Volume 6 | Issue 7 | e1762
Discussion
Whole organism screens have an advantage over more target-
based approaches as hit compounds can be directly translated into
new therapeutics and it has been suggested that the lack of these
screens has impacted on the discovery of new compounds [28].
We have established the first HTS for whole organism screening of
helminths based on bright-field HCS analysis of morphological
and motility changes in schistosome larvae. The published
examples of primary high content drug screens are predominately
cell-based [29,30]. A few involving whole organism screens for
Caenorhabditis elegans [31], zebrafish embryos [32], Leishmania major
[33] and Plasmodium falciparum [34] have been reported. These
exploit use of fluorescent probes or proteins since fluorescence
provides more contrast, sharpness and discrimination compared
with transmitted-light imaging. However, use of fluorescent probes
often involves more manipulations and use of potentially toxic
fluorophores [35]. Furthermore, fluorescent transgenic lines are
not available for certain organisms of interest including parasitic
helminths.
Transmitted-light imaging and analysis has been developed for
whole well segmentation of C. elegans [36] and to demonstrate
drug-induced motility changes using optical flow in adult Brugia
malayi [37]. Our approach focussed on the development of bright-
field imaging of morphology and motility of larval schistosomes
directly comparable to the manual visualization used previously
[20,21]. This requires segmentation and analysis of whole
organisms as has been described for C. elegans [31,38,39]. Our
segmentation method differs from previously reported approaches
applied to schistosomula, which used a single threshold and aimed
to segment touching larvae [40,41]. The protocol we describe uses
an adaptive threshold (relative to regional background intensity)
and avoids the need to segment touching organisms due to
successful larval resuspension prior to imaging. This resulted in
capture of sufficient individual larvae ($10/well) at 46 and 106for analysis in 97.8% wells from the 10,041 compound library.
Analysis of cells or whole organisms by HCS has the potential to
generate image profiles to define characteristic drug phenotypes
[42] which may ultimately be interpretable in relation to
compound activity, modes of action and molecular targets,
currently undefined for any of the known schistosomicides [43].
Different schistosomicides induce a range of distinct morpholog-
ical effects in both adults [19] and larvae [20] which led us to
develop the treatment class model, grouping test compounds
causing similar effects to the anti-schistosome drugs. In screening
the 10,041 compound library, larval treatment classes ascribed to
adult hits with IC50,10 mM were OLT 5, PZQ 1, OX 1. Using
an alternative approach to our Bayesian treatment class model,
agglomerative hierarchical clustering or DBSCAN has been
recently developed [41] to ascribe larval phenotypes according
to defined morphological classes. The utility of such classifications
models according to phenotype may become clear as more hits are
detected and structure/activity relationships are understood.
The Bayesian models developed here can also be readily
modified by uploading larval images of any novel phenotypic
effects identified during image review for any compounds of
particular interest e.g. those which show adult worm activity.
Similarly the models could be modified by addition of images of
dashed lines. (B) Performance of the Automated image analysis categorization compared to the visual assessments. (C) Z factor analysis of phenotype(open) and motility (closed) per plate of the Dundee compound library.doi:10.1371/journal.pntd.0001762.g005
Figure 6. Reconfirmation screen of selected hit and non-hit compounds. Phenotype (A) and motility (B) results from initial screening(Phenotype/Motility score 1) and repeat screening (Phenotype/Motility score 2). Hits which repeated (red), non-hits which repeated (blue) and testswhich did not repeat (yellow).doi:10.1371/journal.pntd.0001762.g006
Whole Organism HCS by Bayesian Classification
www.plosntds.org 9 July 2012 | Volume 6 | Issue 7 | e1762

novel phenotypes deemed on manual review not to warrant hit
status e.g. those causing internal vacuolation identified during our
screening.
The HCS was validated using several compound collections. At
10 mM, a commonly used concentration for primary screening, the
models reliably and reproducibly distinguished all of our reference
schistosomicides from the controls with the exception of DHA and
Ro15. This is not considered a failure of the primary assay since
both of these compounds are inactive in the visual larval and adult
worm in vitro assays at 10 mM. Based on the results with the anti-
schistosome drugs, hit thresholds of 20.15 for phenotype and
20.35 for motility were established and proved robust in detecting
40 previously tested adult hit compounds [19] and 99.8% of
visually assessed hits from the 10,041 compound library. The HCS
produced a false positive rate of 1.1%, mostly (78%) due to the
precipitation of test compounds in wells which in fact contained
healthy parasites and which were readily redefined as non-hits
during routine reviewing of the automated plate reports.
The HCS offers significant advantages over other recent
approaches to objective quantitation of schistosomula damage.
Peak et al. (2010) [23] successfully assessed severe drug effects
based on uptake of fluorescent markers but the assay involves
multiple wash steps and was unable to detect more subtle effects
e.g. caused by PZQ. An assay based on use of the redox indicator,
Alamar Blue, was similarly less sensitive than visual assessment for
more subtle effects and was influenced by variation in parasite
numbers per well [21]. Isothermal microcalorimetry [44],
assessment of motility via electrical impedance measurement
[45] and optical flow [37] are also able to quantitate drug effects in
schistosomes, but are not currently readily adaptable to high
throughput applications.
Much of the HTS described is automated and simple to
operate. Once test plates have been set up and left for 3 days in the
Cytomat incubator, the image capture and analysis systems would
run automatically after opening ‘‘Overlord 3’’, the automation
control software and pressing ‘‘run’’. Thereafter, plates emerge
from the Cytomat and are robotically moved around for barcode
reading, parasite resuspension, imaging and then return to the
cytomat. Subsequent analysis involves opening Pipeline Pilot 8.5
and running the analysis protocol. Once complete the plate reports
are accessible within an intranet web-port. To become sufficiently
familiar with the current customized system would require only a
couple of days of training and completing a few test runs. Basic
modification of the analysis protocols e.g. to run fewer test
compounds in a plate, would require some familiarity with
Pipeline Pilot 8.5 as well as MetaXpress software which controls
the IXM microscope. More significant alterations of the protocols
would require in-depth knowledge of all the different software
involved. Currently the platform takes 2 hrs to image a 384 well
plate and a further 2 hrs to analyse the phenotype and motility
images. The system can be programmed to start imaging at any
time of the day and could run close to continuously. So if test
plates were set up on each of 4 days per week, the throughput,
limited by plate reading, would be ,48 plates or 16,896
compounds/week which would require around 26106 cercariae/
week. In fact it is cercarial production which is limiting our current
throughput capability to around 10 plates twice per week (,7,000
compounds/week, 350,000/year).
In conclusion, the HCS described is suitable for primary
screening of large compound collections for activity against
schistosomes. Further studies are ongoing to adapt this system to
screen against several species of nematode larvae of medical and
veterinary importance, which may allow parallel testing of libraries
against various helminths.
Supporting Information
Figure S1 Schistosoma Analysis Platform custom inter-face. The custom interface enables selection and viewing of a
particular plate (A) and well (B). This subsequently loads individual
wells (C) and segmented larval images (D). Each segmented larva
can be selected (E) and manually phenotyped with a selection of
criteria (F) along with the anti-schistosome compound with which
the well was treated.
(TIF)
Figure S2 Combined larval phenotype and motilityanalysis of compounds initially screened against adultworms. Larval phenotype and motility scores for compounds
from a previously tested WHO/TDR compound library which
were adult hits (red) or non hits (blue) (N = 40 of each).
(TIF)
Figure S3 Interactive plate report. Data from a chosen
plate is displayed in the interactive web port via a tabbed table, bar
charts and a phenotype/motility scatter plot (A). Data from a
particular well can be highlighted in the table or on the scatter plot
by clicking on a cell in the table or a point on the graph. This will
also display the appropriate phenotype and motility images in the
dynamic container (B). Clicking on these enlarges them and also
shows images and phenotype scores of the individual larvae (C) or
motility scores for individual larvae (D). Once a well has been
assessed to be a hit or non-hit, the table can be updated by clicking
the appropriate check box (E) which once submitted (F) will
update the database.
(TIF)
Table S1 Image descriptors used to build Bayesianmodels. Image descriptors including morphological properties
(size, solidity, circularity, eccentricity) pixel intensity properties
(normalized intensity mean, standard deviation, skewness, etc.)
and texture properties at multiple length scales (spatial moments,
central moments, Hu moments, co-occurrence correlation, co-
Figure 7. Secondary adult hit screening of larval hits for theDundee 10,041 Compound Library. Larval phenotype and motilityscores for the compounds which were tested in the secondary adultassay. Adult hits are depicted in red and non-hits in grey.doi:10.1371/journal.pntd.0001762.g007
Whole Organism HCS by Bayesian Classification
www.plosntds.org 10 July 2012 | Volume 6 | Issue 7 | e1762

occurrence entropy etc.) were used to build both Bayesian models
for phenotype scoring and phenotype classification.
(TIF)
Acknowledgments
We wish to thank Ken Duncan and Richard Elliott for their advice
throughout the project. We also wish to thank Julie Frearson for all her
advice on high-throughput instrumentation and Paul Andrews for help in
HCS selection, Malcolm Crook for advice on laboratory automation and
Paul Wyatt for arranging the supply of the compound library from the
University of Dundee’s compound collection.
Author Contributions
Conceived and designed the experiments: QDB ALH RAP. Performed the
experiments: RAP NRM AG. Analyzed the data: RAP QDB NRM.
Contributed reagents/materials/analysis tools: IHG IH LSB AEB IM.
Wrote the paper: RAP QDB.
References
1. Hotez PJ, Brindley PJ, Bethony JM, King CH, Pearce EJ, et al. (2008) Helminth
infections: the great neglected tropical diseases. The Journal of clinicalinvestigation 118: 1311–1321.
2. Knox MR, Besier RB, Le Jambre LF, Kaplan RM, Torres-Acosta JF, et al.
(2011) Novel approaches for the control of helminth parasites of livestock VI:Summary of discussions and conclusions. Veterinary parasitology.
3. WHO (2010) Working to overcome the global impact of neglected tropical
diseases. WHO/HTM/NTD/20101 Geneva, 2010.
4. WHO (2011) Working to overcome the global impact of neglected tropical
diseases. Update 2011. WHO/HTM/NTD/20113 Geneva, 2011.
5. Geary TG, Woo K, McCarthy JS, Mackenzie CD, Horton J, et al. (2010)Unresolved issues in anthelmintic pharmacology for helminthiases of humans.
International Journal for Parasitology 40: 1–13.
6. King CH (2010) Parasites and poverty: the case of schistosomiasis. Acta Trop
113: 95–104.
7. Sabah AA, Fletcher C, Webbe G, Doenhoff MJ (1986) Schistosoma mansoni:chemotherapy of infections of different ages. Experimental parasitology 61: 294–
303.
8. Fenwick A, Webster JP, Bosque-Oliva E, Blair L, Fleming FM, et al. (2009) The
Schistosomiasis Control Initiative (SCI): rationale, development and implemen-tation from 2002–2008. Parasitology 136: 1719–1730.
9. Cioli D (2000) Praziquantel: is there real resistance and are there alternatives?
Curr Opin Infect Dis 13: 659–663.
10. Stelma FF, Talla I, Sow S, Kongs A, Niang M, et al. (1995) Efficacy and side
effects of praziquantel in an epidemic focus of Schistosoma mansoni. AmericanJournal of Tropical Medicine and Hygiene 53: 167–170.
11. Guisse F, Polman K, Stelma FF, Mbaye A, Talla I, et al. (1997) Therapeutic
evaluation of two different dose regimens of praziquantel in a recent
Schistosoma mansoni focus in Northern Senegal. American Journal of TropicalMedicine and Hygiene 56: 511–514.
12. Ismail M, Metwally A, Farghaly A, Bruce J, Tao LF, et al. (1996)
Characterization of isolates of Schistosoma mansoni from Egyptian villagersthat tolerate high doses of praziquantel. American Journal of Tropical Medicine
and Hygiene 55: 214–218.
13. Cioli D, Botros SS, Wheatcroft-Francklow K, Mbaye A, Southgate V, et al.
(2004) Determination of ED50 values for praziquantel in praziquantel-resistantand -susceptible Schistosoma mansoni isolates. International Journal for
Parasitology 34: 979–987.
14. Caffrey CR, Secor WE (2011) Schistosomiasis: from drug deployment to drug
development. Curr Opin Infect Dis.
15. Sayed AA, Simeonov A, Thomas CJ, Inglese J, Austin CP, et al. (2008)Identification of oxadiazoles as new drug leads for the control of schistosomiasis.
Nat Med 14: 407–412.
16. Eissa MM, El-Azzouni MZ, Amer EI, Baddour NM (2011) Miltefosine, a
promising novel agent for schistosomiasis mansoni. International Journal forParasitology 41: 235–242.
17. Keiser J, Manneck T, Vargas M (2011) Interactions of mefloquine with
praziquantel in the Schistosoma mansoni mouse model and in vitro. The Journalof antimicrobial chemotherapy 66: 1791–1797.
18. Hudson A, Nwaka S (2007) The Concept Paper on the Helminth DrugInitiative. Onchocerciasis/lymphatic filariais and schistosomiasis: opportunities
and challenges for the discovery of new drugs/diagnostics. Expert Opinion onDrug Discovery 2: S3–S7.
19. Ramirez B, Bickle Q, Yousif F, Fakorede FK, Mouries M-A, et al. (2007)
Schistosomes: challenges in compound screening. Expert Opinion on Drug
Discovery 2: S53–361.
20. Abdulla MH, Ruelas DS, Wolff B, Snedecor J, Lim KC, et al. (2009) Drugdiscovery for schistosomiasis: hit and lead compounds identified in a library of
known drugs by medium-throughput phenotypic screening. PLoS neglected
tropical diseases 3: e478.
21. Mansour NR, Bickle QD (2010) Comparison of microscopy and Alamar bluereduction in a larval based assay for schistosome drug screening. PLoS neglected
tropical diseases 4: e795.
22. Holtfreter MC, Loebermann M, Frei E, Riebold D, Wolff D, et al. (2010)Schistosomula, pre-adults and adults of Schistosoma mansoni ingest fluores-
cence-labelled albumin in vitro and in vivo: implication for a drug-targeting
model. Parasitology 137: 1645–1652.
23. Peak E, Chalmers IW, Hoffmann KF (2010) Development and validation of aquantitative, high-throughput, fluorescent-based bioassay to detect schistosoma
viability. PLoS neglected tropical diseases 4: e759.24. Manneck T, Braissant O, Ellis W, Keiser J (2011) Schistosoma mansoni:
antischistosomal activity of the four optical isomers and the two racemates of
mefloquine on schistosomula and adult worms in vitro and in vivo. Experimentalparasitology 127: 260–269.
25. Basch PF (1981) Cultivation of Schistosoma mansoni in vitro. I. Establishment ofcultures from cercariae and development until pairing. The Journal of
parasitology 67: 179–185.
26. Zhang JH, Chung TD, Oldenburg KR (1999) A Simple Statistical Parameter forUse in Evaluation and Validation of High Throughput Screening Assays.
J Biomol Screen 4: 67–73.27. Lee H, Moody-Davis A, Saha U, Suzuki BM, Asarnow D, et al. (2012)
Quantification and clustering of phenotypic screening data using time-seriesanalysis for chemotherapy of schistosomiasis. BMC genomics 13 Suppl 1: S4.
28. Swinney DC, Anthony J (2011) How were new medicines discovered? Nature
reviews Drug discovery 10: 507–519.29. Bickle M (2010) The beautiful cell: high-content screening in drug discovery.
Analytical and bioanalytical chemistry 398: 219–226.30. Zanella F, Lorens JB, Link W (2010) High content screening: seeing is believing.
Trends in biotechnology 28: 237–245.
31. Gosai SJ, Kwak JH, Luke CJ, Long OS, King DE, et al. (2010) Automated high-content live animal drug screening using C. elegans expressing the aggregation
prone serpin alpha1-antitrypsin Z. PloS one 5: e15460.32. Peravali R, Gehrig J, Giselbrecht S, Lutjohann DS, Hadzhiev Y, et al. (2011)
Automated feature detection and imaging for high-resolution screening ofzebrafish embryos. Biotechniques 50: 319–324.
33. Siqueira-Neto JL, Song OR, Oh H, Sohn JH, Yang G, et al. (2010)
Antileishmanial high-throughput drug screening reveals drug candidates withnew scaffolds. PLoS neglected tropical diseases 4: e675.
34. Baniecki ML, Wirth DF, Clardy J (2007) High-throughput Plasmodiumfalciparum growth assay for malaria drug discovery. Antimicrobial agents and
chemotherapy 51: 716–723.
35. Graves R (2011) Incorporating transmitted light modalities into high-contentanalysis assays. In: LM CMaM, editor. Label-free technologies for drug
discovery. New York: John Wiley and Sons, Ltd. pp. 101 = 110.36. Moy TI, Conery AL, Larkins-Ford J, Wu G, Mazitschek R, et al. (2009) High-
throughput screen for novel antimicrobials using a whole animal infectionmodel. ACS Chem Biol 4: 527–533.
37. Marcellino C, Gut J, Lim KC, Singh R, McKerrow J, et al. (2012) WormAssay:
a novel computer application for whole-plate motion-based screening ofmacroscopic parasites. PLoS neglected tropical diseases 6: e1494.
38. Stephens GJ, Johnson-Kerner B, Bialek W, Ryu WS (2008) Dimensionality anddynamics in the behavior of C. elegans. PLoS computational biology 4:
e1000028.
39. Cronin CJ, Mendel JE, Mukhtar S, Kim YM, Stirbl RC, et al. (2005) Anautomated system for measuring parameters of nematode sinusoidal movement.
BMC genetics 6: 5.40. Singh R, Pittas MI, Heskia I, Xu F, McKerrow JH, et al. (2009) Automated
image-based phenotypic screening for high-throughput drug discovery. In:Proceedings of 22nd IEEE Symposium on Computer-Based Medical Systems,
2009: ALbuquerque, New Mexico, USA.
41. Lee H, Moody-Davis A, Saha U, Suzuki B, Asarnow D, et al. (2012)Quantification and clustering of phenotypic screening data using time-series
analysis for chemotherapy of schistosomiasis. BMC Genomics 13: S4.42. Perlman ZE, Slack MD, Feng Y, Mitchison TJ, Wu LF, et al. (2004)
Multidimensional drug profiling by automated microscopy. Science 306: 1194–
1198.43. Doenhoff MJ, Cioli D, Utzinger J (2008) Praziquantel: mechanisms of action,
resistance and new derivatives for schistosomiasis. Curr Opin Infect Dis 21: 659–667.
44. Manneck T, Braissant O, Haggenmuller Y, Keiser J (2011) Isothermal
microcalorimetry to study drugs against Schistosoma mansoni. Journal ofclinical microbiology 49: 1217–1225.
45. Smout MJ, Kotze AC, McCarthy JS, Loukas A (2010) A novel high throughputassay for anthelmintic drug screening and resistance diagnosis by real-time
monitoring of parasite motility. PLoS neglected tropical diseases 4: e885.
Whole Organism HCS by Bayesian Classification
www.plosntds.org 11 July 2012 | Volume 6 | Issue 7 | e1762