Paul Frank Collins P.C. All Rights Reserved - · PDF filePaul Frank + Collins P.C. ... •...
51
© Paul Frank + Collins P.C. All Rights Reserved
Transcript of Paul Frank Collins P.C. All Rights Reserved - · PDF filePaul Frank + Collins P.C. ... •...

© Paul Frank + Collins P.C. All Rights Reserved

h fOur Shifting Energy + Cli L dClimate Landscape: O t iti fOpportunities for
ChangeChangeKimberly K. Hayden, Esq.Team Leader, Renewable Energy + Infrastructure Paul Frank + Collins P.C.One Church Street PO Box 1307One Church Street, P.O. Box 1307Burlington, VT 05402‐[email protected]
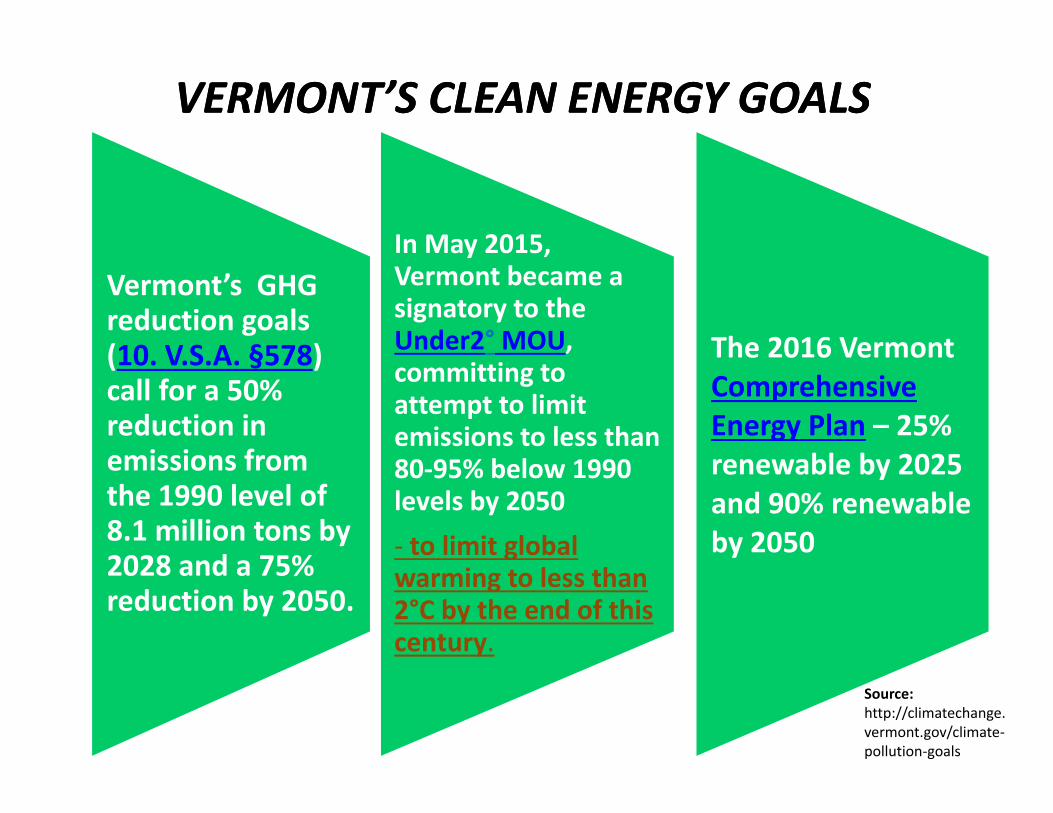
VERMONT’S CLEAN ENERGY GOALSVERMONT’S CLEAN ENERGY GOALS
In May 2015, Vermont’s GHG reduction goals (10 V S A §578)
In May 2015, Vermont became a signatory to the Under2° MOU, The 2016 Vermont(10. V.S.A. §578)
call for a 50% reduction in emissions from
committing to attempt to limit emissions to less than
The 2016 VermontComprehensive Energy Plan – 25%
bl b 2025emissions from the 1990 level of 8.1 million tons by 2028 and a 75%
80‐95% below 1990 levels by 2050 ‐ to limit global
renewable by 2025 and 90% renewable by 2050
2028 and a 75% reduction by 2050.
warming to less than 2°C by the end of this century.
Source: http://climatechange.vermont.gov/climate‐pollution‐goals
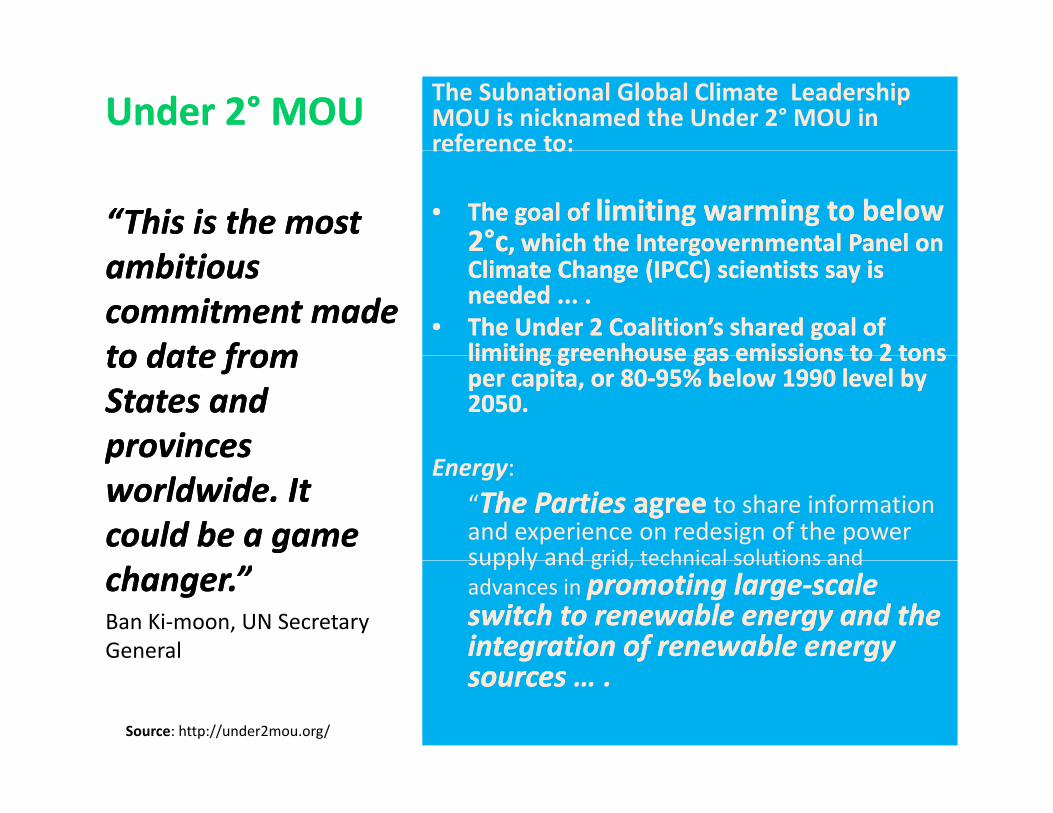
Under 2Under 2°° MOUMOU The Subnational Global Climate Leadership MOU is nicknamed the Under 2° MOU in reference to:reference to:
•• The goal of The goal of limiting warming to below limiting warming to below 22°°cc, which the Intergovernmental Panel on , which the Intergovernmental Panel on
“This is the most “This is the most bb
, g, gClimate Change (IPCC) scientists say is Climate Change (IPCC) scientists say is needed ... .needed ... .
•• The Under 2 Coalition’sThe Under 2 Coalition’s shared goal of shared goal of limiting greenhouse gas emissions to 2 tonslimiting greenhouse gas emissions to 2 tons
ambitious ambitious commitment made commitment made to date fromto date from limiting greenhouse gas emissions to 2 tons limiting greenhouse gas emissions to 2 tons
per capita, or 80per capita, or 80‐‐95% below 1990 level by 95% below 1990 level by 2050.2050.
to date fromto date fromStates and States and provinces provinces
Energy:“The PartiesThe Parties agreeagree to share information and experience on redesign of the power supply and grid technical solutions and
ppworldwide. It worldwide. It could be a game could be a game
supply and grid, technical solutions and advances in promoting largepromoting large‐‐scale scale switch to renewable energy and the switch to renewable energy and the integration of renewable energy integration of renewable energy
changer.”changer.”Ban Ki‐moon, UN Secretary General
sourcessources … .Source: http://under2mou.org/

Vermont 2016 Comprehensive Energy Plan Vermont 2016 Comprehensive Energy Plan
““We ha e aWe ha e amoral and economicmoral and economic““We have a We have a moral and economic moral and economic impeimperative rative to take substantial and to take substantial and
consistent action to reduceconsistent action to reduceconsistent action to reduce consistent action to reduce greenhouse gas emissionsgreenhouse gas emissions to to
mitigate global climatemitigate global climatemitigate global climatemitigate global climateDisruptionDisruption””
Source: Vermont 2016 Comprehensive Energy Plan Executive Summary at 4

HOW ARE WE DOINGHOW ARE WE DOING
????
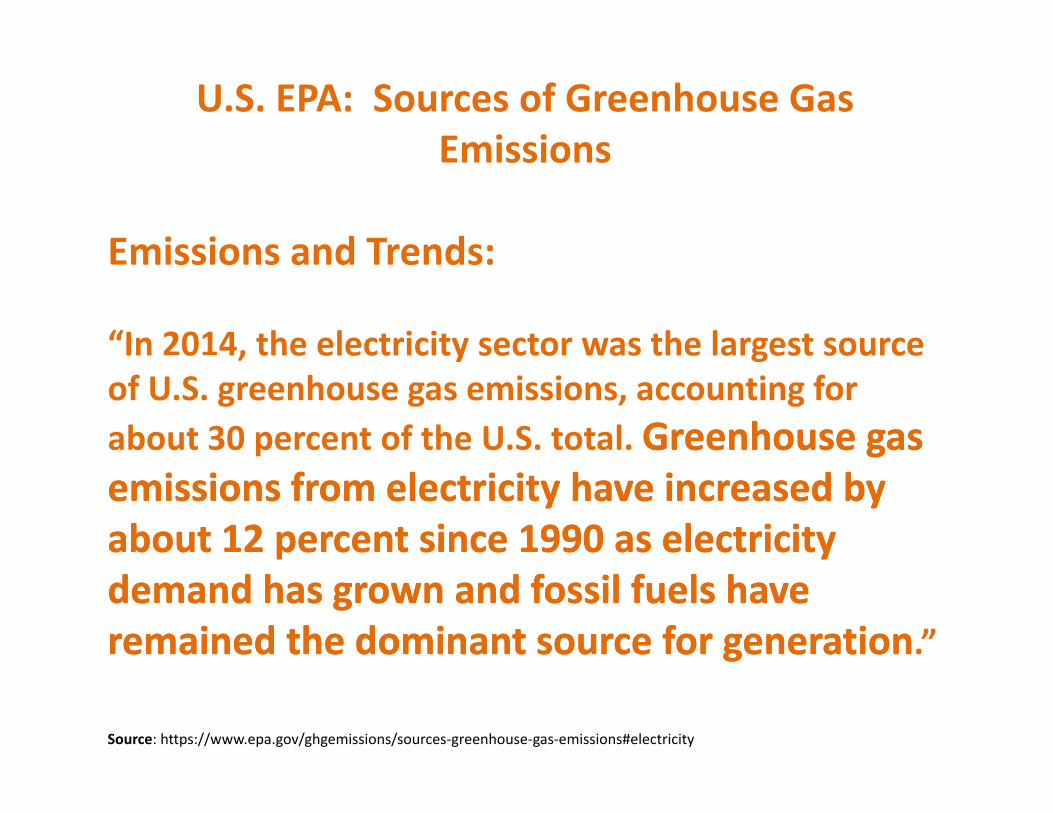
U.S. EPA: Sources of Greenhouse Gas EmissionsEmissions
Emissions and Trends:Emissions and Trends:
“In 2014, the electricity sector was the largest source In 0 4, the electricity sector was the largest sourceof U.S. greenhouse gas emissions, accounting for about 30 percent of the U.S. total. Greenhouse gas Greenhouse gas emissions from electricity have increased by emissions from electricity have increased by about 12 percentabout 12 percent since 1990 as electricity since 1990 as electricity demand has grown and fossil fuels have demand has grown and fossil fuels have remained the dominant source for generationremained the dominant source for generation.”
Source: https://www.epa.gov/ghgemissions/sources‐greenhouse‐gas‐emissions#electricity
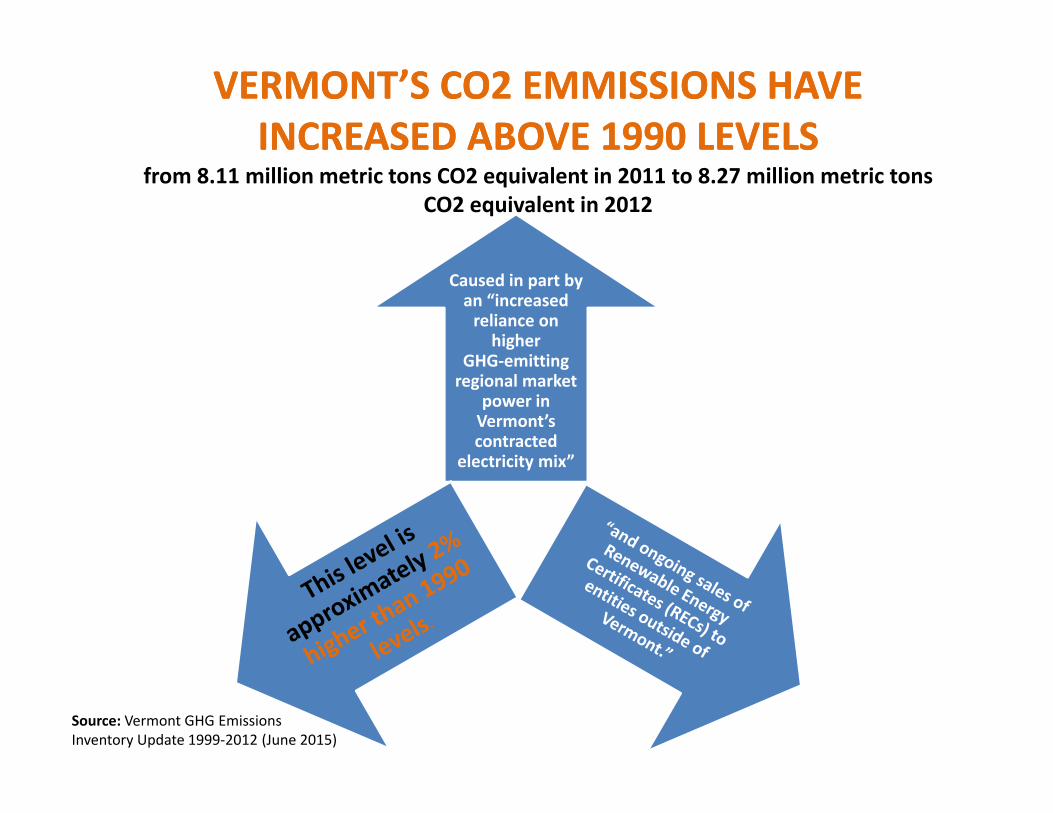
VERMONT’S CO2 EMMISSIONS HAVE VERMONT’S CO2 EMMISSIONS HAVE INCREASED ABOVE 1990 LEVELSINCREASED ABOVE 1990 LEVELS
from 8.11 million metric tons CO2 equivalent in 2011 to 8.27 million metric tons CO2 equivalent in 2012
Caused in part by an “increased reliance on higher
GHG i iGHG‐emitting regional market
power in Vermont’s contracted l t i it i ”electricity mix”
Source: Vermont GHG Emissions Inventory Update 1999‐2012 (June 2015)

Vermont had 18 federally‐declared disasters in the pastVermont had 18 federally declared disasters in the past 10 years, up over 50% from the previous 10 years
Tropical Storm Irene
“2012 was the2012 was the warmest year on record for Vermont d h i land the continental
United States.”
Source: Vermont Climate Change Adaptation Program ‐http://uvaw.uvlsrpc.org/files/9014/5954/3461/Ulmer_Pres_UVAW_Forum_03302016.pdf.

“Grasping the extent of the losses i h t i diffi lt ”
“Thirty‐five hundred homes were damaged along with more
in human terms is difficult.”
than 500 miles of state roads and 200 bridges. Many farms and businesses were damaged and lost income from suspended
operations. The staggering costs to federal and state taxpayersoperations. The staggering costs to federal and state taxpayers climbed above $800 million.”
Source: http://climatechange.vermont.gov/our‐changing‐climate/what‐it‐means/flooding

VERMONT CLIMATE CHANGE ADAPTATION PROGRAMKey Message #1Key Message #1:
“Climate Change is already happening, and is expected to continue”Climate Change is already happening, and is expected to continue”
Vermont Temperature Increase Vermont Temperature Increase Vermont Precipitation Increase Vermont Precipitation Increase since 1965since 1965:
+ 2+ 2°°F in summerF in summer+ 4+ 4°°F in winterF in winter
4th largest rate of warming in U S
since 1965:since 1965:+ 7” rain per year+ 7” rain per year
4th largest increase in precipitation4th largest rate of warming in U.S. 4th largest increase in precipitation in the U.S.
Source: Vermont Climate Change Adaptation Program ‐http://uvaw.uvlsrpc.org/files/9014/5954/3461/Ulmer_Pres_UVAW_Forum_03302016.pdf. Reference materials used ‐ National Oceanic and Atmospheric Administration, Climate at a Glance, Time Series data

OUR POWER GRID IS BECOMINGMOREOUR POWER GRID IS BECOMING MORE RELIANT ON FOSSIL FUELS

The U.S. POWER GRID IS OVERLY The U.S. POWER GRID IS OVERLY DEPENDANT ON FOSSIL FUELSDEPENDANT ON FOSSIL FUELS
•• The primary source of greenhouse gas emissionsThe primary source of greenhouse gas emissions•• The primary source of greenhouse gas emissions The primary source of greenhouse gas emissions in the U.S. is electric generation burning fossil in the U.S. is electric generation burning fossil fuels fuels
•• Approximately 67% of U.S. electricity comes Approximately 67% of U.S. electricity comes from burning fossil fuelsfrom burning fossil fuelsfrom burning fossil fuelsfrom burning fossil fuels
•• CO2 emissions in the U S increased about 9%CO2 emissions in the U S increased about 9%CO2 emissions in the U.S. increased about 9% CO2 emissions in the U.S. increased about 9% between 1990 and 2014between 1990 and 2014
Source: epa.gov/ghgemissions/sources‐greenhouse‐gas‐emissions
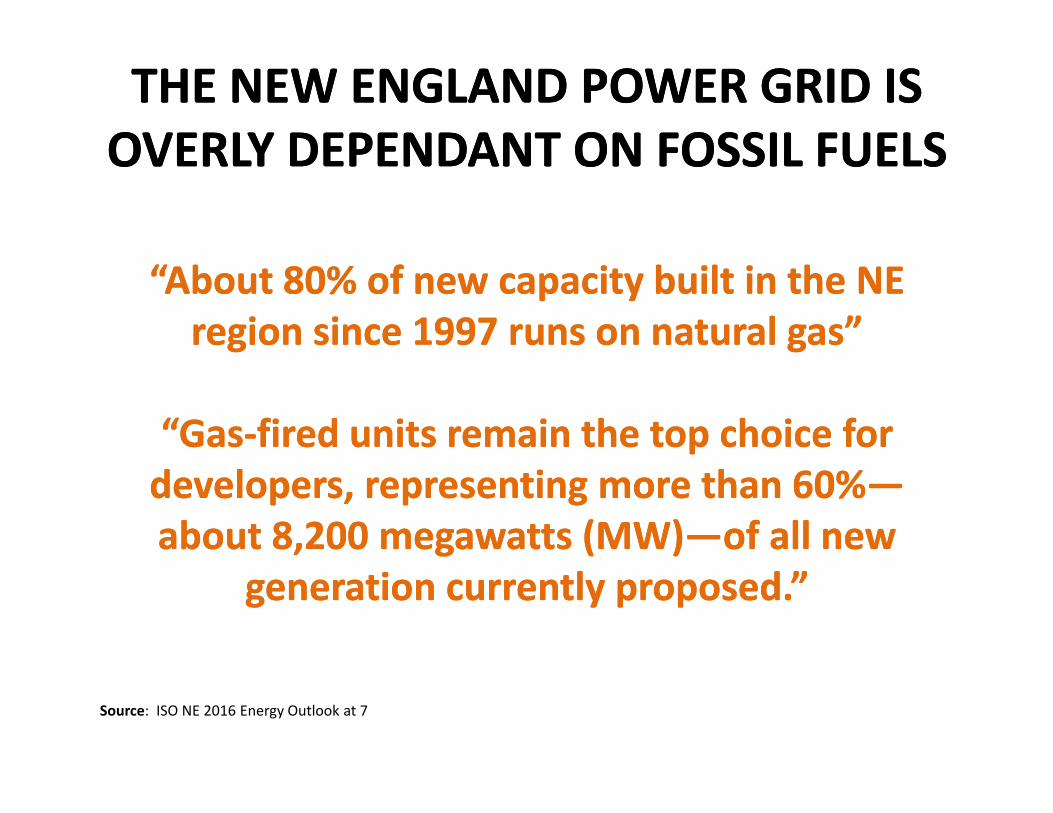
THE NEW ENGLAND POWER GRID IS THE NEW ENGLAND POWER GRID IS OVERLY DEPENDANT ON FOSSIL FUELSOVERLY DEPENDANT ON FOSSIL FUELSOVERLY DEPENDANT ON FOSSIL FUELSOVERLY DEPENDANT ON FOSSIL FUELS
“About 80% of new capacity built in the NE “About 80% of new capacity built in the NE region since 1997 runs on natural gas”region since 1997 runs on natural gas”
“Gas“Gas‐‐fired units remain the top choice for fired units remain the top choice for developers, representing more than 60%developers, representing more than 60%——about 8,200 megawatts (MW)about 8,200 megawatts (MW)——of all new of all new
generation currently proposed.”generation currently proposed.”
Source: ISO NE 2016 Energy Outlook at 7
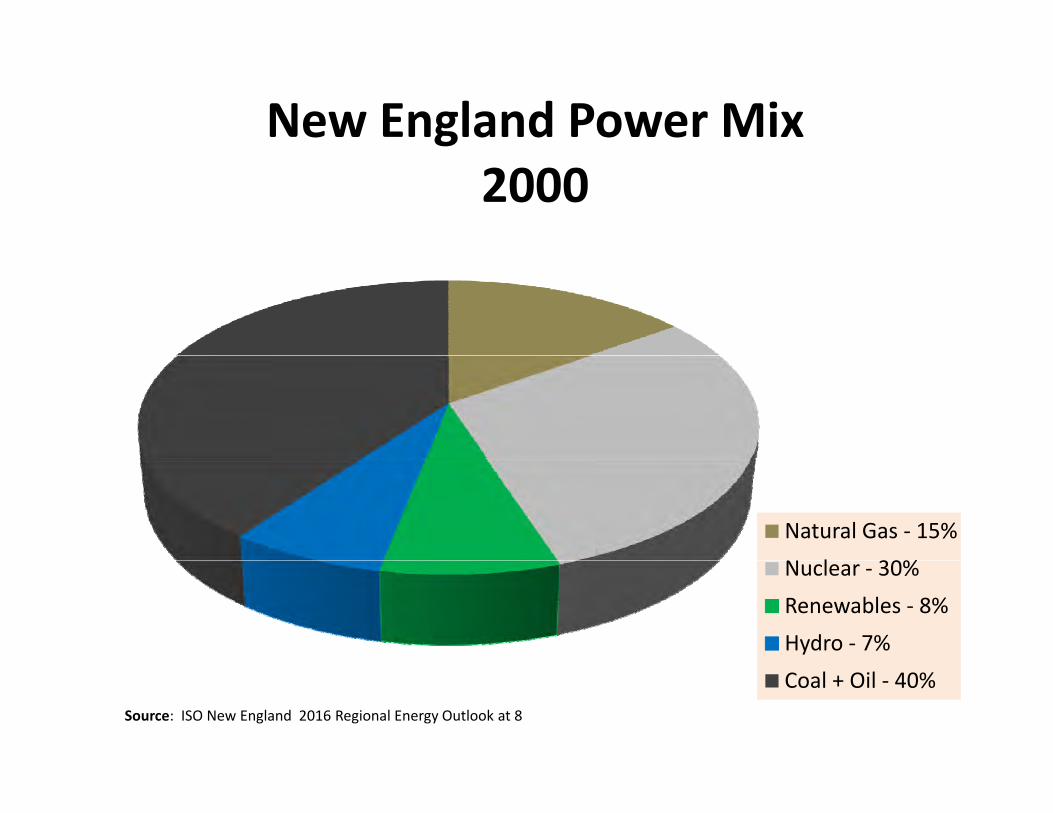
New England Power Mix2000
Natural Gas ‐ 15%
N l 30%Nuclear ‐ 30%
Renewables ‐ 8%Hydro ‐ 7%
Coal + Oil ‐ 40%Source: ISO New England 2016 Regional Energy Outlook at 8

New England Power MixNew England Power MixNew England Power Mix New England Power Mix 20152015
Natural Gas ‐ 49%
Nuclear ‐ 30%
Renewables ‐ 9%
Hydro ‐ 7%y
Coal * Oil ‐ 6%Source: ISO New England 2016 Regional Energy Outlook at 8

Looking Ahead Looking Ahead ‐‐ % of FOSSIL FUELS will % of FOSSIL FUELS will INCREASE RENEWABLES will DECREASE ??INCREASE RENEWABLES will DECREASE ??INCREASE RENEWABLES will DECREASE ??INCREASE RENEWABLES will DECREASE ??
20152015N t l GN t l G 49%49%
20242024Natural GasNatural Gas 49%49%Oil Oil 2%2%RenewablesRenewables 9%9%
Natural GasNatural Gas 57%57%Oil Oil 16%16%RenewablesRenewables 5%5%
Source: ISO New England 2016 Energy Outlook
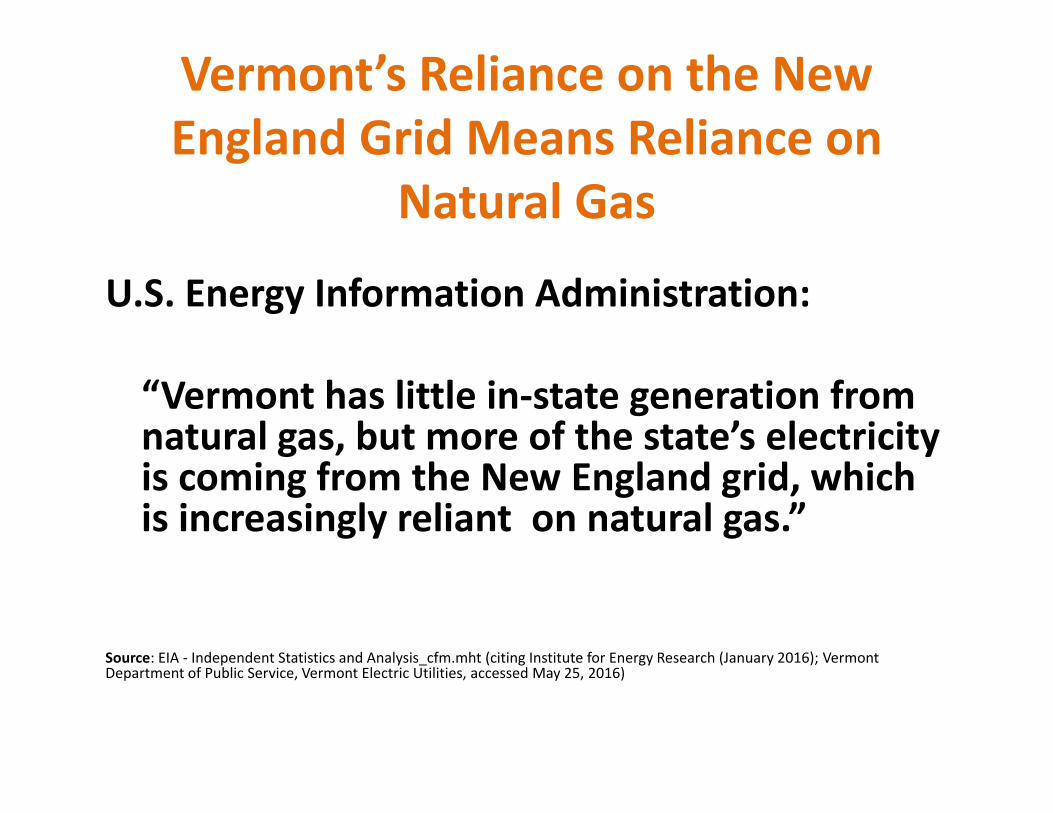
Vermont’s Reliance on the New England Grid Means Reliance onEngland Grid Means Reliance on
Natural Gas
U.S. Energy Information Administration:
“Vermont has little in‐state generation from natural gas, but more of the state’s electricity is coming from the New England grid, which is increasingly reliant on natural gas.”
Source: EIA ‐ Independent Statistics and Analysis cfm.mht (citing Institute for Energy Research (January 2016); Vermont p y _ ( g gy ( y );Department of Public Service, Vermont Electric Utilities, accessed May 25, 2016)

GMP Fuel MixGMP Fuel Mix
Source: GMP Website: http://www.greenmountainpower.com/fuel‐mix/

VT Attorney/DPS Guidancelon REC Sales
• “ Renewable energy certificates or renewable energy credits• Renewable energy certificates or renewable energy credits (“RECs”) are what make solar a “green” or renewable energy resource—they are certificates that track the source of the renewable energy and are the legal attribute of renewable gy genergy.”
• “ The system of tracking attributes via RECs is the only legal The system of tracking attributes via RECs is the only legal way of characterizing the “renewability” of different sources of electricity.”
• “Electricity that has its RECs stripped away and sold is called “null electricity.” Null electricity is not renewable and is simply unspecified and undifferentiated power from the p y p pelectric grid.”
f
Source:http://www‐assets.vermontlaw.edu/Assets/iee/Guidance%20on%20Solar%20Marketing%20(ID%2085283).pd

ISO Generator InterconnectionISO Generator Interconnection QueueQueue as of August as of August 2016: Vermont Represents Less Than 1% on New 2016: Vermont Represents Less Than 1% on New 0 6: Vermont Represents ess Than % on New0 6: Vermont Represents ess Than % on New
Generation Generation ‐‐ The Lowest in New EnglandThe Lowest in New England
Source: https://www.iso‐ne.com/about/key‐stats/resource‐mix

VERMONT’S SHARE OF SOLAR PV: ROOM TO GROW
Source: ISO New England Final 2016 PV Forecast , April 15, 2016
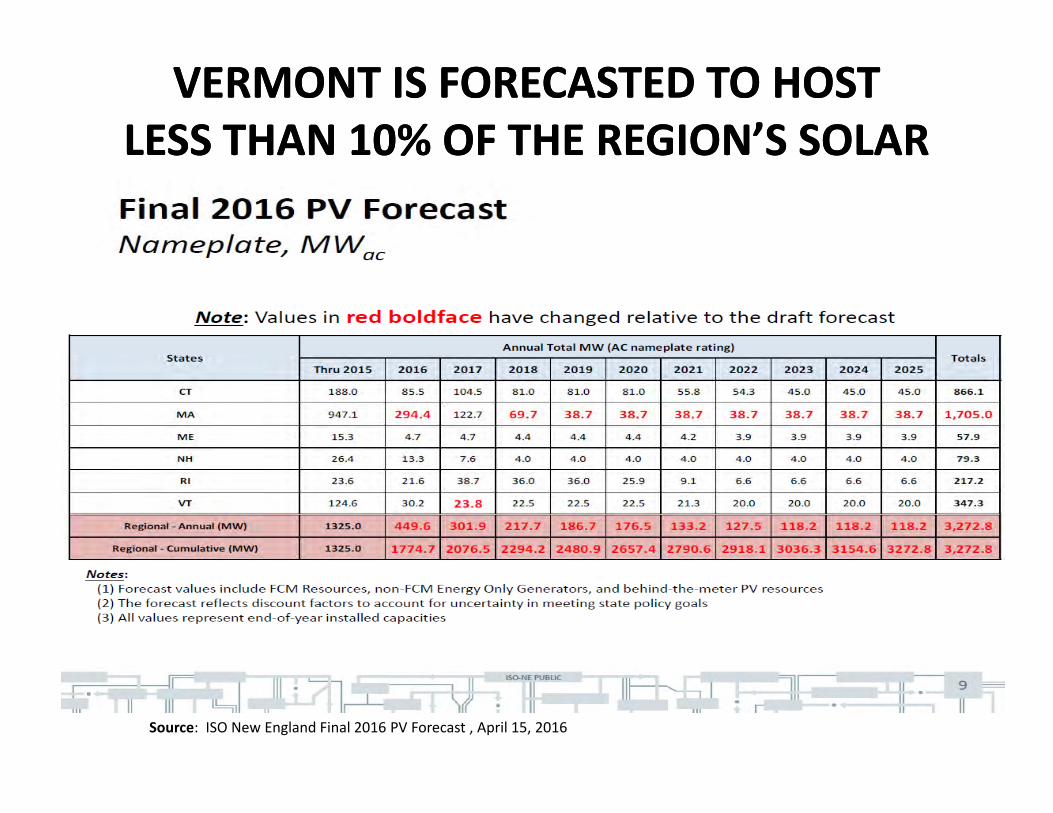
VERMONT IS FORECASTED TO HOST VERMONT IS FORECASTED TO HOST LESS THAN 10% OF THE REGION’S SOLARLESS THAN 10% OF THE REGION’S SOLARLESS THAN 10% OF THE REGION S SOLARLESS THAN 10% OF THE REGION S SOLAR
Source: ISO New England Final 2016 PV Forecast , April 15, 2016

Opportunities for Change in the Energy Landscape
Greenhouse Gas
Reduction Goals
Climate SitingPolicies and
Renewable Energy
ChangePolicies and
LawsStandards
Market Programs & Participation
Client Project Title Page AA
p

OPPORTUNITIES to CHANGE THE OPPORTUNITIES to CHANGE THE VERMONT LANDSCAPEVERMONT LANDSCAPE
•• Vermont Supreme Court Decision Vermont Supreme Court Decision In re In re Rutland Renewable Energy LLCRutland Renewable Energy LLC 2016 VT 502016 VT 50Rutland Renewable Energy, LLCRutland Renewable Energy, LLC, 2016 VT 50, 2016 VT 50
•• The Vermont Renewable Energy StandardThe Vermont Renewable Energy Standard•• Act 174: Act 174: •• PURPAPURPA•• DGDG

RECENT DECISIONS CLARIFYRECENT DECISIONS CLARIFYRECENT DECISIONS CLARIFY RECENT DECISIONS CLARIFY RENEWABLE ENERGY SITINGRENEWABLE ENERGY SITINGRENEWABLE ENERGY SITINGRENEWABLE ENERGY SITING
AN OPPORTUNITYAN OPPORTUNITYAN OPPORTUNITYAN OPPORTUNITY

In re Rutland Renewable Energy, LLCIn re Rutland Renewable Energy, LLC2016 VT 50
• Court Refused to Apply Rutland Town Solar Siting Setback Standards to a 2 3 MW Solar Facility2.3 MW Solar Facility
• Clarified Existing Law under 30 V.S.A. §§ 248(b)(1) & (b)(5)Section 248(b)(1):
energy facilities “will not unduly interfere with the orderly development of the region with due consideration having been given to the recommendations of the municipal and regional planning commissions … [and] the recommendations of the municipal legislative bodies.”[and] the recommendations of the municipal legislative bodies.
• Held that “the statutory requirement [of Section 248(b)(1)] relates to the orderly development of the region, not to a particular municipality within y p g , p p ythe region.”
• Unlike Act 250, “Section 248(b)(1) requires ‘due consideration’ of the land conservation measures of the municipal plans, rather than a finding of conformance as requirement by Criterion 10 ” Petition of Vt Elec Power Coconformance as requirement by Criterion 10.” Petition of Vt. Elec. Power Co.,Docket No. 6860, Order of 1/28/2005 at 202.
Source: https://www.vermontjudiciary.org/LC/Supreme%20Court%20Published%20Decisions/op15‐230.pdf

In re Rutland Renewable Energy, LLCIn re Rutland Renewable Energy, LLC’d’dcont’dcont’d
Section 248(b)(5)‐aesthetics criterion:
“The Town and neighbors argue that the solar siting standards are “clear written community standards” by any definition of those terms. We might adopt that view if we were dealing with Act 250, where state and local
l t i i t H d li ith it ti hregulatory review coexist. Here, we are dealing with a situation where, under existing law, municipalities have a different role. The effect of the solar siting standards under the theory of the Town and neighbors is to enable the Town to control solar generation siting through the Quecheeenable the Town to control solar generation siting through the Quecheetest. We agree with the Board that a modification of the Quechee test is necessary to give the Board the necessary regulatory power.”
• The PSB and Court , relied on 24 V.S.A. § 4413(b), which provides that zoning bylaws “shall not regulate public utility power generating plants and transmission facilities regulated under 30 V.S.A. § 248 ”transmission facilities regulated under 30 V.S.A. § 248.
• “held that the setback requirements were de facto zoning requirements.”

hhAct No. 174 Act No. 174 ‐‐ The Energy The Energy Development ImprovementDevelopment ImprovementDevelopment Improvement Development Improvement
ActActActAct

Act No. 174 Act No. 174 –– Enhanced Energy PlanningEnhanced Energy Planningo Modifies the “Energy Element” in the Vermont Planning and Development Act (Title 24 Chapter 117): Plans to identify “potential areas” for sitingrenewable energy and areas that are “unsuitable”
o DPS to develop guidelines and decide in RPC Plans are “compliant” ‐ If RPC Plan is compliant, municipal plan can receive determination from RPC
o Compliant Enhanced Energy Plans would be entitled to “substantial deference” in a Section 248 siting proceeding. § 11(codified at 30 V.S.A. §248(b)(1)(C (C).248(b)(1)(C (C).
“Substantial Deference” means that a land conservation measure or specific policy shall be applied in accordance with its terms unless there is a clear and convincing demonstration that other factors affecting the general good of the State outweigh the application of the measure or policy.
Appeals of compliance determinations go to the Natural Resources Board, not the PSB – de novo hearing contested case under the APA.

Enhanced Energy Determination Standards of Act 174
Section 6 of Act 174 ‐ regional and municipal plans must be consistent with the following state goals and policies: GHG d ti l d 10 V S A § 578( ) (50% f 1990 l l• GHG reduction goals under 10 V.S.A. § 578(a) (50% from 1990 levels
by 2028; 75% by 2050)
• The 25 x 25 goal for renewable energy under 10 V S A § 580 (25%• The 25 x 25 goal for renewable energy under 10 V.S.A. § 580 (25% in‐state renewables supply for all energy uses by 2025)
• Building efficiency goals under 10 V.S.A. § 581 (25% of homes – or g y g (80,000 units – made efficient by 2020)
• Siting and development of renewable energy resources contained in the State energy plans adopted pursuant to 30 V.S.A. §§ 202 and 202b
• The distributed renewable generation and energy transformation categories of resources to meet the requirements of the Renewablecategories of resources to meet the requirements of the Renewable Energy Standard under 30 V.S.A. §§ 8004 and 8005

Enhanced Energy Determination Standards, cont’d.Per Section 9 of Act No. 174, in addition to the requirements of Sec. 6 of Act, the standards developed by DPS section shall address the following elements in a manner consistent with the State energy plans adopted pursuant to 30 V.S.A. §§ 202 and 202b:
(1) analysis of total current energy use across transportation, heating, and electric sectors; No (2) identification and mapping of existing electric generation andsectors; No. (2) identification and mapping of existing electric generation and renewable resources; (3) establishment of 2025, 2035, and 2050 targets for energy conservation, efficiency, fuel‐switching, and use of renewable energy for transportation, heating, and electricity; ( )(4) analysis of amount of thermal‐sector conservation, efficiency, and conversion to alternative heating fuels needed to achieve these targets; (5) analysis of transportation system changes and land use strategies needed to achieve these targets;these targets; (6) analysis of electric‐sector conservation and efficiency needed to achieve these targets; (7) pathways and recommended actions to achieve these targets, informed by this
l ianalysis; (8) identification of potential areas for the development and siting of renewable energy resources and of the potential electric generation from such resources in the identified areas, taking into account factors including resource availability, environmental g g yconstraints, and the location and capacity of electric grid infrastructure; and (9) identification of areas, if any, that are unsuitable for siting those resources or particular categories or sizes of those resources.

NEXT STEPS NEXT STEPS ‐‐DPS Determination DPS Determination Standards for Energy ComplianceStandards for Energy ComplianceStandards for Energy ComplianceStandards for Energy Compliance
•• On September 26, 2016 the DPS issued draft On September 26, 2016 the DPS issued draft determination standards for commentdetermination standards for commentdetermination standards for commentdetermination standards for comment
•• DPS Seeking feedback until October 20, 2016DPS Seeking feedback until October 20, 2016•• Final standards expected November 1 2016Final standards expected November 1 2016•• Final standards expected November 1, 2016Final standards expected November 1, 2016•• The DPSThe DPS‐‐Regional Commission Mapping is that Regional Commission Mapping is that Started Last Year is Now Being Tied to the Act No. Started Last Year is Now Being Tied to the Act No. gg74 Planning Effort 74 Planning Effort ––
•• It has the Potential to Offer Significant Guidance or It has the Potential to Offer Significant Guidance or to Remove Substantial Land Area from Renewable to Remove Substantial Land Area from Renewable Land DevelopmentLand Development
SSource: http://publicservice.vermont.gov/sites/dps/files/documents/Pubs_Plans_Reports/Act_174/Draft%20Determination%20Standards.pdf
REGIONAL ENERGY IMPLEMENTATION PLAN
/ /(DRAFT 9/7/16)
PREPRE‐‐ACT NO. 174:ACT NO. 174:“DPS/RPC Project In 2015, the Vermont Department of Public Service (DPS), engaged three of Vermont’s , p ( ), g geleven Regional Planning Commissions (Bennington Regional Planning Commission, Northwest Regional Planning Commission and the Two Rivers‐Ottauquechee Regional Commission) in a pilot project to advance a total energy approach to regional plans consistent with the goals and policies contained in the CEP”consistent with the goals and policies contained in the CEP.”
“Mapping Energy Generation Resources and Constraints Mapping Energy Generation Resources and Constraints – Energy generated by renewable resources is the cornerstone of the CEP. In order to achieve 90% renewable by 2050, we will need to identify where the potential for renewable energy generation exists and balance the need for increased capacity with Vermont’s landscape and the desires of our communities.”
Source: Two Rivers‐Ottauquechee Regional commission Regional Energy Implementation Plan Draft 9/7/16 at 6, 12.

“Map Constraints” Eliminate 97% of the TRORC Land Area for
Solar“Solar is the most viableSolar is the most viable source of renewable energy generation in the TRORC region due to the nature of our topography and land cover. Based on GIS mapping analysis, there are roughly 27,000 acres ofare roughly 27,000 acres of land in our region that have the potential of producing solar energy, which is about 3% of the region’sabout 3% of the region’s total land area.”
Source: Two Rivers Ottauquechee Regional Energy l l ( / / f )Implementation Plan (9/1/16 Draft) at 36‐37, 48.

Regional Plan Map ConstraintsAre Not Part of Act 174, Yet …Are Not Part of Act 174, Yet …
TRORC Map Constraints (Level 1 & 2)
• “This data has been designed to exclude certain areas based on specific constraints (referred to as Level 1 constraints). Level one constraints include floodways and river corridors, federal wilderness area, rare and irreplaceable natural areas vernal pools and class one and two wetlands Any area withnatural areas, vernal pools and class one and two wetlands. Any area with potential for energy generation that has a level one constraint, has been removed from the map layer.”
• Other areas that have generation potential, but require consideration in relation g p , qto their natural resources, are identified as Level 2 constraints. These areas include agricultural and hydric soils, conserved lands, special flood hazard areas, deer wintering areas and class 3 wetlands.
• Areas with level two constraints appear on the maps, but are not identified as “Prime” areas (for the purposes of this project, “prime” is used to describe an area of renewable energy generation potential that is unencumbered by either Level 1 or Level 2 constraints) ”Level 1 or Level 2 constraints).

The Energy Siting Map Constraints are Inconsistent with the Comprehensive Energy
Plan“5.5 Siting and Land Use Principles 1. Energy and non‐‐‐‐energy land use planning should be integrated as much
as possible at the local, regional, and state levels.2. Energy (30 V.S.A. 248) and non‐‐‐‐energy (Act 250) land use regulatory
processes should be complement each other to the extent practicableprocesses should be complement each other to the extent practicable.3. Energy elements of Act 250 criteria, and land use elements of Section 248
criteria, should reflect the integrated planning and complementary regulatory review principles.
4. Energy development that meets needs while avoiding or mitigating negative impacts on other state, regional, and local goals and priorities, including economic, environmental, and health priorities identified in Chapter 3, and that takes statewide land use goals into account, should be promoted.
5. Energy development that enhances other state, regional, and local goals and priorities, including reduction in the state’s and region’s GHG footprint, improvement in air quality, and opportunities to develop local f p , p q y, pp peconomies, should be prioritized.”
Source: Comprehensive Energy Plan at 62‐63.

Act 174 Issues & Opportunities for ChangeAct 174 Issues & Opportunities for Change• Appeals re: Enhanced Energy Standards to NRB instead of PSB – how will this
work?• Does Act No. 174 Single Out Renewable Energy Siting for Different TreatmentDoes Act No. 174 Single Out Renewable Energy Siting for Different Treatment
than other Land Use Development Activities?? – Compare 24 V.S.A. §3483a(2)(Land Use Element) to new 24 V.S.A. §3483a(3)(Energy Element)
• Act 174 Does not State or Imply More Restrictive Map Constraints Should beAct 174 Does not State or Imply More Restrictive Map Constraints Should be Applied to Renewable Energy – And its Inconsistent with Siting Policy in the CEP
• “Substantial Deference” … unless there is a clear and convincing demonstration that other factors affecting the general good of the State outweigh thethat other factors affecting the general good of the State outweigh the application of the measure or policy” – such as our GHG Goals
• Act No. 174 amends 30 V.S.A. § 202b(a)(3) – DPS CEP “shall include”“recommendations for regional and municipal energy planning and standards forrecommendations for regional and municipal energy planning and standards for issuing a determination of energy compliance pursuant to 24 V.S.A. § 4352.” This is Missing from the 2016 CEP …
•• Its Important to Weigh in on the DPS Determination Standards DueIts Important to Weigh in on the DPS Determination Standards Due•• Its Important to Weigh in on the DPS Determination Standards Due Its Important to Weigh in on the DPS Determination Standards Due 11/1/1611/1/16

VERMONT’S RENEWABLEVERMONT’S RENEWABLEVERMONT S RENEWABLE VERMONT S RENEWABLE ENERGY STANDARDENERGY STANDARD

VERMONT’S RENEWABLE ENERGY STANDARD:VERMONT’S RENEWABLE ENERGY STANDARD:
Three TiersThree Tiers (30 V S A § 8005) :Three TiersThree Tiers (30 V.S.A. § 8005) :TIER 1TIER 1: Total (all)(Renewable Energy – 55%55% starting January 1, 2017, escalating at 4% every 3rd year thereafter until reaching 75% in 2032; includes existing andincludes existing and new renewable resourcesnew renewable resourcesincludes existing and includes existing and new renewable resourcesnew renewable resources
TIER 2TIER 2: Distributed Renewable Energy (5MW or less)5MW or less) – 1%1% of annual retail electric sales starting January 1, 2017, increasing by 3/5% each year until g y , , g y / yreaching 10% by January 1, 2032; new resources in service after 6/30/2105new resources in service after 6/30/2105
TIER 3TIER 3: Energy Transformation Projects
Alternative Compliance Payment (ACP)Alternative Compliance Payment (ACP): Failure to meet requires payment into Vermont Clean Energy Development Fund at an Alternative Compliance Rate begins at $ /k h ($ h) i l i h i d$0.01/kWh ($10 MWh) in 2017 escalating at the Consumer Price Index.
In the past 5 years Massachusetts and Connecticut RECs have traded in a range of approximately $15 00 ‐ $60 00/REC Source: VEC July 2016 IRP at 27 28approximately $15.00 $60.00/REC. Source: VEC July 2016 IRP at 27‐28.
Other states’ ACPs are set at or above REC market prices. Other states’ ACPs are set at or above REC market prices.

AS A RESULT OF RES, AS A RESULT OF RES, ISO’S 2016 PV ISO’S 2016 PV FORECASTFORECASTFORECAST FORECAST
“Adjusted VT’s 2017 “Adjusted VT’s 2017 f lf lforecast value forecast value downward to reflect downward to reflect the implementation the implementation ppof the Renewable of the Renewable Energy Standard Energy Standard goals ”goals ”goals.goals.
Reduced 2017 PV f 30 MW 23 8from 30 MW to 23.8 MW
Source: ISO New England Final 2016 PV Forecast , April 15, 2016

Vermont Electric Cooperative, Inc.d l2016‐2035 Integrated Resource Plan
VEC purchases generation and RECs from f iliti th t lif V t Ti 1$$ facilities that qualify as Vermont Tier 1 resources and also as Class I resources in Massachusetts and Connecticut. The The Alternative Compliance Rate essentially sets a Alternative Compliance Rate essentially sets a
The $10 ACP is The $10 ACP is below the REC below the REC market tradingmarket trading p yp y
cap on Tier 1 compliance costs. As a result, if cap on Tier 1 compliance costs. As a result, if VEC can sell RECs from Tier 1 eligible VEC can sell RECs from Tier 1 eligible resources as Class I RECs in other states at a resources as Class I RECs in other states at a price that is higher than the Vermontprice that is higher than the Vermont
market trading market trading price and will price and will incent VT incent VT price that is higher than the Vermontprice that is higher than the Vermont
Alternative Compliance Rate, then its Alternative Compliance Rate, then its members are better off financiallymembers are better off financially.”
ce tce tutilities to pay utilities to pay the ACP instead the ACP instead
In the past 5 years Massachusetts and Connecticut RECs have traded in a range of approximately$15 00 ‐ $60 00/REC
of investing in of investing in renewable renewable
$15.00 ‐ $60.00/REC.
Source: VEC July 2016 IRP at 27‐28.
energy energy
WE HAVE AN OPPORTUNITY TO WE HAVE AN OPPORTUNITY TO MAKE THE RES CONSISTENT WITHMAKE THE RES CONSISTENT WITHMAKE THE RES CONSISTENT WITH MAKE THE RES CONSISTENT WITH
THE THE Under 2Under 2°° MOU Energy Pact: MOU Energy Pact:
“promoting large“promoting large scale switch toscale switch to“promoting large“promoting large‐‐scale switch to scale switch to renewable energy and the renewable energy and the gygy
integration of integration of bl ”bl ”renewable energy sources”renewable energy sources”

PURPA

Public Utility Regulatory Policies Act f (" ")of 1978 ("PURPA")
Congress enacted PURPA in 1978 to reduce reliance on fossil fuels:"Because the traditional utilities controlled the transmission lines and were reluctant to purchase power from 'nontraditional facilities, PURPA directed [the FERC] to promulgate rules requiring utilities to purchase electricity from 'qualifying cogeneration [“QF”] and small power production facilities.” New York v. FERC, 535 U.S. 1, 9 (2002).
• A QF is a generating facility of 80 MW or less whose primary energy source is renewable (hydro, wind or solar), biomass, waste, or geothermal resources. 16 U.S.C. § 796(17)(A).
• Section 210(f) requires each state regulatory authority to implement ( ) q g y y pFERC 's rules.
• Vermont PSB Rule 4.100 was added in 1983 to Implement PURPA

Key Changes in the VT PURPA Rule• 4.103 ‐ Formation of the Legally Enforceable Obligation (“LEO”) ‐g y g ( )
Rates become effective when a QF files a petition for a CPG, rather than after receiving a CPG.
• PSB Rule 4.104(E) as amended September 15, 2016, sets avoided costs using the ISO‐New England locational marginal price ("LMP”).
• Rejects Tiered Rates: “Pursuant to 30 V.S.A. § 8005a, Vermont has adopted “multi‐tiered” rates in its standard‐offer program …. p p gState law provides no other requirements for “multi‐tiered” rates; accordingly the proposed rule does not include multitiered rates.”
• Section 4.104(B) (Contract Term) limits the PURPA contract term to 7‐years, as well as the option for a QF to negotiate a longer‐term contract with the interconnecting utility.g y
Source: http://psb.vermont.gov/statutesrulesandguidelines/rule4100
VT PURPA AVOIDED COSTSVT PURPA AVOIDED COSTS
• Under PURPA, a QF is entitled to sell its output toUnder PURPA, a QF is entitled to sell its output to an electric utility at the utility's avoided cost.” 18 C.F.R. § 292.303.
• Avoided cost means rates based upon the utility's costs to generate electricity itself or buy from another source.
• New VT Rule 4.100 Adopted September 15, 2016.
• Natural gas generation is the marginal unit that sets the LMP in New England – so we are pricing QF g p g Qrenewable energy in VT based on fossil fuel prices.

FERC Cases Suggest LMP Prices are Irrelevant to PUPA Avoided CostsAvoided Costs
FERC’s 2010 Order in Southern California Edison Co.:“[I]f a state required a utility to purchase 10 percent of its energy[I]f a state required a utility to purchase 10 percent of its energy needs from renewable resources, then a natural gas‐fired unit, for example, would not be a source "able to sell" to that utility for the specified renewable resources segment of the utility's energy needs, spec ed e e ab e esou ces seg e o e u y s e e gy eeds,and thus would not be relevant to determining avoided costs for that segment of the utility's energy needs.” S. Cal. Edison Co., 133 FERC ¶ 61,059 at P 27 (2010) (emphasis added).
Utilities and EEI argued on reconsideration that PURPA requires states to look at "all costs", including fossil fuel market prices. FERC disagreed:
“Previously, states did not mandate particular purchases, e.g., fromPreviously, states did not mandate particular purchases, e.g., from renewables, and so there was no need to differentiate among generation sources and no need for tiering; all generation sources were essentially fungible, and so our interpretation and the states' interpretation of our PURPA regulations reflected that fact. That isinterpretation of our PURPA regulations reflected that fact. That is increasingly not the case; states are now looking to draw distinctions in what they will allow. The orders issued to date in this proceeding and this order, reflect this change in circumstances.

REGIONAL OPPORTUNITIESREGIONAL OPPORTUNITIESREGIONAL OPPORTUNITIESREGIONAL OPPORTUNITIES

REGIONAL HIGHLIGHTSREGIONAL HIGHLIGHTS• In 2016, Connecticut, Massachusetts, and Rhode Island issued a
three state clean energy RFP. seeking large‐scale clean energy projects 20 MW to 400 MWprojects – 20 MW to 400 MW.
• Over 30 responses including the proposed 60 mile “Green Line” j t t d l t thiproject; response expected later this year.
• In 2016 Massachusetts passed new legislation authorizing the f l h f h d d fprocurement of 9.45 annual TWh of hydro, and up to 1600 MW of
off‐shore wind resources – RFPs expected to be issued in the spring of 2017.
• In 2016 the Connecticut’s Department of Energy and Environmental Protection (DEEP) announced RFP for smaller scale between 2 MW and 20 MW clean energy resources and a Draft– between 2 MW and 20 MW ‐ clean energy resources and a Draft
RFP for natural gas resources to help support electric generation.Source:https://www.iso‐ne.com/static‐assets/documents/2016/10/ad16‐18‐000_transmission_tech_conf_comments.pdf; http://www.ct.gov/deep/cwp/view.asp?Q=578024&A=4808

QUESTIONS?QUESTIONS?