Paul Collier and Pedro C. Vicente Forthcoming at the ... · Vicente (2013) analysed a voter...
39
1 Votes and Violence: Evidence from a Field Experiment in Nigeria * Paul Collier † and Pedro C. Vicente ‡ Forthcoming at the Economic Journal Abstract Elections are now common in low-income societies. However, they are frequently flawed. We investigate a Nigerian election marred by violence. We designed and conducted a nationwide field experiment based on anti-violence campaigning. The campaign appealed to collective action through electoral participation, and worked through town meetings, popular theatres, and door-to- door distribution of materials. We find that the campaign decreased violence perceptions and increased empowerment to counteract violence. We observe a rise in voter turnout, and infer that the intimidation was dissociated from incumbents. These effects are accompanied by a reduction in the intensity of actual violence, as measured by journalists. JEL Classifications: D72, D74, O55. Keywords: Violence, Conflict, Electoral Politics, Political Economy, Randomized Experiment, Field Experiment, Nigeria, West Africa. * We wish to thank the editors, three anonymous referees, Christian Ahlin, Robert Bates, Cátia Batista, Tim Besley, Michael Bratton, David Clingingsmith, Michael Conlin, Esther Duflo, Marcel Fafchamps, Claudio Ferraz, Yvan Guichaoua, Masa Kudamatsu, Rocco Macchiavello, Alice Mesnard, Abdul Mustapha, Laura Valderrama, and Eric Werker for helpful suggestions. We are particularly indebted to Ojobo Atukulu, Otive Igbuzor, and Olutayo Olujide at ActionAid International Nigeria, Austin Emeanua, campaigners Nwakaudu Chijoke Mark, Gbolahan Olubowale, George-Hill Anthony, Monday Itoghor, Umar Farouk, Emmanuel Nehemiah, Henry Mang and their field teams, and to the surveyors headed by Taofeeq Akinremi, Gbenga Adewunmi, late Oluwasegun Olaniyan, and Moses Olusola: their professionalism, courage, and dedication to this project were truly outstanding. We also want to acknowledge the kind institutional collaboration of the Afrobarometer. We thank seminar participants at the LSE-Oxford iiG meetings, CSAE, NCDE, EEA, NEUDC, CEPR, AEA/ASSA, and IGC conferences, and at various seminars for useful comments. We wish to acknowledge financial support from the Department for International Development (DFID), the William and Flora Hewlett Foundation, and the Open Society Institute, in the context of the iiG Consortium – “Improving Institutions for Pro-poor Growth.” All errors are the responsibility of the authors. † Department of Economics, Centre for the Study of African Economies (CSAE), University of Oxford; and Centre for Economic Policy Research (CEPR). Email: [email protected]. ‡ Nova School of Business and Economics, Universidade Nova de Lisboa; and Bureau for Research and Economic Analysis of Development (BREAD). Email: [email protected].
Transcript of Paul Collier and Pedro C. Vicente Forthcoming at the ... · Vicente (2013) analysed a voter...
1
Votes and Violence:
Evidence from a Field Experiment in Nigeria*
Paul Collier† and Pedro C. Vicente
‡
Forthcoming at the Economic Journal
Abstract
Elections are now common in low-income societies. However, they are
frequently flawed. We investigate a Nigerian election marred by violence. We
designed and conducted a nationwide field experiment based on anti-violence
campaigning. The campaign appealed to collective action through electoral
participation, and worked through town meetings, popular theatres, and door-to-
door distribution of materials. We find that the campaign decreased violence
perceptions and increased empowerment to counteract violence. We observe a
rise in voter turnout, and infer that the intimidation was dissociated from
incumbents. These effects are accompanied by a reduction in the intensity of
actual violence, as measured by journalists.
JEL Classifications: D72, D74, O55. Keywords: Violence, Conflict, Electoral Politics, Political Economy,
Randomized Experiment, Field Experiment, Nigeria, West Africa.
* We wish to thank the editors, three anonymous referees, Christian Ahlin, Robert Bates, Cátia Batista, Tim
Besley, Michael Bratton, David Clingingsmith, Michael Conlin, Esther Duflo, Marcel Fafchamps, Claudio
Ferraz, Yvan Guichaoua, Masa Kudamatsu, Rocco Macchiavello, Alice Mesnard, Abdul Mustapha, Laura
Valderrama, and Eric Werker for helpful suggestions. We are particularly indebted to Ojobo Atukulu, Otive
Igbuzor, and Olutayo Olujide at ActionAid International Nigeria, Austin Emeanua, campaigners Nwakaudu
Chijoke Mark, Gbolahan Olubowale, George-Hill Anthony, Monday Itoghor, Umar Farouk, Emmanuel
Nehemiah, Henry Mang and their field teams, and to the surveyors headed by Taofeeq Akinremi, Gbenga
Adewunmi, late Oluwasegun Olaniyan, and Moses Olusola: their professionalism, courage, and dedication
to this project were truly outstanding. We also want to acknowledge the kind institutional collaboration of
the Afrobarometer. We thank seminar participants at the LSE-Oxford iiG meetings, CSAE, NCDE, EEA,
NEUDC, CEPR, AEA/ASSA, and IGC conferences, and at various seminars for useful comments. We wish
to acknowledge financial support from the Department for International Development (DFID), the William
and Flora Hewlett Foundation, and the Open Society Institute, in the context of the iiG Consortium –
“Improving Institutions for Pro-poor Growth.” All errors are the responsibility of the authors. † Department of Economics, Centre for the Study of African Economies (CSAE), University of Oxford; and
Centre for Economic Policy Research (CEPR).
Email: [email protected]. ‡ Nova School of Business and Economics, Universidade Nova de Lisboa; and Bureau for Research and
Economic Analysis of Development (BREAD).
Email: [email protected].

2
This election is a do-or-die affair.
President Olusegun Obasanjo, February 10, 2007
Citizens are generally expected to use their vote or even lobby (Becker, 1983) to further their
interests. However, there may be imperfections. Besley (2006) reviews the consequences if voters
have poor information about government performance. As information deteriorates, a point is
reached beyond which those potential politicians who may be ill-motivated are not disciplined by
the fear of losing votes and enter politics. These politicians may act in very dysfunctional ways.
However, in most electoral settings analysed in the literature, the strategies open to candidates
remain confined to those prevailing in the mature, high-income democracies: mainly strategies
oriented to please ordinary citizens are considered.1 In many of the newly democratic, low-
income countries the only aspect of democracy that has been introduced is elections. There are
neither checks-and-balances upon the use of power, nor effective regulations for the conduct of
the election itself. We contend that these elections warrant close attention.
The record of democratization has been especially problematic in Africa.2 Kudamatsu (2012)
measures government performance by infant mortality and shows that, in Africa, elections
produced no improvement except in the rare instances in which the incumbent was defeated.
Other recent empirical work asserts that in developing countries elections only discipline
economic policy conditional upon being well conducted (Chauvet and Collier, 2009), and that for
low levels of development democracy considerably increases proneness to civil conflict (Collier
and Rohner, 2008). Indeed, Africa has seen a pronounced emergence of political intimidation and
violence during times of election. Just to focus on recent years, Kenya, Nigeria, and Zimbabwe
provide examples of elections marked by thousands of deaths. We believe that by studying
malfeasant electoral strategies like violence, and ways to counter them, we may begin to improve
our understanding of ways to improve electoral conduct as a means of increasing political
accountability in Africa.
The main contribution of this paper is to present evidence from a field experiment we designed
and conducted to establish the causal effects of community campaigning against electoral
1 Skaperdas and Grofman (1995) is a notable early exception.
2 Note that until the 1990s the predominant African political system was autocracy. As Besley and
Kudamatsu (2008) show, while in some contexts autocracy has produced good economic performance, in
Africa it has consistently been dysfunctional.

3
violence. The context for our analysis is the 2007 Nigerian national and state-level elections,
which proved to be an all-too-suitable context for our purposes, as during the two days of these
elections over 300 people were killed. The campaign against political violence that we study in
this paper was randomized across neighbourhoods and villages of six states of Nigeria. These
states represent the main socio-economic regions of the country. The campaign was conducted in
half of those locations before the 2007 elections by a major international NGO, ActionAid, which
specializes in community participatory development. It included town meetings, popular theatre,
and the distribution of campaign material, standardized across all locations. It was aimed at
empowering citizens to counteract local violence. Its activities were designed to reduce the costs
of protest and collective action through electoral participation. In a complementary manner, it
appealed to “voting against violent politicians.”
We based our measurement on representative surveys, on a behavioural measure of
empowerment to counteract violence (the sense that common citizens have ways to oppose
intimidation), and on the compilation of violence-event diaries by independent local journalists in
the treatment and control areas of the experiment. A panel of survey respondents was interviewed
both before the anti-violence campaign and after the elections, and constituted the primary focus
of campaigners after the baseline. The interviews elicited a wide range of measurements of
experience with, and perceptions of, violence. Subjects were also asked to report their voting
behaviour after the elections. We complement our survey measures of empowerment to
counteract violence with an incentive-compatible (cost-inducing) behavioural measure: we asked
all survey respondents to mail a postcard if they wanted to flag the problem of electoral violence
in the media. We also drew additional respondents at the post-election stage, in treated areas only,
who were not directly approached by the campaign. This group allows us to quantify the effects
of the campaign on untargeted individuals within treated locations.
We present evidence that the anti-violence campaign was able to increase the sense of security to
the general population. As an example, our measure of perceived local electoral violence induced
by politicians decreased by 0.23 standard deviation units. The campaign also boosted
empowerment to counteract electoral violence – the likelihood that the postcard was mailed was 8
percentage points higher for treated respondents. We found that the intervention increased voter
turnout by 11 percentage points (gubernatorial elections), and that political intimidation was a
strategy predominantly linked to non-incumbent political groups (as reflected by the impact of the
campaign on vote choices). All these effects on ordinary citizens may have undermined electoral

4
violence as an electoral strategy. Indeed, we observe a clear decrease in actual violence as
reported in the journalists’ diaries. Namely, we detect a 47 percentage-point effect on the
likelihood that physical violence occurs. This is evidence that the campaign was able to influence
the behaviour of violent politicians. Note that we also find effects on untargeted individuals
within treated locations, which may include spillovers of the campaign, specifically in terms of
decreased perceptions of violence.
To the best of our knowledge this is the first experimental paper dedicated to analysing electoral
violence. It is also one of the few papers in the emerging literature applying field experiments to
the study of elections in the developing world3. This literature began with Wantchekon (2003),
who studied clientelism in Benin through the randomization of actual political campaign
platforms. Vicente (2013) analysed a voter education campaign focusing on vote-buying in Sao
Tome and Principe. Fujiwara and Wantchekon (2013), and Banerjee et al. (2011) explore
interventions providing voters with specific information about public-policy options, and offering
information about politician performance and qualifications (respectively). Finally, some work
has been devoted to evaluating awareness campaigns focusing on the employed means, namely
boosting electoral participation through cell phones and free newspapers (Aker et al., 2012) and
social networks (Gine and Mansuri, 2011). Fafchamps and Vicente (2013) analyse the same field
experiment we study here but focus on social-network (heterogeneous) effects of the anti-
violence campaign.
Not many other studies are dedicated to understanding political violence in the developing world.
In terms of theory, Ellman and Wantchekon (2000) provide a model in which an incumbent,
while controlling more violence resources (e.g., army), can more effectively use the threat of
violence to influence votes. Chaturvedi (2005) and Collier and Vicente (2012), consistently with
the findings in this paper, provide models in which the use of political violence by a party
decreases with its electoral support. Empirically, Wilkinson (2004) provides a thorough study of
political violence in India. This author emphasizes the idea that violence may be an important
political strategy in the face of ethnic divisions. A recent paper by Chaves et al. (2009) looked at
the 1922 presidential election in Colombia in order to estimate the correlations between the illicit
3 Experimental methods have been applied in the context of North American elections. Namely, there is a
large literature testing the impact of conventional election techniques, such as canvassing, phone calls, and
direct mail. See for instance Gerber and Green (2000), Gerber (2004), and Nickerson (2008). Note that they
find effects on voting behaviour that are comparable in magnitude to the ones we find in this study. In a
recent field experiment, Dewan et al. (2013) distinguish between different elements of political persuasion.

5
electoral strategies of ballot fraud and coercion, and the presence of the state and of the clergy, as
well as land inequality. Like us, they found support for the claim that coercion was used to
prevent opposition voters from participating in the election.
In Section I we describe the Nigerian context. Section II discusses the design of the experiment,
including details of the treatment, measurement, and estimation strategy. Section III presents
descriptive statistics, and shows the experimental results regarding violence-related survey
measures, the behavioural measure of empowerment, voter behaviour, actual violence, and effects
on untargeted individuals within treatment locations. Section IV concludes with some
implications for future research and policy.
I. Background: The 2007 Nigerian Election
Nigeria is the most populous country in Africa, with an estimated 148 million inhabitants in
2007.4 Despite being a major oil producer, with the 10th largest oil reserves in the world (35
billion barrels)5, it ranks 150 in 190 countries in terms of GDP per capita, with 1979 USD PPP in
2007.6 As implied by this failure to harness oil revenues for growth, the quality of governance has
been low: in Transparency International’s Corruption Perception Index it ranks 147 of 179
countries (2007).7
From 1999, with the passing of a new federal constitution, Nigeria moved to civilian rule8 under
democratic elections: these were held in 1999, 2003, and 2007. However, all of these elections
were damaged by widespread electoral malfeasance (see for instance Omotola, 2010). By many
accounts these elections were far from being “free and fair” by any international standards.
The election of 2007, which is the focus of our study, covered four distinct contests: presidential;
federal house of representatives and senate; gubernatorial; and state assembly. Under Nigeria’s
federal constitution, political power is particularly concentrated in the president and the state
governors. Incumbent president, Olusegun Obasanjo, did not stand in the 2007 election, due to a
term limit. The key contestants were Umaru Yar’Adua, Muhammadu Buhari, and Atiku
4 World Development Indicators, 2009.
5 Oil & Gas Journal, 103(47), December 19, 2005.
6 World Development Indicators, 2009.
7 See Smith (2007), for a thorough account of corruption in Nigeria.
8 See Maier (2000) for a description of this transfer of power and recent political history of Nigeria.

6
Abubakar. Yar’Adua was Obasanjo’s chosen successor in the ruling People’s Democratic Party
(PDP). However, he was little known because until June 2006 Obasanjo had been hoping to
change the constitution to allow him a third term in office. Buhari had already been the main
challenger in the 2003 election, representing the All Nigeria Peoples Party (ANPP). A previous
military ruler, his past regime had been noted for a public campaign against corruption.
Abubakar, although the incumbent vice-president, was in serious conflict with President
Obasanjo, and had been forced to switch party to the Action Congress (AC). Previously a
customs officer with controversial sources of wealth, he had been indicted by the federal anti-
corruption commission (EFCC) on multiple charges related to campaign fund embezzlement and
bribery. At the core of the election campaign were the headlines surrounding the possible
impeachment of Vice-President Abubakar, which would have debarred him from running for the
presidency.
The ruling PDP duly won the election with 70 percent of the votes, as did 28 of its candidates in
the 36 gubernatorial elections. However, the election was deeply flawed through violence and
vote-miscounting. As an illustration, we present the assessments of three well-informed
independent organizations. These features make the 2007 elections well-suited for a study of
electoral violence.
Nigeria's elections were not credible and fell far short of basic international
standards. […] Elections for president, state governors and legislators were marred
by violence, poor organisation, lack of transparency, significant evidence of fraud,
voter disenfranchisement and bias.9
Rigging, violence and intimidation were so pervasive and on such naked display that
they made a mockery of the electoral process. […] Where voting did take place,
many voters stayed away from the polls. […] By the time voting ended, the body
count had surpassed 300.10
9 European Union Election Observation Mission, ‘Nigeria - Final Report on the Gubernatorial and State
Houses of Assembly Elections of 14 April 2007 and on the Presidential and National Assembly Elections
of 21 April 2007’, 2007. 10
Human Rights Watch, ‘Nigerian Debacle a Threat to Africa’, May 2007.

7
The irregularities were so numerous and so far-reaching that the election was a
charade and did not meet the standards required for democratic elections.11
II. Experimental Design
A. The Intervention
We collaborated with the Nigeria chapter of ActionAid, ActionAid International Nigeria (AAIN),
which regarded the prospect of political violence as a grave challenge to democracy and wished
to counter it. AAIN’s input in designing a campaign against electoral violence drew on its
expertise in community participatory development and its experienced field infrastructure.12
The campaign was designed to induce experimental subjects to oppose voter intimidation. The
main mechanism employed was to lower the perceived threat to individual voters through
collective action. The analytic foundation for this method is the model of political protest of
Kuran (1989). There, people who dislike their government may hide their desire for change as
long as the opposition seems weak. In this context, a solid government may see its support
crumble through a slight increase in the opposition’s apparent size, caused by potentially
insignificant events like a public call for protest. This mechanism is exemplified by McMillan
and Zoido (2004), who describe the fall of an intimidation-based regime in Peru due to the release
of a videotape.13
AAIN’s campaign was analogous as a public call for protest. In addition to
trying to lower the perceived threat to individual voters through collective action, the campaign
also emphasized the lack of legitimacy in the use of intimidation. We therefore expect that the
campaign increased voter turnout and caused supporters of violent candidates to change their
electoral preferences away from those candidates. All these expected impacts of AAIN’s
campaign imply a reduction in the effectiveness of violence and intimidation as an electoral
strategy. In that view the ultimate test of the effectiveness of AAIN’s campaign is whether we
11
Transition Monitoring Group (an NGO which deployed 50,000 Nigerian observers to the 2007 elections)
as cited by BBC News on 23 April 2007. 12
AAIN is Nigeria’s chapter of global ActionAid, headquartered in South Africa, with total budget USD
133m in 2005, and specializing on Community Improvement and Capacity Building – it was ranked 20th
worldwide in terms of “performance” in a recent list compiled by Financial Times/Dalberg of global
organizations devoted to philanthropy (above Transparency International, UNDP, and Amnesty
International) - see the Financial Times, July 5, 2007, Report on “Corporate Citizenship and Philanthropy”. 13
This idea also relates to the theory of informational cascades by Bikhchandani et al. (1992) and Lohmann
(1994), which was proposed in order to explain the behaviour of masses.

8
observe a decline in actual violence and intimidation instigated by politicians, despite the fact that
these politicians are not likely to have been directly treated by the campaigners.
The anti-violence campaign reached a set of enumeration areas, i.e., neighbourhoods or villages.
It was implemented during a two-week period approximately two months before the election, just
after our baseline survey. For this campaign, AAIN worked with local state-level partner NGOs,
who conducted the campaign activities in the field.14
Because each state was allocated a different
team of campaign fieldworkers, campaign activities were fully contemporaneous in all states.15
The campaign consisted of a clear message against electoral violence, as embedded in its main
slogan: “No to political violence! Vote against violent politicians.” The main guidelines of the
campaign were discussed between the central AAIN officers and the local partnering NGO
representatives. Actual material and activity design was undertaken with the help of a specialized
firm in Abuja. The campaign slogan was written on a wide range and large quantity of distributed
campaign materials: T-shirts (3,000), caps (3,000), hijabs for Muslim women (1,000), leaflets
(5,000), posters (3,000), and stickers (3,000) – images for the leaflets, posters, and stickers are
displayed in Figure 1. Note that these means of campaigning are the ones primarily chosen by
politicians in Nigeria to licitly spread awareness about their candidacies. The campaign also
included roadshows, which featured jingles in Yoruba, Hausa, and Pidgin English.
<Figure 1 near here>
However, the campaign was designed to work mainly through the holding of town meetings and
popular theatre. The town meetings provided an opportunity for the grassroots to meet with local
representatives to discuss ways of counteracting politically motivated violence. In line with the
theory, meetings were designed to minimize the collective action problem that impedes
diminishing conflict at the local level. Popular theatre was based on the same script for all states
(featuring one good and one bad politician, with the bad one instilling violent intimidation), and
was designed to target youths (usually the ones providing labour for violent activities) and others
(e.g., women) who were relatively difficult to attract to town meetings. There was at least one
town meeting and one popular theatre per treatment location.
14
One author of this paper witnessed operations in the field in four out of the six states included in this
campaign. 15
A comprehensive report of the campaign, including photographs, films, and reports for each state’s
campaign activities, is available from http://www.iig.ox.ac.uk/research/08-political-violence-nigeria/.

9
B. Sampling
Our field experiment included 24 locations/enumeration areas. These were chosen from
Afrobarometer’s (http://www.afrobarometer.org/) representative sample of enumeration areas in
all 36 states of Nigeria, which was drawn for their 2007 pre-election survey. Their sample
framework was the population census, with census enumeration areas and corresponding
population weights. The Afrobarometer sample included 301 enumeration areas.
We began our sample selection by choosing two states in each of the three main regions of the
country (Southwest, Southeast, and North). For that purpose we looked at recent history of
politically motivated violence.16
This process led to the selection of Lagos and Oyo (Southwest),
Delta and Rivers (Southeast), and Kaduna and Plateau (North). This procedure revealed our
emphasis on studying violence while keeping the basic diversity of the country obtained from the
ethnic predominance of Yoruba in the Southwest, Igbo in the Southeast, and Fulani/Hausa in the
North.
The remainder of the sampling process was statistically representative. We began by organizing
all the enumeration areas in the Afrobarometer’s list (in each of the six states selected) by pairs.
We paired enumeration areas by identifying closest enumeration areas that were of the same type
in terms of the classification “large urban,” “small urban,” and “rural” (stemming from the
census). We then randomly chose 12 pairs, two in each state, and randomly selected one of the
enumeration areas in each of these pairs to be treated (with the other enumeration area serving as
control). This process led to the selection of the areas shown in Figure 2.
<Figure 2 near here>
We then selected surveyed individuals within each of the 24 selected enumeration areas. For
baseline respondents, who constitute our main sample, we use random representative sampling
within each enumeration area. The baseline survey was performed jointly with Afrobarometer
and Nigerian partner Practical Sampling International (PSI) during the period January 20 to
16
We used reports by Human Rights Watch, ActionAid International, and other independent sources. See
for instance Human Rights Watch, “Testing Democracy: Political Violence in Nigeria,” 15(9A), April
2003, “Nigeria’s 2003 Elections: the Unacknowledged Violence,” June 2004.

10
February 3, 2007. At that time, individuals within a census area were chosen randomly using
Afrobarometer’s standard techniques.17
We reached 1,200 individuals during the baseline survey,
50 per enumeration area. The same individuals were re-surveyed after the electoral results had
been publicized and a sense of political normalcy was re-established. The post-election survey,
also conducted with PSI, took place from May 22 to June 5 and reached 1,149 or 96 percent of
the baseline respondents. We also surveyed a second, smaller, sample, the selection of which is
described below. Individuals in this sample were administered only the post-election survey.
C. Assignment to Treatment
We randomly assigned 12 enumeration areas to be visited by AAIN campaigners. The other 12
enumeration areas that were sampled for our study were assigned to the control group and were
not visited by campaigners. In each treated enumeration area, campaigners were instructed to
target baseline respondents,18
not only in terms of distribution of materials, but also in terms of
invitations to attend the campaign events, i.e., the town meetings and the popular theatre.
During the post-election survey we gathered a fresh sample of 300 respondents, one per
household, in treated enumeration areas (25 per enumeration area). Within the enumeration area,
the selection of this group followed the same standard procedures applied to the main sample,
with two exceptions: (i) baseline houses were not considered, and (ii) respondents were required
not to have been “directly approached” by the campaign team. This group was then selected to be
representative of only those individuals not targeted by campaigners. We refer to this sample as
the “untargeted” individuals, and by extension we refer to the baseline sample as the “targeted”
individuals. The purpose of this sample is to estimate the effect of the campaign on the untargeted
individuals in treated locations.
17
Enumerators were instructed to start from the centre of the enumeration area and to proceed walking in
different directions. Each nth house was visited. For each enumeration area the number n was set to ensure
an equal likelihood of visit to all houses within the enumeration area, based on the number of houses and
enumerators in the enumeration area. Within each house, enumerators listed all individuals aged 18 and
above who were of a given gender (with gender alternated). One respondent was drawn at random from the
list. Empty houses, absence of selected persons, and refusals were replaced by the next adjacent house. This
happened in 24 percent of the cases. 18
One campaign representative accompanied the survey team during the baseline survey exclusively for
site identification, and respondent addresses were shared with the AAIN at that stage. The surveys and the
campaign were fully independent, with distinct field teams and branding.

11
We gathered data showing that 47 percent of the panel households were represented at one of the
campaign events. Moreover, a large majority of the panel individuals recalled well the activities
of the campaign during our post-election survey: 88/89/86/84 percent remembered the
distribution of materials, the roadshows, the town meetings, and the popular theatre
(respectively). Note however that the activities of the campaign may have reached other
individuals beyond our baseline respondents. This is despite the fact that campaigners were told
to approach (directly and individually) only the 50 baseline respondents at their homes. The
roadshows were by nature designed to raise local awareness without the need for much personal
contact with campaigners. Some passers-by approached campaigners to receive campaign
materials because their presence in the streets attracted attention. However, the town meetings
and popular theatre were publicized through the less evident invitations (to baseline respondents)
and were held at specific venues, making it unlikely that other individuals attended those events.
D. Measurement
Our impact measurement depended on three sources of information: individual survey-based
measurements, a behavioural measure of empowerment, and violence journals at the level of the
enumeration area.
First, the surveys were designed to elicit evidence on individual voter behaviour19
and measures
(e.g., perceptions) related to violence.20
Most questions on violence were asked both prior to the
campaign and after the election. In the baseline survey, the year preceding the survey is the
reference period; in the post-election survey, the reference period is the time elapsed since the
baseline survey until the elections, that is, between January and April 2007. The majority of the
violence questions use a subjective scale.
19
On electoral behaviour, disaggregated official 2007 electoral results have been completely unavailable.
Indeed, we have reports that it is unlikely that they exist for many of our experimental locations. Results
were announced in terms of the overall totals in a process that appears to have bypassed the need to
aggregate actual votes. In many locations, due to massive ballot fraud, our post-election survey may
provide a better approximation of the will of the voters than any official results. Note that Vicente (2013)
was able to contrast self-reports to disaggregated electoral results in Sao Tome and Principe’s 2006
presidential election, without significant differences encountered. Although different, Nigeria and Sao
Tome and Principe are neighbouring countries, which gives us some assurance that self-reports may be an
adequate source of voting data in that region of Africa. 20
All questionnaires are available from the authors upon request.

12
Second, we note the specific behavioural measurement that was implemented during our post-
election survey. We created an incentive-compatible individual measure of empowerment to
counteract violence, which we refer to as the “postcard” variable. It was based on an observable
and costly action against violence, which was proposed to all respondents in our survey. All were
given a prestamped postcard which they could choose whether to mail or not – the main side of
the postcard is shown in Figure 3. On the card there was a message demanding that more
attention be paid to countering voter intimidation in the subject’s state. The postcard was
addressed to the organizations involved in the experiment, which promised to raise media
awareness about the problem in states where enough postcards were sent. Because in order to post
the card the respondent had to make the effort of going to a post office, we have a clear, implied
costly action (which we were able to record individually through numbering the postcards and
matching with survey respondents). The respondent was more likely to incur this cost the stronger
was his/her sense that intimidation could be countered.
<Figure 3 near here>
Finally, we contracted independent local journalists (one per enumeration area) to report/describe,
in a diary, violent events that affected the neighbourhood or village, through direct witnessing and
through consultation with local bodies (town meetings, police) – 131 events were identified in
total, in the period before and after AAIN’s campaign. We coded each event according to its
characteristics. The journalists in charge of the violence diaries collected information on violence
from the second semester of 2006 and until two weeks after the last April election day. The
journalists’ data serve the purpose of enabling identification of the effects of the campaign on the
behaviour of the instigators/perpetrators of violence, i.e., the ultimate test of the impact of a
campaign whose immediate objective was to reduce the effectiveness of violence through the
perceptions and behaviour of the potential victims.
E. Estimation Strategy
Our empirical approach is based on reduced form specifications. We estimate the effects of the
intervention on individual outcomes as measured in our survey and through the postcard, and on
actual violence as measured by the journals. We now describe the main econometric
specifications we employed, exemplifying with data at the individual level.

13
We are interested in investigating the effect of the anti-violence campaign on outcomes related to
violence and voting behaviour. Our design allowed us to estimate treatment effects in different
ways. Most simply, the effect of interest (�) could be estimated through the specification:
�������� = + �� + ��, (1)
where Outcome is a violence-related or voting behaviour outcome, 1=,, tli are identifiers for
individuals, locations, and time (specifically, 1 represents the post-election measurement), and �
is a dummy variable with value 1 for treated locations.
In this setting, because of small sample size, we can also add location and individual-level control
variables to compose one of our main specifications. This is in line with Duflo et al. (2007), who
argued that even though controls do not generally change the estimate for the treatment effect,
they usually help to explain the dependent variable, and therefore typically lower the standard
error of the coefficient of interest. We then have the following specification:
�������� = + �� + �� + �� + ��, (2)
where � is a location-level vector of controls, and � is a vector of individual demographic
controls.
Specification (2) does not use the time dimension. In any event, this may not be possible in some
cases, as we do not have repeated measurement for all outcomes. This is the case for our
measurements of voting behaviour in the April elections, which are only available for the post-
election survey. However, when possible, it may be relevant to control for differing pre-
intervention levels of the outcome across treatment and control groups. In this case, specification
(3) below uses the pre-intervention data in a classic difference-in-differences regression:
�������� = + �� + �� + �� + �� + ��� + ��, (3)
where 0=t before the intervention and 1=t after the anti-violence campaign.
For transparency and ease of interpretation, we run OLS regressions for all estimations in this
paper.

14
Since the data we use are clustered by enumeration area, we allow for within-group dependence
in estimating standard errors of treatment effects by estimating cluster-robust standard errors
through the use of the Huber-White variance estimator (see Moulton, 1990, for a defence of the
use of corrected standard errors). Note however that a practical limitation of inference with
cluster-robust standard errors is that the asymptotic justification assumes that the number of
clusters goes to infinity. Bertrand et al. (2004) show that with a small number of clusters (like in
our case) the cluster-robust standard errors are likely to be downward biased.
Two solutions were proposed to solve this problem, namely in calculating p-values of treatment
effects that account for a small number of clusters. We use both methods in our analysis below.
First, we employ the wild bootstrap approach proposed by Cameron et al. (2008). Second, we use
the randomization inference approach discussed by Rosenbaum (2002) and recommended by
Duflo et al. (2007). See Bhushan et al. (2007) for a recent application of randomization inference.
Cameron et al. (2008) recommend continuing to use the standard OLS estimator with the cluster-
robust (Huber-White) variance estimator. However, they prescribe bootstrapping to obtain
bootstrap critical values that provide an asymptotic refinement when there are few clusters.
Bootstrap methods generate a number of pseudo-samples from the original sample; for each
pseudo-sample they calculate the treatment effect; and use the distribution of the treatment effect
across pseudo-samples to infer the distribution of the actual treatment effect. Wild bootstrap uses
the fact that we are assuming additive errors and holds regressors constant across the pseudo-
samples, while resampling the residuals at the level of the cluster, which are then used to
construct new values of the dependent variable. Note that Cameron et al. (2008) advise that
Rademacher weights (+1 with probability 0.5 and -1 with probability 0.5) are used when
resampling residuals, and that the null hypothesis of zero treatment effect is imposed. We follow
both recommendations.
Randomization inference involves generating placebo random assignment of the treatment to
clusters, and estimating the associated treatment effects for hypothesis testing. This method then
takes into account the specific randomization procedure that was used. Following our treatment
assignment structure composed of 12 pairs of enumeration areas, we have 4,096 unique random
assignments, which are all equally likely to occur and define our specific placebo assignments.
We perform hypothesis testing by checking whether the actual measured treatment effect is in the

15
tails of the distribution of the placebo treatment effects. Since the placebo assignments vary only
across clusters, this method takes intra-cluster correlations into consideration. According to
Bhushan et al. (2007), the drawback of hypothesis testing based on randomization inference is
that it has low power relative to more parametric approaches when the true effect is large because
it puts not even minimal structure on the error term. We therefore take this method as a
conservative one.
A final note goes to survey-based measures of violence-related outcomes. We follow Kling et al.
(2007) in that we normalize 17 survey-based measures using z-scores, and aggregate them in four
indices using equally weighted averages of the normalized individual variables. Table 1 shows all
individual variables with original scales, as well as the four groups. Note that the normalization
also changed the sign of each measure so that more beneficial outcomes (less violence, more
empowerment) have higher scores. According to Kling et al. (2007), this aggregation improves
statistical power to detect effects that go in the same direction within a domain. The z-scores are
calculated by subtracting the control group mean and dividing by the control group standard
deviation. Thus, each component of the index has mean 0 and standard deviation 1 for the control
group.21
<Table 1 near here>
III. Econometric Results
In this section we begin by displaying randomization tests alongside descriptive statistics. We
then turn to our core analysis: the effect of the campaign on violence-related perceptions,
postcard, voting, and actual violent events. We then assess the effects of the campaign on the
individuals who were not targeted by the intervention in treated locations.
A. Balance
We begin by evaluating whether the randomized selection of treated locations was successful in
identifying comparable treatment and control groups. We document differences across these
21
As in Kling et al. (2007), if an individual has a valid response to at least one component measure of an
index, then we impute any missing values for other component measures at the random assignment group
mean for the corresponding time period.

16
groups in terms of a wide range of observable initial characteristics. In Table 2 we contrast
treatment and control groups in terms of location characteristics, individual demographics of our
survey respondents, and baseline outcomes (individual survey-based measures related to violence
using the indices of Table 1 when available for the baseline, individual electoral preferences for
the 2003 elections, and actual violence). Because all these variables are unaffected by the
intervention, and given our treatment assignment criteria, any differences between treatment and
control locations should be understood as a product of chance.
<Table 2 near here>
We find no statistically significant differences (at standard levels) between treatment and control
groups for the location-level variables. This is also the case for survey-based variables. Overall
this is evidence that the randomization was effective in isolating similar groups of locations and
respondents. The fact that observables are balanced across treatment and control makes us hope
that unobservable dimensions are balanced as well. Note that the first part of Table 2 provides
complete descriptive statistics for our sample of locations and respondents. Finally, panel attrition
is found not to be statistically different across treatment and control locations.
B. Violence-related Survey Measures
AAIN’s campaign was aimed at lowering the perceived violent threat to individual voters by
giving them a sense of empowerment. We measured individual perceptions and experience of
intimidation, as well as individual feelings of empowerment to counteract violence. We report
here on the effects of the treatment on those variables.
We begin by using a wide range of perception and experience variables from our surveys. As
mentioned, we compose four indices with these variables (described in Table 1). The first index
concerns general variables of political freedom, i.e., on “voting freely,” on “being free from
insecurity,” and on the perceived fairness of elections, and relates to general measures of conflict
at the local level “within the local community.” The second index is dedicated to perceptions of
politically motivated violence as induced by politicians (from the top). It includes “security from
violence originated by politicians,” political intimidation (“threatening negative consequences in
order to induce voting in a certain way”), “influence of political assassinations on instilling a
climate of fear” (frequent in the 2006 party primaries), politicians “openly advocating violence,”

17
and “violent gangs being active.” Third, we isolate proxies of empowerment against violence at
the bottom: “support for do-or-die affair,” local populations “standing against violence originated
by politicians,” “empowerment,” and “knowledge of ways to resist violence”. The final index of
survey violence measurements comes from a batch of standard questions (both perceptions and
experience) on local crime. These are likely to be indirectly related to politics, through gang and
political thugs’ activities. The component variables are “purposely made damage to property
(vandalism)” and “physical threats/intimidation”. All variables mentioned are normalized as z-
scores (with higher numbers referring to less violence and more empowerment) and averaged to
compose the corresponding index.
We display results regarding our indices of survey perceptions and experience with violence in
Table 3. We use specifications with difference-in-differences when possible (the exception is the
index of general political freedom and conflict, which has several components that have only a
post-election measurement). The first specification we show for each different dependent variable
includes only state dummies22
, with the second adding location and individual demographic
controls (as in equations (2) and (3) above). Note that location controls are described in the first
panel of Table 2a, and individual demographic controls are depicted in the middle panel of Table
2a.
<Table 3 near here>
Overall, we found clear and statistically significant effects of the campaign on diminishing
perceptions of political violence and increasing empowerment of the population against political
violence. These effects are 0.39, 0.23, and 0.22 standard deviation units for general political
freedom and conflict, local electoral violence from the top, and local empowerment from the
bottom (respectively). These effects are strongly significant at the 1 or 5 percent levels using
cluster-robust standard error inference (statistical significance is maintained when using the other
methods of statistical inference we adopt in our paper). They are also robust to the exclusion of
controls. These results reassure us that the campaign was able to lessen perceptions of
intimidation and offer a sense of empowerment at the individual level for the general
population.23
Regarding perceptions and experience with crime, we do not find a statistically
22
The state dummies represent not only the obvious state-level heterogeneity, but also allow controlling for
the fact that a different team of fieldworkers in each state conducted AAIN’s campaign. 23
Note that we have found a significant decrease on perceptions of police-induced problems as a result of
the campaign, i.e., in the same direction as the political violence outcomes. This finding reassures us that

18
significant effect. This may be due to the fact that the crime index was a general one, i.e., it was
not referring directly to politically-motivated violence, the focus of AAIN’s campaign.
C. Behavioural Empowerment against Violence: Postcard
We turn now to our behavioural measure of empowerment against electoral violence, i.e., the
postcard variable. If respondents actually put the postcard in the mail, on average that means they
hope that media awareness can help in undermining the phenomenon in their state, in line with
the postcard contract that was conveyed to them during the post-election survey. Indeed,
increasing the sense of empowerment to counteract intimidation was a primary objective of
AAIN’s campaign. Moreover, the behavioural aspect of this measure (respondents had to incur a
cost to send the postcard) seeks to be an improvement on equivalent survey questions, which may
be more vulnerable to report biases. Because we have only post-election levels for the postcard
variable we use variations of specification (2) above, with state dummies only and with added
location and individual controls. These results are shown in Table 4.
<Table 4 near here>
We also explicitly address the hypothesis that the postcard variable is particularly useful in
skimming those cases where the respondent reports a sense of increased empowerment in the
surveys. In other words, by using the postcard we wish to identify those cases where the attitude
referred to is not just “cheap talk.” However, we also worry about different interpretations of the
postcard by respondents despite our efforts. For that reason, we use the information from the
survey question on empowerment against violence (see Table 1) to skim erroneous interpretations
of the postcard. The second set of regressions in Table 4 uses as dependent variable the postcard
dummy only if the perceived change in empowerment was positive. Otherwise it takes the value
0, as if the respondent had not sent the postcard.
We first note that 37 percent of the subjects returned the postcard in the mail, which implies that
the initiative had a remarkably high degree of adherence. Treated respondents were found to send
the postcard 8 percentage points more frequently than their control counterparts. However,
the campaign does not seem to have been understood by respondents as biased in favour of the incumbent
(who controls the police), as one would expect from the independent nature of the campaign sponsor
(international NGO ActionAid).

19
statistical significance can be observed only when adding controls, at the 5 and 10 percent levels
for inference based on the cluster-robust standard errors and for wild bootstrap (respectively).
Statistical significance does not emerge when using randomization inference, our most
conservative method. We then proceeded with the regressions of our hybrid version of
empowerment. There, we find clearer treatment effects of the same size, significant at the 1
(cluster-robust and wild bootstrap) or 10 (randomization inference) percent levels with full
controls, but also significant without controls when using any of the inference methods. Thus, we
feel relatively confident that the anti-violence campaign was able to achieve a positive change in
empowerment for the targeted population.
D. Voting Behaviour
We now focus on the effects of the anti-violence campaign on the electoral behaviour of the panel
of respondents, in terms of both voter turnout and voting for specific candidates/parties. Our
results are in Table 5. The focus is on the estimation of treatment effects by using single-
difference regressions employing post-election survey data on reported voting behaviour in the
April elections. For each outcome, we begin by showing the single-difference regression with
state dummies only; we then report the regression adding location and individual demographic
controls (specification 2). We focus on voter turnout and voting patterns in the presidential and
gubernatorial elections, these being the elections where the stakes were highest, i.e., where the
executive powers are concentrated in Nigeria.
We begin by observing the effect of the treatment on voter turnout. The main purpose of the
campaign was to lower the threat of intimidation through a call for electoral participation. This
implied persuading people who had decided not to vote because of intimidation to participate in
the election after all. We may therefore interpret a turnout effect of the campaign as being
qualitatively the opposite of the effect of electoral violence itself. We find that the proportion of
registered voters who voted was 7 and 11 percentage points larger in the treated group than in the
control group for the presidential and gubernatorial contests (respectively). The effect on turnout
at the gubernatorial election is statistically significant at the 1 percent level for cluster-robust
standard errors and randomization inference; it is significant at the 10 percent level for wild
bootstrap. For the presidential race, this effect is significant only when using the cluster-robust
standard errors and when using randomization inference (both at the 5 percent level). The larger
size and greater significance of the estimate concerning the gubernatorial elections indicate that

20
political violence may be more closely associated with local contests – indeed, a large share of
the Nigerian oil revenues is channelled to state-level budgets managed by governors.24
We can
conclude in favour of a clear effect of the AAIN campaign on voter turnout, which allows
inferring that electoral violence was an effective strategy in keeping voters away from the polls.
<Table 5 near here>
We now turn to the effects of the anti-violence campaign on each candidate/party’s score. The
second main purpose of the campaign was to emphasize the lack of legitimacy in the use of
intimidation by politicians. This implied persuading voters to vote against those
candidates/parties they identified as violent.
We find that in the presidential election the campaign increased the vote for the PDP candidate by
8 percentage points and reduced the vote for the AC candidate by 7 percentage points. The first is
significant at the 1 percent level using the cluster-robust standard errors, 10 percent level using
wild bootstrap, and 5 percent level using randomization inference (note that wild bootstrap and
randomization inference do not show significant levels for the specification without controls), and
the second is significant at the 1 percent level using the cluster-robust standard errors and 5
percent level randomization inference (note that randomization inference does not achieve a
significant level for the specification without controls). We also observe a positive effect on
voting for ANPP, which nevertheless is significant only when using controls, for cluster-robust
(at the 5 percent level) and randomization inference (at the 10 percent level). We should recall
that the AC presidential candidate was portrayed in the media as espousing instability. The
reduced vote for the AC candidate provides some evidence that the complementary objective of
the campaign embodied in the slogan “vote against violent politicians” also seems to have
worked; people who were expected to support Abubakar decided to punish that candidate by not
voting for him. Yar’Adua seems to have benefited the most from these vote changes.
Concerning the gubernatorial elections, the campaign very clearly increased the vote count of the
incumbent (i.e., PDP in all but one state) by 13 percentage points, an effect significant at the 1
(cluster-robust standard errors) and 10 (wild bootstrap and randomization inference) percent
levels, and robust to the exclusion of location and individual controls (with the exception of
24
The 1999 Nigerian Constitution defines at 44 percent the percentage of oil revenues accruing to states
and local governments.

21
statistical significance provided by randomization inference). We do not find significant effects
for the score of the second and the third parties.
In view of this pattern of results, i.e., incumbents as clear beneficiaries of the treatment, and after
the evidence gathered for the presidential elections, we suggest that violence may be a strategy of
weaker political groups.25
This is consistent with the idea that the incumbent may have an
advantage in using other more effective illicit strategies such as fraud and vote-buying when
needed.26
Weak political groups may be restricted to the use of electoral intimidation of
opponents to maximize their vote share. Intimidation may be viable when it does not carry a
substantial electoral cost (i.e., when those groups do not hold significant popular support),
analogously to terrorism. Collier and Vicente (2011) propose a general theory of electoral
competition with illicit strategies that formalizes this hypothesis.
E. Actual Violence: Journals
We now analyse the effects of the treatment on the intensity of violent events as reported by the
independent local journalists at each experimental location. These reports were based on
information gathered from direct observation and local institutions such as police and town
meetings.
There were 131 violent events in total that were recorded in the journalists’ diaries across all
experimental locations. Each violent event was classified using a 1-5 scale, from lowest to highest
seriousness. This scale uses the following objective thresholds: 5, occurrences resulting in more
than five dead people; 4, occurrences resulting in dead people (although fewer than five casualties
25
Indeed, several sources point to the importance of electoral violence perpetrated by marginal groups not
representing the main parties. In Oyo State, Human Rights Watch underlined the role of violent groups who
contested power within PDP in primary elections but were then defeated. See Omobowale and Olutayo
(2007) for a description of the Oyo political setting, centred on the figure of Chief Lamidi Adedibu. For
Rivers State, the same organization underlines the activities of autonomous armed gangs, who had links to
major political figures in past elections. For further details, see “Criminal Politics: Violence, ‘Godfathers’,
and Corruption in Nigeria,” October 2007. In addition, the International Foundation for Electoral Systems
(IFES), who implemented nationwide surveys during the 2007 Nigerian elections, considers that 40 percent
of the electoral violence originated purely from outside the main parties, PDP, AC, and ANPP (“A Nigerian
Perspective on the 2007 Presidential and Parliamentary Elections,” August 2007). 26
Ballot fraud is likely to favour incumbents, as these candidates are more likely to control the vote-
counting process. Vote-buying is also expected to benefit incumbents, as these politicians are expected to
have more money available and to be more convincing in proposing clientelistic exchanges. Indeed, we
find a positive correlation between competitive local races and the use of fraud and vote-buying (as
measured by perceptions).
22
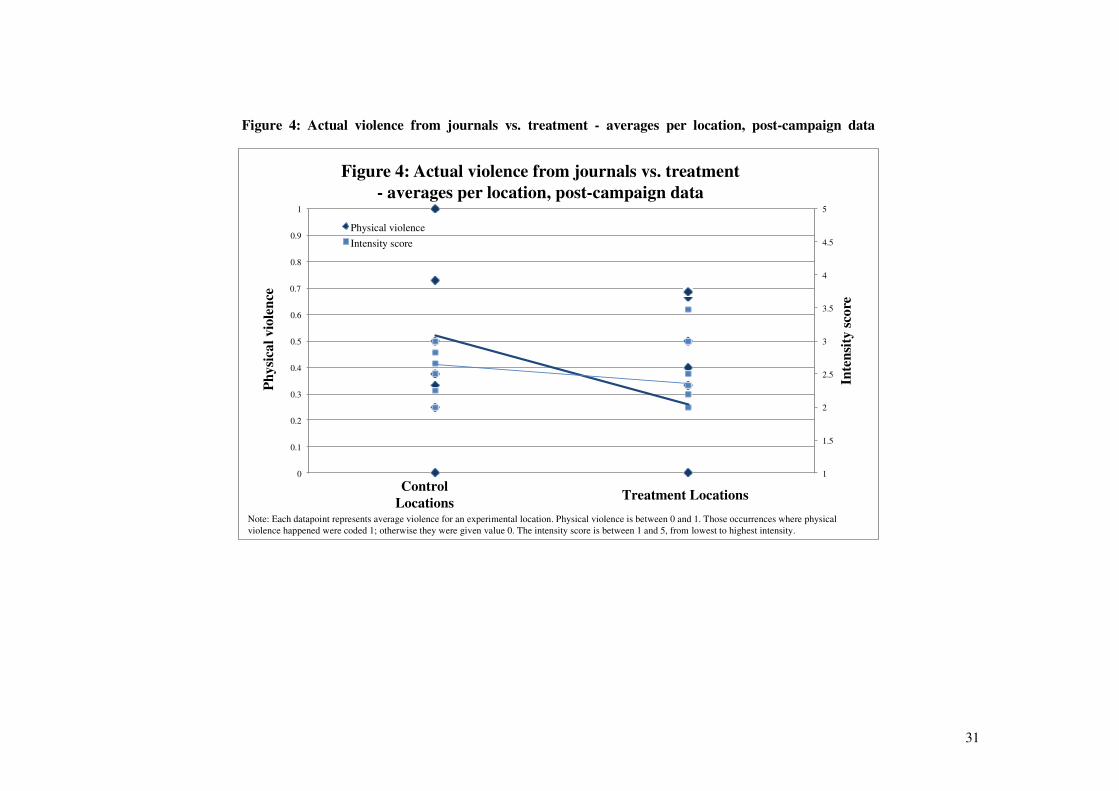
in total); 3, occurrences resulting in physically wounded people; 2, occurrences leading to severe
intimidation; 1, petty-crime occurrences leading to intimidation. Although we use the full scale as
an intensity score, we also consider the simple binary classification of whether physical violence
has occurred (i.e., attributing value 1 to occurrences coded 3-5 and value 0 otherwise).
In Figure 4 we average the seriousness of the occurrences per location and plot both the physical
violence indicator and the violence intensity score (using post-campaign data only) against our
treatment. We find that violence decreased as a result of the treatment. Despite the low number of
(location-level) observations, we find a statistically significant effect of the treatment at the 10
percent level on decreasing physical violence.
<Figure 4 near here>
In order to confirm these results, in Table 6 we run regressions for physical violence (0-1) and for
the full violence intensity score (1-5) taking the violent event as the unit of analysis. This
approach allows for the use of state dummies and location controls (see first panel of Table 2a).
Note that we would not be able to add controls to regressions at the level of the enumeration area
given the low number of observations at that level. In order to use this degree of disaggregation to
study violence intensity, we weight observations so as to attribute the same importance to each
experimental location in the sample. We show results using difference-in-differences with state
dummies only, and with location controls added to state dummies.
We find a 47 percentage-point reduction in the likelihood that physical violence occurs. This
effect is statistically significant at the 5 percent level using all three inference methods (Huber-
White, wild bootstrap, and randomization inference). This is a robust effect, as it displays
statistical significance without location controls. We also find a significant negative effect when
using the full violence intensity score (14 percent of the 1-5 scale). This is significant at the 10
percent level when using state dummies and location controls for all three inference methods. The
estimated impact on intensity provides evidence that there was an effect of the treatment on the
instigators/perpetrators of actual violence, ultimately politicians. Indeed, the likely reduction in
the effectiveness of intimidation (the direct aim of the campaign) was able to lead to a reduction
in the actual level of electoral violence as politicians adjusted their strategies.
<Table 6 near here>

23
F. Effects on Untargeted Individuals
We now evaluate the effects of the anti-violence campaign on untargeted individuals within
treated locations. These subjects were approached only for the second round of the survey and
were not approached by campaigners, although they may still have seen the street activities and
have been generally aware (through their social network) of the campaign. We contrast in Table 7
untargeted individuals with the control individuals, regarding the relevant outcomes analysed
above at the individual level. Our general hypothesis is that the effects of the campaign may have
gone beyond the panel of respondents. Table 7 displays for each outcome the same specifications
used in Tables 3, 4, and 5 when adding full controls (but using the untargeted respondents instead
of the targeted individuals). It also repeats the point estimates from those tables for comparison
purposes.
<Table 7 near here>
We find clear effects on violence and intimidation perceptions. The size of the estimates is
comparable to the effects we have found for the targeted, namely for general political freedom
and conflict, and local electoral violence from the top. These are significant, typically at the 1 or 5
percent levels using all three inference methods. Note that effects on local empowerment are less
clear: the survey-based index yields a significant treatment effect only for randomization
inference, and the postcard does not show statistical significance. We do not find effects on
voting behaviour. We can infer from these results that the spillovers of the campaign within
treatment locations are likely to have been concentrated on perceptions of violence and
intimidation, not on behaviour.27
IV. Conclusion
27
A recent contribution by Ichino and Schundeln (2012) focused attention on electoral observation at the
time of voter registration in the Ghanaian national elections of 2008. They find clear effects of national
observers on decreasing voter registration fraud, but also on displacing some of this fraud to nearby
locations that were not observed. In our study, contamination of control areas can be tested by regressing
our main outcomes of interest (violence and voting behaviour) on distance to closest treatment area, while
using observations from control locations only. We do not find evidence consistent with negative
contamination of neighbouring locations.

24
Since the fall of the Soviet Union there has been a proliferation of elections in societies with
weak governance, many of them in Africa. These elections have often produced serious levels of
violence. The Nigerian election of 2007 was one of the largest African elections to date, and it
brought many instances of electoral violence. In this paper we have provided an in-depth analysis
of community-based campaigning against electoral violence in Nigeria. We have found that the
anti-violence campaign we studied decreased the intensity of real violent events, implying that the
behaviour of politicians who use intimidation as an electoral strategy was influenced. We suggest
that the campaign worked through increased perceptions of local safety and empowerment of the
population. It also led to boosted voter participation and electoral penalization of candidates
perceived to use intimidation (violence was dissociated from incumbents).
The findings in our paper are optimistic regarding the role of community-based campaigning in
counteracting electoral violence. Like in Kuran (1989), relatively insignificant but targeted events
can indeed mobilize citizens to collective action.28
Specifically, more participation at the polls
together with improved security and empowerment of the population may be mutually
reinforcing, in a context in which violence is associated with small political groups. Anti-violence
campaigns may then be an especially effective form of voter education, working mainly as a
coordination mechanism, and relatively undemanding on the amount of information that is passed
to voters. However, we would like to emphasize that future empirical research should not lose
sight of the likely joint determination of the different electoral strategies of politicians. These may
include other types of illicit behaviour such as vote-miscounting and vote-buying. In the same
vein and policy-wise, an anti-violence campaign cannot be the sole remedy for problematic
elections; attention should be devoted to political accountability and to all illicit strategies in an
integrated manner. It is in this context that voter education, broadly construed, and electoral
observation may be invaluable policy tools for the improvement of elections and democracy in
the developing world.
28
Note that individuals who are more marginal to our local communities seem to be most responsive to the
intervention. This is found by interacting the treatment with demographic characteristics. This finding is
consistent with the targeting of violence toward those marginalized groups. Because we may perceive these
voters as less attached to specific political interests at the local level (e.g., clientelism), our findings are in
line with Robinson and Torvik (2009), who asserted that political violence may be pointed primarily at
swing voters.

25
References
Aker, Jenny C., Paul Collier, and Pedro C. Vicente. 2012. “Is Information Power? Using Cell
Phones and Free Newspapers during an Election in Mozambique.” Working Paper.
Banerjee, Abhijit V., Selvan Kumar, Rohini Pande, and Felix Su. 2011. “Do Informed Voters
Make Better Choices? Experimental Evidence from Urban India.” Working Paper.
Bertrand, Marianne, Esther Duflo, and Sendhil Mullainathan. 2004. “How Much Should We
Trust Differences-in-Differences Estimates?” Quarterly Journal of Economics, 119(1): 249-
275.
Bikhchandani, Sushil, David Hirshleifer, and Ivo Welch. 1992. “A Theory of Fads, Fashion,
Custom, and Cultural Change as Informational Cascades.” Journal of Political Economy,
100(5): 992–1026.
Becker, Gary S. 1983. “A Theory of Competition among Pressure Groups for Political
Influence.” Quarterly Journal of Economics, 98(3): 371–400.
Besley, Timothy. 2006. Principled Agents? The Political Economy of Good Government. Oxford:
Oxford University Press.
Besley, Timothy and Masayuki Kudamatsu. 2008. “Making Autocracy Work.” In Institutions and
Economic Performance, ed. Elhanan Helpman. Cambridge: Harvard University Press.
Bhushan, Indu, Erik Bloom, David Clingingsmith, Elizabeth King, Michael Kremer, Benjamin
Loevinsohn, Rathavuth Hong, and J. Brad Schwartz. 2007. “Contracting for Health:
Evidence from Cambodia.” Working Paper.
Cameron, A. Colin, Jonah Gelbach, and Douglas Miller. 2008. “Bootstrap-Based Improvements
for Inference with Clustered Errors.” Review of Economics and Statistics, 90(3): 414-427.
Chaturvedi, Ashish. 2005. “Rigging Elections with Violence.” Public Choice, 125(1-2): 189–202.
Chauvet, Lisa and Paul Collier. 2009. “Elections and Economic Policy in Developing Countries.”
Economic Policy, 24(59): 509–50.
Chaves, Isaías, Leopoldo Fergusson, and James A. Robinson. 2009. “He Who Counts Elects:
Determinants of Fraud in the 1922 Colombian Presidential Election.” NBER Working Paper
15127.
Collier, Paul and Dominic Rohner. 2008. “Democracy, Development, and Conflict.” Journal of
the European Economic Association, 6(2–3): 531–40.
Collier, Paul and Pedro C. Vicente. 2012. “Violence, Bribery, and Fraud: The Political Economy
of Elections in Sub-Saharan Africa.” Public Choice, 153(1-2): 117-147.
Dewan, Torun, Macartan Humphreys, and Daniel Rubenson. 2013. “The Elements of Political
Persuasion: Content, Charisma, and Cue.” Economic Journal, forthcoming.
Duflo, Esther, Rachel Glennerster, and Michael Kremer. 2007. “Using Randomization in
Development Economics Research: A Toolkit.” In Handbook of Development Economics,
eds. T. Paul Schultz, and John Strauss. Vol. 4, 3895–962. Oxford: Elsevier.
Ellman, Matthew and Leonard Wantchekon. 2000. “Electoral Competition under the Threat of
Political Unrest.” Quarterly Journal of Economics, 115(2): 499–531.
Fafchamps, Marcel and Pedro C. Vicente. 2013. “Political Violence and Social Networks:
Experimental Evidence from a Nigerian Election.” Journal of Development Economics, 101:
27-48.

26
Fujiwara, Thomas and Leonard Wantchekon. 2013. “Can Informed Public Deliberation
Overcome Clientelism? Experimental Evidence from Benin.” American Economic Journal:
Applied Economics, 5(4): 241-55.
Gerber, Alan S. 2004. “Does Campaign Spending Work? Field Experiments Provide Evidence
and Suggest New Theory.” American Behavioural Scientist, 47(5): 541–74.
Gerber, Alan S. and Donald P. Green. 2000. “The Effects of Canvassing, Telephone Calls, and
Direct Mail on Voter Turnout: A Field Experiment.” American Political Science Review,
94(3): 653–63.
Giné, Xavier and Ghazala Mansuri. 2011. “Together We Will: Evidence from a Field Experiment
on Female Voter Turnout in Pakistan.” Working Paper.
Ichino, Nahomi and Matthias Schuendeln. 2012. “Deterring or Displacing Electoral
Irregularities? Spillover Effects of Observers in a Randomized Field Experiment in Ghana.”
Journal of Politics, 74(1): 292-307.
Kling, Jeffrey R., Jeffrey B. Liebman, and Lawrence F. Katz. 2007. “Experimental Analysis of
Neighborhood Effects.” Econometrica, 75(1): 83–119.
Kudamatsu, Masayuki. 2012. “Has Democratization Reduced Infant Mortality in Sub-Saharan
Africa? Evidence from Micro Data.” Journal of the European Economic Association, 10(6):
1294-1317.
Kuran, Timur. 1989. “Sparks and Prairie Fires: A Theory of Unanticipated Political Revolution.”
Public Choice, 61(1): 41–74.
Lohmann, Susanne. 1994. “The Dynamics of Informational Cascades: The Monday
Demonstrations in Leipzig, East Germany, 1989–91.” World Politics, 47(1): 42–101.
Maier, Karl. 2000. This House Has Fallen: Nigeria in Crisis. Boulder, CO: Westview Press.
McMillan, John and Pablo Zoido. 2004. “How to Subvert Democracy: Montesinos in Peru.”
Journal of Economic Perspectives, 18(4): 69–92.
Moulton, Brent R. .1990. “An Illustration of a Pitfall in Estimating the Effects of Aggregate
Variables on Micro Units.” Review of Economics and Statistics, 72(2): 334-38.
Nickerson, David W. 2008. “Is Voting Contagious? Evidence from Two Field Experiments.”
American Political Science Review, 102(1): 49–57.
Omobowale, Ayokunle O. and Akinpelu O. Olutayo. 2007. “Chief Lamidi Adedibu and
Patronage Politics in Nigeria.” Journal of Modern African Studies 45(3): 425–46.
Omotola, J. Shola. 2010. “Elections and Democratic Transition in Nigeria Under the Fourth
Republic.” African Affairs, 109(437): 535-553.
Robinson, James A. and Ragnar Torvik. 2009. “The Real Swing Voters’ Curse.” American
Economic Review, Papers and Proceedings, 99(2): 310–5.
Rosenbaum, Paul R. 2002. “Observational Studies.” New York: Springer.
Skaperdas, Stergios and Bernard Grofman. 1995. “Modeling Negative Campaigning.” American
Political Science Review, 89(1): 49–61.
Smith, Daniel J. 2007. A Culture of Corruption: Everyday Deception and Popular Discontent in
Nigeria. Princeton; Oxford: Princeton University Press.
Vicente, Pedro C. 2013. “Is Vote-Buying Effective? Evidence from a Field Experiment in West
Africa.” Economic Journal, forthcoming.

27
Wantchekon, Leonard. 2003. “Clientelism and Voting Behaviour: Evidence from a Field
Experiment in Benin.” World Politics, 55(3): 399–422.
Wilkinson, Steven. I. 2004. Votes and Violence: Electoral Competition and Ethnic Riots in India.
Cambridge: Cambridge University Press.

28
Figure 1: AAIN’s campaign: leaflet/poster (above) and sticker (below)

29
Figure 2: Sampled enumeration areas

30
Figure 3: Postcard
31
Figure 4: Actual violence from journals vs. treatment - averages per location, post-campaign data
1
1.5
2
2.5
3
3.5
4
4.5
5
0
0.1
0.2
0.3
0.4
0.5
0.6
0.7
0.8
0.9
1
Inte
nsi
ty s
core
Ph
ysi
cal
vio
len
ce
Figure 4: Actual violence from journals vs. treatment
- averages per location, post-campaign data
Physical violence
Intensity score
Treatment Locations Control
Locations Note: Each datapoint represents average violence for an experimental location. Physical violence is between 0 and 1. Those occurrences where physical
violence happened were coded 1; otherwise they were given value 0. The intensity score is between 1 and 5, from lowest to highest intensity.

32
Table 1: Violence-related survey measures - questionnaire phrasing and scales
variable phrasing of the question original scale
change of freedom to vote freelyPlease tell me if the following things are worse or better now than they were before our January interview, or are they about the same? Freedom to
choose who to vote for without feeling pressured. Worse-Better1 to 5
change of freedom from crime and
insecurity
Please tell me if the following things are worse or better now than they were before our January interview, or are they about the same? Safety from
crime and violence. Worse-Better1 to 5
free & fair 2007 elections - general On the whole, how free and fair were April 2007 elections? Not free and fair-Free and fair 1 to 4
conflict within local community In your experience, how often did violent conflicts arise between people: Within the community where you live? Never-Always 0 to 4
security How secure against violence originated by politicians has been your neighbourhood or village? Insecure-Secure 1 to 7
political intimidationHow often (if ever) has anyone threatened negative consequences to people in your neighbourhood or village in order to get them to vote a certain
way? Never-Often0 to 3
influence of assassinationsHow much influence have assassinations of politicians in Nigeria had on instilling a climate of fear/intimidation in your neighbourhood or village?
Not Influential-Influential1 to 7
politicians advocating violence How supportive of violence, in terms of openly advocating violence, have been political representatives in your area? Unsupportive-Supportive 1 to 7
gang activityHow frequently have you heard about violent groups/gangs/area youths connected with politics being active in your neighbourhood or village?
Infrequent-Frequent1 to 7
support for 'do-or-die affair'How much of a 'do or die affair' have the people of your neighbourhood or village considered the 2007 elections? No 'Do or die affair'-'Do or die
affair'1 to 7
standing against violence How clearly have the people in your neighbourhood or village been standing against violence originated by politicians? Unclear-Clear 1 to 7
empowerment against violenceHow empowered to defend against violence originated by politicians have the people been feeling in your neighbourhood or village? Disempowered-
Empowered1 to 7
knowledge of ways to counteract
violence
How knowledgeable have been the people in your neighbourhood or village on ways to resist violence originated by politicians? Not Knowledgeable-
Knowledgeable1 to 7
vandalism (perception) How frequently have you heard about purposely-made damages (vandalism) to property in your area? Infrequent-Frequent 1 to 7
vandalism (experience) How frequently, if ever, have you or anyone in your family had some property purposely-damaged (vandalized)? Never-Many times 1 to 4
physical intimidation (perception) How frequently have you heard about physical threats/intimidation in your area? Infrequent-Frequent 1 to 7
physical intimidation (experience) How often, if ever have you or anyone in your family been physically threatened? Never-Many times 1 to 4
local electoral violence -
from the top
local empowerment -
from the bottom
crime - perceptions and
experience
political freedom and
conflict - general

33
Table 2a: Differences across treatment and control groups - location characteristics, individual demographics, and attrition
level difference (to control)
-0.083
(0.172)
0.000
(0.118)
-0.083
(0.206)
0.083
(0.172)
-0.167
(0.181)
0.083
(0.206)
-0.000
(0.002)
-0.260
(1.005)
0.033
(0.736)
-0.029
(0.044)
0.079
(0.057)
-0.042
(0.167)
-0.057
(0.114)
0.087
(0.088)
0.116
(0.126)
-0.091
(0.132)
0.314
(0.204)
-0.042
(0.066)
0.011
(0.031)
0.022
(0.032)
0.001
(0.039)
-0.027
(0.035)
-0.032
(0.110)
0.028
(0.116)
0.036
(0.098)
0.044
(0.029)
0.074
(0.119)
3,867.420
(4,758.596)
-0.018
(0.013)
control
0.237
0.329 0.365
0.512 0.586
0.888 0.932
19,001.358 22,868.778
Note: These results come from OLS regressions. For individual survey-based variables, we include in the treatment group oversample individuals. Standard errors reported; these
are corrected by clustering at the location (census area) level. * significant at 10%; ** significant at 5%; *** significant at 1%.
0.112 0.133
0.125 0.136
0.606 0.574
0.526 0.554
0.222 0.222
0.120 0.093
0.621 0.737
0.318 0.277
0.157 0.100
0.158 0.117
0.344 0.253
4.764 5.078
panel re-surveying 0.967 0.948
cell phone
household expenditure (naira/month)
radio
property and
expenditure
house
land
cattle
student
housework
industry/services: artisanoccupation
agriculture
industry/services: trader
religion
Christian
Muslim
religious intensity (1-6)
Hausa
Igbo
secondary school completed
ethnicity
Yoruba
age
household size
town hall 0.333 0.417
basic demographics
female
married
location characteristics
32.955 32.695
6.430 6.463
0.500 0.500
0.581 0.552
0.316
0.072 0.159
0.417 0.333
electricity 0.750 0.833
health clinic 0.833 0.667
treatment
post office 0.250 0.167
school 0.917 0.917
police

34
Table 2b: Differences across treatment and control groups - baseline outcomes
level difference (to control)
0.011
(0.081)
0.252
(0.210)
0.114
(0.102)
-0.058
(0.061)
-0.064
(0.060)
0.020
(0.087)
-0.076
(0.080)
0.016
(0.023)
-0.023
(0.083)
-0.021
(0.069)
-0.007
(0.023)
0.234
(0.150)
0.234
(0.291)
Note: These results come from OLS regressions. For individual survey-based variables, we include in the treatment group oversample individuals. Standard errors reported; these
are corrected by clustering at the location (census area) level. * significant at 10%; ** significant at 5%; *** significant at 1%.
2.694 2.929
treatment
actual violence
(journals)
physical violence (0-1) 0.425 0.659
violence intensity score (1-5)
control
violence (survey)
local electoral violence - from the top (zscore)
local empowerment - from the bottom (zscore)
crime - perceptions and experience (zscore)
AC gubernatorial
AC presidential
PDP gubernatorial
turnout gubernatorial
PDP presidential
voting 2003 (survey)
turnout presidential
ANPP presidential
ANPP gubernatorial
0.165 0.089
0.027 0.043
0.450
0.113
0.028
0.000
0.034
0.473
0.134
0.000
0.011
0.000 0.252
0.114
0.728 0.669
0.737 0.673
0.471 0.491

35
Table 3: Regressions of individual violence-related survey measures
coefficient 0.366*** 0.386*** 0.236** 0.233** 0.221** 0.221** -0.034 -0.037
standard error (0.133) (0.123) (0.099) (0.102) (0.104) (0.106) (0.114) (0.117)
p-value wild bootstrap 0.024** 0.068* 0.026** 0.028** 0.042** 0.046** 0.766 0.746
p-value randomization inference 0.050* 0.052* 0.001*** 0.002*** 0.012** 0.013** 1.000 0.983
1,148 1,130 2,339 2,303 2,296 2,260 2,349 2,312
-0.000 0.001 -0.000 -0.005 -0.000 -0.012 0.000 -0.008
Yes Yes Yes Yes Yes Yes Yes Yes
No Yes No Yes No Yes No Yes
political freedom and conflict -
general
local electoral violence - from the
top
local empowerment - from the
bottom
crime - perceptions and
experience
Note: All regressions are OLS. All dependent variables are indices of z-scores. They are scaled from high violence (low empowerment) to low violence (high empowerment). All regressions include baseline observations (difference-in-
difference specifications), except for political freedom and conflict - general, and include state dummies. Controls are location controls on the existence of basic public services, and individual demographic characteristics (see Table 2a, top and
middle panels). Standard errors reported; these are corrected by clustering at the location (census area) level. Wild bootstrap method follows Cameron et al (2008), with null hypothesis imposed, weights -1 and 1, and 1000 replications.
Randomization inference uses all 4,096 placebo treatment vectors. * significant at 10%; ** significant at 5%; *** significant at 1%.
treatment effect
number of observations
state dummies
controls
dependent variable ------>
mean dep. variable (control)

36
Table 4: Regressions of behavioural empowerment against violence (postcard)
coefficient 0.060 0.078** 0.085** 0.084***
standard error (0.079) (0.035) (0.036) (0.015)
p-value wild bootstrap 0.486 0.090* 0.034** 0.002***
p-value randomization inference 0.566 0.412 0.096* 0.087*
1,149 1,131 1,149 1,131
0.341 0.342 0.109 0.108
No Yes No Yes
mean dep. variable (control)
controls
Note: All regressions are OLS. All dependent variables are binary. The second dependent variable takes value 1 if the postcard variable takes values 1 and if
empowerment against violence increased from the baseline to the post-election reports. All regressions are based on post-election observations (single-difference
specifications), and include state dummies. Controls are location controls on the existence of basic public services, and individual demographic characteristics (see
Table 2a, top and middle panels). Standard errors reported; these are corrected by clustering at the location (census area) level. Wild bootstrap method follows
Cameron et al (2008), with null hypothesis imposed, weights -1 and 1, and 1000 replications. Randomization inference uses all 4,096 placebo treatment vectors. *
significant at 10%; ** significant at 5%; *** significant at 1%.
dependent variable ------> postcard postcard if ∆empowerment>0
treatment effect
number of observations

37
Table 5: Regressions of voting behaviour
coefficient 0.060* 0.073** 0.093* 0.083*** -0.054* -0.074*** 0.018 0.061**
standard error (0.037) (0.031) (0.048) (0.032) (0.029) (0.021) (0.038) (0.028)
p-value wild bootstrap 0.158 0.152 0.114 0.080* 0.166 0.108 0.702 0.278
p-value randomization inference 0.096* 0.049** 0.101 0.023** 0.116 0.028** 0.574 0.059*
1,143 1,126 1,143 1,126 1,143 1,126 1,143 1,126
0.651 0.657 0.337 0.343 0.190 0.189 0.109 0.110
coefficient 0.100** 0.111*** 0.103** 0.128*** -0.031 0.034 0.033 0.004
standard error (0.040) (0.036) (0.052) (0.042) (0.028) (0.023) (0.034) (0.035)
p-value wild bootstrap 0.038** 0.060* 0.084* 0.084* 0.320 0.370 0.382 0.998
p-value randomization inference 0.066* 0.008*** 0.146 0.054* 0.254 0.119 0.441 0.938
1,143 1,125 1,143 1,125 1,143 1,125 1,143 1,125
0.688 0.696 0.455 0.458 0.122 0.124 0.075 0.076
No Yes No Yes No Yes No Yes
dependent variable ------>turnout voting
presidential PDP presidential AC presidential ANPP presidential
treatment effect
number of observations
mean dep. variable (control)
dependent variable ------> gubernatorial
mean dep. variable (control)
controls
Note: All regressions are OLS. All dependent variables are binary. All regressions are based on post-election observations (single-difference specifications), and include state dummies. Controls are location controls on the existence of basic
public services, and individual demographic characteristics (see Table 2a, top and middle panels). Standard errors reported; these are corrected by clustering at the location (census area) level. Wild bootstrap method follows Cameron et al
(2008), with null hypothesis imposed, weights -1 and 1, and 1000 replications. Randomization inference uses all 4,096 placebo treatment vectors. * significant at 10%; ** significant at 5%; *** significant at 1%.
incumbent gubernatorial second party gubernatorial third party gubernatorial
treatment effect
number of observations

38
Table 6: Regressions of actual violence (journals)
coefficient -0.425** -0.468** -0.486* -0.558*
standard error (0.208) (0.198) (0.292) (0.287)
p-value wild bootstrap 0.068* 0.040** 0.092* 0.062*
p-value randomization inference 0.022** 0.021** 0.112 0.091*
131 131 131 131
0.500 0.500 2.703 2.703
No Yes No Yeslocation controls
Note: All regressions are OLS. Each observation corresponds to an incident; observations are weighted in order to focus on intensity (by giving the same weight to
each location). Intensity is classified on a scale between 1 and 5. First two columns consider 1-2 to be 0, and 3-5 to be 1, i.e., events involving physical confrontation
take value 1. All regressions include state dummies. Location controls are indicator variables on the existence of basic public services (see top panel of Table 2).
Standard errors reported; these are corrected by clustering at the location (census area) level. Wild bootstrap method follows Cameron et al (2008), with null
hypothesis imposed, weights -1 and 1, and 1000 replications. Randomization inference uses all 4,096 placebo treatment vectors. * significant at 10%; ** significant at
5%; *** significant at 1%.
physical violence intensity scoredependent variable ------>
treatment effect
number of observations
mean dep. variable (control)

39
Table 7: Regressions of main outcomes - untargeted individuals
coefficient 0,386*** 0,233** 0,221** -0,037 0,078** 0,073** 0,111*** 0,083*** 0,128***
coefficient 0,336*** 0,260** 0,131 0,062 -0,008 -0,034 -0,016 -0,020 0,004
standard error (0,110) (0,111) (0,142) (0,119) (0,059) (0,052) (0,060) (0,030) (0,035)
p-value wild bootstrap 0,080* 0,022** 0,394 0,628 0,902 0,566 0,792 0,598 0,968
p-value randomization inference 0,035** 0,002*** 0,013** 0,982 0,950 0,647 0,878 0,713 0,953
862 1 739 1 724 1 743 863 859 857 859 857
0,001 -0,005 -0,012 -0,008 0,342 0,657 0,696 0,343 0,458
direct treatment effect
spillover treatment effect
number of observations
mean dep. variable (control)
Note: All regressions are OLS. All dependent variables and specifications are as in Tables 3, 4, and 5, with state dummies and controls. The sample is composed of the treatment oversample and control groups. Standard errors reported; these are corrected by clustering at the location (census area)
level. Wild bootstrap method follows Cameron et al (2008), with null hypothesis imposed, weights -1 and 1, and 1000 replications. Randomization inference uses all 4,096 placebo treatment vectors. * significant at 10%; ** significant at 5%; *** significant at 1%.
dependent variable ------>
turnout votingpolitical freedom
and conflict -
general
local electoral
violence - from the
top
crime - perceptions
and experiencepostcard
presidential gubernatorial PDP presidentialincumbent
gubernatorial
local empowerment -
from the bottom