PATTERNS OF MORTALITY IN LOS ANGELES COUNTY ......almost all the nearly 60,000 deaths in the county...
82
PATTERNS OF MORTALITY IN LOS ANGELES COUNTY 2008-2017 Office of Health Assessment & Epidemiology December 2019
Transcript of PATTERNS OF MORTALITY IN LOS ANGELES COUNTY ......almost all the nearly 60,000 deaths in the county...

PATTERNS OF MORTALITY IN LOS ANGELES COUNTY
2008-2017
Office of Health Assessment & Epidemiology
December 2019

1
Los Angeles County Department of Public Health Barbara Ferrer, PhD, MPH, MEd Director Muntu Davis, MD, MPH Health Officer Paul Simon, MD, MPH Chief Science Officer Office of Health Assessment and Epidemiology Rashmi Shetgiri, MD, MSHS, MSCS Director Megha Shah, MD, MPH, MS Chief, Population Health Assessment Unit Alex Ho, MPH Supervising Epidemiologist Heena Hameed, MPH Epidemiologist Louise Rollin-Alamillo, MS Chief Research Analyst Aida Angelescu, MS Senior Geographic Information Systems Analyst Rishwa Patel, MPH Epidemiology Analyst Amy S. Lightstone, MPH, MA Chief, Epidemiology and Data Coordination Unit Suggested Citation Patterns of Mortality in Los Angeles County, 2008-2017. Los Angeles County Department of Public Health. Office of Health Assessment and Epidemiology. December 2019.

2
Message from the Director
Just as health care providers assess the individual needs of their patients, health departments are responsible for “taking the pulse” of their communities. We at the Los Angeles County Department of Public Health gain valuable insights from our many community partners on the most pressing health challenges facing their communities and the strategies to best address them. In addition, we rely on a variety of data sources to assess the health of the population and the underlying social, economic, and environmental conditions that impact health. One of the most important data sources is the information contained on death certificates, which are recorded for almost all the nearly 60,000 deaths in the county each year.
In this report, Patterns of Mortality in Los Angeles County, we describe recent trends in mortality countywide, in specific regions of the county, and in various sub-populations defined by gender, age group, and race/ethnicity. The statistics reveal important patterns that highlight significant inequities in health across our different communities and population groups. In addition, the report indicates that the steady progress made in reducing mortality over past decades has stalled, and in some groups mortality has even increased.
We provide this information with the recognition that the observed patterns of mortality raise as many questions as they answer. Most importantly, how do we more effectively address the longstanding inequities in mortality, and in health overall, seen across the county? How do we return to a path of sustained reductions in mortality and improvements in health? How do we best address the leading causes of mortality and premature mortality in the county population? The answers to these questions have important implications for ensuring that all county residents have the opportunities, resources, and support to achieve optimal health and well-being.
We offer this report with the hope that your perspectives and insights on the findings will help create a deeper understanding of the actions needed to address the observed inequities in our communities, and that the report will support your efforts, and our collective efforts, to maximize the health of our residents.
If you have suggestions, questions, or other feedback, please do not hesitate to contact us at [email protected].
In gratitude,
Barbara Ferrer, PhD, MPH, MEd Director, Los Angeles County Department of Public Health

3
Table of Contents Message from the Director ......................................................................................................................... 2
Data Highlights............................................................................................................................................ 5
Introduction ............................................................................................................................................... 5
Trends in Mortality ................................................................................................................................... 5
Mortality and Income ................................................................................................................................ 8
Leading Causes of Death ........................................................................................................................ 10
Leading Causes of Premature Death ....................................................................................................... 13
Discussion ............................................................................................................................................... 14
References ............................................................................................................................................... 16
Appendix A: Technical Notes .................................................................................................................. 18
FIGURE A-1. Sample California Death Certificate................................................................................ 19
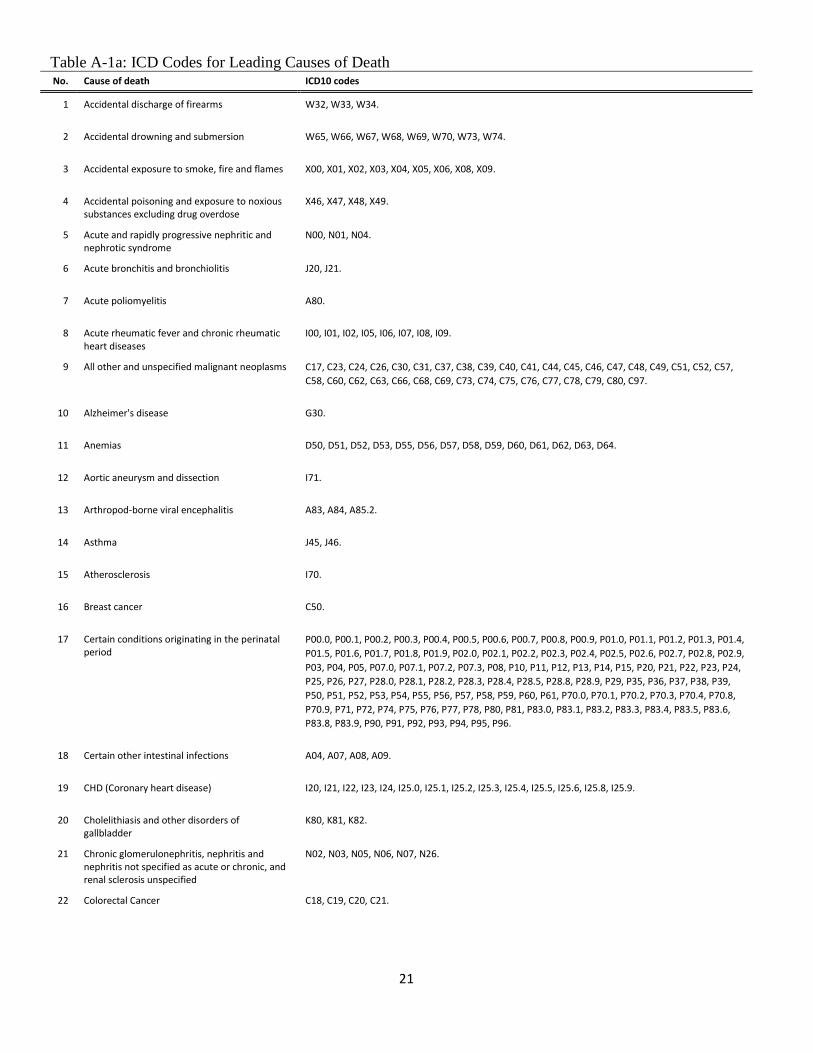
TABLE A-1a. ICD Codes for Leading Causes of Death ........................................................................ 21
TABLE A-1b. ICD Codes for Leading Causes of Infant Death ............................................................. 27
FIGURE A-2. Map of Los Angeles County Service Planning Areas ..................................................... 33
TABLE A-2. City or Community and Corresponding Service Planning Area (SPA) ............................ 34
TABLE A-3a. Leading Causes of Death for Native Hawaiians and Other Pacific Islanders (NHOPI), 2014-2017 ............................................................................................................................................... 37
TABLE A-3b. Leading Causes of Death for Native Hawaiians and Other Pacific Islanders (NHOPI) by Gender, 2014-2017.................................................................................................................................. 37
TABLE A-4a. Leading Causes of Death for American Indians/Alaska Natives (AIAN), 2014-2017 ... 38
TABLE A-4b. Leading Causes of Death for American Indians/Alaska Natives (AIAN) by Gender,
2014-2017 ............................................................................................................................................... 38
TABLE A-5a. Leading Causes of Premature Death for Native Hawaiians and Other Pacific Islanders (NHOPI), 2014-2017 .............................................................................................................................. 39
TABLE A-5b. Leading Causes of Premature Death for Native Hawaiians and Other Pacific Islanders (NHOPI) by Gender, 2014-2017 ............................................................................................................. 39
TABLE A-6a. Leading Causes of Premature Death for American Indians/Alaska Natives (AIAN), 2014-2017 ............................................................................................................................................... 40
TABLE A-6b. Leading Causes of Premature Death for American Indians/Alaska Natives (AIAN) by Gender, 2014-2017.................................................................................................................................. 40
TABLE A-7. Deaths (2017) and Population (2011-2015) of Native Hawaiians and Other Pacific Islanders (NHOPI) by Ethnicity and Multiple Race Status..................................................................... 42
TABLE A-8. Deaths (2017) and Population (2011-2015) of American Indians/Alaska Natives (AIAN) by Ethnicity and Multiple Race Status .................................................................................................... 42
Appendix B: 10 Leading Causes of Death .............................................................................................. 43
TABLE B-1. 10 Leading Causes of Death, Los Angeles County, 2017 ................................................. 44
4
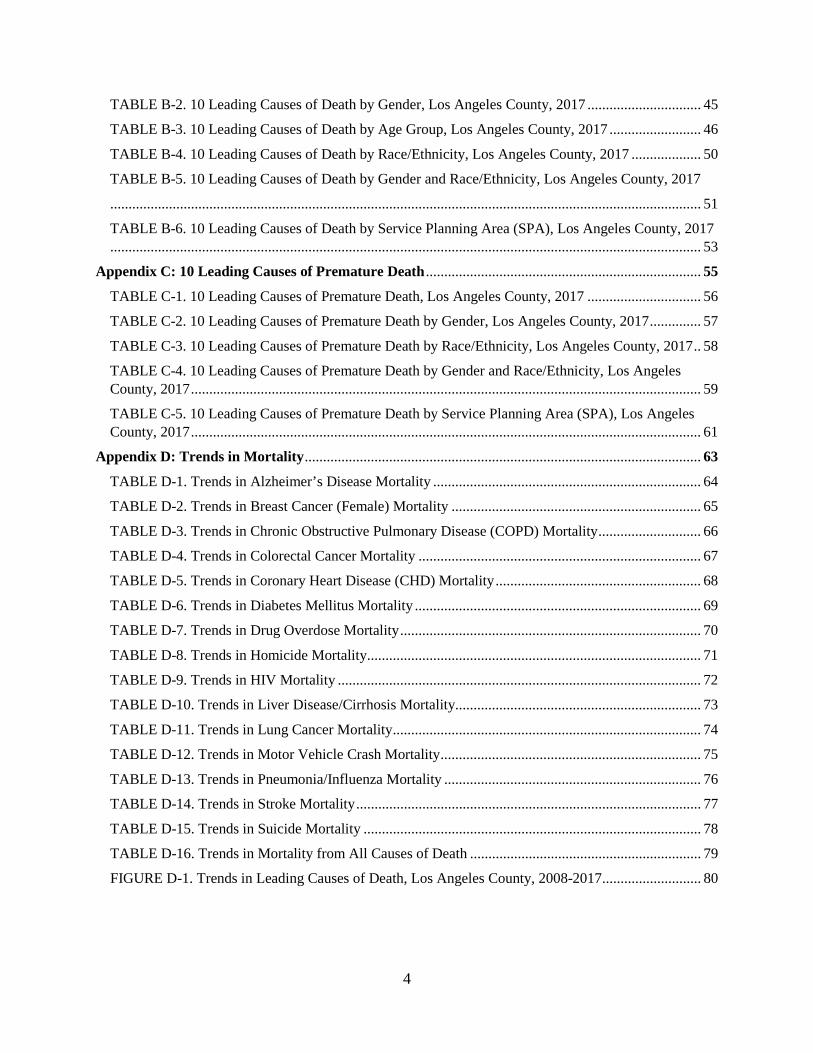
TABLE B-2. 10 Leading Causes of Death by Gender, Los Angeles County, 2017 ............................... 45
TABLE B-3. 10 Leading Causes of Death by Age Group, Los Angeles County, 2017 ......................... 46
TABLE B-4. 10 Leading Causes of Death by Race/Ethnicity, Los Angeles County, 2017 ................... 50
TABLE B-5. 10 Leading Causes of Death by Gender and Race/Ethnicity, Los Angeles County, 2017
................................................................................................................................................................. 51
TABLE B-6. 10 Leading Causes of Death by Service Planning Area (SPA), Los Angeles County, 2017................................................................................................................................................................. 53
Appendix C: 10 Leading Causes of Premature Death ........................................................................... 55
TABLE C-1. 10 Leading Causes of Premature Death, Los Angeles County, 2017 ............................... 56
TABLE C-2. 10 Leading Causes of Premature Death by Gender, Los Angeles County, 2017 .............. 57
TABLE C-3. 10 Leading Causes of Premature Death by Race/Ethnicity, Los Angeles County, 2017 .. 58
TABLE C-4. 10 Leading Causes of Premature Death by Gender and Race/Ethnicity, Los Angeles County, 2017 ........................................................................................................................................... 59
TABLE C-5. 10 Leading Causes of Premature Death by Service Planning Area (SPA), Los Angeles County, 2017 ........................................................................................................................................... 61
Appendix D: Trends in Mortality ............................................................................................................ 63
TABLE D-1. Trends in Alzheimer’s Disease Mortality ......................................................................... 64
TABLE D-2. Trends in Breast Cancer (Female) Mortality .................................................................... 65
TABLE D-3. Trends in Chronic Obstructive Pulmonary Disease (COPD) Mortality ............................ 66
TABLE D-4. Trends in Colorectal Cancer Mortality ............................................................................. 67
TABLE D-5. Trends in Coronary Heart Disease (CHD) Mortality ........................................................ 68
TABLE D-6. Trends in Diabetes Mellitus Mortality .............................................................................. 69
TABLE D-7. Trends in Drug Overdose Mortality .................................................................................. 70
TABLE D-8. Trends in Homicide Mortality ........................................................................................... 71
TABLE D-9. Trends in HIV Mortality ................................................................................................... 72
TABLE D-10. Trends in Liver Disease/Cirrhosis Mortality................................................................... 73
TABLE D-11. Trends in Lung Cancer Mortality .................................................................................... 74
TABLE D-12. Trends in Motor Vehicle Crash Mortality ....................................................................... 75
TABLE D-13. Trends in Pneumonia/Influenza Mortality ...................................................................... 76
TABLE D-14. Trends in Stroke Mortality .............................................................................................. 77
TABLE D-15. Trends in Suicide Mortality ............................................................................................ 78
TABLE D-16. Trends in Mortality from All Causes of Death ............................................................... 79
FIGURE D-1. Trends in Leading Causes of Death, Los Angeles County, 2008-2017 ........................... 80

5
Introduction
Mortality is one of the most fundamental indicators of the health of a population. Although mortality statistics provide a relatively incomplete picture of the overall health of a population, these statistics include important information on the leading causes of death which, in turn, inform health care and public health planning and resource allocations as well as priorities for research and prevention. In addition, these statistics identify populations and communities disproportionately impacted by excess mortality, helping to better focus resources for treatment and prevention, including strategies to address the inequitable societal conditions that contribute to the disproportionately high rates of mortality in some groups. Mortality data also provide important information for identifying and characterizing emerging public health threats. For example, after many decades of steady decline in mortality in the U.S., alarming increases in mortality have been observed in many regions of the nation over the last several years, a trend that has been largely attributed to rising rates of drug overdose deaths and suicides.1
In this report, data are presented on the leading causes of death and premature death in Los Angeles County. Premature death is defined as a death before 75 years of age, a standard cut-off used in mortality analyses. Data on mortality trends are presented for the period 2008 through 2017, the last year for which data on all deaths, including deaths among county residents that occurred outside the county, are available. Data are presented for the total county population and are also broken out by gender, age group, race/ethnicity,* and geographic region (as defined by Service Planning Area) to highlight disparities in mortality seen across different populations in the county. The observed disparities are to a large degree fueled by inequitable social, economic, and environmental conditions experienced by these groups. These conditions are frequently referred to as the social determinants of heath.
Key findings are presented in the body of the report. Additional detailed data tables, figures, and technical notes are provided in the appendices. Trends in Mortality
• From 2008 to 2017, the mortality rate† in Los Angeles County decreased by 6.2%, from 629 deaths to 590 deaths per 100,000 population. However, all of this decrease occurred between 2008 and 2012. From 2012 to 2017 the mortality rate did not decline for females, and among males increased 3.1%, from 688 deaths to 709 deaths per 100,000 (Figure 1).
*Much of this report presents data for four racial/ethnic groups (Latino, white, black, and Asian). Due to small population sizes for Native Hawaiians and other Pacific Islanders and for American Indians/Alaska Natives data for these groups are presented, where possible, as an aggregated four-year estimate (2014-2017).
†All mortality rates are age-adjusted using the 2000 US Standard Population except for the age-specific mortality rates.

6
• Mortality was higher among males than females throughout the 10-year period. In 2017, the mortality rate for males (709 deaths per 100,000) was 44% higher than the rate for females (492 deaths per 100,000) (Figure 1).
Figure 1: Mortality Rate in Los Angeles County and by Gender, 2008-2017 Mortality Rate Significantly Higher for Males Though Overall Decline in Past 10 Years
• Wide disparities were also observed by race/ethnicity. Throughout the 10-year period, the mortality rate was highest among blacks, followed by whites, Latinos, and Asians, with no appreciable change in the magnitude of the disparities (Figure 2).
• From 2012 to 2017, the mortality rate increased 6.7% among Latinos, 6.6% among Asians, and 2.3% among blacks (Appendix D, Table D-16). Figure 2: Mortality Rate in Los Angeles County and by Race/Ethnicity†, 2008-2017
Mortality Rate Consistently the Highest among Blacks for Past 10 Years
629614 615 596
581594 580 593 589 590
754 739 739707
688710
699 713 713 709
528 514 517 506 493 499485 497 489 492
400
500
600
700
800
2008 2009 2010 2011 2012 2013 2014 2015 2016 2017
Total Male Female
670 637
525519
918867
459 426350
450
550
650
750
850
950
2008 2009 2010 2011 2012 2013 2014 2015 2016 2017
White Latino Black Asian
Age-
Adju
sted
Rat
e pe
r 100
,000
Ag
e-Ad
just
ed R
ate
per 1
00,0
00
†From 2008-2011, the number of deaths and death rates for Asians includes NHOPI (Native Hawaiians and other Pacific Islanders). Starting 2012, Asian and NHOPI were separated into different race categories. Trends for Asian population should be interpreted with caution.

7
• Although we were unable to reliably track annual trends in deaths among American Indians/Alaska Natives (AIANs) and Native Hawaiians and other Pacific Islanders (NHOPIs) due to small population sizes, the four-year average mortality rates in these two groups were 802 and 991 per 100,000, respectively, in 2014-2017 (Figure 3). Figure 3: Mortality Rate for Native Hawaiian and Other Pacific Islander and for American Indian/Alaska Native, 2014-2017
Both Groups Have Higher Mortality Rates Compared to LA County Overall
• The mortality rate among all age groups declined from 2008 to 2017; the largest decline was seen among the 0-17 year age group (Table 1).
Table 1: Crude Mortality Rates & Number of Deaths in Los Angeles County by Age Group Past 10 Years Saw One-Third Decline in Crude Mortality Rate (CMR) for Ages 0-17 Years
* for 100,000 population
2008-2017# of Deaths CMR* # of Deaths CMR* CMR % Change
0-17 years 1,201 48 738 32 -33%18-44 years 3,837 95 3,705 92 -3%45-64 years 11,439 498 12,388 464 -7%65+ years 41,042 3,901 46,896 3,564 -9%
2008 2017
Age-
Adju
sted
Rat
e pe
r 100
,000
*Because of the small number of annual deaths among Native Hawaiians and other Pacific Islanders and for American Indians/Alaska Natives, a four-year average was calculated from data for 2014-2017; for comparison purposes, the Los Angeles County rate presented here is also a 2014-2017 four-year average.

8
• The mortality rate decreased in all eight Services Planning Areas (SPAs) of the county except the Antelope Valley SPA (Table 2).
• In addition, among the SPAs, Antelope Valley (SPA 1) had the highest mortality rate in 2017 (819 deaths per 100,000), followed by the South LA SPA (SPA 6; 735 deaths per 100,000). The West LA SPA (SPA 5) had the lowest mortality rate (476 per 100,000), and also had the largest decrease (11%) in mortality from 2008 to 2017.
Table 2: Mortality Rates & Number of Deaths in Los Angeles County by Service Planning Area Only the Antelope Valley SPA Had an Increase in Mortality Rate in the Last 10 Years
*Age-adjusted rate per 100,000. The death rates for 2008-2009 were recalculated using new population estimates based on the 2010 Census, therefore, death rates in this report may differ from rates previously published.
Mortality and Income
In most populations around the world, mortality is inversely related to socioeconomic status, as measured by levels of income, education, or employment. For example, mortality rates are typically higher among populations with lower average incomes than higher average incomes. This relationship reflects a complex array of factors related to privilege, wealth, power, and opportunity as well as access to healthcare and other supportive services.
To assess the relationship between income and mortality in Los Angeles County, all persons who died in 2017 were grouped into four income groups, from lowest to highest, based on the median household income of the census tract in which they resided at the time of their death. This measure of income, while limited, was used because the death certificate data used for the analysis did not include information on an individual’s level of income or wealth at the time of death. Results are shown in Figure 4.
2008-2017# of Deaths Death Rate* # of Deaths Death Rate* Death Rate % Change
SPA 1: Antelope Valley 2,165 795.4 2,759 818.5 3%SPA 2: San Fernando Valley 12,259 603.7 13,840 567.7 -6%SPA 3: San Gabriel Valley 10,616 594.8 11,841 554.5 -7%SPA 4: Metro LA 6,210 575.7 6,416 522.8 -9%SPA 5: West LA 4,112 533.5 4,105 475.6 -11%SPA 6: South LA 5,614 794.7 6,005 735.0 -8%SPA 7: East 7,130 619.7 7,817 600.0 -3%SPA 8: South Bay 9,415 649.6 10,646 636.1 -2%
2008 2017

9
Figure 4: Mortality Rates by Race/Ethnicity and Census Tract-Level Median Household Income, 2017
Mortality Rate Was Highest Among Blacks Within All Income Groups
• In the overall county population, mortality was highest among those in the lowest income group (646 deaths per 100,000 population) and steadily decreased to a low of 516 deaths per 100,000 in the highest income group.
• This inverse relationship was seen in all racial/ethnic groups but was most pronounced among blacks and whites.
• Within income groups, large disparities in mortality remained. For example, among populations in the lowest income group, the mortality rate was highest among blacks (972 deaths per 100,000) followed by whites (874 deaths per 100,000), Latinos (519 deaths per 100,000), and Asians (482 deaths per 100,000).
• Mortality among blacks and whites in the highest income group (690 deaths and 542 deaths per 100,000, respectively) was higher than mortality among Latinos and Asians in all income groups, even the lowest (519 deaths and 482 deaths per 100,000, respectively).
0
250
500
750
1000
LA County Black White Latino Asian
< $42.2k $42.2k - $59.4k $59.4k - $81.6k > $81.6k
Age-
Adju
sted
Rat
e pe
r 100
,000
Data sources: Median Household Income (MHHI): U.S. Census Bureau, 2013-2017 American Community Survey 5-Year Estimates [B19013: MEDIAN HOUSEHOLD INCOME IN THE PAST 12 MONTHS – Universe: Households] Population: July 1, 2017 Population Estimates, prepared by Hedderson Demographic Services for Los Angeles County Internal Services Department, 5/7/2018

10
Leading Causes of Death
The leading causes of death for 2017 are shown in Table 3. More detailed information on the leading causes of death and the trends are presented in Appendix B (Tables B-1 to B-6) and Appendix D (Tables D-1 to D-16 and Figure D-1). Highlights include the following: Table 3: Mortality Rates and Number of Deaths for the Top 10 Leading Causes of Death
Largest 10-Year Increase in Mortality Rate was for Alzheimer’s Disease & Hypertension
• The leading cause of death¥ in Los Angeles County in 2017 was coronary heart disease, accounting for 11,211 (17.7%) of the 63,429 total deaths that occurred in the county population that year, equating to a mortality rate of 103 deaths per 100,000.
• The next five leading causes of death were Alzheimer’s disease (39 deaths per 100,000), stroke (35 deaths per 100,000), chronic obstructive pulmonary disease (28 deaths per 100,000), diabetes (25 deaths per 100,000), and lung cancer (24 deaths per 100,000).
• The mortality rate associated with most of the leading 10 causes of death decreased between 2008 and 2017, with the largest decrease seen for coronary heart disease mortality (29% decrease). A notable exception was Alzheimer’s disease, which increased 71% over this 10-year period. Liver disease/cirrhosis increased 5%.
¥ Causes of death are based on the underlying cause of death reported on the death certificate. Additional information regarding this is presented in Appendix A.
2008-2017# of Deaths Death Rate* # of Deaths Death Rate* Death Rate % Change
Coronary Heart Disease (CHD) 13,428 145.6 11,211 102.9 -29%Alzheimer's Disease 2,121 22.6 4,179 38.7 71%Stroke 3,280 35.9 3,749 35.0 -2%COPD¥ 2,889 32.3 2,927 27.6 -15%Diabetes Mellitus 2,190 24.2 2,658 24.7 2%Lung Cancer 2,910 32.9 2,556 24.0 -27%Pneumonia/Influenza 2,171 23.6 1,957 18.4 -22%Colorectal Cancer 1,365 15.0 1,449 13.4 -10%Liver Disease/Cirrhosis 1,134 11.9 1,412 12.5 5%Hypertension 900 10.1 1,402 13.0 29%
¥Chronic Obstructive Pulmonary Disease
2008 2017
*Age-adjusted rate per 100,000. The death rates for 2008-2009 were recalculated using new population estimates based on the 2010 Census, therefore, death rates in this report may differ from rates previously published.

11
• The leading causes of death in 2017 varied by age group (Appendix B, Table B-3). For example,
o among those 5-14 years of age, motor vehicle crash was the leading cause of death;
o among those 15-24 years of age, homicide was the leading cause of death; o among those 25-44 years of age, drug overdose was the leading cause of death;
and o among those 45 and older, coronary heart disease was the leading cause of death.
• Significant disparities in cause-specific mortality rates were observed across gender and
racial/ethnic groups (Appendix B, Tables B-1 to B-6; Appendix D, Tables D-1 to D-16). For example, in 2017,
o coronary heart disease mortality was approximately two times higher among blacks (158 deaths per 100,000) and one and one-half times higher among whites (117 deaths per 100,000) than among Latinos (81 deaths per 100,000), and Asians (75 per 100,000), with the highest rate among black men (202 deaths per 100,000) and the lowest rate among Asian women (57 deaths per 100,000);
o homicide mortality was higher among men than women for all racial/ethnic groups; and was nearly 20 times higher among black men (38 deaths per 100,000) than among Asian men (2 deaths per 100,000) (Figure 5);
Figure 5: Homicide Mortality Rate by Gender and Race/Ethnicity, 2017 Black Males Homicide Mortality Rate Substantially Higher than Other Groups
o liver disease mortality was nearly two times higher among Latinos (19 deaths per
100,000) than among blacks and whites (10 and 11 deaths per 100,000, respectively), and almost five times higher than among Asians (4 deaths per 100,000); among Latinos, the rate was nearly three times higher among men (29 deaths per 100,000) than among women (11 deaths per 100,000);
Age-
Adju
sted
Rat
e pe
r 100
,000

12
o the rate of suicide was nearly two times higher among whites (13 deaths per 100,000) than among Asians and blacks (7 deaths per 100,000) and more than two times higher than among Latinos (5 deaths per 100,000). Rates varied by gender and race/ethnicity (Figure 6)
Figure 6: Suicide Mortality Rate by Gender and Race/Ethnicity, 2017
White Males Suicide Mortality Rate Over Twice Most Other Groups
o Similar to other racial/ethnic groups, the leading cause of death for Native Hawaiians and other Pacific Islanders and for American Indians/Alaska Natives was coronary heart disease with 152 and 116 deaths, respectively.*
o The second leading cause of death for Native Hawaiians and other Pacific Islanders was diabetes (52 deaths) and the third leading cause was lung cancer (41 deaths).*
o Stroke was the second leading cause of death (40 deaths) for American Indians/Alaska Natives, and diabetes was the third leading cause of death (38 deaths).*
• Significant disparities in cause-specific mortality were also observed across geographic areas (Appendix D, Tables D-1 to D-16). For example,
o the rate of homicide was nearly two times higher in the South LA SPA (15 deaths per 100,000) than in any other SPA; and
o motor vehicle crash mortality was nearly two times higher in the Antelope Valley SPA (23 deaths per 100,000) than in any other SPA.
*The number of deaths from 2014-2017 were combined due to small sample sizes for Native Hawaiians and other Pacific Islanders (NHOPIs) and for American Indians/Alaska Natives (AIANs).
Age-
Adju
sted
Rat
e pe
r 100
,000

13
Leading Causes of Premature Death
The leading causes of premature death, or years of potential life lost (YPLLs) before the age of 75, were assessed for the total county population (Table 4), and by gender, race/ethnicity, and SPA. Detailed results are provided in Appendix C (Tables C-1 to C-5). Highlights are provided below:
Table 4: Years of Potential Life Lost (YPLLs) for the Top 10 Leading Causes of Premature
Death, 2017 Unintentional Drug Overdose Was the Second Leading Cause of Premature Death
• The leading cause of premature death in the overall county population was coronary heart disease, followed by drug overdose, suicide, motor vehicle crashes, and homicide.
• The leading causes of premature death varied by gender, race/ethnicity, and geographic region. For example,
o although coronary heart disease was the leading cause of premature death for both males and females, homicide was the second leading cause among males while breast cancer was the second leading cause among females;
o coronary heart disease was also the leading cause of premature death among the four racial/ethnic groups examined; however, drug overdose was the second leading cause among whites, homicide the second leading cause among blacks and Latinos, and suicide the second leading cause among Asians;
o coronary heart disease was the leading cause of premature death for Native Hawaiians and other Pacific Islanders and for American Indians/Alaska Natives;*
o the second and third leading causes of premature death for Native Hawaiian and other Pacific Islanders were conditions originating in the perinatal period and homicide, respectively;*
o for American Indians/Alaska Natives, the second leading cause of premature death was drug overdose and the third leading cause was liver disease/cirrhosis;*
*The number of deaths from 2014-2017 were combined due to small sample sizes for Native Hawaiians and other Pacific Islanders (NHOPIs) and American Indians/Alaska Natives (AIANs).
Rank Leading Cause of Premature Death YPLLs1 CHD 51,5152 Drug Overdose (Unintentional) 27,7433 Suicide 26,0164 Motor Vehicle Crash 25,9155 Homicide 24,7696 Liver Disease/Cirrhosis 21,6047 Diabetes Mellitus 19,1028 Stroke 16,0859 Lung Cancer 13,427
10 Breast Cancer 12,224

14
o among the SPAs, coronary heart disease was the leading cause of premature death in San Fernando Valley (SPA 2), San Gabriel Valley (SPA 3), Metro LA (SPA 4), East (SPA 7), and South Bay (SPA 8), whereas motor vehicle crashes were the leading cause of premature death in Antelope Valley (SPA 1), drug overdose the leading cause in West LA (SPA 5), and homicide the leading cause in South LA (SPA 6).
Discussion
These findings indicate both favorable and unfavorable recent trends in mortality in Los Angeles County. On the positive side, mortality for many of the leading causes of death have declined in recent years. Of note, mortality from coronary heart disease, the leading cause of death in the county population, declined by approximately one-third between 2008-2017. This pattern has also been observed nationally and has been attributed to improved medical care for those with heart disease, more aggressive treatment of risk factors such as high blood pressure and elevated cholesterol and other lipid levels, and successful primary prevention efforts focused on reducing smoking, increasing physical activity, and improving nutrition.2 The decline in lung cancer mortality also reflects successful prevention efforts that have greatly reduced rates of smoking, though concern remains that the recent proliferation of electronic cigarette use (i.e., vaping) among youth and young adults may produce a new generation addicted to nicotine.3
Despite these positive trends, the historical decline in overall mortality in the county population appears to have stalled since 2012 and in some groups mortality is even increasing. Further research is needed to better understand the factors contributing to this lack of continued progress in reducing mortality. Studies suggest that illicit and prescription drug misuse and mental health conditions have contributed to a recent increase in mortality in some regions of the country.4,5,6 In Los Angeles County, drug misuse is also a likely contributing factor, as the rate of drug overdose deaths increased 28% between 2008 and 2017. In addition, both the number and the rate of deaths associated with homelessness have increased across the county in recent years.7
Though mortality has declined in the county for many of the leading causes of death, there has been a lack of progress in reducing the large, long-standing disparities in mortality seen across demographic groups. These disparities stem from systemic inequities, in many cases rooted in racism, that persist in many of our institutions and have led to these profound health inequities. For example, inequities in access to high-quality education and employment opportunities as well as discriminatory housing practices have created socioeconomic inequities that, in turn, have contributed to the disproportionately high rates of mortality among blacks and Native Americans.8,9 Studies have shown that negative social experiences, such as discrimination, are also linked to higher mortality rates.10 Poor health outcomes and disproportionately high mortality rates among Native Hawaiians and other Pacific Islanders also have been attributed to socioeconomic disadvantages and historical trauma resulting from colonization.11,12 The relatively low mortality rate among Latinos, despite having a high level of
15
poverty, has been observed throughout the southwest U.S. and has been referred to as the Latino health paradox,13 thought in part to reflect a generally strong health profile among immigrant Latinos. However, high rates of obesity and diabetes among both U.S.-born and immigrant Latinos in the county14 threaten to eliminate this health advantage in the coming decades.
Large disparities in mortality across geographic regions of the county have also persisted over the past decade, with the highest mortality rates seen in the Antelope Valley and South Los Angeles SPAs. However, the patterns of mortality across these regions differ. For example, although the rate of homicide decreased 29% countywide from 2008 to 2017, the rate remained two times higher in the South Los Angeles SPA than in any other SPA. In the Antelope Valley SPA, the mortality rate associated with motor vehicle crashes was two times higher than in any other SPA, possibly reflecting longer distances traveled at high speeds on open highways among residents of this SPA relative to other SPAs.
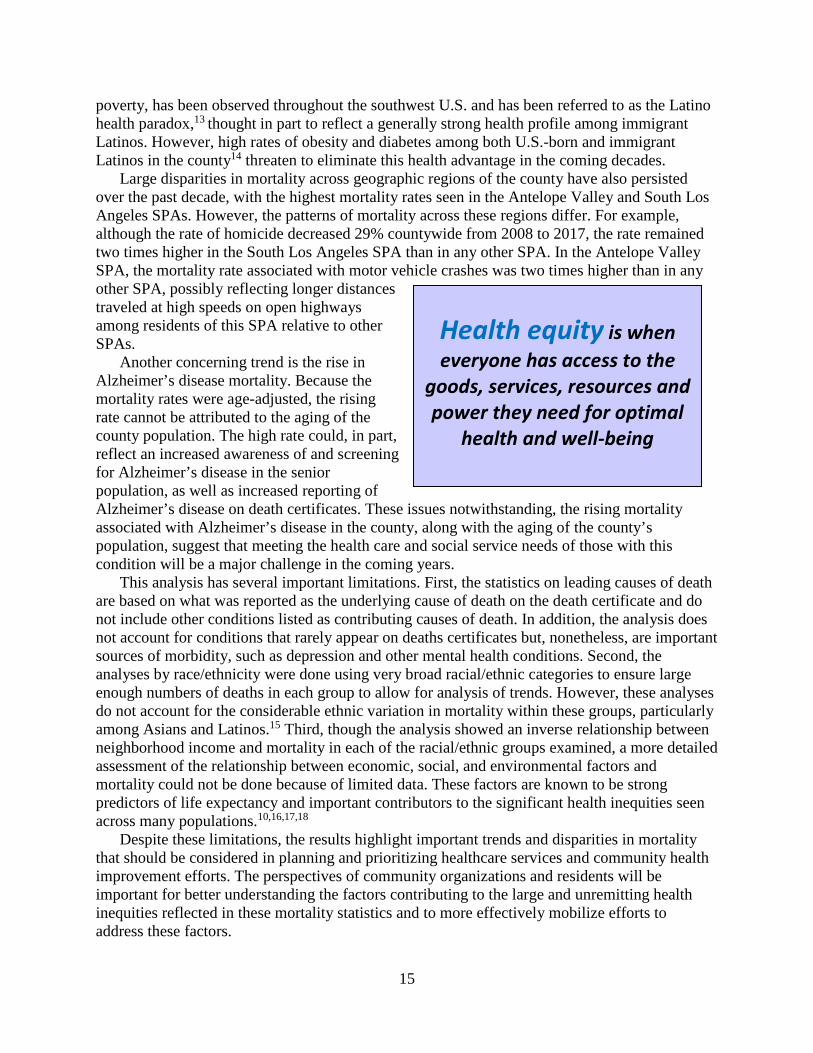
Another concerning trend is the rise in Alzheimer’s disease mortality. Because the mortality rates were age-adjusted, the rising rate cannot be attributed to the aging of the county population. The high rate could, in part, reflect an increased awareness of and screening for Alzheimer’s disease in the senior population, as well as increased reporting of Alzheimer’s disease on death certificates. These issues notwithstanding, the rising mortality associated with Alzheimer’s disease in the county, along with the aging of the county’s population, suggest that meeting the health care and social service needs of those with this condition will be a major challenge in the coming years.
This analysis has several important limitations. First, the statistics on leading causes of death are based on what was reported as the underlying cause of death on the death certificate and do not include other conditions listed as contributing causes of death. In addition, the analysis does not account for conditions that rarely appear on deaths certificates but, nonetheless, are important sources of morbidity, such as depression and other mental health conditions. Second, the analyses by race/ethnicity were done using very broad racial/ethnic categories to ensure large enough numbers of deaths in each group to allow for analysis of trends. However, these analyses do not account for the considerable ethnic variation in mortality within these groups, particularly among Asians and Latinos.15 Third, though the analysis showed an inverse relationship between neighborhood income and mortality in each of the racial/ethnic groups examined, a more detailed assessment of the relationship between economic, social, and environmental factors and mortality could not be done because of limited data. These factors are known to be strong predictors of life expectancy and important contributors to the significant health inequities seen across many populations.10,16,17,18
Despite these limitations, the results highlight important trends and disparities in mortality that should be considered in planning and prioritizing healthcare services and community health improvement efforts. The perspectives of community organizations and residents will be important for better understanding the factors contributing to the large and unremitting health inequities reflected in these mortality statistics and to more effectively mobilize efforts to address these factors.
Health equity is when everyone has access to the
goods, services, resources and power they need for optimal
health and well-being

16
References
1. Haskins J. Suicide, opioids tied to ongoing fall in US life expectancy: Third year of drop. The Nation's Health February/March 2019, 49 (1) 1-10; http://thenationshealth.aphapublications.org/content/49/1/1.2
2. Benjamin EJ, Varani SS, Callaway CW, et.al.; Heart Disease and Stroke Statistics – 2018 Update; American Heart Association; American Heart Association – Circulation; Vol. 127(12). https://www.ahajournals.org/doi/full/10.1161/cir.0000000000000558 (accessed 10/9/2019).
3. Cullen KA, Ambrose BK, Gentzke AS, Apelberg BJ, Jamal A, King BA. Notes from the Field: Use of Electronic Cigarettes and Any Tobacco Product Among Middle and High School Students — United States, 2011–2018. MMWR Morb Mortal Wkly Rep. 2018 Nov 16; 67(45): 1276–1277. Published online 2018 Nov 16. doi: 10.15585/mmwr.mm6745a5
4. Cunningham TJ, Croft JB, Liu Y, Lu H, Eke PI, Giles WH. Vital Signs: Racial Disparities in Age-Specific Mortality Among Blacks or African Americans – United States, 1999-2015. MMWR Morb Mortality Wkly Rep. 2017;66:444-456.
5. Hall JE, Moonesinghe R, Bouye K, Penman-Aguilar A. Racial/Ethnic Disparities in Mortality: Contributions and Variations by Rurality in the United States, 2012-2015. Int J Environ Res Public Health. 2019;16(3):436. Published 2019 Feb 2. https://www.mdpi.com/1660-4601/16/3/436/htm
6. Gomes T, Tadrous M, Mamdani MM, Paterson JM, Juurlink DN. The Burden of Opioid-Related Mortality in the United States. JAMA Netw Open. Published online June 01, 2018:1(2):e180217. https://jamanetwork.com/journals/jamanetworkopen/fullarticle/2682878
7. Los Angeles County Department of Public Health, Center for Health Impact Evaluation, Recent Trends In Mortality Rates and Causes of Death Among People Experiencing Homelessness in Los Angeles County, October 2019.
8. Cunningham TJ, Croft JB, Liu Y, Lu H, Eke PL, Giles WH. Vital Signs: Racial Disparities in Age-Specific Mortality Among Blacks or African Americans – United States, 1999-2018. MMWR Morb Mortal Wkly Rep 2017;66:444-456. http://dx.doi.org/10.15585/mmwr.mm6617e1
9. Hall JE, Moonesinghe R, Bouye K, Penman-Aguilar A. Racial/Ethnic Disparities in Mortality: Contributions and Variations by Rurality in the United States, 2012-2015. Int J Environ Res Public Health. 2019;16(3):436. Published 2019 Feb 2. https://www.mdpi.com/1660-4601/16/3/436
10. Galea A, Tracy M, Hoggatt KJ, DiMaggio C, Karpati A. Estimated Deaths Attributable to Social Factors in the United States. Am J Public Health. 2011;101:1456–1465. https://ajph.aphapublications.org/doi/abs/10.2105/AJPH.2010.300086

17
11. Panapasa SV, Mau MK, Williams DR, McNally JW. Mortality patterns of Native Hawaiians across their lifespan: 1990-2000. Am J Public Health. 2010;100(11):2304–2310.
12. Mokuau, N, DeLeon PH, Kaholokula, JK, Soares S, Tsark J, Haia C. (2016). Challenges and promise of health equity for Native Hawaiians. National Academy of Medicine, Perspectives, 1-10.
13. Tamingco, M. T. (2007). Revisiting the Latino health paradox. Los Angeles: Tomas Rivera Policy Center.
14. Los Angeles County Health Survey. Data Tables. Office of Health Assessment and Epidemiology, Los Angeles County Department of Public Health. http://www.publichealth.lacounty.gov/ha/LACHSDataTopics2018.htm#D; http://www.publichealth.lacounty.gov/ha/LACHSDataTopics2018.htm#O (accessed 10/15/2019)
15. Lewis K, Burd-Sharps. A Portrait of Los Angeles County; Los Angeles County Human Development Report 2017-2018. https://ssrc-static.s3.amazonaws.com/moa/PoLA%20Full%20Report.pdf
16. Doubeni CA, Schootman M, Major JM, Torres Stone RA, Laiyamo AO, et.al. Health Status, Neighborhood Socioeconomic Context, and Premature Mortality in the United States: The National Institutes of Health-AARP Diet and Health Study. Am J Public Health. 2012;102:680–688. https://ajph.aphapublications.org/doi/10.2105/AJPH.2011.300158
17. Lynch JW, Kaplan GA, Pamuk ER, Cohen RD, Heck KE, Balfour JL, Yen IH. Income Inequality and Mortality in Metropolitan Areas of the United States. Am J Public Health. 1998;88:1074-1080.
18. Lantz PM, House JS, Lepkowski JM, Williams DR, Mero RP, Chen J. Socioeconomic Factors, Health Behaviors, and Mortality: Results From a Nationally Representative Prospective Study of US Adults. JAMA, 1998;279:1703-1708.

18
APPENDIX A
TECHNICAL NOTES
When a death occurs in California, state law requires that a death certificate be registered within eight days of death and before a decedent is buried or cremated. The death certificate is a legal document that serves as a permanent record of the death of an individual. To complete a certificate of death, the funeral director or medical facility collects identifying and demographic information about the decedent from family members and medical records. The decedent’s physician or the coroner provides information about the medical conditions or events that precipitated the death. When the death certificate is complete, it is registered with the local registrar using the Electronic Death Registration System.1 Then, the local registrar submits the document to the State Registrar of Vital Records. State records are then aggregated by the National Center for Health Statistics to create an annual national mortality database. There is a delay of about two years before the annual national mortality database is available for use, although the use of electronic death registration systems are helping to shorten this timeframe. Errors, omissions, and inaccuracies can occur when the death certificate is completed and later when it is processed. This report summarizes information obtained from certificates of death (Figure A-1) for all Los Angeles County residents who died in 2017 and mortality trends for 2008 through 2017. While it cannot provide information about every cause of death, it lays the groundwork for future analyses and provides valuable information for public health and medical research, evaluation of prevention and intervention programs, community needs assessments, policy development, and program planning. Certificates of death data represent an important endpoint in the spectrum of disease and help us to better understand the burden of disease in our community. Because certificates of death are required by state law, they provide a readily available, and consistently and continuously collected, source of information on a wide range of health conditions.
1 The Electronic Death Registration System (EDRS) is an Internet system for death certificate origination and registration that enables coroners, funeral directors, doctors, and hospitals to submit death certificates for registration 24 hours per day. This results in improved efficiency, faster registration, and improved data quality. EDRS was first implemented in Los Angeles County in October 2007.

19
Figure A-1: Sample California Certificate of Death

20
PREMATURE DEATH: WHAT IS IT? For this report, we defined premature death as death that occurred before 75 years of age, a
standard cut-off used in public health. In 2017, 44% of the people who died were less than 75 years of age. MEASURES
This report provides the numbers of deaths, death rates, and years of potential life lost (YPLL; before age 75) for the leading causes of death and premature death for 2017 and the ten-year period of 2008 through 2017 for Los Angeles County residents. The variables included in the analysis are age at death, gender, race/ethnicity, Service Planning Area of residence, and underlying cause of death. To protect the identity of decedents, the exact number of deaths was not provided if there were fewer than five deaths in a particular group.
If we expect everyone to live to at least 75 years of age, then people who die younger are considered to have died prematurely. For example, a person who died at 63 years of age lost 12 years of expected life, while a person who died at age 80 did not lose any years of expected life. For everyone who died during the year, we calculated the years of expected life that were lost if they died before 75. By adding up the total YPLL for each cause of death, we identified those causes of death responsible for the greatest amount of premature death.
A standardized coding system, the International Classification of Diseases (ICD), was used to classify causes of death and to group similar causes of death into categories for analysis.2 The cause-of-death groups were based on categories developed by the National Center for Health Statistics.3 A full list of the causes of death in this report is provided in Tables A-1a and A-1b. To identify the leading causes of death, cause-of-death groups were ranked by the number of deaths in each group. If two groups had the same number of deaths, then the cause of death that resulted in the most YPLL was ranked first. To identify the leading causes of premature death, the groups were ranked by the YPLL in each group. If two causes of death resulted in the same number of YPLL, then the group that resulted in the greatest number of deaths was ranked first.
When a person dies, it is likely that several factors or conditions contributed to the death. For this report, we analyzed the underlying cause of death, which is the condition that most directly caused the death. By using a single cause of death rather than considering all the conditions present at the time of death, the number of deaths and rates in this report do not reflect the full impact of certain diseases and conditions.4
2 International statistical classification of diseases and related health problems, tenth revision. Geneva: World Health Organization, 1996. 3 National Center for Health Statistics, National Vital Statistics System. ICD–10 cause-of-death lists for tabulating mortality statistics (updated September 2018 to include WHO updates to ICD–10 for data year 2017). NCHS Instruction Manual, part 9. Hyattsville, MD. 2018. 4 Redelings MD, Sorvillo F, Simon P. A comparison of underlying cause and multiple causes of death: U.S. vital statistics, 2000-2001. Epidemiology. 2006 Jan;17(1):100-3.
21
Table A-1a: ICD Codes for Leading Causes of Death No. Cause of death ICD10 codes
1 Accidental discharge of firearms W32, W33, W34.
2 Accidental drowning and submersion W65, W66, W67, W68, W69, W70, W73, W74.
3 Accidental exposure to smoke, fire and flames X00, X01, X02, X03, X04, X05, X06, X08, X09.
4 Accidental poisoning and exposure to noxious substances excluding drug overdose
X46, X47, X48, X49.
5 Acute and rapidly progressive nephritic and nephrotic syndrome
N00, N01, N04.
6 Acute bronchitis and bronchiolitis J20, J21.
7 Acute poliomyelitis A80.
8 Acute rheumatic fever and chronic rheumatic heart diseases
I00, I01, I02, I05, I06, I07, I08, I09.
9 All other and unspecified malignant neoplasms C17, C23, C24, C26, C30, C31, C37, C38, C39, C40, C41, C44, C45, C46, C47, C48, C49, C51, C52, C57, C58, C60, C62, C63, C66, C68, C69, C73, C74, C75, C76, C77, C78, C79, C80, C97.
10 Alzheimer's disease G30.
11 Anemias D50, D51, D52, D53, D55, D56, D57, D58, D59, D60, D61, D62, D63, D64.
12 Aortic aneurysm and dissection I71.
13 Arthropod-borne viral encephalitis A83, A84, A85.2.
14 Asthma J45, J46.
15 Atherosclerosis I70.
16 Breast cancer C50.
17 Certain conditions originating in the perinatal period
P00.0, P00.1, P00.2, P00.3, P00.4, P00.5, P00.6, P00.7, P00.8, P00.9, P01.0, P01.1, P01.2, P01.3, P01.4, P01.5, P01.6, P01.7, P01.8, P01.9, P02.0, P02.1, P02.2, P02.3, P02.4, P02.5, P02.6, P02.7, P02.8, P02.9, P03, P04, P05, P07.0, P07.1, P07.2, P07.3, P08, P10, P11, P12, P13, P14, P15, P20, P21, P22, P23, P24, P25, P26, P27, P28.0, P28.1, P28.2, P28.3, P28.4, P28.5, P28.8, P28.9, P29, P35, P36, P37, P38, P39, P50, P51, P52, P53, P54, P55, P56, P57, P58, P59, P60, P61, P70.0, P70.1, P70.2, P70.3, P70.4, P70.8, P70.9, P71, P72, P74, P75, P76, P77, P78, P80, P81, P83.0, P83.1, P83.2, P83.3, P83.4, P83.5, P83.6, P83.8, P83.9, P90, P91, P92, P93, P94, P95, P96.
18 Certain other intestinal infections A04, A07, A08, A09.
19 CHD (Coronary heart disease) I20, I21, I22, I23, I24, I25.0, I25.1, I25.2, I25.3, I25.4, I25.5, I25.6, I25.8, I25.9.
20 Cholelithiasis and other disorders of gallbladder
K80, K81, K82.
21 Chronic glomerulonephritis, nephritis and nephritis not specified as acute or chronic, and renal sclerosis unspecified
N02, N03, N05, N06, N07, N26.
22 Colorectal Cancer C18, C19, C20, C21.

22
No. Cause of death ICD10 codes
23 Complications of medical and surgical care Y40, Y41, Y42, Y43, Y44, Y45, Y46, Y47, Y48, Y49, Y50, Y51, Y52, Y53, Y54, Y55, Y56, Y57, Y58, Y59, Y60, Y61, Y62, Y63, Y64, Y65, Y66, Y69, Y70, Y71, Y72, Y73, Y74, Y75, Y76, Y77, Y78, Y79, Y80, Y81, Y82, Y83, Y84, Y88.
24 Congenital malformations, deformations and chromosomal abnormalities
Q00, Q01, Q02, Q03, Q04, Q05, Q06, Q07, Q10, Q11, Q12, Q13, Q14, Q15, Q16, Q17, Q18, Q20, Q21, Q22, Q23, Q24, Q25, Q26, Q27, Q28, Q30, Q31, Q32, Q33, Q34, Q35, Q36, Q37, Q38, Q39, Q40, Q41, Q42, Q43, Q44, Q45, Q50, Q51, Q52, Q53, Q54, Q55, Q56, Q60, Q61, Q62, Q63, Q64, Q65, Q66, Q67, Q68, Q69, Q70, Q71, Q72, Q73, Q74, Q75, Q76, Q77, Q78, Q79, Q80, Q81, Q82, Q83, Q84, Q85, Q86, Q87, Q89, Q90, Q91.0, Q91.1, Q91.2, Q91.3, Q91.4, Q91.5, Q91.6, Q91.7, Q92, Q93, Q95, Q96, Q97, Q98, Q99.
25 COPD (Chronic obstructive pulmonary disease) J40, J41, J42, J43, J44.
26 Diabetes mellitus E10, E11, E12, E13, E14.
27 Discharge of firearms, undetermined intent Y22, Y23, Y24.
28 Diseases of appendix K35, K36, K37, K38.
29 Drug overdose (Unintentional) X40, X41, X42, X43, X44, X45.
30 Falls W00, W01, W02, W03, W04, W05, W06, W07, W08, W09, W10, W11, W12, W13, W14, W15, W16, W17, W18, W19.
31 Hernia K40, K41, K42, K43, K44, K45, K46.
32 HIV (Human immunodeficiency virus) B20, B21, B22, B23, B24.
33 Hodgkin's disease C81.
34 Homicide U01.0, U01.1, U01.2, U01.3, U01.4, U01.5, U01.6, U01.7, U01.8, U01.9, U02, X85, X86, X87, X88, X89, X90, X91, X92, X93, X94, X95, X96, X97, X98, X99, Y00, Y01, Y02, Y03, Y04, Y05, Y06, Y07, Y08, Y09, Y87.1.
35 Hyperplasia of prostate N40.
36 Hypertension I10, I12, I15.
37 Hypertensive heart and renal disease I13.
38 Hypertensive heart disease I11.
39 In situ neoplasms, benign neoplasms and neoplasms of uncertain or unknown behavior
D00, D01, D02, D03, D04, D05, D06, D07, D08, D09, D10, D11, D12, D13, D14, D15, D16, D17, D18, D19, D20, D21, D22, D23, D24, D25, D26, D27, D28, D29, D30, D31, D32, D33, D34, D35, D36, D37, D38, D39, D40, D41, D42, D43, D44, D45, D46, D47, D48.
40 Infections of kidney N10, N11, N12, N13.6, N15.1.
41 Inflammatory diseases of female pelvic organs N70, N71, N72, N73, N74, N75, N76.
42 Legal intervention Y35, Y89.0.
43 Leukemia C91, C92, C93, C94, C95.
44 Liver disease/cirrhosis K70, K73, K74.

23
No. Cause of death ICD10 codes
45 Lung Cancer C33, C34.
46 Malaria B50, B51, B52, B53, B54.
47 Malignant melanoma of skin C43.
48 Malignant neoplasm of bladder C67.
49 Malignant neoplasm of cervix uteri C53.
50 Malignant neoplasm of esophagus C15.
51 Malignant neoplasm of larynx C32.
52 Malignant neoplasm of ovary C56.
53 Malignant neoplasm of pancreas C25.
54 Malignant neoplasm of stomach C16.
55 Malignant neoplasms of corpus uteri and uterus, part unspecified
C54, C55.
56 Malignant neoplasms of kidney and renal pelvis C64, C65.
57 Malignant neoplasms of lip, oral cavity and pharynx
C00, C01, C02, C03, C04, C05, C06, C07, C08, C09, C10, C11, C12, C13, C14.
58 Malignant neoplasms of liver and intrahepatic bile ducts
C22.
59 Malignant neoplasms of meninges, brain and other parts of central nervous system
C70, C71, C72.
60 Malnutrition E40, E41, E42, E43, E44, E45, E46.
61 Measles B05.
62 Meningitis G00, G03.
63 Meningococcal infection A39.
64 Motor vehicle crash V02, V03, V04, V09.0, V09.2, V12, V13, V14, V19.0, V19.1, V19.2, V19.4, V19.5, V19.6, V20, V21, V22, V23, V24, V25, V26, V27, V28, V29, V30, V31, V32, V33, V34, V35, V36, V37, V38, V39, V40, V41, V42, V43, V44, V45, V46, V47, V48, V49, V50, V51, V52, V53, V54, V55, V56, V57, V58, V59, V60, V61, V62, V63, V64, V65, V66, V67, V68, V69, V70, V71, V72, V73, V74, V75, V76, V77, V78, V79, V80.3, V80.4, V80.5, V81.0, V81.1, V82.0, V82.1, V83, V84, V85, V86, V87.0, V87.1, V87.2, V87.3, V87.4, V87.5, V87.6, V87.7, V87.8, V88.0, V88.1, V88.2, V88.3, V88.4, V88.5, V88.6, V88.7, V88.8, V89.0, V89.2.
65 Multiple myeloma and immunoproliferative neoplasms
C88, C90.
66 Non-Hodgkin's lymphoma C82, C83, C84, C85.
67 Operations of war and their sequelae Y36, Y89.1.
68 Other and unspecified events of undetermined intent and their sequelae
Y10, Y11, Y12, Y13, Y14, Y15, Y16, Y17, Y18, Y19, Y20, Y21, Y25, Y26, Y27, Y28, Y29, Y30, Y31, Y32, Y33, Y34, Y87.2, Y89.9.
69 Other and unspecified infectious and parasitic diseases and their sequelae
A00, A05, A20, A21, A22, A23, A24, A25, A26, A27, A28, A30, A31, A32, A33, A34, A35, A36, A42, A43, A44, A48, A49, A54, A55, A56, A57, A58, A59, A60, A63, A64, A65, A66, A67, A68, A69, A70, A71, A74,

24
No. Cause of death ICD10 codes
A75, A77, A78, A79, A81, A82, A85.0, A85.1, A85.8, A86, A87, A88, A89, A92, A93, A94, A95, A96, A97, A98, A99, B00, B01, B02, B03, B04, B06, B07, B08, B09, B25, B26, B27, B30, B33, B34, B35, B36, B37, B38, B39, B40, B41, B42, B43, B44, B45, B46, B47, B48, B49, B55, B56, B57, B58, B59, B60, B64, B65, B66, B67, B68, B69, B70, B71, B72, B73, B74, B75, B76, B77, B78, B79, B80, B81, B82, B83, B85, B86, B87, B88, B89, B90, B91, B92, B93, B94, B95, B96, B97, B98, B99.
70 Other and unspecified malignant neoplasms of lymphoid, hematopoietic and related tissue
C96.
71 Other and unspecified non-transport accidents and their sequelae
W20, W21, W22, W23, W24, W25, W26, W27, W28, W29, W30, W31, W35, W36, W37, W38, W39, W40, W41, W42, W43, W44, W45, W46, W49, W50, W51, W52, W53, W54, W55, W56, W57, W58, W59, W60, W64, W75, W76, W77, W78, W79, W80, W81, W83, W84, W85, W86, W87, W88, W89, W90, W91, W92, W93, W94, W99, X10, X11, X12, X13, X14, X15, X16, X17, X18, X19, X20, X21, X22, X23, X24, X25, X26, X27, X28, X29, X30, X31, X32, X33, X34, X35, X36, X37, X38, X39, X50, X51, X52, X53, X54, X57, X58, X59, Y86.
72 Bronchiectasis J47.
73 Other complications of pregnancy, childbirth and the puerperium
O10, O11, O12, O13, O14, O15, O16, O20, O21, O22, O23, O24, O25, O26, O28, O29, O30, O31, O32, O33, O34, O35, O36, O40, O41, O42, O43, O44, O45, O46, O47, O48, O60, O61, O62, O63, O64, O65, O66, O67, O68, O69, O70, O71, O72, O73, O74, O75, O80, O81, O82, O83, O84, O85, O86, O87, O88, O89, O90, O91, O92, O94, O95, O96, O97, O98, O99.
74 Other diseases of arteries, arterioles and capillaries
I72, I73, I74, I75, I76, I77, I78.
75 Other diseases of respiratory system J00, J01, J02, J03, J04, J05, J06, J30, J31, J32, J33, J34, J35, J36, J37, J38, J39, J67, J70, J80, J81, J82, J84, J85, J86, J90, J91, J92, J93, J94, J95, J96, J98.
76 Other disorders of circulatory system I80, I81, I82, I83, I85, I86, I87, I88, I89, I95, I97, I98, I99.
77 Other disorders of kidney N25, N27.
78 Other heart diseases I26, I27, I28, I30, I31, I32, I33, I34, I35, I36, I37, I38, I39, I40, I42, I43, I44, I45, I46, I47, I48, I49, I50, I51.
79 Other nutritional deficiencies E50, E51, E52, E53, E54, E55, E56, E58, E59, E60, E61, E63, E64.
80 Other tuberculosis A17, A18, A19.
81 Parkinson's disease G20, G21.
82 Peptic ulcer K25, K26, K27, K28.
83 Pneumoconioses and chemical effects J60, J61, J62, J63, J64, J65, J66, J68.
84 Pneumonia/Influenza J09, J10, J11, J12, J13, J14, J15, J16, J17, J18.
85 Pneumonitis due to solids and liquids J69.
86 Pregnancy with abortive outcome O00, O01, O02, O03, O04, O05, O06, O07.
87 Prostate cancer C61.
88 Renal failure N17, N18, N19.
89 Residual D65, D66, D67, D68, D69, D70, D71, D72, D73, D74, D75, D76, D77, D80, D81, D82, D83, D84, D85, D86, D89, E00, E01, E02, E03, E04, E05, E06, E07, E15, E16, E20, E21, E22, E23, E24, E25, E26, E27, E28, E29, E30, E31, E32, E34.0, E34.1, E34.2, E34.3, E34.4, E34.5, E34.8, E34.9, E65, E66, E67, E68,

25
No. Cause of death ICD10 codes
E70, E71, E72, E73, E74, E75, E76, E77, E78, E79, E80, E83, E84, E85, E86, E87, E88, E89, E90, F00, F01, F02, F03, F04, F05, F06, F07, F09, F10, F11, F12, F13, F14, F15, F16, F17, F18, F19, F20, F21, F22, F23, F24, F25, F28, F29, F30, F31, F32, F33, F34, F38, F39, F40, F41, F42, F43, F44, F45, F48, F50, F51, F52, F53, F54, F55, F59, F60, F61, F62, F63, F64, F65, F66, F68, F69, F70, F71, F72, F73, F79, F80, F81, F82, F83, F84, F88, F89, F90, F91, F92, F93, F94, F95, F98, F99, G04, G05, G06, G07, G08, G09, G10, G11, G12.0, G12.1, G12.2, G12.8, G12.9, G13, G14, G23, G24, G25, G31, G32, G35, G36, G37, G40, G41, G43, G44, G45, G46, G47, G50, G51, G52, G53, G54, G55, G56, G57, G58, G59, G60, G61, G62, G63, G64, G70, G71, G72, G73, G80, G81, G82, G83, G90, G91, G92, G93.0, G93.1, G93.2, G93.3, G93.4, G93.5, G93.6, G93.7, G93.8, G93.9, G94, G95, G96, G97, G98, G99, H00, H01, H02, H03, H04, H05, H06, H10, H11, H13, H15, H16, H17, H18, H19, H20, H21, H22, H25, H26, H27, H28, H30, H31, H32, H33, H34, H35, H36, H40, H42, H43, H44, H45, H46, H47, H48, H49, H50, H51, H52, H53, H54, H55, H56, H57, H58, H59, H60, H61, H62, H65, H66, H67, H68, H69, H70, H71, H72, H73, H74, H75, H80, H81, H82, H83, H90, H91, H92, H93, K00, K01, K02, K03, K04, K05, K06, K07, K08, K09, K10, K11, K12, K13, K14, K20, K21, K22, K29, K30, K31, K50, K51, K52, K55, K56, K57, K58, K59, K60, K61, K62, K63, K64, K65, K66, K71, K72, K75, K76, K83, K85, K86, K87, K90, K91, K92, K93, L00, L01, L02, L03, L04, L05, L08, L10, L11, L12, L13, L14, L20, L21, L22, L23, L24, L25, L26, L27, L28, L29, L30, L40, L41, L42, L43, L44, L45, L50, L51, L52, L53, L54, L55, L56, L57, L58, L59, L60, L62, L63, L64, L65, L66, L67, L68, L70, L71, L72, L73, L74, L75, L80, L81, L82, L83, L84, L85, L86, L87, L88, L89, L90, L91, L92, L93, L94, L95, L97, L98, L99, M00, M01, M02, M03, M05, M06, M07, M08, M09, M10, M11, M12, M13, M14, M15, M16, M17, M18, M19, M20, M21, M22, M23, M24, M25, M30, M31, M32, M33, M34, M35, M36, M40, M41, M42, M43, M45, M46, M47, M48, M49, M50, M51, M53, M54, M60, M61, M62, M63, M65, M66, M67, M68, M70, M71, M72, M73, M75, M76, M77, M79, M80, M81, M82, M83, M84, M85, M86, M87, M88, M89, M90, M91, M92, M93, M94, M95, M96, M99, N13.0, N13.1, N13.2, N13.3, N13.4, N13.5, N13.7, N13.8, N13.9, N14.0, N14.1, N14.2, N14.3, N14.4, N15.0, N15.8, N15.9, N20, N21, N22, N23, N28, N29, N30, N31, N32, N33, N34, N35, N36, N37, N39, N41, N42, N43, N44, N45, N46, N47, N48, N49, N50, N51, N60, N61, N62, N63, N64, N80, N81, N82, N83, N84, N85, N86, N87, N88, N89, N90, N91, N92, N93, N94, N95, N96, N97, N98.
90 Respiratory tuberculosis A16.
91 Salmonella infections A01, A02.
92 Scarlet fever and erysipelas A38, A46.
93 Septicemia A40, A41.
94 Shigellosis and amebiasis A03, A06.
95 Stroke I60, I61, I62, I63, I64, I65, I66, I67, I68, I69.
96 Suicide U03, X60, X61, X62, X63, X64, X65, X66, X67, X68, X69, X70, X71, X72, X73, X74, X75, X76, X77, X78, X79, X80, X81, X82, X83, X84, Y87.0.
97 Symptoms, signs and abnormal clinical and laboratory findings, not elsewhere classified
R00, R01, R02, R03, R04, R05, R06, R07, R09, R10, R11, R12, R13, R14, R15, R16, R17, R18, R19, R20, R21, R22, R23, R25, R26, R27, R29, R30, R31, R32, R33, R34, R35, R36, R39, R40, R41, R42, R43, R44, R45, R46, R47, R48, R49, R50, R51, R52, R53, R54, R55, R56, R57, R58, R59, R60, R61, R62, R63, R64, R65, R68, R69, R70, R71, R72, R73, R74, R75, R76, R77, R78, R79, R80, R81, R82, R83, R84, R85, R86, R87, R88, R89, R90, R91, R92, R93, R94, R95, R96, R98, R99.
98 Syphilis A50, A51, A52, A53.
99 Unintentional injury: Other land transport V01, V05, V06, V09.1, V09.3, V09.9, V10, V11, V15, V16, V17, V18, V19.3, V19.8, V19.9, V80.0, V80.1, V80.2, V80.6, V80.7, V80.8, V80.9, V81.2, V81.3, V81.4, V81.5, V81.6, V81.7, V81.8, V81.9, V82.2, V82.3, V82.4, V82.5, V82.6, V82.7, V82.8, V82.9, V87.9, V88.9, V89.1, V89.3, V89.9.
100 Unintentional injury: Water, air and space, and other transport
V90, V91, V92, V93, V94, V95, V96, V97, V98, V99, Y85.
101 Unspecified acute lower respiratory infection J22, U04.
26
No. Cause of death ICD10 codes
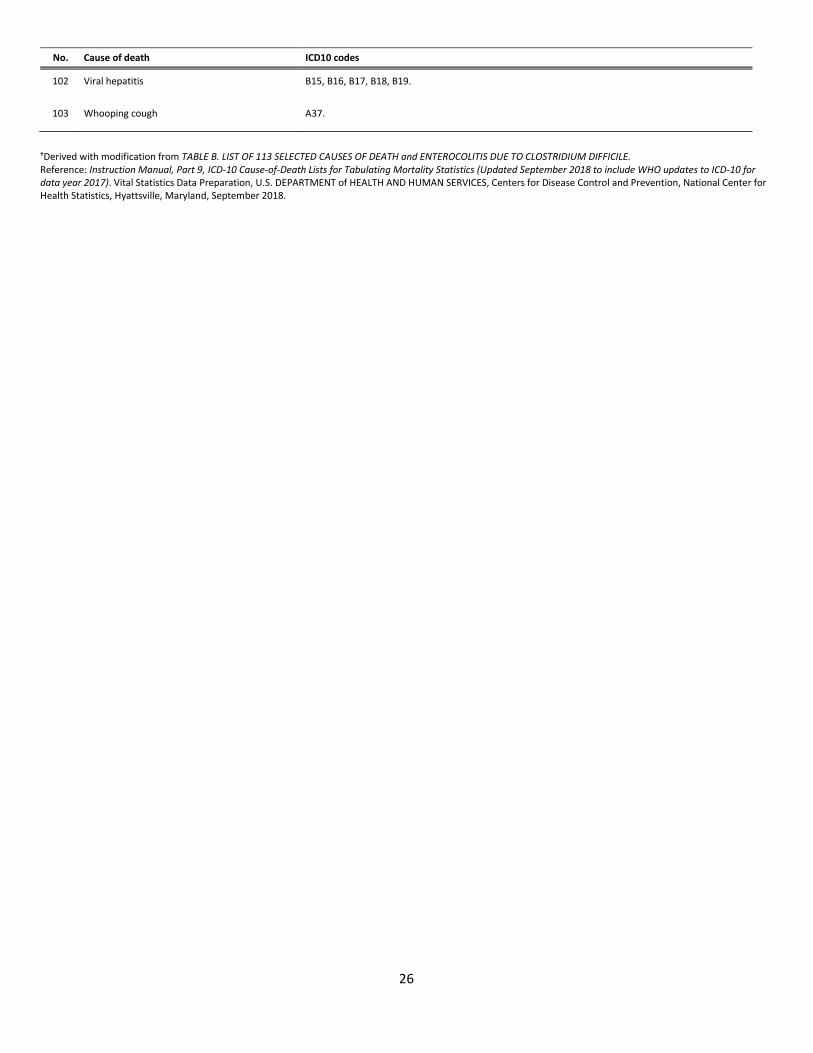
102 Viral hepatitis B15, B16, B17, B18, B19.
103 Whooping cough A37.
†Derived with modification from TABLE B. LIST OF 113 SELECTED CAUSES OF DEATH and ENTEROCOLITIS DUE TO CLOSTRIDIUM DIFFICILE. Reference: Instruction Manual, Part 9, ICD-10 Cause-of-Death Lists for Tabulating Mortality Statistics (Updated September 2018 to include WHO updates to ICD-10 for data year 2017). Vital Statistics Data Preparation, U.S. DEPARTMENT of HEALTH AND HUMAN SERVICES, Centers for Disease Control and Prevention, National Center for Health Statistics, Hyattsville, Maryland, September 2018.

27
Table A-1b: ICD Codes for Leading Causes of Infant Death No. Cause of infant death ICD10 codes
1 Accidental discharge of firearms W32, W33, W34.
2 Accidental drowning and submersion W65, W66, W67, W68, W69, W70, W73, W74.
3 Accidental inhalation and ingestion of food or other objects causing obstruction of respiratory tract
W78, W79, W80.
4 Accidental poisoning and exposure to noxious substances
X40, X41, X42, X43, X44, X45, X46, X47, X48, X49.
5 Accidental suffocation and strangulation in bed
W75.
6 Accidents caused by exposure to smoke, fire and flames
X00, X01, X02, X03, X04, X05, X06, X08, X09.
7 Acute bronchitis and acute bronchiolitis J20, J21.
8 Acute poliomyelitis A80.
9 Acute upper respiratory infections J00, J01, J02, J03, J04, J05, J06.
10 All other and unspecified diseases of digestive system
K00, K01, K02, K03, K04, K05, K06, K07, K08, K09, K10, K11, K12, K13, K14, K20, K21, K22, K23, K25, K26, K27, K28, K30, K31, K35, K36, K37, K38, K57, K58, K59, K60, K61, K62, K63, K64, K65, K66, K67, K70, K71, K72, K73, K74, K75, K76, K77, K80, K81, K82, K83, K85, K86, K87, K90, K91, K92.
11 All other and unspecified infectious and parasitic diseases
A20, A21, A22, A23, A24, A25, A26, A27, A28, A30, A31, A32, A38, A42, A43, A44, A46, A48, A49, A51, A52, A53, A55, A56, A57, A58, A59, A60, A63, A64, A65, A66, A67, A68, A69, A70, A71, A74, A75, A77, A78, A79, B35, B36, B38, B39, B40, B41, B42, B43, B44, B45, B46, B47, B48, B49, B55, B56, B57, B58, B60, B64, B65, B66, B67, B68, B69, B70, B71, B72, B73, B74, B75, B76, B77, B78, B79, B80, B81, B82, B83, B85, B86, B87, B88, B89, B90, B91, B92, B94, B95, B96, B97, B98, B99.
12 All other diseases (Residual) F01, F02, F03, F04, F05, F06, F07, F08, F09, F10, F11, F12, F13, F14, F15, F16, F17, F18, F19, F20, F21, F22, F23, F24, F25, F28, F29, F30, F31, F32, F33, F34, F38, F39, F40, F41, F42, F43, F44, F45, F48, F50, F51, F52, F53, F54, F55, F59, F60, F61, F62, F63, F64, F65, F66, F68, F69, F70, F71, F72, F73, F78, F79, F80, F81, F82, F83, F84, F88, F89, F90, F91, F92, F93, F94, F95, F98, F99, G99, H00, H01, H02, H03, H04, H05, H06, H10, H11, H13, H15, H16, H17, H18, H19, H20, H21, H22, H25, H26, H27, H28, H30, H31, H32, H33, H34, H35, H36, H40, H42, H43, H44, H45, H46, H47, H48, H49, H50, H51, H52, H53, H54, H55, H56, H57, L00, L01, L02, L03, L04, L05, L06, L08, L10, L11, L12, L13, L14, L20, L21, L22, L23, L24, L25, L26, L27, L28, L29, L30, L40, L41, L42, L43, L44, L45, L50, L51, L52, L53, L54, L55, L56, L57, L58, L59, L60, L62, L63, L64, L65, L66, L67, L68, L69, L70, L71, L72, L73, L74, L75, L80, L81, L82, L83, L84, L85, L86, L87, L88, L89, L90, L91, L92, L93, L94, L95, L97, L98, L99, M00, M01, M02, M03, M05, M06, M07, M08, M09, M10, M11, M12, M13, M14, M15, M16, M17, M18, M19, M20, M21, M22, M23, M24, M25, M30, M31, M32, M33, M34, M35, M36, M37, M38, M39, M40, M41, M42, M43, M45, M46, M47, M48, M49, M50, M51, M53, M54, M60, M61, M62, M63, M65, M66, M67, M68, M70, M71, M72, M73, M75, M76, M77, M78, M79, M80, M81, M82, M83, M84, M85, M86, M87, M88, M89, M90, M91, M92, M93, M94, M95, M96, M99, Y85, R54.
13 All other diseases of circulatory system I00, I01, I02, I05, I06, I07, I08, I09, I10, I11, I12, I13, I15, I20, I21, I22, I23, I24, I25.0, I25.1, I25.2, I25.3, I25.4, I25.5, I25.6, I25.8, I25.9, I31, I34, I35, I36, I37, I38, I44, I45, I47, I48, I49, I50, I51, I70, I71, I72, I73, I74, I77, I78, 179, I80, I81, I82, I83, I85, I86, I87, I88, I89, I95, I96, I97, I98, I99.
14 All other endocrine, nutritional and metabolic diseases
E00, E01, E02, E03, E04, E05, E06, E07, E10, E11, E12, E13, E14, E15, E16, E20, E21, E22, E23, E24, E25, E26, E27, E28, E29, E30, E31, E32, E34.0, E34.1, E34.2, E34.4, E34.5, E34.8, E34.9, E65, E66, E67, E68, E70, E71, E72, E73, E74, E75, E76, E77, E78, E79, E80, E83, E85, E88.
15 All other infections specific to the perinatal period
P35, P37, P39.
16 All other respiratory conditions originating in the perinatal period
P28.2, P28.3, P28.4, P28.5, P28.8, P28.9.
17 Anemias D50, D51, D52, D53, D55, D56, D57, D58, D59, D60, D61, D62, D63, D64.
18 Anencephaly and similar malformations Q00.
19 Anoxic brain damage, not elsewhere classified
G93.1.
20 Assault (homicide) by discharge of firearms U01.4, X93, X94, X95.

28
No. Cause of infant death ICD10 codes
21 Assault (homicide) by hanging, strangulation and suffocation
X91.
22 Assault (homicide) by other and unspecified means
U01.0, U01.1, U01.2, U01.3, U01.5, U01.6, U01.7, U01.8, U01.9, X85, X86, X87, X88, X89, X90, X92, X96, X97, X98, X99, Y00, Y01, Y02, Y03, Y04, Y05, Y08, Y09.
23 Asthma J45, J46.
24 Atelectasis P28.0, P28.1.
25 Bacterial sepsis of newborn P36.
26 Birth asphyxia P21.
27 Birth trauma P10, P11, P12, P13, P14, P15.
28 Bronchitis, chronic and unspecified J40, J41, J42.
29 Candidiasis B37.
30 Cardiac arrest I46.
31 Cardiomyopathy I42.
32 Cerebrovascular diseases I60, I61, I62, I63, I64, I65, I66, I67, I68, I69.
33 Certain disorders involving the immune mechanism
D80, D81, D82, D83, D84, D86, D89.
34 Certain intestinal infectious diseases A00, A01, A02, A03, A04, A05, A06, A07, A08.
35 Chronic respiratory disease originating in the perinatal period
P27.
36 Complications of medical and surgical care Y40, Y41, Y42, Y43, Y44, Y45, Y46, Y47, Y48, Y49, Y50, Y51, Y52, Y53, Y54, Y55, Y56, Y57, Y58, Y59, Y60, Y61, Y62, Y63, Y64, Y65, Y66, Y69, Y70, Y71, Y72, Y73, Y74, Y75, Y76, Y77, Y78, Y79, Y80, Y81, Y82, Y83, Y84.
37 Congenital hydrocephalus Q03.
38 Congenital malformations and deformations of musculoskeletal system, limbs and integument
Q65, Q66, Q67, Q68, Q69, Q70, Q71, Q72, Q73, Q74, Q75, Q76, Q77, Q78, Q79, Q80, Q81, Q82, Q83, Q84, Q85.
39 Congenital malformations of digestive system
Q35, Q36, Q37, Q38, Q39, Q40, Q41, Q42, Q43, Q44, Q45.
40 Congenital malformations of genitourinary system
Q50, Q51, Q52, Q53, Q54, Q55, Q56, Q60, Q61, Q62, Q63, Q64.
41 Congenital malformations of heart Q20, Q21, Q22, Q23, Q24.
42 Congenital malformations of respiratory system
Q30, Q31, Q32, Q33, Q34.
43 Congenital pneumonia P23.
44 Congenital syphilis A50.
45 Cystic fibrosis E84.
46 Diarrhea and gastroenteritis of infectious origin
A09.
47 Diphtheria A36.
48 Diseases of the ear and mastoid process H60, H61, H62, H65, H66, H67, H68, H69, H70, H71, H72, H73, H74, H75, H80, H81, H82, H83, H90, H91, H92, H93.
49 Disorders related to long gestation and high birth weight
P08.
50 Down syndrome Q90.
51 Edward syndrome Q91.0, Q91.1, Q91.2, Q91.3.
52 Extremely low birth weight or extreme immaturity
P07.0, P07.2.

29
No. Cause of infant death ICD10 codes
53 Falls W00, W01, W02, W03, W04, W05, W06, W07, W08, W09, W10, W11, W12, W13, W14, W15, W16, W17, W18, W19.
54 Gastritis, duodenitis, and noninfective enteritis and colitis
K29, K50, K51, K52, K55.
55 Gonococcal infection A54.
56 Hematological disorders P60, P61.
57 Hemolytic disease of newborn due to isoimmunization and other perinatal jaundice
P55, P56, P57, P58, P59.
58 Hemorrhagic conditions and other diseases of blood and blood-forming organs
D65, D66, D67, D68, D69, D70, D71, D72, D73, D74, D75, D76.
59 Hemorrhagic disease of newborn P53.
60 Hernia of abdominal cavity and intestinal obstruction without hernia
K40, K41, K42, K43, K44, K45, K46, K56.
61 Hodgkin disease and non-Hodgkin lymphomas
C81, C82, C83, C84, C85.
62 Human immunodeficiency virus (HIV) disease
B20, B21, B22, B23, B24.
63 Hydrops fetalis not due to hemolytic disease P83.2.
64 In situ neoplasms, benign neoplasms and neoplasms of uncertain or unknown behavior
D00, D01, D02, D03, D04, D05, D06, D07, D09, D10, D11, D12, D13, D14, D15, D16, D17, D18, D19, D20, D21, D22, D23, D24, D25, D26, D27, D28, D29, D30, D31, D32, D33, D34, D35, D36, D37, D38, D39, D40, D41, D42, D43, D44, D45, D46, D47, D48.
65 Infantile cerebral palsy G80.
66 Infantile spinal muscular atrophy, type I (Werdnig-Hoffman)
G12.0.
67 Influenza J09, J10, J11.
68 Interstitial emphysema and related conditions originating in the perinatal period
P25.
69 Intrauterine hypoxia P20.
70 Leukemia C91, C92, C93, C94, C95.
71 Malaria B50, B51, B52, B53, B54.
72 Measles B05.
73 Meningitis G00, G03.
74 Meningococcal infection A39.
75 Motor vehicle accidents V02, V03, V04, V09.0, V09.2, V12, V13, V14, V19.0, V19.1, V19.2, V19.4, V19.5, V19.6, V20, V21, V22, V23, V24, V25, V26, V27, V28, V29, V30, V31, V32, V33, V34, V35, V36, V37, V38, V39, V40, V41, V42, V43, V44, V45, V46, V47, V48, V49, V50, V51, V52, V53, V54, V55, V56, V57, V58, V59, V60, V61, V62, V63, V64, V65, V66, V67, V68, V69, V70, V71, V72, V73, V74, V75, V76, V77, V78, V79, V80.3, V80.4, V80.5, V81.0, V81.1, V82.0, V82.1, V83, V84, V85, V86, V87.0, V87.1, V87.2, V87.3, V87.4, V87.5, V87.6, V87.7, V87.8, V88.0, V88.1, V88.2, V88.3, V88.4, V88.5, V88.6, V88.7, V88.8, V89.0, V89.2.
76 Mumps B26.
77 Necrotizing enterocolitis of newborn P77.
78 Neglect, abandonment and other maltreatment syndromes
Y06, Y07.
79 Neonatal aspiration syndromes P24.
80 Neonatal hemorrhage P50, P51, P52, P54.
81 Newborn affected by chorioamnionitis P02.7.

30
No. Cause of infant death ICD10 codes
82 Newborn affected by complications involving cord
P02.4, P02.5, P02.6.
83 Newborn affected by complications involving placenta
P02.0, P02.1, P02.2, P02.3.
84 Newborn affected by incompetent cervix P01.0.
85 Newborn affected by maternal hypertensive disorders
P00.0.
86 Newborn affected by multiple pregnancy P01.5.
87 Newborn affected by noxious influences transmitted via placenta or breast milk
P04.
88 Newborn affected by other and unspecified abnormalities of membranes
P02.8, P02.9.
89 Newborn affected by other complications of labor and delivery
P03.
90 Newborn affected by other maternal complications of pregnancy
P01.2, P01.3, P01.4, P01.6, P01.7, P01.8, P01.9.
91 Newborn affected by other maternal conditions which may be unrelated to present pregnancy
P00.1, P00.2, P00.3, P00.4, P00.5, P00.6, P00.7, P00.8, P00.9.
92 Newborn affected by premature rupture of membranes
P01.1.
93 Nutritional deficiencies E40, E41, E42, E43, E44, E45, E46, E50, E51, E52, E53, E54, E55, E56, E58, E59, E60, E61, E63, E64.
94 Omphalitis of newborn with or without mild hemorrhage
P38.
95 Other accidental suffocation and strangulation.
W76, W77, W81, W84.
96 Other and unspecified accidents W20, W21, W22, W23, W24, W25, W26, W27, W28, W29, W30, W31, W35, W36, W37, W38, W39, W40, W41, W42, W43, W44, W45, W46, W49, W50, W51, W52, W53, W54, W55, W56, W57, W58, W59, W60, W64, W85, W86, W87, W88, W89, W90, W91, W92, W93, W94, W99, X10, X11, X12, X13, X14, X15, X16, X17, X18, X19, X20, X21, X22, X23, X24, X25, X26, X27, X28, X29, X30, X31, X32, X33, X34, X35, X36, X37, X38, X39, X50, X51, X52, X53, X54, X57, X58, X59.
97 Other and unspecified diseases of genitourinary system
N00, N01, N02, N03, N04, N05, N06, N07, N08, N10, N11, N12, N13.0, N13.1, N13.2, N13.3, N13.4, N13.5, N13.6, N13.7, N13.8, N13.9, N14.0, N14.1, N14.2, N14.3, N14.4, N15.0, N15.1, N15.8, N15.9, N20, N21, N22, N23, N26, N28, N29, N30, N31, N32, N33, N34, N35, N36, N37, N39, N40, N41, N42, N43, N44, N45, N46, N47, N48, N49, N50, N51, N60, N61, N62, N63, N64, N70, N71, N72, N73, N74, N75, N76, N77, N80, N81, N82, N83, N84, N85, N86, N87, N88, N89, N90, N91, N92, N93, N94, N95.
98 Other and unspecified diseases of respiratory system
J22, J30, J31, J32, J33, J34, J35, J36, J37, J38, J39, J43, J44, J47, J60, J61, J62, J63, J64, J65, J66, J67, J68, J70, J80, J81, J82, J84, J85, J86, J90, J91, J92, J93, J94, J95, J96, J98, U04.
99 Other and unspecified malignant neoplasms C00, C01, C02, C03, C04, C05, C06, C07, C08, C09, C10, C11, C12, C13, C14, C15, C16, C17, C18, C19, C20, C21, C22, C23, C24, C25, C26, C30, C31, C32, C33, C34, C37, C38, C39, C40, C41, C43, C44, C45, C46, C47, C48, C49, C50, C51, C52, C53, C54, C55, C56, C57, C58, C60, C61, C62, C63, C64, C65, C66, C67, C68, C69, C70, C71, C72, C73, C74, C75, C76, C77, C78, C79, C80, C88, C90, C96, C97.
100 Other and unspecified transport accidents V01, V05, V06, V09.1, V09.3, V09.9, V10, V11, V15, V16, V17, V18, V19.3, V19.8, V19.9, V80.0, V80.1, V80.2, V80.6, V80.7, V80.8, V80.9, V81.2, V81.3, V81.4, V81.5, V81.6, V81.7, V81.8, V81.9, V82.2, V82.3, V82.4, V82.5, V82.6, V82.7, V82.8, V82.9, V87.9, V88.9, V89.1, V89.3, V89.9, V90, V91, V92, V93, V94, V95, V96, V97, V98, V99.
101 Other and unspecified viral diseases A81, A82, A83, A84, A85.0, A85.1, A85.2, A85.8, A86, A87, A88, A89, A92, A93, A94, A95, A96, A97, A98, A99, B00, B02, B03, B04, B06, B07, B08, B09, B15, B16, B17, B18, B19, B25, B27, B30, B33, B34.
102 Other chromosomal abnormalities, not elsewhere classified
Q92, Q93, Q95, Q96, Q97, Q98, Q99.
103 Other congenital malformations and deformations
Q10, Q11, Q12, Q13, Q14, Q15, Q16, Q17, Q18, Q86, Q87, Q88, Q89.
104 Other congenital malformations of circulatory system
Q25, Q26, Q27, Q28.

31
No. Cause of infant death ICD10 codes
105 Other congenital malformations of nervous system
Q01, Q02, Q04, Q06, Q07.
106 Other diseases of nervous system G04, G06, G07, G08, G09, G10, G11, G12.1, G12.2, G12.8, G12.9, G20, G21, G23, G24, G25, G26, G30, G31, G32, G35, G36, G37, G40, G41, G43, G44, G45, G46, G47, G50, G51, G52, G53, G54, G55, G56, G57, G58, G59, G60, G61, G62, G63, G64, G70, G71, G72, G81, G82, G83, G90, G91, G92, G93.0, G93.2, G93.3, G93.4, G93.5, G93.6, G93.7, G93.8, G93.9, G95, G96, G97, G98.
107 Other external causes Y10, Y11, Y12, Y13, Y14, Y15, Y16, Y17, Y18, Y19, Y20, Y21, Y22, Y23, Y24, Y25, Y26, Y27, Y28, Y29, Y30, Y31, Y32, Y33, Y34, Y35, Y36.
108 Other low birth weight or preterm P07.1, P07.3.
109 Other perinatal conditions P29, P70.3, P70.4, P70.8, P70.9, P71, P72, P74, P75, P76, P78, P80, P81, P83.0, P83.1, P83.3, P83.4, P83.5, P83.6, P83.8, P83.9, P90, P91, P92, P93, P94, P95, P96.
110 Other symptoms, signs and abnormal clinical and laboratory findings, not elsewhere classified
R00, R01, R02, R03, R04, R05, R06, R07, R08, R09, R10, R11, R12, R13, R14, R15, R16, R17, R18, R19, R20, R21, R22, R23, R25, R26, R27, R29, R30, R31, R32, R33, R34, R35, R36, R39, R40, R41, R42, R43, R44, R45, R46, R47, R48, R49, R50, R51, R52, R53, R55, R56, R57, R58, R59, R60, R61, R62, R63, R64, R65, R68, R69, R70, R71, R72, R73, R74, R75, R76, R77, R78, R79, R80, R81, R82, R83, R84, R85, R86, R87, R89, R90, R91, R92, R93, R94, R96, R98, R99.
111 Patau syndrome Q91.4, Q91.5, Q91.6, Q91.7.
112 Pericarditis, endocarditis and myocarditis I30, I33, I40.
113 Pneumocystosis B59.
114 Pneumonia J12, J13, J14, J15, J16, J17, J18.
115 Pneumonitis due to solids and liquids J69.
116 Pulmonary heart disease and diseases of pulmonary circu1ation
I26, I27, I28.
117 Pulmonary hemorrhage originating in the perinatal period
P26.
118 Renal failure and other disorders of kidney N17, N18, N19, N25, N27.
119 Respiratory distress of newborn P22.
120 Septicemia A40, A41.
121 Short stature, not elsewhere classified E34.3.
122 Slow fetal growth and fetal malnutrition P05.
123 Spina bifida Q05.
124 Sudden infant death syndrome R95.
125 Syndrome of infant of a diabetic mother and neonatal diabetes mellitus
P70.0, P70.1, P70.2.
126 Tetanus A33, A35.
127 Tuberculosis A16, A17, A18, A19.
128 Varicella (chickenpox) B01.
129 Volume depletion, disorders of fluid, electrolyte and acid-base balance
E86, E87.
130 Whooping cough A37.
†Derived with modification from TABLE C. LIST OF 130 SELECTED CAUSES OF INFANT DEATH. Reference: Instruction Manual, Part 9, ICD-10 Cause-of-Death Lists for Tabulating Mortality Statistics (Updated September 2018 to include WHO updates to ICD-10 for data year 2017). Vital Statistics Data Preparation, U.S. DEPARTMENT of HEALTH AND HUMAN SERVICES, Centers for Disease Control and Prevention, National Center for Health Statistics, Hyattsville, Maryland, September 2018

32
DEFINITIONS
• Death rate: The number of deaths divided by the population at risk. Death rates make comparisons between different population groups more meaningful than frequencies alone. This type of rate is also called the crude death rate.
• Age-specific death rate: The number of deaths in a specific age group divided by the population at risk in that age group.
• Age-adjusted death rate: There are age-related differences in the rates at which most health conditions occur. Some conditions are more common among young people, while others are more common among older people. Age adjustment is a technique for removing the effects of age from crude rates so they can be compared. Age adjustment is used to compare two or more populations at one point in time or one population at two or more points in time. To control for differences in the age distribution of the populations being compared, the age-specific death rates for each population are applied to a standard population in order to create a comparable summary measure of mortality. In this report, age-adjusted death rates were calculated using the 2000 standard population published by the National Center for Health Statistics.5 All rates were rounded to the nearest tenth of a number. Suppression rules have been implemented to minimize random variation and instability. Both count and rate are suppressed for any cell with fewer than 5 deaths regardless of county population size.
• Median: The midpoint of a set of values; the point at which, when the values are put in numerical order, half of the values fall above and half fall below. The median of 25, 27, 28, 36, and 41 is 28.
• Service Planning Area (SPA): The county is divided into eight SPAs and are used for planning, coordination and service delivery (Figure A-2 and Table A-2). SPAs are aggregated from census tracts and are updated every ten years to incorporate changes in Census geography. Current boundaries are distributed by the Los Angeles County Internal Services Department and are available on the GIS Data Portal website: https://egis3.lacounty.gov/dataportal/2012/03/01/service-planning-areas-spa-2012
5 Hoyert DL, Heron MP, Murphy SL, Kung H. Deaths: Final Data for 2003. National vital statistics reports; vol 54 no 13. Hyattsville, MD: National Center for Health Statistics. 2006.

33
Figure A-2: Map of Los Angeles County Service Planning Areas

34
Table A-2: City or Community and Corresponding Service Planning Area (SPA)
NAME SPA NAME SPA Acton 1 East Whittier 7 Agoura Hills 2 El Monte 3 Agua Dulce 1 El Segundo 8 Alhambra 3 Elizabeth Lake 1 Alondra Park 8 Florence-Graham 6 Altadena 3 Gardena 8 Arcadia 3 Glendale 2 Artesia 7 Glendora 3 Avalon 8 Green Valley 1 Avocado Heights 3 Hacienda Heights 3 Azusa 3 Hasley Canyon 2 Baldwin Park 3 Hawaiian Gardens 7 Bell 7 Hawthorne 8 Bell Gardens 7 Hermosa Beach 8 Bellflower 7 Hidden Hills 2 Beverly Hills 5 Huntington Park 7 Bradbury 3 Industry 3 Burbank 2 Inglewood 8 Calabasas 2 Irwindale 3 Carson 8 La Canada Flintridge 2 Castaic 2 La Crescenta-Montrose 2 Cerritos 7 La Habra Heights 7 Charter Oak 3 La Mirada 7 Citrus 3 La Puente 3 Claremont 3 La Verne 3 Commerce 7 Ladera Heights 5 Compton 6 Lake Hughes 2 Covina 3 Lake Los Angeles 1 Cudahy 7 Lakewood 7 Culver City 5 Lancaster 1 Del Aire 8 Lawndale 8 Desert View Highlands 1 Lennox 8 Diamond Bar 3 Leona Valley 1 Downey 7 Littlerock 1 Duarte 3 Lomita 8 East Los Angeles 7 Long Beach 8 East Pasadena 3 Los Angeles 2, 4, 5, 6, 8 East Rancho Dominguez 6 Lynwood 6 East San Gabriel 3 Malibu 5

35
Table A-2: City or Community and Corresponding Service Planning Area (SPA) (continued)
NAME SPA NAME SPA Manhattan Beach 8 Signal Hill 7 Marina del Rey 5 South El Monte 3 Mayflower Village 3 South Gate 7 Maywood 7 South Monrovia Island 3 Monrovia 3 South Pasadena 3 Montebello 7 South San Gabriel 3 Monterey Park 3 South San Jose Hills 3 North El Monte 3 South Whittier 7 Norwalk 7 Stevenson Ranch 2 Palmdale 1 Sun Village 1 Palos Verdes Estates 8 Temple City 3 Paramount 6 Topanga 2 Pasadena 3 Torrance 8 Pico Rivera 7 Val Verde 2 Pomona 3 Valinda 3 Quartz Hill 1 Vernon 7 Rancho Palos Verdes 8 View Park-Windsor Hills 6 Redondo Beach 8 Vincent 3 Rolling Hills 8 Walnut 3 Rolling Hills Estates 8 Walnut Park 7 Rose Hills 7 West Athens 8 Rosemead 3 West Carson 8 Rowland Heights 3 West Covina 3 San Dimas 3 West Hollywood 4 San Fernando 2 West Puente Valley 3 San Gabriel 3 West Rancho Dominguez 6 San Marino 3 West Whittier-Los Nietos 7 San Pasqual 3 Westlake Village 2 Santa Clarita 2 Westmont 8 Santa Fe Springs 7 Whittier 7 Santa Monica 5 Willowbrook 6 Sierra Madre 3

36
NOTES ABOUT THE POPULATION July 1, 2010 - 2017 population estimates were used as the denominators in the rate
calculations. Hedderson Demographic Services produces population estimates on an annual basis for the Los Angeles County Internal Services Department and Information Technology Service Division. Their population estimation methods include applying mortality and migration rates to the 2010 Census estimates and adhering closely to the state’s official city and county estimates from the California Department of Finance, Demographic Research Unit. Annual population estimate datasets are available from the Los Angeles County Internal Services Department on the GIS Data Portal website at: https://egis3.lacounty.gov/dataportal/2014/09/09/population-and-poverty-estimates/
Smoothed population estimates were used as the denominators in the 2008-2009 rate calculations. The Office of Health Assessment and Epidemiology updated the trend line by adjusting the original annual estimates produced by Hedderson Demographic Services to the Census 2010 population counts.
2017 American Community Survey (ACS) 5-Year Estimates were used to estimate the median household income. ACS is a nationwide continuous survey conducted by the US Census Bureau. Data tables can be accessed at: https://factfinder.census.gov/faces/nav/jsf/pages/index.xhtml ASCERTAINMENT OF RACE/ETHNICITY
Up to three races may be specified on a decedent’s certificate of death. The information is provided by the funeral director or coroner who may not ascertain the decedent’s race and/or ethnicity directly from the next of kin, which could lead to inaccuracies.
In addition to race, the death certificate has a check box for indicating whether the decedent was Hispanic, Latino/a, or of Spanish origin regardless of race. In this report, if Hispanic origin is indicated on the certificate of death, then the decedent’s race is tabulated as Hispanic. Of the remaining non-Hispanic decedents, race is tabulated according to first race listed on the certificate. TABULATIONS BY RACE/ETHNICITY
For this report, race is tabulated and presented for six race/ethnic groups: white, Latino, black, Asian, Native Hawaiians and other Pacific Islander (NHOPI), and American Indian and Alaska Native (AIAN). Beginning with 2012 data, this report has separated the Asian/Pacific Islander race category into two categories: Asian and Native Hawaiian and other Pacific Islander (NHOPI). Mortality trends for Asians should be interpreted with caution because the number of deaths and death rates before 2012 reflect Asian and NHOPI combined.
The number of deaths among NHOPI and AIAN was too small to present annual leading causes of death and premature death tables or to determine stable annual death rates. Therefore, to present accurate and useful data for NHOPI and AIAN, we have combined data for 2014-2017 to show the leading causes of death and premature death overall and by gender (Tables A-3a to A-6b):
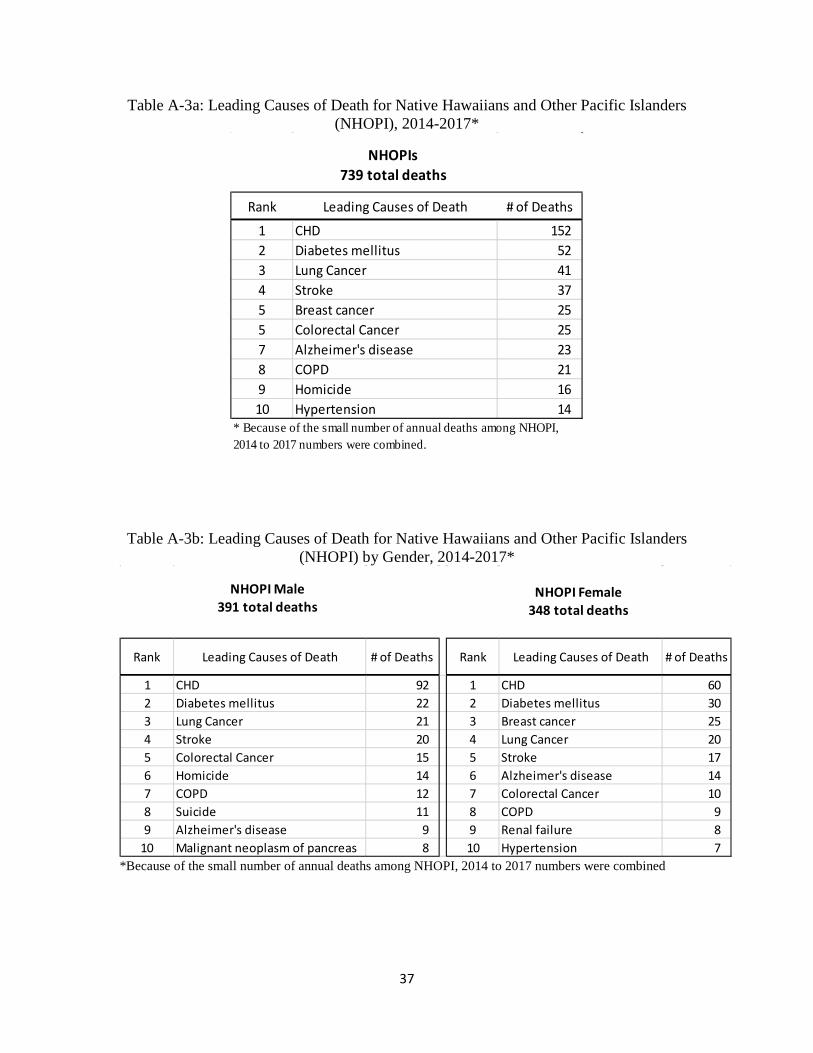
37
Table A-3a: Leading Causes of Death for Native Hawaiians and Other Pacific Islanders (NHOPI), 2014-2017*
Table A-3b: Leading Causes of Death for Native Hawaiians and Other Pacific Islanders
(NHOPI) by Gender, 2014-2017*
*Because of the small number of annual deaths among NHOPI, 2014 to 2017 numbers were combined
Rank Leading Causes of Death # of Deaths
1 CHD 1522 Diabetes mellitus 523 Lung Cancer 414 Stroke 375 Breast cancer 255 Colorectal Cancer 257 Alzheimer's disease 238 COPD 219 Homicide 1610 Hypertension 14
* Because of the small number of annual deaths among NHOPI, 2014 to 2017 numbers were combined.
NHOPIs739 total deaths
Rank Leading Causes of Death # of Deaths Rank Leading Causes of Death # of Deaths
1 CHD 92 1 CHD 602 Diabetes mellitus 22 2 Diabetes mellitus 303 Lung Cancer 21 3 Breast cancer 254 Stroke 20 4 Lung Cancer 205 Colorectal Cancer 15 5 Stroke 176 Homicide 14 6 Alzheimer's disease 147 COPD 12 7 Colorectal Cancer 108 Suicide 11 8 COPD 99 Alzheimer's disease 9 9 Renal failure 8
10 Malignant neoplasm of pancreas 8 10 Hypertension 7
NHOPI Male391 total deaths
NHOPI Female348 total deaths

38
Table A-4a: Leading Causes of Death for American Indians/Alaska Natives (AIAN), 2014-2017*
Table A-4b: Leading Causes of Death for American Indians/Alaska Natives (AIAN) by Gender, 2014-2017*
*Because of the small number of annual deaths among AIAN, 2014 to 2017 numbers were combined
Rank Leading Causes of Death # of Deaths
1 CHD 1162 Stroke 403 Diabetes mellitus 384 Alzheimer's disease 345 Lung Cancer 336 COPD 317 Liver disease/cirrhosis 298 Pneumonia/Influenza 259 Drug overdose (Unintentional) 1810 Hypertension 17
* Because of the small number of annual deaths among AIAN, 2014 to 2017 numbers were combined.
AIANs694 total deaths
Rank Leading Causes of Death # of Deaths Rank Leading Causes of Death # of Deaths1 CHD 59 1 CHD 572 Liver disease/cirrhosis 16 2 Stroke 283 Diabetes mellitus 15 3 Diabetes mellitus 233 Lung Cancer 15 3 Alzheimer's disease 233 COPD 15 5 Lung Cancer 183 Hypertension 15 6 Pneumonia/Influenza 177 Stroke 12 7 COPD 168 Alzheimer's disease 11 8 Breast cancer 149 Hypertensive heart disease 9 9 Liver disease/cirrhosis 139 Prostate cancer 9 9 Drug overdose (Unintentional) 13
AIAN Male313 total deaths
AIAN Female381 total deaths

39
Table A-5a: Leading Causes of Premature Death for Native Hawaiians and Other Pacific Islanders (NHOPI), 2014-2017*
Table A-5b: Leading Causes of Premature Death for Native Hawaiians and Other Pacific
Islanders (NHOPI) by Gender, 2014-2017*
*Because of the small number of annual deaths among NHOPI, 2014 to 2017 numbers were combined
Rank Leading Causes of Premature Death YPLLs1 CHD 1,4242 Certain conditions originating in the perinatal period 7503 Homicide 6674 Diabetes mellitus 4805 Breast cancer 3706 Lung Cancer 3467 Colorectal Cancer 3178 Motor vehicle crash 3029 Stroke 266
10 Suicide 264* Because of the small number of annual deaths among NHOPI, 2014 to 2017 numbers were combined.
NHOPIs9,816 years of potential life lost
Rank Leading Causes of Premature Death YPLLs Rank Caused of Premature Death YPLLs1 CHD 1,028 1 Certain conditions originating in the perinatal period 4502 Homicide 624 2 CHD 3963 Certain conditions originating in the perinatal period 300 3 Breast cancer 3704 Suicide 264 4 Diabetes mellitus 2765 Motor vehicle crash 244 5 Malignant neoplasm of cervix uteri 1696 Diabetes mellitus 204 6 Lung Cancer 1667 Colorectal Cancer 198 7 Stroke 1448 Lung Cancer 180 8 Colorectal Cancer 1199 Stroke 122 9 Leukemia 112
10 COPD117 10
Malignant neoplasms of corpus uteri and uterus, part unspecified 94
NHOPI Male5,637 years of life lost
NHOPI Female4,179 years of life lost

40
Table A-6a: Leading Causes of Premature Death for American Indians/Alaska Natives (AIAN),
2014-2017*
Table A-6b: Leading Causes of Premature Death for American Indians/Alaska Natives (AIAN) by Gender, 2014-2017*
*Because of the small number of annual deaths among AIAN, 2014 to 2017 numbers were combined
Rank Leading Causes of Premature Death YPLLs1 CHD 6932 Drug overdose (Unintentional) 4993 Liver disease/cirrhosis 4314 Diabetes mellitus 4095 Suicide 3556 Hypertension 2487 Lung Cancer 2458 Homicide 2379 Breast cancer 18510 Stroke 182
* Because of the small number of annual deaths among AIAN, 2014 to 2017 numbers were combined.
AIANs6,703 years of potential life lost
Rank Leading Causes of Premature Death YPLLs Rank Leading Causes of Premature Death YPLLs1 CHD 377 1 Drug overdose (Unintentional) 3642 Liver disease/cirrhosis 300 2 CHD 3163 Hypertension 224 3 Diabetes mellitus 2974 Homicide 188 4 Breast cancer 1845 Suicide 172 5 Suicide 1836 Motor vehicle crash 141 6 Lung Cancer 1407 Hypertensive heart disease 137 7 Liver disease/cirrhosis 1318 Drug overdose (Unintentional) 135 8 Pneumonia/Influenza 1229 HIV 119 9 Asthma 95
10 Diabetes mellitus 112 10 Stroke 86
AIAN Female3,257 years of life lost
AIAN Male3,446 years of life lost

41
Calculating stable mortality rates for American Indian and Alaska Native (AIAN) and Native
Hawaiians and other Pacific Islander (NHOPI) has proven to be challenging. The death rate is derived from two sources: the death certificate and the population estimates. Death certificates provide causes of death as well as demographic information on the deceased (gender, race/ethnicity, age). Population estimates provide demographic information on the population. While both sources provide information on race and Hispanic ethnicity, they obtain them in different ways. Race and ethnicity in Census data are based on self-report, whereas on the death certificate, they are completed by the funeral director or coroner. Both sources of data allow for the specification of multiple races.
The potential for racial misclassification may be greater for AIAN and NHOPI compared with other race groups because a larger proportion of their respective populations might have reported two or more races and/or Hispanic ethnicity. In the 2010 Census, 96% of all respondents reported only one race, but the two smallest population groups, NHOPI and AIAN, reported multiple races more frequently than other race groups. According to the findings from 2011-2015 American Community Survey conducted by U.S. Census Bureau, as shown in (Table A-7) 16.0% of NHOPI reported Hispanic ethnicity, but only 5.0% of NHOPI decedents were reported as Hispanic on the death certificate. Similarly, Hispanic ethnicity was reported in 54.3% AIAN in Census data, but in only 30.0% of AIAN deaths (Table A-8). Again, while 48.4% of NHOPI reported multiple races in the Census, only 18.0% of NHOPI decedents were reported with multiple races. In contrast, 62.1% of AIAN reported being multiracial, similar figure of 61.6% of AIAN decedents were reported with multiple races. Hence caution is advised when interpreting death rates for these two racial groups.

42
Data sources: 1. Los Angeles County Department of Public Health, Los Angeles County Linked Death Data,2017 2. U.S. Census Bureau, 2011-2015 American Community Survey Selected Population Tables: B01001, B01001C, B01001E.
Table A-7: Deaths (2017) and Population (2011-2015) of Native Hawaiians and Other Pacific Islanders (NHOPI) by Ethnicity and Multiple Race Status
Race and ethnicity No. of Deaths (%) Population (%)
Ethnicity
Hispanic 11 5.0% 8,419 16.0% Non-Hispanic 211 95.0% 44,087 84.0%
Race Single race 182 82.0% 27,076 51.6% Two or more races 40 18.0% 25,430 48.4%
Total 222 100% 52,506 100% Data sources: 1. Los Angeles County Department of Public Health, Los Angeles County Linked Death Data,2017 2. U.S. Census Bureau, 2011-2015 American Community Survey Selected Population Tables: B01001, B01001C, B01001E.
Table A-8: Deaths (2017) and Population (2011-2015) of American Indians/Alaska Natives (AIAN) by Ethnicity and Multiple Race Status
Race and ethnicity No. of Deaths (%) Population (%) Ethnicity Hispanic 131 30.0% 85,009 54.3% Non-Hispanic 306 70.0% 71,637 45.7% Race Single race 168 38.4% 59,340 37.9% Two or more races 269 61.6% 97,306 62.1% Total 437 100% 156,646 100%

43
APPENDIX B
10 Leading Causes of Death TABLE B-1. 10 Leading Causes of Death, Los Angeles County, 2017 ............................................. 44
TABLE B-2. 10 Leading Causes of Death by Gender, Los Angeles County, 2017 ............................ 45
TABLE B-3. 10 Leading Causes of Death by Age Group, Los Angeles County, 2017 ...................... 46
TABLE B-4. 10 Leading Causes of Death by Race/Ethnicity, Los Angeles County, 2017 ................ 50
TABLE B-5. 10 Leading Causes of Death by Gender and Race/Ethnicity, Los Angeles County, 2017 ....................................................................................................................................................... 51
TABLE B-6. 10 Leading Causes of Death by Service Planning Area (SPA), Los Angeles County, 2017 ....................................................................................................................................................... 53
Notes:
1. Statistics are of Los Angeles County residents only. 2. Cause of Death are categorized based on Table B. List of 113 Selected Causes of Death; and Table C. List of 130
Selected Causes of Infant Death. Reference: National Center for Health Statistics, National Vital Statistics System. ICD–10 cause-of-death lists for tabulating mortality statistics (updated September 2018 to include WHO updates to ICD–10 for data year 2017). NCHS Instruction Manual, part 9. Hyattsville, MD. 2018.
3. Age adjustment is made to US Standard Population 2000. Reference: Klein RJ, Schoenborn CA. Age adjustment using the 2000 projected U.S. population. Healthy People Statistical Notes, no. 20. Hyattsville, Maryland: National Center for Health Statistics, January 2001.
Data Sources:
1. Los Angeles County Department of Public Health, Los Angeles County Linked Death Data, 2017. 2. July 1, 2017 Population Estimates, Los Angeles County Internal Services Department, 2018/05/07.
Abbreviations:
1. CHD = Coronary Heart Disease 2. COPD = Chronic Obstructive Pulmonary Disease

TABLE B-1: 10 LEADING CAUSES OF DEATH, LOS ANGELES COUNTY, 2017
Rank Cause of Death No. of Deaths AAMR*1 CHD 11,211 1032 Alzheimer's disease 4,179 393 Stroke 3,749 354 COPD 2,927 285 Diabetes mellitus 2,658 256 Lung Cancer 2,556 247 Pneumonia/Influenza 1,957 188 Colorectal Cancer 1,449 139 Liver disease/cirrhosis 1,412 12
10 Hypertension 1,402 13
* Age-adjusted mortality rate per 100,000 using 2000 U.S. Standard Population
44

TABLE B-2: 10 LEADING CAUSES OF DEATH BY GENDER, LOS ANGELES COUNTY, 2017
Males FemalesRank Cause of Death No. of Deaths AAMR* Rank Cause of Death No. of Deaths AAMR*
1 CHD 6,260 135 1 CHD 4,951 782 Stroke 1,650 37 2 Alzheimer's disease 2,890 433 Diabetes mellitus 1,491 32 3 Stroke 2,099 334 Lung Cancer 1,421 31 4 COPD 1,522 245 COPD 1,405 32 5 Breast cancer 1,172 196 Alzheimer's disease 1,289 31 6 Diabetes mellitus 1,167 197 Pneumonia/Influenza 1,000 23 7 Lung Cancer 1,135 198 Liver disease/cirrhosis 953 18 8 Pneumonia/Influenza 957 159 Prostate cancer 872 20 9 Hypertension 732 12
10 Colorectal Cancer 762 16 10 Colorectal Cancer 687 11
* Age-adjusted mortality rate per 100,000 using 2000 U.S. Standard Population
45

TABLE B-3: 10 LEADING CAUSES OF DEATH BY AGE GROUP, LOS ANGELES COUNTY, 2017
< 1 Year Rank Cause of Death No. of Deaths CMR*
1 Extremely low birth weight or extreme immaturity 69 62.82 Sudden infant death syndrome 32 29.13 Congenital malformations of heart 30 27.34 Newborn affected by premature rupture of membranes 19 17.35 Bacterial sepsis of newborn 17 15.56 Neonatal hemorrhage 15 13.77 Edward syndrome 13 11.88 Respiratory distress of newborn 11 10.09 Congenital malformations and deformations of musculoskeletal system, limbs and integument 9 8.29 Newborn affected by chorioamnionitis 9 8.2
1-4 YearsRank Cause of Death No. of Deaths CMR*
1 Congenital malformations, deformations and chromosomal abnormalities 12 2.52 Leukemia 8 1.73 Accidental drowning and submersion 6 1.24 Malignant neoplasms of meninges, brain and other parts of central nervous system 5 1.05 Motor vehicle crash 4 0.86 Pneumonia/Influenza 3 0.67 Septicemia 1 0.27 Anemias 1 0.27 Complications of medical and surgical care 1 0.27 Homicide 1 0.2
* Crude Mortality Rate / 100,000 population
46

TABLE B-3 (continued): 10 LEADING CAUSES OF DEATH BY AGE GROUP, LOS ANGELES COUNTY, 2017
5-14 YearsRank Cause of Death No. of Deaths CMR*
1 Motor vehicle crash 20 1.52 Congenital malformations, deformations and chromosomal abnormalities 13 1.03 Suicide 11 0.94 Leukemia 8 0.65 Malignant neoplasms of meninges, brain and other parts of central nervous system 6 0.55 Asthma 6 0.57 Accidental drowning and submersion 3 0.28 Septicemia 2 0.28 Homicide 2 0.28 Certain conditions originating in the perinatal period 2 0.2
15-24 YearsRank Cause of Death No. of Deaths CMR*
1 Homicide 161 11.12 Motor vehicle crash 154 10.63 Suicide 124 8.54 Drug overdose (Unintentional) 74 5.15 Leukemia 18 1.26 Congenital malformations, deformations and chromosomal abnormalities 13 0.97 Falls 9 0.68 Malignant neoplasms of meninges, brain and other parts of central nervous system 6 0.48 Diabetes mellitus 6 0.4
10 Accidental drowning and submersion 5 0.3
* Crude Mortality Rate / 100,000 population
47

TABLE B-3 (continued): 10 LEADING CAUSES OF DEATH BY AGE GROUP, LOS ANGELES COUNTY, 2017
25-44 YearsRank Cause of Death No. of Deaths CMR*
1 Drug overdose (Unintentional) 391 13.22 Homicide 303 10.33 Suicide 291 9.94 Motor vehicle crash 234 7.95 Liver disease/cirrhosis 134 4.56 CHD 114 3.97 Stroke 94 3.28 Diabetes mellitus 79 2.79 Breast cancer 71 2.4
10 Colorectal Cancer 56 1.9
45-64 YearsRank Cause of Death No. of Deaths CMR*
1 CHD 2,092 78.42 Liver disease/cirrhosis 759 28.53 Diabetes mellitus 689 25.84 Lung Cancer 531 19.95 Stroke 515 19.36 Breast cancer 435 16.37 Colorectal Cancer 382 14.38 Drug overdose (Unintentional) 349 13.19 Hypertensive heart disease 291 10.9
10 Suicide 287 10.8
* CMR Crude Mortality Rate / 100,000 population
48

TABLE B-3 (continued): 10 LEADING CAUSES OF DEATH BY AGE GROUP, LOS ANGELES COUNTY, 2017
65-74 YearsRank Cause of Death No. of Deaths CMR*
1 CHD 2,002 266.62 Lung Cancer 739 98.43 Diabetes mellitus 594 79.14 COPD 566 75.45 Stroke 560 74.66 Colorectal Cancer 347 46.27 Malignant neoplasm of pancreas 343 45.78 Liver disease/cirrhosis 313 41.79 Malignant neoplasms of liver and intrahepatic bile ducts 291 38.8
10 Pneumonia/Influenza 280 37.3
≥ 75+ YearsRank Cause of Death No. of Deaths CMR*
1 CHD 6,997 1,238.02 Alzheimer's disease 3,963 701.23 Stroke 2,571 454.94 COPD 2,090 369.85 Pneumonia/Influenza 1,474 260.86 Diabetes mellitus 1,289 228.17 Lung Cancer 1,267 224.28 Hypertension 916 162.19 Renal failure 782 138.4
10 Hypertensive heart disease 709 125.5
* CMR Crude Mortality Rate / 100,000 population
49
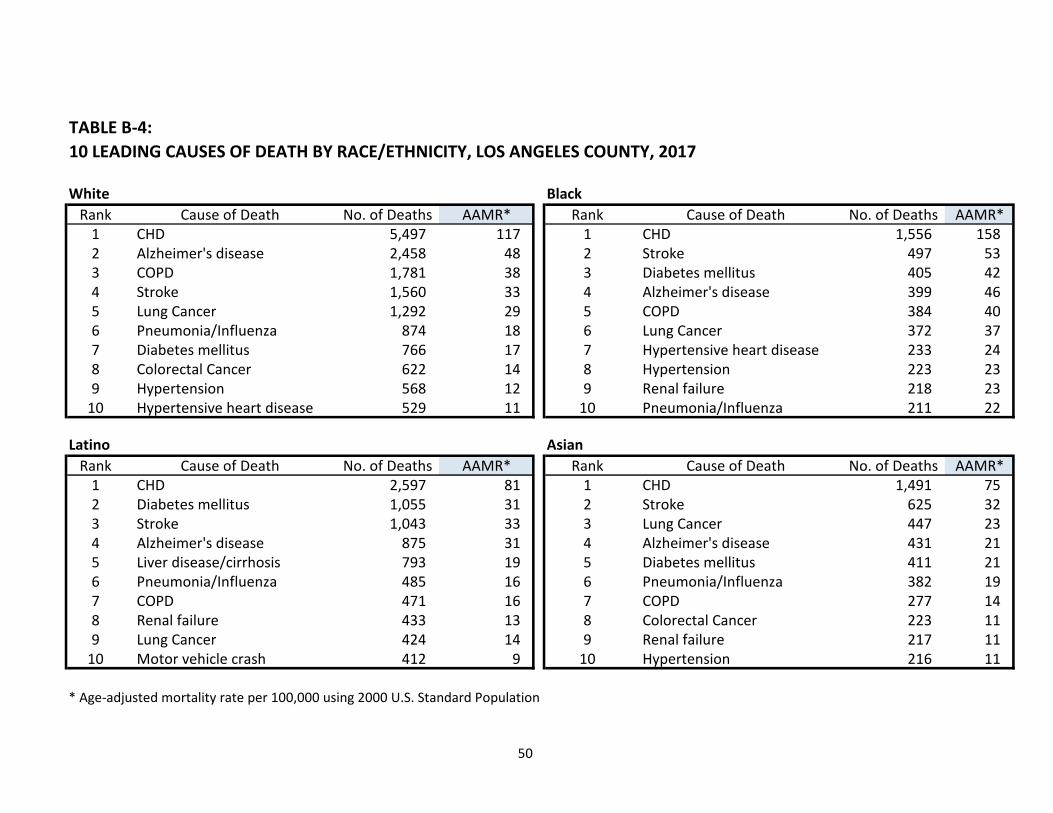
TABLE B-4: 10 LEADING CAUSES OF DEATH BY RACE/ETHNICITY, LOS ANGELES COUNTY, 2017
White BlackRank Cause of Death No. of Deaths AAMR* Rank Cause of Death No. of Deaths AAMR*
1 CHD 5,497 117 1 CHD 1,556 1582 Alzheimer's disease 2,458 48 2 Stroke 497 533 COPD 1,781 38 3 Diabetes mellitus 405 424 Stroke 1,560 33 4 Alzheimer's disease 399 465 Lung Cancer 1,292 29 5 COPD 384 406 Pneumonia/Influenza 874 18 6 Lung Cancer 372 377 Diabetes mellitus 766 17 7 Hypertensive heart disease 233 248 Colorectal Cancer 622 14 8 Hypertension 223 239 Hypertension 568 12 9 Renal failure 218 23
10 Hypertensive heart disease 529 11 10 Pneumonia/Influenza 211 22
Latino AsianRank Cause of Death No. of Deaths AAMR* Rank Cause of Death No. of Deaths AAMR*
1 CHD 2,597 81 1 CHD 1,491 752 Diabetes mellitus 1,055 31 2 Stroke 625 323 Stroke 1,043 33 3 Lung Cancer 447 234 Alzheimer's disease 875 31 4 Alzheimer's disease 431 215 Liver disease/cirrhosis 793 19 5 Diabetes mellitus 411 216 Pneumonia/Influenza 485 16 6 Pneumonia/Influenza 382 197 COPD 471 16 7 COPD 277 148 Renal failure 433 13 8 Colorectal Cancer 223 119 Lung Cancer 424 14 9 Renal failure 217 11
10 Motor vehicle crash 412 9 10 Hypertension 216 11
* Age-adjusted mortality rate per 100,000 using 2000 U.S. Standard Population
50

TABLE B-5: 10 LEADING CAUSES OF DEATH BY GENDER AND RACE/ETHNICITY, LOS ANGELES COUNTY, 2017
White Male White FemaleRank Cause of Death No. of Deaths AAMR* Rank Cause of Death No. of Deaths AAMR*
1 CHD 3,062 151 1 CHD 2,435 872 COPD 790 40 2 Alzheimer's disease 1,699 553 Alzheimer's disease 759 38 3 COPD 991 374 Lung Cancer 692 34 4 Stroke 894 315 Stroke 666 34 5 Lung Cancer 600 256 Diabetes mellitus 478 24 6 Breast cancer 493 217 Pneumonia/Influenza 444 22 7 Pneumonia/Influenza 430 158 Prostate cancer 393 20 8 Colorectal Cancer 311 129 Suicide 346 20 9 Hypertension 293 11
10 Colorectal Cancer 311 16 10 Diabetes mellitus 288 11
Latino Male Latina FemaleRank Cause of Death No. of Deaths AAMR* Rank Cause of Death No. of Deaths AAMR*
1 CHD 1,490 108 1 CHD 1,107 612 Diabetes mellitus 588 40 2 Alzheimer's disease 599 343 Liver disease/cirrhosis 565 29 3 Stroke 550 304 Stroke 493 36 4 Diabetes mellitus 467 255 Motor vehicle crash 311 13 5 Breast cancer 320 156 Homicide 291 11 6 COPD 235 137 Alzheimer's disease 276 26 7 Pneumonia/Influenza 229 138 Pneumonia/Influenza 256 21 8 Liver disease/cirrhosis 228 119 Lung Cancer 246 19 9 Hypertension 204 11
10 Drug overdose (Unintentional) 245 10 10 Renal failure 195 10
* Age-adjusted mortality rate per 100,000 using 2000 U.S. Standard Population
51

TABLE B-5 (continued): 10 LEADING CAUSES OF DEATH BY GENDER AND RACE/ETHNICITY, LOS ANGELES COUNTY, 2017
Black Male Black FemaleRank Cause of Death No. of Deaths AAMR* Rank Cause of Death No. of Deaths AAMR*
1 CHD 845 202 1 CHD 711 1232 Diabetes mellitus 223 55 2 Stroke 300 533 COPD 199 51 3 Alzheimer's disease 289 514 Lung Cancer 198 48 4 COPD 185 325 Stroke 197 50 5 Diabetes mellitus 182 326 Prostate cancer 187 52 6 Lung Cancer 174 307 Homicide 158 38 7 Breast cancer 158 288 Hypertensive heart disease 129 31 8 Hypertension 120 219 Alzheimer's disease 110 35 9 Pneumonia/Influenza 110 19
10 Renal failure 109 28 10 Renal failure 109 19
Asian Male Asian FemaleRank Cause of Death No. of Deaths AAMR* Rank Cause of Death No. of Deaths AAMR*
1 CHD 819 101 1 CHD 672 572 Stroke 284 36 2 Stroke 341 293 Lung Cancer 275 34 3 Alzheimer's disease 292 234 Pneumonia/Influenza 196 25 4 Diabetes mellitus 218 195 Diabetes mellitus 193 24 5 Breast cancer 189 186 COPD 172 21 6 Pneumonia/Influenza 186 167 Alzheimer's disease 139 18 7 Lung Cancer 172 158 Malignant neoplasms of liver and int 129 15 8 Hypertension 111 99 Renal failure 118 14 9 Colorectal Cancer 105 9
10 Colorectal Cancer 118 14 10 COPD 105 9
* Age-adjusted mortality rate per 100,000 using 2000 U.S. Standard Population
52

TABLE B-6: 10 LEADING CAUSES OF DEATH BY SERVICE PLANNING AREA (SPA), LOS ANGELES COUNTY, 2017
Antelope Valley (SPA 1) San Gabriel (SPA 3)Rank Cause of Death No. of Deaths AAMR* Rank Cause of Death No. of Deaths AAMR*
1 CHD 415 124 1 CHD 2,133 972 COPD 216 67 2 Alzheimer's disease 782 353 Alzheimer's disease 200 70 3 Stroke 679 314 Stroke 164 51 4 COPD 604 285 Diabetes mellitus 133 38 5 Diabetes mellitus 542 256 Lung Cancer 129 38 6 Lung Cancer 502 247 Motor vehicle crash 86 23 7 Pneumonia/Influenza 403 188 Liver disease/cirrhosis 72 19 8 Colorectal Cancer 286 139 Pneumonia/Influenza 61 19 9 Hypertension 274 13
10 Hypertension 58 17 10 Liver disease/cirrhosis 249 12
San Fernando (SPA 2) Metro (SPA 4)Rank Cause of Death No. of Deaths AAMR* Rank Cause of Death No. of Deaths AAMR*
1 CHD 2,671 108 1 CHD 1,189 972 Alzheimer's disease 1,147 47 2 Stroke 399 333 Stroke 766 32 3 Alzheimer's disease 342 274 COPD 645 27 4 Diabetes mellitus 295 245 Lung Cancer 560 23 5 Pneumonia/Influenza 242 206 Diabetes mellitus 453 19 6 Lung Cancer 233 197 Pneumonia/Influenza 419 18 7 COPD 207 178 Colorectal Cancer 296 12 8 Hypertension 184 159 Breast cancer 286 11 9 Liver disease/cirrhosis 170 13
10 Hypertension 284 12 10 Colorectal Cancer 150 12
* Age-adjusted mortality rate per 100,000 using 2000 U.S. Standard Population
53

TABLE B-6 (continued): 10 LEADING CAUSES OF DEATH BY SERVICE PLANNING AREA (SPA), LOS ANGELES COUNTY, 2017
West (SPA 5) East (SPA 7)Rank Cause of Death No. of Deaths AAMR* Rank Cause of Death No. of Deaths AAMR*
1 CHD 682 77 1 CHD 1,223 932 Alzheimer's disease 383 41 2 Stroke 474 373 Stroke 249 28 3 Alzheimer's disease 467 364 Lung Cancer 187 22 4 Diabetes mellitus 403 315 COPD 160 18 5 COPD 331 266 Pneumonia/Influenza 123 14 6 Lung Cancer 269 217 Malignant neoplasm of p 122 15 7 Liver disease/cirrhosis 231 178 Colorectal Cancer 94 11 8 Pneumonia/Influenza 225 179 Renal failure 93 11 9 Renal failure 211 16
10 Parkinson's disease 91 11 10 Colorectal Cancer 183 15
South (SPA 6) South Bay (SPA 8)Rank Cause of Death No. of Deaths AAMR* Rank Cause of Death No. of Deaths AAMR*
1 CHD 1,001 127 1 CHD 1,897 1112 Stroke 365 48 2 Stroke 653 393 Diabetes mellitus 350 44 3 Alzheimer's disease 635 394 COPD 243 32 4 COPD 521 315 Alzheimer's disease 223 32 5 Lung Cancer 472 296 Lung Cancer 204 26 6 Diabetes mellitus 396 237 Hypertension 181 23 7 Pneumonia/Influenza 320 198 Homicide 173 15 8 Colorectal Cancer 256 159 Liver disease/cirrhosis 168 18 9 Liver disease/cirrhosis 235 13
10 Pneumonia/Influenza 164 22 10 Renal failure 225 14
* Age-adjusted mortality rate per 100,000 using 2000 U.S. Standard Population
54

55
APPENDIX C
10 Leading Causes of Premature Death TABLE C-1. 10 Leading Causes of Premature Death, Los Angeles County, 2017 ............................................. 56
TABLE C-2. 10 Leading Causes of Premature Death by Gender, Los Angeles County, 2017 ............................ 57
TABLE C-3. 10 Leading Causes of Premature Death by Race/Ethnicity, Los Angeles County, 2017 ................ 58
TABLE C-4. 10 Leading Causes of Premature Death by Gender and Race/Ethnicity, Los Angeles County, 2017 .......................................................................................................................................................................... 59
TABLE C-5. 10 Leading Causes of Premature Death by Service Planning Area (SPA), Los Angeles County, 2017 .......................................................................................................................................................................... 61
Notes:
1. Statistics are of Los Angeles County residents only. 2. Cause of Death are categorized based on Table B. List of 113 Selected Causes of Death; and Table C. List of 130
Selected Causes of Infant Death. Reference: National Center for Health Statistics, National Vital Statistics System. ICD–10 cause-of-death lists for tabulating mortality statistics (updated September 2018 to include WHO updates to ICD–10 for data year 2017). NCHS Instruction Manual, part 9. Hyattsville, MD. 2018.
3. Age adjustment is made to US Standard Population 2000. Reference: Klein RJ, Schoenborn CA. Age adjustment using the 2000 projected U.S. population. Healthy People Statistical Notes, no. 20. Hyattsville, Maryland: National Center for Health Statistics, January 2001.
Data Sources:
1. Los Angeles County Department of Public Health, Los Angeles County Linked Death Data, 2017. 2. July 1, 2017 Population Estimates, Los Angeles County Internal Services Department, 2018/05/07.
Abbreviations:
1. CHD = Coronary Heart Disease 2. COPD = Chronic Obstructive Pulmonary Disease

TABLE C-1: 10 LEADING CAUSES OF PREMATURE DEATH, LOS ANGELES COUNTY, 2017
Rank Cause of Death YPLL-75 YPLL AAR*1 CHD 51,515 4312 Drug overdose (Unintentional) 27,743 2633 Suicide 26,016 2474 Motor vehicle crash 25,915 2465 Homicide 24,769 2386 Liver disease/cirrhosis 21,604 1927 Diabetes mellitus 19,102 1658 Stroke 16,085 1429 Lung Cancer 13,427 110
10 Breast cancer 12,224 109
* Age-adjusted rate per 100,000 using 2000 U.S. Standard Population
56

TABLE C-2: 10 LEADING CAUSES OF PREMATURE DEATH BY GENDER, LOS ANGELES COUNTY, 2017
Males FemalesRank Cause of Death YPLL-75 YPLL AAR* Rank Cause of Death YPLL-75 YPLL AAR*
1 CHD 38,524 669 1 CHD 12,991 2082 Homicide 21,021 398 2 Breast cancer 12,162 2123 Drug overdose (Unintentional) 20,576 390 3 Drug overdose (Unintentional) 7,167 1354 Suicide 20,138 379 4 Diabetes mellitus 6,870 1155 Motor vehicle crash 19,962 374 5 Stroke 6,442 1116 Liver disease/cirrhosis 15,230 276 6 Liver disease/cirrhosis 6,374 1137 Diabetes mellitus 12,232 218 7 Motor vehicle crash 5,953 1168 Stroke 9,643 175 8 Suicide 5,878 1139 Lung Cancer 7,707 132 9 Lung Cancer 5,720 90
10 Colorectal Cancer 6,585 119 10 Colorectal Cancer 4,566 79
* Age-adjusted rate per 100,000 using 2000 U.S. Standard Population
57
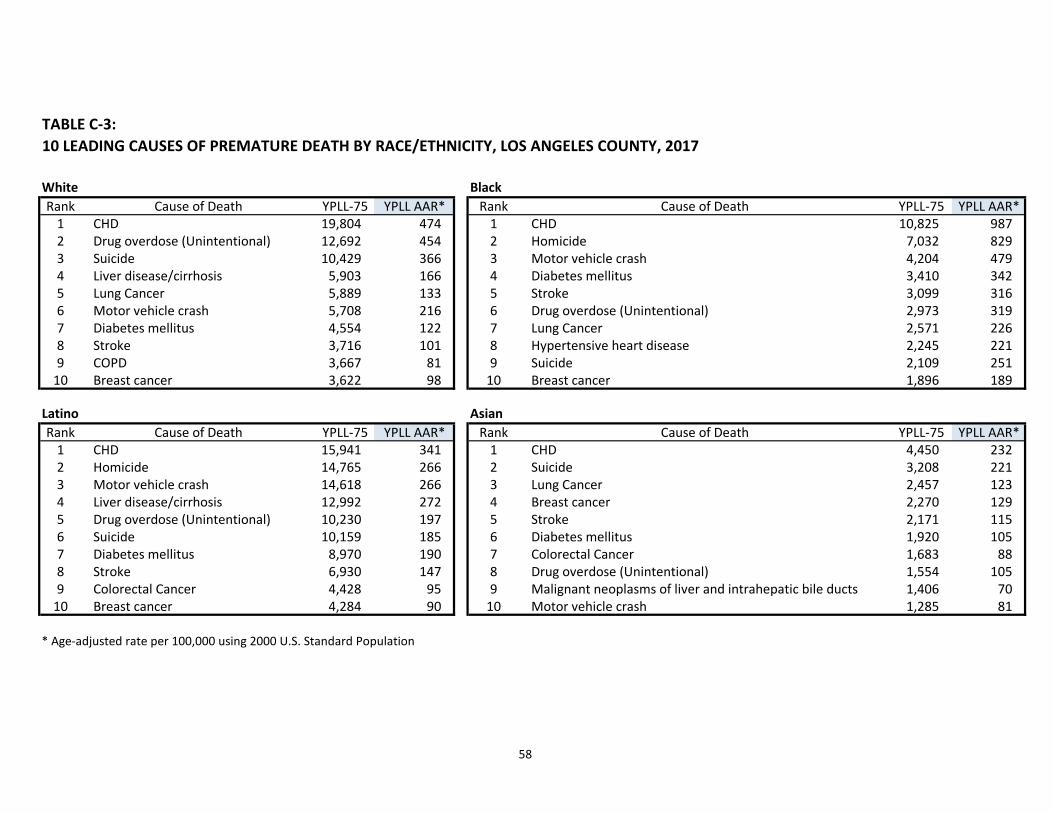
TABLE C-3: 10 LEADING CAUSES OF PREMATURE DEATH BY RACE/ETHNICITY, LOS ANGELES COUNTY, 2017
White BlackRank Cause of Death YPLL-75 YPLL AAR* Rank Cause of Death YPLL-75 YPLL AAR*
1 CHD 19,804 474 1 CHD 10,825 9872 Drug overdose (Unintentional) 12,692 454 2 Homicide 7,032 8293 Suicide 10,429 366 3 Motor vehicle crash 4,204 4794 Liver disease/cirrhosis 5,903 166 4 Diabetes mellitus 3,410 3425 Lung Cancer 5,889 133 5 Stroke 3,099 3166 Motor vehicle crash 5,708 216 6 Drug overdose (Unintentional) 2,973 3197 Diabetes mellitus 4,554 122 7 Lung Cancer 2,571 2268 Stroke 3,716 101 8 Hypertensive heart disease 2,245 2219 COPD 3,667 81 9 Suicide 2,109 251
10 Breast cancer 3,622 98 10 Breast cancer 1,896 189
Latino AsianRank Cause of Death YPLL-75 YPLL AAR* Rank Cause of Death YPLL-75 YPLL AAR*
1 CHD 15,941 341 1 CHD 4,450 2322 Homicide 14,765 266 2 Suicide 3,208 2213 Motor vehicle crash 14,618 266 3 Lung Cancer 2,457 1234 Liver disease/cirrhosis 12,992 272 4 Breast cancer 2,270 1295 Drug overdose (Unintentional) 10,230 197 5 Stroke 2,171 1156 Suicide 10,159 185 6 Diabetes mellitus 1,920 1057 Diabetes mellitus 8,970 190 7 Colorectal Cancer 1,683 888 Stroke 6,930 147 8 Drug overdose (Unintentional) 1,554 1059 Colorectal Cancer 4,428 95 9 Malignant neoplasms of liver and intrahepatic bile ducts 1,406 70
10 Breast cancer 4,284 90 10 Motor vehicle crash 1,285 81
* Age-adjusted rate per 100,000 using 2000 U.S. Standard Population
58
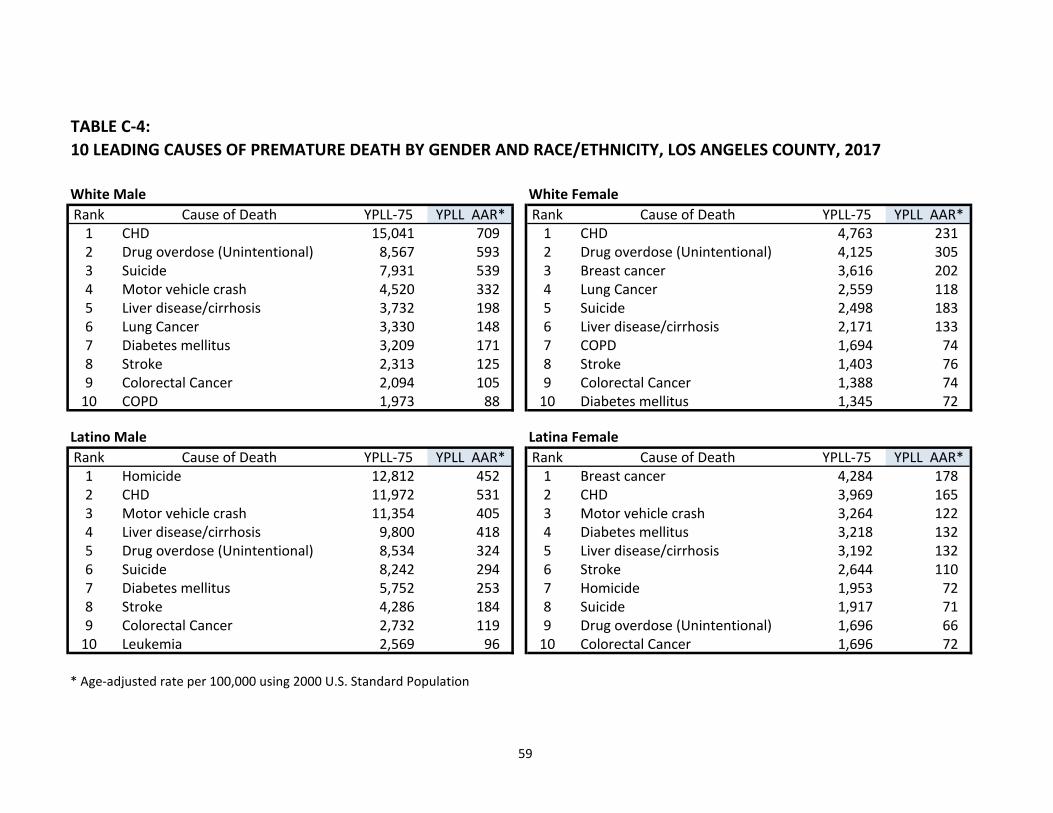
TABLE C-4: 10 LEADING CAUSES OF PREMATURE DEATH BY GENDER AND RACE/ETHNICITY, LOS ANGELES COUNTY, 2017
White Male White FemaleRank Cause of Death YPLL-75 YPLL AAR* Rank Cause of Death YPLL-75 YPLL AAR*
1 CHD 15,041 709 1 CHD 4,763 2312 Drug overdose (Unintentional) 8,567 593 2 Drug overdose (Unintentional) 4,125 3053 Suicide 7,931 539 3 Breast cancer 3,616 2024 Motor vehicle crash 4,520 332 4 Lung Cancer 2,559 1185 Liver disease/cirrhosis 3,732 198 5 Suicide 2,498 1836 Lung Cancer 3,330 148 6 Liver disease/cirrhosis 2,171 1337 Diabetes mellitus 3,209 171 7 COPD 1,694 748 Stroke 2,313 125 8 Stroke 1,403 769 Colorectal Cancer 2,094 105 9 Colorectal Cancer 1,388 74
10 COPD 1,973 88 10 Diabetes mellitus 1,345 72
Latino Male Latina FemaleRank Cause of Death YPLL-75 YPLL AAR* Rank Cause of Death YPLL-75 YPLL AAR*
1 Homicide 12,812 452 1 Breast cancer 4,284 1782 CHD 11,972 531 2 CHD 3,969 1653 Motor vehicle crash 11,354 405 3 Motor vehicle crash 3,264 1224 Liver disease/cirrhosis 9,800 418 4 Diabetes mellitus 3,218 1325 Drug overdose (Unintentional) 8,534 324 5 Liver disease/cirrhosis 3,192 1326 Suicide 8,242 294 6 Stroke 2,644 1107 Diabetes mellitus 5,752 253 7 Homicide 1,953 728 Stroke 4,286 184 8 Suicide 1,917 719 Colorectal Cancer 2,732 119 9 Drug overdose (Unintentional) 1,696 66
10 Leukemia 2,569 96 10 Colorectal Cancer 1,696 72
* Age-adjusted rate per 100,000 using 2000 U.S. Standard Population
59

TABLE C-4 (continued): 10 LEADING CAUSES OF PREMATURE DEATH BY GENDER AND RACE/ETHNICITY, LOS ANGELES COUNTY, 2017
Black Male Black FemaleRank Cause of Death YPLL-75 YPLL AAR* Rank Cause of Death YPLL-75 YPLL AAR*
1 CHD 7,548 1,513 1 CHD 3,277 5522 Homicide 6,224 1,518 2 Breast cancer 1,881 3463 Motor vehicle crash 3,227 759 3 Stroke 1,534 2914 Diabetes mellitus 2,150 470 4 Diabetes mellitus 1,260 2375 Drug overdose (Unintentional) 2,128 496 5 Lung Cancer 1,126 1726 Suicide 1,711 425 6 Motor vehicle crash 977 2177 Stroke 1,565 348 7 Hypertensive heart disease 863 1598 Lung Cancer 1,445 292 8 Drug overdose (Unintentional) 845 1629 Hypertensive heart disease 1,382 297 9 Homicide 808 196
10 HIV 1,254 284 10 Hypertension 795 139
Asian Male Asian FemaleRank Cause of Death YPLL-75 YPLL AAR* Rank Cause of Death YPLL-75 YPLL AAR*
1 CHD 3,563 416 1 Breast cancer 2,229 2312 Suicide 2,206 311 2 Suicide 1,002 1363 Lung Cancer 1,460 162 3 Lung Cancer 997 914 Stroke 1,356 161 4 CHD 887 805 Drug overdose (Unintentional) 1,239 174 5 Diabetes mellitus 882 96
6Malignant neoplasms of liver and intrahepatic bile ducts
1,076 118 6 Malignant neoplasm of ovary 843 82
7 Diabetes mellitus 1,038 116 7 Stroke 815 778 Colorectal Cancer 891 104 8 Colorectal Cancer 792 759 Motor vehicle crash 762 101 9 Motor vehicle crash 523 64
10 Malignant neoplasm of pancreas 585 67 10 Malignant neoplasm of stomach 444 45
* Age-adjusted rate per 100,000 using 2000 U.S. Standard Population
60

TABLE C-5: 10 LEADING CAUSES OF PREMATURE DEATH BY SERVICE PLANNING AREA (SPA), LOS ANGELES COUNTY, 2017
Antelope Valley (SPA 1) San Gabriel (SPA 3)Rank Cause of Death YPLL-75 YPLL AAR* Rank Cause of Death YPLL-75 YPLL AAR*
1 Motor vehicle crash 3,038 764 1 CHD 8,166 3682 CHD 2,644 603 2 Suicide 4,426 2483 Suicide 1,476 382 3 Motor vehicle crash 4,395 2474 Drug overdose (Unintentional) 1,463 381 4 Liver disease/cirrhosis 3,758 1895 Diabetes mellitus 1,403 333 5 Diabetes mellitus 3,457 1656 Liver disease/cirrhosis 1,112 284 6 Drug overdose (Unintentional) 3,318 1887 Homicide 1,108 298 7 Homicide 3,226 1858 Stroke 1,097 286 8 Lung Cancer 2,776 1229 COPD 1,016 236 9 Colorectal Cancer 2,299 110
10 Lung Cancer 785 172 10 Stroke 2,250 110
San Fernando (SPA 2) Metro (SPA 4)Rank Cause of Death YPLL-75 YPLL AAR* Rank Cause of Death YPLL-75 YPLL AAR*
1 CHD 11,039 401 1 CHD 5,767 4292 Drug overdose (Unintentional) 6,705 293 2 Suicide 3,884 3033 Suicide 5,616 242 3 Drug overdose (Unintentional) 3,251 2434 Motor vehicle crash 4,158 178 4 Liver disease/cirrhosis 2,866 2145 Liver disease/cirrhosis 3,655 141 5 Homicide 2,548 2156 Homicide 2,854 125 6 Diabetes mellitus 2,178 1617 Stroke 2,776 105 7 Motor vehicle crash 2,177 1728 Lung Cancer 2,775 96 8 Stroke 1,982 1499 Breast cancer 2,751 105 9 Lung Cancer 1,365 104
10 Diabetes mellitus 2,606 96 10 Colorectal Cancer 1,230 91
* Age-adjusted rate per 100,000 using 2000 U.S. Standard Population
61

TABLE C-5 (continued): 10 LEADING CAUSES OF PREMATURE DEATH BY SERVICE PLANNING AREA (SPA), LOS ANGELES COUNTY, 2017
West (SPA 5) East (SPA 7)Rank Cause of Death YPLL-75 YPLL AAR* Rank Cause of Death YPLL-75 YPLL AAR*
1 Drug overdose (Unintentional) 2,291 326 1 CHD 5,872 4162 CHD 2,236 261 2 Motor vehicle crash 3,416 2493 Suicide 1,655 239 3 Liver disease/cirrhosis 3,383 2494 Lung Cancer 890 105 4 Suicide 3,207 2365 Breast cancer 676 84 5 Diabetes mellitus 3,149 2276 Stroke 674 101 6 Drug overdose (Unintentional) 2,972 2287 Motor vehicle crash 651 93 7 Homicide 2,324 1808 Homicide 531 73 8 Stroke 2,134 1589 Malignant neoplasm of pancreas 526 58 9 Breast cancer 1,467 113
10 Colorectal Cancer 511 63 10 Colorectal Cancer 1,297 98
South (SPA 6) South Bay (SPA 8)Rank Cause of Death YPLL-75 YPLL AAR* Rank Cause of Death YPLL-75 YPLL AAR*
1 Homicide 7,595 647 1 CHD 9,164 4822 CHD 6,627 660 2 Homicide 4,583 2913 Motor vehicle crash 4,183 366 3 Drug overdose (Unintentional) 4,506 2814 Drug overdose (Unintentional) 3,237 306 4 Motor vehicle crash 3,897 2405 Liver disease/cirrhosis 2,866 286 5 Liver disease/cirrhosis 3,524 1996 Diabetes mellitus 2,814 282 6 Suicide 3,488 2187 Stroke 2,327 234 7 Diabetes mellitus 3,070 1728 Suicide 2,264 198 8 Stroke 2,845 1589 Breast cancer 1,371 140 9 Breast cancer 2,345 139
10 Lung Cancer 1,339 132 10 Lung Cancer 2,273 119
* Age-adjusted rate per 100,000 using 2000 U.S. Standard Population
62

63
APPENDIX D
Trends in Mortality TABLE D-1. Trends in Alzheimer’s Disease Mortality ..................................................................... 64
TABLE D-2. Trends in Breast Cancer (Female) Mortality ............................................................... 65
TABLE D-3. Trends in Chronic Obstructive Pulmonary Disease (COPD) Mortality......................... 66
TABLE D-4. Trends in Colorectal Cancer Mortality ........................................................................ 67
TABLE D-5. Trends in Coronary Heart Disease (CHD) Mortality .................................................... 68
TABLE D-6. Trends in Diabetes Mellitus Mortality ......................................................................... 69
TABLE D-7. Trends in Drug Overdose Mortality ............................................................................. 70
TABLE D-8. Trends in Homicide Mortality ...................................................................................... 71
TABLE D-9. Trends in HIV Mortality ............................................................................................... 72
TABLE D-10. Trends in Liver Disease/Cirrhosis Mortality .............................................................. 73
TABLE D-11. Trends in Lung Cancer Mortality ............................................................................... 74
TABLE D-12. Trends in Motor Vehicle Crash Mortality .................................................................. 75
TABLE D-13. Trends in Pneumonia/Influenza Mortality ................................................................ 76
TABLE D-14. Trends in Stroke Mortality ........................................................................................ 77
TABLE D-15. Trends in Suicide Mortality ....................................................................................... 78
TABLE D-16. Trends in Morality from All Causes of Death ............................................................ 79
FIGURE D-1. Trends in Leading Causes of Death, Los Angeles County, 2008-2017 ....................... 80
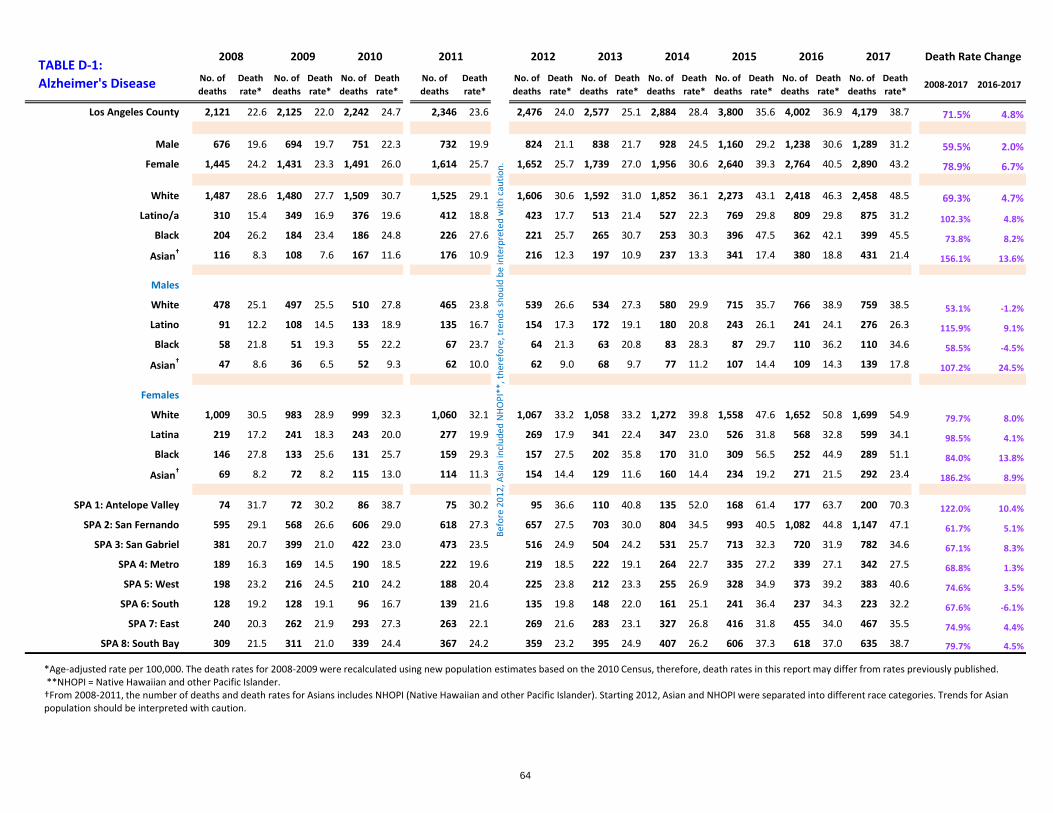
No. of deaths
Death rate*
No. of deaths
Death rate*
No. of deaths
Death rate*
No. of deaths
Death rate*
No. of deaths
Death rate*
No. of deaths
Death rate*
No. of deaths
Death rate*
No. of deaths
Death rate*
No. of deaths
Death rate*
No. of deaths
Death rate*
2008-2017 2016-2017
Los Angeles County 2,121 22.6 2,125 22.0 2,242 24.7 2,346 23.6 2,476 24.0 2,577 25.1 2,884 28.4 3,800 35.6 4,002 36.9 4,179 38.7 71.5% 4.8%
Male 676 19.6 694 19.7 751 22.3 732 19.9 824 21.1 838 21.7 928 24.5 1,160 29.2 1,238 30.6 1,289 31.2 59.5% 2.0%Female 1,445 24.2 1,431 23.3 1,491 26.0 1,614 25.7 1,652 25.7 1,739 27.0 1,956 30.6 2,640 39.3 2,764 40.5 2,890 43.2 78.9% 6.7%
White 1,487 28.6 1,480 27.7 1,509 30.7 1,525 29.1 1,606 30.6 1,592 31.0 1,852 36.1 2,273 43.1 2,418 46.3 2,458 48.5 69.3% 4.7%Latino/a 310 15.4 349 16.9 376 19.6 412 18.8 423 17.7 513 21.4 527 22.3 769 29.8 809 29.8 875 31.2 102.3% 4.8%
Black 204 26.2 184 23.4 186 24.8 226 27.6 221 25.7 265 30.7 253 30.3 396 47.5 362 42.1 399 45.5 73.8% 8.2%
Asian† 116 8.3 108 7.6 167 11.6 176 10.9 216 12.3 197 10.9 237 13.3 341 17.4 380 18.8 431 21.4 156.1% 13.6%
Males
White 478 25.1 497 25.5 510 27.8 465 23.8 539 26.6 534 27.3 580 29.9 715 35.7 766 38.9 759 38.5 53.1% -1.2%
Latino 91 12.2 108 14.5 133 18.9 135 16.7 154 17.3 172 19.1 180 20.8 243 26.1 241 24.1 276 26.3 115.9% 9.1%
Black 58 21.8 51 19.3 55 22.2 67 23.7 64 21.3 63 20.8 83 28.3 87 29.7 110 36.2 110 34.6 58.5% -4.5%
Asian† 47 8.6 36 6.5 52 9.3 62 10.0 62 9.0 68 9.7 77 11.2 107 14.4 109 14.3 139 17.8 107.2% 24.5%
Females
White 1,009 30.5 983 28.9 999 32.3 1,060 32.1 1,067 33.2 1,058 33.2 1,272 39.8 1,558 47.6 1,652 50.8 1,699 54.9 79.7% 8.0%
Latina 219 17.2 241 18.3 243 20.0 277 19.9 269 17.9 341 22.4 347 23.0 526 31.8 568 32.8 599 34.1 98.5% 4.1%
Black 146 27.8 133 25.6 131 25.7 159 29.3 157 27.5 202 35.8 170 31.0 309 56.5 252 44.9 289 51.1 84.0% 13.8%
Asian† 69 8.2 72 8.2 115 13.0 114 11.3 154 14.4 129 11.6 160 14.4 234 19.2 271 21.5 292 23.4 186.2% 8.9%
SPA 1: Antelope Valley 74 31.7 72 30.2 86 38.7 75 30.2 95 36.6 110 40.8 135 52.0 168 61.4 177 63.7 200 70.3 122.0% 10.4%
SPA 2: San Fernando 595 29.1 568 26.6 606 29.0 618 27.3 657 27.5 703 30.0 804 34.5 993 40.5 1,082 44.8 1,147 47.1 61.7% 5.1%
SPA 3: San Gabriel 381 20.7 399 21.0 422 23.0 473 23.5 516 24.9 504 24.2 531 25.7 713 32.3 720 31.9 782 34.6 67.1% 8.3%
SPA 4: Metro 189 16.3 169 14.5 190 18.5 222 19.6 219 18.5 222 19.1 264 22.7 335 27.2 339 27.1 342 27.5 68.8% 1.3%
SPA 5: West 198 23.2 216 24.5 210 24.2 188 20.4 225 23.8 212 23.3 255 26.9 328 34.9 373 39.2 383 40.6 74.6% 3.5%
SPA 6: South 128 19.2 128 19.1 96 16.7 139 21.6 135 19.8 148 22.0 161 25.1 241 36.4 237 34.3 223 32.2 67.6% -6.1%
SPA 7: East 240 20.3 262 21.9 293 27.3 263 22.1 269 21.6 283 23.1 327 26.8 416 31.8 455 34.0 467 35.5 74.9% 4.4%
SPA 8: South Bay 309 21.5 311 21.0 339 24.4 367 24.2 359 23.2 395 24.9 407 26.2 606 37.3 618 37.0 635 38.7 79.7% 4.5%
TABLE D-1: Alzheimer's Disease
Death Rate Change20092008 2010 2011 2017
Befo
re 2
012,
Asia
n in
clud
ed N
HOPI
**, t
here
fore
, tre
nds s
houl
d be
inte
rpre
ted
with
cau
tion.
2012 2013 2014 2015 2016
*Age-adjusted rate per 100,000. The death rates for 2008-2009 were recalculated using new population estimates based on the 2010 Census, therefore, death rates in this report may differ from rates previously published.**NHOPI = Native Hawaiian and other Pacific Islander.
†From 2008-2011, the number of deaths and death rates for Asians includes NHOPI (Native Hawaiian and other Pacific Islander). Starting 2012, Asian and NHOPI were separated into different race categories. Trends for Asian population should be interpreted with caution.
64
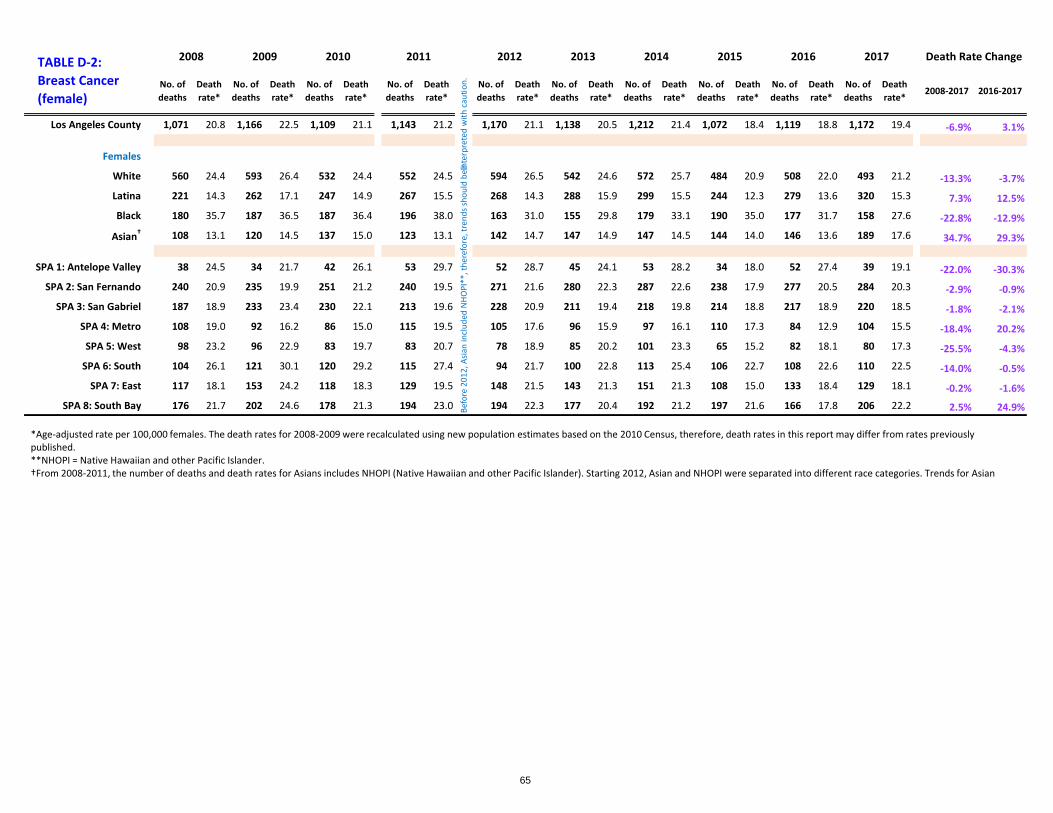
No. of deaths
Death rate*
No. of deaths
Death rate*
No. of deaths
Death rate*
No. of deaths
Death rate*
No. of deaths
Death rate*
No. of deaths
Death rate*
No. of deaths
Death rate*
No. of deaths
Death rate*
No. of deaths
Death rate*
No. of deaths
Death rate*
2008-2017 2016-2017
Los Angeles County 1,071 20.8 1,166 22.5 1,109 21.1 1,143 21.2 1,170 21.1 1,138 20.5 1,212 21.4 1,072 18.4 1,119 18.8 1,172 19.4 -6.9% 3.1%
Females
White 560 24.4 593 26.4 532 24.4 552 24.5 594 26.5 542 24.6 572 25.7 484 20.9 508 22.0 493 21.2 -13.3% -3.7% Latina 221 14.3 262 17.1 247 14.9 267 15.5 268 14.3 288 15.9 299 15.5 244 12.3 279 13.6 320 15.3 7.3% 12.5%
Black 180 35.7 187 36.5 187 36.4 196 38.0 163 31.0 155 29.8 179 33.1 190 35.0 177 31.7 158 27.6 -22.8% -12.9%
Asian† 108 13.1 120 14.5 137 15.0 123 13.1 142 14.7 147 14.9 147 14.5 144 14.0 146 13.6 189 17.6 34.7% 29.3%
SPA 1: Antelope Valley 38 24.5 34 21.7 42 26.1 53 29.7 52 28.7 45 24.1 53 28.2 34 18.0 52 27.4 39 19.1 -22.0% -30.3%SPA 2: San Fernando 240 20.9 235 19.9 251 21.2 240 19.5 271 21.6 280 22.3 287 22.6 238 17.9 277 20.5 284 20.3 -2.9% -0.9%
SPA 3: San Gabriel 187 18.9 233 23.4 230 22.1 213 19.6 228 20.9 211 19.4 218 19.8 214 18.8 217 18.9 220 18.5 -1.8% -2.1%SPA 4: Metro 108 19.0 92 16.2 86 15.0 115 19.5 105 17.6 96 15.9 97 16.1 110 17.3 84 12.9 104 15.5 -18.4% 20.2%
SPA 5: West 98 23.2 96 22.9 83 19.7 83 20.7 78 18.9 85 20.2 101 23.3 65 15.2 82 18.1 80 17.3 -25.5% -4.3%SPA 6: South 104 26.1 121 30.1 120 29.2 115 27.4 94 21.7 100 22.8 113 25.4 106 22.7 108 22.6 110 22.5 -14.0% -0.5%
SPA 7: East 117 18.1 153 24.2 118 18.3 129 19.5 148 21.5 143 21.3 151 21.3 108 15.0 133 18.4 129 18.1 -0.2% -1.6%SPA 8: South Bay 176 21.7 202 24.6 178 21.3 194 23.0 194 22.3 177 20.4 192 21.2 197 21.6 166 17.8 206 22.2 2.5% 24.9%
TABLE D-2: Breast Cancer (female)
Death Rate Change2008 2009 2010 2011 2017
Befo
re 2
012,
Asia
n in
clud
ed N
HOPI
**, t
here
fore
, tre
nds s
houl
d be
inte
rpre
ted
with
cau
tion.
2012 2013 2014 2015 2016
*Age-adjusted rate per 100,000 females. The death rates for 2008-2009 were recalculated using new population estimates based on the 2010 Census, therefore, death rates in this report may differ from rates previously published. **NHOPI = Native Hawaiian and other Pacific Islander.†From 2008-2011, the number of deaths and death rates for Asians includes NHOPI (Native Hawaiian and other Pacific Islander). Starting 2012, Asian and NHOPI were separated into different race categories. Trends for Asian
65
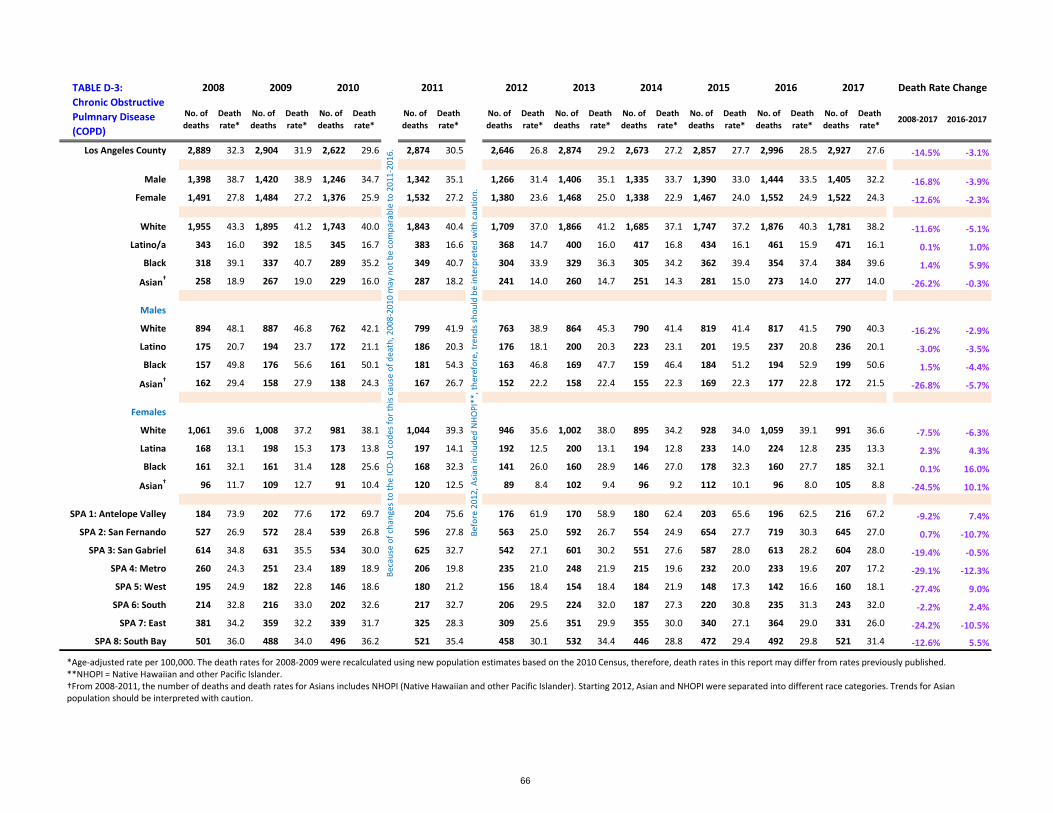
No. of deaths
Death rate*
No. of deaths
Death rate*
No. of deaths
Death rate*
No. of deaths
Death rate*
No. of deaths
Death rate*
No. of deaths
Death rate*
No. of deaths
Death rate*
No. of deaths
Death rate*
No. of deaths
Death rate*
No. of deaths
Death rate*
2008-2017 2016-2017
Los Angeles County 2,889 32.3 2,904 31.9 2,622 29.6 2,874 30.5 2,646 26.8 2,874 29.2 2,673 27.2 2,857 27.7 2,996 28.5 2,927 27.6 -14.5% -3.1%
Male 1,398 38.7 1,420 38.9 1,246 34.7 1,342 35.1 1,266 31.4 1,406 35.1 1,335 33.7 1,390 33.0 1,444 33.5 1,405 32.2 -16.8% -3.9%Female 1,491 27.8 1,484 27.2 1,376 25.9 1,532 27.2 1,380 23.6 1,468 25.0 1,338 22.9 1,467 24.0 1,552 24.9 1,522 24.3 -12.6% -2.3%
White 1,955 43.3 1,895 41.2 1,743 40.0 1,843 40.4 1,709 37.0 1,866 41.2 1,685 37.1 1,747 37.2 1,876 40.3 1,781 38.2 -11.6% -5.1%Latino/a 343 16.0 392 18.5 345 16.7 383 16.6 368 14.7 400 16.0 417 16.8 434 16.1 461 15.9 471 16.1 0.1% 1.0%
Black 318 39.1 337 40.7 289 35.2 349 40.7 304 33.9 329 36.3 305 34.2 362 39.4 354 37.4 384 39.6 1.4% 5.9%
Asian† 258 18.9 267 19.0 229 16.0 287 18.2 241 14.0 260 14.7 251 14.3 281 15.0 273 14.0 277 14.0 -26.2% -0.3%
Males
White 894 48.1 887 46.8 762 42.1 799 41.9 763 38.9 864 45.3 790 41.4 819 41.4 817 41.5 790 40.3 -16.2% -2.9%Latino 175 20.7 194 23.7 172 21.1 186 20.3 176 18.1 200 20.3 223 23.1 201 19.5 237 20.8 236 20.1 -3.0% -3.5%
Black 157 49.8 176 56.6 161 50.1 181 54.3 163 46.8 169 47.7 159 46.4 184 51.2 194 52.9 199 50.6 1.5% -4.4%
Asian† 162 29.4 158 27.9 138 24.3 167 26.7 152 22.2 158 22.4 155 22.3 169 22.3 177 22.8 172 21.5 -26.8% -5.7%
Females
White 1,061 39.6 1,008 37.2 981 38.1 1,044 39.3 946 35.6 1,002 38.0 895 34.2 928 34.0 1,059 39.1 991 36.6 -7.5% -6.3%Latina 168 13.1 198 15.3 173 13.8 197 14.1 192 12.5 200 13.1 194 12.8 233 14.0 224 12.8 235 13.3 2.3% 4.3%
Black 161 32.1 161 31.4 128 25.6 168 32.3 141 26.0 160 28.9 146 27.0 178 32.3 160 27.7 185 32.1 0.1% 16.0%
Asian† 96 11.7 109 12.7 91 10.4 120 12.5 89 8.4 102 9.4 96 9.2 112 10.1 96 8.0 105 8.8 -24.5% 10.1%
SPA 1: Antelope Valley 184 73.9 202 77.6 172 69.7 204 75.6 176 61.9 170 58.9 180 62.4 203 65.6 196 62.5 216 67.2 -9.2% 7.4%SPA 2: San Fernando 527 26.9 572 28.4 539 26.8 596 27.8 563 25.0 592 26.7 554 24.9 654 27.7 719 30.3 645 27.0 0.7% -10.7%
SPA 3: San Gabriel 614 34.8 631 35.5 534 30.0 625 32.7 542 27.1 601 30.2 551 27.6 587 28.0 613 28.2 604 28.0 -19.4% -0.5%SPA 4: Metro 260 24.3 251 23.4 189 18.9 206 19.8 235 21.0 248 21.9 215 19.6 232 20.0 233 19.6 207 17.2 -29.1% -12.3%
SPA 5: West 195 24.9 182 22.8 146 18.6 180 21.2 156 18.4 154 18.4 184 21.9 148 17.3 142 16.6 160 18.1 -27.4% 9.0%SPA 6: South 214 32.8 216 33.0 202 32.6 217 32.7 206 29.5 224 32.0 187 27.3 220 30.8 235 31.3 243 32.0 -2.2% 2.4%
SPA 7: East 381 34.2 359 32.2 339 31.7 325 28.3 309 25.6 351 29.9 355 30.0 340 27.1 364 29.0 331 26.0 -24.2% -10.5%SPA 8: South Bay 501 36.0 488 34.0 496 36.2 521 35.4 458 30.1 532 34.4 446 28.8 472 29.4 492 29.8 521 31.4 -12.6% 5.5%
TABLE D-3: Chronic Obstructive Pulmnary Disease (COPD)
Death Rate Change20092008 2010
Beca
use
of c
hang
es to
the
ICD-
10 c
odes
for t
his c
ause
of d
eath
, 200
8-20
10 m
ay n
ot b
e co
mpa
rabl
e to
201
1-20
16.
2011 2017
Befo
re 2
012,
Asia
n in
clud
ed N
HOPI
**, t
here
fore
, tre
nds s
houl
d be
inte
rpre
ted
with
cau
tion.
2012 2013 2014 2015 2016
*Age-adjusted rate per 100,000. The death rates for 2008-2009 were recalculated using new population estimates based on the 2010 Census, therefore, death rates in this report may differ from rates previously published. **NHOPI = Native Hawaiian and other Pacific Islander.†From 2008-2011, the number of deaths and death rates for Asians includes NHOPI (Native Hawaiian and other Pacific Islander). Starting 2012, Asian and NHOPI were separated into different race categories. Trends for Asian population should be interpreted with caution.
66

No. of deaths
Death rate*
No. of deaths
Death rate*
No. of deaths
Death rate*
No. of deaths
Death rate*
No. of deaths
Death rate*
No. of deaths
Death rate*
No. of deaths
Death rate*
No. of deaths
Death rate*
No. of deaths
Death rate*
No. of deaths
Death rate*
2008-2017 2016-2017
Los Angeles County 1,365 15.0 1,388 15.0 1,285 14.0 1,400 14.5 1,397 13.9 1,376 13.8 1,372 13.6 1,482 14.0 1,358 12.7 1,449 13.4 -10.3% 5.8%
Male 703 18.2 710 18.0 663 16.8 715 17.0 737 16.8 709 16.3 710 16.2 771 16.4 698 14.9 762 16.1 -11.3% 8.1%Female 662 12.6 678 12.7 622 11.9 685 12.6 660 11.6 667 11.8 662 11.6 711 12.0 660 10.9 687 11.3 -10.6% 3.5%
White 660 15.0 696 15.6 619 14.8 613 14.1 606 14.0 632 15.0 611 14.3 611 13.8 597 13.4 622 14.0 -6.8% 4.3%Latino/a 306 12.1 286 11.4 296 11.3 359 12.7 345 11.2 347 11.5 320 10.7 400 12.0 366 10.6 404 11.5 -4.9% 8.8%
Black 196 23.1 209 24.8 195 23.4 194 22.0 221 24.0 181 19.7 191 20.8 195 20.6 166 17.7 188 19.5 -15.7% 10.1%
Asian† 197 13.9 195 13.5 173 11.4 228 13.9 216 12.5 204 11.6 234 13.0 263 14.1 214 11.3 223 11.4 -17.8% 1.0%
Males
White 325 17.3 345 18.0 317 17.3 312 16.1 313 16.2 306 16.2 315 16.4 309 15.2 296 14.8 311 15.6 -9.6% 5.7%Latino 167 15.5 169 16.5 157 13.9 192 15.7 191 14.3 194 14.8 168 13.6 217 15.3 188 11.8 225 14.5 -6.5% 22.6%
Black 96 27.9 95 27.0 97 27.7 94 26.6 114 30.6 88 23.4 94 24.5 95 23.3 84 21.3 101 26.2 -6.0% 23.0%
Asian† 111 18.2 101 16.1 91 13.9 113 16.2 116 15.9 114 15.1 124 16.0 142 17.8 121 15.2 118 14.1 -22.5% -7.0%
Females
White 335 13.3 351 13.7 302 12.7 301 12.5 293 12.0 326 13.7 296 12.6 302 12.5 301 12.3 311 12.4 -6.7% 0.8%Latina 139 9.6 117 8.0 139 9.4 167 10.6 154 9.0 153 9.1 152 8.8 183 9.7 178 9.5 179 9.2 -4.3% -2.9%
Black 100 19.8 114 22.9 98 19.8 100 18.9 107 19.6 93 17.3 97 18.1 100 18.6 82 14.9 87 15.2 -23.1% 2.0%
Asian† 86 10.7 94 11.5 82 9.4 115 12.3 100 10.0 90 9.1 110 10.6 121 11.1 93 8.3 105 9.4 -12.1% 12.9%
SPA 1: Antelope Valley 36 13.7 52 19.3 49 16.6 39 12.4 52 16.0 52 16.8 46 14.8 57 16.6 53 15.4 55 17.3 25.9% 12.2%SPA 2: San Fernando 301 14.9 294 14.0 281 13.5 312 14.3 288 12.6 308 13.6 295 12.9 323 13.3 306 12.5 296 12.1 -18.9% -3.3%
SPA 3: San Gabriel 251 14.2 263 14.7 250 13.8 267 13.9 268 13.5 307 15.5 283 14.1 306 14.7 286 13.7 286 13.1 -7.5% -4.3%SPA 4: Metro 154 14.6 149 14.1 133 13.4 152 14.0 173 15.8 142 12.9 142 12.7 166 14.4 155 12.8 150 12.1 -16.7% -5.3%SPA 5: West 98 13.2 102 13.3 92 12.0 99 12.7 83 10.1 75 9.4 92 11.8 102 12.1 81 9.4 94 10.8 -18.0% 15.3%
SPA 6: South 128 19.0 140 20.9 117 17.3 119 16.8 135 18.5 116 16.0 140 18.7 131 16.3 115 15.0 129 16.3 -14.5% 8.4%SPA 7: East 163 14.6 152 13.4 149 13.4 176 14.8 186 15.3 168 14.2 161 13.2 167 12.9 153 11.7 183 14.6 0.0% 25.0%
SPA 8: South Bay 229 15.7 235 16.1 213 14.8 235 15.5 211 13.4 208 13.1 212 13.4 230 13.9 208 12.2 256 15.1 -3.9% 23.4%
TABLE D-4: Colorectal Cancer
Death Rate Change2008 2009 2010
Beca
use
of c
hang
es to
the
ICD-
10 c
odes
for t
his c
ause
of d
eath
, 200
7-20
10 m
ay n
ot b
e co
mpa
rabl
e to
201
1-20
16.
2011 2017
Befo
re 2
012,
Asia
n in
clud
ed N
HOPI
**, t
here
fore
, tre
nds s
houl
d be
inte
rpre
ted
with
cau
tion.
2012 2013 2014 2015 2016
*Age-adjusted rate per 100,000. The death rates for 2008-2009 were recalculated using new population estimates based on the 2010 Census, therefore, death rates in this report may differ from rates previously published. **NHOPI = Native Hawaiian and other Pacific Islander.†From 2008-2011, the number of deaths and death rates for Asians includes NHOPI (Native Hawaiian and other Pacific Islander). Starting 2012, Asian and NHOPI were separated into different race categories. Trends for Asian population should be interpreted with caution.
67

No. of deaths
Death rate*
No. of deaths
Death rate*
No. of deaths
Death rate*
No. of deaths
Death rate*
No. of deaths
Death rate*
No. of deaths
Death rate*
No. of deaths
Death rate*
No. of deaths
Death rate*
No. of deaths
Death rate*
No. of deaths
Death rate*
2008-2017 2016-2017
Los Angeles County 13,428 145.6 12,725 135.1 12,635 137.8 11,913 121.5 11,677 114.7 11,827 116.7 11,062 109.0 11,385 107.6 11,115 103.1 11,211 102.9 -29.3% -0.1%
Male 7,001 185.5 6,638 171.2 6,651 175.4 6,237 153.8 6,332 149.2 6,436 152.1 6,114 143.1 6,263 141.5 6,284 138.1 6,260 135.0 -27.2% -2.3%Female 6,427 114.2 6,087 106.3 5,984 108.4 5,676 95.7 5,345 87.1 5,391 88.6 4,948 81.8 5,122 81.3 4,831 75.7 4,951 77.5 -32.1% 2.4%
White 7,596 160.3 6,980 145.1 6,845 151.3 6,475 135.4 6,298 132.1 6,188 132.3 5,672 122.0 5,809 121.1 5,485 116.1 5,497 116.7 -27.2% 0.5%Latino/a 2,536 112.7 2,428 104.7 2,555 110.9 2,404 96.2 2,383 88.1 2,516 92.5 2,434 87.7 2,515 85.4 2,533 80.9 2,597 81.0 -28.1% 0.2%
Black 1,804 217.9 1,878 221.2 1,721 208.0 1,571 178.5 1,583 173.8 1,619 177.1 1,511 164.5 1,528 164.3 1,543 160.2 1,556 157.8 -27.6% -1.5%
Asian† 1,437 103.3 1,387 97.2 1,451 98.5 1,396 86.7 1,301 74.3 1,398 78.4 1,347 76.2 1,412 74.8 1,427 73.4 1,491 75.5 -26.9% 2.8%
Males
White 3,905 205.1 3,598 185.5 3,566 192.0 3,342 171.1 3,411 171.9 3,360 172.2 3,194 163.7 3,189 158.2 3,124 156.2 3,062 151.3 -26.2% -3.1%Latino 1,349 141.2 1,333 134.7 1,372 138.3 1,323 124.4 1,271 109.7 1,418 121.8 1,325 110.7 1,421 112.7 1,436 106.4 1,490 107.9 -23.6% 1.4%
Black 940 284.6 957 278.7 898 273.0 817 227.6 863 233.7 836 221.5 828 218.1 826 216.4 877 219.4 845 201.9 -29.1% -8.0%
Asian† 770 131.8 718 119.3 776 127.9 706 105.5 707 98.1 765 104.8 711 97.2 759 98.1 781 98.2 819 100.9 -23.4% 2.8%
Females
White 3,691 123.0 3,382 111.2 3,279 116.3 3,133 104.6 2,887 97.6 2,828 98.3 2,478 86.2 2,620 90.4 2,361 83.2 2,435 87.3 -29.1% 4.9%Latina 1,187 90.8 1,095 82.0 1,183 90.1 1,081 75.2 1,112 71.4 1,098 70.3 1,109 70.1 1,094 64.8 1,097 61.5 1,107 60.7 -33.2% -1.4%
Black 864 170.8 921 178.1 823 162.8 754 141.2 720 129.8 783 141.4 683 124.2 702 126.0 666 116.5 711 122.9 -28.1% 5.5%
Asian† 667 81.2 669 79.3 675 77.0 690 72.1 594 56.3 633 58.8 636 60.2 653 57.3 646 54.6 672 56.7 -30.2% 3.8%
SPA 1: Antelope Valley 459 175.7 476 180.0 499 188.2 404 141.8 423 142.4 453 148.4 466 148.1 431 134.7 424 129.5 415 123.8 -29.5% -4.4%SPA 2: San Fernando 3,081 151.7 2,828 134.7 2,852 136.5 2,702 121.1 2,657 113.3 2,717 118.5 2,511 108.8 2,630 109.3 2,515 104.0 2,671 108.3 -28.6% 4.2%
SPA 3: San Gabriel 2,486 137.3 2,304 125.7 2,270 123.8 2,219 112.1 2,168 106.7 2,193 106.6 2,080 101.9 2,093 97.7 2,060 94.8 2,133 97.1 -29.3% 2.4%SPA 4: Metro 1,469 135.4 1,414 130.4 1,495 147.8 1,350 124.6 1,333 117.5 1,323 116.5 1,254 110.9 1,282 109.1 1,305 107.0 1,189 97.0 -28.3% -9.3%
SPA 5: West 882 110.8 854 103.9 817 98.5 823 94.5 822 94.1 764 87.7 700 81.9 729 82.6 735 83.9 682 76.9 -30.6% -8.4%SPA 6: South 1,222 183.4 1,271 187.4 1,112 173.0 1,063 155.3 1,031 142.1 1,061 147.5 987 135.5 1,020 136.5 1,031 130.3 1,001 127.4 -30.6% -2.2%
SPA 7: East 1,588 138.6 1,488 128.3 1,463 133.7 1,401 118.9 1,345 109.1 1,373 113.2 1,243 101.7 1,280 99.2 1,201 91.8 1,223 92.9 -33.0% 1.2%SPA 8: South Bay 2,143 148.6 2,029 137.0 2,064 144.3 1,936 126.7 1,896 120.4 1,933 122.1 1,811 113.3 1,911 115.4 1,834 107.9 1,897 111.2 -25.2% 3.0%
TABLE D-5: Coronary Heart Disease (CHD)
Death Rate Change2008 2009 2010
Beca
use
of c
hang
es to
the
ICD-
10 c
odes
for t
his c
ause
of d
eath
, 200
7-20
10 m
ay n
ot b
e co
mpa
rabl
e to
201
1-20
16.
2011 2017
Befo
re 2
012,
Asia
n in
clud
ed N
HOPI
**, t
here
fore
, tre
nds s
houl
d be
inte
rpre
ted
with
cau
tion.
2012 2013 2014 2015 2016
*Age-adjusted rate per 100,000. The death rates for 2008-2009 were recalculated using new population estimates based on the 2010 Census, therefore, death rates in this report may differ from rates previously published.**NHOPI = Native Hawaiian and other Pacific Islander. †From 2008-2011, the number of deaths and death rates for Asians includes NHOPI (Native Hawaiian and other Pacific Islander). Starting 2012, Asian and NHOPI were separated into different race categories. Trends for Asian population should be interpreted with caution.
68

No. of deaths
Death rate*
No. of deaths
Death rate*
No. of deaths
Death rate*
No. of deaths
Death rate*
No. of deaths
Death rate*
No. of deaths
Death rate*
No. of deaths
Death rate*
No. of deaths
Death rate*
No. of deaths
Death rate*
No. of deaths
Death rate*
2008-2017 2016-2017
Los Angeles County 2,190 24.2 1,964 21.3 1,894 21.0 2,196 22.9 2,204 22.4 2,172 21.9 2,291 22.9 2,373 22.7 2,480 23.1 2,658 24.7 1.8% 6.7%
Male 1,084 28.0 1,024 26.1 993 25.7 1,170 28.3 1,151 26.8 1,126 26.4 1,234 28.4 1,281 28.0 1,330 28.4 1,491 31.7 13.1% 11.6%Female 1,106 21.3 940 17.6 901 17.4 1,026 18.7 1,053 18.7 1,046 18.4 1,057 18.6 1,092 18.5 1,150 19.1 1,167 19.1 -10.6% -0.1%
White 801 18.3 672 15.2 667 15.9 783 17.8 736 16.9 675 15.5 731 16.7 712 16.1 762 17.0 766 17.4 -4.7% 2.3%Latino/a 764 31.8 694 28.4 690 28.5 799 29.6 824 28.8 860 29.9 868 29.8 897 28.6 939 28.1 1,055 31.4 -1.2% 11.7%
Black 359 43.2 340 39.7 294 35.5 316 36.0 345 38.9 286 31.5 398 43.2 400 42.3 398 40.5 405 41.9 -3.1% 3.4%
Asian† 257 18.5 248 17.6 237 16.0 278 17.4 273 16.2 318 18.3 269 15.3 333 18.0 347 18.0 411 21.3 15.1% 18.2%
Males
White 429 22.9 364 19.2 365 20.0 453 23.5 402 20.8 374 19.7 424 21.9 403 20.4 442 22.2 478 24.5 6.9% 10.3%Latino 371 35.7 361 34.8 356 34.2 430 36.4 443 34.7 437 35.4 464 37.0 484 35.3 498 34.3 588 40.3 12.9% 17.4%
Black 157 46.3 161 46.2 144 42.9 150 42.5 168 45.9 150 40.1 199 51.4 209 53.4 199 48.1 223 54.8 18.3% 13.9%
Asian† 126 21.4 131 22.1 124 20.0 129 19.3 122 17.5 154 21.3 138 18.9 169 21.4 176 21.9 193 23.6 10.1% 7.7%
Females
White 372 14.6 308 11.9 302 12.6 330 13.4 334 13.5 301 11.9 307 12.5 309 12.6 320 13.0 288 11.5 -21.1% -11.6%Latina 393 28.8 333 23.7 334 24.3 369 24.3 381 23.9 423 25.9 404 24.4 413 23.6 441 23.5 467 24.7 -14.0% 5.3%
Black 202 40.9 179 34.8 150 30.4 166 32.0 177 33.2 136 25.1 199 37.1 191 34.5 199 35.1 182 32.3 -21.1% -8.1%
Asian† 131 16.2 117 14.1 113 13.0 149 16.0 151 15.1 164 16.0 131 12.7 164 15.4 171 14.9 218 19.4 19.4% 30.2%
SPA 1: Antelope Valley 106 38.7 113 39.9 85 30.8 109 36.7 102 33.4 103 32.0 118 37.4 106 30.8 148 43.7 133 37.8 -2.1% -13.4%SPA 2: San Fernando 408 20.5 337 16.3 343 16.7 391 18.0 390 17.3 392 17.7 392 17.2 423 17.7 432 17.9 453 18.7 -8.7% 4.3%
SPA 3: San Gabriel 405 23.0 375 21.2 330 18.6 400 21.1 475 24.3 449 22.8 429 21.7 463 22.6 479 22.3 542 25.5 10.8% 14.2%SPA 4: Metro 241 23.3 212 20.0 230 23.2 276 26.1 273 25.0 256 23.5 258 23.1 226 19.3 253 21.0 295 24.1 3.5% 14.6%SPA 5: West 100 13.5 75 9.6 90 11.9 83 10.1 88 11.1 63 7.5 91 11.3 84 9.9 99 11.8 86 10.5 -22.4% -11.3%
SPA 6: South 262 39.2 247 35.9 218 32.6 245 35.2 265 36.3 279 37.6 317 42.3 313 40.6 317 38.7 350 43.7 11.5% 12.8%SPA 7: East 352 31.4 323 28.9 302 27.6 350 29.9 304 25.4 312 25.7 337 28.1 376 29.7 372 28.9 403 30.8 -1.7% 6.6%
SPA 8: South Bay 309 21.5 282 19.2 293 20.7 336 22.0 307 19.9 317 20.1 349 21.9 381 23.2 380 22.3 396 23.4 9.0% 4.9%
TABLE D-6: Diabetes Mellitus
Death Rate Change20092008 2010 2011 2017
Befo
re 2
012,
Asia
n in
clud
ed N
HOPI
**, t
here
fore
, tre
nds s
houl
d be
inte
rpre
ted
with
cau
tion.
2012 2013 2014 2015 2016
*Age-adjusted rate per 100,000. The death rates for 2008-2009 were recalculated using new population estimates based on the 2010 Census, therefore, death rates in this report may differ from rates previously published. **NHOPI = Native Hawaiian and other Pacific Islander.†From 2008-2011, the number of deaths and death rates for Asians includes NHOPI (Native Hawaiian and other Pacific Islander). Starting 2012, Asian and NHOPI were separated into different race categories. Trends for Asian population should be interpreted with caution.
69

No. of deaths
Death rate*
No. of deaths
Death rate*
No. of deaths
Death rate*
No. of deaths
Death rate*
No. of deaths
Death rate*‡
No. of deaths
Death rate*‡
No. of deaths
Death rate*‡
No. of deaths
Death rate*‡
No. of deaths
Death rate*‡
No. of deaths
Death rate*‡ 2008-2017 2016-2017
Los Angeles County 625 6.3 685 6.9 611 6.0 580 5.7 609 5.9 749 7.2 689 6.5 690 6.5 732 6.8 864 8.0 27.7% 17.7%
Male 431 8.7 471 9.5 435 8.7 407 8.0 428 8.4 524 10.2 490 9.4 500 9.5 550 10.3 631 11.8 35.8% 14.9%Female 194 3.8 214 4.2 176 3.4 173 3.3 181 3.5 225 4.3 199 3.7 190 3.5 182 3.3 233 4.2 10.5% 27.9%
White 326 10.0 356 10.9 314 10.0 324 10.4 323 10.6 407 12.8 370 11.7 361 11.9 369 12.0 406 13.2 32.0% 10.2%Latino/a 195 4.8 219 5.2 194 4.5 167 3.7 184 4.1 224 4.8 207 4.5 198 4.1 248 5.0 292 5.8 22.2% 16.1%
Black 87 9.3 93 9.9 90 9.7 71 7.6 77 8.0 86 9.1 91 9.3 101 10.5 95 9.5 114 11.4 23.1% 20.5%
Asian† 13 -- 13 -- 9 -- 15 -- 17 1.2 24 1.6 14 0.9 24 1.5 16 1.0 43 2.8 -- 179.6%
Males
White 204 12.5 229 14.1 209 13.2 216 13.6 217 13.8 279 17.3 253 15.9 255 16.5 268 17.2 268 17.1 36.4% -0.6%Latino 164 8.0 181 8.7 163 7.6 133 6.0 150 6.8 174 7.7 165 7.2 163 6.7 209 8.5 245 9.8 22.9% 14.9%
Black 53 12.6 53 12.5 56 13.0 45 10.3 42 9.3 50 11.1 61 13.4 63 14.1 57 12.6 81 17.9 41.4% 41.9%
Asian† 7 -- 6 -- <5 -- 12 -- 13 2.0 17 2.4 10 1.4 15 1.9 14 1.9 34 4.7 -- 147.1%
Females
White 122 7.3 127 7.7 105 6.5 108 7.1 106 7.2 128 8.1 117 7.3 106 7.0 101 6.6 138 9.1 24.5% 38.5%Latina 31 1.6 38 1.8 31 1.5 34 1.5 34 1.6 50 2.1 42 1.8 35 1.4 39 1.6 47 1.9 17.4% 15.9%
Black 34 6.5 40 8.0 34 6.9 26 5.1 35 7.1 36 7.6 30 5.8 38 7.4 38 7.0 33 6.0 -8.4% -14.9%
Asian† 6 -- 7 -- 6 -- <5 -- <5 -- 7 0.9 <5 -- 9 1.1 <5 -- 9 1.1 -- --
SPA 1: Antelope Valley 24 6.6 27 7.7 38 9.7 32 8.5 35 8.8 47 12.2 47 11.7 33 8.7 44 11.3 46 11.7 78.2% 3.6%SPA 2: San Fernando 133 6.1 146 6.5 122 5.5 146 6.4 133 5.8 170 7.3 174 7.5 144 6.2 145 6.1 202 8.5 39.8% 39.5%
SPA 3: San Gabriel 70 4.0 91 5.2 70 3.9 69 3.9 87 4.8 82 4.5 75 4.0 95 5.2 107 5.7 98 5.4 33.5% -5.8%SPA 4: Metro 91 7.7 89 7.5 89 7.5 80 6.7 98 8.1 108 8.8 89 7.2 117 9.3 114 8.7 108 8.1 5.3% -7.3%
SPA 5: West 46 6.4 41 5.9 42 6.0 33 4.7 44 6.2 60 8.6 42 5.7 58 7.9 56 7.5 68 9.3 45.5% 23.6%SPA 6: South 63 7.7 69 8.5 57 6.3 52 5.6 52 5.6 82 8.7 59 5.8 74 7.5 86 8.4 102 10.0 29.4% 18.8%
SPA 7: East 62 5.0 70 5.6 56 4.6 42 3.3 63 5.0 65 5.1 76 5.9 63 4.8 63 4.7 92 7.0 40.5% 48.9%SPA 8: South Bay 110 7.1 108 6.9 102 6.4 121 7.5 96 5.9 129 8.0 123 7.4 102 6.1 110 6.7 148 8.8 25.4% 32.0%
TABLE D-7: Drug Overdose
Death Rate Change20092008 2010 2011 2017
Befo
re 2
012,
Asia
n in
clud
ed N
HOPI
**, t
here
fore
, tre
nds s
houl
d be
inte
rpre
ted
with
cau
tion.
2012 2013 2014 2015 2016
*Age-adjusted rate per 100,000. The death rates for 2008-2009 were recalculated using new population estimates based on the 2010 Census, therefore, death rates in this report may differ from rates previously published. **NHOPI = Native Hawaiian and other Pacific Islander.†From 2008-2011, the number of deaths and death rates for Asians includes NHOPI (Native Hawaiian and other Pacific Islander). Starting 2012, Asian and NHOPI were separated into different race categories. Trends for Asian population should be interpreted with caution.‡From 2008-2011, rates based on deaths < 20 are suppressed with (--). Starting 2012, rates based on 5-19 deaths are presented, which are considered unreliable and should be interpreted with caution.
70

No. of deaths
Death rate*
No. of deaths
Death rate*
No. of deaths
Death rate*
No. of deaths
Death rate*
No. of deaths
Death rate*‡
No. of deaths
Death rate*‡
No. of deaths
Death rate*‡
No. of deaths
Death rate*‡
No. of deaths
Death rate*‡
No. of deaths
Death rate*‡
2008-2017 2016-2017
Los Angeles County 838 8.2 723 7.1 651 6.3 609 5.9 596 5.8 584 5.7 544 5.2 612 5.9 622 6.0 611 5.8 -29.2% -2.8%
Male 710 13.7 618 12.0 545 10.4 512 9.9 515 10.0 512 9.9 468 9.0 520 9.9 548 10.4 511 9.7 -29.5% -6.8%Female 128 2.6 105 2.1 106 2.1 97 1.9 81 1.6 72 1.4 76 1.5 92 1.8 74 1.4 100 1.9 -25.1% 37.0%
White 83 2.7 64 2.1 76 2.5 61 2.0 69 2.3 63 2.1 67 2.2 75 2.6 54 1.8 65 2.1 -22.5% 18.0%Latino/a 458 8.9 397 7.9 328 6.2 333 6.3 305 5.8 279 5.4 258 5.0 298 5.6 310 5.8 340 6.4 -28.3% 9.7%
Black 250 26.9 227 24.3 219 25.2 192 22.1 199 23.2 223 26.0 203 23.4 207 24.1 218 25.2 176 20.3 -24.6% -19.4%
Asian† 43 3.3 32 2.3 24 1.6 21 1.3 19 1.3 14 1.0 12 0.8 21 1.2 34 2.1 28 1.8 -45.6% -14.5%
Males
White 62 4.1 43 2.8 51 3.4 45 2.9 44 2.8 51 3.4 50 3.2 54 3.7 42 2.8 45 2.8 -30.2% 1.7%Latino 407 15.2 344 13.4 288 10.7 285 10.5 277 10.2 246 9.3 221 8.4 259 9.5 268 9.8 291 10.7 -29.9% 8.7%
Black 214 48.8 207 46.5 186 45.2 168 40.8 179 43.9 203 50.0 183 44.5 185 45.6 206 49.9 158 38.2 -21.8% -23.5%
Asian† 24 3.9 23 3.3 18 -- 13 -- 11 1.6 8 1.2 10 1.3 14 1.7 26 3.5 15 2.0 -48.4% -43.3%
Females
White 21 1.4 21 1.4 25 1.5 16 -- 25 1.8 12 0.7 17 1.1 21 1.5 12 0.8 20 1.4 -1.6% 71.0%Latina 51 2.2 53 2.2 40 1.6 48 1.9 28 1.2 33 1.4 37 1.6 39 1.6 42 1.7 49 1.9 -11.6% 12.8%
Black 36 7.6 20 4.2 33 7.3 24 5.3 20 4.6 20 4.3 20 4.6 22 4.9 12 2.8 18 4.2 -45.1% 48.7%
Asian† 19 -- 9 -- 6 -- 8 -- 8 1.1 6 0.7 <5 -- 7 0.7 8 0.9 13 1.6 -- 72.3%
SPA 1: Antelope Valley 26 6.4 31 7.4 23 6.0 26 6.6 17 4.2 28 6.9 23 5.8 28 6.8 28 7.2 28 7.8 21.8% 8.1%SPA 2: San Fernando 91 4.3 79 3.7 71 3.2 54 2.4 74 3.4 47 2.1 68 3.0 77 3.4 74 3.3 76 3.3 -23.8% -1.4%
SPA 3: San Gabriel 108 6.0 69 3.8 71 4.0 66 3.7 59 3.3 80 4.4 53 2.9 83 4.6 57 3.3 81 4.6 -23.1% 38.9%SPA 4: Metro 102 9.2 82 7.2 73 6.2 62 5.2 69 5.7 46 3.9 62 5.1 58 4.8 55 4.3 66 5.3 -41.6% 24.3%
SPA 5: West 18 -- 14 -- 12 -- 17 -- 10 1.6 17 2.4 5 0.7 11 1.5 7 0.9 18 2.4 -- 163.5%SPA 6: South 233 21.9 194 18.2 189 17.2 184 17.1 180 16.8 166 15.2 168 15.8 168 15.9 194 17.5 173 15.2 -30.4% -13.0%
SPA 7: East 99 7.0 101 7.4 88 6.5 82 6.2 72 5.3 71 5.4 63 4.7 70 5.2 78 5.8 58 4.5 -35.2% -21.7%SPA 8: South Bay 140 9.1 144 9.2 120 7.6 117 7.5 113 7.2 127 8.1 100 6.3 115 7.3 125 8.0 111 7.0 -23.3% -13.1%
TABLE D-8: Homicide
Death Rate Change20092008 2010 2011 2017
Befo
re 2
012,
Asia
n in
clud
ed N
HOPI
**, t
here
fore
, tre
nds s
houl
d be
inte
rpre
ted
with
cau
tion.
2012 2013 2014 2015 2016
*Age-adjusted rate per 100,000. The death rates for 2008-2009 were recalculated using new population estimates based on the 2010 Census, therefore, death rates in this report may differ from rates previously published. **NHOPI = Native Hawaiian and other Pacific Islander.†From 2008-2011, the number of deaths and death rates for Asians includes NHOPI (Native Hawaiian and other Pacific Islander). Starting 2012, Asian and NHOPI were separated into different race categories. Trends for Asian population should be interpreted with caution.‡From 2008-2011, rates based on deaths < 20 are suppressed with (--). Starting 2012, rates based on 5-19 deaths are presented, which are considered unreliable and should be interpreted with caution.
71

No. of deaths
Death rate*
No. of deaths
Death rate*
No. of deaths
Death rate*
No. of deaths
Death rate*
No. of deaths
Death rate*‡
No. of deaths
Death rate*‡
No. of deaths
Death rate*‡
No. of deaths
Death rate*‡
No. of deaths
Death rate*‡
No. of deaths
Death rate*‡
2008-2017 2016-2017
Los Angeles County 371 3.8 313 3.2 274 2.8 243 2.4 225 2.2 223 2.2 246 2.4 253 2.4 257 2.3 228 2.1 -45.5% -10.6%
Male 310 6.4 256 5.3 232 4.8 199 4.0 196 3.9 197 4.0 209 4.1 219 4.2 229 4.3 203 3.8 -41.1% -12.1%Female 61 1.2 57 1.1 42 0.8 44 0.8 29 0.6 26 0.5 37 0.7 34 0.6 28 0.5 25 0.4 -63.2% -10.1%
White 96 2.8 84 2.4 74 2.1 72 2.1 72 2.0 56 1.8 76 2.1 64 1.7 85 2.2 66 1.8 -35.9% -19.5%Latino/a 137 3.5 108 2.8 114 2.7 84 2.1 78 1.8 76 1.8 82 1.9 86 1.9 78 1.7 86 2.0 -44.2% 16.2%
Black 113 12.4 109 11.9 80 8.6 77 8.6 65 7.2 79 8.4 81 8.8 87 9.3 76 8.2 66 6.4 -47.9% -21.4%
Asian† 21 1.5 11 -- 5 -- 8 -- 7 0.4 11 0.7 <5 -- 7 0.4 8 0.4 8 0.5 -66.0% 24.2%
Males
White 86 4.8 74 4.2 65 3.6 60 3.4 68 3.7 52 3.2 70 3.9 59 3.1 80 4.1 61 3.2 -33.8% -21.8%Latino 114 6.0 91 4.9 98 4.6 70 3.6 69 3.2 69 3.4 76 3.6 71 3.2 70 3.1 78 3.7 -38.1% 19.3%
Black 90 21.7 79 19.0 64 15.2 61 14.7 51 12.0 65 14.9 57 13.3 75 17.2 63 14.9 54 11.7 -46.0% -21.6%
Asian† 16 -- 11 -- <5 -- 7 -- 7 1.0 11 1.6 <5 -- 7 0.9 7 0.8 8 1.1 -- 38.1%
Females
White 10 -- 10 -- 9 -- 12 -- <5 -- <5 -- 6 0.3 5 0.3 5 0.3 5 0.3 -- 10.4%Latina 23 1.2 17 -- 16 -- 14 -- 9 0.4 7 0.4 6 0.3 15 0.7 8 0.3 8 0.4 -64.4% 41.2%
Black 23 4.7 30 6.0 16 -- 16 -- 14 3.0 14 2.9 24 4.9 12 2.5 13 2.4 12 2.0 -57.8% -18.0%
Asian† 5 -- <5 -- <5 -- <5 -- <5 -- <5 -- <5 -- <5 -- <5 -- 0 0.0 -- --
SPA 1: Antelope Valley 5 -- 10 -- 10 -- 6 -- 7 2.0 9 2.5 6 1.6 9 2.7 13 3.3 8 1.9 -- -41.5%SPA 2: San Fernando 45 2.1 34 1.5 37 1.6 37 1.5 29 1.3 24 1.1 37 1.6 31 1.3 32 1.3 39 1.5 -26.5% 17.0%
SPA 3: San Gabriel 30 1.7 32 1.9 30 1.7 24 1.3 26 1.4 27 1.5 21 1.1 27 1.4 19 1.0 23 1.2 -24.7% 25.0%SPA 4: Metro 93 7.9 81 7.0 71 6.4 71 6.2 48 4.1 56 4.8 74 6.1 59 4.7 65 4.9 51 4.0 -49.8% -19.3%SPA 5: West 11 -- 11 -- 7 -- 7 -- 7 1.0 <5 -- 13 1.8 10 1.4 8 1.0 7 0.9 -- -13.6%
SPA 6: South 85 10.1 63 7.5 41 4.5 34 3.8 38 4.1 40 4.4 44 4.8 50 5.2 39 4.0 40 4.2 -58.9% 4.2%SPA 7: East 27 2.2 23 2.0 34 2.7 20 1.6 24 1.9 16 1.3 18 1.4 19 1.5 22 1.7 19 1.4 -36.4% -17.6%
SPA 8: South Bay 72 4.6 56 3.7 41 2.6 42 2.6 45 2.8 49 3.1 32 1.9 48 2.9 59 3.4 41 2.3 -50.0% -32.7%
TABLE D-9: HIV
Death Rate Change20092008 2010 2011 2017
Befo
re 2
012,
Asia
n in
clud
ed N
HOPI
**, t
here
fore
, tre
nds s
houl
d be
inte
rpre
ted
with
cau
tion.
2012 2013 2014 2015 2016
*Age-adjusted rate per 100,000. The death rates for 2008-2009 were recalculated using new population estimates based on the 2010 Census, therefore, death rates in this report may differ from rates previously published. **NHOPI = Native Hawaiian and other Pacific Islander.†From 2008-2011, the number of deaths and death rates for Asians includes NHOPI (Native Hawaiian and other Pacific Islander). Starting 2012, Asian and NHOPI were separated into different race categories. Trends for Asian population should be interpreted with caution.‡From 2008-2011, rates based on deaths < 20 are suppressed with (--). Starting 2012, rates based on 5-19 deaths are presented, which are considered unreliable and should be interpreted with caution.
72

No. of deaths
Death rate*
No. of deaths
Death rate*
No. of deaths
Death rate*
No. of deaths
Death rate*
No. of deaths
Death rate*
No. of deaths
Death rate*
No. of deaths
Death rate*
No. of deaths
Death rate*
No. of deaths
Death rate*
No. of deaths
Death rate*
2008-2017 2016-2017
Los Angeles County 1,134 11.9 1,246 12.9 1,171 12.0 1,246 12.5 1,275 12.4 1,315 12.8 1,323 12.5 1,539 14.2 1,442 13.2 1,412 12.5 4.6% -5.6%
Male 773 17.1 837 18.1 787 17.2 818 17.1 875 18.0 898 18.5 871 17.4 1,003 19.5 987 19.1 953 17.8 4.3% -6.7%Female 361 7.2 409 8.0 384 7.4 428 8.1 400 7.4 417 7.7 452 8.1 536 9.4 455 7.9 459 7.7 7.2% -2.4%
White 398 9.9 419 10.5 416 10.9 436 11.4 422 10.9 471 12.3 430 10.8 454 11.3 443 10.9 430 10.6 6.8% -2.6%Latino/a 594 19.4 645 20.9 587 18.4 637 18.6 672 19.0 666 18.8 699 18.7 873 23.0 793 20.1 793 19.2 -0.9% -4.3%
Black 69 7.3 112 12.1 97 10.1 104 10.9 103 10.5 85 8.7 108 10.7 126 12.2 122 11.8 110 10.3 41.1% -12.5%
Asian† 59 4.1 58 3.9 55 3.5 56 3.5 71 4.4 77 4.5 68 3.8 67 3.8 53 2.9 72 3.7 -9.6% 27.4%
Males
White 268 13.8 272 14.0 262 13.9 269 14.3 299 15.8 311 16.7 264 13.5 292 14.8 286 14.4 272 13.5 -2.1% -6.3%Latino 413 28.0 448 29.6 423 28.5 455 27.5 467 27.1 487 28.8 493 27.5 582 31.9 577 31.1 565 29.0 3.4% -6.9%
Black 45 10.8 75 17.9 54 12.2 54 12.3 61 13.6 47 10.4 57 12.3 72 14.9 74 15.8 67 14.4 33.5% -8.9%
Asian† 39 5.9 37 5.3 38 5.4 34 4.9 44 6.2 44 5.8 45 5.8 43 5.5 29 3.5 46 5.4 -9.6% 53.5%
Females
White 130 6.2 147 7.2 154 8.0 167 8.5 123 6.2 160 8.0 166 8.2 162 7.7 157 7.5 158 7.9 27.2% 5.7%Latina 181 11.8 197 12.9 164 10.0 182 10.7 205 11.7 179 10.1 206 10.9 291 15.1 216 10.7 228 10.8 -8.5% 0.9%
Black 24 4.6 37 7.3 43 8.3 50 9.6 42 8.0 38 7.3 51 9.6 54 9.9 48 8.6 43 7.1 54.6% -17.0%
Asian† 20 2.6 21 2.6 17 -- 22 2.4 27 2.9 33 3.4 23 2.2 24 2.4 24 2.5 26 2.4 -5.4% -3.5%
SPA 1: Antelope Valley 45 14.0 53 16.8 47 13.0 55 15.2 47 13.6 58 15.7 61 16.1 73 19.5 63 17.1 72 18.5 32.1% 8.2%SPA 2: San Fernando 207 9.6 200 9.0 192 8.7 218 9.6 243 10.4 273 11.6 223 9.1 257 10.5 252 10.2 247 9.4 -2.4% -8.2%
SPA 3: San Gabriel 194 10.9 217 11.9 191 10.5 215 11.2 240 12.2 224 11.6 235 11.7 248 12.4 234 11.2 249 11.8 8.0% 5.5%SPA 4: Metro 147 13.2 163 14.8 151 13.8 156 14.1 147 13.0 171 15.0 165 14.0 188 15.4 170 13.3 170 13.0 -2.1% -2.6%
SPA 5: West 40 5.3 55 7.2 45 6.2 61 8.3 60 8.2 56 7.5 62 8.1 50 6.4 56 7.1 40 4.9 -6.4% -30.8%SPA 6: South 112 15.2 130 17.5 141 17.8 150 18.3 152 17.7 121 14.5 144 16.5 181 20.4 176 18.6 168 17.8 17.2% -4.4%
SPA 7: East 198 17.2 226 19.5 210 17.8 193 15.7 194 15.7 214 17.2 212 16.7 289 22.0 245 18.5 231 17.0 -0.9% -7.9%SPA 8: South Bay 174 11.4 176 11.4 181 11.6 196 12.3 191 11.8 196 12.1 215 12.7 250 14.3 240 13.9 235 13.2 16.3% -4.8%
TABLE D-10: Liver Disease/Cirrhosis
Death Rate Change20092008 2010 2011 2017
Befo
re 2
012,
Asia
n in
clud
ed N
HOPI
**, t
here
fore
, tre
nds s
houl
d be
inte
rpre
ted
with
cau
tion.
2012 2013 2014 2015 2016
*Age-adjusted rate per 100,000. The death rates for 2008-2009 were recalculated using new population estimates based on the 2010 Census, therefore, death rates in this report may differ from rates previously published.**NHOPI = Native Hawaiian and other Pacific Islander.
†From 2008-2011, the number of deaths and death rates for Asians includes NHOPI (Native Hawaiian and other Pacific Islander). Starting 2012, Asian and NHOPI were separated into different race categories. Trends for Asian population should be interpreted with caution.--Number of deaths is too small to calculate a reliable rate.
73
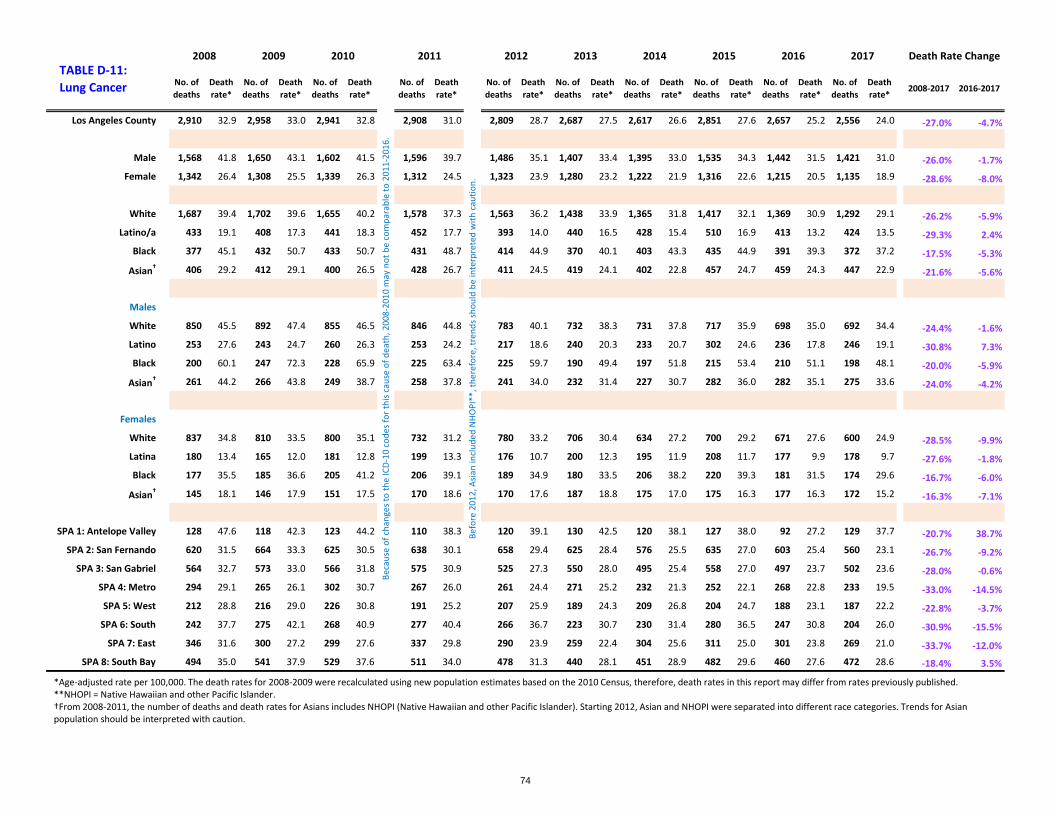
No. of deaths
Death rate*
No. of deaths
Death rate*
No. of deaths
Death rate*
No. of deaths
Death rate*
No. of deaths
Death rate*
No. of deaths
Death rate*
No. of deaths
Death rate*
No. of deaths
Death rate*
No. of deaths
Death rate*
No. of deaths
Death rate*
2008-2017 2016-2017
Los Angeles County 2,910 32.9 2,958 33.0 2,941 32.8 2,908 31.0 2,809 28.7 2,687 27.5 2,617 26.6 2,851 27.6 2,657 25.2 2,556 24.0 -27.0% -4.7%
Male 1,568 41.8 1,650 43.1 1,602 41.5 1,596 39.7 1,486 35.1 1,407 33.4 1,395 33.0 1,535 34.3 1,442 31.5 1,421 31.0 -26.0% -1.7%Female 1,342 26.4 1,308 25.5 1,339 26.3 1,312 24.5 1,323 23.9 1,280 23.2 1,222 21.9 1,316 22.6 1,215 20.5 1,135 18.9 -28.6% -8.0%
White 1,687 39.4 1,702 39.6 1,655 40.2 1,578 37.3 1,563 36.2 1,438 33.9 1,365 31.8 1,417 32.1 1,369 30.9 1,292 29.1 -26.2% -5.9%Latino/a 433 19.1 408 17.3 441 18.3 452 17.7 393 14.0 440 16.5 428 15.4 510 16.9 413 13.2 424 13.5 -29.3% 2.4%
Black 377 45.1 432 50.7 433 50.7 431 48.7 414 44.9 370 40.1 403 43.3 435 44.9 391 39.3 372 37.2 -17.5% -5.3%
Asian† 406 29.2 412 29.1 400 26.5 428 26.7 411 24.5 419 24.1 402 22.8 457 24.7 459 24.3 447 22.9 -21.6% -5.6%
Males
White 850 45.5 892 47.4 855 46.5 846 44.8 783 40.1 732 38.3 731 37.8 717 35.9 698 35.0 692 34.4 -24.4% -1.6%Latino 253 27.6 243 24.7 260 26.3 253 24.2 217 18.6 240 20.3 233 20.7 302 24.6 236 17.8 246 19.1 -30.8% 7.3%
Black 200 60.1 247 72.3 228 65.9 225 63.4 225 59.7 190 49.4 197 51.8 215 53.4 210 51.1 198 48.1 -20.0% -5.9%
Asian† 261 44.2 266 43.8 249 38.7 258 37.8 241 34.0 232 31.4 227 30.7 282 36.0 282 35.1 275 33.6 -24.0% -4.2%
Females
White 837 34.8 810 33.5 800 35.1 732 31.2 780 33.2 706 30.4 634 27.2 700 29.2 671 27.6 600 24.9 -28.5% -9.9%Latina 180 13.4 165 12.0 181 12.8 199 13.3 176 10.7 200 12.3 195 11.9 208 11.7 177 9.9 178 9.7 -27.6% -1.8%
Black 177 35.5 185 36.6 205 41.2 206 39.1 189 34.9 180 33.5 206 38.2 220 39.3 181 31.5 174 29.6 -16.7% -6.0%
Asian† 145 18.1 146 17.9 151 17.5 170 18.6 170 17.6 187 18.8 175 17.0 175 16.3 177 16.3 172 15.2 -16.3% -7.1%
SPA 1: Antelope Valley 128 47.6 118 42.3 123 44.2 110 38.3 120 39.1 130 42.5 120 38.1 127 38.0 92 27.2 129 37.7 -20.7% 38.7%SPA 2: San Fernando 620 31.5 664 33.3 625 30.5 638 30.1 658 29.4 625 28.4 576 25.5 635 27.0 603 25.4 560 23.1 -26.7% -9.2%
SPA 3: San Gabriel 564 32.7 573 33.0 566 31.8 575 30.9 525 27.3 550 28.0 495 25.4 558 27.0 497 23.7 502 23.6 -28.0% -0.6%SPA 4: Metro 294 29.1 265 26.1 302 30.7 267 26.0 261 24.4 271 25.2 232 21.3 252 22.1 268 22.8 233 19.5 -33.0% -14.5%SPA 5: West 212 28.8 216 29.0 226 30.8 191 25.2 207 25.9 189 24.3 209 26.8 204 24.7 188 23.1 187 22.2 -22.8% -3.7%
SPA 6: South 242 37.7 275 42.1 268 40.9 277 40.4 266 36.7 223 30.7 230 31.4 280 36.5 247 30.8 204 26.0 -30.9% -15.5%SPA 7: East 346 31.6 300 27.2 299 27.6 337 29.8 290 23.9 259 22.4 304 25.6 311 25.0 301 23.8 269 21.0 -33.7% -12.0%
SPA 8: South Bay 494 35.0 541 37.9 529 37.6 511 34.0 478 31.3 440 28.1 451 28.9 482 29.6 460 27.6 472 28.6 -18.4% 3.5%
TABLE D-11: Lung Cancer
Death Rate Change20092008 2010
Beca
use
of c
hang
es to
the
ICD-
10 c
odes
for t
his c
ause
of d
eath
, 200
8-20
10 m
ay n
ot b
e co
mpa
rabl
e to
201
1-20
16.
2011 2017
Befo
re 2
012,
Asia
n in
clud
ed N
HOPI
**, t
here
fore
, tre
nds s
houl
d be
inte
rpre
ted
with
cau
tion.
2012 2013 2014 2015 2016
*Age-adjusted rate per 100,000. The death rates for 2008-2009 were recalculated using new population estimates based on the 2010 Census, therefore, death rates in this report may differ from rates previously published. **NHOPI = Native Hawaiian and other Pacific Islander.†From 2008-2011, the number of deaths and death rates for Asians includes NHOPI (Native Hawaiian and other Pacific Islander). Starting 2012, Asian and NHOPI were separated into different race categories. Trends for Asian population should be interpreted with caution.
74

No. of deaths
Death rate*
No. of deaths
Death rate*
No. of deaths
Death rate*
No. of deaths
Death rate*
No. of deaths
Death rate*
No. of deaths
Death rate*
No. of deaths
Death rate*
No. of deaths
Death rate*‡
No. of deaths
Death rate*
No. of deaths
Death rate*
2008-2017 2016-2017
Los Angeles County 822 8.4 677 6.9 625 6.3 620 6.2 692 6.8 733 7.1 730 7.1 741 7.0 938 8.8 860 8.0 -4.0% -8.8%
Male 623 12.9 484 10.1 428 8.8 427 8.7 499 10.0 542 10.9 530 10.6 554 10.7 665 12.7 633 12.1 -6.4% -4.6%Female 199 4.0 193 3.9 197 3.8 193 3.7 193 3.7 191 3.5 200 3.8 187 3.5 273 5.0 227 4.1 4.4% -17.3%
White 253 7.9 220 6.7 200 6.1 189 6.0 214 6.7 210 6.5 219 6.7 231 7.1 257 7.9 226 7.0 -11.5% -11.8%Latino/a 367 8.6 312 7.3 290 6.8 291 6.6 317 6.8 356 7.6 341 7.4 357 7.6 474 9.7 412 8.5 -1.3% -12.0%
Black 107 11.9 74 8.2 71 8.0 70 7.9 91 10.4 79 8.8 108 11.9 87 9.7 115 12.8 142 15.2 27.7% 18.8%
Asian† 92 6.9 69 5.0 62 4.2 63 4.1 61 3.8 83 5.2 60 3.8 62 3.7 86 5.0 74 4.2 -39.2% -15.9%
Males
White 198 12.5 169 10.4 136 8.2 132 8.5 158 10.0 166 10.4 170 10.6 172 10.6 198 12.3 170 10.6 -15.7% -14.0%Latino 290 13.7 223 10.5 213 10.0 204 9.2 228 9.7 267 11.6 244 10.7 275 12.0 330 13.5 311 12.9 -5.8% -4.6%
Black 77 18.6 52 12.8 54 13.0 47 11.3 66 16.9 54 13.2 77 18.3 69 16.2 86 20.9 104 24.2 30.2% 15.7%
Asian† 56 9.0 39 6.2 25 3.8 42 5.9 41 5.6 51 7.2 37 5.4 36 4.7 46 6.2 43 5.5 -38.5% -10.6%
Females
White 55 3.3 51 3.1 64 3.9 57 3.4 56 3.4 44 2.6 49 2.8 59 3.5 59 3.4 56 3.3 1.5% -1.5%Latina 77 3.8 89 4.2 77 3.8 87 4.1 89 3.9 89 3.9 97 4.3 82 3.5 144 6.0 101 4.3 13.4% -27.8%
Black 30 6.2 22 4.5 17 -- 23 4.8 25 5.3 25 5.3 31 6.5 18 3.9 29 6.1 38 7.4 20.0% 22.0%
Asian† 36 4.9 30 4.1 37 4.4 21 2.5 20 2.3 32 3.4 23 2.4 26 2.8 40 4.0 31 3.2 -35.6% -20.7%
SPA 1: Antelope Valley 44 12.1 45 12.9 35 9.6 45 11.9 54 13.9 61 16.2 65 16.4 57 14.0 73 18.3 86 23.2 91.5% 26.9%SPA 2: San Fernando 167 7.9 142 6.6 127 5.9 118 5.5 151 6.7 159 7.1 148 6.6 166 7.2 189 8.0 152 6.3 -20.8% -21.8%
SPA 3: San Gabriel 124 6.9 109 6.1 100 5.6 102 5.7 90 5.0 116 6.2 105 5.8 105 5.5 153 8.1 138 7.3 5.1% -10.4%SPA 4: Metro 76 6.9 65 5.8 75 6.6 53 4.6 57 4.8 92 7.8 65 5.6 75 6.3 95 7.6 80 6.4 -7.8% -16.4%
SPA 5: West 32 4.8 31 4.4 30 4.7 32 4.4 33 4.7 27 3.9 30 4.1 32 4.4 35 4.7 30 3.9 -17.1% -16.2%SPA 6: South 112 12.5 94 10.1 70 7.1 89 9.2 96 10.0 85 8.5 115 11.3 95 9.6 132 13.2 129 12.6 1.1% -4.2%
SPA 7: East 111 8.8 85 6.6 88 6.9 87 6.6 92 6.9 93 7.0 101 7.7 94 6.8 120 8.9 109 8.1 -7.2% -8.8%SPA 8: South Bay 113 7.3 89 5.8 83 5.4 89 5.8 118 7.6 97 6.1 98 6.2 114 6.9 138 8.4 136 8.1 11.3% -3.1%
TABLE D-12: Motor Vechicle Crash
Death Rate Change20092008 2010 2011 2017
Befo
re 2
012,
Asia
n in
clud
ed N
HOPI
**, t
here
fore
, tre
nds s
houl
d be
inte
rpre
ted
with
cau
tion.
2012 2013 2014 2015 2016
*Age-adjusted rate per 100,000. The death rates for 2008-2009 were recalculated using new population estimates based on the 2010 Census, therefore, death rates in this report may differ from rates previously published. **NHOPI = Native Hawaiian and other Pacific Islander.†From 2008-2011, the number of deaths and death rates for Asians includes NHOPI (Native Hawaiian and other Pacific Islander). Starting 2012, Asian and NHOPI were separated into different race categories. Trends for Asian population should be interpreted with caution.--Number of deaths is too small to calculate a reliable rate.
75

No. of deaths
Death rate*
No. of deaths
Death rate*
No. of deaths
Death rate*
No. of deaths
Death rate*
No. of deaths
Death rate*
No. of deaths
Death rate*
No. of deaths
Death rate*
No. of deaths
Death rate*
No. of deaths
Death rate*
No. of deaths
Death rate*
2008-2017 2016-2017
Los Angeles County 2,171 23.6 2,097 22.4 1,964 21.9 2,062 21.3 2,048 20.3 2,264 22.5 2,071 20.7 2,124 20.3 2,066 19.4 1,957 18.4 -22.1% -5.3%
Male 990 27.9 1,016 27.5 910 25.8 962 25.2 975 24.2 1,069 26.6 1,030 25.7 1,009 24.4 1,016 23.8 1,000 23.1 -17.4% -3.1%Female 1,181 20.7 1,081 19.1 1,054 19.2 1,100 18.8 1,073 17.6 1,195 19.6 1,041 17.5 1,115 17.6 1,050 16.3 957 15.0 -27.3% -7.8%
White 1,203 24.4 1,076 22.1 1,011 22.0 982 20.4 965 19.7 1,094 22.8 986 21.2 924 18.7 916 19.1 874 18.4 -24.4% -3.6%Latino/a 430 20.2 492 20.9 399 18.8 509 21.4 419 16.4 509 19.7 484 17.8 487 17.6 496 16.9 485 16.1 -20.6% -4.9%
Black 232 29.3 223 26.9 247 31.1 242 28.7 245 27.9 257 28.7 189 21.6 223 25.2 222 24.2 211 22.4 -23.7% -7.5%
Asian† 297 21.8 290 20.5 296 20.6 319 19.9 395 22.8 393 22.0 387 22.0 468 24.9 401 20.1 382 19.4 -11.1% -3.7%
Males
White 541 28.8 528 27.6 480 26.3 475 24.4 465 23.4 519 26.6 465 24.3 455 23.0 459 23.5 444 22.5 -21.9% -4.3%Latino 192 23.3 232 23.9 179 21.4 212 22.5 196 19.2 242 23.3 257 23.0 207 18.6 235 19.7 256 21.0 -9.7% 6.7%
Black 119 39.6 100 32.3 91 30.1 93 29.8 99 29.2 111 32.2 86 26.3 95 27.8 110 30.9 101 27.0 -31.7% -12.6%
Asian† 135 24.7 148 26.1 155 27.0 174 27.3 203 29.5 187 26.3 206 29.4 240 32.3 200 25.5 196 24.9 0.7% -2.3%
Females
White 662 21.3 548 18.7 531 18.9 507 17.6 500 17.1 575 20.3 521 19.1 469 15.7 457 15.8 430 15.3 -28.2% -3.1%Latina 238 18.4 260 19.0 220 17.1 297 20.6 223 14.6 267 17.2 227 14.2 280 16.8 261 14.8 229 12.7 -30.9% -14.2%
Black 113 23.0 123 23.7 156 30.9 149 27.9 146 26.5 146 26.5 103 19.1 128 23.2 112 20.1 110 19.1 -17.1% -5.1%
Asian† 162 19.7 142 16.8 141 16.4 145 14.8 192 18.3 206 19.1 181 17.1 228 19.6 201 16.5 186 15.5 -20.9% -5.8%
SPA 1: Antelope Valley 51 21.1 59 22.6 61 25.3 56 21.6 59 20.8 84 29.1 65 23.0 69 23.2 61 20.8 61 19.0 -10.1% -8.9%SPA 2: San Fernando 415 20.5 414 20.0 415 20.2 394 18.1 355 15.5 476 21.0 450 19.8 458 19.3 436 18.3 419 17.6 -13.8% -3.6%
SPA 3: San Gabriel 449 24.9 404 22.2 390 21.5 422 21.4 413 20.4 425 20.6 387 19.0 421 19.6 404 18.4 403 18.5 -25.6% 0.5%SPA 4: Metro 255 23.1 256 23.1 229 23.0 257 24.0 272 23.5 261 23.2 256 22.7 274 23.2 258 21.8 242 19.8 -14.2% -9.0%SPA 5: West 218 27.0 162 19.5 158 18.6 166 17.6 140 15.5 173 18.9 163 19.5 152 16.6 150 16.5 123 13.9 -48.5% -15.7%
SPA 6: South 188 28.2 178 25.9 181 30.2 201 30.4 189 27.2 217 31.1 152 21.7 170 24.0 167 22.4 164 21.5 -23.7% -3.8%SPA 7: East 248 21.6 263 22.6 216 20.3 216 18.7 257 21.1 253 21.0 241 20.0 236 18.7 219 16.7 225 17.3 -20.2% 3.4%
SPA 8: South Bay 343 24.1 360 24.7 311 22.4 350 23.3 361 23.3 374 23.9 355 23.0 340 21.2 371 22.3 320 19.5 -19.3% -12.8%
TABLE D-13: Pneumonia & Influenza
Death Rate Change20092008 2010 2011 2017
Befo
re 2
012,
Asia
n in
clud
ed N
HOPI
**, t
here
fore
, tre
nds s
houl
d be
inte
rpre
ted
with
cau
tion.
2012 2013 2014 2015 2016
*Age-adjusted rate per 100,000. The death rates for 2008-2009 were recalculated using new population estimates based on the 2010 Census, therefore, death rates in this report may differ from rates previously published. **NHOPI = Native Hawaiian and other Pacific Islander.†From 2008-2011, the number of deaths and death rates for Asians includes NHOPI (Native Hawaiian and other Pacific Islander). Starting 2012, Asian and NHOPI were separated into different race categories. Trends for Asian population should be interpreted with caution.
76

No. of deaths
Death rate*
No. of deaths
Death rate*
No. of deaths
Death rate*
No. of deaths
Death rate*
No. of deaths
Death rate*
No. of deaths
Death rate*
No. of deaths
Death rate*
No. of deaths
Death rate*
No. of deaths
Death rate*
No. of deaths
Death rate*
2008-2017 2016-2017
Los Angeles County 3,280 35.9 3,301 35.5 3,278 36.2 3,256 33.6 3,360 33.5 3,300 32.8 3,205 32.0 3,668 35.4 3,666 34.6 3,749 35.0 -2.5% 1.2%
Male 1,373 36.9 1,399 36.8 1,405 38.1 1,370 34.2 1,406 33.8 1,439 34.7 1,382 33.4 1,563 36.4 1,649 37.6 1,650 36.8 -0.2% -2.2%Female 1,907 34.6 1,902 34.1 1,873 34.3 1,886 32.6 1,954 32.6 1,861 31.0 1,823 30.4 2,105 34.0 2,017 31.8 2,099 33.2 -4.2% 4.3%
White 1,552 32.2 1,623 33.7 1,534 33.6 1,546 32.1 1,543 32.1 1,506 31.6 1,382 29.3 1,554 32.4 1,522 31.7 1,560 32.8 1.9% 3.6%Latino/a 749 32.2 733 30.7 780 33.9 774 30.3 854 31.5 831 30.2 865 31.8 992 34.4 1,009 33.2 1,043 33.0 2.3% -0.7%
Black 469 57.8 433 52.1 446 54.1 423 49.0 418 46.2 434 48.4 448 50.1 480 53.7 472 51.0 497 52.6 -9.1% 3.1%
Asian† 496 36.0 504 35.7 501 34.1 498 31.3 513 30.1 511 29.1 489 27.6 606 32.7 624 32.4 625 31.9 -11.4% -1.5%
Males
White 603 32.1 668 34.8 629 34.5 596 30.9 593 30.3 625 32.3 568 29.5 612 31.4 678 34.7 666 33.9 5.4% -2.4%Latino 343 33.6 325 31.0 346 35.0 344 31.1 386 33.4 399 34.2 391 34.0 469 38.0 467 36.0 493 36.2 7.6% 0.6%
Black 194 59.5 170 50.9 179 55.6 183 53.1 157 41.8 172 46.7 199 55.0 213 59.4 207 55.8 197 50.4 -15.2% -9.6%
Asian† 223 38.9 235 40.2 243 39.9 237 35.9 250 35.4 233 32.1 216 29.8 255 33.0 276 34.6 284 35.5 -8.8% 2.7%
Females
White 949 31.7 955 32.6 905 32.5 950 32.2 950 32.6 881 30.6 814 28.5 942 32.7 844 28.7 894 31.5 -0.8% 9.6%Latina 406 30.6 408 29.7 434 32.5 430 29.2 468 29.7 432 26.9 474 29.9 523 31.1 542 30.6 550 30.2 -1.1% -1.2%
Black 275 55.0 263 51.7 267 53.0 240 45.8 261 47.2 262 48.2 249 45.0 267 49.0 265 47.0 300 53.0 -3.7% 12.8%
Asian† 273 33.9 269 32.5 258 29.7 261 27.9 263 26.2 278 26.8 273 25.8 351 32.0 348 30.3 341 29.0 -14.3% -4.2%
SPA 1: Antelope Valley 120 47.8 94 36.8 114 45.2 99 36.6 122 43.3 113 38.4 125 43.9 127 40.7 101 30.4 164 51.1 6.9% 68.1%SPA 2: San Fernando 628 31.1 690 33.4 661 32.1 657 29.7 700 30.6 649 28.5 628 27.5 744 31.4 782 32.9 766 31.5 1.4% -4.2%
SPA 3: San Gabriel 629 35.0 694 38.4 650 36.1 616 32.2 660 33.0 673 33.5 618 30.9 752 36.0 713 33.3 679 31.3 -10.6% -6.0%SPA 4: Metro 367 34.6 344 31.8 311 30.7 345 32.4 341 30.3 357 31.5 309 27.7 380 32.7 403 33.5 399 32.9 -5.1% -1.9%
SPA 5: West 262 33.4 232 28.9 253 30.0 242 27.7 236 26.9 249 27.6 205 23.6 237 27.5 253 28.3 249 27.8 -16.9% -1.8%SPA 6: South 355 53.3 323 47.9 307 47.6 311 45.4 317 43.8 292 40.4 295 41.2 378 52.0 346 46.1 365 47.8 -10.3% 3.7%
SPA 7: East 378 33.2 411 35.4 426 39.3 432 37.0 436 35.5 413 34.3 426 35.1 442 34.9 451 35.4 474 36.9 10.9% 4.1%SPA 8: South Bay 519 36.1 510 35.0 551 38.8 551 36.2 545 35.1 553 35.6 596 37.9 607 37.4 614 36.8 653 39.1 8.3% 6.3%
TABLE D-14: Stroke
Death Rate Change20092008 2010 2011 2017
Befo
re 2
012,
Asia
n in
clud
ed N
HOPI
**, t
here
fore
, tre
nds s
houl
d be
inte
rpre
ted
with
cau
tion.
2012 2013 2014 2015 2016
*Age-adjusted rate per 100,000. The death rates for 2008-2009 were recalculated using new population estimates based on the 2010 Census, therefore, death rates in this report may differ from rates previously published. **NHOPI = Native Hawaiian and other Pacific Islander.†From 2008-2011, the number of deaths and death rates for Asians includes NHOPI (Native Hawaiian and other Pacific Islander). Starting 2012, Asian and NHOPI were separated into different race categories. Trends for Asian population should be interpreted with caution.
77
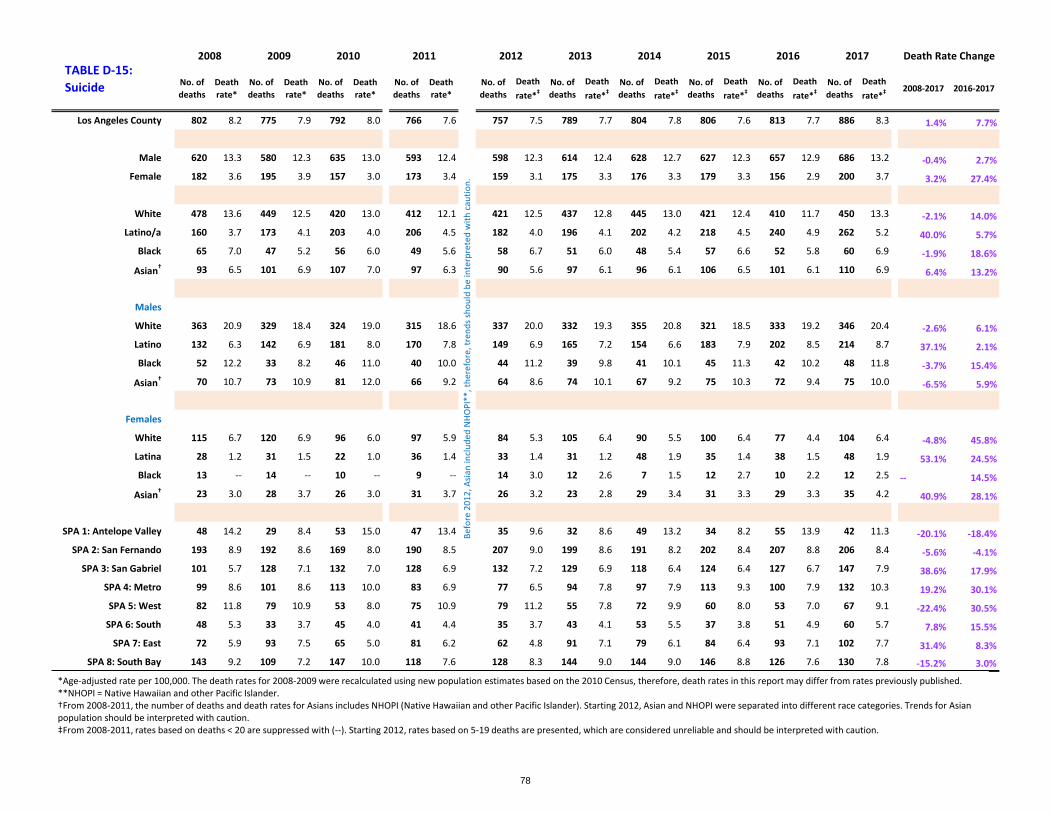
No. of deaths
Death rate*
No. of deaths
Death rate*
No. of deaths
Death rate*
No. of deaths
Death rate*
No. of deaths
Death rate*‡
No. of deaths
Death rate*‡
No. of deaths
Death rate*‡
No. of deaths
Death rate*‡
No. of deaths
Death rate*‡
No. of deaths
Death rate*‡ 2008-2017 2016-2017
Los Angeles County 802 8.2 775 7.9 792 8.0 766 7.6 757 7.5 789 7.7 804 7.8 806 7.6 813 7.7 886 8.3 1.4% 7.7%
Male 620 13.3 580 12.3 635 13.0 593 12.4 598 12.3 614 12.4 628 12.7 627 12.3 657 12.9 686 13.2 -0.4% 2.7%Female 182 3.6 195 3.9 157 3.0 173 3.4 159 3.1 175 3.3 176 3.3 179 3.3 156 2.9 200 3.7 3.2% 27.4%
White 478 13.6 449 12.5 420 13.0 412 12.1 421 12.5 437 12.8 445 13.0 421 12.4 410 11.7 450 13.3 -2.1% 14.0%Latino/a 160 3.7 173 4.1 203 4.0 206 4.5 182 4.0 196 4.1 202 4.2 218 4.5 240 4.9 262 5.2 40.0% 5.7%
Black 65 7.0 47 5.2 56 6.0 49 5.6 58 6.7 51 6.0 48 5.4 57 6.6 52 5.8 60 6.9 -1.9% 18.6%
Asian† 93 6.5 101 6.9 107 7.0 97 6.3 90 5.6 97 6.1 96 6.1 106 6.5 101 6.1 110 6.9 6.4% 13.2%
Males
White 363 20.9 329 18.4 324 19.0 315 18.6 337 20.0 332 19.3 355 20.8 321 18.5 333 19.2 346 20.4 -2.6% 6.1%Latino 132 6.3 142 6.9 181 8.0 170 7.8 149 6.9 165 7.2 154 6.6 183 7.9 202 8.5 214 8.7 37.1% 2.1%
Black 52 12.2 33 8.2 46 11.0 40 10.0 44 11.2 39 9.8 41 10.1 45 11.3 42 10.2 48 11.8 -3.7% 15.4%
Asian† 70 10.7 73 10.9 81 12.0 66 9.2 64 8.6 74 10.1 67 9.2 75 10.3 72 9.4 75 10.0 -6.5% 5.9%
Females
White 115 6.7 120 6.9 96 6.0 97 5.9 84 5.3 105 6.4 90 5.5 100 6.4 77 4.4 104 6.4 -4.8% 45.8%Latina 28 1.2 31 1.5 22 1.0 36 1.4 33 1.4 31 1.2 48 1.9 35 1.4 38 1.5 48 1.9 53.1% 24.5%
Black 13 -- 14 -- 10 -- 9 -- 14 3.0 12 2.6 7 1.5 12 2.7 10 2.2 12 2.5 -- 14.5%
Asian† 23 3.0 28 3.7 26 3.0 31 3.7 26 3.2 23 2.8 29 3.4 31 3.3 29 3.3 35 4.2 40.9% 28.1%
SPA 1: Antelope Valley 48 14.2 29 8.4 53 15.0 47 13.4 35 9.6 32 8.6 49 13.2 34 8.2 55 13.9 42 11.3 -20.1% -18.4%SPA 2: San Fernando 193 8.9 192 8.6 169 8.0 190 8.5 207 9.0 199 8.6 191 8.2 202 8.4 207 8.8 206 8.4 -5.6% -4.1%
SPA 3: San Gabriel 101 5.7 128 7.1 132 7.0 128 6.9 132 7.2 129 6.9 118 6.4 124 6.4 127 6.7 147 7.9 38.6% 17.9%SPA 4: Metro 99 8.6 101 8.6 113 10.0 83 6.9 77 6.5 94 7.8 97 7.9 113 9.3 100 7.9 132 10.3 19.2% 30.1%SPA 5: West 82 11.8 79 10.9 53 8.0 75 10.9 79 11.2 55 7.8 72 9.9 60 8.0 53 7.0 67 9.1 -22.4% 30.5%
SPA 6: South 48 5.3 33 3.7 45 4.0 41 4.4 35 3.7 43 4.1 53 5.5 37 3.8 51 4.9 60 5.7 7.8% 15.5%SPA 7: East 72 5.9 93 7.5 65 5.0 81 6.2 62 4.8 91 7.1 79 6.1 84 6.4 93 7.1 102 7.7 31.4% 8.3%
SPA 8: South Bay 143 9.2 109 7.2 147 10.0 118 7.6 128 8.3 144 9.0 144 9.0 146 8.8 126 7.6 130 7.8 -15.2% 3.0%
TABLE D-15: Suicide
Death Rate Change2008 2010 2011 20172009
Befo
re 2
012,
Asia
n in
clud
ed N
HOPI
**, t
here
fore
, tre
nds s
houl
d be
inte
rpre
ted
with
cau
tion.
2012 2013 2014 2015 2016
*Age-adjusted rate per 100,000. The death rates for 2008-2009 were recalculated using new population estimates based on the 2010 Census, therefore, death rates in this report may differ from rates previously published. **NHOPI = Native Hawaiian and other Pacific Islander.†From 2008-2011, the number of deaths and death rates for Asians includes NHOPI (Native Hawaiian and other Pacific Islander). Starting 2012, Asian and NHOPI were separated into different race categories. Trends for Asian population should be interpreted with caution.‡From 2008-2011, rates based on deaths < 20 are suppressed with (--). Starting 2012, rates based on 5-19 deaths are presented, which are considered unreliable and should be interpreted with caution.
78

No. of deaths
Death rate*
No. of deaths
Death rate*
No. of deaths
Death rate*
No. of deaths
Death rate*
No. of deaths
Death rate*
No. of deaths
Death rate*
No. of deaths
Death rate*
No. of deaths
Death rate*
No. of deaths
Death rate*
No. of deaths
Death rate*
2008-2017 2016-2017
Los Angeles County 58,043 628.7 57,620 614.1 56,538 615.3 57,988 596.4 58,498 580.9 59,678 593.5 58,568 580.2 62,250 593.4 62,861 589.4 63,429 589.6 -6.2% 0.0%
Male 29,402 754.2 29,342 739.2 28,772 738.8 29,191 707.2 29,610 687.7 30,413 709.8 30,071 699.3 31,941 712.5 32,542 712.8 32,818 708.7 -6.0% -0.6%Female 28,641 528.0 28,278 514.0 27,766 516.8 28,797 506.2 28,888 492.5 29,265 498.5 28,496 485.1 30,307 496.9 30,318 488.8 30,611 491.9 -6.8% 0.6%
White 30,149 670.3 29,622 651.0 28,738 667.2 29,104 646.8 29,123 644.8 29,188 655.0 28,168 633.3 29,295 642.7 29,132 641.7 28,826 637.0 -5.0% -0.7%Latino/a 13,591 525.1 13,671 521.2 13,751 529.1 14,301 512.1 14,467 486.3 15,243 510.9 15,322 507.8 16,403 515.7 17,003 509.3 17,732 519.1 -1.1% 1.9%
Black 7,697 918.0 7,825 918.0 7,438 891.2 7,623 874.6 7,644 847.4 7,721 853.6 7,714 850.7 8,234 898.8 8,322 887.9 8,294 866.5 -5.6% -2.4%
Asian† 6,354 458.6 6,267 442.0 6,343 429.1 6,630 416.6 6,783 400.0 7,038 404.7 6,871 392.7 7,691 417.4 7,706 406.6 8,213 426.3 -7.1% 4.8%
Males
White 14,768 796.0 14,553 770.7 14,184 783.4 14,232 750.9 14,378 745.8 14,533 767.0 14,294 754.3 14,711 755.5 14,814 763.0 14,624 750.0 -5.8% -1.7%Latino 7,316 629.6 7,433 636.5 7,448 644.3 7,591 611.7 7,670 578.5 8,139 618.0 8,129 617.4 8,791 628.9 9,150 619.5 9,628 635.4 0.9% 2.6%
Black 3,871 1131.1 3,961 1134.5 3,704 1087.2 3,788 1061.5 3,857 1037.5 3,901 1042.0 3,912 1045.7 4,183 1095.7 4,327 1113.5 4,247 1059.1 -6.4% -4.9%
Asian† 3,301 563.2 3,276 545.7 3,277 531.6 3,386 508.8 3,431 485.0 3,580 494.0 3,480 477.7 3,908 510.2 3,881 494.4 4,138 517.5 -8.1% 4.7%
Females
White 15,381 565.7 15,069 552.1 14,554 568.1 14,872 556.4 14,745 554.3 14,655 557.0 13,873 529.1 14,584 545.7 14,318 537.1 14,202 538.7 -4.8% 0.3%Latina 6,275 440.7 6,238 431.1 6,303 439.7 6,710 432.0 6,797 411.2 7,104 426.0 7,193 424.3 7,610 427.0 7,853 421.2 8,104 426.7 -3.2% 1.3%
Black 3,826 763.5 3,864 759.0 3,734 748.3 3,835 737.0 3,787 702.4 3,820 707.0 3,802 707.0 4,051 746.4 3,994 719.1 4,047 716.9 -6.1% -0.3%
Asian† 3,053 378.6 2,991 362.5 3,066 354.0 3,244 347.7 3,352 336.0 3,458 338.0 3,391 329.4 3,783 347.1 3,825 339.5 4,075 356.6 -5.8% 5.1%
SPA 1: Antelope Valley 2,165 795.4 2,230 801.8 2,214 799.4 2,243 760.4 2,267 738.5 2,419 775.8 2,491 791.4 2,620 804.7 2,713 818.5 2,759 818.5 2.9% 0.0%SPA 2: San Fernando 12,259 603.7 12,132 580.1 12,032 577.3 12,313 558.8 12,731 553.9 13,029 574.4 12,687 554.2 13,520 566.5 13,774 574.4 13,840 567.7 -6.0% -1.2%
SPA 3: San Gabriel 10,616 594.8 10,636 589.9 10,457 579.8 10,758 560.0 11,049 557.8 11,230 562.2 10,901 545.5 11,610 556.5 11,670 550.6 11,841 554.5 -6.8% 0.7%SPA 4: Metro 6,210 575.7 6,032 556.6 5,982 585.4 6,098 564.9 6,153 545.6 6,249 552.3 6,040 532.7 6,383 541.2 6,485 533.3 6,416 522.8 -9.2% -2.0%SPA 5: West 4,112 533.5 3,967 499.6 3,943 496.7 4,040 485.1 4,050 480.5 4,053 483.3 3,973 479.8 4,085 480.3 4,115 480.4 4,105 475.6 -10.8% -1.0%
SPA 6: South 5,614 794.7 5,638 794.3 5,234 762.4 5,477 759.4 5,449 720.4 5,484 726.6 5,435 716.2 5,930 764.9 6,018 740.3 6,005 735.0 -7.5% -0.7%SPA 7: East 7,130 619.7 7,184 619.9 6,914 621.8 7,161 604.0 7,107 577.1 7,337 604.2 7,253 592.3 7,627 595.6 7,608 584.9 7,817 600.0 -3.2% 2.6%
SPA 8: South Bay 9,415 649.6 9,455 640.9 9,402 654.9 9,722 639.5 9,645 617.7 9,832 624.1 9,705 612.6 10,392 634.5 10,392 621.5 10,646 636.1 -2.1% 2.4%
TABLE D-16: All Causes
Death Rate Change2008 2009 2010 2011 2017
Befo
re 2
012,
Asia
n in
clud
ed N
HOPI
**, t
here
fore
, tre
nds s
houl
d be
inte
rpre
ted
with
cau
tion.
2012 2013 2014 2015 2016
AIAN = American Indian and Alaska Native; NHOPI = Native Hawaiian and other Pacific Islander.*Age-adjusted rate per 100,000. The death rates for 2008-2009 were recalculated using new population estimates based on the 2010 Census, therefore, death rates in this report may differ from rates previously published. †From 2008-2011, the number of deaths and death rates for Asians includes NHOPI (Native Hawaiian and other Pacific Islander). Starting 2012, Asian and NHOPI were separated into different race categories. Trends for Asian population should be interpreted with caution.
79

FIGURE D-1: TRENDS IN LEADING CAUSES OF DEATH, LOS ANGELES COUNTY 2008-2017
0
10
20
30
40
50
60
2008 2009 2010 2011 2012 2013 2014 2015 2016 2017
Age-
Adju
sted
Mor
talit
y Ra
te p
er 1
00,0
00
Year
Age-Adjusted Mortality Rate (AAMR) Trends of Leading Causes of Death, Los Angeles County (2008-2017)
Alzheimer's disease
Stroke
COPD
Diabetes mellitus
Lung cancer
Breast cancer (female)
Pneumonia & influenza
Colorectal cancer
Liver disease/cirrhosis
0
50
100
150
200
2008 2009 2010 2011 2012 2013 2014 2015 2016 2017
Coronary heart disease
80

Los Angeles County Department of Public Health Office of Health Assessment and Epidemiology 313 N. Figueroa, Room 127 Los Angeles, CA 90012
Los Angeles County Department of Public Health Los Angeles County Board of Supervisors Barbara Ferrer, PhD, MPH, MEd Hilda L. Solis, First District Director Mark Ridley-Thomas, Second District Muntu Davis, MD, MPH Sheila Kuehl, Third District Health Officer Janice Hahn, Fourth District Paul Simon, MD, MPH Kathryn Barger, Fifth District Chief Science Officer