Patterns of Health Care Utilization in...
60
WV 5 ;1• 7 POLICY RESEARCH WORKING PAPER 2775 Patterns of Health Care Utilization in Vietnam Analysis of 1997-98 Vietnam Living Standards Survey Data Pravin K. Trivedi The World Bank Development Research Group Macroeconomics and Growth February 2002 Public Disclosure Authorized Public Disclosure Authorized Public Disclosure Authorized Public Disclosure Authorized
Transcript of Patterns of Health Care Utilization in...

WV5 ;1• 7POLICY RESEARCH WORKING PAPER 2775
Patterns of Health Care Utilizationin Vietnam
Analysis of 1997-98 VietnamLiving Standards Survey Data
Pravin K. Trivedi
The World Bank
Development Research Group
Macroeconomics and Growth
February 2002
Pub
lic D
iscl
osur
e A
utho
rized
Pub
lic D
iscl
osur
e A
utho
rized
Pub
lic D
iscl
osur
e A
utho
rized
Pub
lic D
iscl
osur
e A
utho
rized

l POLICY RESEARCH WORKING PAPER 2775
Abstract
Trivedi provides an econometric analysis of health care emphasized. Econometric models are estimated for useutilization in Vietnam based on individual and household probability and frequency of contact for all majorlevel data from the 1997-98 Vietnam Living Standards categories of care, and for individual and householdSurvey. The author focuses on the major features of medical expenditure. Econometric results revealhealth care utilization patterns, including the differential responses to income changes at differentdeterminants of largely self-prescribed use of levels of income. Commune health centers and self-pharmaceutical drugs, and the use of government medication are normal goods at lower income levels buthospitals, commune health centers, and private health inferior goods at higher income levels. The authorfacilities. The role of income and health insurance is discusses the policy implications of these results.
This paper-a product of Macroeconomics and Growth, Development Research Group-is part of a larger effort in thegroup to study household welfare and poverty reduction in Vietnam. Copies of the paper are available free from the WorldBank, 1818 H Street NW, Washington, DC 20433. Please contact Rina Bonfield, room MC3-354, telephone 202-473-1248, fax 202-522-3518, email address abonfieldCa worldbank.org. Policy Research Working Papers are also posted on theWeb at http://econ.worldbank.org. The author may be contacted at trivedi(EJ indiana.edu. February 2002. (55 pages)
The Policy Research Working Paper Series disseminates the . of work in progress to encourage the exchbage of ideas abouitdevelopment issues. An objectiie of the series is to get the findings out quickly, even if the presentations are less than fully polished. Thepapers carry the names of the authors and should be cited accordingly. The ,, '. . interpretations, anzd conclusions expressed in thispaper are enitirely those of the auithors. They do not necessarily represent the view of the World Bank, its Executive Directors, or thecountries they represent.
Produced by the Research Advisory Staff

Patterns of Health Care Utilization inVietnam: Analysis of 1997-98 VLSS Data
Pravin K. TrivediDepartment of Economics
Wylie HallIndiana University
Bloomington, [N 47405, U.S.AEmail: [email protected]
* Acknowledgments: I am very grateful to Paul Glewwe for guidance throughout the preparationof this paper. His extensive comments on specific issues helped to improve the paper. I alsothank Fwu-Ranq Chang for useful discussions especially about the issues concerning self-medication. Murat Munkin and Jie Qun Guo provided excellent research assistance at variousstages.


1 Introduction
The changes to the Vietnam health sector initiated by doi moi have been described and analyzed
in previous World Bank empirical studies based on the 1992-93 Living Standards Survey. These
studies noted, in particular, the decline of the traditional public sector provider of the health care
to the poor, the commune health center, and the incipient rise in the early 1 990s of private sector
health providers. The deregulation of the pharmaceutical industry was followed by a dramatic
growth of private pharmacies as the single most important source of drugs for self-medication.
Contacts with pharmacies, both public and private, became the most important type of contact
between the provider and patient, while at the same time the role of the commune health center
declined. Deregulation permitted the emergence of private care facilities provided by doctors and
nurses, some of whom are simultaneously employed in the government hospitals and other
public facilities. Another major new feature of the health care sector, largely absent in 1992, is
the Vietnam Health Insurance (VHI) program, with mandatory coverage for some sections of the
community and voluntary coverage for others. As discussed in a later section, this is an
important new development that has significant implications about the rate at which the relative
importance of different providers in the health sector has changed and is likely to change in
future. These emergent trends, also highlighted and explored in the 1999 Vietnam Health Sector
Review (VHSR, 1999), have raised important analytical and policy questions about the access to
and utilization of health services by different socio-economic groups.
This article provides a further analysis of the direction and scope of changes in the health
sector. Here the emphasis is on econometric modeling of demand for different types of health
care in Vietnam, and we have relatively little to say about supply aspects. In contrast, the VHSR
(1999) surveys all aspects of the health sector. In modeling the demand for health care we use
2

both individual and household level data from the 1997-98 Vietnam Living Standards Survey
(VLSS). The focus is on four major features of health care utilization patterns, including:
* the determinants of the largely self-prescribed use of pharmaceutical drugs;
* the use of government hospitals;
* the (declining) use of commune health centers, and
* the increasing use of private health care facilities.
In each case, our major interest concerns the role of price and income variables. Given
the high rate of economic growth, accompanied by major structural changes in health care
delivery, it is useful to consider how these changes have impacted on the pattem of health care
utilization, and what further changes we might expect to see in future if these trends persist. Our
major tool of analysis is multivariate regression analysis using models that respect the discrete
nature of many of the outcome variables that are reported in the VLSS.
The analysis of this paper complements that provided in the comprehensive 1999
Vietnam Health Sector Review (VHSR, 1999). The latter provides a great deal of descriptive
statistical information on the structure and organization of health care delivery and on the broad
pattern of health care use in Vietnam. The VHSR (1999) also provides many points of
comparisons between the 1992-93 VLSS and its 1997-98 counterpart. Although the tabular
summary information provided there is both rich and informative, and also highly suggestive of
factors that influence health care utilization, no formal modeling of the data is undertaken.
Relationships between variables are studied or interpreted on a bivariate basis, e.g., the relation
between health care usage and household income. Because this method cannot control for the
presence of other relevant factors, and can at most only establish informal associations, there is a
danger of misleading interpretations due to the neglected confounding variables. This article
3

addresses the task of measuring and testing various hypotheses about health care utilization
within a multivariate econometric framework.
The remainder of this paper is organized as follows. In Section 2 we take a preliminary
look at data and outline the substantive issues considered later in the paper. We also summarize
the changes and trends affecting the health sector since the 1991-92 VLSS. Section 3 surveys the
main empirical issues considered in the paper. Section 4 considers the modeling framework and
related statistical issues. Section 5 analyzes the determinants of enrollment into the VHI
program. We then tackle the task of modeling the utilization of the major components of health
care, ignoring the remaining providers who collectively account for only a small share of the
health care budget. Econometric methods used in this section are those appropriate for binary-
valued and count variable. These are used to model the probability and/or number of visits to
commune center, pharmacies, government hospitals, private providers, and public hospitals.
Section 6 discusses results for individual and household health care expenditures. Section 7
discusses the policy implications of the results. Section 8 summarizes and concludes.
2 1997/98 VLSS Survey
2.1 Coverage of health care questionnaire
The health component of the 1997-98 VLSS is the main source of the data used here. Utilization
data are collected for seven types of providers (government hospital (GOVHOSP); commune
health center (CHC); regional polyclinic; other government health facility; private health facility
(PHF); traditional eastern medical practitioner; pharmacy visits or self-medication (PHARVIS).
For each type of provider, the questionnaire seeks information on number of contacts, total
expenditure, the amount spent on medicines, and transportation and other costs associated with
4

the visits. For the self-medication part the questionnaire also sought information on whether the
visit to the drug vendor was self-initiated or by another provider.
The survey also provides information on government hospital admissions (HOSPADM)
in the twelve month period preceding the survey, and the number of nights spent in hospitals
(HOSPNITE).
The responses to questions about expenditure on health care refer to a period of 12
months. The data make it possible to calculate this figure for the household both inclusive and
exclusive of health insurance expenditure.
Finally, the questionnaire collected information on whether the respondent had health
insurance (HLTHINS) and the amount spent on the same in the previous 12 months.
The survey includes information on the current health status such as occurrence of illness
(ILL) or injury (INJ) in the preceding 4 weeks, the number of days of illness (ILLDAYS), and
number of days of restricted activity (ACTDAYS). 1
However, there are some gaps in the information available that affect econometric
modeling of health care utilization. For example, there is still no information on long term health
status such as the presence of limiting and nonlimiting chronic conditions. The general health
status of an individual is a very important conditioning variable in most analyses of demand for
health care. Further, the direct information on HLTHINS lacks some necessary detail as to which
l There is a suspicion, based on information collected in the field, that the responses to thequestion about recent illness or injury may be biased. The bias is thought to arise from thegreater propensity to report illness or injury of those in higher socio-economic categories.
5

of the several levels of coverage of insurance applied to a survey respondent; this issue is
elaborated further in the section on health insurance.2
The survey also provides information on various socio-demographic variables such as
gender (SEX), years of schooling (EDUC), age (AGE), marital status (MARRIED), as well as
total household expenditure (INC). Table 1 provides the data definitions and descriptive
summary statistics.
These data can support empirical investigations both at the level of an individual and the
household. The available frequency-of-use data can be used in regression modeling of the
probability of contact between provider and patient, and also in modeling the frequency of such
contact. Models of probability of contact attempt to explain the factors that distinguish those who
received some care from those that did not receive any care. Such models only distinguish
between zero and positive levels of utilization. Count data models distinguish between different
levels of usage, but do not distinguish between high quality contact that may have cost more and
those of lower quality. Models of expenditure, on the other hand, allow us to take into account
expenditure variations that may be due to variation in the quality of care, but they do so
indirectly. Count models are analogous to models that explain quantities, but expenditure models
attempt to explain the product of quantity and price of service. Aggregated health care
expenditure data can be used to develop total household expenditure models. The two modeling
approaches are largely complementary and mutually reinforcing.
2By combining data sets it may be feasible in future to impute the type of insurance of eachindividual, and thereby make it possible to study the differential impact of each on utilizationmeasures.
6

3 Survey of Main Issues
The VHSR (1999: 49-50) considers five factors in health utilization: income, price, quality of
care, access (especially by income levels), and the role of education. In this section we outline
qualitatively the main issues concerning the role of these factors. Regression models are
considered in Section 5. We begin by summarizing the main features of health care utilization
data provided in the 1997-98 VLSS.
Table 2 below summarizes the contact rates for the main types of providers in 1993 and
1998. The data show that other govermment health facilities and traditional providers are a small
part of the total number of visits. Pharmacies and drug vendors, government hospitals, private
health facilities and commune health centers account for bulk of the total usage. All types of
utilization have grown since 1993, but the use of drug vendors has shown the fastest rate of
growth - - it has more than tripled. This attests to the overwhelming importance of self-
medication. Pharnacies are both private and public. Private pharmacies are more prevalent in the
urban areas and public ones more so in the rural areas. The VHSR (1999, p. 56) points out that
the increase in average number of pharmacy visits is accompanied by a decline in out of pocket
expenditure on drugs. Also notable is the growth of utilization of private health facilities, which
has grown rnore than 2.5 times.
Previous analyses of the 1992-93 data have attributed the impressive rise in pharmacy
visits to a combination of factors. The first is the improvement in the supply and availability of
pharmaceutical drugs between 1993 and 1998, following the deregulation of the retail markets
and liberalization of the pharmaceutical industry in 1989. Evidence suggests that the real price of
drugs may have declined over the 1993-98 period by as much as 30 per cent or more. The second
factor is the persistence of self-medication induced in part by the ease of access of medicines
7

relative to the alternatives. In rural areas, especially, distance from government health facilities
as well as poor quality of health services at commune health centers have been cited as possible
reasons for the continued growth of self-medication.
The growth of private health providers is another important facet of health care
utilization. There are two main types of private health providers: (i) full time providers who own
private facilities, and (ii) part-time providers who are employed by the public health facilities but
engage in private practice during off-hours, (VHSR, 1999, p. 101). Both licensed and unlicensed
practices are included in this category, and hence the quality of care in this sector may be
variable. Nearly 70% of PHFs are estimated to be in urban areas.
3.1 Access and costs
A rough measure of access is the annualized health service contact rate by provider type. These
are shown in Table 3. This measure can be misleading if not supplemented with other
information. In any sample survey, one is likely to observe zero contact frequency for some
respondents, in part because the respondent was healthy in the survey period and did not need
health care. Table 4 compares the overall contact rates with the subset consisting of those
classified as sick or injured, and extends the same comparison across different income levels.
The figures show that commune health care is sought at a 3-4 times higher rate by the
sick in the lowest income quartile, compared with the sick in the highest income quartile. The
situation is reversed in the case of government hospitals. The contact rate in that case is 3-4 time
higher for the sick rich than for the sick poor, indicating that these hospitals are more important
providers of health care for the relatively better off. This differential usage is further in evidence
for private health providers, but the difference multiple is closer to 2 than 3 or 4. The differential
8

usage is the smallest for pharmaceutical providers. This appears to indicate that access to private
drug vendors is roughly equal for the sick, whether low- or high-income. However, this needs a
caveat because government hospitals that are accessible to the VHI enrollees, and are favored by
the high-income groups, also dispense pharmaceutical drugs, and act as a substitute for
pharmacies.
Table 4 shows the average contact rates with providers by health status. This shows that
at all income levels pharmacy is the most frequently contacted care provider for the sick. Private
health providers and government hospitals, respectively, are the next most frequently contacted
by those in the top income quartile. For the sick in the lowest income quartile, private providers
are relatively more frequently contacted than are commune health centers. The contact rates for
the latter are very low for high income individuals.
To summarize: commune health centers appear to primarily serve the low-income groups,
and government hospitals primarily serve the high income group. However, as noted below,
those who are covered by Vietnam Health Insurance (VHI) program are serviced by government
hospitals. And insurance coverage under VHI is more extensive for the relatively better off
groups; hence the observed higher usage for these groups may be due to a combined income and
a price effect, as will become clear in our econometric analysis. Finally, as others have also
previously noted (Gertler and Litvack, 1999), self-medication through drugs purchased at
pharmacies appears to be the first line of defence against sickness, irrespective of their income
class.
Cost of access: For each type of service contact, the questionnaire collected responses on
the total cost of transportation, room and board, and other related costs. Of course, these data
were only collected for those who actually had non-zero usage. The data are censored for those
9

who had zero usage. For those who had positive usage level, the data can be used to estimate
average extraneous cost of health service. Although this is useful information, it is insufficient
for modeling individual choice of the type of service. Standard economic theory suggests that in
choosing between two types of providers, e.g. commune health center and government hospital,
the relative extraneous cost of the services of the two providers is relevant. The survey data only
pertain to the average extraneous cost of the service actually chosen by the patient. By itself it
cannot be used to construct a relative price for each user that is needed for modeling purposes.
Even a simple measure such as distance from different types of providers may be used to
construct a more appropriate measure of the extraneous costs under the assumption that such
costs are closely related to the distance. The average extraneous cost of access, for those who
used a provider, may still be useful as a rough benchmark comparisons. Average household
medical expenditures for different types of households are shown in Table 5. The medical
expenditure for the average urban household is nearly 50% higher than the average rural
household.
3.2 Health insurance
A major new development in the health sector since the 1992-93 VLSS survey is the emergence
of a national health insurance program, Vietnam Health Insurance (VHI), initiated in late 1992,
began effective operation in 1993.
Three health insurance programs in Vietnam are provided under government sponsorship,
comprising a compulsory national health insurance program and the two voluntary programs.
During its first phase, insurance coverage was provided to current and retired civil servants and
to salaried employees of state-owned and large private enterprises. Benefits include the full cost
10

of pharmaceuticals, ambulatory and inpatient care at governmentalfacilities to which enrollees
are referred; a district or provincial hospital acts as a primary care provider. The mandatory VHI
coverage does not extend to dependents of employees.
A second voluntary VHI plan provides for coverage on a group basis to VHI dependents
and some other groups such as communes. That is, groups rather than individuals must enrol in
the program. The benefit level varies. A third tier of national health insurance is the voluntary
plan, called Comprehensive Student Insurance (CSI). The benefits of the compulsory VHI are
less variable than those of the voluntary component. The CSI plans and premiums are locally
designed and administered, and show substantial variation in premiums and benefits among
localities.
One estimate of the number of total (compulsory and voluntary) enrollees in the VHI
program comes from VHSR (1999) that estimates this at 9.8 million in 1998, which includes
about 38% voluntary enrollees. This covers roughly 12% of the population. The coverage of the
target population for the compulsory component is around 77%, but it is much lower for the
voluntary component and largely consists of students.
Having health insurance is positively related to income class. In the lowest income
quartile, insurance coverage rate is 9.2%. A high proportion of this group may be those enrolled
in the voluntary scheme. In the top income quartile, 24.5% have health insurance, see Table 6.
Tabular analysis of the impact of insurance is provided in the VHSR (1999, Table 65).
Controlling for income (by quintiles) the insured have significantly higher rates of service
utilization of public providers, especially for in inpatient services in government hospitals.

Because the VHI premium for the compulsorily insured is a fixed percentage of the
employee's base salary, the cost of insurance varies and income serves as a partial proxy for the
cost of insurance.
One of the objectives of the empirical investigations in this article is to estimate the
impact of health insurance on utilization - - an issue that was not relevant in analyzing 1992-93
VLSS data. The foregoing account raises an important econometric issue concerning the
treatment of health insurance. For the compulsorily enrolled in the program, i.e., the majority, we
may treat insurance status as exogenous, but for those who are voluntarily enrolled, there may be
an element of individual choice, which is an argument for treating the variable as endogenous.
However, as was noted above, enrollment is on a group, and not individual, basis. This factor
diminishes the role of individual preferences in the choice of health insurance. There is also a
related data problem. The health component of the questionnaire asked only two questions about
insurance; first whether the respondent had health insurance, and second, the cost of health
insurance in the previous 12 months. Without additional data, one cannot distinguish between
those who were enrolled in the compulsory insurance program and those who were not.
Therefore, insurance status will be treated as exogenous in the health care utilization equation.
That is, we postulate that causality runs from health insurance to health utilization. In theoretical
models with unrestricted choice of insurance, the choice of insurance and health utilization will
be interdependent, or jointly (rather than recursively) determined.
It is of some interest to compare utilization patterns among the insured and the uninsured
individuals, conditional on positive expenditure over the previous 12 months. Total expenditure
of the insured sample is about 20 percent higher, and this difference is statistically significant.
The average difference in government hospital utilization between the insured and the uninsured
12

is also statistically significant, that for the insured population being higher by a factor of about
2.5. The average difference in the use of private health facility and drug vendors is significantly
higher for the uninsured sample than for the insured. This general pattern is also consistent with
the results of regression analysis in which we control for many socio-demographic variables.
4 Statistical Issues in Analysis of Individual Data
In this section we shall develop econometric models for health insurance and for four categories
of health care services that jointly account for about 99 percent of the total health care
expenditure. The largest component (92.7%) is due to drug vendors and pharmacy visits;
government hospitals and private health facilities account for another 5.5 to 6.0 percent, with the
former being slightly larger. The commune health centers account for close to 1 per cent.
Traditional (Eastern) medicine providers and other smaller components will not be analyzed.
4.1 Problem of zeros
Individual utilization data are available for 27,731 cases. However, this includes a high
proportion of cases of zero utilization, in part because survey period is truncated at 4 weeks; see
Table 7. For PHARVIS the zero proportion is about 76%, but for the other three major provider
categories it is between 96 and 98 percent each. Typically the observed frequency distribution
shows positive probability mass at only a few other integer values, such as 1, 2, and 3, and with
very small mass at higher integer values. For example, for PHARVIS, the frequency of 1 visit is
about 10%, and of 2 visits about it is less than 5%. In the case of GOVHOSP, PHF, and CHC,
the corresponding percentages are even smaller.
13

The handling of the zero problem depends on whether one's objective is to model health
care expenditures or frequency of contact with the provider. In modeling expenditures the zeros
pose a problem because they introduce a discontinuity in the distribution of expenditures. But in
modeling a discrete random variable such as contact frequency this is not an issue.
For the 1992-93 data, Gertler and Litvack (1999) chose the "two-part model", in which
the first part models the split between zero and nonzero expenditures through a binary outcome
model. That is, the focus is on modeling the probability of contact with the provider, using the
logit, or the probit, or the linear probability model. The second part of the model is a linear
regression in which the outcome variable is health care expenditure, or the logarithm of it, for
those who had at least one contact with the provider. If y denotes the measure of health care use,
e.g. expenditure, and X denotes the explanatory variables, then according to the two-part model,
E[y|X] = probability[y > OIX]x E[yly > O,XI
An attraction of the TPM framework is that it provides a solution to the awkward
statistical issues arising from the presence of significant probability mass at y = 0.3 Note also that
the zeros have two possible interpretations. The first is that they correspond to "corner solutions"
in the consumer choice problem. That is, they indicate non-consumption, given current income,
price, and health status. A second interpretation is that zeros indicate that the good under
consideration is not in the consumer's choice set, for a variety of possible reasons; see Cameron
and Trivedi (1998, chapter 6). The first part of TPM may be interpreted as a model of the
probability of an interior solution to the choice problem, while the second part models the level
of consumption, conditional on an interior solution being realized. Therefore, both parts yield
estimates of economically interesting parameters.
3 Continuous probability distributions cannot allow for nontrivial probability mass at zerofrequency.
14

A disadvantage of this framework is that the number of observations available for the
second part of the model can be proportionately quite small, leading to a loss of precision in
estimation. In these cases it is attractive to use a count data model, which can naturally
accommodate a significant probability mass at zero, making it unnecessary to separate the zero
and nonzero observations as in the case of TPM.4 Further, count data models work well in those
cases where the outcomes are concentrated on a relatively few values of the outcome variable,
which is the case for three of the four utilization measures we wish to model; an important
exception is the number of nights spent in public hospital. In all count models the following
specification is used to model the number of visits:
log(E[#visitsto provider|X|])= lXjj.
In this paper we shall use the binary outcome framework, a la Gertler and Litvack, in
those instances where the frequency distribution of contacts is strongly concentrated on just two
(O and 1) or three values (0, 1, and 2). For other cases, most notably PHARVIS, we shall use a
count data model in which the modeling focus is on the average number of contacts as a function
of observed characteristics of individuals.
Aggregate health care expenditures are modeled both at the level of an individual and at
the level of the household, but we do not model expenditure on individual components of
utilization.
4A qualification is that the proportion of zeros may be "excessive" relative to the count modelspecified, thereby requiring that we use as flexible a count data model as feasible (see Cameronand Trivedi, 1998).
15

4.2 Problem of clustering
Another significant factor is the clustering of responses by the primary sampling unit, the
commune, used in the complex (stratified) sample survey methodology. In the case of VLSS
data, clustering is by commune, which is sampling unit. The sample covers fewer than 200
communes, with variable number of observations per commune.
Clustering implies lack of independence of observations. Clustering affects both the
discrete and continuous outcome variables studied in this article. If there is significant within-
commune homogeneity, perhaps due to common unobserved fixed or random components that
affect all individual behavior within a commune, then assuming independence of observations
will produce estimates with a spuriously higher degree of precision than is warranted. The
correct sampling variances are larger than estimated under the independence assumption.
Two statistical approaches to deal with the effects of clustering are used. The first is
based on adjusting all standard errors for clustering by using the so-called "cluster robust"
variance estimator. Typically this adjustment inflates the estimated variance of the coefficients.
This approach is analogous to the use of the so-called Eicker-White robust variance estimator.
All estimates of standard errors reported in this study are "cluster robust" unless stated
otherwise.5
A second approach to clustered observations uses a different statistical model. In this case
it is assumed that each commune has its own intercept, denoted aj wherej is the commune
subscript. Correlation between responses for a given commune reflect the presence of a common
intercept, which is treated as a cluster (fixed) effect. In this formulation of the cluster effect, both
the point estimates of parameters as well as their standard errors, are affected, whereas the
5For example, this is possible in the computer program STATA 6.0 for a variety of estimators.
16

"cluster robust" approach only adjusts standard errors. An example of a linear fixed effects
model is Deaton (1997, 288-292). In this study we want to allow for commune fixed effects, but
our main interest is not in estimating the fixed effects but in eliminating their impact on
economically interesting parameters like income elasticity. Neglect of the fixed (cluster) effects
can bias the coefficients of interest if the relevant regressors are correlated with fixed effects. In
fixed effect models parameters of interest may be obtained after "sweeping out" commune
effects. However, unlike linear regression models where the sweep step is always possible, for
nonlinear regression models used in this paper, this approach is feasible for only for a class of
models, such as the logit (but not the probit) and Poisson regression models (Hsiao (1986);
Cameron and Trivedi (1998, Chapter 9.3).
An interesting feature of our use of the fixed effects count model is that it indirectly
reduces the impact of the "excess zeros" problem. This comes about because the fixed effects
model will drop all observations from a commune if the responses within a commune are
identical. In general, therefore, fixed effect models are based on fewer observations since (as is
the case in our sample) all observations from a commune are thrown out if every survey
respondent records the same response (e.g. zero). For example, if in any particular commune the
sample shows no usage of the CHC, then all observations for that commune are dropped. This
reduces the sample size but also reduces the impact of the "excess zeros" problem. The number
of "lost" observations will vary with the type of provider being considered.
The two approaches for handling clustered data involve non-overlapping statistical
assumptions. Hence there is no guarantee that the results from fixed effects model will coincide
with those from the standard models. Nor is there a simple of way of choosing between the two
models, in case they yield different results.
17

4.3 Econometric models
The preferred model in this article for counted data is some variant of the count
regression model that can handle the aforementioned statistical problems of clustering and/or
excess zeros. In those cases where the excess zeros problem is very severe, the binary outcome
model is used to model the probability of nonzero outcome. The justification here is that our
ability to distinguish between factors that lead to (say) n+l units of utilization rather than $n$ is
seriously reduced when the cell counts for those outcomes are small. Hence, to gain precision,
we only attempt to distinguish between zero usage and positive usage, ignoring the extent of
positivity.
In all cases we have used the fixed effects version of an estimator to check the robustness
of the estimates. Fixed effects estimators are usually adopted in the analysis of longitudinal data
to deal with individual specific heterogeneity under the assumption that this component is fixed
for any individual and can be "swept out" by an appropriate data transformation that is feasible
given repeated observations on the same individual. In the case of VLSS data we have assumed
instead that the fixed effect is commune specific and can be handled in an analogous fashion
given more than one observation per commune. That is, the longitudinal (panel) models can be
adapted to handle the present case. The underlying general method for handling clustered data is
the conditional maximum likelihood approach which can be applied to binary, counted or
continuous data. Fixed effects variants of the Poisson, the logit and the linear regression
available in the literature for panel data can be adapted to handle clustered observations.
18

Counted data are sometimes modeled using the ordered probit or the Tobit regression.
These rely on the normality assumption. Violation of normality due to the excess zeros ad
clustering is so pervasive in the VLSS sample that these estimators are inappropriate.
To summarize: the following alternative models specifications were estimated.
Individual data
* Probability of having health insurance.
* Probability of visit to: commune health center (CHC); private health facility (PHF);
government hospital (GOVHOSP); pharmacy or drug vendor (PHARVIS).
* Number of visits to: CHC; GOVHOSP; PHF; PHARVIS.
* Probability of admission to government hospital (HOSPADM).
* Number of nights spent in government hospital (HOSPNITE).
* Aggregate expenditure on health care provided by all providers in the 4 weeks preceding
the survey and in government hospitals in the previous 12 months (MEDEXP)
Household data
* Aggregate expenditure on health care provided by all providers in the 4 weeks preceding
the survey and in government hospitals in the previous 12 months (HMEDEXP).
5 Results
The main focus of the discussion of results will be on the role of income and health insurance,
after conditioning on a set of relevant covariates. This conditioning applies to all models unless
stated otherwise. As is customary, the income variable is proxied by logarithm of total household
expenditure, denoted log(INC). The only price variable is HLTHINS. The conditioning
19

covariates are AGE, SEX, MARRIED, EDUC, ILL, INJ, ILLDAYS, ACTDAYS. These
variables are defined in Table 8.
5.1 Determinants of health insurance status
Initially we do not distinguish between voluntary and mandatory enrollees into the VHI program.
A logit model for health insurance (HLTHINS) status, using the full sample, shows that age
(AGE), educational level (EDUC), and income (INC) are all strongly positively related to having
insurance. See the first two columns of Table 8 for detailed regression results. The coefficient on
log of total household expenditure, our proxy for income, is precisely determined with a t-ratio
exceeding 5 in most specifications. High income and high education both increase the probability
of compulsory coverage, hence the observed result is quite plausible. Surprisingly being married
(MARRIED) is negatively related to having health insurance. One possible interpretation of this
result is that it reflects the higher rate of health insurance among students through the CSI
program, but it could also reflect relatively higher enrollment into the VHI by unmarried males.
Controlling for the aforementioned factors, there is a negative association between having
insurance and being female. In the third and fourth column the results are for a specification with
a more flexible functional formn for the income variable to allow for different response
coefficients in the four income quartiles, denoted INC 1, INC2, INC3, and INC4. Essentially we
split log(lNC) into four ranges and consider whether the income coefficient varies and whether
this spline functional form improves the fit of the model. This specification fits the data better.
However, the fixed effects logit version, which allows for commune fixed effects, of the same
specification fits even better. Overall, this regression gives a similar picture to that form the
20

simple logit, but it shows that the insurance decision is insensitive to income in the lowest
quartile, and most sensitive in the two middle quartiles.
Several variants of the fixed effects logit model were estimated by three age categories:
less than 22 years, between 22 and 60, and greater than 60. The motivation for this
disaggregation comes from the aforementioned differences in types of health insurance. It is
expected that the student enrollees are predominantly concentrated in the youngest group, and
the retired individuals in the oldest group, leaving the middle group containing the largest
number of those mandatorily enrolled. Interestingly, the average rate of enrollment in three age
groups varies only between 16% and 19%. The regression for the middle group are shown in the
last two columns of Table 8, and the main features of this regression conform to those mentioned
earlier in this section. The results for the youngest group show the highest income coefficient
(.72), and those of the oldest group show statistically zero income sensitivity. The separate
results for the young and old groups are not reported in Table 8 to save space. Although this
disaggregation is rough, and a more careful modeling of the insurance decision is desirable, our
results do not suggest that there is serious distortion due to the absence of distinction between
types of health insurance. It is, however, possible that the main impact of different types of
insurance will be on utilization. This issue will be explored in later sections on health care
utilization.
An important issue is whether there is adverse selection into the insurance program. To
infer that there is, one would need to show that controlling for other factors, the insurance
program enrols a disproportionately larger number of "bad risks". Identifying high risk enrollees
is not easy because of the lack of information about the long term health status of individuals in
the health survey. Our inference has to be more indirect. The survey provides information on the
21

injury and/or illness in the 4 weeks preceding the survey, and information on the number of
illness days and days of limited activity. Information is also available on the smoker/nonsmoker
status of the respondent. This latter variable can serve as a proxy for future health problems. The
logit regression results suggest that there is no significant association between insurance status
and the number of illness days (ILLDAYS) and/or limited activity days (ACTDAYS), or
smoking habit. There is, however, statistically significant, but weak, positive association between
incidence of illness (ILL) and injury (INJ) and having health insurance. This is consistent with
those who are insured having a greater proclivity to reporting illness or injury.
The sector of employment plays an important role in the insurance status because, as was
pointed out Section 3, insurance is mandatory in some government and private sectors. If, as
seems reasonable, membership of the sector is independent of the level of utilization, then
exogeneity of the insurance variable is justified. In such cases it seems valid to argue that
causality runs from insurance to utilization. To put this argument on a sound footing it is
desirable to enter sector of occupation as an additional factor in the insurance equation and to
confirm its role as an important factor after conditioning on income and educational attainment.
Implementing this step requires additional data that were not available when this study was done.
We now turn to regression analysis of utilization, treating the insurance variable as exogenous.
5.2 Commune health centers
Detailed regression results are given in Table 9. In the case of CHC, the relative
infrequency of use, the "excess zeros" problem has already been noted. This makes the results
from direct application of the Poisson regression unreliable. Hence the reported results use either
22

the fixed effects (conditional maximum likelihood) variant of the Poisson regression, or simply
fixed effects logit model for the probability of CHC use.
The three regressions in Table 9 suggest that CHC is treated by users as an inferior good.
The marginal impact of rising household income on both the probability and level of usage is
negative and significant; see the last four columns. The impact of rising educational level is also
negative but is only marginally significant. That is, CHCs are typically not used by the higher
income and better educated groups. In their analysis of 1992-92 VLSS Gertler and Litvack have
noted the low quality of CHC services (also see VHSR, 1999). Our evidence is consistent with
their observation. However, it would have been more satisfactory to have introduced additional
variables in the regression reflecting various observed features of CHCs, in order to pin down
precisely why CHCs are shunned by users. For example, it would be useful to know whether
there are differences in their ability to supply drugs or provide higher levels of service. However,
this requires more data than currently available.
To throw more light on the relation between income (log(INC)) and the level of use of
CHCs, we report an additional regression in Table 9, first two columns, which uses the spline
functional form to allow for different response coefficients in the four income quartiles, denoted
INC1, INC2, INC3, and INC4. The fit of the model for probability of using CHC improves only
slightly. These results indicate that the income coefficient is not significantly different from zero
for the three lowest income quartiles, and is significantly negative for the highest income
quartile. Qualitatively the pattern of coefficients that we find is that which we expect for an
"inferior good".
The coefficient of HLTHINS is positive. This is an unexpected result. When additional
regressions were estimated for three age groups, the results indicated positive coefficient in each
23

case but with a low degree of precision. One possible explanation is that the result reflects the
role of the CHCs as drug providers to eligible insured individuals.
The results also indicate that AGE and CHC use are negatively related, i.e., older
individuals avoid using CHCs.
The strongest positive relation of CHC use is with short term health status. Those who are
ill, or injured, and have suffered limitation in physical activity do use CHCs. For young and
sick/injured individuals from low-income households, CHCs may serve as a first step in seeking
health care.
5.3 Government hospitals
This subsection will first discuss the results from models of probability of outpatient visits. This
is followed by discussion of results for inpatient hospital admissions and number of nights spent
in the hospital.
5.3.1 Probability of outpatient use
A variety of estimation methods have been used to model the probability of use of public
hospital outpatient services. Detailed regression results are given in Table 10. The results from
the regular logit and fixed effects logit are qualitatively similar and precise.
The probability of use is strongly and positively related to household income. The
elasticity of probable use with respect to income is estimated around 0.4. There is also a strong
positive relationship wiih having health insurance (HLTHINS), which confirms the strong
connection between the use of public hospital outpatient services and having health insurance.
These two results confirm that income and price effects in the use of public hospital outpatient
24

services are strong. Additional robustness checks do not show that the fit of the model can be
improved by using a spline specification for the income variable.
The use of public hospitals is also strongly related to being ill or injured and to the length
of illness (ILLDAYS). Usage is also higher for married persons and for females. Somewhat
unexpectedly, AGE is negatively related to use. However, inpatient utilization is strongly and
positively related to age, as discussed in the following section.
5.3.2 Hospital admissions and nights in hospital
About 5% of the sample reported admission into hospital in the 12 months prior to the survey.
About 26% of these are insured. Of these the overwhelming majority, more than 97%, spent at
least one night in hospital. The average number of nights spent in hospital, conditional on
admission, is between 13 and 14, but the median figure is about 7, indicating a skewed, fat-tailed
distribution. The probability of hospital admission is higher for the insured than for the
uninsured, and the average length of stay in hospital is also longer for the insured, about 18 days
versus 12 for the uninsured. The distribution of hospital expenditure is also correspondingly
skewed and fat-tailed with very high non-normal kurtosis. That is, relatively small number of
individuals account for a high proportion of the total hospital expenditure.
Detailed regression results for admission and hospital nights are given in Table 11. The
results indicate a strong positive relation between being insured and the probability of admission
into hospital. There is also a statistically significant positive relation between income and
hospital admission, but this link is weaker than that with insurance. Other factors that indicate
bad health status also increase the probability of admission. When HOSPADM regressions are
run separately for the insured and uninsured subsamples, hardly a single explanatory variable has
a statistically significant coefficient for the insured subsample, but for the uninsured, both health
25
status and income levels are important factors. When the HOSPNITE regressions are run
separately for the insured and uninsured subsamples, most of the coefficients in the uninsured
equation are absolutely larger indicating that their greater sensitivity to other factors. That is,
having health insurance reduces the role of other factors but does not eliminate it.
Developing a robust regression model for the number of nights in hospital is difficult
because of the awkward frequency distribution of the data. Several linear and nonlinear (count
data) models were tried. None fit the data really well; that is, the data are intrinsically rather
noisy. Overall, these results indicate that AGE, income, and HLTHINS are the most important
explanators of hospital usage. When different specifications of equations are considered income
is shown to be not a robust explanatory variable, but HLTHINS and AGE remain consistently
significant.
5.4 Private health facilities
The contact rate for private health facilities are significantly higher among the uninsured than the
insured population. They are also slightly higher among the younger age group.
Because the excess zero problem is very evident (95.5% of the sample report no use), the
estimated regressions model the probability of contact. Detailed regression results are given in
Table 11. In the full-sample regressions, HLTHINS has a negative coefficient reflecting higher
contact rate among the uninsured. Since insured individuals are eligible for outpatient care in
public hospitals, the private facilities are relatively more frequented by the uninsured. Health
insurance, therefore, diverts usage away from the private facilities.
Once we control for insurance status there is no clear evidence that income and private
health care are positively related. The size of the income coefficient is found to be sensitive to
26

changes in specification. In the fixed effects logit model the income coefficient is small and
relatively imprecise. The use of the spline specification also does not completely resolve the
ambiguity, but there is slight evidence that in the higher income quartiles there may be a
significant positive relation between income and the use of PHF.
In an attempt to examine the role of aggregation bias in estimating the income effect, the
fixed effects Poisson model was reestimated by age groups using both the regular and for the
spline specification of the income variable. For the middle income group (22<age<60), the
insurance impact is significantly negative and the income coefficient is small (-.064; t-ratio:
1.06). In the spline version, insurance impact is again negative and significant, and two of the
four income coefficients are also negative with t-ratios greater than 2, and one positive with t-
ratio also greater than 2. That is, PHF appears to be an inferior good at the higher range of
income, but possibly a normal good at a lower level. However, the link between income and
utilization is not robust. The ambiguity in the results persists also for the younger (age<22) and
older (age>60) groups. These results suggest that as yet there is only weak evidence of income-
induced demand shift towards PHFs and quite clear evidence of the negative impact of VHI plan
on PHFs.
In other respects the pattern of use is qualitatively similar to that of public hospitals. As
in that case, usage is positively related to being ill (ILL) or injured (INJ), being female (SEX) or
married, and with the length of illness (ILLDAYS), and negatively related to AGE. The last
result may simply indicate a greater willingness on the part of the young to try out the emergent
private health facilities.
27

5.5 Pharmacy visits
Detailed regression results for the number of visits and the probability of visit are given in Table
12. Because of the overwhelming importance of expenditure on purchased medicines, the results
for the frequency of pharmacy visits are of special interest.
Although many variants of the Poisson regression and the logit model were used, the
reported results are based on the commune fixed effects formulation.6
The most interesting results shown in the first two columns of Table 12 are: overall
income effect is significantly negative and the health insurance effect is also negative. As in the
case of GOVHOSP, using the fixed effects model lowers the absolute size of the income
coefficient. This result is plausible and consistent with lower income household relying
overwhelmingly on self-medication in the event of illness, injury, and activity limitation. In
earlier section we have already cited evidence that indicates an increasing reliance on self-
medication as the supply of drugs has improved and the retailing of drugs has become
deregulated. Drugs can also be dispensed at public hospitals, but the evidence presented above
suggests that this particular channel is available to, and more likely to be used by, the high
income insured individuals.
To more closely investigate the connection between income and pharmacy visits separate
regression models were fitted for probability and number of pharmacy visits, using a flexible
spline specification for income variable. These results suggest that pharmacy use is a normal
good, with a positive (but imprecisely determined) income elasticity, in the lower income
quartile. But with high probability it is an inferior good, with a negative income elasticity, in the
two highest quartile. Unfortunately, the relatively large standard errors on the coefficients
6See Cameron and Trivedi (1998, chapters 3 and 9) for a detailed discussion of the count datamodels used here.
28

preclude a stronger statement. That is, pharmacy visits appear to be an inferior good for the rich,
but a normal good for the poor. This result is different from that in some previous analyses based
on the 1992-93 VLSS data (Gertler et. al, 1996) which suggest that pharmacy visits is a normal
good at all income levels.
The impact of HLTHINS on self-medication is found to be negative and statistically
significant and sign-wise robust across a range of alternative specifications. The size of the
impact is larger in models that do not control for clustering and which are not reported in Table
12. The fixed effects Poisson model yields the lowest estimate but even this is unambiguously
negative and significant. Consistent with the results is the interpretation that self-medication is a
risky form of health care and it is avoided as income rises and as alternative higher quality health
care becomes available through health insurance. In Vietnam the higher quality care is provided
in public hospitals. Note that the more highly educated individuals, and hence presumably those
better aware of the risks of self-medication, also avoid pharmacy visits.
The role of other factors - - such as being female, being married, having illness or injury,
and the length of illness - -is similar to that which has been found for other types of health care;
that is, they all increase the frequency of pharmacy visits. One difference is that AGE does have
positive effect.
The picture presented above is broadly consistent with the predictions of a theoretical
model which treats self-medication as a risky alternative to professional care (see Chang and
Trivedi, 2001). The reported results are robust and do not qualitatively change if the econometric
analysis is carried out by insurance status or by using disaggregated age categories, or using
other econometric estimators based on more flexible assumptions.
29

6 Analysis of Health Care Expenditure
6.1 Individual data
This section is devoted to a regression analysis of medical expenditure. The dependent variable
is log(expenditure) for each member of the household, conditional on a positive level of
expenditure for that individual. All types of health care expenditure in the 4 week period
preceding the survey are included. The sample size is 8081.
The main focus in this analysis is again on the role of household income and HLTHINS.
As before, we control for the AGE, SEX, MARRIED, EDUC, and health status ILL, INJ,
ILLDAYS, ACTDAYS). The detailed regression results are shown in Table 13.
The results indicate that whereas household income continues to show a strong
explanatory power, the insurance variable is much less significant. The point estimate of the
elasticity of individual health expenditure with respect to income is of the order of 0.3 to 0.4. The
estimates of income elasticity from the fixed effects model are slightly smaller than those
without fixed effects.
The response to HLTHINS, however, is positive but with a relatively large standard error.
This can be interpreted as follows: HLTHINS acts to divert demand from care of lower quality,
such as that provided by commune health centers, to care of higher quality, such as that provided
in public hospitals. The aggregate response of expenditure to insurance then would be small or
zero if most of the impact takes the form such substitution. However, substitution in terms of
number of visits need not have zero impact on total expenditure. If the substitution is towards
care of higher quality, then total medical expenditure may increase. Such a situation seems
consistent with the estimates we have obtained. The insurance effect on health care expenditure
reflects substitution towards higher quality care.
30

The reported estimates are robust. Point estimates of income elasticity similar to that
from the fixed effects model are obtained from several other variants including the following:
separate models for insured and uninsured samples; random effects version of the estimated
model; model in which income coefficient is allowed to differ by income quartile. To save space
the details of these results is not included in Table 13.
6.2 Household data
Analysis of medical expenses aggregated across all household members serves as a useful check
on the results from individual data. It also yields estimates of Engle curves for medical
expenditure. The main limitation of this approach is that we cannot control for health status of
individual members of the household, and we have seen that to do so is important. We can
control for some of the other relevant variables such as location (urban or rural) and size of the
household, SEX, AGE and educational attainment of the head of the household.
Descriptive sample statistics show that on average households with insured head spend
about 20% more on heath care than those without. Average household health care expenditure is
higher for urban than rural household despite the fact that rural households are typically slightly
larger.
Detailed regression results are in Table 14. The most interesting result is that point
estimates of the income elasticity is around 0.6- 0.7, varying somewhat with the exact definition
of total expenditure that we use. Health care in total is thus found to be a normal good, but not a
'luxury good". If total health care expenditure is a small part of the household budget,
endogeneity of the total expenditure may be ignored. However, this assumption is easy to relax.
31

Instrumental variable estimates are given in the last two columns. The income elasticity still
remains around 0.6.
Additional robustness checks do not indicate that this estimate varies significantly by
urban or rural location, or by level of income. This point estimate of income elasticity is larger
than the corresponding estimate for individual expenditures. One possible explanation is that the
estimate from aggregate household data may be upward biased because of the failure to take into
account the effect of HLTHINS which, as was seen earlier, is positively correlated with the
household income level. That is, the role of insurance has been absorbed into the income
elasticity, causing it to become somewhat inflated. A second possibility is simply that demand
for health care at the level of the household is indeed more elastic than it is for a single
individual.
Age and sex of the head of the household are also significant factors. On average
households with female heads spend more on health care, and households with older heads also
spend more. Educational level of the head of the household is not found to be a significant
explanator.
7 Discussion of Policy Issues
In this section we discuss three health care policy issues: the implications of the pervasive
phenomenon of self-medication; the future of the CHCs; and the expected future changes in the
pattern of health care utilization.
This article has documented the pervasiveness of self-medication and the factors that
promote it. The phenomenon is a common one in most developing countries. The World Health
Organization (WHO) explicitly recognizes that self-medication has an important role to play in
32

most health care systems, and has observed that with the continued improvement in people's
education, general knowledge, and socio-economic status, self-medication has been successfully
integrated into many health care systems around the world. In a less developed economy like
Vietnam, where both public and private health care infrastructure is relatively basic, self-
medication is an important form of health care. Freer availability of drugs contributes to
household welfare. World-wide, the purchase of prescription-only drugs without a prescription is
far more common than the sale of over-the-counter drugs.7 Opportunities for self-medication are
enhanced and aided by the Internet and by the deregulation of over-the-counter sales of
pharmaceutical products with active ingredients. These tendencies have harmful consequences,
of which the growing ineffectiveness of antibiotic drugs is the most alarming and most visible.
When small doses are used to treat bacterial infections, presumably because the user cannot
afford the cost of the prescribed full course, instead of clearing the infection the practice
promotes the growth of antibiotic resistant strains of bacteria. This reduces the future potency of
antibiotics for all users. Previous World Bank reports reflect the concern expressed by the
medical profession and public health organizations. Inadequately supervised and administered
drugs, often in incorrect dosages, are a major contributing cause of the growth of antibiotic
resistant bacteria. The problem is a serious concern because it involves a negative intertemporal
externality - - current actions of an individual have a negative future impact on the society as a
whole. The public health issue is how to combat this problem.
This article has found econometric evidence that the practice of self-medication is
negatively associated with educational attainment, income levels, and the relative price and
7 WHO Drug Information, 14(1), 2000. This paper cites a consumer interview study carried outin six Latin American countries that found that only 34% of the dispensed medicines wereclassified as OTC.
33

accessibility of alternative providers. There is also strong a priori reason to believe that supply
side deregulation has lowered the price of, and improved access to, drugs, and thereby
encouraged self-medication. On the demand side we can expect that economic growth will
reduce the seriousness of the problem. But this view needs to be qualified. Although it appears
that in the highest income quartile self-medication is an inferior good, any reduction from this
source due to income growth will only make a small contribution to net reduction. The larger
positive contribution from lower income groups may outweigh the negative tendencies.
Moreover, economic growth has been more rapid in urban than in rural areas, so the reduction in
harmful types of self-medication in rural areas is likely to be even slower. Moreover, if
affordable alternatives to self-medication exist, then its use is more likely to decline as there is
increasing awareness of its dangers. Again such alternatives are less accessible in rural areas.
These arguments suggest that in the absence of regulatory constraints the practice of self-
medication is likely to persist. A discussion of the appropriate form of regulation is outside the
scope of this study.
Previous World Bank analyses, in expressing concern about the extent and continued
growth of (harmful) self-medication in Vietnam (see Gertler and Litvack (1998), VHSR (1999)),
have suggested that this growth is in part a consequence of low quality of care available to the
lower income groups. A variety of policy prescriptions have been put forward. Gertler and
Litvack (1998, pp. 246-247) suggest that improving the quality of service at the CHCs, for
example by improving the supply of low-priced generic drugs, would reduce self-medication.
The VHSR (1999, pp. 120-21) also mentions the proliferation of counterfeit and sub-standard
drugs available on the market. It goes on to describe the recently initiated Vietnam National
Drug Policy also aimed at rational and safe use of drugs. Our results suggest that an expansion of
34

the voluntary health insurance program would also have a qualitatively similar effect. It appears
that enrollment into the voluntary health insurance program has stalled, although the reasons for
such stagnation are unclear. However, our results indicate that enrollment into the insurance
program is responsive to income growth. Again this suggests that continued growth will reduce
the problem. However, the poorer rural sections of the population will benefit from this
development more slowly and to a lesser extent.
This article finds evidence that strongly suggests that commune health centers provide an
inferior service whose consumption declines with income and education. Our analysis is not
sufficiently detailed to pinpoint the CHC characteristics that are responsible for their decline. But
it is plausible that the readily available alternative of self-medication is partly responsible. Note
that it has been suggested that CHCs fail to carry adequate stocks of cheap generics and are
generally poorly staffed and equipped. Given the continuation of the present trends, the CHCs
may become even less important in the future.
The growth of private health facilities is a relatively recent phenomenon. Our results do
not suggest that income growth has a strong impact on the growth of this sector. It seems likely
that this sector provides services to those who desire a higher quality of care than available
outside public hospitals, but also are either ineligible or unable to get treated at public hospitals.
Evidence indicates that higher income individuals with insurance get treatment and drugs at
public hospitals. Currently, public hospitals seem to be the main and perhaps the only source of
quality care. With economic growth will come increased demand for health care of higher
quality, especially in urban areas. As long as the "catchment area" of the private health facilities
is restricted directly or indirectly, future economic growth will put greater pressure on public
hospitals, unless other alternatives superior to those currently available can be found. If, on the
35

other hand, the insured individuals can be treated at Private Health Facilities, then there will be
an alternative to public hospital care. This will reduce pressure on public hospitals that is bound
to arise if the income growth continues to be robust. Whether this will raise the average quality
of care, or reduce rampant self-medication, would seem to depend upon the regulatory
constraints that apply to the Private Health Facilities.
8 Summary and Conclusions
From previous analyses of 1992-93 VLSS data a stylized pattern of health care utilization
in Vietnam has emerged. Broadly, according to this stylized view, the richer sections of the
population get their health care at public hospitals, the poorer at the commune health centers, and
all groups use self-medication heavily, causing the latter to dominate as the principle source of
health care. In this picture, other providers such as private health facilities, traditional medicine
practitioners, home providers and so forth play a relatively minor role. The stylized description
has little to say about the impact of health insurance on the observed use pattern.
This study provides some confirmations as well as modifications of the above stylized
description.
* Evidence supports the view that those who are either ill or injured have ready access to
some form of health care. At all levels of income, the commonest response to the need for
health care is some form of self-medication.
* The private providers collectively are more important as a fraction of total health care
spending than the commune health centers.
* The results suggest that both self-medication and commune health centers are inferior
goods by the usual definition that their demand declines with rising household incomes.
36

Self-medication appears to be an inferior good especially for high income households,
but a normal good at low income levels. In the aggregate, however, the net effect of
income on pharmacy visits is estimated to be close to zero. These results are consistent
with the view that both self-medication and commune health centers are low-quality and
risky forms of health care in Vietnam.
* Within the existing income distribution estimates show a negative relation between the
use probability of commune health center and income. This negative relation is less
robust in the lowest income quartile.
* Health care provided by private health facilities is weakly related to income overall, but
may be positively related for the lower income groups.
* There is a strong positive relation between income and the use of both inpatient and
outpatient care provided at public hospitals.
* The net impact of health insurance on self-medication and the use of private health
facilities is negative. That is, under the current organization of health care delivery,
having health insurance diverts patients away from private health care and self-
medication mainly towards public hospitals, and to a lesser extent towards commune
health centers. The growth of services in the private health facilities is therefore affected
in opposite directions by rising income and rising proportion of insured population.
* Income, insurance status and age are the three major determinants of in-patient care
(hospital nights) in public hospitals.
* There appears to be no evidence that health insurance has had a significant impact on the
total household out-of-pocket health care expenditures (excluding care at in-patient care
37

at public hospitals) in either direction. That is, much of the impact seems to be in the
form of redistribution of care between types of providers.
* Previous analyses have expressed serious concern about the dominant role of
unsupervised and unregulated self-medication in Vietnam. It has been suggested that this
is made possible by easy availability of a very wide range of pharmaceutical drugs. Both
rising incomes and growth of health insurance reduce the extent of self-medication, but it
is not clear whether these deterrents are strong enough.
* Aggregate household income elasticity for health care is higher than indicated by
previous studies.
There are some qualifications. We have treated, with some justification, both health
insurance and household incomes as weakly exogenous variables. No allowance has been made
for measurement error in income. Standard statistical arguments suggest that this may cause us to
underestimate the impact of income on the demand for health care. Second, we have
distinguished between different types of health insurance only indirectly, and this may have
caused some aggregation bias of an indeterminate nature. Although we have provided a
statistical model of the probability of enrollment in the health insurance program, we have not,
for reasons of lack of data, provided any estimates of price sensitivity of insurance demand. This
is an important qualification to our finding that enrollment in the program is strongly associated
with income.
Finally, it is useful to review the main policy implications of the findings, which were
presented in Section 7. First, the results suggest several avenues for reducing the heavy (and
often inappropriate) reliance of Vietnamese on over-the-counter antibiotics. Increases in
household income and education levels should reduce this reliance over the long-term. In
38

addition, expansion of the new voluntary health insurance program would reduce reliance on
self-medication of antibiotics and other drugs. Second, there is clear evidence of dissatisfaction
with health services provided by commune health centers; people switch to other sources of
medical care as their income rises. Further research is needed on the source of this
dissatisfaction; among the possible sources are inadequate stocks of medicine and inadequate
staff. If no changes are made commune health centers will become an even less important
source of health care for the Vietnamese population. Finally, the role of private health care
providers in Vietnam needs further development. In the long run, they can provide high quality
hospital care, unless restrictions prevent them from doing so. This would serve as an additional
source of such care for individuals in Vietnam's voluntary health insurance program, and as that
program expands the capacity to meet the demand for such health care must be expanded as well.
39

References
Behrman, J.R. and J.C. Knowles (2000), "The Demand for Student Health Insurance in
Vietnam", unpublished paper.
Behrman, J.R. and J.C. Knowles (2000), "The Demand for Health Insurance in Vietnam: An
Application of Contingent Valuation", unpublished paper.
Cameron, A.C., and P.K. Trivedi (1998), Regression Analysis of Count Data, Econometric
Society Monograph 30. New York: Cambridge University Press.
Cameron, C., P.K. Trivedi, F. Milne, and J. Piggot (1988), "A Microeconometric Model of the
Demand for Health Care and Health Insurance in Australia", Review of Economic Studies,
55, 85-106.
Chang, F-R., and P.K. Trivedi (2001), "Economics of Self-medication: Theory and Evidence".
Working paper.
Deaton, A. (1997), The Analysis of Household Surveys, Baltimore: Johns Hopkins
Dollar, D., P. Glewwe, and J. Litvack (1998), Household Welfare and Vietnam's Transition.
World Bank Regional and Sectoral Study. Washington, D.C.: The World Bank.
Gertler, P. and J. Litvack (1998), "Access to Health Care during Transition: The Role of Private
Sector in Vietnam", chapter 8 in Dollar, D., et al., Household Welfare and Vietnam 's
Transition, 235-256.
Gertler, P., J. Litvack and N. Prescott (1996), "Health Care During Transition: The Role of the
Private Sector in Viet Nam", mimeo.
Hsiao, C. (1986) Analysis of Panel Data, Cambridge: Cambridge University Press.
World Bank (1999), Vietnam Health Sector Review. World Bank report.
40

World Bank (1995), Vietnam: Poverty Assessment and Strategy. Report of The World Bank
Country Operations Division Country Department 1. East Asia and Pacific Region.
41

Table 1: Definitions and descriptive statistics
Variable Definition Mean Std. DevPHARVIS number of pharmacy visits .51 1.31PHARDUM 0/1 dummy for pharmacy visit .26 .44GOVHOSP number of hospital outpatient visits .049 0.41PHF number of visits to private health facility .11 0.80CHC number of visits to commune health centers .04 0.34HOSPADM 0/1 dummy for hospital admissions .051 0.22HOSPNITE number of hospital nights 13.53 21.82MEDEXP Total medical expenditure 1,520 5,139(4W+12m) (4 weeks plus 12 months)HHEXP Total norninal household expenditure 15,273 13,020ln(INC) log(HHEXP) 2.60 0.62lnmedexp ( >0) log(MEDEXP) for positive expenditures 2.14 1.08Inmedexp (insured) Inmedexp for the insured 2.32 1.11lmnedexp (uninsured) Inmedexp for the uninsured 2.12 1.08HLTHINS 0/1 dummy for health insurance status 0.16 0.37AGE age in years 29.7 9.67SEX 0/1 dummy for gender .51 .49MARRIED 0/1 dummny for marital status .40 .49EDUC completed years of education 3.38 1.94ILL 0/1 dummy for illness in4 weeks before survey 0.41 0.49INJ 0/1 dummy for injury in 4 weeks before survey 0.009 0.098ILLDAYS number of days of illness/injury in 4 weeks before survey 2.80 5.45ACTDAYS number of days of lirnited activity in 4 weeks before survey 0.06 1.11URBAN 0/1 dummy for urban household 0.29 0.45HHSIZE household size 4.73 1.96
42

Table 2: Annualized health service contact rates by provider
GOVHOSP CHC PHARVIS OTHER PHF TRAD Public AllProviders Providers
1993 0.32 0.19 2.14 0.03 0.66 0.03 0.54 3.371998 0.60 0.57 6.78 0.25 1.76 0.36 1.43 10.33
Source: World Bank, Vietnam Health Sector Review, 37-38.
Notes:
CHC: commune health center
GOVHOSP: govemment hospital
PHF: private health facility
PHARVIS: visits to pharnacy or drug vendor
TRAD: traditional (Eastern) practitioner
OTHER: other government facilities.
43

Table 3: Mean number of visits to different health care providersbigskip
N CHC GOVHOSP PHF PHARVIS TRAD HOMEVISFull sample: mean 27331 .040 .049 .113 .512 .022 .038Sicksample: mean 11322 .096 .113 .274 1.214 .054 .091Insured sample 4496 .041 .105 .084 .406 .014 .037Sick/insured sample 1818 .100 .248 .198 .971 .033 .086Percentofhealthexpend. 8081 .96 3.22 2.61 92.17 .33 .41
Notes:
CHC: commune health center
GOVHOSP: government hospital
PHF: private health facility
PHARVIS: visits to pharmacy or drug vendor
TRAD: traditional (Eastern) practitioner
HOMEVIS: home visits
44

Table 4: Average contact rates with providers by health status
Income class Commune Govt. Hosp Private HF Pharmacy OtherAll Sick All Sick All Sick All Sick All Sick
Lowest 10% .0659 .1271 .0299 .0532 .1002 .1967 .5660 1.0688 .0279 .0586Lowest 25% .0596 .1219 .0336 .0672 .0995 .2089 .5595 1.1368 .0256 .0537Highest 25% .0119 .0326 .0762 .2005 .1406 .3878 .4526 1.2323 .0221 .0086Highest 10% .0075 .0211 .1081 .2920 .1398 .3989 3985 1.1407 .0096
Source: Author's calculations
Notes: The samnple sizes are as follows:
Full sample-
Lowest 10% - 2773; Lowest 25%- 6922; Highest 25% - 6939; Highest 10% - 2775.
Sick sample-
Lowest 10% - 1408 ; Lowest 25%- 3273; Highest 25% - 2483; Highest 10% - 945;
45

Table 5: Medical expenditure by households
Household type Expend. 1 Expend. 2 NAverage 1520 768 5999Average ly>O 1822 788 5006Urban 2000 997 1730Rural 1325 674 4269Farm 1772 942 2561Nonfarm 1331 637 3438
Notes:
Expend. 1: Medical expenditure;
Expend. 2: medical expenditure excluding insurance
46
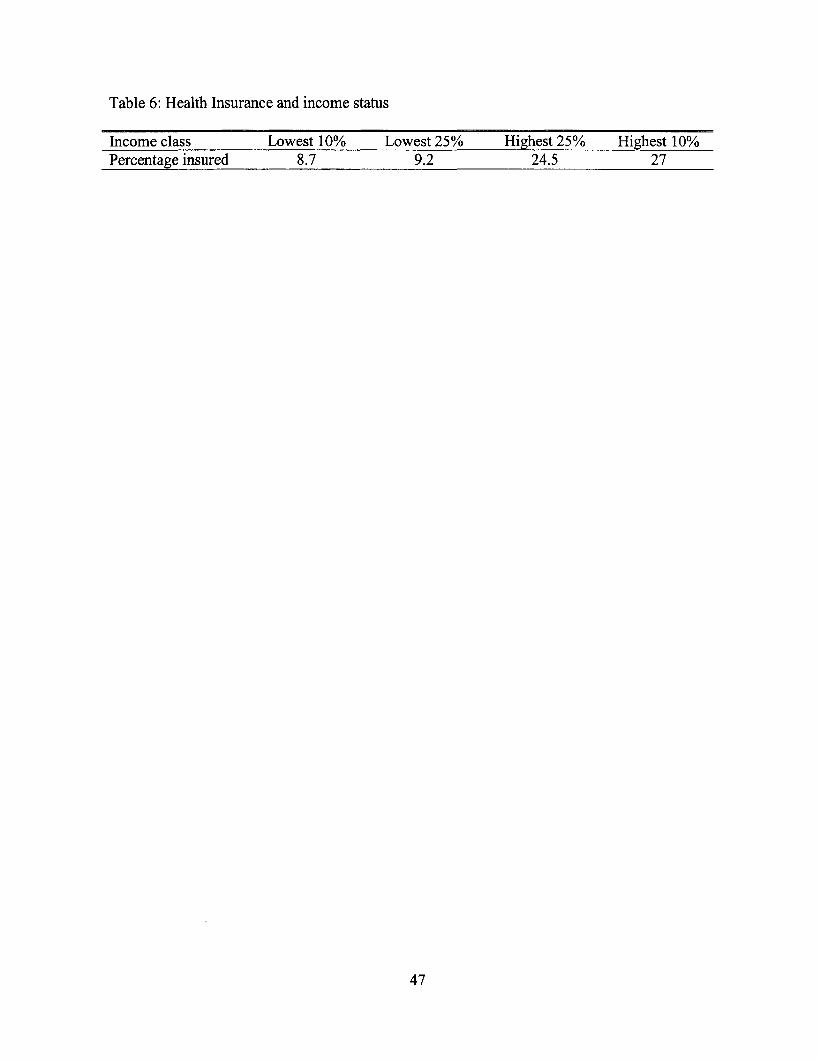
Table 6: Health Insurance and income status
Income class Lowest 10% Lowest 25% Highest 25% Highest 10%Percentage insured 8.7 9.2 24.5 27
47

Table 7: Frequency Distribution of health service contacts
Number of contacts Pharmacy GOVHOSP PHF CHC Other HOSPNITE0 20,639 26,796 26,481 27,041 27,158 421 3,827 736 540 486 254 712 1,716 133 316 111 124 1003 776 30 180 52 66 1224 359 17 99 23 36 745 174 8 36 6 24 926 64 4 12 3 12 547 43 1 18 4 16 2748 16 3 4 1 9 329 4 2 3 3 2 2010+
Notes:
sample size: 27,731; for HOSPNITE sample size = 1,463
GOVHOSP: outpatient contacts only.
HOSPADM: admissions in government hospitals.
HOSPNITE: nights in government hospitals.
48

Table 8: Determinants probability of health insurance enrollment
Robust Logit Robust Logit Fixed effects logit Fixed effects logitCoeff. Std.err Coeff. Std.err Coeff. Std.err Coeff. Std.err
cons -4.53 .2985 -3.9217 .6039 - - - -ln(INC) .3645 .0611 - - - - .5868 .0452AGE .3786 .0412 .0105 .0011 .0211 .0018SEX -.2940 .0368 -.2966 .0366 -.3509 .0365 -.2456 .0388MARRIED -.5099 .0726 -. 5008 .0733 -.4266 .0464 -.8005 .0616EDUC .2952 .0226 .2963 .0227 .2045 .0105 .2144 .0110INCI - -.0169 .2330 .1171 .1509 -
INC2 - 1.3532 .2871 1.0391 .2234 - -INC3 - .3967 .2343 .6203 .1684 - -INC4 - .0837 .1177 .3004 .0762 - --In-lik 11268 11242 9422 8220Sample Full Full Full 22<age<60
Notes: Fixed effects are assumed to be commune specific. Fixed effects logit adapts thecorresponding model for longitudinal data to the case of cross section data clustered bycommunes. Communes that show no response variation across individuals are droppedfrom the sample. For robust logit, standard errors are calculated using Eicker-White typeformula adapted for clustering.
49

Table 9: Models for number and probability of CHC visits
Fixed Effects Fixed Effects Fixed EffectsPoisson Poisson Logit
Variables coef std.err. coef. std.err. coef. std.err.cons - - -
ln(IJNC) - - -.2214 .0775 -.3574 .1116INC1 .0117 .1807 - - -
INC2 -.0704 .3240 - - - -INC3 -.3847 .3592 - - - -INC4 -.9222 .3285 - - - -HLTHINS .1855 .0941 .1885 .0996 .3820 .1310SEX .0699 .0616 .0608 .0616 .0637 .0877AGE -.0078 .0018 -.0082 .0018 -.0082 .0026MARRIED .3015 .0764 .3124 .0760 .2958 .1108ILLDAYS .0392 .0041 .0394 .0041 .0180 .0065ACTDAYS -.0221 .0122 -.0213 .0121 -.0194 .0301INJ 1.1758 .1788 1.1447 .1788 1.6969 .3422ILL 3.7315 .1992 3.7248 .1991 3.8622 4.1359EDUC -.0496 .0235 -.0510 .0234 .0065 .0316
-log-lik 2695 2700 1640n 15,132 15,132 15,132
Notes: Fixed effects are assumed to be commune specific. Fixed effects logit and Poisson adaptthe corresponding models for longitudinal data to the case of cross section data clusteredby communes. Communes that show no response variation across individuals are droppedfrom the sample.
50

Table 10: Government hospital inpatient and outpatient utilization
Robust Fixed Effect Fixed Effect Fixed EffectLogit Logit Logit Poisson
GOVHOSP GOVHOSP HOSPADM HOSPNITEVariables coef. std. err. coef. std. err. coef std. err coef. std. errcons -5.6949 .1915 - - - - - -
ln(INC) .4474 .0571 .4183 .0839 .1045 .0643 .4283 .0175HLTHINS 1.1155 .0834 .9449 .0928 .2070 .0768 .1583 .0214SEX .1723 .0742 .1709 .. 0746 .0115 .0553 -. 0452 .0160AGE -. 1783 .0518 -.1933 .0485 -.0349 .0370 .0068 .0004MARRIED .4947 .1006 .5085 .0966 .1035 .0718 -. 1812 .0194ILLDAYS .0906 .0041 .0964 .0046 .0169 .0054 .0111 .0013ACTDAYS .0392 .0300 .0451 .0199 .0555 .0259 -.0046 .0070INJ 1.7518 .2653 1.9980 .2440 -.7760 .4478 .4671 .0900ILL .5322 .0318 .6057 .0384 .1851 .0712 .0388 .0207EDUC .0003 .0192 -.0289 .0222 -.0441 .0173 -.0063 .0047
-In-lik 3297 2568 4981 10479n Full 25227 27380 1412
Notes: Fixed effects are assumed to be commune specific. Fixed effects logit and Poisson adaptthe corresponding models for longitudinal data to the case of cross section data clusteredby communes. Communes that show no response variation across individuals are droppedfrom the sample. For robust logit, standard errors are calculated using Eicker-White typeformula adapted for clustering.
51

Table 11: Models for probability of utilization of private health care%
Fixed Effects RobustLogit Logit
Variables coef. std.err. coef. std.err.cons 0.0 -6.93 .6177ln(INC) .0414 .0723INC1 .5434 .3033INC2 -.3038 .5098INC3 1.5588 .3783INC4 .1425 .1572HLTHINS -.2388 .1064 -.4003 .1135SEX .1512 ..0653 .1396 .0544AGE -.3908 .0364 -.3628 .0373MARRIED .3187 .0849 .3034 .0815ILLDAYS .0390 .0046 .0336 .0045ACTDAYS -.0376 .0242 -.0325 .0237INJ 1.3521 .2512 1.3208 .2760ILL 4.3357 .2160 4.2822 .2211EDUC .0242 .0207 -.0451 .0244
-In-lik 3097 3086n 27733 27783
Notes: Fixed effects are assumed to be commune specific. Fixed effects logit adapts the samemodel for longitudinal data to the case of data clustered by communes. Communes thatshow no response variation across individuals are dropped from the sample. For robustlogit, standard errors are calculated using Eicker-White type formula adapted forclustering.
52

Table 12: Models for pharmacy visits
Fixed Effects Fixed Effects Fixed EffectsPoisson Poisson logit
PHARVIS PHARVIS PHARDUMVariables coef. std.err. coef. std.err. coef. std.err.cons - -ln(INC) -.1025 .0190 -
INCI - - .0623 .0544 -.0336 .1257INC2 - - -.0939 .0939 .2239 .2234INC3 - - -.0346 .0823 -.6112 .1972INC4 - - -.3042 .0461 -.4301 .1028HLTHINS -. 1614 .0273 -. 1589 .0273 -.2613 .0592SEX .0255 .0171 .0024 .0171 .1267 .0399AGE .0564 .0004 .0283 .0004 .0059 .0011MARRIED .1071 0201 .1010 .0201 .1158 .0491ILLDAYS .0229 .0012 .0230 .0012 -.0401 .0032ACTDAYS 0203 .0056 .0207 .0056 .0438 .0190INJ .3019 .0788 .2965 .0789 .2533 .2195ILL 3.5072 .0486 3.5062 .0486 4.9302 .0706EDUC -.0167 .0055 -.0169 .0056 .0162 .0126
-log-lik 18564 18547 7617n 27671 27671 27671
Notes: Fixed effects are assumed to be commune specific. Fixed effects Poisson adapts the samemodel for longitudinal data to the case of data clustered by communes. Communes thatshow no response variation are dropped from the sample.
53

Table 13: Models for positive medical expenditure for individuals
OLS-Robust Fixed EffectsOLS
Variables coef. std. err. coef. std.err.cons .6096 .0797 0.0ln(INC) .3623 .0195 .2963 .0248HLTHINS .0922 .0327 .0254 .0332SEX .0021 .0228 .0033 ..0212AGE .1071 .0136 .0961 .0126MARRIED .0321 .0284 .0468 .0267ILLDAYS .0427 .0022 .0422 .0022ACTDAYS .0455 .0127 .0380 .0119INJ .1488 .1275 .2395 .1170ILL -.0659 .0587 -.0363 .0578EDUC .0085 .0063 .0047 .0071
R 2 .1208N 8081 8081
Notes: Robust standard errors are calculated using Eicker-White type formula adapted forclustering.
54

Table 14: Models for positive medical expenditure for households
OLS-Robust Random Effects Fixed Effects RobustOLS OLS IV
Variables coef. std. err. coef. std. err. coef. std. err. coef. std. err.
cons -.8852 .3806 -.3008 .4163 .1103 .4568 .0281 .5573ln(INC) .7340 .0436 .6542 .0479 .6000 .0519 .6210 .0692SEX .1189 .0531 .1172 .0513 .1091 .0519 .0760 .0517AGE .0100 .0017 .0115 .0016 .0116 .0016 .0105 .0016EDUC -.0296 .0127 -.0628 .0129 -.0519 .0135 -.0922 .0140URBAN -.3024 .0595 -.2648 .0917 - -
HHSIZE .0163 .0135 .0111 .0136 .0112 .0141 .0360 .0160R2 .094n 5006 5006 5006 5006
Notes: The variable ln(INC) has been "instrumented" using the instruments: urban; farm; agegroup; educational attainment; province.
55

Policy Research Working Paper Series
ContactTitle Author Date for paper
WPS2754 Revealed Preference and Abigail Barr January 2002 T. PackardSelf-Insurance: Can We Learn from Truman Packard 89078the Self-Employed in Chile?
WPS2755 A Framework for Regulating Joselito Gallardo January 2002 T. IshibeMicrofinance Institutions: The 38968Experience in Ghana and the Philippines
WPS2756 Incomeplete Enforcement of Pollution Hua Wang January 2002 H. WangRegulation: Bargaining Power of Nlandu Mamingi 33255Chinese Factories Benoit Laplante
Susmita Dasgupta
WPS2757 Strengthening the Global Trade Bernard Hoekman January 2002 P. FlewittArchitecture for Development 32724
WPS2758 Inequality, the Price of Nontradables, Hong-Ghi Min January 2002 E. Hernandezand the Real Exchange Rate: Theory 33721and Cross-Country Evidence
WPS2759 Product Quality, Productive Aart Kraay January 2002 R. BonfieldEfficiency. and International Isidro Soloaga 31248Technology Diffusion: Evidence from James TyboutPlant-Level Panel Data
WPS2760 Bank Lending to Small Businesses George R. G. Clarke January 2002 P. Sintim-Aboagyein Latin America: Does Bank Origin Robert Cull 37644Matter? Maria Soledad Martinez Peria
Susana M. Sanchez
WPS2761 Precautionary Saving from Different Richard H. Adams Jr. January 2002 N. ObiasSources of Income: Evidence from 31986Rural Pakistan
WPS2762 The (Positive) Effect of Norbert R. Schady January 2002 T. GomezMacroeconomic Crises on the 32127Schooling and Employment DecisionsOf Children in a Middle-Income Country
WPS2763 Capacity Building in Economics: Boris Pleskovic January 2002 B. PleskovicEducation and Research in Transition Anders Aslund 31062Economies William Bader
Robert Campbell
WPS2764 What Determines the Quality Roumeen Islam January 2002 R. Islamof Institutions? Claudio E. Montenegro 32628

Policy Research Working Paper Series
ContactTitle Author Date for paper
WPS2765 Inequality Aversion, Health Adam Wagstaff January 2002 H. SladovichInequalities. and Health Achievement 37698
WPS2766 Autonomy, Participation, and Learning Gunnar S. Eskeland January 2002 H. Sladovichin Argentine Schools: Findings and Deon Filmer 37698Their Implications for Decentralization
WPS2767 Child Labor: The Role of Income Rajeev H. Dehejia January 2002 A. BonfieldVariability and Access to Credit in a Roberta Gatti 31248Cross-Section of Countries
WPS2768 Trade, Foreign Exchange, and Energy Jesper Jensen January 2002 P. FlewittPolicies in the Islamic Republic of David Tarr 32724Iran: Reform Agenda, EconomicImplications, and Impact on the Poor
WPS2769 Immunization in Developing Countries: Varun Gauri January 2002 H. SladovichIts Political and Organizational Peyvand Khaleghian 37698Determinants
WPS2770 Downsizing and Productivity Gains Martin Rama January 2002 H. SladovichIn the Public and Private Sectors Constance Newman 37698of Colombia
WPS2771 Exchange Rate Appreciations, Labor Norbert M. Fiess February 2002 R. lzquierdoMarket Rigidities, and Informality Marco Fugazza 84161
William Maloney
WPS2772 Governance Matters Il: Updated Daniel Kaufmann February 2002 E. FarnandIndicators for 2000-01 Aart Kraay 39291
Pablo Zoido-Lobat6n
WPS2773 Household Enterprises in Vietnam: Wim P. M. Vijverberg February 2002 E. KhineSurvival, Growth, and Living Jonathan Haughton 37471Standards
WPS2774 Child Labor in Transition in Vietnam Eric Edmonds February 2002 R. BonfieldCarrie Turk 31248