Patterns of Drug Dispensing in California Workers ... | Patterns of Drug Dispensing in California...
36
1 | Patterns of Drug Dispensing in California Workers’ Compensation September 13, 2016 Patterns of Drug Dispensing in California Workers’ Compensation Gregory L. Johnson, Ph.D. Director, Medical Analytics
-
Upload
nguyenkien -
Category
Documents
-
view
213 -
download
0
Transcript of Patterns of Drug Dispensing in California Workers ... | Patterns of Drug Dispensing in California...
1 | Patterns of Drug Dispensing in California Workers’ Compensation
September 13, 2016
Patterns of Drug Dispensing in California Workers’ Compensation Gregory L. Johnson, Ph.D. Director, Medical Analytics
WCIRB California Research and Analysis
2 | Patterns of Drug Dispensing in California Workers’ Compensation
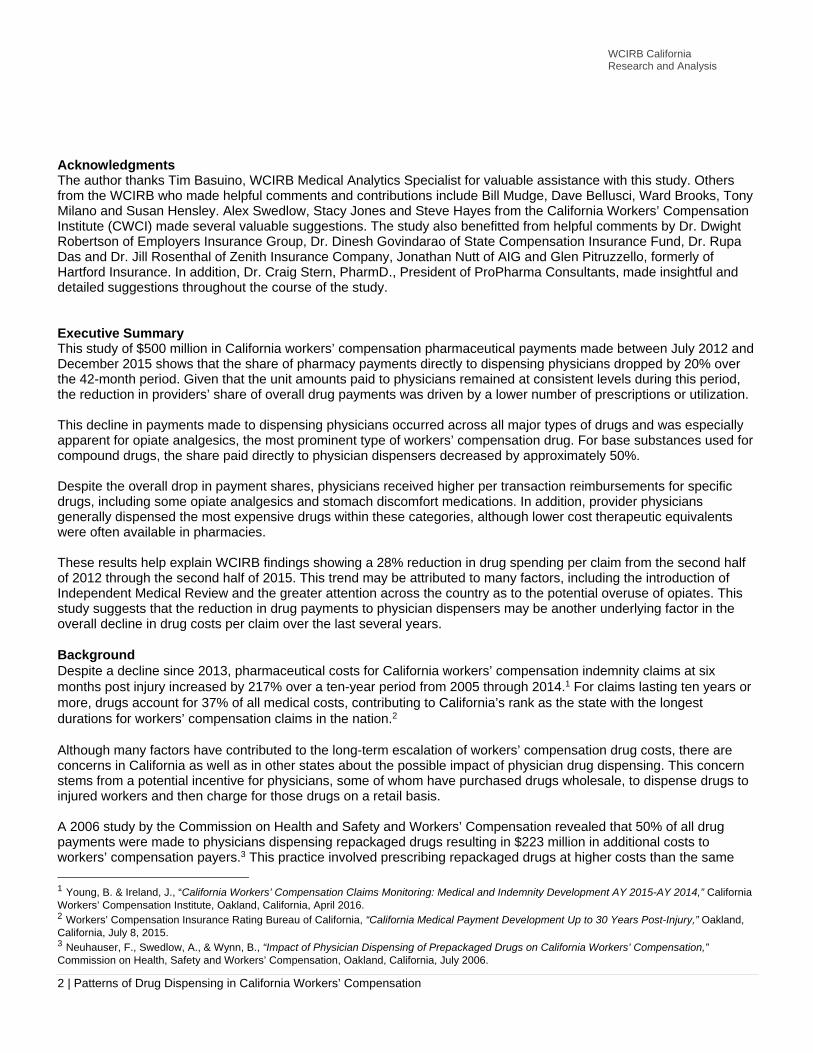
Acknowledgments The author thanks Tim Basuino, WCIRB Medical Analytics Specialist for valuable assistance with this study. Others from the WCIRB who made helpful comments and contributions include Bill Mudge, Dave Bellusci, Ward Brooks, Tony Milano and Susan Hensley. Alex Swedlow, Stacy Jones and Steve Hayes from the California Workers’ Compensation Institute (CWCI) made several valuable suggestions. The study also benefitted from helpful comments by Dr. Dwight Robertson of Employers Insurance Group, Dr. Dinesh Govindarao of State Compensation Insurance Fund, Dr. Rupa Das and Dr. Jill Rosenthal of Zenith Insurance Company, Jonathan Nutt of AIG and Glen Pitruzzello, formerly of Hartford Insurance. In addition, Dr. Craig Stern, PharmD., President of ProPharma Consultants, made insightful and detailed suggestions throughout the course of the study. Executive Summary This study of $500 million in California workers’ compensation pharmaceutical payments made between July 2012 and December 2015 shows that the share of pharmacy payments directly to dispensing physicians dropped by 20% over the 42-month period. Given that the unit amounts paid to physicians remained at consistent levels during this period, the reduction in providers’ share of overall drug payments was driven by a lower number of prescriptions or utilization. This decline in payments made to dispensing physicians occurred across all major types of drugs and was especially apparent for opiate analgesics, the most prominent type of workers’ compensation drug. For base substances used for compound drugs, the share paid directly to physician dispensers decreased by approximately 50%. Despite the overall drop in payment shares, physicians received higher per transaction reimbursements for specific drugs, including some opiate analgesics and stomach discomfort medications. In addition, provider physicians generally dispensed the most expensive drugs within these categories, although lower cost therapeutic equivalents were often available in pharmacies. These results help explain WCIRB findings showing a 28% reduction in drug spending per claim from the second half of 2012 through the second half of 2015. This trend may be attributed to many factors, including the introduction of Independent Medical Review and the greater attention across the country as to the potential overuse of opiates. This study suggests that the reduction in drug payments to physician dispensers may be another underlying factor in the overall decline in drug costs per claim over the last several years. Background Despite a decline since 2013, pharmaceutical costs for California workers’ compensation indemnity claims at six months post injury increased by 217% over a ten-year period from 2005 through 2014.1 For claims lasting ten years or more, drugs account for 37% of all medical costs, contributing to California’s rank as the state with the longest durations for workers’ compensation claims in the nation.2 Although many factors have contributed to the long-term escalation of workers’ compensation drug costs, there are concerns in California as well as in other states about the possible impact of physician drug dispensing. This concern stems from a potential incentive for physicians, some of whom have purchased drugs wholesale, to dispense drugs to injured workers and then charge for those drugs on a retail basis. A 2006 study by the Commission on Health and Safety and Workers’ Compensation revealed that 50% of all drug payments were made to physicians dispensing repackaged drugs resulting in $223 million in additional costs to workers’ compensation payers.3 This practice involved prescribing repackaged drugs at higher costs than the same
1 Young, B. & Ireland, J., “California Workers’ Compensation Claims Monitoring: Medical and Indemnity Development AY 2015-AY 2014,” California Workers’ Compensation Institute, Oakland, California, April 2016. 2 Workers’ Compensation Insurance Rating Bureau of California, “California Medical Payment Development Up to 30 Years Post-Injury,” Oakland, California, July 8, 2015. 3 Neuhauser, F., Swedlow, A., & Wynn, B., “Impact of Physician Dispensing of Prepackaged Drugs on California Workers’ Compensation,” Commission on Health, Safety and Workers’ Compensation, Oakland, California, July 2006.

WCIRB California Research and Analysis
3 | Patterns of Drug Dispensing in California Workers’ Compensation
drugs available at pharmacies. Given that a 2002 Appellate Court Case in San Diego upheld physicians’ right to dispense drugs4, the California Division of Workers’ Compensation addressed this issue in March 2007 through an administrative regulation which equalized payment levels for repackaged physician-dispensed drugs and drugs dispensed by pharmacies. This change appeared to reduce physician dispensing for some drugs while opening the door for dispensing of compounds not covered by the California Medi-Cal-based pharmacy fee schedule applicable to pharmaceuticals in the California system.5 On a national level, the National Council on Compensation Insurance (NCCI) showed that physician dispensing doubled from 2008 to 2011, while drug payments to physicians increased by 150% compared to 23% for pharmacies.6 Over the past several years, thirteen states passed legislation that either restricted physician dispensing or equalized drug reimbursement levels for all dispensing sites. Three states (New York, Texas and Massachusetts) completely ban physician dispensing. Massachusetts experienced a 42% drop in workers’ compensation drug costs after implementing this prohibition.7 Despite these legislative efforts, a national workers’ compensation Pharmacy Benefit Manager (PBM) reported physician dispensing generated payments for specific drugs between 198% and 311% higher than pharmacies.8 Although California’s pharmacy fee schedule is designed to prevent such price disparities, a California Workers’ Compensation Institute (CWCI) study showed that physician dispensing contributed to a 13% increase in overall medical costs and a 17% increase in indemnity costs.9 An Illinois study showed that physician drug dispensing contributed to 37% higher medical costs and 24% higher indemnity costs.10 A recent WCRI review of price-based reforms of physician dispensing in eight states indicated that initial savings generated by these controls were eroded when physicians began dispensing new drug versions.11 A 2014 report addressing the question of physician dispensing of compounds described how physician dispensing of these substances generates payments significantly higher than the level of the state workers’ compensation pharmacy fee schedule.12 In California, the number of prescriptions for compounds declined between 2012 and 2013, but the average paid per script increased by 68% to $774.13 In August 2016, RAND Institute issued a report on California’s new workers compensation drug formulary to be implemented July 1, 2017. The authors suggested that the administrative rules governing the formulary may limit physician dispensing by curtailing this practice in provider networks and by capping reimbursements for non-preferred physician dispensed drugs.14 A subsequent CWCI study showed that the formulary’s preferred drugs cover approximately 22% of California workers compensation drug payments. 15 The multi-year escalation in California workers’ compensation drug costs appears to be reversing. A December 2015 WCIRB study indicated that overall California workers’ compensation drug costs per claim declined by 22% on a
4 Fourth Appellate District Court, Park Medical Pharmacy vs. San Diego Orthopedic Associates, Case Number DO38051, San Diego, California, June 11, 2002. 5 Swedlow, A., & Ireland, J., “Analysis of Post-Reform Outcomes: Changes in Pharmaceutical Utilization and Reimbursement In the California Workers’ Compensation System,” California Workers’ Compensation Institute, Oakland, California, September 2009. 6 Lipton, B., Colon, D., & Robertson, J., “Workers Compensation Prescription Drug Study: 2013 Update,” National Council on Compensation Insurance, Boca Raton, Florida, September 2013. 7 Wang, D., Liu, T.C., & Thumula, V., “The Prevalence and Costs of Physician Dispensed Drugs,” Workers Compensation Research Institute, Cambridge, Massachusetts, September 2013. 8 Helios, “Workers’ Compensation Drug Trends Report,” Memphis, Tennessee, 2015. 9 Swedlow, A., Gardner, L. B. & Ireland, J., “Differences in Outcomes for Injured Workers Receiving Physician-Dispensed Repackaged Drugs in the California Workers’ Compensation System,” California Workers’ Compensation Institute, Oakland, California, February 2013. 10 White, et al. “Effect of Physician-Dispensed Medication on Workers’ Compensation Claim Outcomes in the State of Illinois,” Journal of Occupational and Environmental Medicine, May 2014. 11 Wang, D., Thumula, V. & Liu, T.C., “Eight State Reports on Physician Dispensing,” Workers Compensation Research Institute, Cambridge, Massachusetts, July 2016. 12 Walls, A.P., et al., “Compounding is Confounding Workers’ Compensation,” CompPharma, Tampa, Florida, 2014. 13 California Workers’ Compensation Institute, “Current Trends in Compound Drug Utilization and Cost in the California Workers’ Compensation System,” Oakland, California, February 2013. 14 Wynn, B., Buttorff, C., Meza, E., Taylor, E., & Mulcahy, A., “Implementing a Drug Formulary for California’s Workers’ Compensation Program,” RAND Corporation, Santa Monica, California, August 2016. 15 Swedlow, A., & Hayes, S., “California’s Proposed Workers’ Compensation Formulary, Part 1: A Review of Preferred and Non-Preferred Drugs,” California Workers’ Compensation Institute,” Oakland, California, August 2016.

WCIRB California Research and Analysis
4 | Patterns of Drug Dispensing in California Workers’ Compensation
cumulative basis from the second half of 2012 through the first half of 2015.16 Given that prior research pointed to physician dispensing as a factor in the multi-year year escalation of workers’ compensation drug payments, could changes in dispensing patterns contribute to this recent decline? In order to address this question, this study explores the dynamics of both pharmacy and physician drug dispensing in California workers’ compensation. The goal is to describe the frequency, cost impacts, primary drug types, and regional differences to illuminate this issue for system stakeholders. Study Approach The WCIRB used the following approach in this analysis of physician dispensed pharmacy costs:
1. The WCIRB analyzed drug payments in its Medical Data Call (MDC) database submitted by 45 insurer groups representing 91% of California workers’ compensation premiums. This database includes approximately 4.6 million unique drug transactions, 2.5 million paid bills, and $500 million in drug payments to 4,500 pharmacies and 2,600 physicians between July 1, 2012 and December 31, 2015. Pharmacy Benefit Manager (PBM) data was included if specific information on the recipients of drug payments, whether pharmacies or physicians was provided. A summary of the data included in this study is displayed in Appendix 1.
2. Drug data were analyzed using a six level drug classification hierarchy ranging from the broadest to most specific drug categories. For analytic purposes, the broadest category (Major Workers’ Compensation Drug Groups) combined several distinct medication types into one category. (An example is “Behavioral Health Drugs” which includes anti-depressants, anti-psychotics and sedative-hypnotics). Appendix 2 shows this classification hierarchy using a commonly prescribed opiate analgesic as an example.
3. To identify compounded drugs, each of the 2.5 million paid drug bills was analyzed to determine which bills contained payments for specific drug codes used for compound base substances. These base drug codes appeared on approximately 177,000 bills and any additional paid codes for standard drugs mixed into the base substances were included within compounding payments. Appendix 3 displays a representative example of a compound bill.
4. A WCIRB mapping tool grouped the 58 California counties into six regions, as described in Appendix 4.
5. To classify the provider data, WCIRB used these definitions: Pharmacies include entities paid for drugs with Provider IDs indicating pharmacies, chains, independents or compounding wholesalers and retailers. Physicians include entities paid for drugs with Provider IDs indicating “physicians” as defined by the California workers’ compensation system. Examples of entities included in these classifications are summarized in Appendix 5.
Research Questions This study addresses the following research questions:
1. Has the share of total drug payments to physicians changed during the 42-month study period? If so, does this change help explain the overall decline in drug costs per claim since the second half of 2012?
2. For specific types of drugs, how have payment patterns differed between physicians and pharmacies? Have
these trends changed over the 42-month study period?
3. What are the patterns of compound drug dispensing by physicians and pharmacies? Have the payment patterns for compound drugs changed over the 42-month study period?
4. What are the regional differences in compound and non-compound drug dispensing between physicians and
pharmacies? How do payments for compound drugs compare to each region’s overall medical payments?
5. Are there differences between physicians and pharmacies in dispensing brand versus generic medications? Do these differences help explain the overall decline in drug payments per claim?
16 Workers’ Compensation Insurance Rating Bureau of California, “Impact of SB 863 on California Workers’ Compensation Medical Costs through June 30, 2015,” Oakland, California, December 10, 2015.
WCIRB California Research and Analysis
5 | Patterns of Drug Dispensing in California Workers’ Compensation
6. Do physicians and pharmacies exhibit different payment patterns for therapeutically equivalent drugs? If so, how do these differences help explain the overall changes in dispensing patterns?
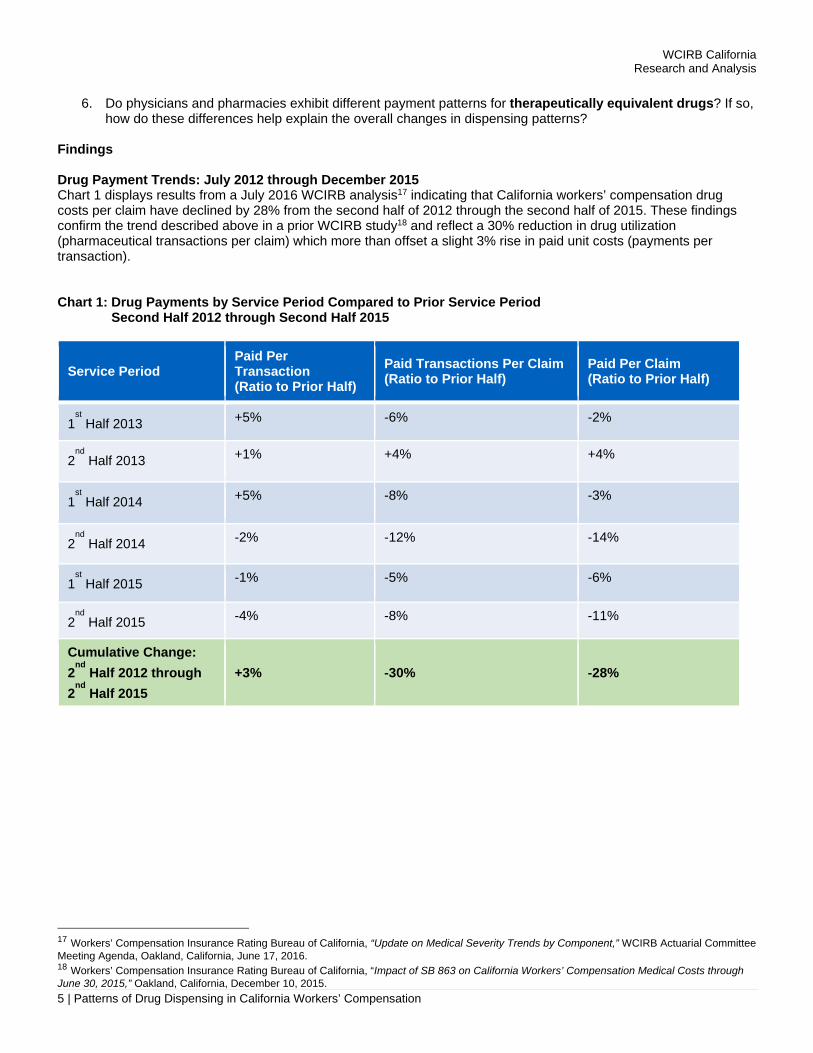
Findings Drug Payment Trends: July 2012 through December 2015 Chart 1 displays results from a July 2016 WCIRB analysis17 indicating that California workers’ compensation drug costs per claim have declined by 28% from the second half of 2012 through the second half of 2015. These findings confirm the trend described above in a prior WCIRB study18 and reflect a 30% reduction in drug utilization (pharmaceutical transactions per claim) which more than offset a slight 3% rise in paid unit costs (payments per transaction). Chart 1: Drug Payments by Service Period Compared to Prior Service Period Second Half 2012 through Second Half 2015
Service Period Paid Per Transaction (Ratio to Prior Half)
Paid Transactions Per Claim (Ratio to Prior Half)
Paid Per Claim (Ratio to Prior Half)
1st Half 2013 +5% -6% -2%
2nd
Half 2013 +1% +4% +4%
1st Half 2014 +5% -8% -3%
2nd
Half 2014 -2% -12% -14%
1st Half 2015 -1% -5% -6%
2nd
Half 2015 -4% -8% -11%
Cumulative Change:
2nd
Half 2012 through
2nd
Half 2015
+3% -30% -28%
17 Workers’ Compensation Insurance Rating Bureau of California, “Update on Medical Severity Trends by Component,” WCIRB Actuarial Committee Meeting Agenda, Oakland, California, June 17, 2016. 18 Workers’ Compensation Insurance Rating Bureau of California, “Impact of SB 863 on California Workers’ Compensation Medical Costs through June 30, 2015,” Oakland, California, December 10, 2015.

WCIRB California Research and Analysis
6 | Patterns of Drug Dispensing in California Workers’ Compensation
Payment Trends for Major Drug Types The overall reduction in drug costs per claim has been driven by different prescribing patterns over the 42-month study period. Chart 2 displays payment shares for all major types of drugs dispensed by both physicians and pharmacies. Opiate analgesics, stomach discomfort drugs and dermatological applications have declined in total payment shares while non-opiate analgesics and behavioral health medications have increased. The decline in opiate analgesics is consistent with a multi-year trend shown in a May 2016 CWCI study.19 Chart 2 shows that the decline in opiate analgesics accelerated in the second half of 2014. Starting in this period, the total share of spending for opiate analgesics dropped by 3% while the combined shares of non-opiate analgesics and behavioral health drugs increased by a corresponding amount. Since some of these drugs are non-addictive alternatives for pain treatment, this trend may reflect substitutions for opiate analgesics. Chart 2: Payment Shares for Major Drug Types Second Half 2012 through Second Half 2015
19 Swedlow, A., & Hayes, S., “Trends in The Use of Opioids in California’s Workers’ Compensation System,” California Workers' Compensation Institute, Oakland, California, May 2016.
0%
5%
10%
15%
20%
25%
2012H2 2013H1 2013H2 2014H1 2014H2 2015H1 2015H2
% o
f Dru
g P
aym
ents
Service/Transaction Half
Opiate Analgesics Non-Opiate Analgesics
Dermatological Applications Stomach Discomfort Drugs
Behavioral Health Drugs Musculotherapy Drugs
Base Substances for Compounding

WCIRB California Research and Analysis
7 | Patterns of Drug Dispensing in California Workers’ Compensation
Patterns of Drug Payments to Physicians and Pharmacies Chart 3 shows the overall share of payments for all drugs, comparing pharmacies and physicians. During the second half of 2012, payment shares for both sites were roughly equivalent. By the second half of 2015, the drug payment share for pharmacies rose to 67% while the share for physicians dropped to 33%. Since the average unit paid per transaction has remained stable at both sites, the difference primarily reflects a reduction in the volume of drug payments to physicians, an interpretation consistent with the utilization declines shown above in Chart 1. Chart 3: Patterns of Drug Payments to Physicians and Pharmacies – All Drugs Second Half 2012 through Second Half 2015
$0
$20
$40
$60
$80
$100
$120
$140
0%
10%
20%
30%
40%
50%
60%
70%
2012H2 2013H1 2013H2 2014H1 2014H2 2015H1 2015H2
Pai
d P
er T
rans
actio
n
% o
f Dru
g P
aym
ents
Service/Transaction Half
Physician Share of Paid Pharmacy Share of Paid
Physician Paid Per Transaction Pharmacy Paid Per Transaction

WCIRB California Research and Analysis
8 | Patterns of Drug Dispensing in California Workers’ Compensation
Differences in Payment Patterns for Major Drug Groups Payment shares to physicians declined for all major drug groups during the study period, as shown in Charts 4 through 10. For opiate analgesics, Chart 4 shows that payment shares to physicians dropped from 46% to 21% during the 42-month period while pharmacies showed a corresponding increase. This change in the pattern of recipients for drug payments contributed to the overall decline in the total share of pharmaceutical costs arising from opiate analgesics. Paid amounts per transaction for both physician and pharmacy dispensed opiate analgesics remained generally consistent during the 42-month study period. Chart 4: Opiate Analgesic Payment Trends Second Half 2012 through Second Half 2015
$0
$20
$40
$60
$80
$100
$120
0%
10%
20%
30%
40%
50%
60%
70%
80%
90%
2012H2 2013H1 2013H2 2014H1 2014H2 2015H1 2015H2
Pai
d P
er T
rans
actio
n
% o
f Dru
g P
aym
ents
Service/Transaction Half
Physician Share of Opiate Analgesic Payments Pharmacy Share of Opiate Analgesic Payments
Physician Paid Per Transaction Pharmacy Paid Per Transaction

WCIRB California Research and Analysis
9 | Patterns of Drug Dispensing in California Workers’ Compensation
As shown in Chart 5, payments to physicians for non-opiate analgesics such as anti-inflammatories, declined from a 52% share in 2012 to a 43% share in 2015, although this rate has increased somewhat since 2014. Paid amounts per transaction to both physicians and pharmacies have remained stable, although pharmacies consistently received, on average, 25% higher levels of reimbursement for these medications. Chart 5: Non-Opiate Analgesic Payment Trends Second Half 2012 through Second Half 2015
$0
$20
$40
$60
$80
$100
$120
0%
10%
20%
30%
40%
50%
60%
70%
2012H2 2013H1 2013H2 2014H1 2014H2 2015H1 2015H2
Pai
d P
er T
rans
actio
n
% o
f Dru
g P
aym
ents
Service/Transaction Half
Physician Share of Non-Opiate Analgesic Payments Pharmacy Share of Non-Opiate Analgesic Payments
Physician Paid Per Transaction Pharmacy Paid Per Transaction

WCIRB California Research and Analysis
10 | Patterns of Drug Dispensing in California Workers’ Compensation
Chart 6 displays dispensing trends for dermatological applications such as pain patches and some creams. This data shows that shares of payments to physicians dropped from 62% to 43% and correspondingly increased in pharmacies. For both physicians and pharmacies, paid amounts per transaction in 2015 were similar to 2012 levels, after spikes upward in the first half of 2013. Chart 6: Dermatological Applications, Payment Trends Second Half 2012 through Second Half 2015
$0
$50
$100
$150
$200
$250
0%
10%
20%
30%
40%
50%
60%
70%
2012H2 2013H1 2013H2 2014H1 2014H2 2015H1 2015H2
Pai
d P
er T
rans
actio
n
% o
f Dru
g P
aym
ents
Service/Transaction Half
Physician Share of Dermatological Applications Payments Pharmacy Share of Dermatological Applications Payments
Physicians Paid Per Transaction Pharmacies Paid Per Transaction

WCIRB California Research and Analysis
11 | Patterns of Drug Dispensing in California Workers’ Compensation
Stomach discomfort drugs are often prescribed to counter the effects of opiate analgesics. Chart 7 shows how the reduction in physician payments for these medications paralleled the decline in opiate analgesics by dropping from a 72% share in 2012 to a 58% share in 2015. Physicians received higher payments per transaction for stomach discomfort drugs, consistently receiving approximately 30% more per transaction than pharmacies during the entire study period. Chart 7: Stomach Discomfort Drug Payment Trends Second Half 2012 through Second Half 2015
$0
$50
$100
$150
$200
$250
0%
10%
20%
30%
40%
50%
60%
70%
80%
2012H2 2013H1 2013H2 2014H1 2014H2 2015H1 2015H2
Pai
d P
er T
rans
actio
n
% o
f Dru
g P
aym
ents
Service/Transaction Half
Physician Share of Stomach Discomfort Drug Payments Pharmacy Share of Stomach Discomfort Drug Payments
Physician Paid Per Transaction Pharmacy Paid Per Transaction

WCIRB California Research and Analysis
12 | Patterns of Drug Dispensing in California Workers’ Compensation
Behavioral Health drugs include a variety of pharmaceuticals, including antidepressants, anti-anxiety drugs, anticonvulsants, sedative hypnotics, stimulants and psychoactive medications. Some of these drugs are prescribed to treat pain symptoms. Chart 8 shows that physicians have consistently received a minority of payments for these drugs, and further declined from 30% to 20% during the study period. However, on a paid per transaction basis since 2014, physicians are approaching the level of pharmacies at a rate of $110 per paid transaction. Chart 8: Behavioral Health Drug Payment Trends Second Half 2012 through Second Half 2015
$0
$20
$40
$60
$80
$100
$120
$140
0%
10%
20%
30%
40%
50%
60%
70%
80%
90%
2012H2 2013H1 2013H2 2014H1 2014H2 2015H1 2015H2P
aid
Per
Tra
nsac
tion
% o
f Dru
g P
aym
ents
Service/Transaction Half
Physician Share of Behavioral Health Drug Payments Pharmacy Share of Behavioral Health Drug Payments
Physicians Paid Per Transaction Pharmacy Paid Per Transcation

WCIRB California Research and Analysis
13 | Patterns of Drug Dispensing in California Workers’ Compensation
Chart 9 displays dispensing trends for skeletal muscle relaxants. These data show a drop in physician payment share from 67% to 50% from 2012 through 2015. On a cost per transaction basis, physicians and pharmacies were roughly comparable by the end of 2015, although physicians recorded a spike upward in the first half of 2014. Chart 9: Skeletal Muscle Relaxants Payment Trends Second Half 2012 through Second Half 2015
$0
$10
$20
$30
$40
$50
$60
$70
$80
$90
$100
0%
10%
20%
30%
40%
50%
60%
70%
80%
2012H2 2013H1 2013H2 2014H1 2014H2 2015H1 2015H2
Pai
d P
er T
rans
actio
n
% o
f Dru
g P
aym
ents
Service/Transaction Half
Physician Share of Skeletal Muscle Relaxant Payments Pharmacy Share of Skeletal Muscle Relaxant Payments
Physician Paid Per Transaction Pharmacy Paid Per Transaction

WCIRB California Research and Analysis
14 | Patterns of Drug Dispensing in California Workers’ Compensation
Chart 10 displays payment trends for compounding base ingredients. These ingredients include bulk chemicals and other substances used as bases for mixing other drugs and represent approximately half of the total cost of compounded drugs.20 The share of compound base ingredient payments made directly to physicians has consistently averaged approximately 20% during this period. Payments per transaction to pharmacies for base compound ingredients rose 67% from $225 to $375. By contrast, payments per transaction to physicians for these base ingredients have generally averaged less than $150. Chart 10: Compound Base Ingredient Payment Trends Second Half 2012 through Second Half 2015
Compound Bill Payment Patterns The paid transactions for base compounding ingredients described in Chart 10 account for approximately one-half of all payments for compound bills. In order to gain a more complete picture of compounding, the WCIRB studied compounding on a per bill basis. The WCIRB identified approximately 177,000 bills receiving payments for base compounding ingredients, such as bulk chemicals, pharmaceutical adjuvants and some creams. Any additional formulations of more standard drugs on these bills were included as portions of the paid compound bills.21
20 This compound billing pattern is described in Walls, A.P., et.al., “Compounding is Confounding Workers’ Compensation,” CompPharma, Tampa, Florida, 2014. 21 This compound billing pattern is described in Walls, A.P., et.al., “Compounding is Confounding Workers’ Compensation,” CompPharma, Tampa, Florida, 2014.
$0
$50
$100
$150
$200
$250
$300
$350
$400
$450
0%
10%
20%
30%
40%
50%
60%
70%
80%
90%
100%
2012H2 2013H1 2013H2 2014H1 2014H2 2015H1 2015H2P
aid
Per
Tra
nsac
tion
% o
f Dru
g P
aym
ents
Service/Transaction Half
Physician Share of Compound Base Payments Pharmacy Share of Compound Base PaymentsPhysician Paid per Transcation Pharmacy Paid Per Transaction

WCIRB California Research and Analysis
15 | Patterns of Drug Dispensing in California Workers’ Compensation
Powders were the most frequently appearing drug formulation mixed into compound base substance. Based on dosage strength, powdered versions of some standard drugs are generally more expensive than tablet or capsule forms of the same drug. As a result, the combined incremental charges and resulting payments for compounds can escalate to levels three to four times higher than non-compound prescriptions.22 Compounds are manufactured by specialty pharmacies and pharmaceutical wholesalers who distribute these substances to pharmacies and providers. Chart 11 depicts the payment shares of the various combinations of drug ingredients found in compound bills in the WCIRB database. These bills contain inactive bases for compounds (6% share) and active bulk chemical ingredients (28% share) as well as creams and lotions (25% share). The remaining 41% of the share of payments are for various forms of more standard drugs, nearly half of which are powdered forms of non-opiate analgesics. We analyzed whether compounders have gradually developed more commodity products by including fewer and more standardized ingredients in their products over the period between 2012 and 2015. Using a common statistical index of product concentration23, the WCIRB did not find greater concentration of ingredients over the study period. It is possible that this commodity packaging process may have begun in years before 2012 when our baseline data was collected.
22 Helios, “Physician Dispensing and Compounded Medications – a Legislative and Regulatory Update,” Memphis, Tennessee, October 22, 2014. 23 Berger, E., “Survival of the Fittest: An Assessment of the Herfindahl Index and Product Market Competition,” Ithica, New York, March 15, 2014.
Behavioral Health Drugs, 2.4%
Bulk Chemicals, 27.8%
Pharmaceutical Adjuvants, 6.4%
Creams and Lotions, 24.6%
Nonopiate Analgesics, 21.9%
Opiate Analgesics, 0.2%
Other Drugs, 1.5%
Skeletal Muscle Relaxants, 15.0%
Stomach Discomfort Drugs, 0.01%
Chart 11: Paid Shares for Ingredients used in Compound Substances
WCIRB California Research and Analysis
16 | Patterns of Drug Dispensing in California Workers’ Compensation
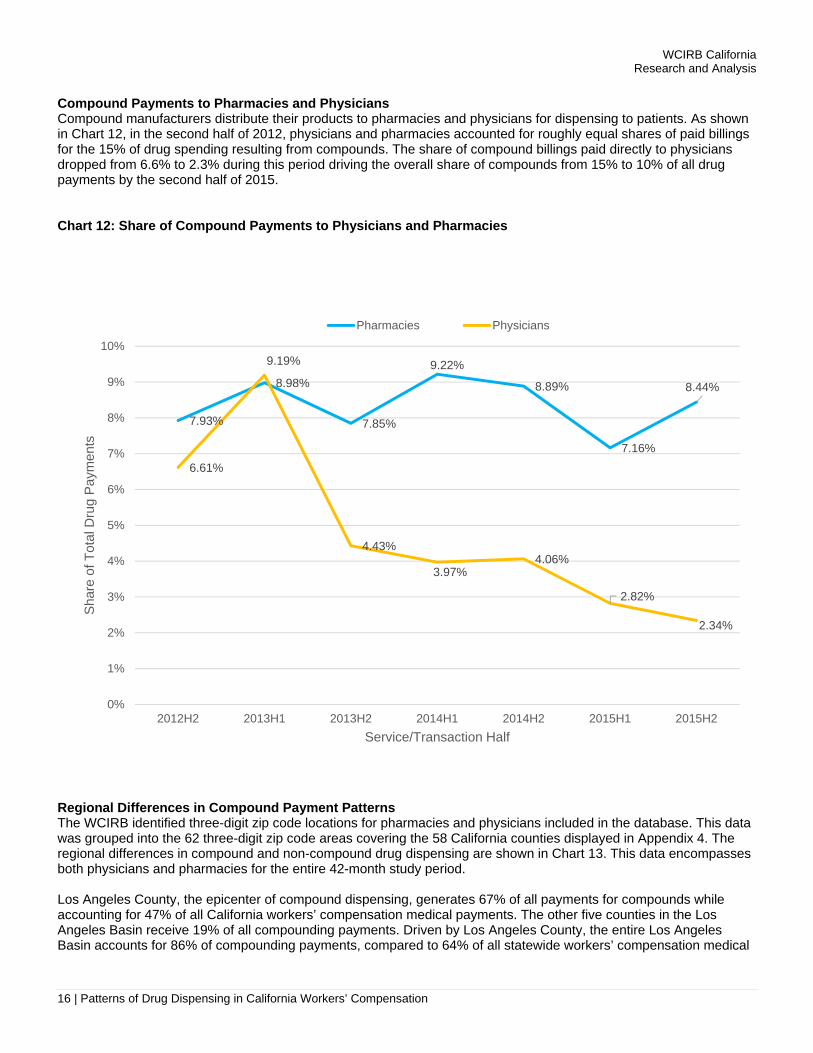
Compound Payments to Pharmacies and Physicians Compound manufacturers distribute their products to pharmacies and physicians for dispensing to patients. As shown in Chart 12, in the second half of 2012, physicians and pharmacies accounted for roughly equal shares of paid billings for the 15% of drug spending resulting from compounds. The share of compound billings paid directly to physicians dropped from 6.6% to 2.3% during this period driving the overall share of compounds from 15% to 10% of all drug payments by the second half of 2015. Chart 12: Share of Compound Payments to Physicians and Pharmacies
Regional Differences in Compound Payment Patterns The WCIRB identified three-digit zip code locations for pharmacies and physicians included in the database. This data was grouped into the 62 three-digit zip code areas covering the 58 California counties displayed in Appendix 4. The regional differences in compound and non-compound drug dispensing are shown in Chart 13. This data encompasses both physicians and pharmacies for the entire 42-month study period. Los Angeles County, the epicenter of compound dispensing, generates 67% of all payments for compounds while accounting for 47% of all California workers’ compensation medical payments. The other five counties in the Los Angeles Basin receive 19% of all compounding payments. Driven by Los Angeles County, the entire Los Angeles Basin accounts for 86% of compounding payments, compared to 64% of all statewide workers’ compensation medical
7.93%
8.98%
7.85%
9.22%
8.89%
7.16%
8.44%
6.61%
9.19%
4.43%
3.97%4.06%
2.82%
2.34%
0%
1%
2%
3%
4%
5%
6%
7%
8%
9%
10%
2012H2 2013H1 2013H2 2014H1 2014H2 2015H1 2015H2
Sha
re o
f Tot
al D
rug
Pay
men
ts
Service/Transaction Half
Pharmacies Physicians

WCIRB California Research and Analysis
17 | Patterns of Drug Dispensing in California Workers’ Compensation
payments during the 42-month study period.24 For non-compounded drugs, Chart 13 shows that regional drug payment patterns generally reflected regional differences in overall medical payments. Payments for compound drugs, whether to pharmacies or physicians, is a phenomenon primarily driven by the six county Los Angeles Basin. Chart 13: Regional Drug Payment Patterns
24 WCIRB medical transaction data through second half of 2015.
67.2%
19.3%
1.7%
7.1%3.7%
1.0%
44.2%
16.4%
5.8%
14.2%11.8%
7.5%
46.6%
17.3%
5.4%
11.5%12.3%
6.9%
0%
10%
20%
30%
40%
50%
60%
70%
80%
Los AngelesCounty
Remainder of LosAngeles Basin
San Diego County Central California Bay Area Remainder ofCalifornia
Per
cent
age
of C
alifo
rnia
Pay
men
ts
Region
Compound Drug Payments Non-Compound Drug Payments All Medical Payments

WCIRB California Research and Analysis
18 | Patterns of Drug Dispensing in California Workers’ Compensation
When these substances are analyzed according to entities receiving payments, physicians and pharmacies show some regional differences. As depicted in Chart 14, the average payment of $294 per bill to physicians in the six county Los Angeles Basin is approximately 2% higher than the physician payment level for compounds in the other 52 California counties. For pharmacies, differences are greater. Pharmacies in the Los Angeles Basin received $1,020 per bill as compared to approximately $260 in the remainder of the state. Chart 14: Average Compound Payment per Bill by Region
Comparisons of Generic to Brand Drugs For all health care payers in the U.S., generic drugs constituted 90% of all pharmaceutical payments in 2015.25 By contrast, workers’ compensation generic payments range between 60% to 70% of drug spending.26 Do payment patterns for generic and brand drugs differ between physicians and pharmacies in California workers’ compensation? The WCIRB classified National Drug Codes (NDCs) into generics and brand drugs (including brands with generic equivalents). For frequently prescribed drugs which have become generic in the past two years (such as Celebrex and Cymbalta), we used the generic classification. Compounded substances, which are composed of hybrids of several drugs, were excluded from this section of the study.
25 Statista, “Proportion of Branded versus Generics Drugs Prescribed in the United States from 2005 to 2015,” New York, New York, 2016. 26 Helios, “Workers’ Compensation Drug Trends Report,” Memphis, Tennessee, 2015.
$1,004
$1,084
$216
$372
$104
$253
$862
$276
$372
$247$317
$292
$229
$293
$0
$200
$400
$600
$800
$1,000
$1,200
Los AngelesCounty
Remainder ofLos Angeles
Basin
San DiegoCounty
CentralCalifornia
Bay Area Remainder ofCalifornia
Statewide
Ave
rage
Pay
men
t
Region
Pharmacy Bills Physician Bills

WCIRB California Research and Analysis
19 | Patterns of Drug Dispensing in California Workers’ Compensation
A recent WCIRB study showed that on an aggregate basis, the share of all drug payments for generics increased by 6% from 2013 to 2015 while the share spent on brand drugs correspondingly declined although brand drugs were paid an average rate five times higher than generics.27 As shown in Chart 15, the share of generic payments to physicians declined from approximately 60% to 40%, while payments per transaction have remained stable at approximately $70. For pharmacies, payments per generic transaction have increased by approximately 20%, and the paid amount per transaction is approaching the level paid to physicians. Chart 15: Patterns of Payments for Generic Drugs Second Half 2012 through Second Half 2015
27 Workers’ Compensation Insurance Rating Bureau of California, “California Workers’ Compensation Aggregate Medical Payment Trends – Updated through Calendar Year 2015,” Oakland, California, August 1, 2016.
$0
$10
$20
$30
$40
$50
$60
$70
$80
30%
35%
40%
45%
50%
55%
60%
65%
2012H2 2013H1 2013H2 2014H1 2014H2 2015H1 2015H2
Pai
d P
er T
rans
actio
n
% o
f Gen
eric
Dru
g P
aym
ents
Service/Transaction Half
Pharmacy Share of Generic Drug Payments Physician Share of Generic Drug PaymentsPharmacy Paid per Transaction Physician Paid per Transaction

WCIRB California Research and Analysis
20 | Patterns of Drug Dispensing in California Workers’ Compensation
As shown in Chart 16, the paid share of brand drugs to physicians declined from 40% to 25%, while the approximate average payment per brand drug transaction of $200 in the second half of 2015 is approximately the same level as it was in the second half of 2012. For pharmacies, payments per brand drug transaction increased by approximately 33% to an average of almost $400. Chart 16: Patterns of Payments for Brand Drugs Second Half 2012 through Second Half 2015
In summary, payment shares to physicians dropped for both generic and brand drugs. By contrast, the per transaction cost increased by 25% for generic and brand drugs paid to pharmacies, while per-transaction payments to physicians remained stable at 2012 levels. These disparities may occur because pharmacies have first access to the newest, most expensive drugs from wholesalers.28 As pharmacies have merged and become larger entities, the overall drug supply chain has become more concentrated in recent years.29 Comparisons for Therapeutically Equivalent Drugs Pharmacies and physicians exhibit divergent payment patterns as shown above in Charts 4 through 10. These charts summarize broad Major Workers’ Compensation Drug Groups. Since each of these Major Drug Groups contains thousands of individual pharmaceuticals, the WCIRB reviewed payment differences at a more granular level.
28 Neuhauser, F., Swedlow, A., & Wynn, B., “Impact of Physician-Dispensing of Repackaged Drugs on California Workers’ Compensation, Employers Cost, and Workers’ Access to Quality Care,” Commission on Health and Safety and Workers’ Compensation, Oakland, California, July 2006. 29 Fein, A., “Five Industry Trends for U.S. Drug Wholesalers,” Drug Channels, December 8, 2015.
$0
$50
$100
$150
$200
$250
$300
$350
$400
$450
20%
30%
40%
50%
60%
70%
80%
2012H2 2013H1 2013H2 2014H1 2014H2 2015H1 2015H2
Pai
d P
er T
rans
actio
n
% o
f Bra
nd D
rug
Pay
men
ts
Service/Transaction Half
Pharmacy Share of Brand Drug Payments Physician Share of Brand Drug Payments
Pharmacy Paid per Transaction Physician Paid per transaction

WCIRB California Research and Analysis
21 | Patterns of Drug Dispensing in California Workers’ Compensation
General Therapeutic Equivalents This analysis involves comparing the major drug groups by general therapeutic equivalents. To do so, the WCIRB analyzed its data to identify the 15 Generic Product Identifiers (GPIs) with the greatest share of payments during the study period.30 These 15 GPIs accounted for 41% of all drug payments in the WCIRB’s drug payment database. Chart 17 displays comparisons between physicians and pharmacies for five major opiate analgesic GPIs. These controlled substances include Oxycontin, Tramadol, Oxycodone Acetaminophen (Percocet), Fentanyl and Hydrocodone combinations such as Vicodin. As shown in Chart 17, physicians received greater payments per transaction than pharmacies for all five categories of Opiate Analgesics. For Tramadol, payments per transaction are 300% higher for physicians than pharmacies, a difference driven by physician selection of the most expensive version of this drug, as shown in Charts 21A and 21B, presented later in this report. Chart 17: Paid Per Transaction, Opiates
30 Based on the WCIRB’s Medispan® code load, April 2016.
$0
$100
$200
$300
$400
$500
$600
Vicodin Tramadol Oxycontin Fentanyl Percocet
Pai
d P
er T
rans
actio
n
Pharmacies Physicians
WCIRB California Research and Analysis
22 | Patterns of Drug Dispensing in California Workers’ Compensation
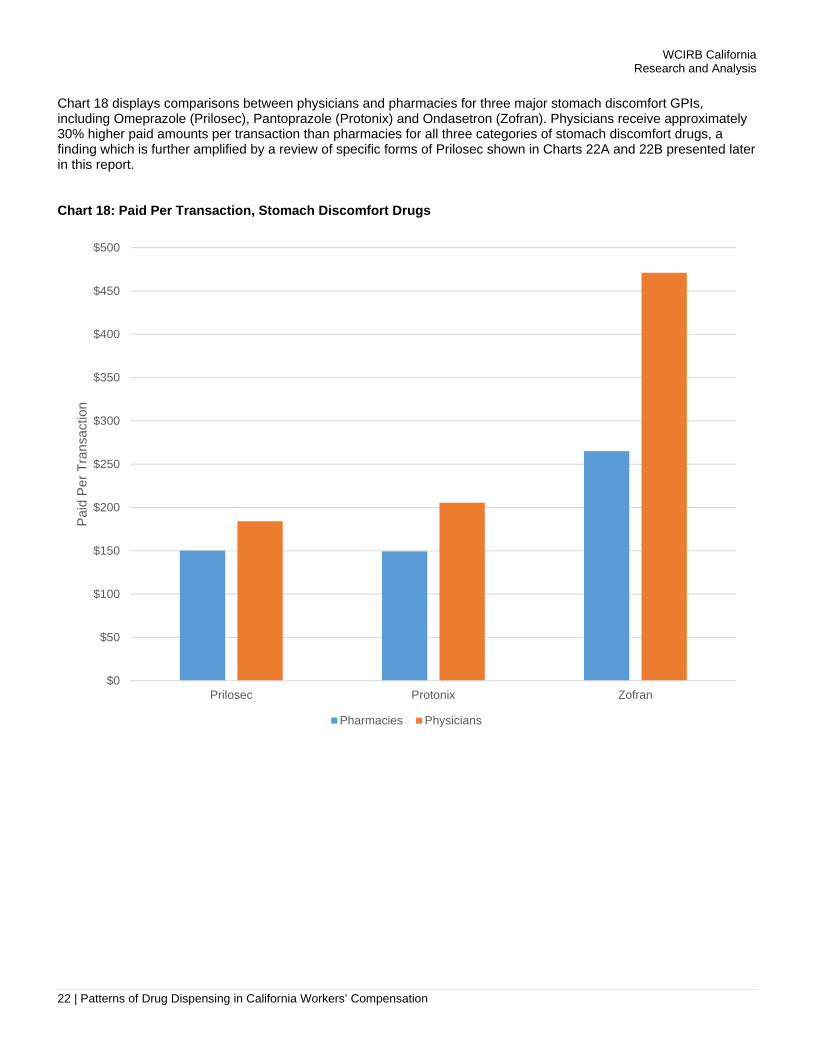
Chart 18 displays comparisons between physicians and pharmacies for three major stomach discomfort GPIs, including Omeprazole (Prilosec), Pantoprazole (Protonix) and Ondasetron (Zofran). Physicians receive approximately 30% higher paid amounts per transaction than pharmacies for all three categories of stomach discomfort drugs, a finding which is further amplified by a review of specific forms of Prilosec shown in Charts 22A and 22B presented later in this report. Chart 18: Paid Per Transaction, Stomach Discomfort Drugs
$0
$50
$100
$150
$200
$250
$300
$350
$400
$450
$500
Prilosec Protonix Zofran
Pai
d P
er T
rans
actio
n
Pharmacies Physicians
WCIRB California Research and Analysis
23 | Patterns of Drug Dispensing in California Workers’ Compensation
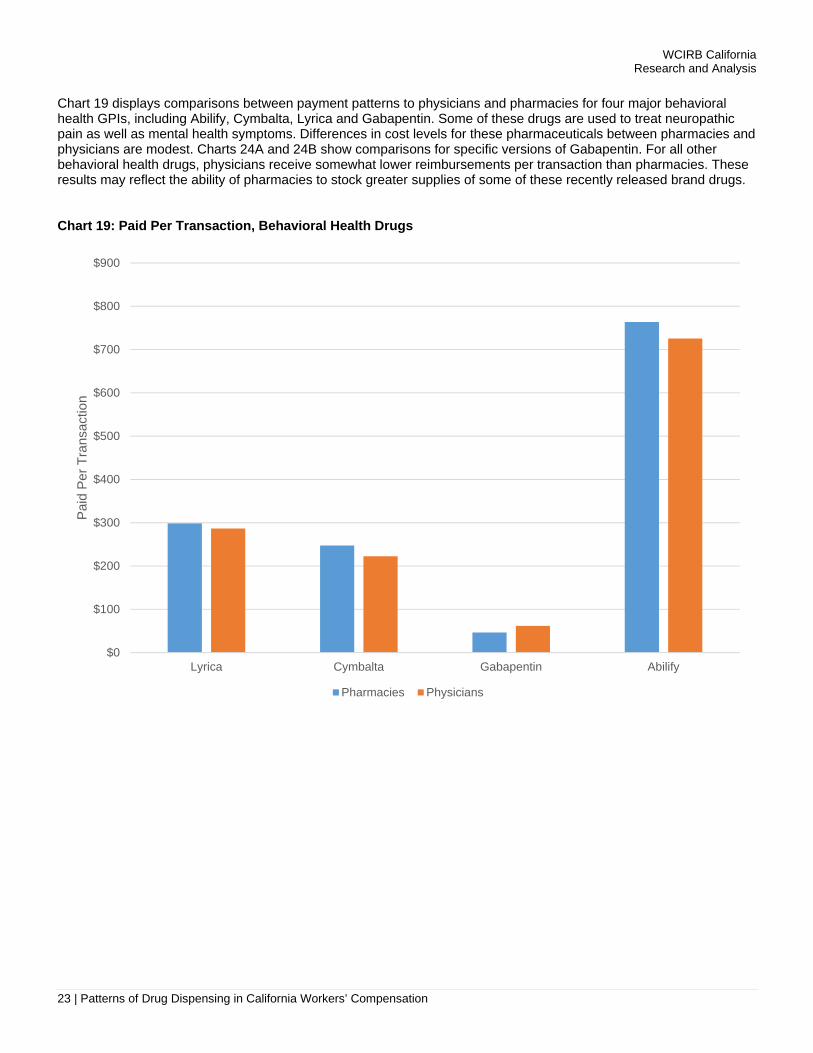
Chart 19 displays comparisons between payment patterns to physicians and pharmacies for four major behavioral health GPIs, including Abilify, Cymbalta, Lyrica and Gabapentin. Some of these drugs are used to treat neuropathic pain as well as mental health symptoms. Differences in cost levels for these pharmaceuticals between pharmacies and physicians are modest. Charts 24A and 24B show comparisons for specific versions of Gabapentin. For all other behavioral health drugs, physicians receive somewhat lower reimbursements per transaction than pharmacies. These results may reflect the ability of pharmacies to stock greater supplies of some of these recently released brand drugs. Chart 19: Paid Per Transaction, Behavioral Health Drugs
$0
$100
$200
$300
$400
$500
$600
$700
$800
$900
Lyrica Cymbalta Gabapentin Abilify
Pai
d P
er T
rans
actio
n
Pharmacies Physicians
WCIRB California Research and Analysis
24 | Patterns of Drug Dispensing in California Workers’ Compensation
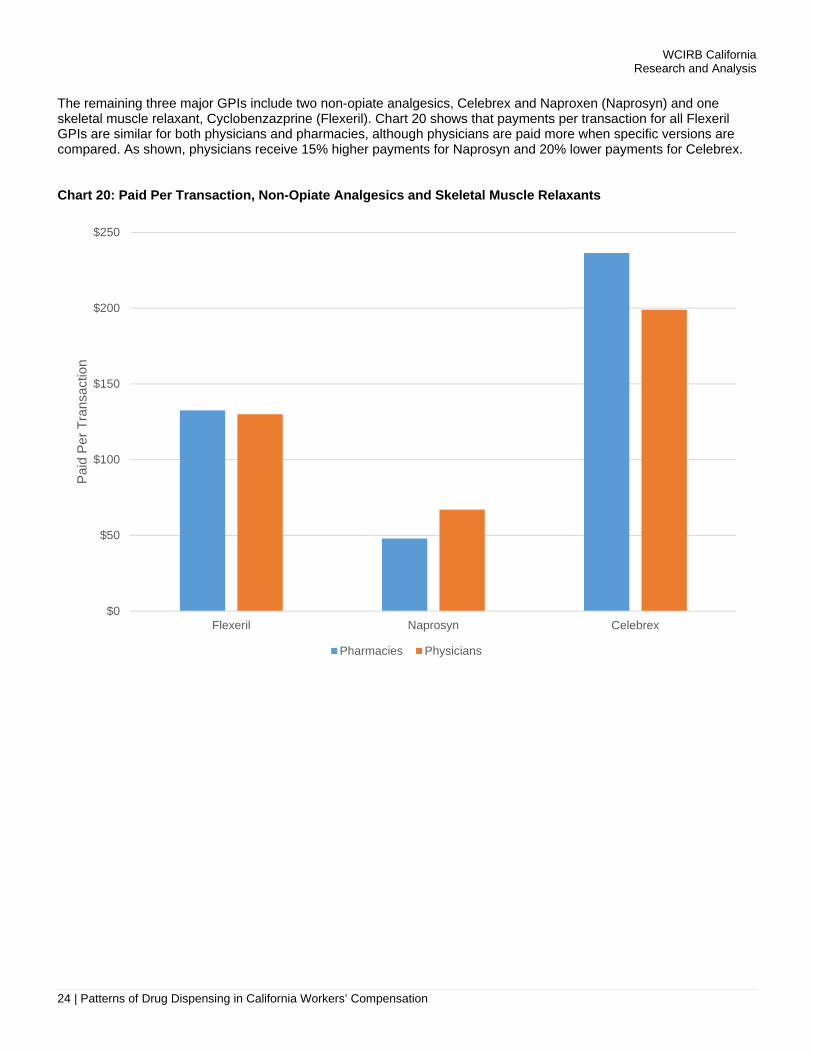
The remaining three major GPIs include two non-opiate analgesics, Celebrex and Naproxen (Naprosyn) and one skeletal muscle relaxant, Cyclobenzazprine (Flexeril). Chart 20 shows that payments per transaction for all Flexeril GPIs are similar for both physicians and pharmacies, although physicians are paid more when specific versions are compared. As shown, physicians receive 15% higher payments for Naprosyn and 20% lower payments for Celebrex. Chart 20: Paid Per Transaction, Non-Opiate Analgesics and Skeletal Muscle Relaxants
$0
$50
$100
$150
$200
$250
Flexeril Naprosyn Celebrex
Pai
d P
er T
rans
actio
n
Pharmacies Physicians
WCIRB California Research and Analysis
25 | Patterns of Drug Dispensing in California Workers’ Compensation
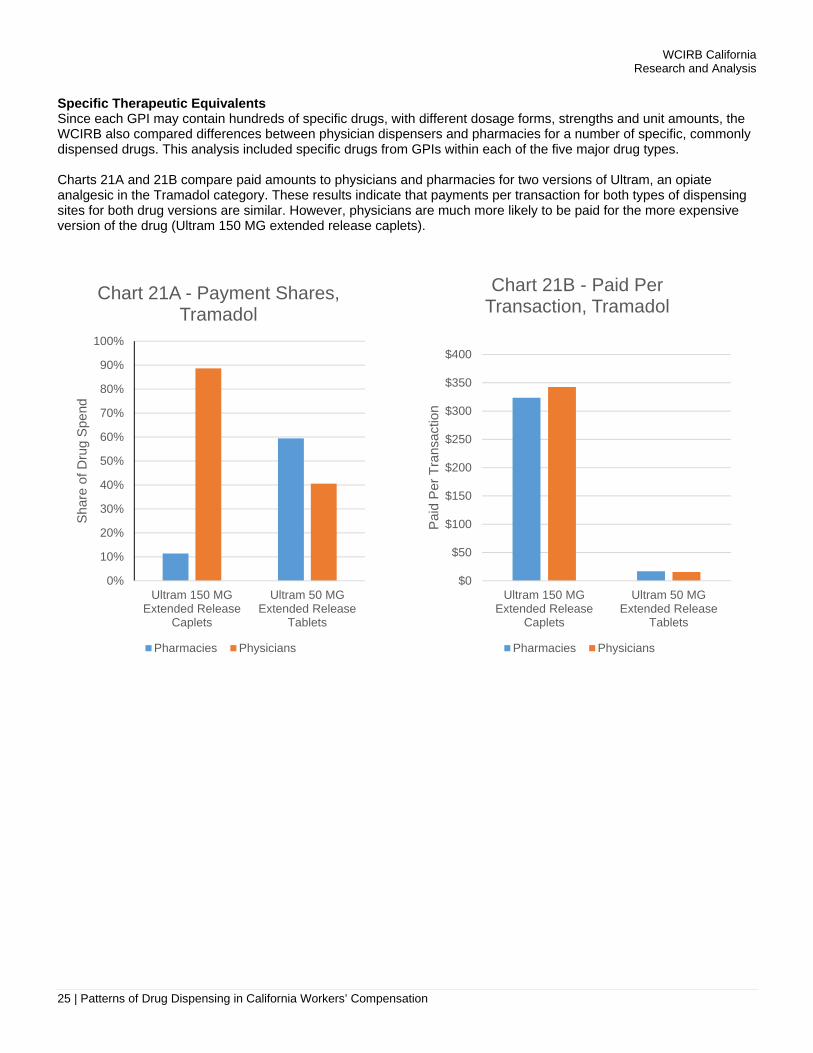
Specific Therapeutic Equivalents Since each GPI may contain hundreds of specific drugs, with different dosage forms, strengths and unit amounts, the WCIRB also compared differences between physician dispensers and pharmacies for a number of specific, commonly dispensed drugs. This analysis included specific drugs from GPIs within each of the five major drug types. Charts 21A and 21B compare paid amounts to physicians and pharmacies for two versions of Ultram, an opiate analgesic in the Tramadol category. These results indicate that payments per transaction for both types of dispensing sites for both drug versions are similar. However, physicians are much more likely to be paid for the more expensive version of the drug (Ultram 150 MG extended release caplets).
0%
10%
20%
30%
40%
50%
60%
70%
80%
90%
100%
Ultram 150 MGExtended Release
Caplets
Ultram 50 MGExtended Release
Tablets
Sha
re o
f Dru
g S
pend
Chart 21A - Payment Shares, Tramadol
Pharmacies Physicians
$0
$50
$100
$150
$200
$250
$300
$350
$400
Ultram 150 MGExtended Release
Caplets
Ultram 50 MGExtended Release
Tablets
Pai
d P
er T
rans
actio
n
Chart 21B - Paid Per Transaction, Tramadol
Pharmacies Physicians

WCIRB California Research and Analysis
26 | Patterns of Drug Dispensing in California Workers’ Compensation
Charts 22A and 22B compare payments to physicians and pharmacies for two versions of Prilosec, a type of stomach discomfort drug within the Omeprazole category. These results show that physicians are more likely to be paid for the more expensive version of the drug (20 MG delayed release capsules) and less likely to dispense the lower priced version (40 MG delayed release capsules).
0%
10%
20%
30%
40%
50%
60%
70%
80%
90%
Omeprazole 20 MGCapsule Delayed
Release
Omeprazole 40 MGCapsule Delayed
Release
Sha
re o
f Dru
g S
pend
Chart 22A - Payment Shares, Prilosec
Pharmacies Physicians
$0
$20
$40
$60
$80
$100
$120
$140
$160
$180
$200
Omeprazole 20 MGCapsule Delayed
Release
Omeprazole 40 MGCapsule Delayed
Release
Pai
d P
er T
rans
actio
n
Chart 22B - Paid Per Transaction, Prilosec
Pharmacies Physicians

WCIRB California Research and Analysis
27 | Patterns of Drug Dispensing in California Workers’ Compensation
Charts 23A and 23B compare physician and pharmacy patterns for two versions of Flexeril, a type of skeletal muscle relaxant within the Cyclobenzaprine category. These results indicate that physicians are more likely to be paid for the more expensive version of the drug (7.5 MG tablets).
0%
10%
20%
30%
40%
50%
60%
70%
80%
90%
Flexeril 10 MGTablets
Flexeril 7.5 MGTablets
Sha
re o
f Dru
g S
pend
Chart 23A - Payment Shares, Flexeril
Pharmacies Physicians
$0
$50
$100
$150
$200
$250
Flexeril 10 MGTablets
Flexeril 7.5 MGTablets
Pai
d P
er T
rans
actio
n
Chart 23B - Paid Per Transaction, Flexeril
Pharmacies Physicians

WCIRB California Research and Analysis
28 | Patterns of Drug Dispensing in California Workers’ Compensation
Charts 24A and 24B compare payments to physicians and pharmacies for two versions of Gabapentin, a drug classified as an anticonvulsant often used to treat neuropathic pain, and commonly prescribed as Neurontin. These results indicate that physicians are more likely to dispense the more expensive version of the drug (600 MG tablets) rather than the less expensive 300 MG caplets.
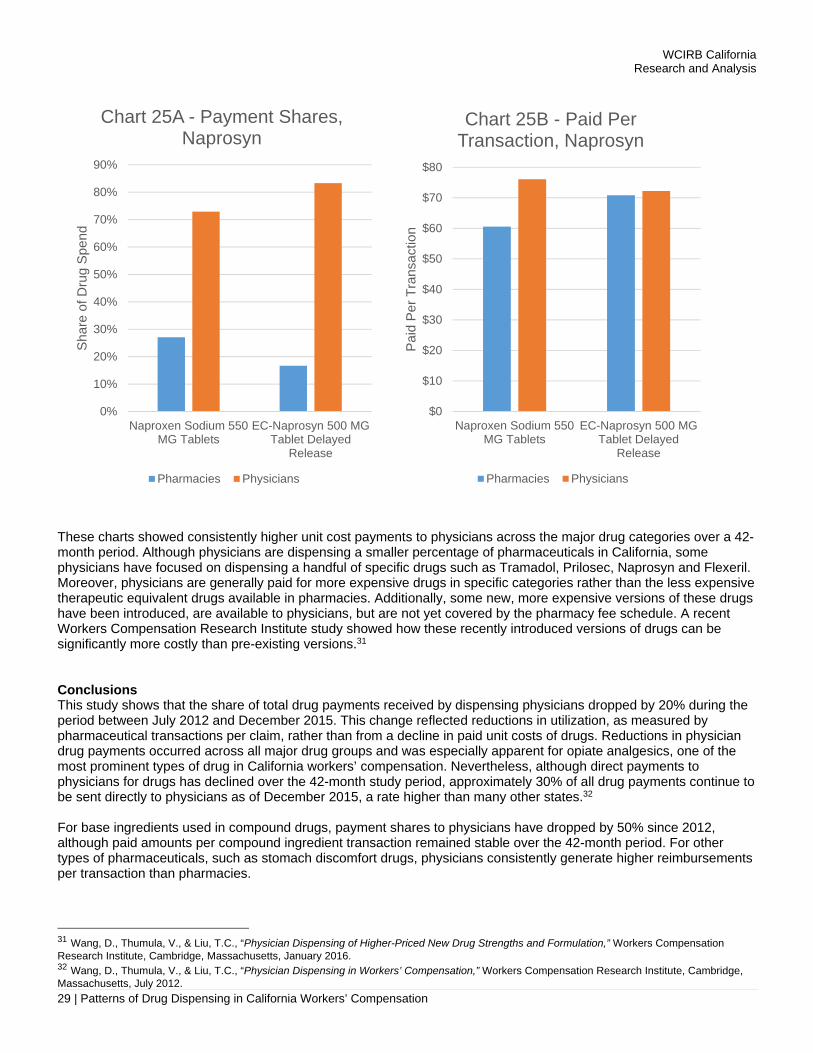
Charts 25A and 25B compare payments to physicians and pharmacies for Naprosyn, a specific version of a non-opiate analgesic, Naproxen. These results show that physicians receive 25% higher payments for the 550 MG tablet version of this drug for which physicians dispense more frequently.
0%
10%
20%
30%
40%
50%
60%
70%
Gabapentin 600 MGTablets
Gabapentin 300 MGCaplets
Sha
re o
f Dru
g S
pend
Chart 24A - Payment Shares, Gabapentin
Pharmacies Physicians
$0
$10
$20
$30
$40
$50
$60
$70
$80
$90
$100
Gabapentin 600 MGTablets
Gabapentin 300 MGCaplets
Pai
d P
er T
rans
actio
n
Chart 24B - Paid Per Transaction, Gabapentin
Pharmacies Physicians
WCIRB California Research and Analysis
29 | Patterns of Drug Dispensing in California Workers’ Compensation
These charts showed consistently higher unit cost payments to physicians across the major drug categories over a 42-month period. Although physicians are dispensing a smaller percentage of pharmaceuticals in California, some physicians have focused on dispensing a handful of specific drugs such as Tramadol, Prilosec, Naprosyn and Flexeril. Moreover, physicians are generally paid for more expensive drugs in specific categories rather than the less expensive therapeutic equivalent drugs available in pharmacies. Additionally, some new, more expensive versions of these drugs have been introduced, are available to physicians, but are not yet covered by the pharmacy fee schedule. A recent Workers Compensation Research Institute study showed how these recently introduced versions of drugs can be significantly more costly than pre-existing versions.31 Conclusions This study shows that the share of total drug payments received by dispensing physicians dropped by 20% during the period between July 2012 and December 2015. This change reflected reductions in utilization, as measured by pharmaceutical transactions per claim, rather than from a decline in paid unit costs of drugs. Reductions in physician drug payments occurred across all major drug groups and was especially apparent for opiate analgesics, one of the most prominent types of drug in California workers’ compensation. Nevertheless, although direct payments to physicians for drugs has declined over the 42-month study period, approximately 30% of all drug payments continue to be sent directly to physicians as of December 2015, a rate higher than many other states.32 For base ingredients used in compound drugs, payment shares to physicians have dropped by 50% since 2012, although paid amounts per compound ingredient transaction remained stable over the 42-month period. For other types of pharmaceuticals, such as stomach discomfort drugs, physicians consistently generate higher reimbursements per transaction than pharmacies.
31 Wang, D., Thumula, V., & Liu, T.C., “Physician Dispensing of Higher-Priced New Drug Strengths and Formulation,” Workers Compensation Research Institute, Cambridge, Massachusetts, January 2016. 32 Wang, D., Thumula, V., & Liu, T.C., “Physician Dispensing in Workers’ Compensation,” Workers Compensation Research Institute, Cambridge, Massachusetts, July 2012.
0%
10%
20%
30%
40%
50%
60%
70%
80%
90%
Naproxen Sodium 550MG Tablets
EC-Naprosyn 500 MGTablet Delayed
Release
Sha
re o
f Dru
g S
pend
Chart 25A - Payment Shares, Naprosyn
Pharmacies Physicians
$0
$10
$20
$30
$40
$50
$60
$70
$80
Naproxen Sodium 550MG Tablets
EC-Naprosyn 500 MGTablet Delayed
Release
Pai
d P
er T
rans
actio
n
Chart 25B - Paid Per Transaction, Naprosyn
Pharmacies Physicians

WCIRB California Research and Analysis
30 | Patterns of Drug Dispensing in California Workers’ Compensation
When considering therapeutic equivalents of some of the most frequently prescribed drugs, physicians generally receive higher payments per transaction. This difference is magnified by the tendency for physicians to be paid for some of the most expensive drugs in specific drug categories. Several factors have contributed to the decline of drug payments per California workers’ compensation claim since 2012, a change driven by a reduced number or prescriptions per claim rather than lower unit costs. The widespread attention to opiate use in workers’ compensation may have affected prescribing behavior. Overall changes in the wholesale drug supply chain may have affected physicians, including a 2013 Federal law requiring FDA inspections of compound drug wholesalers.33 In addition, some Managed Provider Networks (MPNs) have contractually disallowed physician dispensing. Since July 2013, drug prescribing in California workers’ compensation has been subject to a greater level of scrutiny since the introduction of Independent Medical Review (IMR). The CWCI has shown that approximately half of all 2015 IMR decisions concern prescription drugs and uphold 90% of prior utilization review denials.34 The decline in physician dispensing shown in this study may also be a contributing factor in the overall drop of drug costs per claim since the second half of 2012. It is likely that the various factors described above are interdependent. For example, the heightened peer oversight and visibility brought about by utilization review programs, combined with IMR, may have curbed, in part, the willingness of some physicians to engage in the dispensing of drugs from their offices.
33 U.S. Food and Drug Administration, “FDA implementation of the Compound Quality Act,” Washington, D.C., November 13, 2015. 34 California Workers’ Compensation Institute, “Independent Medical Review Decisions: January through December 2015,” Oakland, California, February 18, 2016.

WCIRB CaliforniaResearch and Analysis
31 | Patterns of Drug Dispensing in California Workers’ Compensation
1
Appendix 1: Summary of Data Included in This Study
Drug Payment Data Sources% of Total Drug
Payments
Included Data:
Insurer and PBM data with detailed Identifying data on pharmacies and physician dispensers
50%
Excluded Data:PBM data without detailed identifying
Information on pharmacies and/or physicians23%*
Other drug dispensers:(Non-California pharmacies and physicians, hospitals, HMOs,
mail order suppliers and miscellaneous providers)
18%
Drug payments without identifying NDC orphysician /pharmacy ID codes
9%
* Based on WCIRB research and discussions with PBM executives, the patterns of WCIRB drug data included in this studyare representative of drug data in the overall California workers’ compensation market.

WCIRB CaliforniaResearch and Analysis3
32 | Patterns of Drug Dispensing in California Workers’ Compensation
Major WCDrug
Categories
1. OPIATEANALGESICS
2. NON‐OPIATE ANALGESICS
3. DERMATOLOGICAL APPLICATIONS
4. STOMACH DISCOMFORT
DRUGS
5. BEHAVIORAL HEALTH DRUGS
6. SKELETALMUSCLE
RELAXANTS
7. COMPOUNDING SUBSTANCES
8. OTHER
% of Total Drug Paid 22% 17% 13% 13% 11% 9% 8% 7%
Therapeutic Groups 65 64, 66, 68 90 49,50 58-62, 72 22, 23, 74, 75 90, 96, 98 Various
Tramadol (Ultram)
Naproxen(Naprosyn)
Lidocaine Patches
Omeprazole(Prilosec)
Pregablin(Lyrica)
Cyclobenzaprine(Flexeril)
Bulk Chemicals-GsDietary
Supplements(Theramine)
Hydrocodone Combination .-2 ingredients
(Vicodin)
Celecoxib(Celebrex) Liniment
CombinationsPantoprazole
(Protonix)
Duloxetine(Cymbalta) Baclofen
Bulk Chemicals- Cs
Oxycontin(Oxycontin)
FlurbiprofenMenthol patches
Ondasteron(Zofran)
Ariprazole(Abilify) Bulk Chemicals= Ts
Opioid Comb.-2 ingredients
(Percocet)Diclofenac
Gabapentin(Neurontin)
Cream Bases
Fentanyl(Fentora)
Eszopicione(Lunesta)
PharmaceuticalAdjuvants
Appendix 2: Most Frequent GPI Drug Categories in This StudyCODE TYPE CODE # DESCRIPTION
MAJOR WCDRUG CATEGORY
1 Opiate Analgesics
THERAPEUTIC GROUP (TG)
65 Analgesic Opiate
THERAPEUTIC CLASS (TC)
6510 Opiate Agonist
GPI -GENERIC DRUG EQUIVALENT
65100095 Tramadol
GPI- SPECIFICDRUG EQUIVALENT
65100095107075 300 MG Tramadol Tablets
NDC CODE 504580650730 ULTRAM 300 MG Tablets
Illustrative Example for Appendix 2
NOTE: This study analyzed the drug code types shown above, as well as data on drug strengths, dosages and formulations. The researchers did not include data on drug quantity (e.g., pills per prescription).
WCIRB CaliforniaResearch and Analysis
33 | Patterns of Drug Dispensing in California Workers’ Compensation
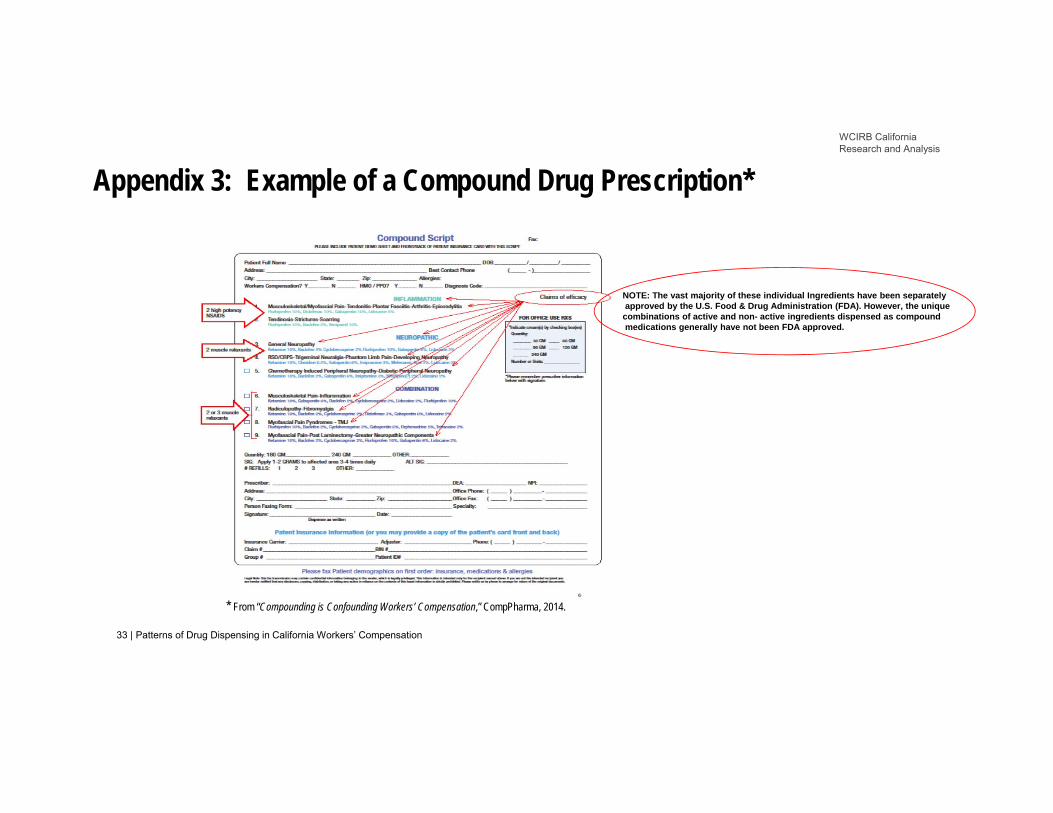
Appendix 3: Example of a Compound Drug Prescription*
* From “Compounding is Confounding Workers’ Compensation,” CompPharma, 2014.
NOTE: The vast majority of these individual Ingredients have been separatelyapproved by the U.S. Food & Drug Administration (FDA). However, the unique
combinations of active and non- active ingredients dispensed as compoundmedications generally have not been FDA approved.

WCIRB CaliforniaResearch and Analysis
34 | Patterns of Drug Dispensing in California Workers’ Compensation
LOSANGELESCOUNTY
REMAINDER OF LA BASIN
SAN DIEGOCOUNTY
CENTRALCALIFORNIA
BAY AREA ALLOTHERREGIONS
STATE-WIDE
# OF COUNTIES
1 5 1 12 8 31 58
COUNTYNAMES
Los Angeles San Bernardino,Orange, Ventura,Riverside, Imperial
San Diego Santa Barbara, Inyo, Kern, Fresno, Mono,San Luis Obispo, Tulare, Madera, Kings, Santa CruzSan Benito, Monterrey
San Francisco, Alameda, Marin,San Mateo, Santa Clara, Contra Costa, Sonoma, Napa
All Others
ALL
# OF 3 DIGIT ZIP CODES
20 9 3 11 11 8 62
3 DIGIT ZIP CODE RANGES
900-918, 935 922-930 919-921 931-934, 936-939,950,952,953
940-949, 951 954-961 ALL
Appendix 4: Categorization of Six California Regions

WCIRB CaliforniaResearch and Analysis
35 | Patterns of Drug Dispensing in California Workers’ Compensation
DISPENSERTYPE &LOCATION
LACOUNTY
OTHER LA BASIN
SANDIEGO
CENTRALCALIFORNIA
BAYAREA
ALL OTHER REGIONS
STATEWIDE
Pharmacies* 1,223 890 320 802 730 552 4,517
Physicians ** 912 510 190 443 353 223 2,631
TOTAL 2,135 1,400 510 1,245 1,083 775 7,148
* Pharmacies are defined as entities receiving payments for drugs during the study period including chain pharmacies, independent pharmacies, compounding pharmacies and drug wholesalers.
** Physicians are defined as any entity classified as a physician in the California workers’ compensation system who received payments for drugs during the study period. This designation included individual MDs, group practices, clinics, acupuncturists, osteopaths and chiropractors.
Appendix 5: Summary of Pharmacies and Physician Dispensers Included in This Study

WCIRB California Research and Analysis
Workers’ Compensation Insurance Rating Bureau of California 1221 Broadway, Suite 900 Oakland, CA 94612
888.229.2474 (CA-WCIRB) www.wcirb.com Twitter: @WCIRB
Notice This Patterns of Drug Dispensing in California Workers’ Compensation (Report) was created by the Workers’ Compensation Insurance Rating Bureau of California (WCIRB) for the convenience of its members. The WCIRB has made reasonable efforts to ensure the accuracy of this Report. You must make an independent assessment regarding the use of this Report based upon your particular facts and circumstances. 2016 Workers’ Compensation Insurance Rating Bureau of California. All rights reserved.
No part of this work may be reproduced or transmitted in any form or by any means, electronic or mechanical, including, without limitation, photocopying and recording, or by any information storage or retrieval system without the prior written permission of the Workers’ Compensation Insurance Rating Bureau of California (WCIRB), unless such copying is expressly permitted in this copyright notice or by federal copyright law. No copyright is claimed in the text of statutes and regulations quoted within this work.
Each WCIRB member company, including any registered third-party entities, (Company) is authorized to reproduce any part of this work solely for the following purposes in connection with the transaction of workers’ compensation insurance: (1) as necessary in connection with Company’s required filings with the California Department of Insurance; (2) to incorporate portions of this work, as necessary, into Company manuals distributed at no charge only to Company employees; and (3) to the extent reasonably necessary for the training of Company personnel. Each Company and all agents and brokers licensed to transact workers’ compensation insurance in the state of California are authorized to physically reproduce any part of this work for issuance to a prospective or current policyholder upon request at no charge solely for the purpose of transacting workers’ compensation insurance and for no other purpose. This reproduction right does not include the right to make any part of this work available on any website or on any form of social media.
Workers’ Compensation Insurance Rating Bureau of California, WCIRB, WCIRB California, WCIRB Connect, WCIRB Inquiry, X-Mod Direct, eSCAD and the WCIRB California logo (WCIRB Marks) are registered trademarks or service marks of the WCIRB. WCIRB Marks may not be displayed or used in any manner without the WCIRB’s prior written permission. Any permitted copying of this work must maintain any and all trademarks and/or service marks on all copies.
To seek permission to use any of the WCIRB Marks or any copyrighted material, please contact the WCIRB at [email protected].