Patterns and Determinants of Household Expenditure on Engineering Education in Delhi
14
Patterns and Determinants of Household Expenditure on Engineering Education in Delhi Pradeep Kumar Choudhury Doctoral Scholar, National University of Educational Planning and Administration (NUEPA), New Delhi, India www.nuepa.org 13 th EADI General Conference and DSA Annual Conference (19-22 September 2011) York, UK 20 th September 2011 1
-
Upload
illana-michael -
Category
Documents
-
view
30 -
download
0
description
Patterns and Determinants of Household Expenditure on Engineering Education in Delhi. Pradeep Kumar Choudhury Doctoral Scholar, National University of Educational Planning and Administration (NUEPA), New Delhi, India www.nuepa.org - PowerPoint PPT Presentation
Transcript of Patterns and Determinants of Household Expenditure on Engineering Education in Delhi

Patterns and Determinants of Household Expenditure on Engineering Education in Delhi
Pradeep Kumar ChoudhuryDoctoral Scholar, National University of Educational Planning and
Administration (NUEPA), New Delhi, Indiawww.nuepa.org
13th EADI General Conference and DSA Annual Conference (19-22 September 2011)York, UK
20th September 2011
1

Introduction
Financing for Development
Education and Development
Financing of Education
2
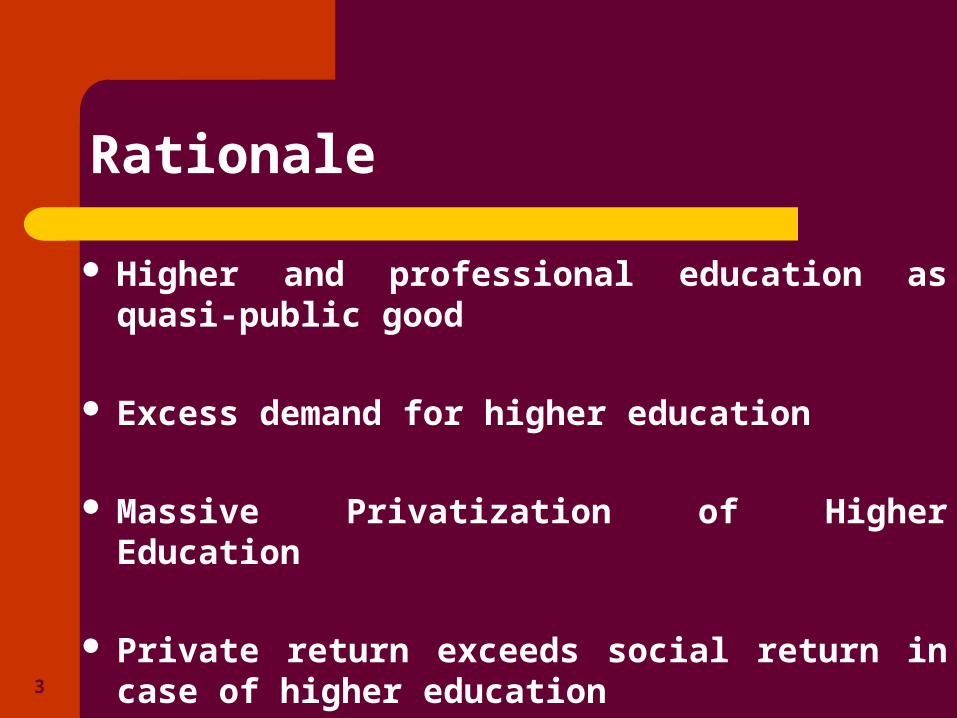
Rationale
Higher and professional education as quasi-public good
Excess demand for higher education
Massive Privatization of Higher Education
Private return exceeds social return in case of higher education
3

Objectives
To analyze the patterns of household expenditure on engineering education.
To find out the possible determinants of household expenditure on engineering education in Delhi.
4

Sample
Institutions
Government Private Total
5 6 11
Students
479 699 1178
Students from Traditional Departments = 246 Students from IT related Departments = 745
5

Household expenditure on eng. education by gender (Rs. in ’000)
Heads of Exp. Total
M F T
Fees (Tuition + Other) 41.7 46.1 42.3
Non-fee Expenditure 23.4 18.9 22.7
Additional expenditure 23.5 20.8 23.1
Total Household Expenditure 70.9 69.3 70.66
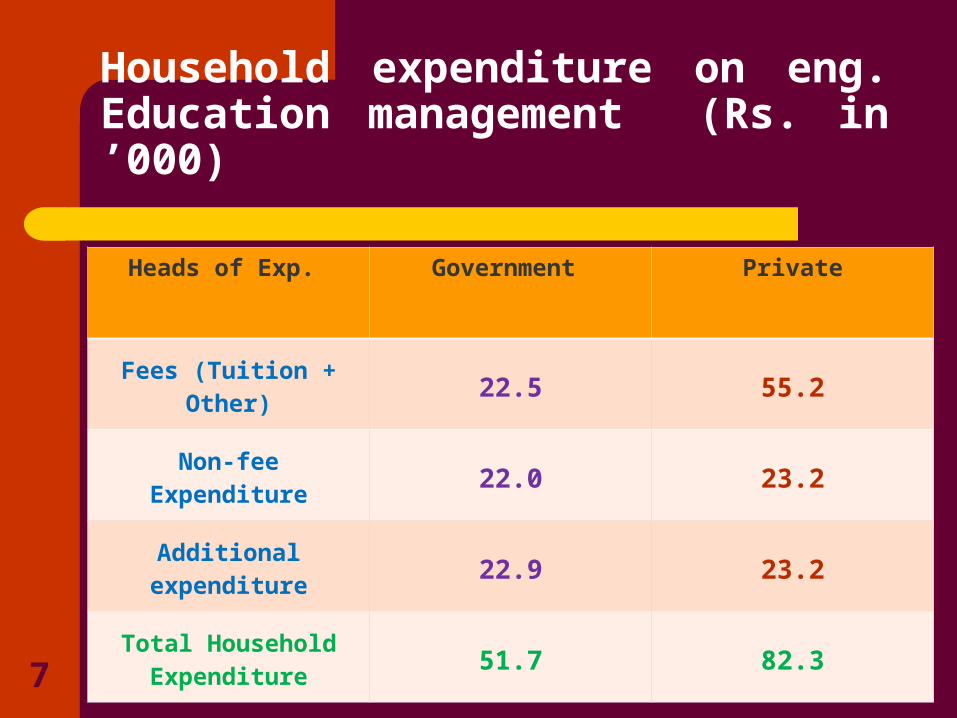
Household expenditure on eng. Education management (Rs. in ’000)
Heads of Exp. Government Private
Fees (Tuition + Other) 22.5 55.2
Non-fee Expenditure 22.0 23.2
Additional expenditure 22.9 23.2
Total Household Expenditure
51.7 82.37

Total Household expenditure on eng. education by social category and management (Rs. in ’000)
SC & ST OBC Gen
Government 56.9 57.1 50.8
Private 69.1 96.8 82.9
Total 62.5 81.1 71.48
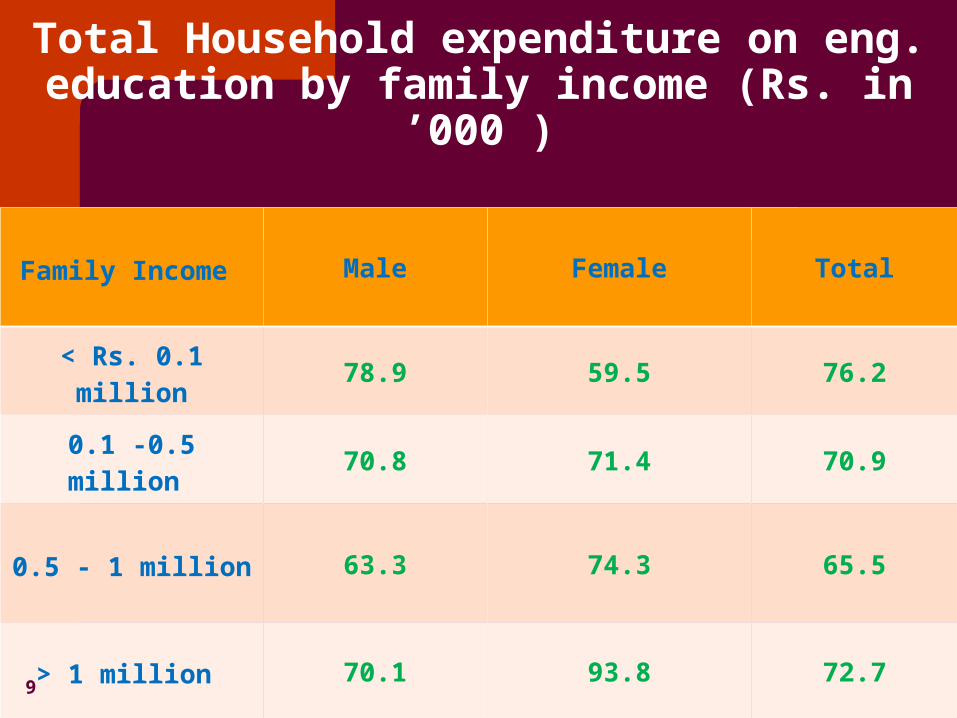
Total Household expenditure on eng. education by family income (Rs. in ’000 )
Family Income Male Female Total
< Rs. 0.1 million 78.9 59.5 76.2
0.1 -0.5 million 70.8 71.4 70.9
0.5 - 1 million 63.3 74.3 65.5
> 1 million 70.1 93.8 72.79

Household expenditure on eng. Education by department of study (’000)
Item Traditional IT
Fees (Tuition + Other) 42.2 42.2
Non-fee Expenditure 22.1 22.9
Additional expenditure 21.8 24.3
Total Household Expenditure on eng. education
71.6 71.410

Determinants of total household expenditure on engineering education
Variable Total HH Exp. on eng. education
Muslim -0.34***
SC -0.16***
Lnfamily_income 0.01
Mangt. of the college 0.54*
Furtheredu_Master 0.31*
Furtheredu2_PhD 0.22**
R-square= 0.18, N=75111
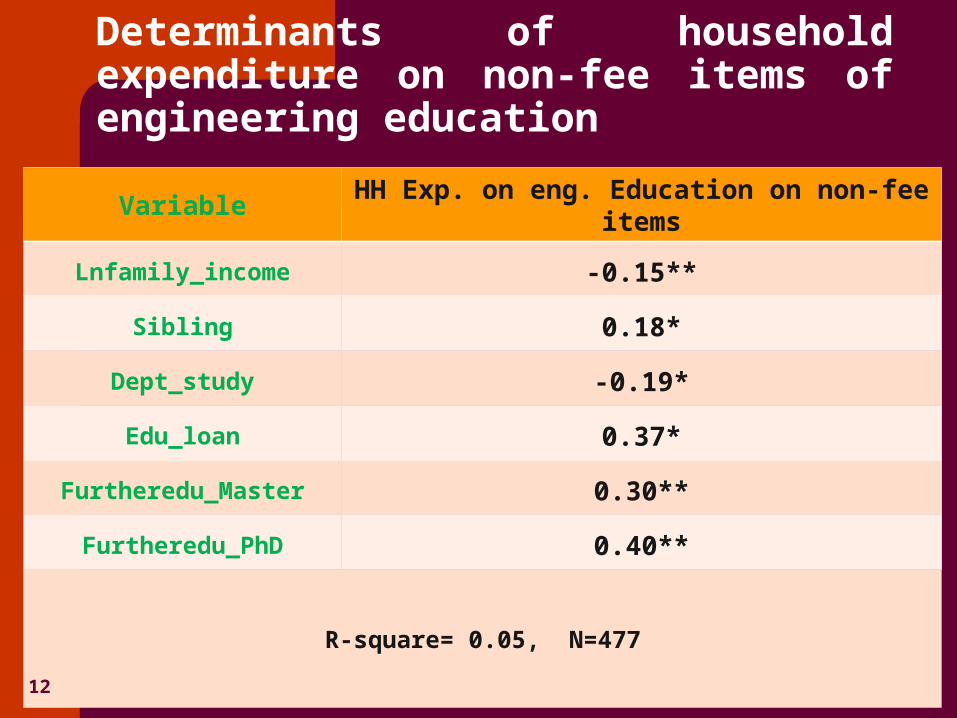
Determinants of household expenditure on non-fee items of engineering education
Variable HH Exp. on eng. Education on non-fee items
Lnfamily_income -0.15**
Sibling 0.18*
Dept_study -0.19*
Edu_loan 0.37*
Furtheredu_Master 0.30**
Furtheredu_PhD 0.40**
R-square= 0.05, N=477
12

Summary
Gender difference
Difference in household expenditure by management
Expenditure difference by income group (Inverse)
No difference by departments of study13