Patrick Blanchard TXF, Paris, November 12, 2013 The Future of Export Finance: How to diversify...
6
Patrick Blanchard TXF, Paris, November 12, 2013 The Future of Export Finance: How to diversify sources of liquidity? An exporter’s perspective
-
Upload
jordan-mckinney -
Category
Documents
-
view
215 -
download
2
Transcript of Patrick Blanchard TXF, Paris, November 12, 2013 The Future of Export Finance: How to diversify...
Patrick BlanchardTXF, Paris, November 12, 2013
The Future of Export Finance:How to diversify sources of liquidity?
An exporter’s perspective
© ALSTOM 2013. All rights reserved. Information contained in this document is indicative only. No representation or warranty is given or should be relied on that it is complete or correct or will apply to any particular project. This will depend on the technical and commercial circumstances. It is provided without liability and is subject to change without notice. Reproduction, use or disclosure to third parties, without express written authority, is strictly prohibited.
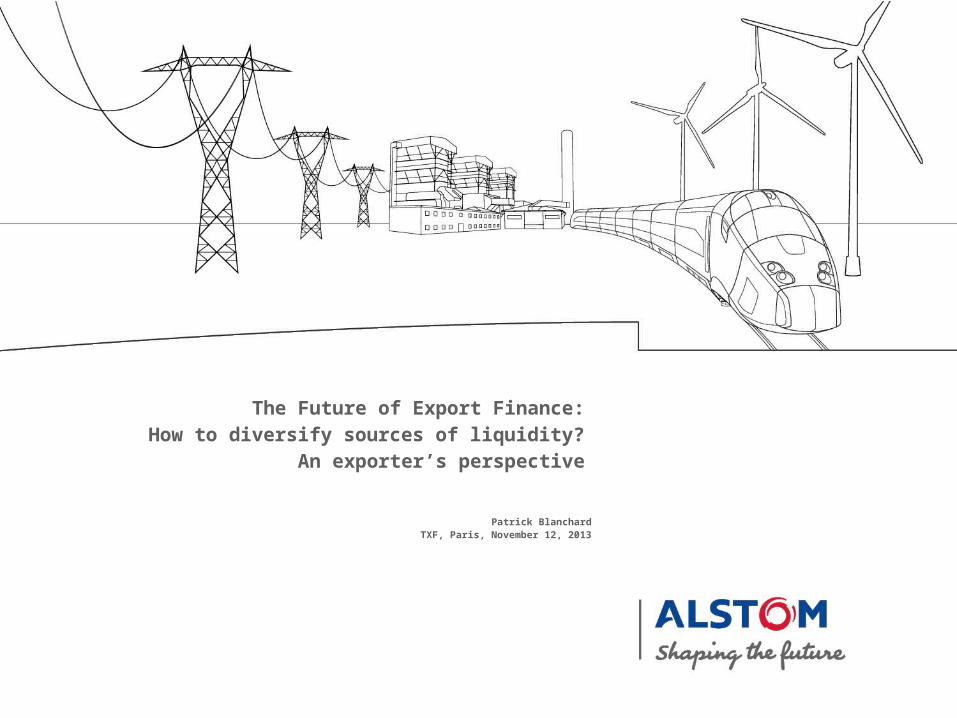
Alstom Thermal Power
Alstom Transport
Alstom Grid
Alstom Renewable Power
Alstom Four Sectors
© ALSTOM 2013. All rights reserved. Information contained in this document is indicative only. No representation or warranty is given or should be relied on that it is complete or correct or will apply to any particular project. This will depend on the technical and commercial circumstances. It is provided without liability and is subject to change without notice. Reproduction, use or disclosure to third parties, without express written authority, is strictly prohibited.
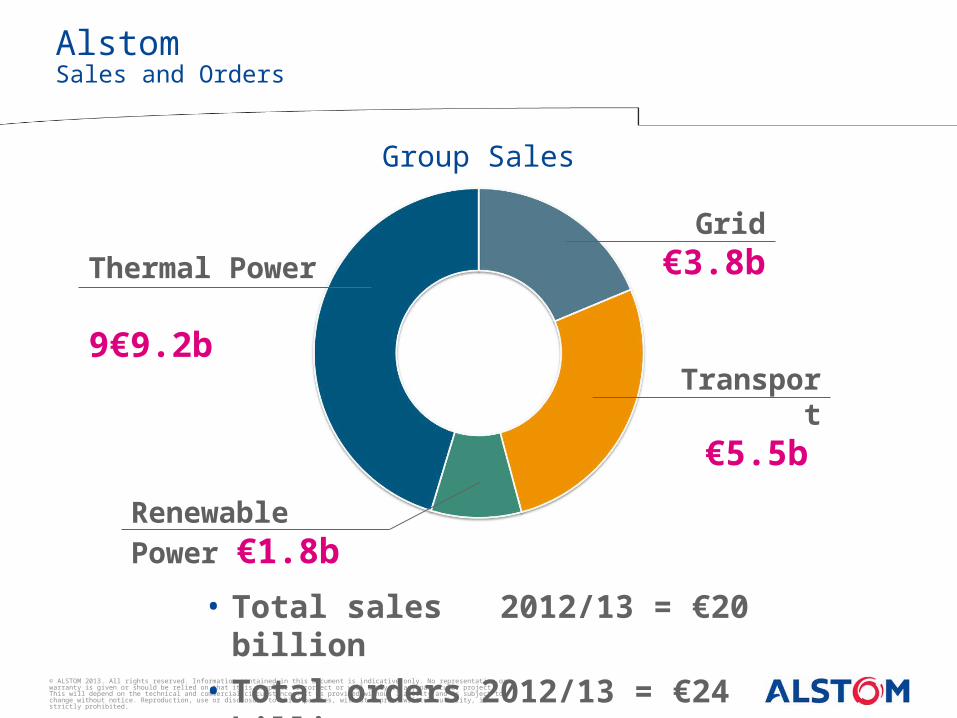
• Total sales 2012/13 = €20 billion• Total orders 2012/13 = €24 billion
Transport€5.5b
Thermal Power 9€9.2b
Grid€3.8b
Renewable Power €1.8b
AlstomSales and Orders
Group Sales
© ALSTOM 2013. All rights reserved. Information contained in this document is indicative only. No representation or warranty is given or should be relied on that it is complete or correct or will apply to any particular project. This will depend on the technical and commercial circumstances. It is provided without liability and is subject to change without notice. Reproduction, use or disclosure to third parties, without express written authority, is strictly prohibited.
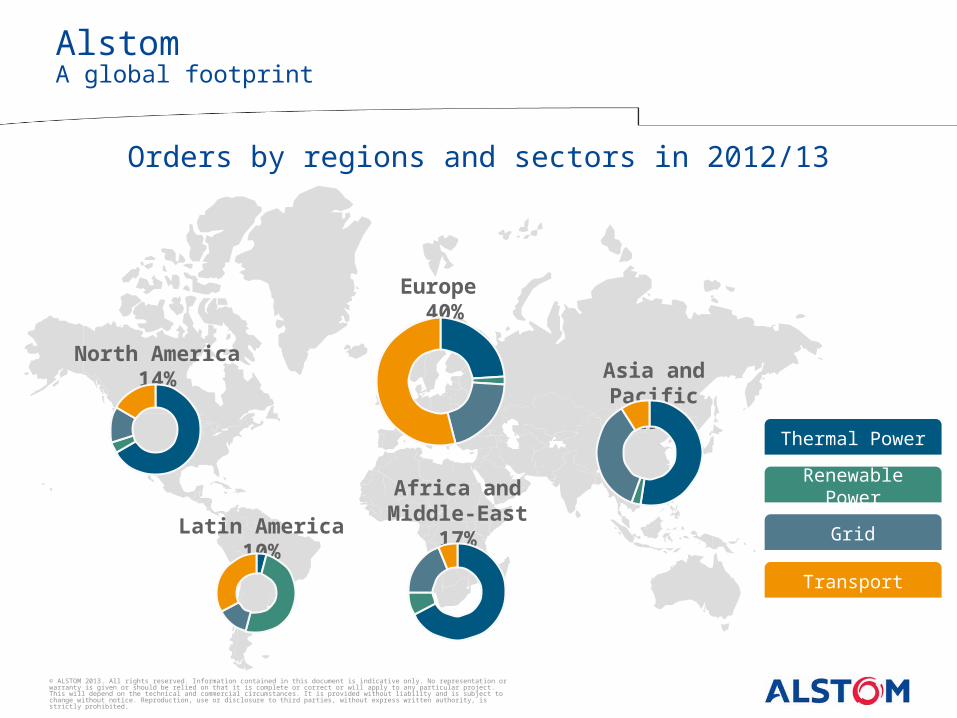
Orders by regions and sectors in 2012/13
AlstomA global footprint
Europe 40%
North America14%
Latin America10%
Africa andMiddle-East
17%
Asia and Pacific19%
Thermal Power
Renewable Power
Grid
Transport
© ALSTOM 2013. All rights reserved. Information contained in this document is indicative only. No representation or warranty is given or should be relied on that it is complete or correct or will apply to any particular project. This will depend on the technical and commercial circumstances. It is provided without liability and is subject to change without notice. Reproduction, use or disclosure to third parties, without express written authority, is strictly prohibited.
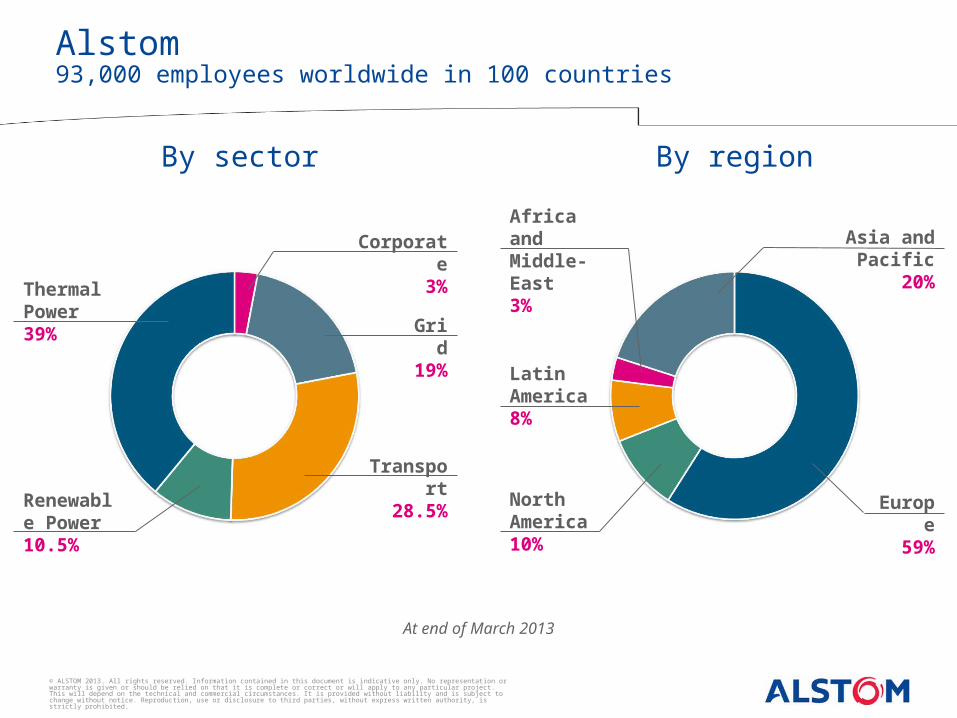
By regionBy sector
Africa and Middle-East3%
Asia and Pacific20%
Latin America8%
NorthAmerica10%
Europe59%
Renewable Power10.5%
Grid19%
Transport28.5%
Corporate3%
Thermal Power39%
At end of March 2013
Alstom93,000 employees worldwide in 100 countries
© ALSTOM 2013. All rights reserved. Information contained in this document is indicative only. No representation or warranty is given or should be relied on that it is complete or correct or will apply to any particular project. This will depend on the technical and commercial circumstances. It is provided without liability and is subject to change without notice. Reproduction, use or disclosure to third parties, without express written authority, is strictly prohibited.
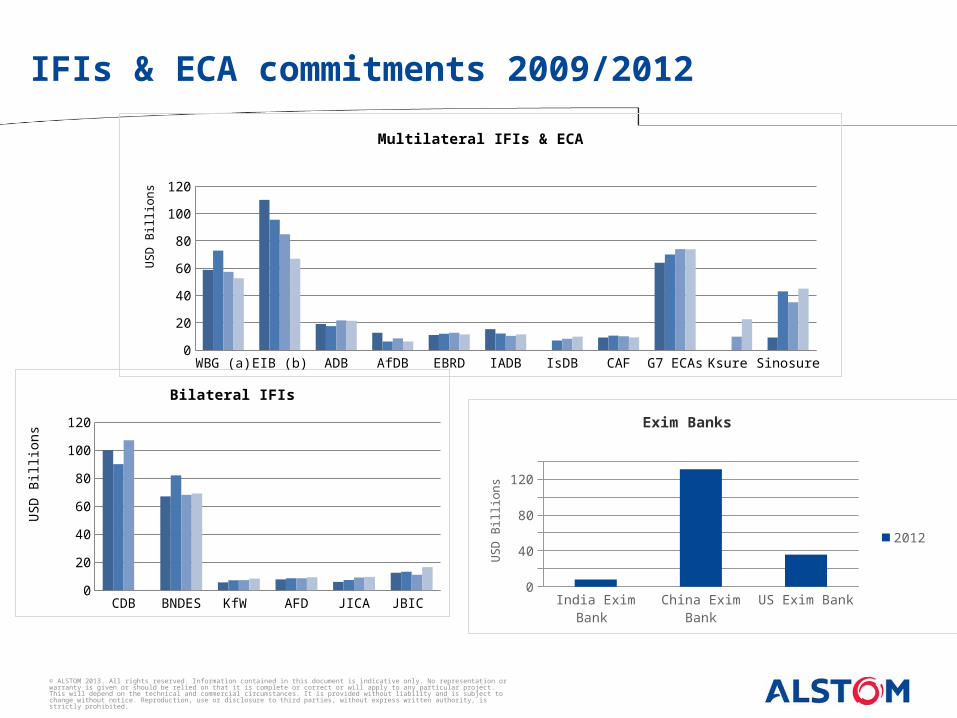
IFIs & ECA commitments 2009/2012
India Exim Bank China Exim Bank
US Exim Bank0
20406080
100120140
Exim Banks
2012US
D B
illio
ns
CDB BNDES KfW AFD JICA JBIC
2009 100 67 5.6 7.7 6 12.5
2010 90 82 7.1 8.5 7.3 13.2
2011 107 68 7.2 8.5 9.1 11
2012 NaN 69 8.3 9.2 9.5 16.5
1030507090
110
Bilateral IFIs
USD
Billi
ons
WBG (a) EIB (b) ADB AfDB EBRD IADB IsDB CAF G7 ECAs
Ksure Sinosure
2009 58.8 110.06675
19.1 12.7 11.006675
15.3 NaN 9.17 64 NaN 9.17
2010 72.9 95.54256
17.5 6.3 11.94282
12.1 7 10.5 70 NaN 43
2011 57.3 84.89431
21.7 8.5 12.664561
10.4 8.3 10.1 74 9.8 35
2012 52.6 66.85952
21.5 6.3 11.443264
11.4 9.8 9.3 73.9 22.6 45
10
50
90
Multilateral IFIs & ECAU
SD
Billio
ns