Patient-Specific Modeling and Simulation of Deep - DiVA Portal
22
Patient-Specific Modeling and Simulation of Deep Brain Stimulation Karin Wårdell, Elin Diczfalusy and Mattias Åström Linköping University Post Print N.B.: When citing this work, cite the original article. Original Publication: Karin Wårdell, Elin Diczfalusy and Mattias Åström, Patient-Specific Modeling and Simulation of Deep Brain Stimulation, 2011, in Patient-Specific Modeling in Tomorrow's Medicine, ed. Amit Gefen, pp 357-378. http://dx.doi.org/10.1007/8415_2011_104 Copyright: Springer Postprint available at: Linköping University Electronic Press http://urn.kb.se/resolve?urn=urn:nbn:se:liu:diva-72087
Transcript of Patient-Specific Modeling and Simulation of Deep - DiVA Portal
Patient-Specific Modeling and Simulation of
Deep Brain Stimulation
Karin Wårdell, Elin Diczfalusy and Mattias Åström
Linköping University Post Print
N.B.: When citing this work, cite the original article.
Original Publication:
Karin Wårdell, Elin Diczfalusy and Mattias Åström, Patient-Specific Modeling and
Simulation of Deep Brain Stimulation, 2011, in Patient-Specific Modeling in Tomorrow's
Medicine, ed. Amit Gefen, pp 357-378.
http://dx.doi.org/10.1007/8415_2011_104
Copyright: Springer
Postprint available at: Linköping University Electronic Press
http://urn.kb.se/resolve?urn=urn:nbn:se:liu:diva-72087

Patient-Specific Modeling and Simulation of Deep Brain Stimulation
Karin Wårdell, Elin Diczfalusy, Mattias Åström
Department of Biomedical Engineering
Linköping University, Linköping, Sweden
Abstract. Deep brain stimulation (DBS) is widely used for reduction of symptoms
caused by movement disorders. In this chapter a patient-specific finite element
method for modeling and simulation of DBS electric parameters is presented. The
individual’s stereotactic preoperative MR-batch of images is used as input to the
model in order to classify tissue type and allotte electrical conductivity for
cerebrospinal fluid, blood and grey as well as white matter. With patient-specific
positioning of the DBS electrodes the method allows for investigation of the
relative electric field changes in relation to anatomy and DBS-settings. Examples
of visualization of the patient-specific electric entities together with the
surrounding anatomy are given. The use of the method is exemplified on patients
with Parkinson’s disease. Future applications including multiphysics simulations
and applicability for new DBS targets and symptoms are discussed.
7.1 Introduction
Deep brain stimulation has become one of the most important brain stimulation
techniques for clinical use (Benabid, 2003). The application of DBS for movement
disorders such as Parkinson’s disease, essential tremor and dystonia, is currently
also expanding toward other diseases and symptoms such as epilepsy, Gilles de la
Tourette’s syndrome, obsessive compulsive disorders and other psychiatric
illnesses. Research on DBS is performed in many centers and several thousand
scientific papers have so far been published (Hemm and Wårdell, 2010).
The clinical result from DBS is very dependent on the anatomical placement of
the electrode in the brain, and thus the surgical implantation procedure as well as
the stimulation parameter settings of the device. As DBS has become more
commonly used, there are also an increasing number of reports of postoperative
adverse events including speech disturbances, depression, mood changes and
behavioral problems (Hariz et al., 2008). Such side disorders are often associated
with electrode misplacement or the stimulation settings in relation to the pre-
defined target area selected for electrode implantation. Since the mechanism of
action of DBS is not fully understood, it is sometimes difficult to define the
optimal target area in the brain which is related to a specific symptom. Increased
knowledge of the mechanism of action and thus improved understanding of the

2
therapeutic effect from DBS can be gained through different techniques. Examples
are recording of the neural response to stimulation, anatomical and functional
imaging, biochemical measurements of neurotransmitters with e.g. microdialysis
and simulations of electrical modalities around the electrode.
Several research groups have used the finite element method (FEM) in order to
develop computer-models of DBS electrodes and to set up simulations of the
electric field around the electrode (McIntyre et al., 2004, Hemm et al., 2005,
Åström et al., 2006, Yousif and Liu, 2007). The first generation of DBS-models
were used to visualize the concept of electric parameters for different DBS
stimulation settings, pre-selected target area and anatomical structures of the brain
(Hemm et al., 2005) (McIntyre et al., 2004) (Åström et al., 2006). FEM has also
been used to investigate the electrode-brain interface (Yousif et al., 2007), the
axonal tissue around deep brain structures directly activated by DBS (McIntyre et
al., 2004) and the influence on the electric field from cerebrospinal (CSF) filled
cystic cavities (Åström et al., 2006). The latest modeling concepts are, however,
patient- and treatment specific i.e. based on the individual’s own anatomy and
DBS electrode settings as input (Åström et al., 2009, Vasques et al., 2008, Butson
et al., 2007). The activated tissue volume around the DBS electrode when
positioned in the globus pallidus internus (GPi) has been studied by Vasques and
colleagues (Vasques et al., 2008). Butson and co-workers used FEM for prediction
of the volume of tissue activated based on diffusion tensor imaging (DTI) and an
axon model (Butson et al., 2007). This concept has been used in order to evaluate
verbal influence from stimulation when the DBS electrode was positioned in the
subthalamic nucles (STN) (Mikos et al., 2011). Patient-specific FEM simulations
have also been used by our group in order to investigate the relationship between
electrical field and both movement and speech intelligibility in patients with
Parkinson’s disease stimulated in the STN (Åström et al., 2010).
As the number of DBS implantations are constantly increasing and each
implantation procedure requires accurate, precise and safe targeting of the brain
structure for optimal clinical outcome, the technical aids for improving the DBS
implantation and patient follow-up have become increasingly important (Hemm
and Wårdell, 2010). A major challenge is therefore to develop tools that helps
optimize the surgical procedure, the postoperative follow up, the patient safety,
and also help reducing the total costs for health care. In this perspective, patient-
specific modeling, simulation and visualization have the potential to become a
useful tool for improvement of the surgical planning and the post-operative follow
up.
In this chapter we present a patient-specific method for investigation of the DBS-
electric distribution in relation to individual stimulation setting and brain anatomy
by means of FEM modeling and simulations. Our approach (Åström et al., 2009)
(Åström, 2011) uses the individual patient’s preoperative batch of images in order

3
to classify the electrical conductivity for different tissue types. With the help of
treatment-specific positioning of the DBS electrode in relation to the postoperative
MR images, the method allows for investigations of the relative electric field
changes in relation to anatomy and DBS-settings. Visualization of the electrical
entities together with anatomical structures can be done in numerous ways.
Examples of visualization in 2D and 3D are given in this chapter. As it is of
importance with knowledge of DBS and the surgical implantation procedure for
setting up models and simulations, the chapter start with a review of these
features.
Fig. 1. a) Medtronics DBS electrode 3389 b) Leksell® Stereotactic System (With permission from
Elekta Instrument AB) c) CT image with implanted DBS electrodes (With permission from Patric
Blomstedt, Umeå University Hospital).
7.2 Deep brain stimulation systems
The most commonly used DBS electrodes (Fig. 1) have four contacts with a
diameter of 1.27 mm and contact length of 1.5 mm and an intercontact distance of
0.5 mm or 1.5 mm (Medtronic’s leads and electrode models 3389 and 3387,
Medtronic Corporation). The stimulation waveforms are produced by an
implantable pulse generator, for example, Soletra® is used for unilateral
stimulation and Kinetra® for bilateral stimulation. The voltage is commonly set at
a value between 1-5 V, the frequency between 120-185 Hz, the pulse width
between 60-200 s and the stimulation mode to mono- or bipolar. Each contact
can be used as anode or cathode in bipolar electrode configuration or as cathode in
the monopolar setting. If monopolar mode is used, the pulse generator case is used
as anode. After placement of the electrode in the predefined target area the
battery-operated pulse generator is implanted under the skin below the clavicle
and connected to the electrode through a lead extension.
The Medtronic DBS-system was approved by the Food and Drug
Administration as a treatment for tremor in 1997, for Parkinson’s disease in 2002
and for dystonia in 2003. Currently several companies and research groups are
developing new neurostimulation devices (Panescu, 2008). Among these, St. Jude

4
Medical Incorporation received the European CE mark approval of the Libra® and
LibraXP DBS systems for treating symptoms of Parkinson’s disease and the
first clinical implantation was done in Europe in 2009. Boston Scientific
Corporation recently initiated marketing the Vercise™ DBS System. The first
implantations were done in Europe, in the end of 2010 on patients with
Parkinson’s disease. Another new approach is Steering Brain Stimulation (Sapiens
Steering Brain Stimulation BV, The Netherlands). Their electrode uses 64 contacts
that can be configured individually to provide tailored stimulation much beyond
the capability of the probes that are commercially available today (Martens et al.,
2011). The electrode has so far been evaluated in animal studies. First
implantations in patients are expected in the near future.
7.3 DBS targets
The target area for implantation of the DBS electrode is preselected depending on
the symptom that should be reduced, and is usually only slightly larger than the
DBS electrode itself. This makes the positioning of the electrode crucial. The
targeting, together with optimization of the stimulation parameters are therefore of
utmost importance for an effective clinical outcome with minimal side-effects.
Structures deep within the brain such as the thalamus or the basal ganglia are
commonly used as target areas (Fig. 2). One of the most common targets is the
subthalamic nucleus (STN) (Benabid et al., 2009). It is used for reduction of
symptoms elevating from Parkinson’s disease and essential tremor. Targeting the
globus palldidus internus (GPi) is preferred by many groups for symptoms caused
by dystonia (Vitek et al., 2011) but also frequently used for Parkinson’s disease.
Recent research shows that precise targeting of a subsection of these nuclei may
be more efficient for reduction of well defined symptoms. For example, the STN
being only approximately 240 mm3 (8 x 6 x 5 mm
3) is believed to be organized
into motor, limbic and associative functional portions (Hardman et al., 2002).
DBS is currently also explored in a range of new target areas and symptoms,
many of these related to various psychiatric disorders such as Gilles de la Tourette
syndrome, obsessive-compulsive disorder, schizophrenia. Others are related to
epilepsy, cluster headache and Alzheimers disease. Finding the best target related
to a specific symptom or disorder is a delicate task which is a matter for intensive
research at many clinics worldwide.
In order to explore new target areas for DBS and to perform postoperative
follow-up on already implanted individuals, patient-specific modeling, simulation
and visualization of DBS electric parameters has great potential to become a new
tool that will help increase the understanding of the relation between DBS
parameter settings and the clinical outcome.

5
Fig. 2. Posterior view of the basal ganglia excluding the striatum. Image from (Åström, 2011).
7.4 Surgical implantation of DBS electrodes
Stereotactic technique is used in order to reach the target area in a safe way with
high accuracy and precision during DBS surgery. The procedure can be
distinguished according to preoperative planning, surgical implantation and
postoperative follow-up (Fig. 3). A short review of the different steps with
emphasizes to input parameters related to the modeling and simulation are
presented in this section. A more detailed description of the surgical procedure
and supporting techniques is presented in (Hemm and Wårdell, 2010).
7.4.1 Preoperative planning and imaging
The preoperative phase is used for planning the trajectory and target coordinates
and is highly dependent on high quality imaging of the brain with MRI and/or CT.
The most common procedure is to use a frame based stereotactic system for the
intervention. Before the imaging is taking place the stereotactic frame is firmly
attached to the patient’s head together with an indicator box. The indicator box
produces reference points (fiducials) in the image batch which are used for the
transformation of the target co-ordinates to the co-ordinates of the stereotactic
system. The fiducials are also essential for setting up the models. Some centres
acquire stereotactic MRI the day of implantation just before surgery while others
perform the MRI some days before the implantation to be co-registered with a
stereotactic CT of the day of surgery (Fig. 3). MRI sequences used can be T1, T2
or proton density weighted and is depending on the target of interest. For setting
up patient-specific models and simulations MRI is preferred before CT as it makes
tissue segmentation easier. The surgical planning including calculation of target
co-ordinates and trajectory is usually performed with commercially available
stereotactic software such as SurgiPlan (Elekta Instrument AB, Stockholm,

6
Sweden) iPlan (BrainLab AG, Munich, Germany) or Framelink (Medtronic
Incorporation, Minneapolis, MN, USA).
Some clinics do the planning of entry point, trajectory and target area directly
in the captured images while other users prefer to superimpose an anatomical
brain atlas onto the MRI in order to improve the identification of the target aimed
at. Modern versions of both the Schaltenbrand-Wahren and Talairach atlases are
available for computer use (Nowinski et al., 2005) and sometimes integrated in the
surgical planning systems. Åström et al., (Åström et al., 2010, Åström, 2011)
recently developed and used a 3D atlas based on Morels anatomical atlas (Morel,
2007) (Fig. 2, Fig. 7d). Such 3D atlases help to increase the intuitive
understanding of targets and their relation to the anatomy even more during the
preoperative planning . They are also useful in the interpretation of the interaction
between anatomy and simulated electrical parameters.
7.4.2 Surgical implantation
As a next step the electrode implantation itself takes place. If the procedure
requires the patient’s feedback for specific testing, surgery is done with local
anesthesia. After opening of the skull the probe can be inserted directly towards
the pre-planned target by means of a guide. However, in order to reduce the effect
from brain shift and thus fine tune the targeting, the electrode insertion procedure
is usually companioned with intracerebral measurements. Microelectrode
recording is the most commonly used technique and allows for neural activity
studies in up to five trajectories surrounding the target area (Gross et al., 2006).
The final trajectory is then decided based on the results of the recordings. Both
impedance measurement (Zrinzo and Hariz, 2008) and optical measurements
(Wårdell et al., 2007, Johansson et al., 2009) are done along the pre-calculated
trajectory using a guide with incorporated sensor for online feed-back. The feature
of the optical technique includes both microvascular blood flow and tissue type
discrimination along the trajectory. During surgery some clinics also perform
intra-operative X-ray or fluoroscopy in order to check the electrode position. If the
patient is awake the first testing of the DBS device is done before the probe is
fixated. As a final step the pulse generator is implanted together with leads which
connect it to the electrode.

7
7.4.3 Postoperative follow-up
Following the implantation the final electrode position and the absence of
haemorrhage is controlled by means of CT or MRI, with or without the
stereotactic frame. The electrode position will appear as electrode artefacts which
in general hide parts of the anatomical structures. Therefore image co-registration
is often part of the quality control as it allows a comparison between the planned
and the final electrode position. The electrode artifacts in the postoperative images
are also used for localizing the correct electrode position(s) when setting up
patient-specific models. These positions are then transferred to the preoperative
batch of MRI. A description of the procedure is presented under 7.5.2.
Post-operative follow-up also includes regular consultation with the patients.
At these sessions the stimulation settings are fine tuned. For some disorders e.g.
Parkinson’s disease and essential tremor the response to stimulation is immediate
and initial tests can be done already at surgery. For other disorders such as
dystonia it can take months to find the best fit of stimulation parameters i.e.
stimulation with optimal clinical effect and minimal adverse effect. During these
session simulation of the electric field can be useful for helping optimising the
electrode setting and thus the clinical effect.
Fig. 3. Surgical procedure and current supporting techniques. Images nessecary as input for modeling
and simulations are highlighted in grey. Modified from (Hemm and Wårdell, 2010).

8
7.5 Patient-specific models and simulations of DBS electric field
Setting up patient-specific models and performing simulations include a number
of steps. First, a brain tissue model of the brain region of interest is created based
on the preoperative patient images. Each voxel in the tissue model is assigned an
electric conductivity value depending on the tissue type. Next, an electrode model
of the DBS electrode used is set up based on its actual dimensions. The modelled
electrode is positioned in the brain tissue model and assigned suitable electrical
parameters. The patient-specific FEM simulation is then carried out based on the
equation for steady currents in order to calculate the distribution of electrical
parameters around the electrode. As a last step, the parameters of interest are
visualized together with the preoperative MRI. An overview of the process is
shown in Fig 4.
Fig. 4. Summary of the steps for setting up models and simulations of DBS-electric fields.

9
7.5.1 Brain tissue model
The preoperative stereotactic images are used as the starting point for creating the
patient-specific brain tissue model. Either MRI or DTI can be used as input to the
brain tissue model.
When using MRI as input, the quality should be good enough to distinguish
between grey matter, white matter, blood vessels and CSF. T1 or T2 weighted 1.5
Tesla MR images are preferred as input data, since these modalities allow
intensity-based identification of all of the above mentioned tissue materials.
Proton density weighted images can be used, but must be co-registered with either
T1 or T2 weighted images for identification of CSF. The MRI-batch of
preoperative images or co-registered images is used for intensity-based
segmentation of the tissue in order to identify grey matter, white matter, CSF and
blood vessels.
In the next step, a matrix is created where the intensity values are replaced with
the corresponding tissue conductivity values for the DBS stimulation frequency
used. For MRI voxels containing more than one tissue type, a linear interpolation
function is used to allot an approximated electrical physical property value. The
electrical conductivity property values are obtained from an online database by
Andreuccetti (Andreuccetti et al., 2005). Typical values for the stimulation
frequency 130 Hz are presented in Tab. 1. As seen, the electrical conductivity is
significantly higher in CSF than in other tissue types. This emphasizes the
importance of segmentation of especially CSF-filled cystic cavities (Virchovs
Robin spaces) in the deep brain structures before continuation with the simulation
step (Åström et al., 2006). An example of a MRI based brain tissue model is
presented in Fig. 5b together with the original MR-image (Fig. 5a).
Tab. 1. Electrical conductivity values for different brain matters at 130 Hz (Andreuccetti et al., 2005).
When DTI is used as input a different concept is nessecary in order to set up
the brain tissue model. Brain tissue may be anisotropic in regions of myelinated
fibre bundles. Tuch and colleagues (Tuch et al., 2001) suggested that DTI can be
used to non-invasively calculate anisotropic electrical conductivity tensors in
patient-specific brain anatomy. Using this concept, the diffusion tensors can be
represented by a symmetric positive definite 3 by 3 matrix, D:
Brain matter Electrical conductivity (S/m)
CSF 2.00
Grey matter 0.09
White matter 0.06
Blood 0.70

10
[
] [m2 s
-1]
where the subscripts describes each direction. Tuch and collegues also showed
that the diffusion and electrical conductivity tensors may be linearly related by:
[S m
-1]
where is the electrical conductivity tensor, is the effective extracellular
electrical conductivity, is the effective extracellular diffusivity. The ratio of
/ have been empirically derived to e.g. 0.844 S s mm-3
(Tuch et al., 2001). As
a last step in the creation of the tissue model, each electrical conductivity value or
tensor is transferred to the co-ordinate corresponding to the original location in the
preoperative image.
The calculated anisotropic tissue conductivy can be visualized with superquadric
glyphs (Kindlmann, 2004). A software tool was developed for visualization of
diffusion tensors with superquadric glyphs together with axial and coronal MRI
and DBS electrodes (Åström, 2011). Fig. 5c presents an example of a DTI brain
tissue model.
7.5.2 Electrode model
Electrode models, based on their actual geometrical dimensions, are predefined
and set up in the FEM software. Examples of two different predefined electrode
models (Medtronic 3389 and St Jude 6149) are presented in Fig. 6. In order to
position the electrode models in the real target site, the electrode artefacts in the
postoperative image batch are used. A second finite element model is set up, based
on the post-operative images, where the electrode models are positioned at the
centre of the artefacts. A transformation matrix is then created based on the
positions of the fiducials in the pre- and postoperative images. The transformation
matrix is applied to the electrode models, in order to place them at their accurate
positions in the brain model.

11
Fig.5. Axial and coronal views of preoperative MRI (a) and with electric conductivity maps based on
MRI displayed with colour-maps (b) and DTI displayed with superquadric glyph (c). The electrodes
are positioned in the STN.
Fig.6. Example of patient-specific positioning of electrode models with surrounding artefacts as seen
in the postoperative images. a) Medtronics electrode 3389 b) St Jude’s electrode 6149.
12
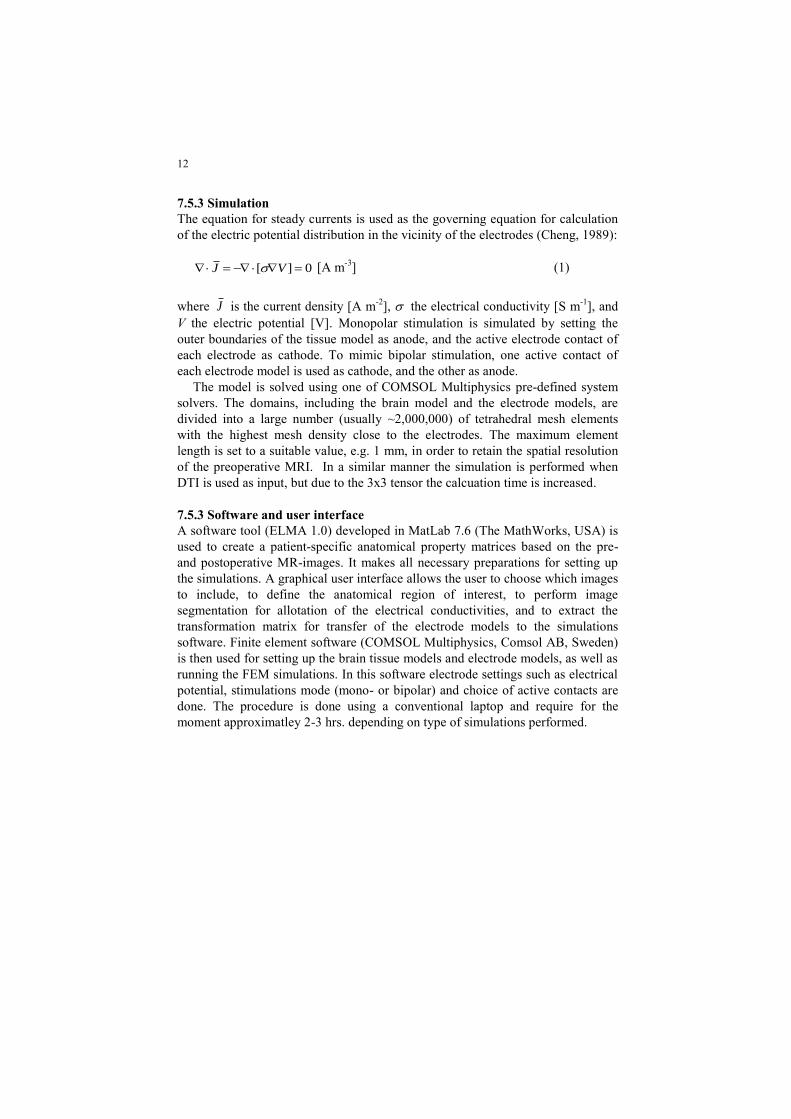
7.5.3 Simulation
The equation for steady currents is used as the governing equation for calculation
of the electric potential distribution in the vicinity of the electrodes (Cheng, 1989):
0][ VJ [A m-3
] (1)
where J is the current density [A m-2
], the electrical conductivity [S m-1
], and
V the electric potential [V]. Monopolar stimulation is simulated by setting the
outer boundaries of the tissue model as anode, and the active electrode contact of
each electrode as cathode. To mimic bipolar stimulation, one active contact of
each electrode model is used as cathode, and the other as anode.
The model is solved using one of COMSOL Multiphysics pre-defined system
solvers. The domains, including the brain model and the electrode models, are
divided into a large number (usually ~2,000,000) of tetrahedral mesh elements
with the highest mesh density close to the electrodes. The maximum element
length is set to a suitable value, e.g. 1 mm, in order to retain the spatial resolution
of the preoperative MRI. In a similar manner the simulation is performed when
DTI is used as input, but due to the 3x3 tensor the calcuation time is increased.
7.5.3 Software and user interface
A software tool (ELMA 1.0) developed in MatLab 7.6 (The MathWorks, USA) is
used to create a patient-specific anatomical property matrices based on the pre-
and postoperative MR-images. It makes all necessary preparations for setting up
the simulations. A graphical user interface allows the user to choose which images
to include, to define the anatomical region of interest, to perform image
segmentation for allotation of the electrical conductivities, and to extract the
transformation matrix for transfer of the electrode models to the simulations
software. Finite element software (COMSOL Multiphysics, Comsol AB, Sweden)
is then used for setting up the brain tissue models and electrode models, as well as
running the FEM simulations. In this software electrode settings such as electrical
potential, stimulations mode (mono- or bipolar) and choice of active contacts are
done. The procedure is done using a conventional laptop and require for the
moment approximatley 2-3 hrs. depending on type of simulations performed.

13
7.6 Visualisation
Visualization is central for improving the interpretation of the results from patient-
specific modeling and simulations of DBS. Various electrical entities as well as
anatomy may be visualized for different rationales. The electric field, which is the
first derivative of the electric potential, is a general property often visualized
during simulations of DBS. Such visualizations are preferably done together with
the anatomy in 2D or 3D.
An example of a patient-specific simulation of bilateral DBS implantation in
STN is presented in Fig. 7 (left electrode: 4 V, contact 1; right electrode: 3.5 V,
contact 7). In order to compare the electric field with the patient’s own anatomy
we have chosen to delineate the outer part of the electric field at the isolevel 0.2
V/mm, a border previously suggested by (Hemm et al., 2005). By using a fixed
isolevel it is possible to make relative comparisons between simulations
performed in the same patient but with different voltage or contact settings. This is
often the case during evaluation of the clinical effect following various DBS
system settings. The anatomical 2D structures as extracted from Morels atlas
(Morel, 2007) are superimposed onto the MRI and electrical field images in Fig. 7
a-c.
To further facilitate the interpretation of DBS simulations a 3D atlas has been
created of the human thalamus and the basal ganglia based on axial slices of the
stereotactic atlas by Morel (Morel, 2007). The patient-specific anatomy can then
be visualized in 3D together with patient MRI on both axial and coronal slides.
The 3D atlas is created by segmentation of the axial atlas slices. Three
dimensional surface objects of each structure and fibre path are generated by
combining several aligned images. Each object is then filtered by 3D smoothing in
order to remove rough edges and corners. In this way, depending on the
positioning of the electrode, structures such as sub-nuclei of the thalamus and
basal ganglia can be manually co-registered with patient MRI for improving the
anatomic information in 3D. An example of a 3D atlas of a few relevant structures
and fibre paths during DBS is presented in Fig. 7d. The DBS electrode and electric
field is here animated and thus, not patient-specific.
When DTI is used as model input the visualization becomes more complex as the
anisotropy (superquadatic glyphs) need to be presented together with the
simulated field, and preferably also together with the preoperative MRI. An
example is shown in Fig. 8. In this example two fixed isolevels are used 0.2 V/mm
and 0.05 V/mm in order to make comparison with visualisation of the
superquadratic glyphs easier.

14
Fig. 7. a) Electrodes positioned in the STN with simulated electric field with isolevel 0.2 V/mm
presented with MRI. b) Isolevels traced in yellow. c) An anatomical atlas superimposed on the MRI together with traced isolevels.d) Superior view of an anatomical structures together with animated DBS
electrode and surrounding electric field.
Fig 8. Example of patient-specific visualization of electric field simulation using DTI as input. a) axial
and b) cornal slice. The anisotropy in tissue is presented by the superquadratic glyps superimposed on the preoperative MRI. The electric fields are visualised with two isolevels 0.2V/mm (inner) and 0.05
V/mm (outer) circles. Image from (Åström, 2011).

15
7.7 Clinical examples of DBS simulations
7.7.1 Parkinson’s disease: Simulations as aid for clinical assessment
In the following an example of a patient with Parkinson’s disease suffering from
stimulation-induced speech impairments is presented (Tripoliti et al., 2008,
Åström et al., 2010). The patient underwent bilateral DBS surgery based on
stereotactic T2-weighted 1.5 Tesla MRI with sequences enabling visualization of
the STN. A postoperative fast spin echo T2-weigthed MRI was used for
visualisation of the actual electrode position and consequently also used for setting
up the models for the DBS-simulation. The electrode contacts located closest to
the centre of the STN were used as active contacts. In order to identify these the
FrameLink Planning StationTM
(Medtronic, Minneapolis, MN, USA) was used.
Simulations were set up based on the pre- and postoperative MRI images and the
DBS implanted electrode (Model 3389, Medtronics Inc. USA). In order to be able
compare simulations of various stimulations settings, the result was presented as
0.2 V/mm isolevel superimposed on the axial and coronal preoperative MRI
together with Morels 2D atlas.
Clinical assessments of speech intelligibility and movement were carried out
during monopolar stimulation in the STN with an electric potential of 0, 2, and 4
V. Movement was evaluated using the Unified Parkinson’s Disease Rating Scale
part three (UPDRS-III) and speech by three sustained vowel phonation of “ah”
and a 60 s monologue. The electric field was simulated for 2 and 4 V settings with
frequency and pulse length set at 130 Hz and 60 µs respectively. This
corresponded to the settings used during the clinical assessments (Tab. 2).
Tab.2 Electrical settings and clinical effects
Left side
Contact (Potential)
Right side
Contact (Potential)
Speech
intelligibility UPDRS-III Side-effects
0 (2 V) 5 (2 V) 70 % 33 None
0 (4 V) 5 (4 V) 20 % 33 Dysarthria
The patient suffered from acute stimulation-induced impairment of speech
intelligibility during the high potential (4V). Visualisation of the simulated electric
field in relation to anatomy showed that the active electrode contacts were
positioned slightly ventral, posterior and medial to the centre of the STN and that
the electric field isolevel covered a major part of the fasciculus cerebello-
thalamicus (fct) (Fig. 9). Movement as measured by the UPDRS-III was improved
during both potential settings compared to off stimulation. In this particular patient
the motor score was surprisingly the same during both high and low stimulation. A
complete presentation of the study including ten patients is presented in (Åström
et al., 2010).
R

16
Fig. 9 a) Axial and b) coronal view of the electric field during electrical settings that induced dysarthria
(red) and that did not induce dysarthria (white). The approximate boundaries of the red nucleus, the fct
and the STN are traced with blue colour. Electric fields are presented with isolevel 0.2V/mm.
7.7.2 Parkinson’s disease: Multiphysics simulations
Modeling and simulations of DBS can also be done in a multiphysics approach.
An example is given were patient-specific simulations of the electric field around
DBS electrodes are combined with modeling and simulations of the tissue volume
of influence around microdialysis probes. Equation (1) and a modified version of
Fick’s diffusion equation were implemented (Diczfalusy et al., 2011).
Stereotactic T2-weigthed 1.5 Tesla MRI was used for target identification.
Bilateral implantation of DBS electrodes were done in the STN. In addition,
microdialysis probes were implanted in the putamen (Put, right side) and the GPi
(left and right side). This made monitoring of neurotransmitters such as dopamine,
glutamate and serotonin in relation to changes of the DBS-voltage settings
possible. Post-operative CT was used as identification of the electrode artifacts
and thus positioning of the DBS electrodes for setting up the models. In a similar
way, a small goldthread in the microdialysis probe tip was used to identify the
anatomical position, and thus used for setting up patient-specific modeling and
simulations of the tissue volume of influence around the membrane. Instead of
identifying the electrode artifacts with help of the surgical planning system, the
developed software (ELMA 1.0) was used.
An examples of a multiphysics simulation is presented in Fig. 10. An isolevel of
0.2 V/mm was used for presentation of the electric fields around the DBS
electrodes positioned in the STN. The maximum tissue volume of influence
(TVImax) for dopamin was presented using a concentration level at 0.01*C0
nmol/L, where C0 is the initial dopamin concentration in the tissue (Diczfalusy et
al., 2011). Patient-specific evaluation of microdialysis data in relation to the
TVImax and the electric field extensions is currenlty in progress.

17
Fig. 10. Example of a patient-specific multiphysics simulation superimposed on an axial preoperative
MRI slice. Electric field simulations are presented with isolevel 0.2 V/mm around the DBS electrodes
positioned in the STN, and microdialysis TVImax with a concentration isolevel of 0.01 C0 around the
three cathethers.
Discussion and Conclusions
A method for patient-specific modeling and simulation of deep brain stimulation
has been presented. By using MRI as input and by positioning the DBS electrodes
at their real position it is possible to perform simulations on a patient-specific
basis. Simulations can be done for various frequency and voltage settings and also
for various electrode models.
Our concept, based on electrical conductivity setting from MRI segmentation
of grey and white matter, blood and CSF, makes the modeling and simulation easy
to use and to adapt for new imaging concepts e.g. 3T MRI, now very quickly
introduced at many neurosurgical clinics. 3T MRI will improve the simulation
quality compared to 1.5T, due to more efficient image segmentation. Especially
CSF-filled cysts common in structures such as the GPi, are expected to be visible.
CSF, with its high conductivity has a great influence on the electric field shape
and extension, a fact shown by Åström et al., (Åström et al., 2006). An example
was also presented were a DTI was used to set up the brain tissue model in the
preparation for the simulations. DTI takes the tissues anisotropy into account,

18
which may be important if the DBS electrode is positioned in or in the vicinity to
white matter tracts. As long as DBS electrodes are positioned in grey matter, as is
the case when aiming at the deep brain structures, the anisotropy is of less
significance. As many electrodes are misplaced they may as well end up closely to
white matter, and the anisotropy will then be important to take into account. The
influence on simulation results from various image types (DTI, T2-MRI and pure
homogenous) as model input has been studied by us (Åström et al., 2011). These
investigations show that the influence of heterogeneous and anisotropic tissue on
the electric field may have a clinical relevance, especially in anatomic regions that
are functionally subdivided and surrounded by multiple fibres of passage.
However, at this point patient-specific models based on either MRI or DTI data
appear suitable for presenting a rough estimation of the electric field.
In this chapter different exemples of visualisations have been given. It must be
stressed that it is important to present the final simulation results together with the
individual anatomy. One example commonly used by us is to superimpose the
electric field on the preoperative axial or coronal MR-images. By using a fixed
isolevel it is possible to do relative comparisons for instance if the DBS settings
are changed during clinical assessments. Alternatively the electric potential or the
activating function can be presented. Such visualisations are possible, and have
been used by e.g. McIntyre et al., (McIntyre et al., 2004, Butson et al., 2007, Maks
et al., 2009) and are also exemplified by Åström (Åström et al., 2009, Åström,
2011). In addition, it is very important to have in depth knowledge of the deep
brain structures in the interpretation of the result. Therefore a 3D brain atlas was
developed. This atlas is so far only applicable as a general guide, as the electric
field simulation presented is animated (Fig. 7d). A future step in improvning the
visualisation would be to integrate the presentation of patient-specific field
simulations with the 3D atlas.
Along with the DBS electrode development also the number of pre-selected
electrodes must be increased. Two types of Medtronics electrodes (3389 and
3387), as well as two type of St Jude electrode (6149, 6145) have already been
implemented. A next step could be implementation of other suggested DBS-
configurations proposed by e.g. Boston Scientific and the Sapiens. However,
along with such introductions the software also needs to be modified to the
specific simulation mode suggested by the manufactur i.e. to both include current
and voltage control of the electrodes as well as feasable settings of stimulation
parameters.
Already today, the simulation settings can relatively easy be adapted for other
clinical applications and studies. So far we have used it on patients with
Parkinson’s disease where DBS electrodes have been positoned in the STN. We
are currentty adapting the model for use on patients with dystonia with DBS
electrodes positioned in the GPi. Other interesting applications are Gilles de la

19
Tourettes syndrome. A disorder for which the optimal target area is still under
investigation. In order to explore new target areas for DBS and to perform
postoperative follow-up on already implanted individuals, patient-specific
modeling, simulation and visualization of DBS electric parameters has a great
potential to become a new clinical tool that can both help increase the
understanding of the relation between DBS parameter settings and the clinical
outcome. A vision for the use in tomorrow’s medicine would be a flexible, user
friendly software that helps the clinician in both the preoperative planning phase
and the postoperative follow up by simulating and presenting electrical fields and
other entities in relation to the anatomy in a flexible way.
Acknowledgement
The authors would like to thank the clinical collegues at the Unit of Functional
Neurosurgery, London University Collegue and at the Division of Neurology and
Neurosurgery at Linköping University Hospital for very valuable input and
discussions during the development of the software. The work was financially
supported as a group grant (311-2006-7661 ) by the Swedish Foundation for
Strategic Research (SSF), the Swedish Research Council (VR) and the Swedish
Governmental Agency for Innovation Systems (VINNOVA).
References
ANDREUCCETTI, D., FOSSI, R. & PETRUCCI, C. 2005. Dielectric properties
of body tissue. Italian National Research Council, Institute for Applied Physics,
Florence, Italy, http://niremf.ifac.cnr.it/tissprop/
BENABID, A. L. 2003. Deep brain stimulation for Parkinson's disease. Current
Opinion in Neurobiology, 13, 696-706.
BENABID, A. L., CHABARDES, S., MITROFANIS, J. & POLLAK, P. 2009.
Deep brain stimulation of the subthalamic nucleus for the treatment of
Parkinson's disease. Lancet Neurol, 8, 67-81.
BUTSON, C. R., COOPER, S. E., HENDERSON, J. M. & MCINTYRE, C. C.
2007. Patient-specific analysis of the volume of tissue activated during deep
brain stimulation. Neuroimage, 34, 661-70.
CHENG, D. K. 1989. Field and Wave Electromagnetics, Addison-Wesley
Publishing Company Inc.
DICZFALUSY, E., ZSIGMOND, P., DIZDAR, N., KULLMAN, A., LOYD, D.
& WÅRDELL, K. 2011. A Patient-Specific Multiphysics Model for Prediction
of Analyte Diffusion when Using Microdialysis in Parallel to Deep Brain
Stimulation. Submitted.
GROSS, R. E., KRACK, P., RODRIGUEZ-OROZ, M. C., REZAI, A. R. &
BENABID, A. L. 2006. Electrophysiological mapping for the implantation of
deep brain stimulators for Parkinson's disease and tremor. Mov Disord, 21,
S259-S283.

20
HARDMAN, C. D., HENDERSON, J. M., FINKELSTEIN, D. I., HORNE, M. K.,
PAXINOS, G. & HALLIDAY, G. M. 2002. Comparison of the basal ganglia in
rats, marmosets, macaques, baboons, and humans: volume and neuronal number
for the output, internal relay, and striatal modulating nuclei. J Comp Neurol,
445, 238-55.
HARIZ, M. I., REHNCRONA, S., QUINN, N. P., SPEELMAN, J. D. &
WENSING, C. 2008. Multicenter study on deep brain stimulation in Parkinson's
disease: an independent assessment of reported adverse events at 4 years. Mov
Disord, 23, 416-21.
HEMM, S., MENNESSIER, G., VAYSSIERE, N., CIF, L., EL FERTIT, H. &
COUBES, P. 2005. Deep brain stimulation in movement disorders: stereotactic
coregistration of two-dimensional electrical field modeling and magnetic
resonance imaging. J Neurosurg, 103, 949-55.
HEMM, S. & WÅRDELL, K. 2010. Stereotactic implantation of deep brain
stimulation electrodes: a review of technical systems, methods and emerging
tools. Med Biol Eng Comput, 48, 611-24.
JOHANSSON, J. D., BLOMSTEDT, P., HAJ-HOSSEINI, N., BERGENHEIM,
A. T., ERIKSSON, O. & WÅRDELL, K. 2009. Combined Diffuse Light
Reflectance and Electrical Impedance Measurements as a Navigation Aid in
Deep Brain Surgery. Stereotact Funct Neurosurg, 87, 105-113.
KINDLMANN, G. 2004. Superquadric Tensor Glyphs. Proceedings IEEE
TVCG/EG Symposium on Visualization pages, 147-154.
MAKS, C. B., BUTSON, C. R., WALTER, B. L., VITEK, J. L. & MCINTYRE,
C. C. 2009. Deep brain stimulation activation volumes and their association with
neurophysiological mapping and therapeutic outcomes. J Neurol Neurosurg
Psychiatry, 80, 659-66.
MARTENS, H. C., TOADER, E., DECRE, M. M., ANDERSON, D. J., VETTER,
R., KIPKE, D. R., BAKER, K. B., JOHNSON, M. D. & VITEK, J. L. 2011.
Spatial steering of deep brain stimulation volumes using a novel lead design.
Clin Neurophysiol, 122, 558-66.
MCINTYRE, C. C., MORI, S., SHERMAN, D. L., THAKOR, N. V. & VITEK, J.
L. 2004. Electric field and stimulating influence generated by deep brain
stimulation of the subthalamic nucleus. Clin Neurophysiol, 115, 589-95.
MIKOS, A., BOWERS, D., NOECKER, A. M., MCINTYRE, C. C., WON, M.,
CHATURVEDI, A., FOOTE, K. D. & OKUN, M. S. 2011. Patient-specific
analysis of the relationship between the volume of tissue activated during DBS
and verbal fluency. Neuroimage, 54 Suppl 1, S238-46.
MOREL, A. 2007. Stereotactic atlas of the human thalamus and basal ganglia,
Informa Healthcare USA Inc.
NOWINSKI, W. L., THIRUNAVUUKARASUU, M. & BENABID, A. L. 2005.
The Cerefy Clinical BrainAtlas: Enhanced edition with surgical planning and
intraoperative support. CD-ROM.
PANESCU, D. 2008. Emerging technologies. Implantable neurostimulation
devices. IEEE Eng Med Biol Mag, 27, 100-5, 113.

21
TRIPOLITI, E., ZRINZO, L., MARTINEZ-TORRES, I., TISCH, S., FROST, E.,
BORRELL, E., HARIZ, M. I. & LIMOUSIN, P. 2008. Effects of contact
location and voltage amplitude on speech and movement in bilateral
subthalamic nucleus deep brain stimulation. Mov Disord, 23, 2377-83.
TUCH, D. S., WEDEEN, V. J., DALE, A. M., GEORGE, J. S. & BELLIVEAU, J.
W. 2001. Conductivity tensor mapping of the human brain using diffusion
tensor MRI. Proc Natl Acad Sci U S A, 98, 11697-701.
VASQUES, X., CIF, L., HESS, O., GAVARINI, S., MENNESSIER, G. &
COUBES, P. 2008. Stereotactic model of the electrical distribution within the
internal globus pallidus during deep brain stimulation. J Comput Neurosci.
VITEK, J. L., DELONG, M. R., STARR, P. A., HARIZ, M. I. & METMAN, L.
V. 2011. Intraoperative neurophysiology in DBS for dystonia. Mov Disord, 26
Suppl 1, S31-6.
WÅRDELL, K., BLOMSTEDT, P., RICHTER, J., ANTONSSON, J.,
ERIKSSON, O., ZSIGMOND, P., BERGENHEIM, A. T. & HARIZ, M. I.
2007. Intracerebral microvascular measurements during deep brain stimulation
implantation using laser Doppler perfusion monitoring. Stereotact Funct
Neurosurg, 85, 279-86.
YOUSIF, N., BAYFORD, R., BAIN, P. G. & LIU, X. 2007. The peri-electrode
space is a significant element of the electrode-brain interface in deep brain
stimulation: a computational study. Brain Res Bull, 74, 361-8.
YOUSIF, N. & LIU, X. 2007. Modeling the current distribution across the depth
electrode-brain interface in deep brain stimulation. Expert Rev Med Devices, 4,
623-31.
ZRINZO, L. & HARIZ, M. 2008. Impedance recording in functional
neurosurgery. In: GILDENBERG, P. L., LOZANO, A. M. & TASKER, R.
(eds.) Textbook of stereotactic and functional neurosurgery.
ÅSTRÖM, M. 2011. Modelling, Simulation and Visualisation of Deep Brain
Stimulation. Linköping Studies in Science and Technology Dissertation, No.
1384, Department of Biomedical Engineering, Linköping University.
ÅSTRÖM, M., JOHANSSON, J. D., HARIZ, M. I., ERIKSSON, O. &
WÅRDELL, K. 2006. The effect of cystic cavities on deep brain stimulation in
the basal ganglia: a simulation-based study. J Neural Eng, 3, 132-8.
ÅSTRÖM, M., LEMAIRE, J. & WÅRDELL, K. 2011. Influence of heterogeneous
and anisotropic tissue conductivity on electric field distribution in deep brain
stimulation. Submitted.
ÅSTRÖM, M., TRIPOLITI, E., HARIZ, M. I., ZRINZO, L. U., MARTINEZ-
TORRES, I., LIMOUSIN, P. & WÅRDELL, K. 2010. Patient-specific model-
based investigation of speech intelligibility and movement during deep brain
stimulation. Stereotact Funct Neurosurg, 88, 224-33.
ÅSTRÖM, M., ZRINZO, L. U., TISCH, S., TRIPOLITI, E., HARIZ, M. I. &
WÅRDELL, K. 2009. Method for patient-specific finite element modeling and
simulation of deep brain stimulation. Med Biol Eng Comput, 47, 21-8.