Pathways Ranking Guide and Proceedings Report, Focus Group ...
97
National Invasive Species Council Pathways Work Team Focus Group Conference Report And Pathways Ranking Guide June 21 – 22, 2005 Figure 1 Scientific name: Boiga irregularis. Common name: Brown Tree Snake Figure 2 Scientific name: Anoplophora glabripennis. Common name: Asian Longhorned Beetle
Transcript of Pathways Ranking Guide and Proceedings Report, Focus Group ...

National Invasive Species CouncilPathways Work Team
Focus Group Conference ReportAnd Pathways Ranking Guide
June 21 – 22, 2005
Figure 1 Scientific name: Boiga irregularis. Common name: Brown Tree Snake
Figure 2 Scientific name: Anoplophora glabripennis. Common name: Asian Longhorned Beetle
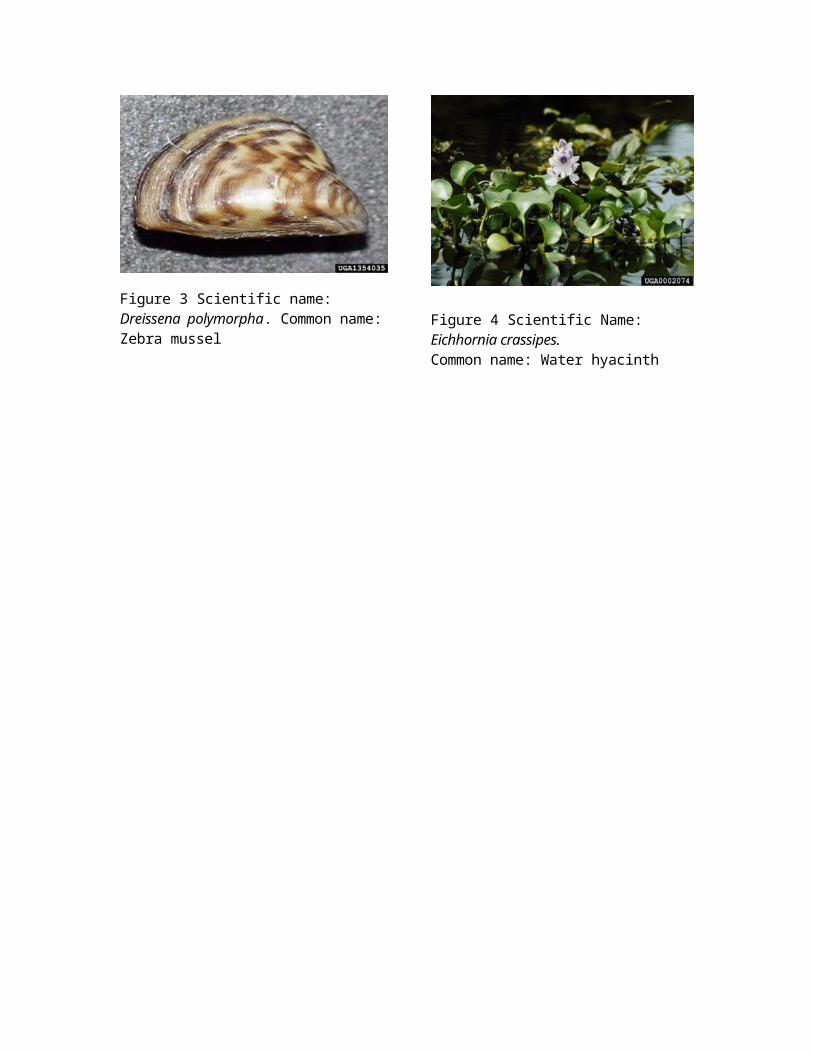
Figure 3 Scientific name: Dreissena polymorpha. Common name: Zebra mussel
Figure 4 Scientific Name: Eichhornia crassipes. Common name: Water hyacinth
Pathways Work Team Conference
Sponsored by:
Richard OrrAssistant Director for International Policy and Prevention
National Invasive Species Council (NISC)1201 Eye Street NW Fifth Floor Room 79
Washington DC. 20005
and
Alan S. GreenExecutive Director, Plant Health Programs
Plant Protection and Quarantine (PPQ)Animal and Plant Health Inspection Service (APHIS)
U.S. Department of Agriculture (USDA)4700 River Road
Riverdale, MD 20737
In Collaboration with theU. S. Department of the Interior
1849 C Street, NW.Washington, DC 20240
and
U.S. Department of Commerce 14th Street and Constitution Avenue, NW.
Washington, DC 20230
A limited number of printed copies are available from:U.S. Department of Agriculture
Animal and Plant Health Inspection ServicePlant Protection and Quarantine
301-734-8412
Electronic copies are available on the Internet through NISC at:http://www.invasivespeciesinfo.gov
2 Report Date: December 2005. Penny Kriesch, USDA/APHIS; Chair Pathways Work Team
TABLE OF CONTENTS
Executive Summary 4
Pathways Work Team 5
CHAPTER 1-DESIGN VERSION 1 6
Phase 1: Assignment 2002 6 Phase 1: System Design 2003 7 Phase 1: Design 1 Report 8Phase 2: Design 1 Field Test 8 Phase 2: Design 1 Field Test Report 8
CHAPTER 2-REDESIGN 11
Conceptual Framework 11Qualitative/Quantitative Assessment 11 Qualitative Assessment 11 Quantitative Assessment 14 In Search of Reliable Data 14 Managing Uncertainty 17
CHAPTER 3- GUIDE VERSION 2 19
Redesign 19Pathway Evaluators 19Stage I: Single Pathway Triage 19 Triage Process 19 Triage Process Chart 20 Triage Results Chart 20Stage 2: Individual Pathway Scope 21 Eco-region Map 22Stage 3: Pathway Characteristics 23Stage 4: Pathway Risk Analysis 23 Uncertainty Factors 23 Risk Assessment Questions 24 Risk Consensus Score 32Stage 5: Invasiveness Scale 33 Stage 6: Situational Modifiers 34
CHAPTER 4-POLICY ACTION 35
From Science to Pathway Policy 35Interpreting Invasiveness Scales 35 NISC and Cross-Agency Analysis 36 Future Assessment Activities 36
APPENDICES 37A: Sponsorship 37 B: Matrix-Agency Strategic Plans 38 C: Contacts List 39 D: Conference Research Materials 48 E: Conference Agenda 49F: Reserved-Predictive Indices 50G: Pathway Categorizations 51 H: Revised Pathway Diagrams 54
3

Executive Summary
This document represents the second version of a guide and process for pathway definition, analysis and prioritization. It is expected that this document will undergo another trial test and revision prior to full implementation, though we strongly believe this is a ‘workable’ product that only requires refinement.
Throughout this systems development process, the Pathways Work Team struggled with several issues relevant to scientific data and public policy. While this report in no way attempts to resolve such intricate issues, it is essential that these considerations be brought to the forefront for future decision-making efforts and as such are enumerated below:
International competitiveness is impacted by invasive species Pathway ranking combines community, government and corporate interests Sound science, transparency and consistency are essential for formulating policy Neutrality is essential in providing scientific advice to decision makers Market and non-market forces must be analyzed for final decisions Invasive species prevention is inherently an international activity Methodology must include public, stakeholder and expert participation Assessment is to provide common perspectives Decisions must occur at individual agency levels Outcome of the process is the characterization of relative risk of pathways Policy makers must devise plans for pathway management, resource leveraging, policy
development, budget decisions and technology transfer/development
In conclusion, the Pathways Work Team strongly supported the position that policy decides the direction to take (with human health, commerce, and then ecosystems being the priorities for ranking), but science must maintain the focus. 1
Penny Kriesch, ChairNational Invasive Species CouncilPrevention CommitteePathways Work Team
1 Source: Arizona State University Consortium for Science, Policy and Outcomes, College of Liberal Arts and Sciences
4

Pathways Work Team
5

Penny Kriesch Agricultural Analyst USDA APHIS
Faith CampbellSenior Policy RepresentativeThe Nature Conservancy
Jeffrey P. FisherEnvironmental and Scientific Affairs AnalystDepartment of State
Susan D. CohenPolicy AnalystUSDA APHIS
Sharon GrossAssistant Program CoordinatorNISC
Pam FullerCenter for Aquatic Resources AnalystUSGS
Jan GilbreathOffice of International Affairs AnalystU.S. Environmental Protection Agency
Vincent GuidaNOAA Fisheries AnalystDepartment of Commerce
Michael HennesseyEntomologist Pathways & Stndrd Team LdrUSDA APHIS
Donald R. MacLeanEnvironmental Quality AnalystU.S. Fish and Wildlife Service
Kathy MetcalfDirector, Maritime AffairsChamber of Shipping of America
Mike RipleyEnvironmental CoordinatorChippewa Ottawa Resource Authority
John L. TeemAquatic Nuisance Species RepresentativeNational Aquaculture Association
Darci VetterOffice of U.S. Trade Representative
Donna L. WestSenior Import SpecialistUSDA APHIS
Alice Wywialowski, Policy Analyst USDA APHIS


CHAPTER 1 – DESIGN VERSION 1
Phase 1: Assignment – 2002
The Invasive Species Pathways Work Team was established in June 2002 by the Invasive Species Advisory Committee to accomplish discreet tasks contained within the National Invasive Species Management Plan. Assignment scope extended to addressing issues related to unintentional introductions of invasive species, specifically addressing those action items numbered 16, 17, and 20, as directly recounted below:
16. Federal agencies will take the following steps to interdict pathways that are recognized as significant sources for the unintentional introduction of invasive species:
a. By July 2001, NOAA, the Coast Guard, Interior, and EPA will sponsor research to develop new technologies for ballast water management, because the current method of ballast water management--ballast water exchange--is recognized as only an interim measure to address non-native species introductions.b. By January 2002, the U.S. Coast Guard will issue standards for approval of ballast water management technologies, because actual deployment of new ballast water technologies on ships is contingent on a standard by which to judge their efficacy.c. By January 2002, USDA will issue additional regulations to further reduce the risk of species introductions via solid wood packing materials.
17. By January 2002, the Council will implement a process for identifying high priority invasive species that are likely to be introduced unintentionally, e.g., Mediterranean fruit fly and brown tree snake, and for which effective mitigation tools are needed.
20. By January 2003, the Council will implement a system for evaluating invasive species pathways and will issue a report identifying, describing in reasonable detail, and ranking those pathways that it believes are the most significant. The report will discuss the most useful tools, methods, and monitoring systems for identifying pathways, including emerging or changing pathways, and for intervening and stopping introductions most efficiently.
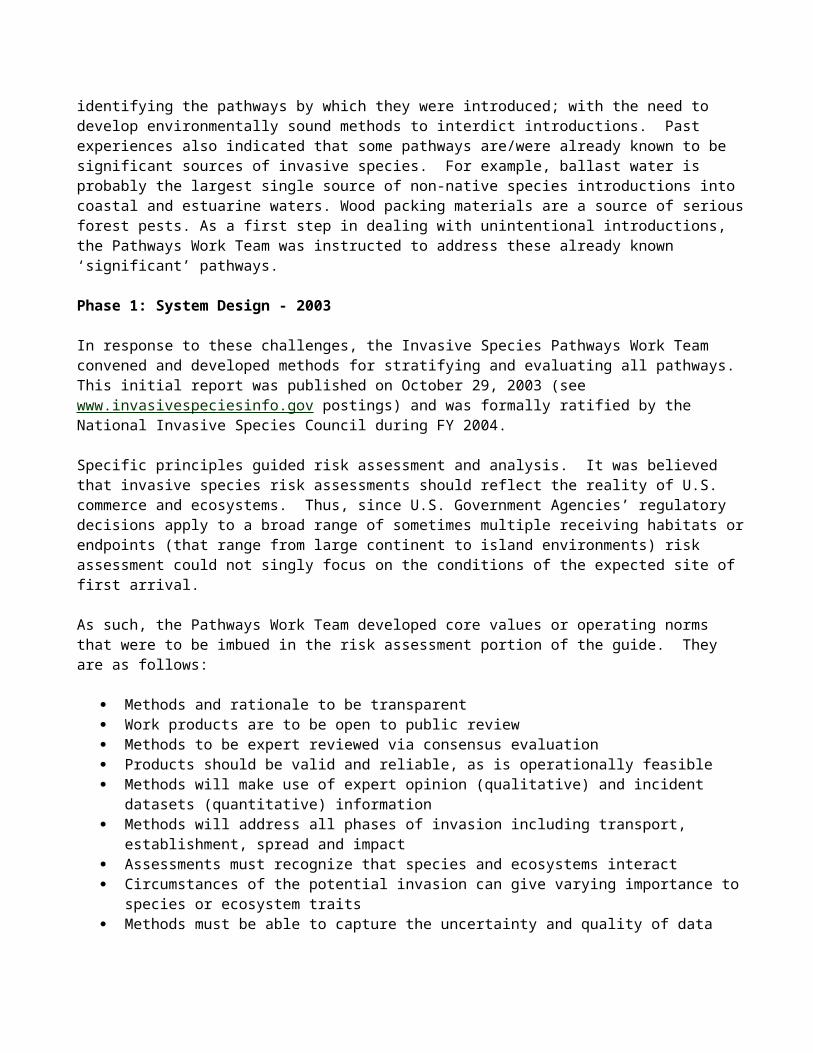
Agency collective experiences indicated the most effective method of preventing unintentional introduction of non-native species was through identifying the pathways by which they were introduced; with the need to develop environmentally sound methods to interdict introductions. Past experiences also indicated that some pathways are/were already known to be significant sources of invasive species. For example, ballast water is probably the largest single source of non-native species introductions into coastal and estuarine waters. Wood packing materials are a source of serious forest pests. As a first step in dealing with unintentional introductions, the Pathways Work Team was instructed to address these already known ‘significant’ pathways.
Phase 1: System Design - 2003
In response to these challenges, the Invasive Species Pathways Work Team convened and developed methods for stratifying and evaluating all pathways. This initial report was published on October 29, 2003 (see www.invasivespeciesinfo.gov postings) and was formally ratified by the National Invasive Species Council during FY 2004.

Specific principles guided risk assessment and analysis. It was believed that invasive species risk assessments should reflect the reality of U.S. commerce and ecosystems. Thus, since U.S. Government Agencies’ regulatory decisions apply to a broad range of sometimes multiple receiving habitats or endpoints (that range from large continent to island environments) risk assessment could not singly focus on the conditions of the expected site of first arrival.
As such, the Pathways Work Team developed core values or operating norms that were to be imbued in the risk assessment portion of the guide. They are as follows:
Methods and rationale to be transparent Work products are to be open to public review Methods to be expert reviewed via consensus evaluation Products should be valid and reliable, as is operationally feasible Methods will make use of expert opinion (qualitative) and incident datasets (quantitative)
information Methods will address all phases of invasion including transport, establishment, spread and
impact Assessments must recognize that species and ecosystems interact Circumstances of the potential invasion can give varying importance to species or ecosystem
traits Methods must be able to capture the uncertainty and quality of data When assessment relies on expert opinion, assessment be clear about the basis of that reliance
and ‘expert’ qualifications Methods must be realistic relative to available resources
It was also expressed that eventual policy decisions regarding pathway priority should meet the following considerations:
Cost of actions should be weighed against benefits Actions should be proactive and take advantage of opportunities Special attention should be given to pathways that are not regulated Pathways should be re-evaluated periodically since risks associated with any particular pathway
can change over time due to changes in magnitude (propagule pressure), changes in sending or receiving ecosystem(s) and other factors
Pathway evaluation should be open and participatory; involving experts and stakeholders. Broad-based involvement gives greater credibility for the finished product
The Pathways Work Team also noted that it is important to prioritize preparation of risk assessments since pathways usually remain open until the risk assessment is concluded. Agencies should conduct risk assessments even if the NISC process of evaluating pathways is not complete.
It was also determined that developed criteria for assessing risk priority depended upon the probability or consequence of introduction. At a minimum, this portion of the assessment should include the factors below:
Pathway magnitude (number of species, inoculation strength and frequency, diversity of species carried via pathway)
Survivability or viability of organisms during transit Likelihood of pathway to transmit invasive species that are difficult to detect or manage during
transit in the pathway Environmental comparability of origin and destination habitats

Ease of spread (via artificial or natural means) once present (i.e., Does it have high reproductive rates? Is it highly mobile? Are there other factors that would facilitate its rapid spread)
Difficulty of control if the species becomes established
Phase 1: Design 1 Report
In synopsis, the Pathways Work Team report of October 2003 presented three major products: (1) scientific and ‘philosophical’ concepts forming the basis to pathway rankings; (2) a pathway factors assessment tool; and (3) exemplar tree-diagrams or charts of pathway constructs (see Chapter 3 and Appendices G and H of this document for updated versions). It was determined at that point, due to limitations on available and accurate quantitative data, assessment would have to be based upon subjective, expert opinion, supported by existing literature and invasive-specific datasets. For risk assessments, it was deemed critical for pathway risk analysts to be able to attend to all relevant taxonomic groups; that jurisdiction was limited to human-assisted movement of organisms; and, that the instrument(s) should be sufficiently flexible to address local to national perspectives, as well as the full range of taxa and pathways. This 2003 report is available on www.invasivespeciesinfo.gov
Phase 2: Design 1 Field Test - 2005
On June 21-22, 2005, the National Invasive Species Council, Pathways Work Team sponsored an Invasive Species Pathways Focus Group Assessment Conference. The Conference was held at USDA APHIS, Oklahoma Memorial Conference Center, Riverdale, Maryland. The objectives of the conference were two-fold: (1) to provide an avenue for Federal, state, tribal governments, industry and academia to jointly analyze three specific pathways that unintentionally introduce invasive species into U.S. ecosystems and (2) to receive evaluative feedback on the validity and efficacy of proposed pathway risk assessment methodology and diagrams.
The following processes were used to achieve conference objectives: (1) convened expert focus groups comprised of government, industry and academic experts to qualitatively evaluate the invasive risk levels associated with air cargo, wood packing material and shipping industry/ballast water pathways (which would address such invasive species as brown tree snake, Asian longhorned beetle and zebra mussels); (2) assessed quantitative pathway risk analysis datasets; and (3) conducted a ‘test’ training session relevant to education of agency personnel on invasiveness species.
The anticipated outcomes from the conference included the following: (1) cross-agency and industry assessment of the threat of invasive species introduced via the specified pathways; (2) evaluation of the validity and efficacy of proposed pathway risk assessment methodologies; and, (3) recommendations on future training and prioritization efforts.
Conference planners intended that results would provide data and resultant analysis to agency decision makers to assist in collaborative efforts such as resource leveraging, targeting of invasive populations, and identification of gaps or inconsistencies between organizations that may inhibit efforts to prevent unintentional introduction of invasive species.
Phase 2: Design 1 Field Test Report
Feedback from these focus groups on the assessment tools, methods and outcomes was highly productive but nearly overwhelming as it forced the Pathways Work Team to reconstruct virtually all pathway assessment methods and tools. As such, activities were deemed successful, as they precluded the implementation of a product in need of significant revisions. A by-product of this

conference was the realization that the assessment tools and methods will be a continually evolving process; as sophistication of tools and supportive datasets improve.
There were a total of 42 conference attendees that participated in two evaluations: (1) critical assessment of pathway tools; and (2) evaluation of the process for administering the tools. Thirty-three participants provided written comments regarding the pathway criteria and ranking processes; thirteen provided feedback on conference processes.
Conclusions were, despite three separate work groups, nearly unanimous in suggested changes. Recommendations are provided below in synopsis format:
The Guide: Overall, the process and use of an assessment guide are supported. However, participants indicated that extensive revisions would be required. Revisions (as described below) fell into one of the 4 categories of: (a) assessment process; (b) assessment tool and questions; (3) diagrams; and (4) evaluation scales:
Assessment Process: It was the general consensus that the assessment tool should be completed by experts on an individual basis, then via focus group procedures. Revised methodology is contained in Chapter 3 of this report.
Assessment Tool: Numerous additions or changes were recommended for the assessment tool - - and were so extensive that field test evaluations of wood packing material, air transport and ballast water cannot be said to be reliable or valid assessments based on conference focus group assessments. This is not to indicate that expert assessments made of the pathways were invalid, just that the tools used must be significantly revised to ensure credibility, validity and reliability. The following is an overview of salient points:
Specific invasive characteristics of a pathway’s start, transition and endpoint(s) must be defined
Geographic and eco-region issues are critical to assessments Questions must be reworded to current assessment, only Questions must contain more defined, specific language Duplication of similar questions must be avoided to preclude unfair weighting of
instrument Uncertainty factors must be more thoroughly assessed Terms and definitions should be included or indicated as same as ISPM Glossary of
Terms Scientific assessment is separate from policy, cost/benefit issues or action plans Pathway characteristics need to be defined and coupled with species-specific invasive
qualities Evaluation should be done by a mix of experts Need more intensive instruction as to how to complete the tools
Diagrams
Suggestions for expanding the diagrams included the following pathways:
military baggage and gear travelers (themselves) pets and animals for entertainment travel/tourism, cut flowers

fruits and vegetable commodities domestic waste streams movement of raw logs within U.S. garbage transport recreational boats and vessels (T12.2) non-food aquaculture animal liberation
Evaluation Scales
Rankings do not provide sufficient complexities for stratifying pathways Scale of severity needs to be established (i.e., what is high versus low) The average of categories doesn’t give value. Need logistic regression analysis Clarification is needed on certainty/uncertainty issues Assessments must be accurate, reliable and predictive in orientation
The Pathways Work Team incorporated/amended all tools and methodologies relative to the above recommendations. However, some of the comments expressed needs that outstripped the current sophistication level of information gathering and management. These recommendations will not be overlooked or ‘lost’ but will have to be deferred to future revisions of the guide and the incorporation of mathematical algorithms or indices into database queries.
CHAPTER 2 - REDESIGN
Conceptual Framework: The underlying conceptual framework and issues posed to the Pathways Work Team group via focus group feedback was: How could NISC promote a methodology and infrastructure for cooperative management of invasive species pathways in a matrix-method that crossed Federal, state, tribal, local, academic and special interest group lines? Subsidiary to this issue was the development of a way to rank risk (i.e., scale of severity) or threat posed by a particular invasive. This determination would bring resolution (at best) or at minimum, prioritization, to competing interests as to which invasive(s) would pose the greatest consensus risk to the entire U.S. populace (i.e., not just a single stakeholder strata). In addition, the ‘consensus on risk’ had to ensure prioritization gave precedent to human health, economy and ecology issues, in respective order.
The work group early recognized that diligence in addressing scientific pathway identification and prioritizing issues are essential; as the ultimate outcome of all these recommendations - - namely the allocation and assignment of Federal resources and programmatic priorities - - was of great consequence to multiple stakeholders.
The national invasive species effort, in tandem with current trends of international collaboration and resource management, must fulfill the role of expert science in policy processes for multi-layered decision-making. The construct of pathway assessments, therefore, had to ‘break new ground’ in developing a methodology that was democratic, transparent, scientifically expert and yet geo-politically sensitive. The methodology had to be sufficiently flexible so that it could be used by various stakeholders on local, regional and national levels; while giving platform for cross-organizational forums for integrated action planning between those with shared national interests on a specific pathway. The end-goal is a full systems-approach to invasive species detection, management and mitigation.
Qualitative and Quantitative Assessment
The International Organization for Standardization defines risk as “the combination of the chance of an event and its consequences” (IOS, 2002). The Pathways Work Team made early agreement that pathway analysis and prioritization would parallel risk assessment (i.e., the scientific evaluation of the biological risks and potential consequences) procedures. In addition, it was decided that questions regarding risk management (i.e., a process of determining appropriate measures to reduce risk) would also be included in assessment data as reduction of risk practices directly impact severity of pathway invasiveness. Ultimately, it was decided that pathway prioritization and analysis was so broad in scope, it would require both quantitative and qualitative methods to give the most accurate assessment based on existing information and expertise.
Qualitative Assessment - The Proposed Process and Tools: As delineated in the opening remarks made by Hilda Diazo-Soltero, USDA Invasive Species Liaison, the purpose of the June 21-22, 2005, Invasive Species Pathways conference was to trial test the process and instruments developed for assessment of national pathways. The processes and tools (recounted below) was the Pathways Work Team’s best attempt at creating a democratic, scientific policy process that utilizes the best practices for qualitative and quantitative assessments; accommodating multi-layered factors and perspectives. Components of the process are further elucidated below: 2
2 See User-Friendly Handbook for Project Evaluation (NSF 93-152) as paraphrased and applied to remainder of section.

Stage 1: Individual Expert Qualitative Review. Initially, individual experts gathered and codified their first-hand information and expertise relative to a specific pathway. In their assessments, the experts openly explored pathway nuances germane to their working environment and orientation. In addition, these experts developed a pathway prioritization based on a ‘full system’ (i.e., full pathway cycle) context. This was particularly important as pathways are viewed as a series of events that may lead to the introduction of an invasive species. The first step of the method (i.e., individual participants first completing the assessment tool, independently) ensured that evaluators adequately represent their particular stakeholder group’s perspectives and issues. (This approach is only effective if participants are well-qualified, content experts.) The questions contained in the assessment tool provided a structured protocol to guide individuals to make thorough observations via a set of targeted concepts and criteria that would be later used for consensus assessment.
Stage 2: Group Expert (Consensus) Qualitative Review. The second stage of evaluation was accomplished by a pathway-specific focus group of experts that represented pathway-specific stakeholder groups. Expert determination was based on professional credentials, organizational liaisons, work history and academic credentials. These focus group reviews, in themselves, provided very different data from individual assessments. They enabled the capturing of multiple consensus perspectives of various stakeholders; creating a common vision or analysis of a specific pathway. This enabled identification of common aspects of a pathway while setting a group forum for addressing related issues.
The pathway focus groups combined elements of both interview and participant observation; while capitalizing on collective group intelligence. Group interaction generated data and insights that most likely would not have emerged through individual evaluation.
Based on conference outcomes, the Pathways Work Team recommends focus groups be limited to 8 to 12 persons; be managed by facilitator; and have a designated official recorder. This meeting format not only is conducive to reviewing the efficacy of the assessment tools and efficacy of quantitative datasets; but is conducive towards the emergence of new ideas.
Guiding the Focus Groups. A challenge for these focus group proceedings was the gleaming of usable, consistent, descriptive statistics for cross-organization and pathway comparison. The assessment tool served as a topic guide to assist focus group facilitators in keeping various perspectives on a unified track. The tool also served as a road map in developing the joint findings and the final report.
Focus Group Facilitation. Focus group participants were asked to reflect on the questions asked by the moderator; were permitted to hear one another’s individual responses and then make additional comments beyond their own original responses. It was neither necessary to reach consensus nor to resolve disagreements as this effort was a ‘field test’ of the tools. The facilitators kept the discussion flowing and ensured that no one or more persons dominated the discussion. 3 in the future, however, the facilitator(s)’ role will be to seek
3 User-Friendly Handbook for Project Evaluation (NSF 93-152).

consensus between participants on pathway risk prioritization (see Chapter 3 of this guide).
Focus Group Construct. It was decided that one group per pathway was essential due to pathway complexities and the subsequent varied expertise required. Though a good rule is to conduct at least two focus groups per pathway to ensure response validity; in that pathways are limited in scope (i.e., a pathway can be succinctly defined and assessed) single focus group assessment were/are deemed sufficient. (This is not to say once evaluated, always evaluated. In fact, it is expected that pathways will be re-assessed, as needed, due to changing conditions.)
Recording Focus Group Data. The procedures for recording focus group sessions were basic. The focus group facilitator was assigned a non-expert person designated as the recorder to take notes on both comments and assessments. A major advantage to this is the recorder focuses on observing and taking notes, while the facilitator concentrates on asking questions, facilitating group interaction, following up on ideas, and making smooth transition from issue to issue. It was understood that these results would be codified in a final report but without individual names or organizations attributed to specific comments.4 (Feedback from conference attendees on use of facilitators/recorders was assessed as highly favorable per a separate evaluative survey).
Other Qualitative Methods - -Document Studies. Though quantitative benchmarks/datasets were researched to assist pathway prioritization, a significant lack of data history caused use of one other method for pathway assessment - - document and scientific studies. Pathway-specific documents were supplied to participants several weeks prior to the conference to provide exemplar pathway cases and to create a common knowledge base for discussion and comparison. Successful, the Pathways Work Team encourages the augmentation of qualitative and quantitative datasets with document studies for all future pathway assessments.
4 User-Friendly Handbook for Project Evaluation (NSF 93-152).

Quantitative
The goal of developing quantitative datasets is to give statistical indicators to aid in assessing the likelihood of invasive species entry or occurrence, establishment or spread of a pest or disease within the territory, phytosanitary measures which might be applied, and the associated potential biological and economic consequences or the evaluation of the potential for adverse effects on human or animal health. Assessment should first be rooted in the unmitigated (unmanaged) pest or disease risk but then modified to address mitigation/management practices. Biological, economic or ecosystem consequences should also be addressed, but in terms of merging risk ‘science’ with policy decisions.
Specific risk factors for quantitative assessment included such factors as the following
Prevalence of a pest or disease agent in the exporting area Geographic and environmental characteristics; Sanitary and phytosanitary status of the adjoining or neighboring areas Trading partners and practices Regulatory infrastructure of the exporting country Invasive species surveillance and monitoring system(s) Pest or disease agent survival rate in transit Interception data Invasive species destination risk factors such as likelihood and consequences of a
particular pest or disease agent surviving, multiplying, establishing and spreading in the territory of the importing country
Uncertainty about the organisms, the human error factor, or methods used Distribution of the commodity or vectoring agents Availability of susceptible hosts and/or competent vectors
The relevant economic factors include:
The potential damage due to loss of production or sales in the event of the entry, establishment or spread of a pest or disease
The cost of control and eradication The relative cost-effectiveness of risk mitigation strategies Cost-benefit analysis of mitigation versus consequence of introduction
As previously indicated, quantitative data was unavailable, sporadic or incomplete. The Pathways Work Team could not, therefore, statistically define acceptable levels of risk but rather had to create evaluative scales of relative risk for pathway analysis. The Team recommended a special work group to be convened to develop statistical indices at a later date.
Qualitative vs. Quantitative: The Search for Reliable Data
The qualitative approach primarily uses categorical values for inputs and outputs. The input variables were then assigned a particular ranking such as low, moderate, or high risk. The Team also found that due to a lack of valid, consistent datasets, pathway analysis would have to rely more heavily upon qualitative (i.e., expert) opinion. It is anticipated as data collection and predictive indices increase in sophistication, there will be a shift towards more quantitative analysis - -but this shift will only result after several edifications or ‘design evolvements’ of this process. The complexities yet potential benefits expressed by participants regarding quantitative assessments were extensive and call for future statistics-based program development. The section below, written by Laura Biven, (PhD, Applied

Mathematics, Advisor to Pathways Work Team) elucidates these future challenges. The Team welcomes comments, feedback and discussion on the concepts posed in the paper, below.
In Search of an Objective Measure of Pathway RiskAny risk assessment process has two key components 1) identifying a projected outcome and 2) assessing the likelihood of that outcome being realized. In the case of assessing the risk posed by potential invasive species, this can be broken down further into the following three components:
1) The likelihood of introduction2) The likelihood of establishment3) The magnitude of damage
The likelihood of introduction can be quantified for a particular species and well defined pathway. This measure can be objective in so far as the total likelihood is based on the individual probabilities that the species follows each stage of the pathway. The caveat is that it is the risk assessor who identifies the various stages and assigns their relative importance. Errors in this measure (and they may be considerable) are mostly due to the lack of accurate information about the various stages of the pathway (e.g., infection rates; likelihood of incidental infestations of cargo; efficacy of natural and artificial mitigations, etc).
The likelihood of establishment can be estimated for a particular species and target habitat. Estimates are usually semi-quantitative (high, medium or low) and are inaccurate, not for lack of information, but because the establishment of a species is critically dependent on a large and unknown set of variables. Starlings, for instance, were introduced into Central Park in New York City eight times. Only two of these populations established.
The magnitude of damage resulting from the establishment of a particular species can be assessed by considering each affected commodity (e.g., the environment; human or animal populations; agricultural crops , etc). These estimates are often quantified as dollar amounts but are nonetheless inherently subjective or, at least, dependent on cultural values. It is the risk assessor or community that decides how to assess the relative value of human health and freedom from trade barriers, for example. Expressing these values as dollar amounts is simply a useful tool for recording these decisions.
Objectivity is a Question of Detail
In searching for an objective measure of pathway risk, we must content ourselves with objective measures of 1 and 2: the likelihoods of introduction and establishment. It’s worth noting that objectivity of these measures does not imply that the measures must be quantitative and, conversely, a quantitative measure is not necessarily objective. Indeed, it is relatively unimportant whether the measure is quantitative or qualitative. Of much more importance is the accuracy of the information on which the assessment is based.
All of the steps for assessing the risk of invasive species, above, place strict requirements on the level of detail needed in the definition of species and pathway (including pathway origin and target habitat). It is unrealistic, however, to perform risk assessments on all species/pathway combinations on a national scale. For this reason, the Pathways Work Team has defined a number of pathway categories (these are referred to as “pathways” although may be better thought of as collections of pathways or pathway categories).2 The task of assessing the risk of pathway categories necessarily has two levels of detail: The first is the level of detail required to accurately assess risk as outlined in the steps 1—3 above. The second is the more general level on which pathway categories are defined.

Any assignment of risk to a category of pathway is necessarily a summary of the underlying specific species/ pathway risks. The summary may be the mean risk of the group or the maximum risk value or some other summarizing measure. Any summary, however, constitutes a loss of information. The mean value can mask high risk elements in the group whereas the maximum risk value loses information about the absolute potential for damage. Sensitivity analyses of the risk of particular species/ pathway combinations show that the value of risk depends critically on the details of the target habitat, season of introduction, species type, etc. The value of risk for two elements in the same category are almost surely unrelated, therefore. This lack of correlation among elements in the pathway category furthers the argument against assigning a single value of risk to the category.
When considering a pathway category, there are two possibilities for the available data: I. Data exist (quantitative or qualitative) about specific species, pathways, origins, target habitats or
combinations of these. Perhaps a pest risk assessment has been done for a particular species/ pathway combination that falls under this category. Perhaps there is only anecdotal evidence of a particular species entering via the pathway. In any case, the information will be about specific elements of the pathway category under consideration. Information of this type can be relevant for assessing the likelihood of introduction and/or the likelihood of establishment.
II. No such data exist or are available. Perhaps the pathway has never before been studied or no reliable conclusions have resulted from the study. In this case, assessment of the likelihood of introduction without further analysis is largely guesswork. Assessing the likelihood of establishment, given the introduction of a particular species, may be estimated with a predictive screening method with full understanding of the limitations of these methods.
Methods for Assessing Likelihood
Assessing the likelihood of introducing a species differs depending on the details of the species and pathway in consideration. The method of diagramming the pathway and assessing the probability that some number of individuals of the species survives each stage of the pathway is well documented.3
Assessing the likelihood of establishment is a difficult task and many different approaches are possible, each with their pros and cons and underlying assumptions. What follows are evaluations of a selection of the methods available.
Gather of information about known species present in the pathway. There are many (although insufficient) web accessible databases which contain information about invasive species; possible invasives; their modes of entry and spread in the US; their native habitats and means of reproduction.4 Most of these databases deal with plant species.
Calculation of the overall flux of species through the pathway per year or per transport event. Under the assumption that the number of invasive species present in a pathway is directly related to the total number of species in the pathway, this is one way to estimate the number of invasive species present in the pathway. Finding the data to perform this calculation may be difficult and incur large errors. Comparing pathways based on this measure is meaningless unless the species under consideration are similar.
Use of Predictive Screening Methods to Assess Invasiveness of Species. Under the assumption that particular characteristics of a species can determine its likelihood to be invasive, there are a number of models which seek to identify these characteristics for a narrow enough class of species. The invasiveness of the genus Pinus in North America has been linked to characteristics of mean seed mass and minimum juvenile period, for example5. These methods tend to develop cautious criteria. The emphasis is on correctly diagnosing a species as invasive while some non-invasives may be misdiagnosed as invasive. The only criterion consistently linked with invasiveness of plant species and broadly accepted in the professional communities is whether or not the species is invasive in any other environment.
Use of Predictive Screening Methods to Assess Invasibility of Habitats. Similar predictive screening models exist to predict the likelihood of certain ecosystems being invaded by non-native species, usually plants. Disturbed ecosystems have been associated with invasibility, for example.6 These models are not uniformly accepted in detail although the premise that an ecosystem may be more or less inherently vulnerable to invasions has broad consensus support.

Managing Uncertainty
Reduction of uncertainty has always been the central goal of any scientific effort. Uncertainty may result from a range of issues such as follow:
flaws in methodology (i.e., measurement errors or lack of knowledge of the steps or elements of risk evaluation);
lack of expertise, coherence or error on part of risk assessor, biological unknowns of the invasive organisms/pathways;
insufficient information (i.e., lack of accurate/precise knowledge of the input values); or political impediments.
What is critical to realize is that uncertainty need not be an impediment to resolution of an issue. The risk perspectives developed are based upon the state of scientific understanding of the pathway at a particular time - - and reflect a state of confidence in that understanding. Culture, organization, educative norms or values may directly impact the level of uncertainty a risk assessor may experience, but the process for pathway risk analysis must ‘overcome’ these obstacles to create action.
Notes on the use of the Survey: The survey developed by the Pathways Work Team solicits justified (through citations in the literature, first hand accounts etc.) expert opinion. Results from individual surveys are essentially subjective. Results from a collection of surveys depend on the variety and number of experts participating as well as the breadth of their collective and individual expertise. There is some reason to believe, however, that the spectrum of information gleaned from a large and diverse enough group of experts is objective in the sense that it is reproducible—the results from a different but similar group of experts would extract the same information. More tests with this tool need to be completed to support this belief, however.
Pathway Risk Assessment Do’s and Don’ts
DO NOT summarize risk information about individual species/pathway combinations to assign a single numeric value of risk to a pathway category. Some synthesis of this information is necessary to compare the relative importance of pathway categories, but this process cannot be formulaic and is necessarily subjective.
DO look at information about individual species and pathways in the category and determine the quality of the information source (published records, informed opinion, anecdote, etc.)
DO Use predictive screening where possible but only with a full understanding of the assumptions involved and quality of data used.
See the review article “Reducing the risks of nonindigenous species introduction” by Jennifer L. Ruesnink and Ingrid M. Parker, Bioscience, Vo. 45 Issues 7, p. 465 (Jul/Aug 1995) which cites Phillips, J.C. “Wild birds introduced or transplanted in North America” USDA Technical Bulletin No. 61. US Department of Agriculture (1928)2 See Pathways Diagrams in Report Appendices.3See, for example, “Guidelines for Pathway-Initiated Pest Risk Assessments” .US Department of Agriculture, APHIS, PPQ. (October 17, 2000)4A comprehensive list is contained in “Invasive Species Databases—Proceedings of a Workshop” Charles Valentine Riley Memorial Foundation, 1999. See also http://www.nbii.gov/search/sitemap.html 5 Rejmánek, M. and Richardson, D.M. “What Attributes Make Some Plant Species More Invasive?” Ecology, 77(6) (1996) pp. 1655-1661. See also Reichard, S.H. and Hamilton, C.W. “Predicting Invasions of Woody Plants Introduced into North America” Conservation Biology, Vol. 11 No. 1 (1997) pp. 193-2036 See Rejmánek, M., Richardson, D.M. and Pyšek, P. “Plant Invasions and Invasibility of Plant Communities” in “Vegetation Ecology” Edited by E.v.d.Maarel, Blackwell Publishing (2005) for a review.

As such, the Pathways Work Team decided the assessment process must characterize the nature of uncertainty each assessor may have (on a per question basis) with a requirement for assessors to devise a strategy to either reduce the uncertainty associated with the question, or a method to assess the pathway, with acceptable levels of uncertainty tolerated.
It is anticipated that individual uncertainty issues will be minimized or ameliorated through the secondary, consensus process whereby broader range (e.g., group) expertise, experience and knowledge will be incorporated into final factor assessment. It is understood that group expertise will replace individual uncertainty factors; and that if there is general consensus of uncertainty on a particular risk factor, the group may elect to raise or lower the risk ‘score’ of a pathway based upon extrapolated reasoning. Risk assessment is not an absolute, but a relative ‘equation’.
Pathway analysis is in a sense, a way of democratizing science; as the end goals are transparency, attention to specific scientific and technological outputs and development of human socio-political (i.e., government) structures. The processes devised must be rigorous, relevant and participatory. It is important evaluators accept that most important decisions are made with a degree of uncertainty; but actions in light of uncertainty are justified by a high level of commitment to set goals, values and actions. Policy decisions are based on what the future should look like for particular groups with an underlying acknowledgement that realities may modify those future goals. Policy sets the direction to take, but science creates and maintains the focus.5
5 Source: Arizona State University Consortium for Science, Policy and Outcomes, College of Liberal Arts and Sciences

CHAPTER 3 – THE GUIDE VERSION 2
The Redesign
The focus groups called for considerable restructuring of the pathway assessment tool. What was recommended was the need to develop a three-tiered methodology that adequately addressed policy direction, risk science and interagency action planning. This methodology had to ensure that the priorities of first, human health, second economy, and then ecology (as defined in National Invasive Species Management Plan) were accommodated.
Within the above recommended framework, the focus groups challenged the Pathways Work Team to also devise a method to determine which individual pathway(s) to first assess. There were concerns over unknown pathways; false perceptions over severity or ‘innocuous’ nature of pathways; or that the current instrument would result in little differentiation over pathway risk. As such, and after great discussion on weighting particular factors and creating scales of severity, the following phased assessment is proposed. This method has not been tested via focus groups and should be trial tested with appropriate revisions prior to full implementation.
Pathway Evaluators: As defined previously, pathway prioritization is matter for program experts. It is important to gather together a team of individuals who can appropriately accomplish all tasks below. At a minimum, a pathway assessment expert team list should be compiled that includes information as to the experts’ name, organization/associations, areas of specialty, published papers, academic background, related work history and contact information.
The segment of this report that serves as an instructional guide to pathway definition and prioritization begins on the next page for ease of use (i.e., removal from)
the remainder of the conference report.

Stage I: Multiple Pathway Triage
An initial question arose: How should agencies determine which pathway should first be evaluated? What appeared to be a simple question was in actuality, a complicated one, expressing the need for a preliminary triage approach to pathway prioritization. Restated, stakeholders asked the following:
“How do we prioritize resources dedicated to the evaluation of invasive species in light of multiple competing pathway interests and yet to be determined pathway risk levels?
The Pathways Work Team strongly felt that triage should be directly relevant to agency mission and strategic priorities. Therefore at Stage 1, an agency-based group of two or more invasive species ‘generalists’ are asked to convene to conduct the following preliminary evaluation:
Triage Process
Step 1: Review the inventory list/diagrams of all invasive species pathways; adding any pathways to the list that may be undefined (see Appendix G for list). Briefly define the pathway particulars (i.e., start point, endpoint, transitions, any materials, agents, etc., that could vector invasives).
Step 2: Define agency mission, functions and responsibilities relative to invasive species pathways
Step 3: Select and list all pathways that are pertinent to the agency’s mission
Step 4: Indicate, briefly, what particular invasives are associated with each pathway. A list of potential invasive species categories is provided below:
All hitchhiking organisms All aquatic organisms Fouling organisms (e.g., organisms that attach to boats, pilings, platforms, etc.) Arthropods (e.g., insects, arachnids, crustaceans, etc.) Mollusks (e.g., giant African snails, zebra mussels, etc.) Plants and plant propagules (e.g., water hyacinth, Russian knapweed, etc.) Plant pathogens (e.g., sudden oak death, etc.) Phytoplankton (e.g., Amphidinium, dinoflagellates, etc.) Vertebrates (e.g., snakeheads, gavials, rats, brown tree snakes, etc.) Human and animal parasites (e.g., liver flukes, etc.) Human and animal pathogens (e.g.,. salmonella, West Nile virus, foot and mouth disease,
SARS, etc.)

Step 5: Assign each listed pathway to a threat level. The threat levels are defined as:
Threat Level A - - the pathway currently transmits an invasive species that poses a direct threat to human health
Threat Level B - - the pathway currently transmits an invasive species that poses a direct threat to economic systems
Threat Level C - - the pathway currently transmits an invasive species that poses a direct threat to ecological climes.
Note: By definition, an invasive species must fall within one of the above three categories. New species or exotics are continually entering the country via these selfsame pathways. But if they do not pose a threat, they do not meet the definition of invasive, for these purposes.
Though some pathways may pose more than one level of threat, this is a rough cut hierarchical assessment and therefore only one value, the most pernicious (i.e., human health, then economy, and finally ecology) may be assigned. As a frame of reference, ballast water carrying cholera that dumps directly into drinking water would be a threat level of A. Whereas that same water, if dumped into a stream that is not used for any human or business purposes (i.e., where cholera contamination would not impact health or economics), then the threat level could be C - - or could even possibly result in the determination that in the particular circumstance (or receiving point), it would not even be considered invasive.
Triage Process Chart 1.Pathway Name 2. Agency
Mission & Functions
3. Mission Related IS Pathways & Description
4. Invasive Transmitted via Pathway
5. Threat Level
T 1 Transportation T1.1 Air T1.2 Water, Aquatic T1.2.1 Ballast Water T1.2.2 Hull/Surface T1/2.3 Stowaways T1.2.4 Superstructures T1.2.5 Transportation Relocation of Dredge
U.S. Coast Guard protects the public, environment & U.S. economic interests in ports, waterways, along the coast, on international waters, or in any maritime region
T1.2.1 Ship Ballast Water-Cargo ship that begins voyage in Kusadasi, with endpoint NYC.
AmphidiniumCholera
A (Human Health First Priority)
T1.2.2 Hull/Surface Fouling. Cruise ship start point Miami, to Jamaica and Return
Zebra Mussels
B (Economy Second Priority)
T1.2.5 Dredge RelocationBarge traveling from Hawaii to Oregon
Water hyacinth
C (Ecology Third priority)
(Note: this is only an example and does not reflect full or accurate range of invasive species or pathway analysis for U.S. Coast Guard).
The result of this triage is a prioritized list to determine which pathways to first assess. In this case, ship ballast water is first, followed by hull fouling, then dredge relocation.

Stage II: Single Pathway Risk Assessment (By Individual then Focus Group Review)
There are four steps to Single Pathway Risk Assessment: (1) pathway definition, (2) pathway scope; (3) pathway risk level; (4) pathway risk score.
[The steps contained in Stages II and III are to first be completed by individual experts, independently. These independent assessments are then to be used by the experts as background information for completion of a single focus group consensus decision for Stages II and III. ]
1) Step 1: Indepth Pathway Definition. At this stage, it is critical to DEFINE, not analyze, the characteristics of the pathway. Pathway definition includes the following:
a) Define the start point of the pathway, including all physical, geographical, ecological, etc., characteristics relevant to pathway invasiveness (i.e., ship starting at shipyard loading dock in Charleston, North Carolina where wood packing material originating from the U.S. is being used to transport motor parts).
b) Define any intermediary stop points (i.e., ship docks in New York City but crates remain on hold. Ship then travels to Miami, Florida)
c) Define endpoint of the pathway (i.e., crates are off-loaded at Miami port. Wood packing material is destroyed via wood chipper and motor parts distributed via truck to local stores).
d) Specifically define all invasives may be considered for pathway analysis. These include invasives from the following exemplar categories:i) All hitchhiking organismsii) All aquatic organismsiii) Fouling organisms (e.g., organisms that attach to boats, pilings, platforms, etc.)iv) Arthropods (e.g., insects, arachnids, crustaceans, etc.)v) Mollusks (e.g., giant African snails, zebra mussels, etc.)vi) Plants and plant propagules (e.g., water hyacinth, Russian knapweed, etc.)vii) Plant pathogens (e.g., sudden oak death, etc.)viii) Phytoplankton (e.g., Amphidinium, dinoflagellates, etc.)ix) Vertebrates (e.g., snakeheads, gavials, rats, brown tree snakes, etc.)x) Human and animal parasites (e.g., liver flukes, etc.)xi) Human and animal pathogens (e.g.,. salmonella, West Nile virus, foot and mouth disease,
SARS, etc.)
Pathway definitions should be brief, narratives or lists that give succinct facts (not opinion) regarding pathway characteristics. Defined characteristics for this pathway are:
Pathway Title ______________________(Description Follows)______________________
___________________________________________________________________________
___________________________________________________________________________
___________________________________________________________________________
___________________________________________________________________________

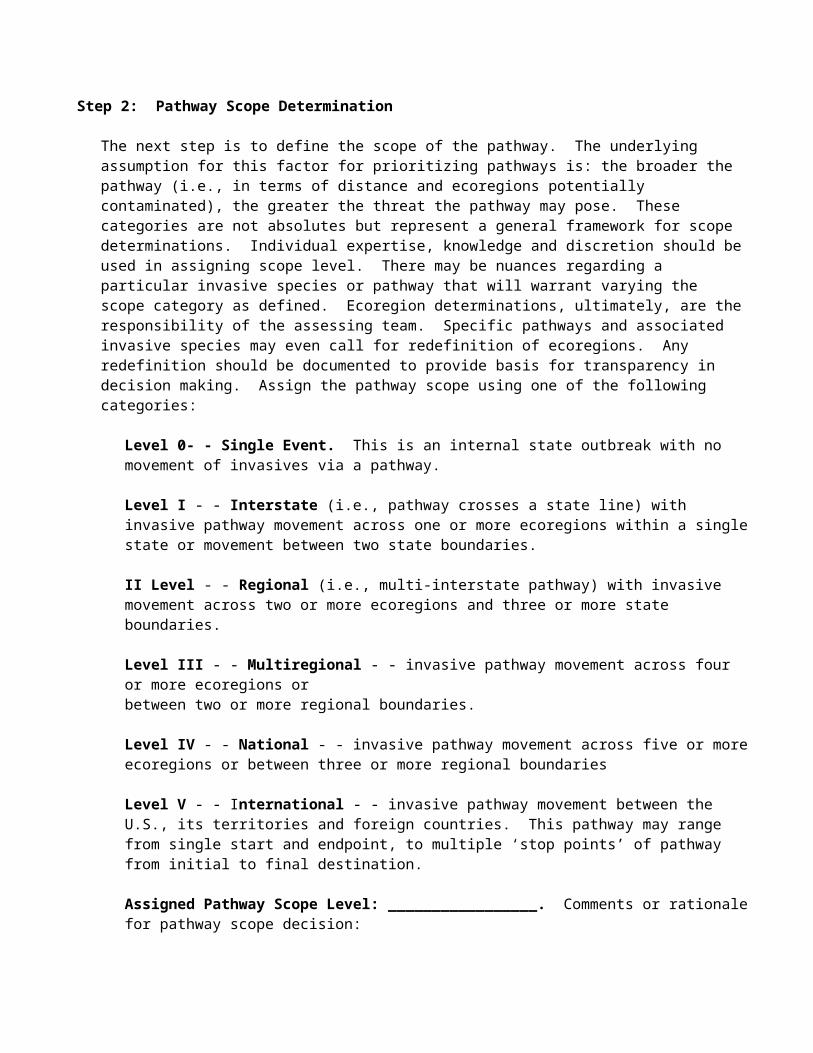
2) Step 2: Pathway Scope Determination
The next step is to define the scope of the pathway. The underlying assumption for this factor for prioritizing pathways is: the broader the pathway (i.e., in terms of distance and ecoregions potentially contaminated), the greater the threat the pathway may pose. These categories are not absolutes but represent a general framework for scope determinations. Individual expertise, knowledge and discretion should be used in assigning scope level. There may be nuances regarding a particular invasive species or pathway that will warrant varying the scope category as defined. Ecoregion determinations, ultimately, are the responsibility of the assessing team. Specific pathways and associated invasive species may even call for redefinition of ecoregions. Any redefinition should be documented to provide basis for transparency in decision making. Assign the pathway scope using one of the following categories:
Level 0- - Single Event. This is an internal state outbreak with no movement of invasives via a pathway.
Level I - - Interstate (i.e., pathway crosses a state line) with invasive pathway movement across one or more ecoregions within a single state or movement between two state boundaries.
II Level - - Regional (i.e., multi-interstate pathway) with invasive movement across two or more ecoregions and three or more state boundaries.
Level III - - Multiregional - - invasive pathway movement across four or more ecoregions or between two or more regional boundaries.
Level IV - - National - - invasive pathway movement across five or more ecoregions or between three or more regional boundaries
Level V - - International - - invasive pathway movement between the U.S., its territories and foreign countries. This pathway may range from single start and endpoint, to multiple ‘stop points’ of pathway from initial to final destination.
Assigned Pathway Scope Level: _________________. Comments or rationale for pathway scope decision:
__________________________________________________________________
__________________________________________________________________
__________________________________________________________________
___________________________________________________________________
For the purposes of example and reference The Pathways Work Team has provided
the following graphic depiction ofpathway related ecoregions produced by
U.S. Geological Survey, www.nationalatlas.gov

Invasive Species Pathway Scope Ecoregion Map
Level 0. Single Event. This is an internal state outbreak with no movement of invasives via a pathway. Level I. Interstate (i.e., pathway crosses a state line) with invasive pathway movement across one or more ecoregions within a single state or movement between two state boundaries.Level II. Regional (i.e., multi-interstate pathway) with invasive movement across two or more ecoregions and three or more state boundaries.Level III. Multiregional - - invasive pathway movement across four or more ecoregions or between two or more regional boundaries.Level IV. National- - invasive pathway movement across five or more ecoregions or between three or more regional boundariesLevel V. International - - invasive pathway movement between U.S., its territories and foreign countries. This pathway may range from single start and endpoint, to multiple ‘stop points’ of pathway from initial to final destination.

3) Step 3: Pathway Risk Level Analysis (Question-Based)
Step 3 is the portion of pathway assessment where risk experts form a science-based decision regarding the risks posed by a pathway. This assessment represents the ‘third cut’ in prioritizing pathways. Expert opinions are to be supported by quantitative datasets, expert literature and scientific expertise. Pathway complexities and characteristics are in constant change and flux - -motivated by shifting trade and market patterns. As such, though future pathway risk assessments will strive for greater quantifiable or formulaic assessments, expert opinion will remain the key source of pathway risk determinations. Risk decisions are guided by response to the following set of pre-determined analysis questions.
Each question (again, a single/consensus response in whole numbers) must be answered. The questions are geared to address such issues as probability of introduction, probability of establishment, history of invasiveness, available mitigation methods and invasive impacts. Issues regarding action planning, policy and political implications for the invasives are not part of this scientific risk assessment phase but rather will be covered in the last portion, Invasive Species response, action planning and communication efforts.
Uncertainty Factor. During this process, evaluators must accept the existence of varying degrees of uncertainty. It is expected for all reviewers, even in light of the uncertainty, to come to a single/consensus whole number score for each question. If uncertainty exists, the basis for that uncertainty must be defined. Pathway analysts must give character to the uncertainty, using such rationale as exampled below:
Uncertainty exists due to:
flaws in methodology (i.e., measurement errors or lack of knowledge of the steps or elements of risk evaluation)
lack of expertise, coherence or error on part of risk assessor, biological unknowns of the invasive organisms/pathways
insufficient information (i.e., lack of accurate or precise knowledge of the input values), or
political impediments
The segment of this chapter that serves as guided questions for pathways risk analysis begins on the next page for ease of use.

Question 1: What is the pathway’s history for frequency of introducing invasive species?(Frame of Reference: Extremely High frequency ranking is defined, in relative terms, as introducing invasives that have had either human health pandemic implications, have caused serious economic impacts on major industries or have introduced invasives that negatively impacted numerous ecological niches).
Level Nbr Level Descriptor Level Determination (i.e., 0,1,2,3,4, or 5) (Assign a whole number):
Level 0 No Risk RationaleLevel 1 Extremely Low Level of RiskLevel 2 Moderately Low Level of RiskLevel 3 Medium Level of RiskLevel 4 Moderately High Level of RiskLevel 5 Extremely High Level of Risk
Is there uncertainty regarding this rating? If so, please complete the chart below:Basis of Uncertainty Check All
RelevantUncertainty level (Assign whole nbr from 0-5 where 1= slightly uncertain; 5= highly uncertain)
Flaws in methodology RationaleLack of expertiseLack of coherence on issueBiological unknowns Insufficient information Political impedimentsOther-Define
Question 2: What level (0-5) of viable invasive species does this pathway transport? (Frame of Reference: Extremely High (i.e., ranking of 5) infers a pathway capable of transferring 100 or more viable invasives species in a single event).Level Nbr Level Descriptor Level Determination (i.e., 0,1,2,3,4, or 5)
(Assign a whole number):Level 0 No Risk RationaleLevel 1 Extremely Low Level of RiskLevel 2 Moderately Low Level of RiskLevel 3 Medium Level of RiskLevel 4 Moderately High Level of RiskLevel 5 Extremely High Level of Risk
Is there uncertainty regarding this rating? If so, please complete the chart below:Basis of Uncertainty Check All
RelevantUncertainty level (Assign whole nbr from 0-5 where 1= slightly uncertain; 5= highly uncertain)
Flaws in methodology RationaleLack of expertiseLack of coherence on issueBiological unknowns Insufficient information Political impedimentsOther-Define
Question 3: What level (0-5) quantifies the number of viable specimens per invasive species transmitted via that pathway? (Frame of Reference: Extremely High infers the pathway transmits numerous [i.e. 100 plus) viable populations that can readily be established. Extremely low infers that only 1-2 specimens capable of establishment/reproduction are transmitted.Level Nbr Level Descriptor Level Determination (i.e., 0,1,2,3,4, or 5)
(Assign a whole number):Level 0 No Risk RationaleLevel 1 Extremely Low Level of RiskLevel 2 Moderately Low Level of RiskLevel 3 Medium Level of RiskLevel 4 Moderately High Level of RiskLevel 5 Extremely High Level of Risk
Is there uncertainty regarding this rating? If so, please complete the chart below:Basis of Uncertainty Check All
RelevantUncertainty level (Assign whole nbr from 0-5 where 1= slightly uncertain; 5= highly uncertain)
Flaws in methodology RationaleLack of expertiseLack of coherence on issueBiological unknowns Insufficient information Political impedimentsOther-Define
Question 4: Based on the specific invasive species transmitted via this pathway, what is the relative level of risk (0-5) of establishment based upon the receiving endpoint (s) of the pathway (i.e., does the pathway introduce organisms into hospitable environments? (Frame of Reference: A rating of 0 indicates the environment does not permit any establishment of the invasive species. A rating of 5 indicates the environment is a perfect match for the invasive species’ natural habitat with plentiful food sources and no natural predators or ecosystem controls).Level Nbr Level Descriptor Level Determination (i.e., 0,1,2,3,4, or 5)
(Assign a whole number):Level 0 No Risk RationaleLevel 1 Extremely Low Level of RiskLevel 2 Moderately Low Level of RiskLevel 3 Medium Level of RiskLevel 4 Moderately High Level of RiskLevel 5 Extremely High Level of Risk
Is there uncertainty regarding this rating? If so, please complete the chart below:Basis of Uncertainty Check All
RelevantUncertainty level (Assign whole nbr from 0-5 where 1= slightly uncertain; 5= highly uncertain)
Flaws in methodology RationaleLack of expertiseLack of coherence on issueBiological unknowns Insufficient information Political impediments

Other-DefineQuestion 5: What is level or amount of invasive species environments harbored by the pathway that would enhance viability of and opportunity for transmission of invasive species? (Frame of Reference: Is there pathway substrate, trade material, or cargo? Does this volume represent high/ medium low levels of incoming material for the pathway assessed?)Level Nbr Level Descriptor Level Determination (i.e., 0,1,2,3,4, or 5)
(Assign a whole number):Level 0 No Risk RationaleLevel 1 Extremely Low Level of RiskLevel 2 Moderately Low Level of RiskLevel 3 Medium Level of RiskLevel 4 Moderately High Level of RiskLevel 5 Extremely High Level of Risk
Is there uncertainty regarding this rating? If so, please complete the chart below:Basis of Uncertainty Check All
RelevantUncertainty level (Assign whole nbr from 0-5 where 1= slightly uncertain; 5= highly uncertain)
Flaws in methodology RationaleLack of expertiseLack of coherence on issueBiological unknowns Insufficient information Political impedimentsOther-Define
Question 6: What is the level of invasive opportunities (1-5) posed by this pathway due to the number of potential invasive species entry points (i.e., single or multiple destination/transfer points)? (Frame of Reference: A level 5 ranking infers multiple entry points (4 or more) that expand across the entire nation; whereas a level 1 assessment infers single, localized entry point with minimal opportunity for invasion)Level Nbr Level Descriptor Level Determination (i.e., 0,1,2,3,4, or 5)
(Assign a whole number):Level 0 No Risk RationaleLevel 1 Extremely Low Level of RiskLevel 2 Moderately Low Level of RiskLevel 3 Medium Level of RiskLevel 4 Moderately High Level of RiskLevel 5 Extremely High Level of Risk
Is there uncertainty regarding this rating? If so, please complete the chart below:Basis of Uncertainty Check All
RelevantUncertainty level (Assign whole nbr from 0-5 where 1= slightly uncertain; 5= highly uncertain)
Flaws in methodology RationaleLack of expertiseLack of coherence on issueBiological unknowns Insufficient information

Political impedimentsOther-Define

Question 7: How hospitable to invasive organisms is the pathway? (Frame of Reference: A rating of zero (0) means all invasive organisms are dead upon arrival; 3 = most of the invasive species that entered the pathway are still reproductively viable; 5 = invasive species are thriving in transit and have expanded populations, colonies or have enhanced their invasiveness capabilities).Level Nbr Level Descriptor Level Determination (i.e., 0,1,2,3,4, or 5)
(Assign a whole number):Level 0 No Risk RationaleLevel 1 Extremely Low Level of RiskLevel 2 Moderately Low Level of RiskLevel 3 Medium Level of RiskLevel 4 Moderately High Level of RiskLevel 5 Extremely High Level of Risk
Is there uncertainty regarding this rating? If so, please complete the chart below:Basis of Uncertainty Check All
RelevantUncertainty level (Assign whole nbr from 0-5 where 1= slightly uncertain; 5= highly uncertain)
Flaws in methodology RationaleLack of expertiseLack of coherence on issueBiological unknowns Insufficient information Political impedimentsOther-Define
Question 8: What is the level or opportunities (0-5) for the pathway to facilitate spread to uncontaminated shipments during transport or during storage before/after transport (e.g., are shipments commingled and is cross-contamination a possibility)? (Frame of Reference: A rating of 5 = 100% likelihood of co-mingled/cross contamination to uncontaminated hospitable shipments during transport or via pre/post transport/storage resulting in absolute dispersion of invasive species.) Level Nbr Level Descriptor Level Determination (i.e., 0,1,2,3,4, or 5)
(Assign a whole number):Level 0 No Risk RationaleLevel 1 Extremely Low Level of RiskLevel 2 Moderately Low Level of RiskLevel 3 Medium Level of RiskLevel 4 Moderately High Level of RiskLevel 5 Extremely High Level of Risk
Is there uncertainty regarding this rating? If so, please complete the chart below:Basis of Uncertainty Check All
RelevantUncertainty level (Assign whole nbr from 0-5 where 1= slightly uncertain; 5= highly uncertain)
Flaws in methodology RationaleLack of expertiseLack of coherence on issueBiological unknowns Insufficient information Political impediments

Other-DefineQuestion 9: What is the level of prescreening effectiveness (e.g. detection) of invasive species prior to or during transport via this pathway? (Frame of Reference: A rating of zero (0) equals indicates that virtually all invasives are detected and mitigated prior to or during transit. A rating of 5 indicates that there are no detection or mitigation methods for the invasives prior to or during transit) Level Nbr Level Descriptor Level Determination (i.e., 0,1,2,3,4, or 5)
(Assign a whole number):Level 0 No Risk RationaleLevel 1 Extremely Low Level of RiskLevel 2 Moderately Low Level of RiskLevel 3 Medium Level of RiskLevel 4 Moderately High Level of RiskLevel 5 Extremely High Level of Risk
Is there uncertainty regarding this rating? If so, please complete the chart below:Basis of Uncertainty Check All
RelevantUncertainty level (Assign whole nbr from 0-5 where 1= slightly uncertain; 5= highly uncertain)
Flaws in methodology RationaleLack of expertiseLack of coherence on issueBiological unknowns Insufficient information Political impedimentsOther-Define
Question 10: What is the level of difficulty (0-5) in detecting the invasive species once introduced? (Frame of reference: A rating of zero (0) indicates that all invasives are detected immediately at the pathway endpoint. A rating of 5 indicates that the invasive species is/are so difficult to detect, there is a 100% likelihood they will be disseminated throughout the nation and become permanently established without detection)Level Nbr Level Descriptor Level Determination (i.e., 0,1,2,3,4, or 5)
(Assign a whole number):Level 0 No Risk RationaleLevel 1 Extremely Low Level of RiskLevel 2 Moderately Low Level of RiskLevel 3 Medium Level of RiskLevel 4 Moderately High Level of RiskLevel 5 Extremely High Level of Risk
Is there uncertainty regarding this rating? If so, please complete the chart below:Basis of Uncertainty Check All
RelevantUncertainty level (Assign whole nbr from 0-5 where 1= slightly uncertain; 5= highly uncertain)
Flaws in methodology RationaleLack of expertiseLack of coherence on issueBiological unknowns Insufficient information

Political impedimentsOther-Define
Question 11: What is the assessment level (0-5) of the pathway’s characteristics that would enable it to transport ‘generalist’ invasives that are capable of surviving in multiple habitats? (Frame of Reference: An assessment of zero (0) indicates the pathway does not transmit any generalists. An assessment of 5 indicates the majority of invasives transmitted by this pathway are generalists with at least 3 or more populations capable of surviving in any of the pathway endpoints.) Level Nbr Level Descriptor Level Determination (i.e., 0,1,2,3,4, or 5)
(Assign a whole number):Level 0 No Risk RationaleLevel 1 Extremely Low Level of RiskLevel 2 Moderately Low Level of RiskLevel 3 Medium Level of RiskLevel 4 Moderately High Level of RiskLevel 5 Extremely High Level of Risk
Is there uncertainty regarding this rating? If so, please complete the chart below:Basis of Uncertainty Check All
RelevantUncertainty level (Assign whole nbr from 0-5 where 1= slightly uncertain; 5= highly uncertain)
Flaws in methodology RationaleLack of expertiseLack of coherence on issueBiological unknowns Insufficient information Political impedimentsOther-Define
Question 12: What is the level of risk of natural spread (rating of 0-5) posed by the invasive species transmitted via this pathway? (Frame of Reference: A rating of zero (0) indicates the pathway transmits invasives with low reproductive rates or are fragile in any ecosystem other than that of its origination. A ranking of 5 indicates the pathway transmits invasives that are highly mobile, spread by wind, water and have fast/high reproductive rates in multiple ecosystems.)Level Nbr Level Descriptor Level Determination (i.e., 0,1,2,3,4, or 5)
(Assign a whole number):Level 0 No Risk RationaleLevel 1 Extremely Low Level of RiskLevel 2 Moderately Low Level of RiskLevel 3 Medium Level of RiskLevel 4 Moderately High Level of RiskLevel 5 Extremely High Level of Risk
Is there uncertainty regarding this rating? If so, please complete the chart below:Basis of Uncertainty Check All
RelevantUncertainty level (Assign whole nbr from 0-5 where 1= slightly uncertain; 5= highly uncertain)
Flaws in methodology RationaleLack of expertise

Lack of coherence on issueBiological unknowns Insufficient information Political impedimentsOther-Define

Question 13: What is the level or risk of human/human activity (0-5) in spreading the invasives transmitted via this pathway? (Frame of Reference: A rating of zero (0) indicates that humans or human activities do not spread the invasive species. A rating of 5 indicates humans or human activities are the primary agent for the rapid spread of invasive species such as with Avian influenza).Level Nbr Level Descriptor Level Determination (i.e., 0,1,2,3,4, or 5)
(Assign a whole number):Level 0 No Risk RationaleLevel 1 Extremely Low Level of RiskLevel 2 Moderately Low Level of RiskLevel 3 Medium Level of RiskLevel 4 Moderately High Level of RiskLevel 5 Extremely High Level of Risk
Is there uncertainty regarding this rating? If so, please complete the chart below:Basis of Uncertainty Check All
RelevantUncertainty level (Assign whole nbr from 0-5 where 1= slightly uncertain; 5= highly uncertain)
Flaws in methodology RationaleLack of expertiseLack of coherence on issueBiological unknowns Insufficient information Political impedimentsOther-Define
Question 14: What is the level of risk (0-5) of the pathway introducing an invasive that is known to be invasive but not yet in the U.S.? (Frame of Reference: A rating of 0 indicates that the pathway only transmits species that are already distributed throughout the endpoint ecoregion; a rating of 3 indicates the pathway transmits invasives that are in U.S ecoregions, but not in the endpoint of the pathway. A ranking of 5 indicates the pathway transmits viable invasives into pristine eco-systems.Level Nbr Level Descriptor Level Determination (i.e., 0,1,2,3,4, or 5)
(Assign a whole number):Level 0 No Risk RationaleLevel 1 Extremely Low Level of RiskLevel 2 Moderately Low Level of RiskLevel 3 Medium Level of RiskLevel 4 Moderately High Level of RiskLevel 5 Extremely High Level of Risk
Is there uncertainty regarding this rating? If so, please complete the chart below:Basis of Uncertainty Check All
RelevantUncertainty level (Assign whole nbr from 0-5 where 1= slightly uncertain; 5= highly uncertain)
Flaws in methodology RationaleLack of expertiseLack of coherence on issueBiological unknowns Insufficient information Political impediments
Other-DefineQuestion 15: What is the level (0-5) of available control options for the invasives transmitted via this pathway? (Frame of Reference: A rating of zero (0) indicates there are comprehensive control options that mitigate all invasives transmitted via the pathway. A rating of 5 indicates there are no control options for the invasives transmitted via the pathway.)Level Nbr Level Descriptor Level Determination (i.e., 0,1,2,3,4, or 5)
(Assign a whole number):Level 0 No Risk RationaleLevel 1 Extremely Low Level of RiskLevel 2 Moderately Low Level of RiskLevel 3 Medium Level of RiskLevel 4 Moderately High Level of RiskLevel 5 Extremely High Level of Risk
Is there uncertainty regarding this rating? If so, please complete the chart below:Basis of Uncertainty Check All
RelevantUncertainty level (Assign whole nbr from 0-5 where 1= slightly uncertain; 5= highly uncertain)
Flaws in methodology RationaleLack of expertiseLack of coherence on issueBiological unknowns Insufficient information Political impedimentsOther-Define
Question 16: What is the assessment of economic cost (0-5) of control options for invasive species transmitted via this pathway? (Frame of Reference: A rating of zero (0) indicates control options are a part of routine operations and therefore requires no additional funding. A rating of 5 indicates control options are so expensive, it requires the petitioning of external agency/multi-source emergency funding to control/eradicate.)Level Nbr Level Descriptor Level Determination (i.e., 0,1,2,3,4, or 5)
(Assign a whole number):Level 0 No Risk RationaleLevel 1 Extremely Low Level of RiskLevel 2 Moderately Low Level of RiskLevel 3 Medium Level of RiskLevel 4 Moderately High Level of RiskLevel 5 Extremely High Level of Risk
Is there uncertainty regarding this rating? If so, please complete the chart below:Basis of Uncertainty Check All
RelevantUncertainty level (Assign whole nbr from 0-5 where 1= slightly uncertain; 5= highly uncertain)
Flaws in methodology RationaleLack of expertiseLack of coherence on issueBiological unknowns Insufficient information Political impediments

Other-Define
4) Step 4 Calculating Risk Individual/Consensus Score
After each single question is provided a score, this portion of pathway assessment requires the awarding of a final, overall assessment number (i.e., 0-5). No partial numbers are to be awarded. The process for awarding the single risk score follows:
A. Tally overall pathway risk rating (Single/Consensus rating 0-5 expressed in whole number. Is the average of all per question ratings.)
B. Tally overall uncertainty ratings (Single/Consensus rating 0-5) expressed in whole number. Is the average of all per question uncertainty ratings)
C. Tally Revised/Final Pathway Risk Rating after considering uncertainty issues. (Is usually the same as rating in #A - -but not necessarily. Represents a compromise or adjusted rating reflective of the best determination after consideration of uncertainty. Is a whole number)

Stage III- Invasiveness Scale (1-75)
Based on the above analyses, there are now 3 major factors upon which to assign a pathway ranking: impact category, pathway scale and pathway risk factors. Using the chart below, assign a risk prioritization (on scale of 1-75) for the pathway.

Example1: Ballast WaterImpact Category
Pathway Scope
Pathway Risk Level
A Human V 4
Example 2: Wood Packing Material
Impact Category
Pathway Scope
Pathway Risk Level
B Economy V 3
1. DefineRisk Impact Category
2. Select Pathway Scope Column (i.e., V, IV, II, II or I)3. Select Pathway Risk Level (i.e., 5, 4, 3, 2 or 1)4. Assign Corresponding Rank Order (i.e., single integer between the numbers 1-75)
NOTE: Any scope values of 0 indicate a local event and as such cannot be classified as a true pathway. However, these events provide areas for future observation or query.
A LevelHuman Health
75. V – 574. V – 473. V – 372. V – 271. V - 1
70. IV – 569. IV – 468. IV – 367. IV – 266. IV – 1
65. III – 564. III – 463. III – 362. III – 261. III – 1
60. II – 559. II – 458. II – 357. II – 256. II - 1
55. I – 554. I – 453. I – 352. I – 251. I – 1
0 – 50 – 40 – 30 – 20 – 1
B LevelEconomic Impacts
50. V – 549. V – 448. V – 347. V – 246. V - 1
45. IV – 544. IV – 443. IV – 342. IV – 241. IV – 1
40. III – 539. III – 438. III – 337. III – 236. III – 1
35. II – 534. II – 433. II – 332. II – 231. II - 1
30. I – 529. I – 428. I – 327. I – 226. I – 1
0 – 50 – 40 – 30 – 20 – 1
C LevelEcological Impact
25. V – 524. V – 423 .V – 322. V – 221. V - 1
20. IV – 519. IV – 418. IV – 317. IV – 216. IV – 1
15. III – 514. III – 413. III – 312. III – 211. III – 1
10. II – 59. II – 48. II – 37. II – 26. II - 1
5. I – 54. I – 43. I – 32. I – 21. I – 1
0 – 50 – 40 – 30 – 20 - 1
As such the initial ranking of the above exemplar pathways would be:
Ex 1: Ballast Water = Risk Ranking of 74Impact Category
Pathway Scope
Pathway Risk Level
A – Human V 4
Ex 2: Wood Packing = Risk Ranking of 48Impact Category
Pathway Scope
Pathway Risk Level
B – Economy V 3

Stage IV. Situational Modifiers of Pathway Risk Ranking
As previously indicated, there are certain factors which should be considered and then used to adjust the above rankings. The intent of the system is to provide a method of stratifying risk based upon national priorities (i.e., human, then economical and finally ecological impact), pathway scope and pathway risk factors. These are all qualitative measures for socio-political-economic systems. As such, the method must be sufficiently flexible to modify these rankings based upon other relevant factors. These relevant factors include the following:
1. Does the pathway transport invasives that are known to cause impact to human infrastructures (i.e., plant that lowers property values)?
2. Does the pathway transport invasives known to cause impacts to biologic/primary productivity/living industries (i.e., ecotourism, birding, aquatic recreation)?
3. Does the Pathway transport invasives that are known to have political or public sensitivity beyond that scientifically associated with the pathway (i.e., sensationalism of ‘killer bees’, endangered species)?
For instance, in the second example, the ranking was as below:
Example 2: Wood Packing Material = Risk Ranking of 48
Impact Category
Pathway Scope
Pathway Risk Level
B – Economy V 3
However, if it is found that a new human health invasive is being transmitted through similar foreign pathways that intersect with this particular U.S. pathway, it might be advisable to reevaluate the impact category to the “A” level. The final risk ranking would then be reevaluated as 73 - -at the top of the list.

CHAPTER 4 - CONCLUSIONS FOR POLICY AND ACTION
From Science to Pathway Policy
In the process of developing the pathway diagrams, assessment tool, and assessment methodology, the Pathways Work Team struggled with several issues relevant to scientific data and public policy. While this report in no way attempts to resolve such intricate issues, it is essential that these considerations be brought to the forefront for future decision-making efforts and as such are enumerated below:
There is a need to maximize the contributions of science for commercial/societal ends. International competitiveness is impacted by invasive species. Science-based decision-making should be open to public scrutiny. Pathway ranking combines community, government and corporate interests. Sound science, transparency and consistency are essential for formulating policy. Need neutrality in scientific advice to decision makers. Private sector has a role in setting the agenda. Invasive Species prevention is inherently an international activity. Methodology must include public and expert participation. Process for evaluating pathway risks is as important as assessment tools/criteria Outcome of process is the characterization of relative risk of pathway. It is up to policy
makers to later devise plans for pathway management, resource leveraging, policy development, budget decisions and technology transfer/development.
Invasiveness is predictable and can be controlled. Science can help understand the current condition under which decisions are being
made and can define potential future consequences of those decisions. Uncertainty issues must be addressed and include such aspects as lack of coherence,
lack of scientific data, areas of inaction, need for clarification, the state of confidence a scientist has regarding a particular phenomenon, diversity of values or interests, different definition of objectives; or different definition of measures.
Most important decisions are made with a high degree of uncertainty but are justified by high level of commitment to set goals and values.
Policy decisions are based on what the future should look like for particular groups; with consideration made of ‘current situation’ issues.
The bottom line agreed upon by all was that policy decides the direction to take, but science maintains the focus. 6
Interpreting Invasiveness Scales
The next, logical question, therefore, is what does the above evaluation accomplish. The uses for the pathway prioritization scale include the following:
(1) Common Value of Human Health First, Economy then Ecology. Regardless of various agency/industry mission or priorities, this method of pathway prioritization creates a common value: human health is the most salient concern followed by economy, then ecology.
6 Source: Arizona State University Consortium for Science, Policy and Outcomes, College of Liberal Arts and Sciences

(2) Mission Based Priorities. Managing and prioritizing pathways has to be inextricably linked to organization mission and goals. This pathway prioritization method is a tool to assist agencies in defining and addressing invasive species issues - - and is not a ‘stand alone’ arbitrary exercise.
(3) Ecoregion Integration. Using an ecoregion approach enables ecological issues to be imbued in the process, while giving latitude in definition of pathways based upon actual impact as opposed to regional governmental boundaries.
NISC and Cross-Agency Analysis
Once agencies have gone through the first ‘triage’ of pathway prioritization, it is anticipated these results will be shared with the National Invasive Species Council. NISC can then inform the various agencies as to which pathways they share with similar priorities. This ‘matching’ would then enable strategic grouping of organizations and experts for matrixed, systemic pathway prioritization and analysis, nationwide. And again, this tool could be the focus for that analysis. A long term goal would be for these mechanisms to eventually evolve into an online library of benchmarked pathway risk analyses and datasets. Appendix B contains recommended issues/question that should be addressed in cross-agency decisions.
Future Pathway Assessment Activities
The Pathways Work Team strongly feels that, though this is a great leap in sophistication of pathways prioritization efforts, we still have a long way to go - -particularly in the area of database integration and developing predictive statistical algorithms.
As such, this second edition of the ranking methods will also have to be field tested via focus groups to accomplish further refinements. We expect there to be at least two more edifications prior to “perfection”. The Pathways Work Team found that each phase or format has to be ‘tried and true’ by users; though the consensus was - - we’re on the right track.
Comments regarding this guide may be forwarded to
National Invasive Species CouncilPrevention Committee
Pathways Working Team via e-mail to:
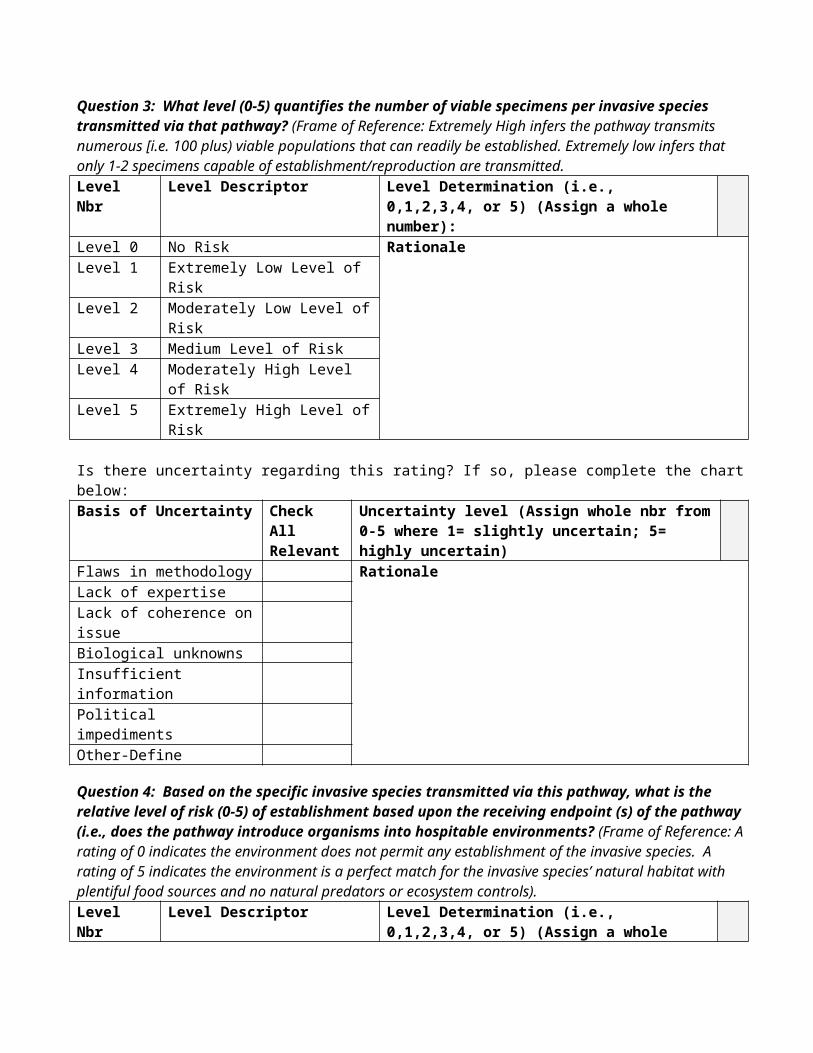
APPENDIX A: Sponsorship
This conference was co-sponsored by the U.S. Department of Interior, National Invasive Species Council, Prevention Committee, the Pathways Working Group and the U.S. Department of Agriculture, Animal and Plant Health and Inspection Service, Plant Protection and Quarantine. An immeasurable amount of gratitude is expressed to the following cooperators, advisors, and experts that so diligently dedicated their resources for invasive species pathways activities:

Aquatic Nuisance Species Task ForceChamber of Shipping of AmericaChippewa Ottawa Resource AuthorityColorado State UniversityEcological Society of AmericaEnvironment Protection AgencyFlorida Department of Agriculture &Consumer ServicesFlorida Gulf Coast UniversityInternational Joint CommissionInternational Union of Concerned ScientistsLouisiana State UniversityMaine Lakes Conservancy InstituteMinnesota Crop Improvement AssociationNational Aeronautics Space AdministrationNational Aquaculture AssociationNational Association State Departments of AgricultureNational Fish and Wildlife FoundationNative American Fish and Wildlife SocietyNorth American Brown Tree Snake Control Team, Texas A&M UniversityNorth American Weed Management AssociationNorth Carolina Department of Agriculture and Consumer ServicesNortheast Midwest InstituteOcean ConservancyOffice of Secretary of Defense- Armed Forces Pest Management BoardOregon Department of AgricultureOregon State UniversityPacific Wildlife Research, Inc.Pet Industry Joint Advisory CouncilSmithsonian Environmental Research CenterTaylor Shellfish FarmsThe Nature ConservancyUniversity of FloridaUniversity of GeorgiaU.S. Coast GuardU.S. Geological SurveyU.S. Department of AgricultureU.S. Department of CommerceU.S. Department of Health and Human ServicesU.S. Department of Homeland SecurityU.S. Department of the InteriorU.S. Department of StateU.S. Department of TransportationU.S. Trade Representative
45

APPENDIX B: Matrix-Agency Strategic Planning Considerations
The Pathways Work Team was charged with developing methodologies for assessing the relative risk of invasive species via distinct pathways. This process is not a policy decision-making effort but one wherein joint perspective of relative risk is developed by all persons with vested interest. However, the Team does recommend the following questions be responded to by appropriate parties to further the pathway analysis towards its eventual outcome: policy decisions, resource leveraging, budget actions, and scientific technology transfer and development in an integrated industry, public and government environment:
Policy and Program Conduct
What policy/program will or should be created to carry out the pathway findings/recommendations?Who is responsible for data collection, analysis and reporting?What entities monitor assessment/program activities?What entities will periodically review and evaluate the program and its elements?What is the cost benefit to proposed actions?What are the indicators that actions are achieving the desired outcomes?What are the criteria for evaluation success of pathway management?
Public Reporting
How are results/outcomes shared among various vested stakeholders?What is the best method for sharing information with the stakeholders?
Databases
What databases exist that can be used for pathway analysis?What is the best structure for integrating the information from the databases?What elements need to be collected and used?
Budget
What are the fiscal issues that need to be incorporated into the policy to foster institutional excellence (i.e., Government Performance Results Act)?
Strategic Planning
Who is responsible for developing and carrying out cross-agency/stakeholder strategic plans for invasive species prevention?What incentives can be developed to ensure compliance with strategic objectives, tasks and deliverables?
46

APPENDIX C: Contacts List
----------A------------------
Allen AuclairU.S. Army Garrison Aberdeen Proving GroundDirectorate of Installation OperationsU.S. Army Environmental CenterInstallation Restoration Division5179 Hoadley RoadAberdeen Proving Ground, MD 21010-5401Phone: 410-306-1146Fax: [email protected]
Kay AustinInternational Joint Commission1250 23rd Street, NW Suite 100Washington, DC [email protected]: 202-736-9011fax 202-467-0746
-----------B------------------
Dr. George K BeckColorado State UniversityDepartment of BioAgricultural Sciences and Pest ManagementRoom 116 Weed LabPlant Science BuildingFort Collins, CO 80523-117Phone 970-491-7568Fax 970-491-3862Email: [email protected]
Gary M BeilMinnesota Crop Improvement Association1900 Hendon AvenueSt. Paul, MN 55108Phone 1-800-510-6242Fax 612-625-3748Email: [email protected]
John BerryNational Fish and Wildlife Foundation (NFWF)1120 Connecticut Ave., NWSuite 900Washington, DC 20036Phone: 202-857-0166Fax: 202-857-0762
Herbert T. BoltonU.S. Army Environmental CenterATTN: SFIM-AEDC-CDCAberdeen Proving Ground, MD 27010 Or
USDA/CSREESMailstop 22201400 Independence Ave., S.W.\Washington, D.C. 20250-2220
Elizabeth C. BourgetInternational Joint CommissionSecretary, U.S. Section1250- 23rd Street, NW Suite 100Washington, DC 20037Phone 202-736-9008Fax 202-467-0746Email: [email protected]
Terry L. BourgoinDirector , Division of Plant Industry Maine Dept. of Agriculture Deering Bldg AMHI Complex28 State House Station Augusta, ME 04333-0028 Phone: 207-287-3891 Fax: 207-287-7548 E-mail: [email protected]
E. Shippen BrightMaine Lakes Conservancy InstituteP.O. Box 55Nobleboro, ME 04555Phone 207-563-5253e-mail: [email protected]
Kerry BrittonUSDA Forest ServiceForest Health Protection1601 N. Kent StreetArlington, VA 22209Phone: 703-605-5347Fax: 703-605-5353Email: [email protected]
David BrooksU.S. Trade [email protected]
A Gordon BrownDepartment of InteriorNational Invasive Species Council1201 Eye Street, NW; 5th FloorWashington, DC 20005Phone: 202-354-1878Fax 202-371-1751Email. [email protected]
47

-----------C------------------Faith T. Campbell, Ph.D. Senior Policy Representative Introduced Forest Insects and Diseases The Nature Conservancy 4245 North Fairfax Drive Arlington, VA 22203 Phone: (703) 841-4881 FAX: (703) 841-2722 E-mail: [email protected] [email protected]
Earl CampbellFish Wildlife ServicesPhone: 808-792-9414Cell: 808-226-6076Email: [email protected]
Jonathan [email protected] forAllegra Cangelosi Senior Policy Analyst, Northeast-Midwest Institute 218 D St. Washington, DC 20003 Phone: 202-464-4007 FAX: 202-544-0043 E-mail: [email protected]
Deborah J. Cavett (Facilitator )Director, Interagency InitiativesScience and Education Resources DevelopmentCooperative State Research, Education and Extension ServicePhone: 202-720-6346FAX: 202-720-3945Mailing Address: 1400 Independence Ave SW Stop 2250; Washington, DC 20250Express mail Delivery: 800 9th Street SW Rm 3312Washington, DC 20024
Craig ClarkUSDA APHIS; Wildlife ServicesPhone [email protected]
Andrew Cohen7770 Pardee Lane; 2nd FloorOakland, CA 94621-1424Phone: 510-746-7637Fax: 510-746-7300e-mail: [email protected]
Susan D. Cohen USDA APHIS PPD, 3C42 4700 River Road, Unit #117 Riverdale, MD 20737 Phone: (301) 734-5929 FAX: (301) 734-5899 E-mail: [email protected]
Wilhem [email protected] ; phone 850-488-4033
Diane CooperTaylor Shellfish FarmsSE 130 Lynch RoadShelton, WA 98584Phone 360-426-6178Fax [email protected]
Joseph CornUniversity of GeorgiaSE Cooperative Wildlife Disease StudyWildlife Health BuildingCollege of Veterinary MedicineAthens, GA [email protected]
Gene Cross, Plant Pest AdministratorPlant Industry Division NC Department of Agriculture and Consumer ServicesNational Plant Board Liaison1060 Mail Service CenterRaleigh, ND 27699-1060(919) 733-6930, ext. 213 [email protected]
-----------D------------------
Hilda Diaz-SolteroUSDA Senior Invasive Species Coordinator1201 Eye Ste. N.W. 5th FloorWashington, DC 20005Phone 202-513-7249Fax 202-371-1751Email: [email protected]
Bill DickersonNC Depart of Agriculture and Consumer ServicesNational Plant Board Liaison1060 Mail Service CenterRaleigh, ND 27699-1060Phone 919-733-3933Fax 919-733-1041Email: [email protected]
Robert DoudrickUSDA Forest ServiceNorth Central Research Station 1992 Folwell AvenueSt Paul, MN 55108Phone: 651-649-5295
48
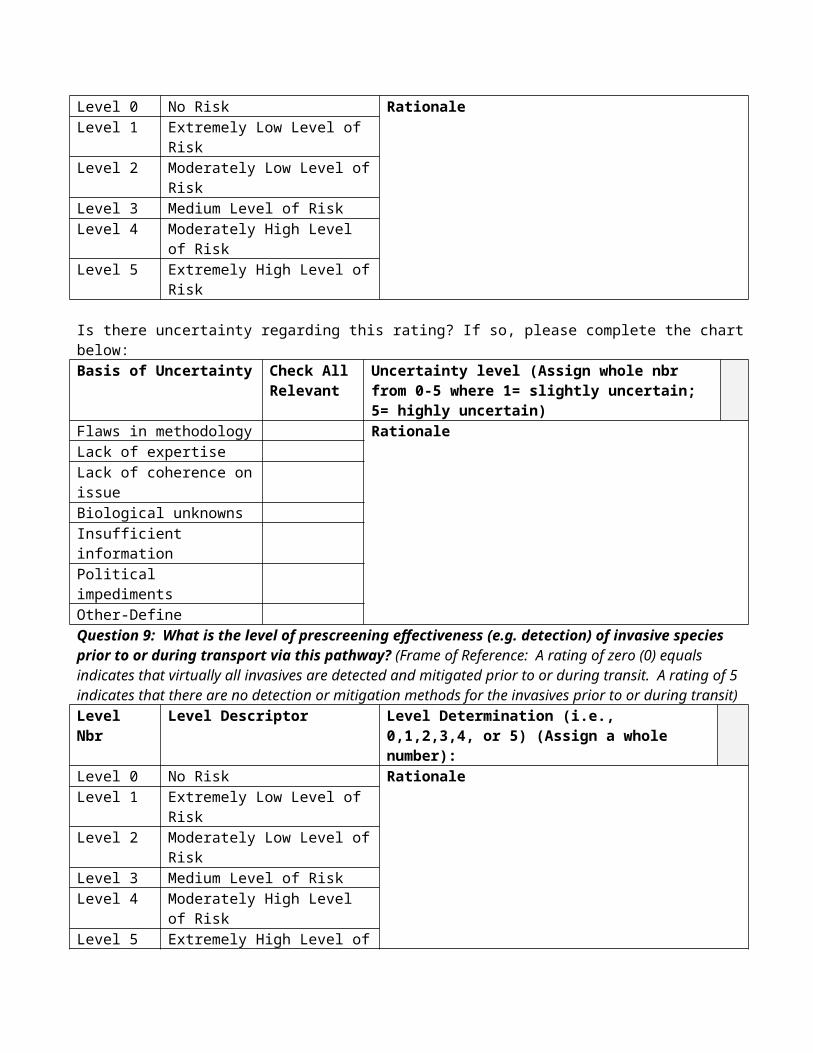
-----------E------------------Pete EaganArmed Forces Pest Management BoardForest Glen SectionWRAMC, Bldg 172Washington, DC 2307-5001Phone 301-295-7476Email: [email protected]
Roger EberhardtOffice of the Great Lakes, Michigan DEQHollister Building, 6th Floor106 West Allegan StreetP.O. Box 30473Lansing, MI 48909Phone 517-335-4056/Fax –517-335-4531Direct line 517-335-4227Email: [email protected]
Orlo (Bob) EhartAnimal and Plant Health Safeguarding CoordinatorNASDA, Suite 10201156 15th Street., NWWashington, DC 20005-1711Phone; 202-296-9680 ext 214Fax: 202-296-9686Email: [email protected]
Rachel EichelbergerU.S. Department of InteriorNational Invasive Species Council U.S. Department of Interior (OS/SIO/NISC) Mailing Address: 1849 C Street. NW Washington, DC 20240 Physical Address: 1201 Eye Street NW Fifth Floor Room 79 Washington DC. 20005 [email protected]
Lucius G. EldredgePacific Science AssociationThe Bishop Museum1525 Bernice StreetHonolulu, HI 96817Phone 808-848-4124Fax 808-847-8252Email: [email protected]
Elizabeth EtchellsDeputy Director for Environmental ReviewsUSTR – Environment and Natural ResourcesPhone: 202-395-6130e-mail: [email protected]
Dr. EverettU.S. Coast GuardAquatic Nuisance Species Program
Environmental Standards Division (G-MSO-4) 2100 2nd Street, S.W.Phone: 202-267-2243Email: [email protected]
-----------F------------------
Christopher Fisher Colville Confederated TribesFed Ex 23 Brook Tracts Road, Omak, WA 98841P.O. Box 150, Nespelem, WA 99155Phone 888-881-7684 ex 2110509-634-2200fax 509-634-4116email: [email protected]
Dr. Jeffrey P. Fisher Ecology and Conservation Officer Bureau of Oceans and International Environmental and Scientific Affairs U.S. Department of State Washington, D.C. 20520 Phone: (202) 647-6867 FAX: (202) 736-7351 E-mail: [email protected]
Pam Fuller U.S. Geological Survey – Bio. Res. Discipline Nonindigenous Aquatic Species Program Center for Aquatic Resources Studies 7920 NW 71st Street Gainesville, FL 32653 Phone: (352) 264-3481 FAX: (352) 378-4956 E-mail: [email protected]
-----------G------------------
Richard GaskallaDirector Division of Plant Industry Florida Dept. of Agriculture & Consumer Services P. O. Box 147100 Gainesville, FL 32614-7100 Phone: 352-372-3505 Fax: 352-955-2300 E-mail: [email protected]
Jan Gilbreath Trade Team; Ofc of International Affairs U.S. Environmental Protection Agency Washington, D.C. Phone: (202) 564-6279 FAX: (202) 565-2409 Cell: (703) 587-9083 E-mail: [email protected]
49

Sharon K. Gross Asst. Prgm Coord -- Invasive Species U.S.G.S.– Bio. Res. Discipline 12201 Sunrise Valley Drive, MS 301 Reston, VA 20192 Phone: (703) 648-4076 FAX: (703) 648-4238 (or 4039) E-mail: [email protected]
Vincent G. Guida, PhD Research Fisheries Biologist US Department of Commerce NOAA Fisheries Northeast Fisheries Science Center J.J. Howard Laboratory Highlands, NJ 07732 Phone: (732) 872-3042 FAX: (732) 872-3128 E-mail: [email protected]
-----------H------------------
Robert Haack USDA Forest ServiceNorth Central Research Station1992 Folwell AvenueSt. Paul; Minnesota 55108-1034Phone 517-355-7740 ex [email protected]
Scott HardinFlorida Fish and Wildlife Conservation CommissionExotic Species Coordination Section620 South Meridian StreetTallahassee, FL 32399-1600Email: [email protected]: 850-488-4068FAX: 850-413-0381
Catherine HazlewoodThe Ocean Conservancy2029 K Ste NWWash,. DC 20006Phone: 202-429-5609Fax 202-872-0619Email: [email protected]
Dr. S.E. HenkeNorth American Brown Tree Snake Control Team (NABTSCT)Department of Animal and Wildlife ServiceTexas A&M University – KingsvilleCaesar Wildlife Research Institute700 University Blvd, MSC 218Kingsville, Texas 783-8202Phone 361-593-3689Fax 361-593-3788Email: [email protected]
Michael Hennessey, Ph.D., (Facilitator)Entomologist Pathways & Standards Team Ldr USDA APHIS PPQ CPHST Plant Epidemiology & Risk Analysis Laboratory 1730 Varsity Drive, Suite 300 Raleigh, North Carolina 27606-5202 Phone: (919) 855-7514 FAX: (919) 855-7595 E-mail: [email protected]
Jim HesterAgency Environment CoordinatorUSAIDBureau Economic Growth, Agriculture and Trade1350 Pennsylvania, Avenue, NWWashington, DC 20523Phone 202-712-5176Email: [email protected]
Dan HilburnAdministrator, Plant Division Oregon Department of Agriculture 635 Capitol St., NESalem, OR 97301-2532 Phone: 503-986-4663 Fax: 503-986-4786 E-mail: [email protected]
Jeffrey E. HillAssociate Research FacultyTropical Aquaculture LaboratoryUniversity of Florida1408 24th Street SERuskin, FL 33570Phone: 813 671-5230 x 118Fax 813-671-5234Email [email protected]
Sandra HowardOfc of the Assistant Secretary for Planning and EvaluationU.S. DHHS200 Independence Ave., SW, MS 445FWashington, DC 20201Phone 202-690-5874Fax 202-205-8835Email: [email protected]
Dr. Martin Hugh-JonesLouisiana State UniversityDepartment of Pathobiological SciencesSchool of Veterinary MedicineBaton Rouge, LA 70803Phone: 225-578-5599Fax: 2258-578-9701Email: [email protected]
50

-----------J------------------
Jerome A JacksonFlorida Gulf Coast UniversityWhitaker Center for Science/Math and Technical Education; College of Arts and Sciences; Whitaker Hall Room 22210501 FGCU Boulevard SouthFort Myers, FL 33965-6565Phone: 239-590-7193Email: [email protected]
Dr. Whitman Miller For Susan JiacintoSmithsonian Environmental Res CenterP.O. Box 28; 647 Contees Wharf RdEdgewater, MD 21037-0028Phone: 443-482-2400Fax: [email protected] J.R. JohnsonOregon Department of AgricultureInsect Pest Prevention &Mgmt SectionPlant Division635 Capitol St. NESalem, OR 97301phone: 503-986-4636800-525-0137fax 503-986-4786email [email protected]
-----------K------------------
Timothy R.E. KeeneyANSTFDeppartment Ass’t Sec of Oceans and AtmosphereDept of Commerce, NOAAHerbert Hoover Bldg., Room 580414th St and Constitution Ave., NWWashington, DC 20230Phone 305-292-0311e-mail [email protected]
Henry KellyFederation of American Scientists1717 K Street NW Suite 209Washington, DC 20036Phone: 202-546-3300Fax: 202-675-1010
Sheilah KennedyNorth American Weed Management AssociationP.O. Box 1910, 461 E AgateGranby, CO 80446-1910Of P.O. Box 4Kanogan, WA 98840-0004Phone: 970-887-1228Fax 970-887-1229Cell 509-322-6909Contact: Charles Henry at [email protected]
Arnold KonheimOffice of the SecretaryU.S. Department of Transportation400 7th Street SW Room 10309GWashington, DC 20590Phone 202-366-4849Fax [email protected]
Richard W. KrichhoffNational Association of State Departments of Agriculture Washington Office1156 15th Street, NW Suite1020Washington, DC 20005Phone: 202-296-6980Fax: 202-296-9686
Penny E. Kriesch (Chair) Agricultural Analyst USDA APHIS PPQ PPCI 4700 River Road; Unit 156; Suite 4C73 Riverdale, Maryland 20737 Phone: (301) 734-8412 FAX: (301) 734-3396 E-mail: [email protected]
-----------L------------------
Lindsey Elizabeth Etchellsfor Mark LinscottUSTREnvironment and Natural Resources600 17th Street NWWashington, DC 20508Phone 202-395-7320Email: [email protected]; [email protected]
----------M------------------
Donald R. MacLean U.S. Fish and Wildlife Service Division of Environmental Quality Branch of Invasive Species 4401 N. Fairfax Drive, Room 300 Arlington, VA 22203 Phone: (703) 358-2108 FAX: (703) 358-1800 E-mail: [email protected]
Randy MacMillanNational Aquaculture Association111 W. Washington Street, SuiteCharles Town, WV 25414Phone: 304-728-2167Fax: 304-728-2196Email: [email protected]
51
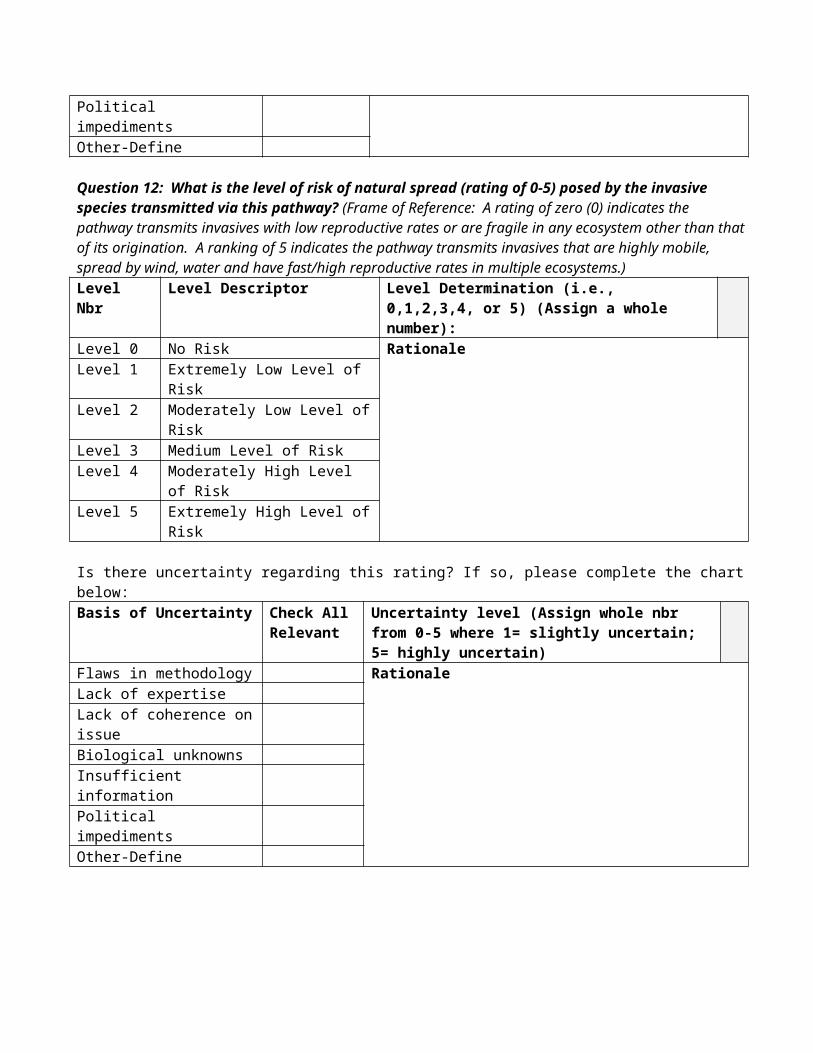
Steven McCormickThe Nature Conservancy4245 North Fairfax DriveSuite 100Arlington, VA 22203-1606
Jerry MelilloEcological Society of America1707 H Street NW; Suite 400Washington, DC 20006Phone 202-833-8773Direct phone: 508-289-7494Fax 202-833-8775Email: [email protected]
Kathy Metcalf Director, Maritime Affairs Chamber of Shipping of America 1730 M Street, NW; Suite 407 Washington, DC 20036 Phone: 202.775.4399 Fax: 202.659.3795 E-Mail: [email protected]
N. Marshall Meyers Pet Industry Joint Advisory Council; Suite 400; 1220 19th Street, NWWashington, DC 20036Phone 202-452-1525Fax 202-293-4377Email: [email protected]
Dr. A. Whitman MillerAssistant Director SERC Invasions Research ProgramNational Ballast Information Clearinghouse.P.O. Box 28; 647 Contees Wharf RoadEdgewater, MD 21037-0028Phone: 443-482-2208Fax: 443-482-2295e-mail: [email protected]
LCDR Kathy MooreOffice of Operating and Environmental StandardsDivision Chief, Aquatic Nuisance Species ProgramU.S. Coast Guard (G-MSO-4)2100 Second Street SW; Room 1601Washington, DC 20593-0001Phone: 202-267-0214
Bob MyersUSDA APHIS, Wildlife Services4700 River Road, Cubicle 6A69Riverdale, MD 20737Phone: 301-734-5920Email: [email protected]
-----------N------------------
Douglas NeumannOffice of Ecology and Terrestrial ConservationU.S. Department of State2201 C. St. NW Room 4333Washington DC 20520-6310Phone: 202-647-1804Email: [email protected]
Ira New BreastNative American Fish and Wildlife Society8333 Greenwood BlvdDenver, CO 80221Phone 303-466-1725Laurie Montour, project coordinatorEmail: [email protected]
-----------O------------------
Carol L. OkadaHawaii Department of Agriculture1849 Auiki StreetHonolulu, HI 96819Phone: 808-832-0566Fax: [email protected]
Charles R. O’NeillNew York Sea Grant ProgramGreat Lakes Program CoordinatorPhone 585-395-2516Or 800-285-2285Fax: 585-395-2466Email : [email protected]
Richard Orr (Guest Speaker)Asst. Director for Int. Policy and Prevention National Invasive Species Council U.S. Department of Interior (OS/SIO/NISC) Mailing Address: 1849 C Street. NW Washington, DC 20240 Physical Address: 1201 Eye Street NW Fifth Floor Room 79 Washington DC. 20005 Phone: (202) 354-1882 FAX: (202) 371-1751 E-mail: [email protected]
52

-----------P------------------
Mamie ParkerANSTF; Fishers and Habitat ConservationU.S. Fish and Wildlife ServiceInterior Building, Room 32451849 C Street. NWWashington DC 20240Phone 202-208-6394Fax: 202-2087-4674Email: mamie [email protected]. Is sending Everett Wilson, email: [email protected]
Neelam PatelEnvironmental Protection [email protected]
Parul PatelOffshore Pest Information SystemOPIS Program ManagerPest Detection & Mgmt ProgramsUSDA APHIS PPQ4700 River Road; Unit 140Riverdale, MD 20737Phone: 301-734-8965Fax: 301-734-8584e-mail: [email protected]
Bivan PatnaikOffice of Operating and Environmental StandardsBallast Water Management CommandantU.S. Coast Guard (G-MSO-4)2100 Second Street SW; Room 1601Washington, DC 20593-0001Phone: 202-267-0214
Gad PerryTexas TechPhone: 806-742-2841 ex 228Email: gad.perry @ttu.edu
Mike Pitzler USDA APHISWildlife Services3375 Koapaka Street Suite H-420Honolulu, HI 96819Phone: 808-861-8576
-----------R------------------
Craig RegelbruggeAmerican Nursery and Landscape Association1000 Vermont Avenue, 3rd FloorWashington, DC 20005Phone: 202-789-2900Fax: 202-789-1893e-mail: [email protected]
Sarah Reichard
Center For Urban HorticultureUniversity of WashingtonP.O Box 354115Seattle, WA 98195-4115Phone [email protected]
David F. Reid, Ph.D. Dir, NOAA, National Center for Research on Aquatic Invasive Species, U.S. Department of Commerce; Great Lakes Environmental Res Lab2205 Commonwealth Blvd. Ann Arbor, MI 48105-2945 Voice: (734) 741-2019 FAX: (734) 741-2055 E-mail: [email protected]
Connie RiherdAssistant DirectorFlorida Dept. of Agriculture & Consumer Services P. O. Box 147100 Gainesville, FL 32614-7100352-372-3505 ext. [email protected]
Lucinda Riley, J.D. DHS/CBP, Director of Policy and Programs ; Agriculture Inspection Policy and Programs Tel. (202)-344-2433 Fax: (202)344-1442 [email protected]
Michael RipleyEnvironmental Coordinator Inter-Tribal Fisheries & Assessment Program Chippewa Ottawa Resource Authority 179 West Three Mile Road Sault Sainte Marie, MI 49783 Tel. (906) 632-0072 Fax. (906) 632-1141 [email protected]
Anwar RizviSenior Plant PathologistUSDA APHIS PPQ ISPM4700 River Road; Unit 134Riverdale, MD 20737-1236phone: 301-734-4313; fax: 301-734-8584e-mail: [email protected]
Erich Rudyj (Facilitator)USDA APHIS PPQ PPCI4700 River RoadRiverdale, MD 20737301-734-6748
53

Roger RufeOcean Conservancy2029 K StreetWashington, DC 20006Phone: 202-429-5609
-----------S------------------
Jeffrey SchardtFlorida Department of Environmental Protection; 3900 Commonwealth Boulevard, MS 100Tallahassee, FL 32397Phone 850-245-2809Fax [email protected]
Anne SergeantNational Center for Environmental AssessmentU.S. Environmental Protection Agency HQ Ariel Rio Bldg; 8601 N;1200 PA Avenue, NWWashington, DC 20460Phone 202-564-3249Fax: 202-564-2018Email: [email protected]
Edwin SheffnerApplied Sciences Program, ICFSScience Mission DirectorateSun Earth System DivisionNASA Headquarters; Mail 5L79300 E Street, SWWashington, DC 20546-0001Email: [email protected]
Thomas Sim Administrator Plant Protection and Weed Control ProgramKansas Department of Agriculture PO Box 19282Topeka, KS 66619-1282 Phone: 785-862-2180 Fax: 785-862-2182 E-mail: [email protected]
Michael Simon USDA APHIS PPQ; Unit 11Kahului Airport; Kahului, HI 96732Phone 808-877-8757Fax 808-877-9086
Michael SlimakNational Center for Environmental Assessment; U.S. Environmental Protection Agency HQ; Ariel Rio Bldg; 8601 N; 1200 PA Avenue, NWWashington, DC 20460Phone 202-564-3349Fax: 202-564-2018Email: [email protected]
Colin D. Stewart, PhDUSDA APHIS Veterinary ServiceNational Center for Import/Export4700 River Road, Unit 39Riverdale, MD 20737-1231Phone: 301-734-0650Fax: 301-734-8226e-mail: [email protected]
Jeffrey StoneOregon State University Department of Botany and Plant Pathology; Cordley 2082Corvallis, OR 97331.2902Phone: 541-737-3451Fax: [email protected]
-----------T------------------
Al TaskerUSDA APHIS PPQ ISPM; Suite 5A454700 River RoadRiverdale, MD 20737301-734-5708
John L. Teem, Ph.D. National Aquaculture Association Aquatic Nuisance Species Representative 111 W. Washington St. Ste 1 Charles Town, W.V. 25414 Direct Mail: FDACS/Aquaculture, 1203 Governor’s Square Blvd., Tallahassee FL 32301 Phone: (850) 410-0867 FAX: (850) 410-0893 E-mail: [email protected]
Ralph TheirUSDA Forest Service Forest Health Protection1601 N. Kent StreetArlington, VA 2209Phone: 703-605-5336Fax: 703-605-5353
Mark TuchmanU.S. Environmental Protection AgencyGreat Lakes National Program Office77 West Jackson Blvd. G0JChicago, IL 60604-3590Phone 312-353-1369Email: [email protected]
54

John TurnerBureau of Oceans and International Environmental and Scientific AffairsU.S. Department of State (OES/OA/MLP)2201 C. Ste. NW; Room 7831Washington, DC 20520Phone 202-647-1554Email: [email protected] or [email protected]
-----------V------------------
Bob VenetteUSDA Forest ServiceNorth Central Research Station1992 Folwell AvenueSt. Paul; Minnesota 55108-1034Phone 651-649-5028Fax [email protected]
Dave VeselyPacific Wildlife Research, IncP. O. Box 1061Corvallis, OR 97339Phone 541-745-5025Fax: 541-745-5841Email: [email protected]
David Brooks for Darci Vetter Director for Sustainable Development Office of the U.S. Trade Representative 600 17th St, NW Washington, DC 20508 Phone: 202-395-9629 FAX: 202-395-9517 E-mail: [email protected]
Dan ViceAss’t State DirectorUSDA Wildlife ServicesHI/GU/Pacific Islandse-mail: [email protected]
-----------W------------------
John WaughInternational Union for Conservation of Nature and Natural Resources (IUCN)1630 Connecticut Ave NW; 3rd FlrWashington, DC 20009
Donna West USDA/APHIS/PPQ Senior Import Specialist 4700 River Road; 4C68 Riverdale, MD 20737 Phone: 301-734-5298 FAX: 301-734-3249 E-mail: [email protected]
Randy Westbrooks U.S. Geologic Survey 233 Border Belt Drive; P.O. Box 279 Whiteville, NC 28472 Phone: (910) 640-6435 FAX: (910) 648-6763 E-mail: [email protected]
Dean WilkinsonDepartment of Commerce LiaisonNational Invasive Species Council1201 Eye Street, NW 5th FloorWashington, DC 20005Phone 202-513-7243Fax 202-371-1751Email [email protected]
Sherman Wilhelm (Replaced by Zajicek)Florida Department of Agriculture and Consumer Services; Div of Aquaculture; 1203 Governors Sq Blvd, 5th Floor; Tallahassee, Florida 32301Phone 850-488-5471Fax 850-410-0893Email: [email protected]
Lyle WongPhone: 808-973-9535Email [email protected]
-----------Z------------------
Paul W. ZajicekFlorida Department of Agriculture and Consumer ServicesDivision of Aquaculture1203 Governors Sq Blvd, 5th FloorTallahassee, Florida 32301Phone: 850-488-0893Fax 850-410-0893Email: [email protected]
Hamdallah ZedanGlobal Invasive Species Program Secretariat413 St-Jacques Street, 8th Flr, Ofc 800Montreal, Quebec, Canada, H2Y 1N9Phone 514-288-2220Fax 514-288-6588Email: [email protected]
55

APPENDIX D: Conference Background Research Materials List:
1. HAACK 2001 Intercepted Scolytidae (Coleoptera) at U.S. ports of entry: 1985–20002. APHIS Intercept 1 yr dunnage SWPM counts3. APHIS intercept tiles SWPM counts4. F.J. GAY 1969 Article - - Species Introduced by Man5. APHIS PIN 309 Ad Hoc Report Results on Air Transport 6. Quarantine Risk Associated with Air Cargo Containers by P.D. Gadgil, L.S. Bulman and K.L.
Glassey, July 20027. Insect Survival in Jet Aircraft by W. N. Sullivan, 19588. MIA cargo aircraft risk analysis9. MIA cargo aircraft establishment10. MIA cargo aircraft inspections analysis11. MIA optimizing cargo inspections12. Canadian Technical Report of Fisheries and Aquatic Sciences 2268 dated 1999 by Michel
Harvey, Michel Gilbert, Danile Gauthier and Donald M. Reid13. Genetic Identification and Implications of Another Invasive Species of Dreissenid Mussel in the
Great Lakes by Bernie May and J. Ellen Marsden 199214. Mid-ocean exchange of container vessel ballast water. 2: Effects of vessel type in the transport
of diatoms and dinoflagelaltes from Manzanillo, Mexico, to Hong Kong, China by Dickman dated 1999
15. Ballast-mediated animal introductions in the Laurentian Great Lakes: retrospective and prospective analyses by Igor A. Grigorovich, Robert I. Colautti, Edward L. Mills, Kristen Holeck, Albert G. Ballert, and Hugh J. MacIsaac 2003
16. Identifying hazards in complex ecological systems. Part 1: fault-tree analysis for biological invasions Keith R. Hayes 2002
17. Global hot spots of biological invasions: evaluating options for ballast-water management, John M. Drake and David M. Lodge 2004
[Note: Information provided in this report was collected from multiple sources during conference and via interviews. Should any of the provided information require further footnote, please contact Penny Kriesch at [email protected] for report notation.]
56

APPENDIX E: Conference AgendaAgenda
National Invasive Species CouncilPathway Assessment Conference
(Air Transport, Ballast Water, Wood Packing Material)USDA APHIS Oklahoma Memorial Conference Center
Riverdale, Maryland, June 21-22, 2005
Day One – June 21, 2005
8:30 Coffee9:00 Welcome Penny Kriesch, USDA APHIS-NISC Prevention Cmte9:10 National Invasive Species Program Richard Orr, Assistant Director for International
Policy/Prevention, National Invasive Species Council, (NISC) U.S. Department of Interior
9:30 Pathways Analysis Project Hilda Diaz-Soltero, Senior USDA Invasive SpeciesCoordinator USDA Liaison, NISC
10:00 Instructions to Work Groups Facilitation Team (Penny Kriesch)10:15 Break Adjourn to Work Groups10:30 Individual Focus Groups Conference-Rooms A/B/C12:00 Training- Invasive Species Jeffrey P. Fisher, PhD, International Trade and Trends
U.S. Department of State, Bureau of Oceans and International Environmental & Scientific Affairs
Lunch1:30 Focus Groups (In-Room break) Conference-Rooms A/B/C3:30 Reconvene in Large Group Pathway Focus Group Leads
Issues, Challenges, Next Steps Conference Center Main Room4:00 Adjourn
Day Two – June 22, 2005
8:30 Coffee9:00 Invasive Species: Data Mining Susan Cohen, PhD, USDA APHIS Policy/Program Dev9:15 Work Group Break-Outs Conference-Rooms A/B/C12:00 Training Video Al Tasker, USDA APHIS, Noxious Weed Coordinator1:30 Focus Groups (In-Room Break) Conference-Rooms A/B/C2:30 Focus Group Report Outs Pathway Focus Group Leads-
Conference Center Main Room3:30 The Next Challenges for Faith Campbell
Pathway Prioritization The Nature Conservancy3:45 Thanks and Adjourn Penny Kriesch
57
Government User, 12/07/05,
Pathway Assessment Confer
Government User, 12/05/05,
Insert AM and PM breaks
Government User, 12/05/05,
Afternoon Break should be added in the schedule
Government User, 12/05/05,
Be sure to indicate lunch served to participants on premises
Government User, 12/21/05,
Standardize to Chair, NISC Prevention Workgroup, Invasive Species Pathways Committee
Government User, 12/05/05,
9:00

APPENDIX F – Reserved For Future Development of Predictive Algorithms and Integrated Database Design
58

APPENDIX G: Revised Pathway Diagrams
Diagrammed Pathway Categorizations
(T) Transportation
T 1 Modes of TransportationT1.1 Air T1.2 Water/Aquatic
T1.2.1 Ship Ballast WaterT1.2.2 Hull/Surface Fouling (i.e., Recreational Boats and Vessels)T1.2.3 Stowaways in HoldsT1.2.4 Superstructures/Structures Above Water LineT1.2.5 Transportation/Relocation of Dredge Spoil Material
T1.3 Land Terrestrial T1.3.1 Cars, Buses, Trucks, ATVs. Trailers for recreational boatsT1.3.2 Trains, Subways, Metros, MonorailsT1.3.3 Construction/Firefighting VehiclesT1.3.4 Hikers, Horses Pets
T2 Military Travel and Transportation of Military VehiclesT2.1 Baggage/GearT2.2 Equipment
T3 Items used in the Shipping ProcessT3.1 ContainersT3.2 Packing Materials
T3.2.1 Wood Packing MaterialsT3.2.2 SeaweedT3.2.3 Other Plant MaterialsT3.2.4 Sand/Earth
T4 Mail/Internet Overnight shippingT5 Travel Tourism/Relocation
T5.1 Travelers ThemselvesT5.2 Baggage/GearT5.3 Pets/Plants and Animals Transported for EntertainmentT5.4 Travel ConsumablesT5.5 Service Industries

(L) Living Industry
L1 Plant PathwaysL1.1 Importation of Plants for ResearchL1.2 Potting Soils, Growing Mediums, Sods and Other MaterialsL1.3 Plant Trade (agricultural nursery, landscape, floral, raw logs)
L1.3.1 Plant PartsL1.3.1.1 Above-Ground Plant PartsL1.3.1.2 Below Ground Plant PartsL1.3.1.3 Seeds and the Seed TradeL1.3.1.4 Aquatic Propagules
L1.3.2 Whole PlantsL2 Food Pathways
L2.1 Live SeafoodL2.2 Other Live Food AnimalsL2.3 Plants and Plant Parts as Food
L3 Non-Food Animal PathwaysL3.1 BaitL3.2 Pet/Aquarium TradeL3.3 AquacultureL3.4 Non-Pet AnimalsL3.5 Release of Organisms for Religious, Cultural or Other Reasons
L4 Nonliving Animal and Plant Related PathwaysL4.1 Processed and Partially Processed Meat and Meat Processing WasteL4.2 Frozen SeafoodL4.3 Minimally Processed Animal ProductsL4.4 Minimally Processed Plant Products
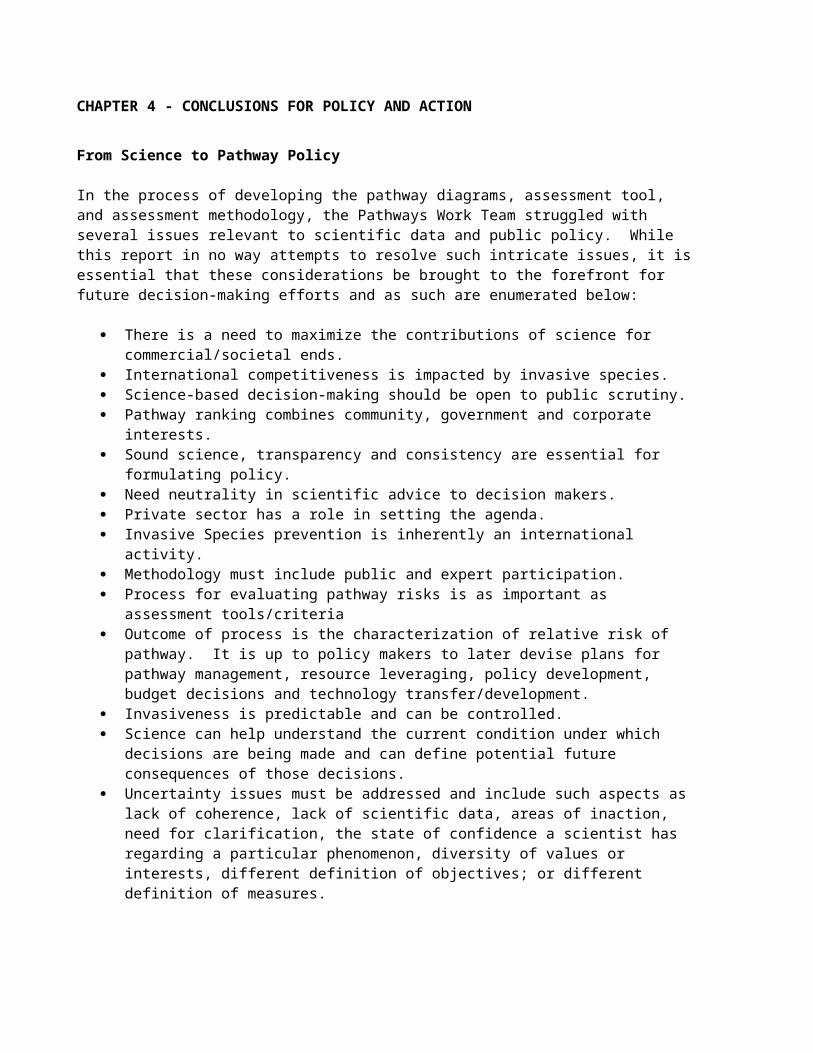
(M) Miscellaneous
M1 BiocontrolM2 Other Aquatic Pathways
M2.1 Interconnected WaterwaysM2.1.1 Freshwater CanalsM2.1.2 Marine/Estuarine CanalsM2.1.3 Domestic Waste Streams
M2.2 Interbasin TransfersM3 Natural Spread of Established PopulationsM4 Ecosystem DisturbanceM4.1 Long-Term (highway and utility rights-of-way, clearing, logging)M4.2 Short Term (habitat restoration, enhancement, prescribed burning)M5 Garbage
M5.1 Garbage TransportM5.2 Garbage Landfill
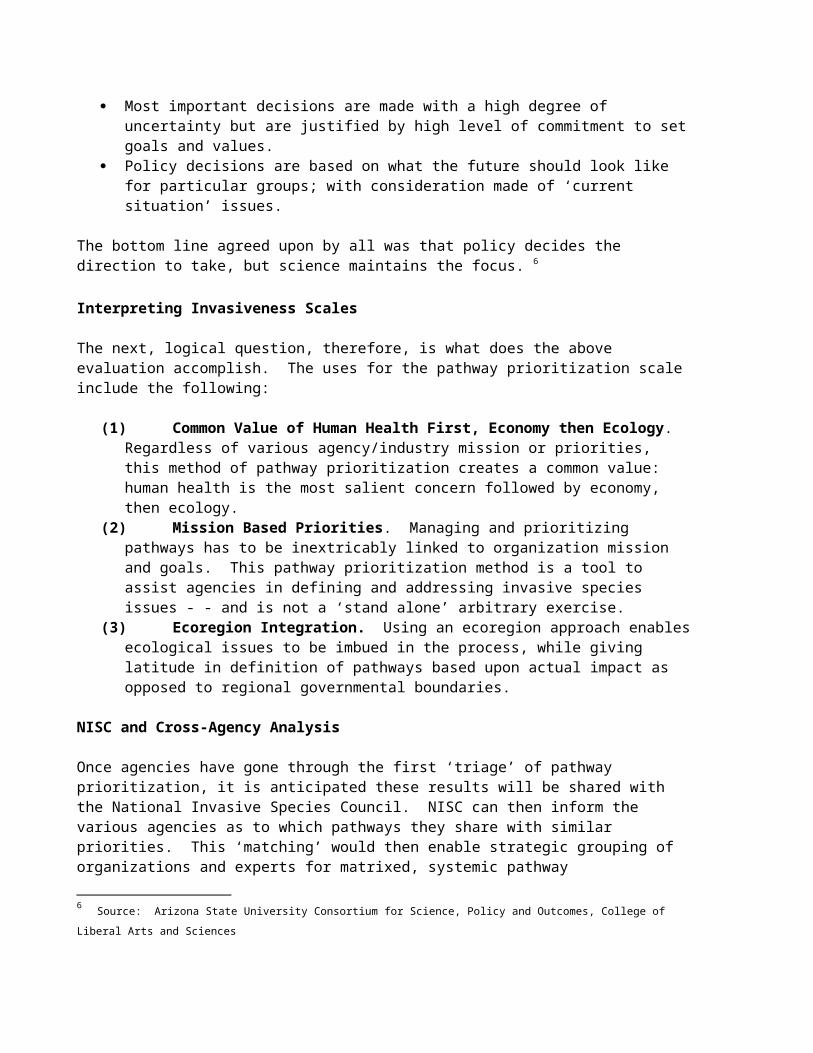
APPENDIX H-Pathways Diagrams
Categorization Of Pathways
Transportation Related Pathways
This category includes all thevarious pathways related totransportation of people and goods.Subcategories include:
1) Modes of Transportation2) Military Travel and Transportation
of Military Vehicles3) Items Used in Shipping Process4) Mail/Internet/Overnight Shipping
Companies5) Travel/Tourism/Recreation
/Relocation
See Diagram 1 for more details
Living Industry Pathways
This category includes all thevarious pathways associated withliving organisms and/or their by-products.Subcategories include:
1) Plant Pathways2) Food Pathways (market ready or
near market ready – transportinganimals for consumption)
3) Non-Food Animal Pathways(transporting animals forreasons other than consumption)
4) Non-Living Animal and PlantRelated Pathways (animal andplant products)
See Diagram 2 for more details
Miscellaneous Pathways
This category includes variouspathways that did not fit into theother two categories. Subcategories include:
1) Biocontrol2) Release of
Animals for Religious, Cultural or Other Reasons
3) Other Aquatic Pathways4) Natural Spread of
Established Populations of Invasive Species
5) Ecosystem Disturbance (long and short term)
See Diagram 3 for more details
Diagram 1

Diagram 2 Transportation Related Pathways(Includes all the various pathways related to the transportation of people, commodities and
goods, including military travel and transportation of military vehicles)
T1Modes of
Transportation(Things doing
the transporting)
T2 Military Travel
and Transportationof Military Vehicles
T-4Mail/Internet
Overnight ShippingCompanies
T-5Travel/Tourism/
Relocation
T3.1Containers(Interiors &
exteriors)
T3.2PackingMaterials
T3.2.1Wood
PackingMaterials(Pallets, crates)
T3.2.2Seaweed
T3.2.3OtherPlant
Materials(Used as packing
materials)
T3.2.4Sand/Earth
(Archaeologicalshipments)
T1.1Air Transportation(Planes, seaplanes,
helicopters, etc. Includes all places where organisms
could hide including wheel wells, cargo
holds, and main cabins.)
T1.2Water/AquaticTransportation
(Freshwater and marine- includes all types ofaquatic vehicles andmovable structures).
T1.3Land/TerrestrialTransportation
(Includes all methods of moving across the
ground)
T5.1Travelers
Themselves(Includes humans as
disease vectors)
T5.2Baggage/
Gear(Carry on
and checkedbaggage; hiking
boots; aquaticrecreationgear, etc.)
T5.3Pets/Plantsand Animals
Transported ForEntertainment
(Pet and horse shows,sporting events,
circuses, rodeos, plantor garden shows, etc.)
T5.4Travel
Consumables(Food on cruise
cruise ships, etc.)
T1.3.1Cars BusesTrucks ATVs
T1.3.2TrainsSubwaysMetrosMonorails
T1.3.3Construction & FirefightingVehicles
T1.3.4HikersHorsesPets
T1.2.1Ship Ballast
Water(And otherthings thathold water)
T1.2.2Hull/
SurfaceFouling (i.e. Recreational
Boats &Vehicles)
T1.2.3Stowaways
In Holds
T1.2.4Superstructures/Structures
Above Water Line(Dredge platforms,
Oil rigs, etc.)
T1.2.5Transportation/Relocation of DredgeSpoil Material
T-3Items Used In The Shipping
Process
T5.5Service
Industries(Industries thatservice ships,planes, etc..)
T2.1
Baggage
T2.2
Equipment

Diagram 3Living Industry Pathways
(includes all pathways associated withliving organisms and/or their by-products)
L1Plant Pathways
(Aquatic and Terrestrial)
L3Non-Food
Animal Pathways(Transporting animals for reasons other than
consumption, excluding entertainment which iscovered in the diagram for transportation pathways)
L2Food Pathways
(Transportation of animalsfor immediate consumption)
L4.2FrozenSeafood
L1.3.2WholePlants
L3.3Aquaculture
(Incl. organismsclassified as
seafood whenshipped for
other purposes)
L3.1Bait
L2.1Live
Seafood(market ready-
to be consumedImmediately)
L2.2OtherLiveFoodAnimals L3.5
Release ofOrganisms
For Religious,Cultural or
OtherReasons
(Prayer animalrelease, animals
released atweddings, animal liberations, etc.)
L1.3.1.1Above GroundPlant Parts(Cuttings,budwood,etc.)
L1.3.1.2Below GroundPlant Parts(Bulbs, roots,culms, tubers, etc.)
L1.3.1.3Seeds andthe SeedTrade
L1.3.1.4AquaticPropagules
SubpathwaysEach of the categories above has subpathways:1) The organism “in trade” itself – whether intentionally released (authorized or unauthorized) or escaped2) Hitchhikers on or in the organism in trade3) Hitchhikers in water, food, nesting/bedding, or growing medium
NOTE: Hitchhikers can include plants, animals, invertebrates, parasites, diseases and pathogens
L4Nonliving
Animal and PlantRelated Pathways
L2.3Plant &
Plant PartsAs Food
L1.1Importation of
Plants forResearch
L1.2Potting Soils,
GrowingMediums,Sods, and
Other Materials(Fertilizers, bioengineering materials such as live turf
and erosion control technologies, live fascines, wetland restoration and
wildflower sods,etc.)
L1.3Plant Trade(Agricultural,
nursery,Landscape, floral, raw Logs, etc.)
L3.4Non-PetAnimals
(Animals for research,zoos, public aquaria,
fur harvest,livestock for non-food
purposes such ashunt clubs, racing,
breeding, draft animals)
L3.2 PetAquarium
Trade(Plants covered
under plant trade)
L4.1Processed and
Partially ProcessedMeat and Meat
ProcessingWaste
L4.3MinimallyProcessed
AnimalProducts
(Hides, trophiesfeathers, etc.)
L4.4MinimallyProcessed
PlantProducts
(Logs, chips,firewood,
mulch, straw,hay, baskets, etc.)
L1.3.1PlantParts
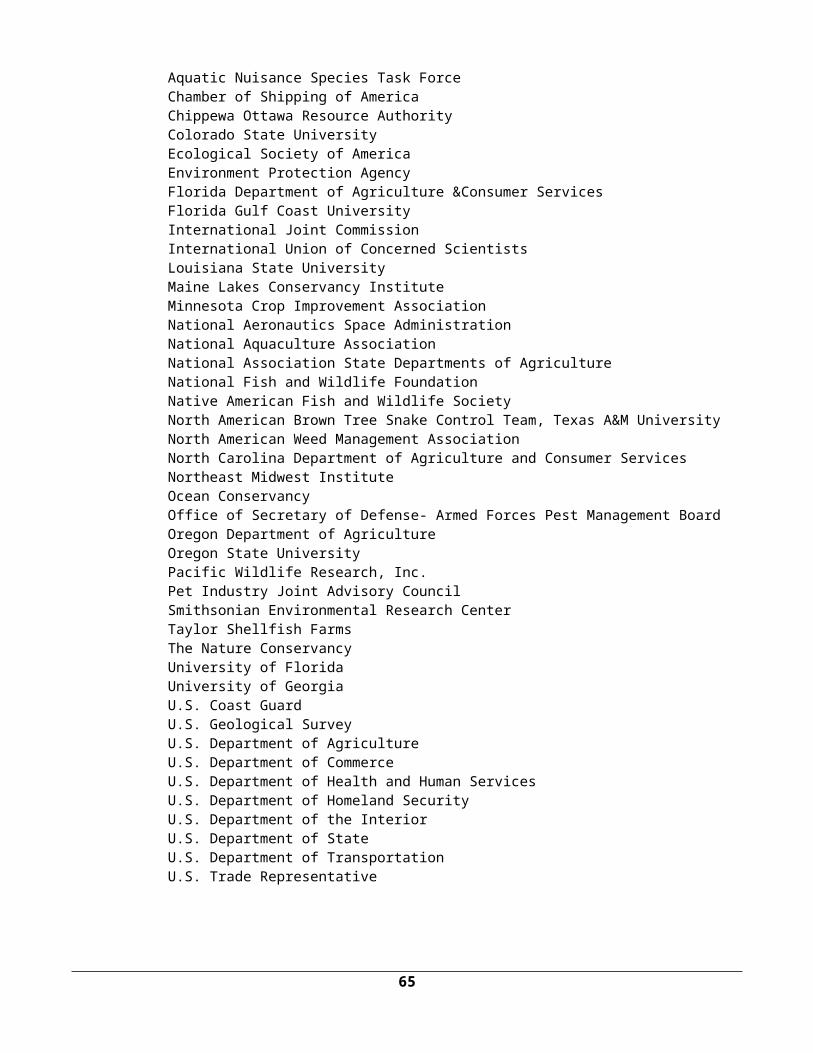
Diagram 4 Miscellaneous Pathways(Includes various pathways that did not fit into the
Transportation or Living Industry Pathway Categories)
M1Biocontrol
M4EcosystemDisturbance
M2.1Interconnected
Waterways
Important Note: For the purposes of these diagrams, this category only refers to the release of an organism for the purposes of biocontrol that unexpectedly becomes an invasive species.
M2.2InterbasinTransfers
(Aqueducts, etc.)
M4.1Long-Term
(Highway and utility
rights-of-way, landclearing, logging,
etc.)
M4.2Short-Term
(Habitat restoration,enhancement
prescribed burning, etc.)
M2Other
AquaticPathways
M3Natural SpreadOf EstablishedPopulations of
Invasive Species(Includes natural migration,
movement and spread ofpopulations, ocean
currents,wind patterns, unusual
weatherevents, spread via
migratorywaterfowl, etc.)
M5Garbage
M5.1Transport
M5.2Landfill
M2.1.1Freshwater
Canals
M2.1.2Marine/Estuarine
Canals
Important Note: The natural spreadof invasive species is a recognized pathway of introduction into new areas, but is not one that will be addressed by the team for the purposes of determining pathway priority, prevention measures, orbest management practices.
M2.1.3Domestic
WasteStreams

RESERVED