
Pathways of Liquid Effluents in Groundwater and Surface Water (Section 2.4.13 SAR) EXAMPLE Pathways...
31
EXAMPLE Pathways of Liquid Effluents Pathways of Liquid Effluents in Groundwater and Surface in Groundwater and Surface Water Water (Section 2.4.13 SAR) (Section 2.4.13 SAR) FRAMES-2.0 Workshop U.S. Nuclear Regulatory Commission Bethesda, Maryland November 15-16, 2007 Pacific Northwest National Laboratory Richland, Washington
-
Upload
wilfrid-neal -
Category
Documents
-
view
221 -
download
0
Transcript of Pathways of Liquid Effluents in Groundwater and Surface Water (Section 2.4.13 SAR) EXAMPLE Pathways...
EXAMPLE
Pathways of Liquid Effluents in Pathways of Liquid Effluents in Groundwater and Surface WaterGroundwater and Surface Water
(Section 2.4.13 SAR)(Section 2.4.13 SAR)
EXAMPLE
Pathways of Liquid Effluents in Pathways of Liquid Effluents in Groundwater and Surface WaterGroundwater and Surface Water
(Section 2.4.13 SAR)(Section 2.4.13 SAR)
FRAMES-2.0 WorkshopU.S. Nuclear Regulatory Commission
Bethesda, MarylandNovember 15-16, 2007
Pacific Northwest National LaboratoryRichland, Washington

2
PurposePurposePurposePurpose
Demonstrate Hierarchical Modeling SSAR assessment: instantaneous mixing, advection, retardation,
decay Modeling: mass balance, advection, dispersion, retardation, decay
Instantaneous release Long-term release (20-yr leak)
Explore Conservative Assumptions Full mixing over the Aquifer Depth Largest Darcy Velocity No Dispersion
Register and use an Excel Spreadsheet
3
Problem DescriptionProblem Description(direct quote from SAR)
Problem DescriptionProblem Description(direct quote from SAR)
“Reactor Coolant Storage Tank is postulated to rupture, and 80% of its liquid volume (92 m3) is assumed to be released in accordance with Branch Technical Position 11-6…Flow from the rupture is postulated to flood the building and migrate past the building containment structure and sump collection system and enter the subsurface at the top of the building slab…(V)ertical downward flow ensues. A pathway is created that would allow the entire 92 m3 to enter the groundwater system instantaneously.”
4
Problem DefinitionProblem DefinitionProblem DefinitionProblem Definition
No vadose zone, aquifer only
Uses known tank concentrations
Instantaneously places 80% (not 100%) of the tank’s mass into only the aquifer’s effective pore space
Uses tank’s total liquid volume to estimate the plan view area of contamination
NOT an instantaneous release scenario, which requires mass balance checks on water and mass flux rates
Mixes contamination over the aquifer depth (conservative?)
Maximum Darcy velocity (noted as conservative)
Advection, Decay, and Retardation Only (noted as conservative)
No Dispersion (noted as conservative)
5
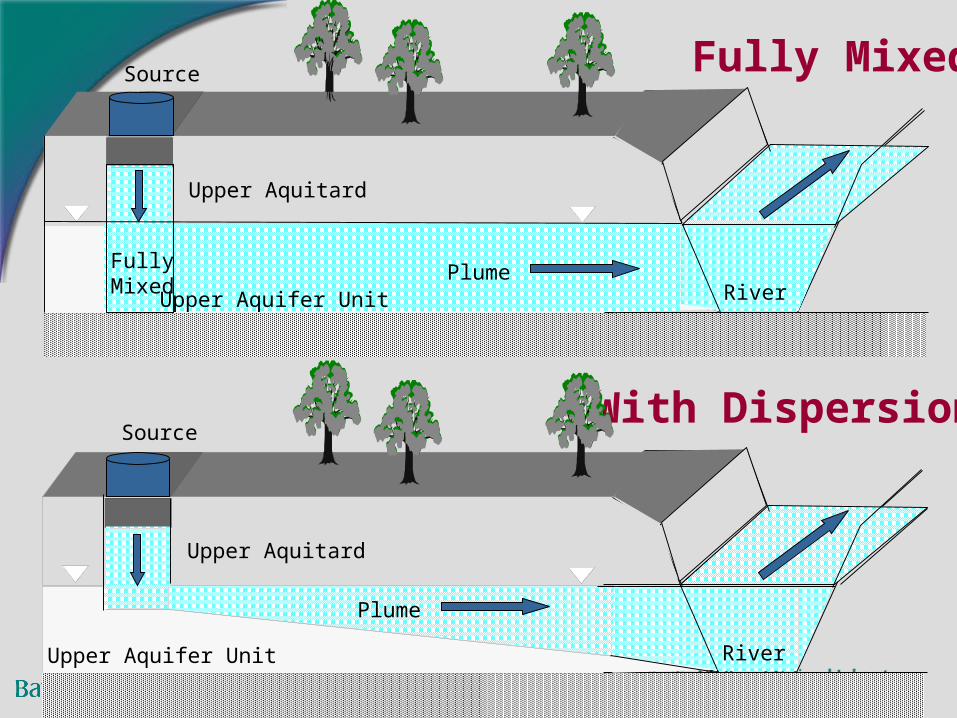
With Dispersion
Fully Mixed
Upper Aquitard
Upper Aquifer Unit
Plume
Source
River
Upper Aquitard
Source
RiverPlume
Upper Aquifer Unit
FullyMixed

6
7
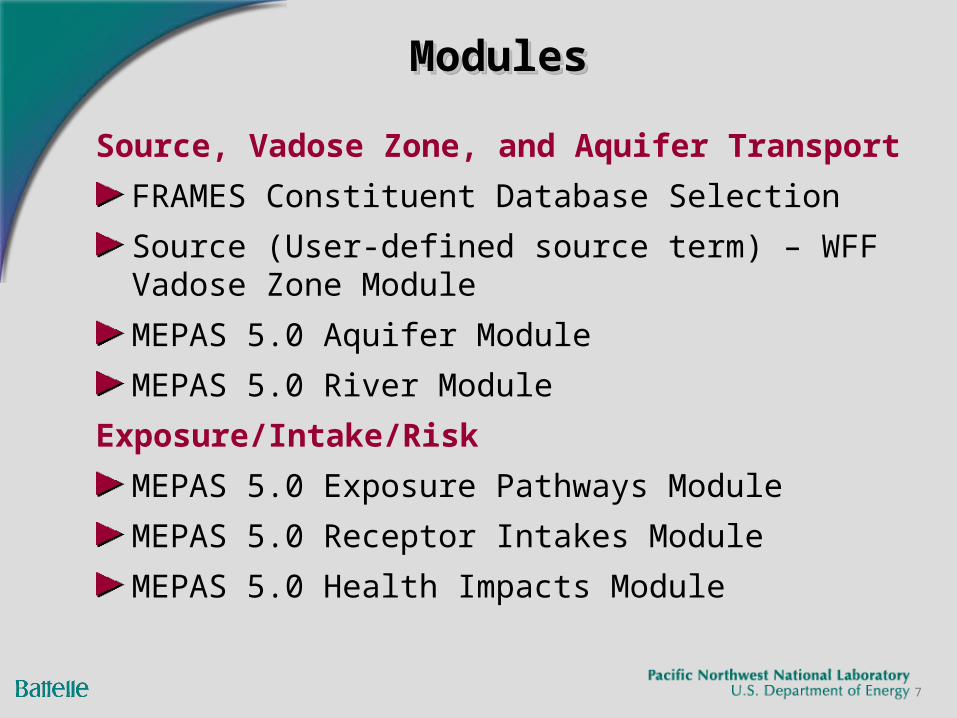
ModulesModulesModulesModules
Source, Vadose Zone, and Aquifer Transport
FRAMES Constituent Database Selection
Source (User-defined source term) – WFF Vadose Zone Module
MEPAS 5.0 Aquifer Module
MEPAS 5.0 River Module
Exposure/Intake/Risk
MEPAS 5.0 Exposure Pathways Module
MEPAS 5.0 Receptor Intakes Module
MEPAS 5.0 Health Impacts Module

8
Model InputModel Input
Registering an Registering an Excel WorksheetExcel Worksheet
(separate presentation)
9

10

11

12
ConstituentDatabase

13
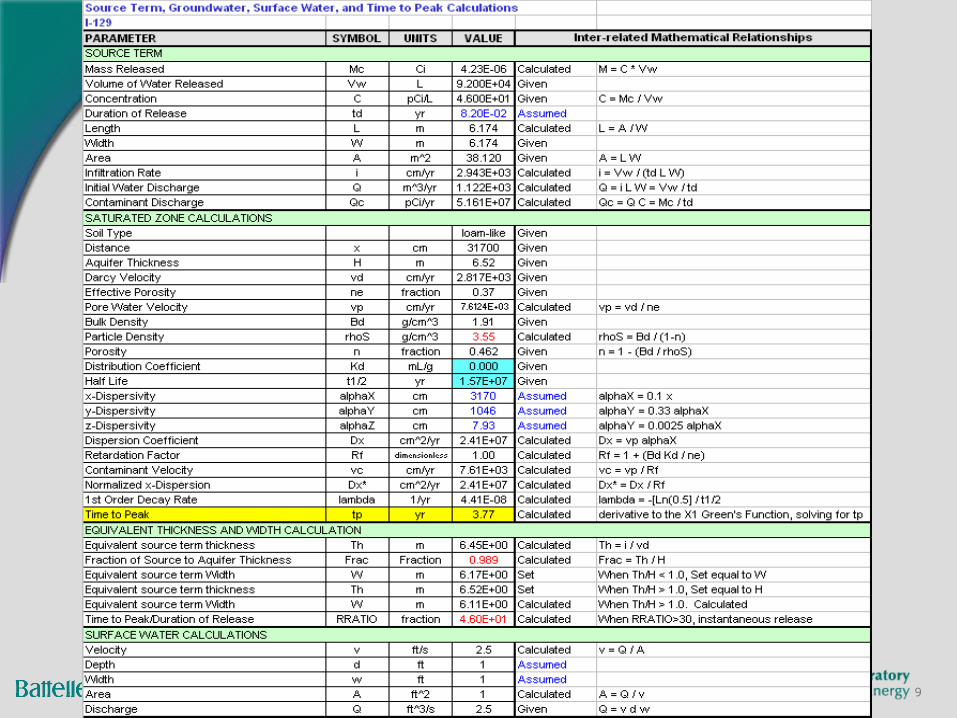
“Source-Term” Module

14
Aquifer Module

15
River Module
16
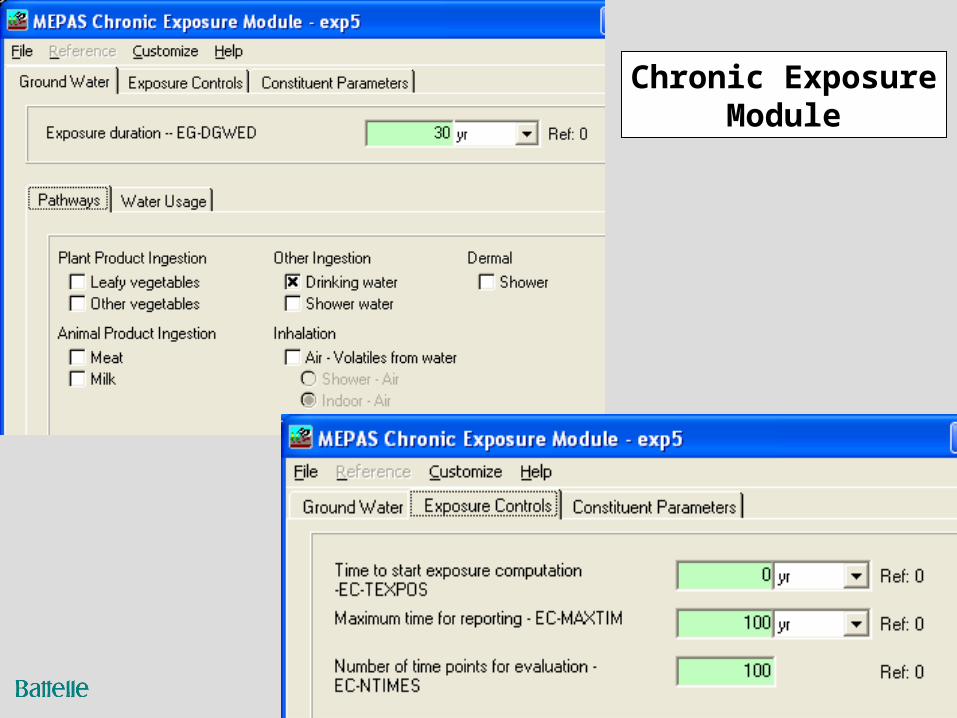
Chronic ExposureModule

17
Intake Module
Impacts Module

18
Output ResultsOutput Results

19
exp5:Aquifer Constituent Concentration for IODINE-1 (I129)
0.00E+00
5.00E-06
1.00E-05
1.50E-05
2.00E-05
2.50E-05
3.00E-05
0 5 10 15 20 25 30 35
yr
pC
i/m
l
exp5:Aquifer Constituent Concentration for STRONTIU (SR90)
0.00E+00
5.00E-05
1.00E-04
1.50E-04
2.00E-04
2.50E-04
3.00E-04
3.50E-04
4.00E-04
4.50E-04
0 50 100 150 200 250 300 350 400
yr
pC
i/m
l
exp5:Aquifer Constituent Concentration for TRITIUM (H3)
0.00E+00
1.00E+02
2.00E+02
3.00E+02
4.00E+02
5.00E+02
6.00E+02
0 5 10 15 20 25 30 35
yr
pC
i/m
l
Constituent Concentrations in
Aquifer at River’s Edge
pC
i/m
L
pC
i/m
L
pC
i/m
L
Years
20
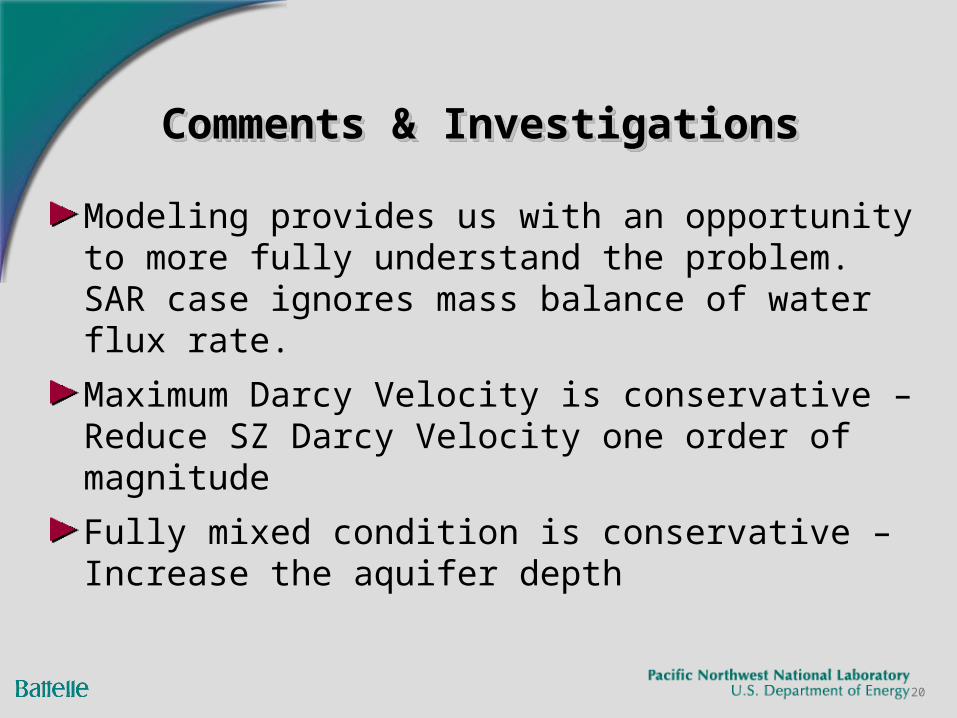
Comments & InvestigationsComments & InvestigationsComments & InvestigationsComments & Investigations
Modeling provides us with an opportunity to more fully understand the problem. SAR case ignores mass balance of water flux rate.
Maximum Darcy Velocity is conservative – Reduce SZ Darcy Velocity one order of magnitude
Fully mixed condition is conservative – Increase the aquifer depth

21
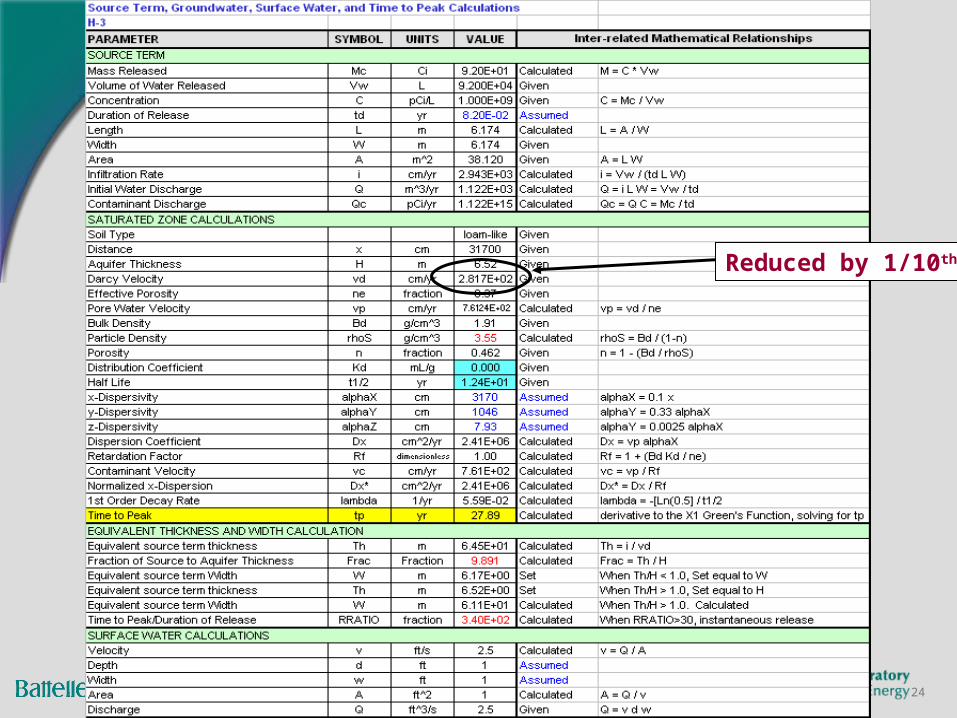
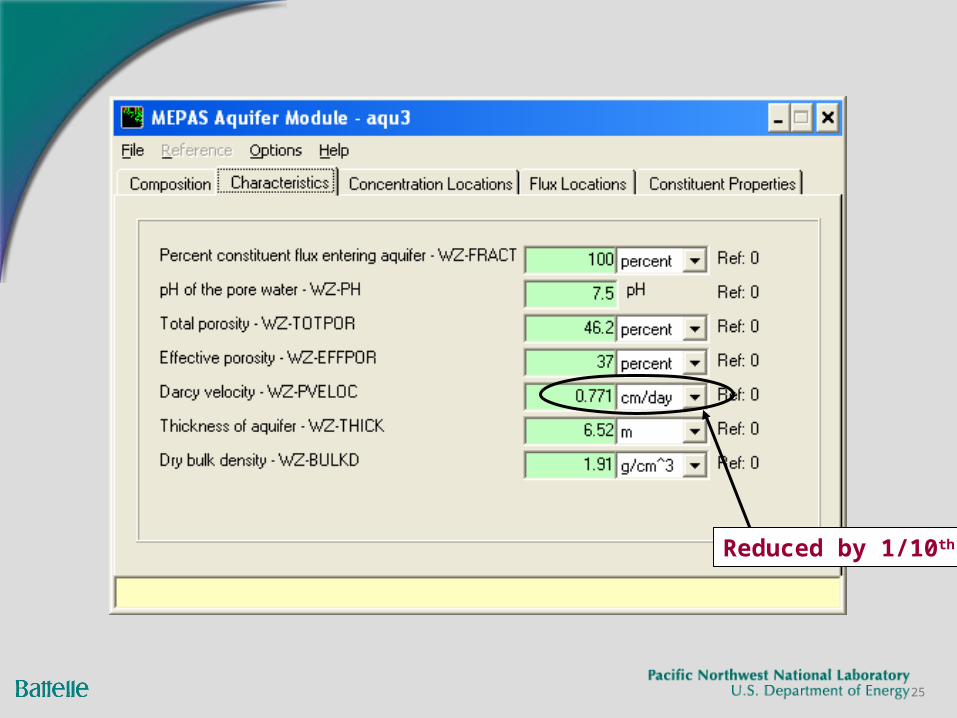
Check to see if a maximum saturated zone Darcy velocity is conservative:Check to see if a maximum saturated zone Darcy velocity is conservative:
Reduce the saturated zone Darcy velocity by an order of magnitude (i.e., 1/10th)

22
Reduced by 1/10th

23
Reduced by 1/10th
24
Reduced by 1/10th
25
Reduced by 1/10th
26
exp5:Aquifer Constituent Concentration for IODINE-129 (I129)
0.0E+00
5.0E-06
1.0E-05
1.5E-05
2.0E-05
2.5E-05
3.0E-05
0 50 100 150 200 250 300 350
yr
pC
i/m
L
exp5:Aquifer Constituent Concentration for STRONTIUM-90 (SR90)
0.0E+00
5.0E-08
1.0E-07
1.5E-07
2.0E-07
2.5E-07
3.0E-07
3.5E-07
0 200 400 600 800 1000 1200
yr
pC
i/m
L
exp5:Aquifer Constituent Concentration for TRITIUM (H3) (H3)
0
20
40
60
80
100
120
0 20 40 60 80 100 120 140 160 180 200
yr
pC
i/m
L
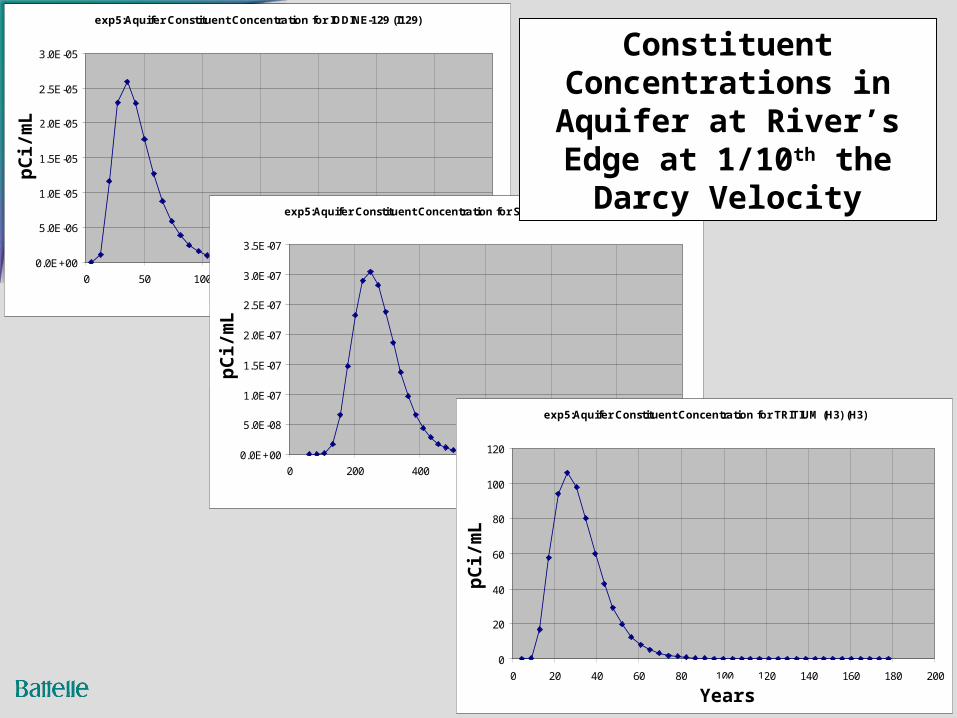
Constituent Concentrations in Aquifer at River’s Edge at 1/10th
the Darcy Velocity
pC
i/m
L
pC
i/m
L
pC
i/m
L
Years

27
Hierarchical Modeling Results

28
Check to see if fully mixed conditions in the aquifer is conservative:Check to see if fully mixed conditions in the aquifer is conservative:
Increase the aquifer thickness.
This case was not run, but the modeling can provide insight on how aquifer depth can impact the conservative assumption.

29
Rule-of-Thumb Relationships
30
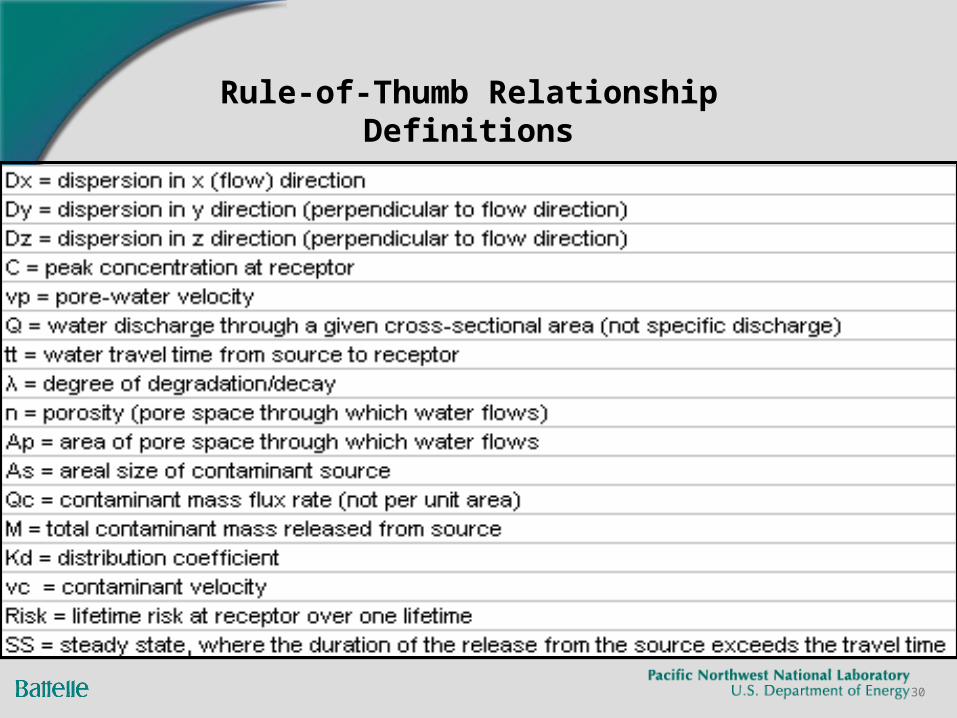
Rule-of-Thumb Relationship Definitions

31
SummarySummarySummarySummary
Many important factors determine whether scenarios and assumptions are conservativeInterdependencies between parametersDuration of releaseTime of concentrationWater mass balanceContaminant mass balance


