Pathway in turning tide Introduction - Realising...
31
[email protected] / +234 1 270 1652 ARM Securities ARM Research [email protected] +234 1 270 1652 11 October 2017 Nigeria Strategy Report | Q4 2017 Outlook Pathway in turning tide Developments in the last few months encapsulated some of the overarching themes we’ve previously laid out. Much of the third quarter seemed to have put to rest keen worries on near-term stability of the naira as well as a five-quarter old economic recession. For now, we awaken to a CBN volte-face and a louder expectation of accommodative monetary policy. Similarly, our conservative outlook on 2017 growth has largely been justified by a contraction in the bellwether Services sector that tapered optimism over latest GDP reading. Momentum for investments appeared to have switched gear, with Nigeria’s equity market notably turning the corners in May following the introduction of the IEW a month earlier. Foreign portfolio investors finally received their bidding in a market wherein CBN involvement in activities is south of 10%. In a word, improvement in FX liquidity restored foreign confidence in a market that was once be-devilled by intense dollar demand management and an overall obsession for “currency protectionism”. Indeed, currency was central to financial markets and economic discuss over the past months, but it did not fully explain the bull run in equities or the fading away of high treasury yields. Economic Snapshot August 2017 Inflation Data/Indices MoM YoY Prev YoY Headline 1.0% 16.0% 16.1% Food 1.1% 20.3% 20.3% All Items Less Farm 0.9% 12.3% 12.2% Imported food 1.3% 14.4% 14.1% Energy 0.4% 10.7% 11.6% Currency Markets Latest Daily Chg YTD USDNGN 360.1 0.08% 14.8% EURNGN 425.5 0.24% 31.6% GBPNGN 474.7 0.07% 25.1% JPYNGN 321.0 0.63% 19.3% Monetary Aggregates – August 2017 (N’bn) MoM YoY M2 21,851 -1.55% -0.93% CPS 21,997 -0.79% -3.55% NCG 4,824 -17.7% 35.9% NFA 9,733 11.3% 32.4% NDC 26,821 -4.32% 1.76% External Position Latest QoQ YoY Trade Balance ($’mn) 2,110 -7.3% N/A External Reserves ($’mn) 32,491 7.27% 6.98% Foreign Debt ($’mn) 15,047 8.97% 31.9% Growth Data – Q2 2017 (N’bn) %of total YoY Real GDP 16,307 100% 0.5% Agriculture 3,745 23.0% 3.4% Oil 1,449 8.9% 1.6% Services 5,974 36.6% -0.5% Wholesale and Trade 2,787 17.1% -1.6% Manufacturing 1,529 9.4% 0.6% Introduction
Transcript of Pathway in turning tide Introduction - Realising...

[email protected] / +234 1 270 1652
ARM Securities
ARM Research [email protected]
+234 1 270 1652
11 October 2017
Nigeria Strategy Report | Q4 2017 Outlook
Pathway in turning tide
Developments in the last few months encapsulated some of the
overarching themes we’ve previously laid out. Much of the third
quarter seemed to have put to rest keen worries on near-term
stability of the naira as well as a five-quarter old economic
recession. For now, we awaken to a CBN volte-face and a louder
expectation of accommodative monetary policy. Similarly, our
conservative outlook on 2017 growth has largely been justified by
a contraction in the bellwether Services sector that tapered
optimism over latest GDP reading.
Momentum for investments appeared to have switched gear, with
Nigeria’s equity market notably turning the corners in May
following the introduction of the IEW a month earlier. Foreign
portfolio investors finally received their bidding in a market
wherein CBN involvement in activities is south of 10%. In a word,
improvement in FX liquidity restored foreign confidence in a
market that was once be-devilled by intense dollar demand
management and an overall obsession for “currency
protectionism”. Indeed, currency was central to financial markets
and economic discuss over the past months, but it did not fully
explain the bull run in equities or the fading away of high treasury
yields.
Economic Snapshot
August 2017 Inflation Data/Indices
MoM YoY Prev YoY
Headline 1.0% 16.0% 16.1%
Food 1.1% 20.3% 20.3%
All Items Less Farm 0.9% 12.3% 12.2%
Imported food 1.3% 14.4% 14.1%
Energy 0.4% 10.7% 11.6%
Currency Markets
Latest Daily Chg
YTD
USDNGN 360.1 0.08% 14.8%
EURNGN 425.5
0.24% 31.6%
GBPNGN 474.7 0.07% 25.1%
JPYNGN 321.0 0.63% 19.3%
Monetary Aggregates – August 2017
(N’bn) MoM YoY
M2 21,851 -1.55% -0.93%
CPS 21,997 -0.79% -3.55%
NCG 4,824 -17.7% 35.9%
NFA 9,733 11.3% 32.4%
NDC 26,821 -4.32% 1.76%
External Position
Latest QoQ YoY
Trade Balance ($’mn) 2,110 -7.3% N/A
External Reserves ($’mn) 32,491 7.27% 6.98%
Foreign Debt ($’mn) 15,047 8.97% 31.9%
Growth Data – Q2 2017
(N’bn)
%of total
YoY
Real GDP 16,307 100% 0.5%
Agriculture 3,745 23.0% 3.4%
Oil 1,449 8.9% 1.6%
Services 5,974 36.6% -0.5%
Wholesale and Trade 2,787 17.1% -1.6%
Manufacturing 1,529 9.4% 0.6%
Introduction

[email protected] / +234 1 270 1652 ARM Securities
Against this backdrop, this report directs attention to a critical assessment of major
market drivers in the review period with a view to ascertaining the sustainability of
current gains as well as highlighting appropriate investment plays in Nigeria’s ever
dynamic terrain. What, for instance, is the fate of equity markets going into 2018?
Will it continue to ride FX-induced momentum? On fixed income, there is a much
louder call for yield moderation in the coming year, but that’s the obvious part. Thus,
rather than end at obvious assertions, we ask the all-important question: “now that
attractive yields are exiting the economic stage, what is the next step? As we approach
year-end and subsequently first half of 2018, we are looking at the continuation of
some trends and starting to see others a little differently.

[email protected] / +234 1 270 1652 ARM Securities
Table of Content
Introduction 1
Crude Oil: Will crude oil ‘roller coaster’ linger? 4
Domestic Macro
GDP: Uphill with the handbrake on 7
Fiscal: Federal Revenue Growth Shows Signs of Life 10
Balance of Payment: Nigeria’s net creditor status diminishes again 12
Naira: Naira resilience – new normal or fleeting reality? 15
Inflation: still an eye into CBN’s monetary policy mind 16
Monetary Policy: Is MPC at a turning point? 18
Capital Market
Fixed Income: Yields trend lower as apex bank changed front 21
Equities: Equities set to maintain upbeat momentum 24
Capital Market Strategy
FI Strategy: Go long but be mindful of duration risk 28
Equity Strategy: See buying opportunities in coming shocks 29
[email protected] / +234 1 270 1652 ARM Securities
Crude oil market rebalancing in the third quarter of 2017 was ahead of our forecast,
as US oil production was partially disrupted by the Hurricane while OPEC stuck to
its pact. For context, at the start of the quarter, we had forecasted a slower
rebalancing of the crude oil market with excess supply projected to decline to
100kbpd (Q2 17: 400kbpd). This view was hinged on quick increases in shale
production, which we expected to moderate the impact of rising demand and
OPEC’s production cut. Irrespective, the impact of hurricane on production made
our earlier call look too pessimistic, after having stoked a faster than expected
rebalancing. Precisely, crude oil market switched to a deficit in the quarter (-
160kbpd) to drive a bull run in the commodity price.
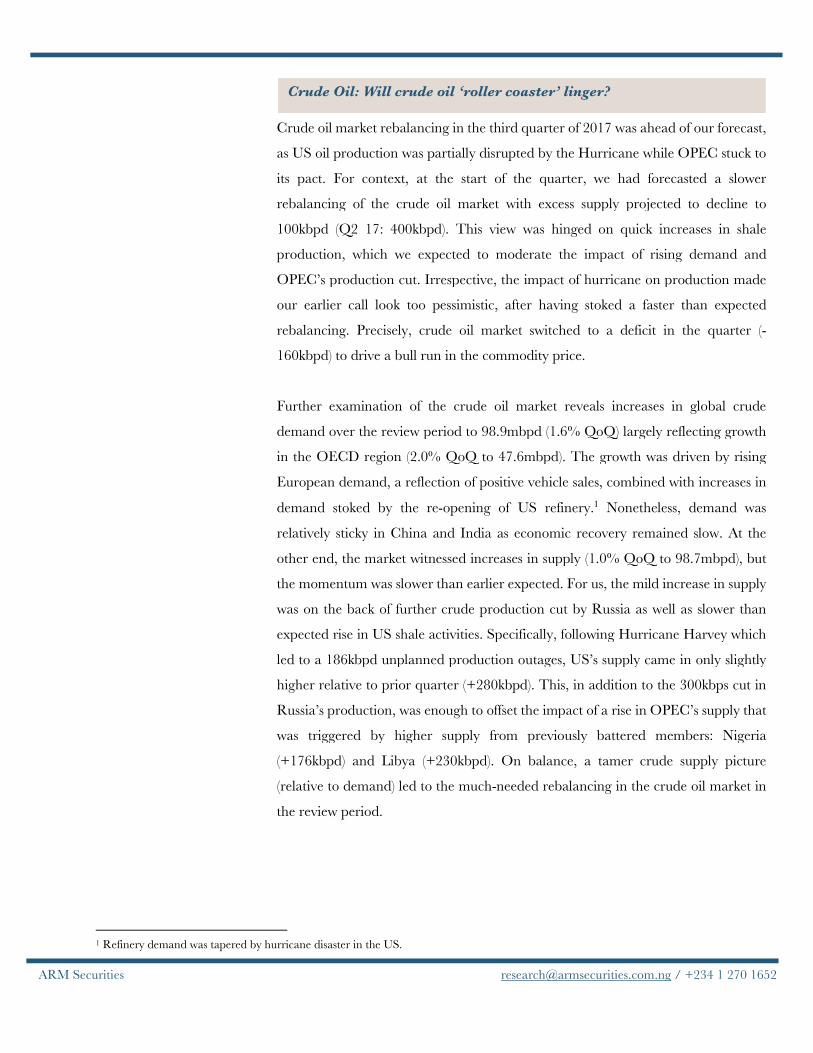
Further examination of the crude oil market reveals increases in global crude
demand over the review period to 98.9mbpd (1.6% QoQ) largely reflecting growth
in the OECD region (2.0% QoQ to 47.6mbpd). The growth was driven by rising
European demand, a reflection of positive vehicle sales, combined with increases in
demand stoked by the re-opening of US refinery.1 Nonetheless, demand was
relatively sticky in China and India as economic recovery remained slow. At the
other end, the market witnessed increases in supply (1.0% QoQ to 98.7mbpd), but
the momentum was slower than earlier expected. For us, the mild increase in supply
was on the back of further crude production cut by Russia as well as slower than
expected rise in US shale activities. Specifically, following Hurricane Harvey which
led to a 186kbpd unplanned production outages, US’s supply came in only slightly
higher relative to prior quarter (+280kbpd). This, in addition to the 300kbps cut in
Russia’s production, was enough to offset the impact of a rise in OPEC’s supply that
was triggered by higher supply from previously battered members: Nigeria
(+176kbpd) and Libya (+230kbpd). On balance, a tamer crude supply picture
(relative to demand) led to the much-needed rebalancing in the crude oil market in
the review period.
1 Refinery demand was tapered by hurricane disaster in the US.
Crude Oil: Will crude oil ‘roller coaster’ linger?
[email protected] / +234 1 270 1652 ARM Securities
Figure 1: Crude oil Supply/Demand vs. Balance (in mbpd)
Source: EIA, ARM Research
Market re-balancing propels best oil price rally since November cut. After
trading below $50/bbl. in July on the back of bearish data from the US, crude oil
prices kicked-off a recovery from August. Pertinently, after the re-opening of US
refineries2 in the prior quarter, weekly data from the US showed subsisting
drawdown in US crude inventories and rig count in the last 8 weeks of the quarter.
The foregoing, combined with knock-on effects of the hurricane contributed to a
20% QoQ increase in the Brent crude price. In terms of sentiment, market switched
to a sharp swing in sheer backwardation (longer-dated contracts trading lower than
the spot price), indicating a possible decline in crude stocks and positive for prices.
2following routine turn-around maintenance (TAM)
-0.5
0.0
0.5
1.0
1.5
2.0
2.5
90.0
92.0
94.0
96.0
98.0
100.0
Q1
15
Q2
15
Q3
15
Q4
15
Q1
16
Q2
16
Q3
16
Q4
16
Q1
17
Q2
17
Q3
17
Global Demand Global Supply
[email protected] / +234 1 270 1652 ARM Securities
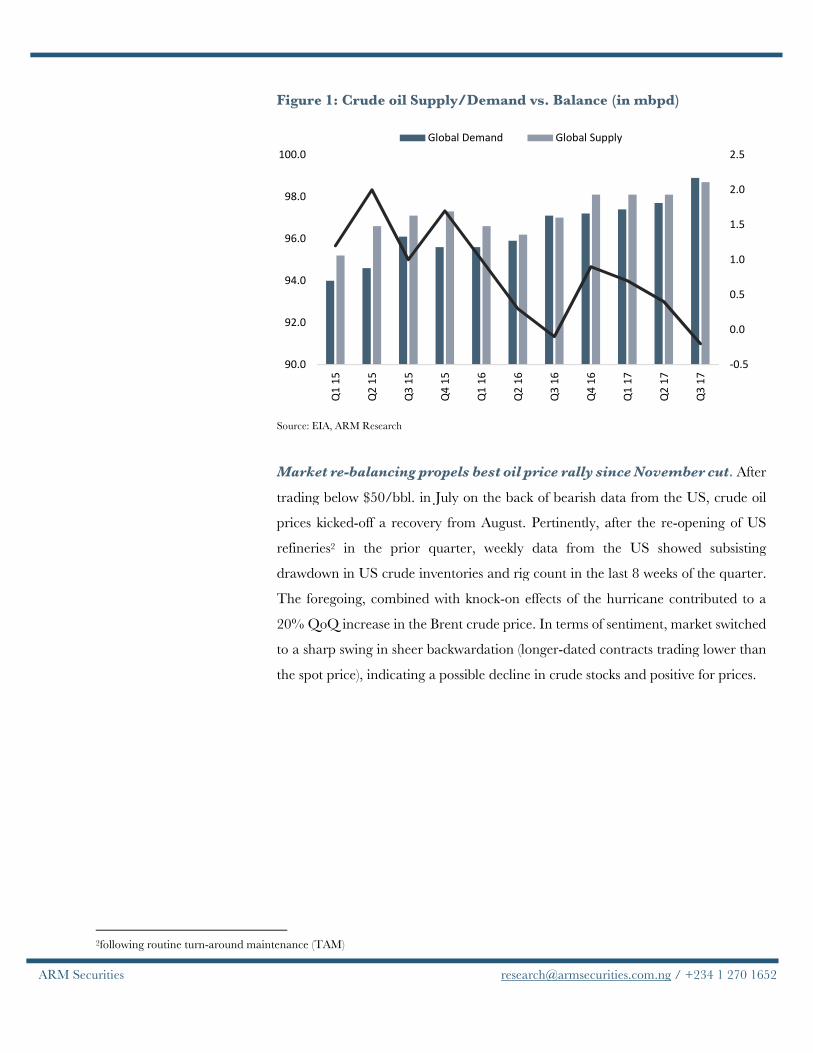
Figure 2: Quarterly mean prices vs. return (historical & forecast)
Source: Bloomberg, ARM Research
We retain our base case forecast. In framing our outlook for crude oil prices
over the next six-months, we hold our base case assumptions. Firstly, while we think
the market has fully rebalance, we expect greater supply from US as the impact of
Hurricane subsides to shake the rebalancing. Pertinently, the impact from recent
Hurricane has yielded smaller damage compared to past storms with a sizable
number of US drillers expected to resume drilling activities in the near term. Also,
feelers from the market suggest that higher production from Nigeria and Libya (of
120kbpd and 100kbpd respectively) is moderating the impact of production cut by
other OPEC members. Finally, we think the long-held converse in the US dollar to
the Brent posit a likely retraction in crude oil prices. Hence, expectation for further
rate hike and unwinding of balance sheet by the US Fed guide to a stronger dollar
and consequently lower crude oil prices.
Given the above, we think risks are more tilted to the downside and our long-held
call of a rebalancing has moved the market’s implied price in line with our call. Based
on the foregoing dynamics, we envisage that a rebalancing of the crude markets
would leave 2017 prices stable, albeit slightly lower in the last quarter of 2017.
Precisely, we expect the confluence of factors to keep mean crude oil prices at a range
of $45 - $50/bbl. with a base case of $50/bbl. The key risk to our forecast will be a
35.2 47.0 47.0 51.0 54.6 50.8 52.2 50.0
6.2%
25.5%
-1.2%
15.8%
-7.0%-9.3%
20.1%
-4.2%
-20.0%
-10.0%
0.0%
10.0%
20.0%
30.0%
30.0
35.0
40.0
45.0
50.0
55.0
60.0
Q1
16
Q2
16
Q3
16
Q4
16
Q1
17
Q2
17
Q3
17
Q4
17
Mean prices ($/bbl.) % QoQ Return -RHS

[email protected] / +234 1 270 1652 ARM Securities
slower than expected ramp up in US production as well as higher compliance by
OPEC and non-OPEC.
After five quarters of negative growth, Nigeria’s recession ended in the second
quarter of 2017 (0.5% YoY) majorly driven by growth on the oil front (1.6% YoY)
that was hinged on improved crude production (Q2 17: 1.84mbpd). Irrespective,
optimism over the reading was weak as non-oil GDP (91% of overall GDP) recorded
a slower pace of growth (0.4% YoY) relative to prior quarter (Q1 17: +0.7% YoY).
A breakdown of the non-oil GDP into its underlying components showed that
growth deceleration in Q2 was led by Services, its largest component, which reverted
to negative growth (-0.5% YoY) after coming out of recession in the prior quarter.
The decline in services was due to weaker output in the ICT sub-sector (-1.2% YoY)
– the first time in 21 quarters—coupled with further contraction in the real estate
sub sector. On the former, the contraction in ICT largely reflected activities in the
telecommunications subsector where active lines declined (-4.7% YoY to 143
million). Meanwhile subdued activities in luxury real estate segment extended the
sector’s pressures for the sixth straight quarter to leave related output lower by 3.5%
YoY (vs Q1 17: -3.1%). Consequently, though non-oil GDP remained upbeat on the
surface, sustaining its expansion at 0.4% YoY (Q1 17: 0.7% YoY), the growth was
disappointing and pointed to a slower recovery than expected.
GDP: Uphill with the handbrake on
Economic Review and Outlook

[email protected] / +234 1 270 1652 ARM Securities
Figure 3: Growth for the non-oil components
Source: NBS, ARM Research
Oil production rebound leads to cautious optimism. Going forward, given
the relative stability in the Niger delta region coupled with the reopening of the
Forcados pipeline, we expect higher oil production over the last two quarters of 2017.
Extrapolating oil production for July using an average 28-month spread between
NNPC and OPEC production data, we think production printed around 1.93mbpd
in July. That said, we estimate Q3 and Q4 2017 crude oil production at 1.9mbpd
and 2.0mbpd consecutively. The foregoing brings H2 17 average crude production
to 1.89mbpd taking our full year crude production estimate to 1.86mbpd (+1.5%
YoY). Consequently, we now expect oil GDP of 0.7% and 1.5% YoY for Q3 and
Q4 17 respectively – with the latter bolstered by the weak base in the corresponding
period of 2016.
-10.0%
-6.0%
-2.0%
2.0%
6.0%
10.0%
Q3
15
Q4
15
Q1
16
Q2
16
Q3
16
Q4
16
Q1
17
Q2
17
Agriculture Manufacturing
Building & Construction Wholesale & Retail Trade
Services

[email protected] / +234 1 270 1652 ARM Securities
Figure 4: YoY Oil GDP growth vs. Oil production
Source: NBS, ARM Research
Services contraction sets hurdle for faster recovery. For the rest of the year,
we expect sustained pressures in the Services sector as we believe the largest sub
sector (telecommunications) appears to be at its peak which should leave growth at
current or even lower levels. Elsewhere, irrespective of the high interest rate
environment and the decline in consumer purchasing power which should ordinarily
remain a drag on output, improved FX liquidity coupled with continued efforts by
the FG to ease the business environment should still sustain the expansion in
manufacturing sector. For evidence, the manufacturing PMI survey for the month
of September already revealed further progress in manufacturing with 15 of its 18
sub-sectors reporting expanded activities (vs. 12 in the prior two months). On other
fronts, subdued demand from high-end users should leave construction GDP
relatively flat while the end of the lean season, improved access to inputs, continued
government support and cheap financing should sustain the growth in the
Agriculture sector. On balance, we now look for non-oil GDP growth of 0.4% and
0.5% YoY in Q3 and Q4 17 respectively. Tying our views across oil and non-oil
GDP, we forecast real GDP growth for Q3 17 and Q4 17 of 1.1% and 2.0% YoY
accordingly. On this basis, we revise our 2017 real GDP forecast slightly lower to
0.7% YoY (previous: 0.8% YoY).
-25.0%
-20.0%
-15.0%
-10.0%
-5.0%
0.0%
5.0%
0.0
0.5
1.0
1.5
2.0
2.5
Q3
15
Q4
15
Q1
16
Q2
16
Q31
6
Q41
6
Q1
17
Q2
17
Q3
17
Q4
17
Oil production (mbpd) Oil GDP (RHS)

[email protected] / +234 1 270 1652 ARM Securities
Figure 5: YoY Oil, non-oil, and real GDP growth
Source: NBS, ARM Research
Over 2018, we think the movement in non-oil GDP will be key to overall economic
growth. The increase in crude oil production over 2017 brings a high base for oil
GDP and thus guides to a slower growth on that font. More so, given weak
investment in the oil sector, we think Nigeria’s crude oil production will peak at
2.2mbpd. For non-oil, we a hold a pessimistic view driven by the high base in
Agriculture and a sustained slack in Services. On Services, with tele density over
100%, tepid subscriber growth should continue to underpin deceleration in
telecommunications GDP. Consequently, ICT GDP growth should remain slack in
2018. Elsewhere, we see limited respite for real estate which is already grappling with
over-supply across most segments. On balance, we think a slower growth in the oil
sector and Agriculture front holds a fragile view on overall GDP in 2018.
Over the first five months of 2017, FG’s fiscal deficit printed at N1.828 trillion (or
~77% of projected fiscal deficit estimate for 2017), largely reflecting sizable revenue
shortfalls on the oil and non-oil fronts. For context, actual federally retained revenues
over the period was sizably lower than budget target (-55% at N1.015 trillion).
However, our analysis points to improved revenue picture in the subsequent two
months. In arriving at this conclusion, we leverage on the seeming relationship
6.2%
2.8%
-1.5%
0.7%
4.0%
-2.0%
-20.0%
-15.0%
-10.0%
-5.0%
0.0%
5.0%
10.0%
2014 2015 2016 2017 Base 2017 Bull 2017 Bear
Oil GDP Non Oil GDP Real GDP
Fiscal: Federal Revenue Growth Shows Signs of Life

[email protected] / +234 1 270 1652 ARM Securities
between historical FAAC and gross federation account revenue, with the former
having accounted for ~93% of the latter over the past 18 months. Using this
relationship and other adjustments as a basis for estimation, we arrive at cumulative
retained revenue of ~N1.51 trillion over the first seven months of 2017. Whilst, like
the case all though January-May, our estimated retained revenue remains sizably
higher than in the corresponding period of 2016, it still lags government’s 2017
projections by a whopping 70%—with drivers of revenue weaknesses on both the oil
and non-oil fronts already detailed out in our H2 17 strategy update.
Figure 6: Breakdown of non-oil revenue (N’ billion)
Source: CBN, ARM Research
Despite the disappointing revenue picture, we believe FG’s expenditure remained at
elevated levels going by budget implementation of 88% between January and May
2017. Thus, cautiously assuming same level of implementation for June and July, we
estimate FG’s fiscal deficit of N2.65 trillion (or over 100% of FG’s target deficit for
2017). Of this lot, cumulative FG foreign and domestic borrowings have, thus far in
2017, only covered 65% on a net basis—with borrowings from external sources
accounting for 58% and domestic debt constituting the remainder. To this point, we
note that FG’s debt-service to revenue ratio printed at 41% over H1 17 to further
underpin FG’s gravitation towards cheaper external borrowings.
Improving oil revenue picture trims deficit forecast. Going forward, we
expect gross oil revenue to ride on both price and production momentum in the
coming months. That said, we still view FG’s oil production target of 2.2mbpd and
0
10
20
30
40
50
60
70
80
90
Jan-17 Feb-17 Mar-17 Apr-17 May-17
Corporate Tax Customs & Excise Duties VAT Independent Revenue Others
[email protected] / +234 1 270 1652 ARM Securities
2.3mbpd for 2017 and 2018 (vs. 1.83mbpd and 1.90mbpd in FY 17E and Q1 18E)
as a tall target which would again see actual receipts lag projections. On the non-oil
leg, we acknowledge potential pass-through from improved FX liquidity that could
gradually cause import duties to track rising imports. That said, with the level of
import activities still expected to be sizably lower than in prior years, we see scope
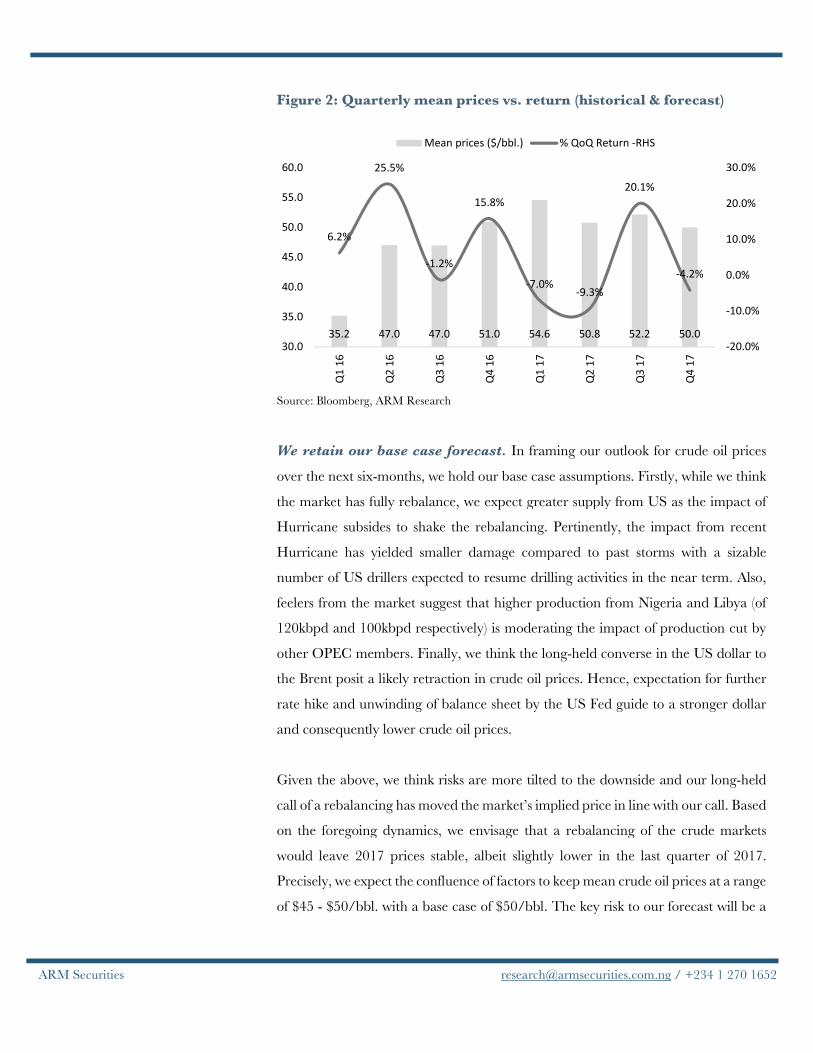
for only limited pass-through to non-oil revenue. In view of the mentioned, we
project actual retained revenues to lag FG’s projection in the coming months with
our base case scenario3 suggesting an implied fiscal deficit of N3.4 trillion in 2017E.
Table 1: 2017 Federation revenue budget vs ARM revised estimates
Source: ARM Research
In Q2 17, Nigeria retained its net creditor status with the rest of world after posting
current account (CA) surplus of $1.4 billion. However, the reading implied a second
consecutive quarterly decline in CA balance after the nation recorded surpluses of
$2.7 billion and $3.3 billion in Q1 17 and Q4 16 respectively. Notably, the recent
plunge in CA surplus was 2.7x that of the prior quarter and was triggered by a decline
in trade surplus and, more importantly, sharp jumps in services and income deficits.
On the goods (trade) front, contraction in surplus position was underpinned by a
surge in imports (+13% QoQ to $8.7 billion) which slightly offset milder export
2017 Estimates Budget Bear Base Bull Oil production (mbpd) 2.20 1.50 1.85 2.20
Oil price ($/bbl) 44.50 30.00 45.00 60.00
Exchange rate (N/$) 305.00 305.00 305.00 450.00
Oil and gas receipts (N' billion) 5,080 2,254 4,171 9,756
Deductions
JV Cash calls (N' billion) - 564 - -
13% derivation (N' billion) 660 220 542 1,268
Net Oil Revenue (N' billion) 4,420 1,471 3,628 8,488
FG Share of oil revenue (N' billion) 2,144 713 1,760 4,117
FG share of non-Oil revenue (N' billion) 1,370 729 825 922
FG independent revenue (N' billion) 808 200 325 450
Other revenue (N' billion) 776 250 290 350
FG Total revenue (N' billion) 5,097 1,893 3,200 5,838
FGN Expenditure (N' billion) 7,444 5,955 6,551 7,444
Fiscal deficit (N' billion) (2,347) (4,063) (3,351) (1,606)
3 Going by current run rate of FG expenditure patterns, we project FY 2017 at N6.6 trillion.
Nigeria’s net creditor status diminishes again

[email protected] / +234 1 270 1652 ARM Securities
growth (+8.5% QoQ to $10.8 billion) to leave the country’s trade surplus at $2.1
billion in Q2 17 (vs. $2.3 billion in Q1 17). In our view, import activities were boosted
by improved FX liquidity following the introduction of I&E window in April with an
isolation of quarterly developments indicating strongest gains in non-oil (+25% QoQ
to $6.6 billion). Specifically, non-oil imports received robust support from higher
importation of food & beverage as well as industrial supplies, both of which jointly
accounted for 47.4% of total imports in Q2 17 (vs. 27.4% in Q1 17). On other fronts,
sizeable net debits in travels, professional and technical services as well as losses on
equity investment positions abroad led to expansion in services and income deficits
in the review period. For context, cumulative deficits across both segments expanded
42% QoQ to $6.1 billion in Q2 17 to largely nullify milder growth in current
transfers (largely unilateral transfers with nothing received in return e.g. workers’
remittance) and leave the country’s CA surplus 48% lower relative to Q1 17 levels.
However, the moderation in CA balance was compensated for by a strong surge in
financial accounts (over three-fold QoQ to $4.3 billion) largely reflecting slower
absolute reduction in foreign reserves (i.e. from debit of more than $2.9 billion in Q1
17 to just over $290 million in Q2 17). In addition, the financial account was
supported by increases in other investments (such as trade credits and loans), FPI and
FDI—with higher FPI mainly skewed towards equities according to information
provided in CBN’s capital importation report4.
With data on the economy set to be released in coming periods, we expect crude
export to consolidate gains from the first full quarter of Forcados re-opening in Q3.
In line with this, recent production estimates are already pointing to crude
production of ~1.9mbpd in Q3 17 (+3% QoQ). However, with mean crude prices
having remained relatively stable over the past three months (+1% QoQ to $51.28),
we see scope for only 4.3% QoQ growth in exports to $11.3 billion in Q3 17E. On
imports, despite the huge dollar sales thus far in 2017, CBN’s dollar cash inflow
numbers (+5.8% MoM to $3.9 billion in July alone) still present ample re-assurance
that ongoing interventions would be sustained in the near term. This, combined with
4 Capital importation into Nigeria increased by 97.3% QoQ to $1.8 billion in Q2 17 with breakdowns showing the biggest jumps in flows to the equity market.
Balance of Payment to survive murky waters

[email protected] / +234 1 270 1652 ARM Securities
continued improvements in FX liquidity, FPI flows, and rising reserves (+1.8% QTD
to $30.8 billion), leaves scope for continued USDNGN stability and availability in
the coming months—with knock-on effect likely to further buoy imports (+9% QoQ
to $9.5 billion in Q3 17) and leave Nigeria’s trade surplus 15% narrower QoQ at
$1.79 billion. Overlaying the implied goods trade surplus with target services and
income deficits of $3.6 billion and $3.2 billion (respectively 4.1% and 3.6% of
forecast Q3 16 GDP) as well as net current transfers of $6.2 billion, we expect the
country’s current account to print at $1.36 billion (Q4 17: $1.1 billion) and 1.3% of
GDP in Q3 17 (Q4 17: 1.1%).
On the financial account, we expect a combination of improving economic picture
and flexible exchange rate system to sustain the demand for naira-denominated
assets over the coming months. Specifically, flows to equity should be buoyed by the
gradual reduction in clearing rates at CBN auctions, and high levels of maturities
expected over the first half of 2018. In our view, all three variables should stoke
downward pressure on yields and increase the viability of equities as an investment
option—especially with the outlook for earnings still positive across select names.
Overall, despite the expected moderation in current account surplus—which should
subsist into H1 18 in our view, projected improvement in financial account picture
suggests little downside risk for the naira in the near term.
Figure 7: CA surplus to GDP ratio – historical and forecast
Source: CBN, ARM Research
-5.1%
-1.2%
-3.9%
-1.5%
1.0%
-2.1%
0.0%
3.4% 3.2%
1.6% 1.3% 1.1%
-6.0%
-5.0%
-4.0%
-3.0%
-2.0%
-1.0%
0.0%
1.0%
2.0%
3.0%
4.0%
Q1
15
Q2
15
Q3
15
Q4
15
Q1
16
Q2
16
Q3
16
Q4
16
Q1
17
Q2
17
Q3
17e
Q4
17e

[email protected] / +234 1 270 1652 ARM Securities
As seen in the previous sections, recent plunge in ‘reserve depletion’ (-90% QoQ to
~$290 million) improved Nigeria’s financial account and tapered concerns over
narrowing CA surplus and naira resilience over much of Q2 17. Going by latest CBN
numbers, the naira again showed toughness at both the NIFEX and BDC markets
over July and August—with breakdowns suggesting a 4.1% appreciation in the latter
relative to Q1 17 average. At the NAFEX end, naira appreciation extended further
into September (+0.9% MoM to mean of N359.79/$) with daily market turnover
reaching $279 million by mid-month. Consequently, narrower spreads have reduced
the potential for arbitrage transactions. For us, the new-found strength in the naira
reflects sustained CBN dollar injections into various FX market strata and higher
foreign portfolio inflows—with the former tracking improvements in Q3 17 reserves
(+4.8% QoQ at $31.8 billion) that have left net monthly dollar inflow into the
economy printing 21% higher at $3.5 billion relative to the average over 2016. No
doubt, optimism over the apex bank’s ongoing FX interventions was aided, to a great
degree, by currency-induced collapse in imports which first became noteworthy in
July 2016 (-36% MoM to $2.5 billion—lowest level since February 2009). Precisely,
the low base for imports masked the impact of collapse in reserves over 2016 by
flattering import cover over the last eight months (+54% to ~12 months). That said,
foreign appetite for naira assets was equally boosted by the regulatory mandate
directing banks to quote the floating IEW rate rather than a fixed exchange rate.
This was seen by markets as a move towards a unified, floating exchange rate.
Irrespective, the jury is still out on if the current naira traction is sustainable.
However, from a BoP perspective, our expectation of continued growth in the
financial account—with reserve drawdown expected to contract further as FPIs and
other investments remain elevated—suggest that the naira would still hold its own in
the near term despite expected decline in CA surplus. In any case, notwithstanding
CBN’s huge FX injections into the economy5, its net dollar inflow has, thus far,
remained positive (save for the one-off deficit of $936 million in May) even as surging
autonomous dollar supply provides impetus to currency markets amidst recent pro-
market initiatives (i.e. gravitation towards synchronized exchange rate for the
5 Dollar sales have remained strong despite reduced demand backlog
Naira resilience – new normal or fleeting reality?

[email protected] / +234 1 270 1652 ARM Securities
country). Whilst we note that, farther out, currently rebounding imports could
slightly dim the picture—especially from an import cover perspective, we retain our
near-term bullishness on the USD across FX market strata and bet on it trending
around current levels till the end of H1 18.
Figure 8: Historical changes in reserve and import cover numbers
Source: CBN, ARM Research
Inflation has, without doubt, overwhelmingly influenced monetary policy discuss in
the last few months with the CBN holding the reality of negative real return on
investment as justification for a sustained hawkish monetary policy thrust. This
position has persisted despite recent moderations in MoM core (-41bps to 1.06%
June through August) and food inflation (-84bps to 1.16% since June). Instructively,
the deceleration in core inflation speaks to extended moderations in energy prices
across the country (August: Petrol: -1.9% YoY, -2.5% MoM; Diesel: -0.15% YoY, -
0.70% MoM; Kerosene: -7.66% YoY, -0.49% MoM) while the surprise clampdown
in food pressures reflected the duo of delayed pass-through from naira gains as well
as the impact of higher domestic production of key agricultural produce in the wake
of CBN’s move to blacklist the importation of some locally available products which
was further bolstered by the run-up to main harvest season in the south.
23.00
28.00
33.00
38.00
43.00
48.00
53.00
Import Cover (months) - RHS Foreign Reserves ($'billions) - LHS Threshold (months) - RHS
Inflation: still an eye into CBN’s monetary policy mind

[email protected] / +234 1 270 1652 ARM Securities
Figure 9: MoM Core and Food vs. YoY headline Inflation
Source: NBS, ARM Research
Despite the retrace in food price pressures in August, we still hold the view that the
last flooding disrupted harvesting in September, with knock-on effect likely to keep
MoM food reading ahead of trend levels. Elsewhere, despite the recent blip, we
expect YoY core inflation to resume deceleration in September as gains from
monthly improvements in FX liquidity become more telling. However, largely
reflecting flood-induced food pressures, we now look for MoM headline reading of
0.95% for September (average in the three years leading to 2016: 0.79% MoM)
which translates to a YoY inflation of 16.14% for September. Farther out (over Q4
2017), we expect MoM food inflation to print above trend levels despite the
commencement of main harvest season (2017 mean: 0.81%; average in five years
leading to 2017: 0.78%). This view is aided by extended flooding in key agricultural
communities such as Benue, wherein portions of farmland and food storage facilities
were washed away. The case for core inflation remains premised on extended
deceleration in energy prices which have, not surprisingly, intersected with steady
improvements in FX market liquidity that we expect to subsist at least in the near
term. In view of the foregoing, we now forecast mean headline inflation of 16.6%
over 2017 (vs. 15.6% in 2016).
0.0%
5.0%
10.0%
15.0%
20.0%
25.0%
0.5%
1.0%
1.5%
2.0%
2.5%
3.0%
Jan-1
7
Feb-1
7
Mar
-17
Apr-
17
May
-17
Jun-1
7
Jul-17
Aug-
17
YoY Core YoY Food MoM Core MoM food

[email protected] / +234 1 270 1652 ARM Securities
Figure 10: 2017 Inflation- actual and forecasts
Source: NBS, ARM Research
High 2017 base implies cap to 2018 price increases. Going into 2018—the
year preceding 2019 general elections, we see little scope for substantial shocks on
the inflation front. To be clear, higher crude oil production while sustained pro-
market initiatives look set to keep encouraging autonomous dollar inflows. In
addition to this, the FG would have little or no motivation to tow the unpopular path
of full PMS deregulation or significant alterations to electricity prices amidst, what
looks set to be, a tough electioneering campaign. With no inflationary shocks in sight
therefore, we see scope for substantial deceleration in headline inflation in 2018
owing largely to high base effect from 2017. That said, increased electioneering
spending—expected to commence in the latter period of H2 18—raises scope for
some temperance in the pace of inflation deceleration towards the close of the year.
For us, headline inflation should average 12.6% over H1 18.
The MPC has achieved something impressive. It now has markets speculating on its
language rather than on actual policy changes. This means that its forward guidance
is working. So, turning to its language, the communique from the latest monetary
policy meeting showed that there was an agreement on the fragility of growth and
18.7%
17.8%
17.2% 17.2%
16.3%
16.1% 16.0% 16.0%16.1%
16.0% 15.8% 15.8%
Jan Feb Mar Apr May Jun Jul Aug Sep Oct Nov Dec
2017 Mean
Is MPC at a turning point?

[email protected] / +234 1 270 1652 ARM Securities
expected moderation in inflation, though the call for caution still echoes. We expect
the MPC to upgrade its assessment of risks in its next meeting, which should guide
to an imminent change in policy.
The talk in markets is that a near-term cut in interest rate is back on the cards. Recent
cessation of the one-year OMO paper and gradual reduction in clearing rates at
OMO auctions suggest that the CBN is edging closer to an inflection point policy
wise if one goes by historical patterns. For evidence, we note the recent action by the
CBN in money markets, which saw it allow liquidity build up into massive demand
at the primary market with the eventual impact driving rates lower at primary market
auctions. In addition to this, CBN’s cessation of one-year bills at its OMO auctions
also explained the current yield trajectory at the treasury end with longer term rates
dropping faster than that of shorter-term instruments. We look again at key drivers
to delineate our outlook for domestic monetary policy.
Sharper moderation in Inflation expected beyond 2017. We expect to end
the year at 15.8%, resulting in a 2017 average of 16.7% YoY. Further, we see
pressures gradually falling apart in 2018 as high base effect and lack of material price
shock take out the steam from current price momentum. For us, headline inflation
should average 12.6% over H1 18. These figures suggest that the CBN will gradually
phase out its liquidity sapping programme with the need to support the fragile
economic growth set to provide more backing. In the near term though, with mean
2017 inflation still materially above CBN target 11% and the MPR, the argument of
trying to ensure positive real returns on investments is likely to remain in support of
CBN’s ongoing monetary policy tightening.
External liquidity position stabilized. In Q2 17, Nigeria retained its net
creditor status in relation to the rest of world after posting current account (CA)
surplus of $1.4 billion. However, the reading implied a second consecutive quarterly
decline in CA balance after the nation recorded $2.7 billion and $3.3 billion in Q1
17 and Q4 16 respectively. Going forward, overlaying the implied goods trade
surplus with target services and income deficits of $3.6 billion and $3.2 billion as well
as net current transfers of $6.2 billion, we expect the country’s current account to
print at $1.36 billion (Q4 17: $1.1 billion) and 1.3% of GDP in Q3 17 (Q4 17: 1.1%),
with a sustained surplus in 2018.

[email protected] / +234 1 270 1652 ARM Securities
Fragile growth outlook. non-oil GDP growth disappointed as the Q2 17 reading
(0.4% YoY) signaled a slowdown from Q1 17 levels (+0.72% YoY) following
contractions in Services and Trade. The pattern in non-oil, owing to a slack in ICT
(12% of GDP) and impact of credit tightening on Trade (17% of GDP), suggests that
the pace of economic recovery is likely to remain soft over the rest of 2017 and even
going into 2018.
Balance of factors guides to an accommodative stance in H1 18. On
balance, juxtaposing the fragile growth picture with expected downtrend in inflation
and improved FX picture because of rising dollar inflows with a subsisting CA
surplus, we see more scope for the apex bank to ease gradually to support the slow
pace of economic recovery. In the interim (Q4 17 and Q1 18), we expect the CBN
to assume a less aggressive stance at its weekly OMO auctions leading to lower rates
on government securities. Farther out, we forecast a cut in monetary policy rate
(MPR) from Q2 18 and expect the MPR to be at 12% by year-end 2018.

[email protected] / +234 1 270 1652 ARM Securities
Coming into the third quarter, our prognosis for the naira yield curve was a
subsisting uptrend over H2 17 followed by a moderation over H1 18. Our
expectation for the yield uptrend was premised on a retention of the hawkish
monetary stance due to concerns on recent naira stability as well as persisting
inflationary pressure, even as we expected higher FG borrowings over the period.
However, the extent to which actual yield trajectory matched expectation was
limited by the evolution of two events. First, the CBN signaled an inflection point
policy wise, going by historical patterns. Pertinently, the apex bank allowed liquidity
build up into massive demand at the primary market which eventually resulted in
rates decline at the primary market auction (PMA). In addition, the CBN ceased
issuance of the one-year bills at its OMO auctions, which led to a downtrend in
Treasury bill yields with longer term rates dropping faster than that of shorter-term
instruments. The second is tied to the FG’s growing concerns over the debt service
metrics with recently released Q2 17 budget implementation report showing that
debt service to revenue ratio has hit 41%. Consequently, the FG was less aggressive
with its bond issuance even as market favored the primary auction for short-dated
securities. Overall, the outcome of these events underpinned a 98bps contraction in
the yield curve to 17.47% over Q3 17 against expectation.
Taking a closer look at the evolution of the yield curve over Q3 17, yield movement
at the short and long-end of the curve was divergent in the first two months of the
quarter, though contraction in September cuts across both segments. Largely
reflecting the build-up in system liquidity in Q2 (Net OMO maturity of N79.8 billion
vs. Net issuance of N933.4 billion in Q1 17), the CBN cut back on rates at its OMO
auction in the review period. In addition, banks increased purchase of treasury bills
following sustained issuance of stabilization securities which raised the opportunity
cost of sitting on excess liquidity6. Farther out, the CBN ceased issuance of the one-
6 Amidst continued special forex intervention by the CBN, banks had increasingly channeled available funds towards meeting forex
purchases with the consequent impact resulting in less participation at OMO auctions. However, faced with subsequent increase
Fixed Income: Yields trend lower as apex bank changed front
Capital Market Review and Outlook
[email protected] / +234 1 270 1652 ARM Securities
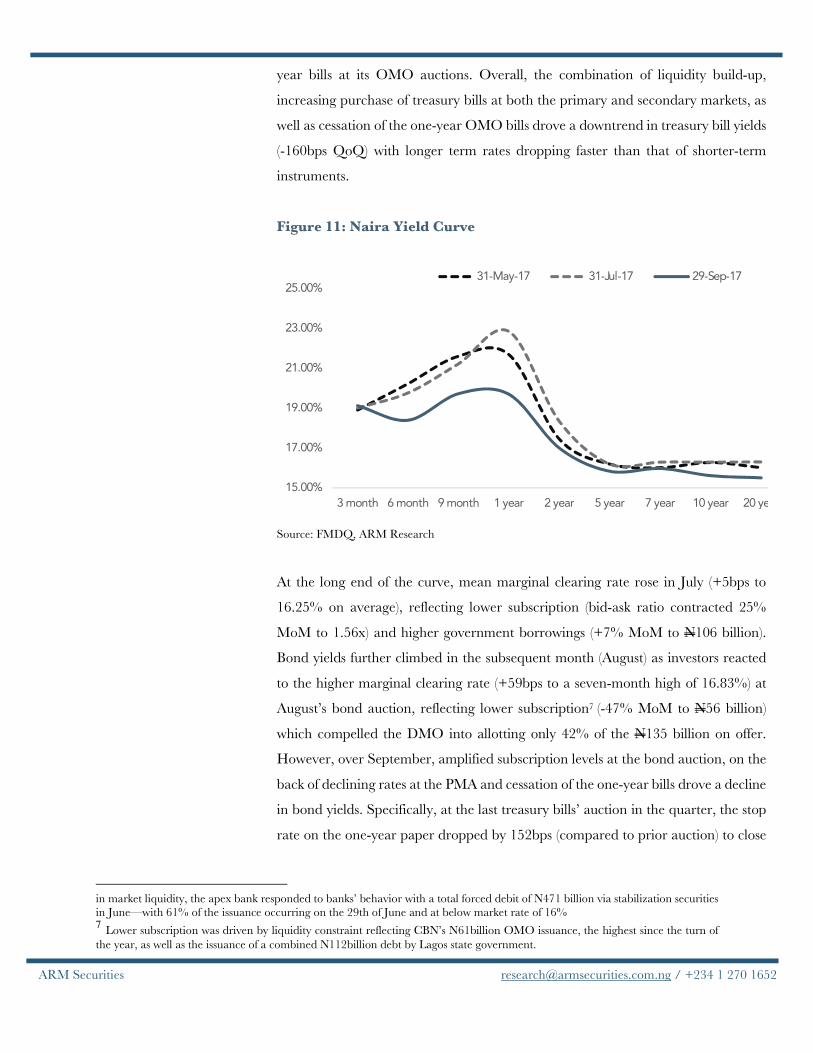
year bills at its OMO auctions. Overall, the combination of liquidity build-up,
increasing purchase of treasury bills at both the primary and secondary markets, as
well as cessation of the one-year OMO bills drove a downtrend in treasury bill yields
(-160bps QoQ) with longer term rates dropping faster than that of shorter-term
instruments.
Figure 11: Naira Yield Curve
Source: FMDQ, ARM Research
At the long end of the curve, mean marginal clearing rate rose in July (+5bps to
16.25% on average), reflecting lower subscription (bid-ask ratio contracted 25%
MoM to 1.56x) and higher government borrowings (+7% MoM to N106 billion).
Bond yields further climbed in the subsequent month (August) as investors reacted
to the higher marginal clearing rate (+59bps to a seven-month high of 16.83%) at
August’s bond auction, reflecting lower subscription7 (-47% MoM to N56 billion)
which compelled the DMO into allotting only 42% of the N135 billion on offer.
However, over September, amplified subscription levels at the bond auction, on the
back of declining rates at the PMA and cessation of the one-year bills drove a decline
in bond yields. Specifically, at the last treasury bills’ auction in the quarter, the stop
rate on the one-year paper dropped by 152bps (compared to prior auction) to close
in market liquidity, the apex bank responded to banks’ behavior with a total forced debit of N471 billion via stabilization securities in June—with 61% of the issuance occurring on the 29th of June and at below market rate of 16% 7 Lower subscription was driven by liquidity constraint reflecting CBN’s N61billion OMO issuance, the highest since the turn of
the year, as well as the issuance of a combined N112billion debt by Lagos state government.
15.00%
17.00%
19.00%
21.00%
23.00%
25.00%
3 month 6 month 9 month 1 year 2 year 5 year 7 year 10 year 20 year
31-May-17 31-Jul-17 29-Sep-17

[email protected] / +234 1 270 1652 ARM Securities
at 17.0%. The attendant impact of this has cascaded into a downtrend in secondary
market rates on bonds. Overall, bond yields declined 34bps relative to prior quarter.
Insert chart on T-Bills and bond auction in the last 6 months and 4th quarter of 2017
(Offer, Subscription, Allotted, Marginal rate)
Rates sensitivity and waning inflation meld into dovish yield outlook
Having established the key influence of CBN’s change of stance in fueling yield
decline in Q3 2017, likely policy trajectory of the apex bank remains central to our
yield outlook. In our monetary policy forecast, we expect the CBN to assume a less
aggressive stance at its OMO windows to continue to drive rates lower in the near
term. On the strength of the mentioned, we expect T-bill yields to decline to sub
18% levels in Q4 2017, with a sizable decline (100-150bps) in H1 2018.
At the longer end of the curve, FG’s borrowing pattern remains crucial in
formulating an outlook. As noted in the fiscal review, we have a base case scenario8
suggesting an implied fiscal deficit of N3.4 trillion in 2017E (vs. N2.4 trillion
stipulated in the budget and N1.8 trillion over the first five months of 2017).
Consequently, we assume a fiscal deficit of N1.6 trillion for the second half of the
year. Precisely, excluding N724billion issued in Q3 2017 (Net Treasury bill
issuances: N318billion, Bond Issuance: N406billion), the FG would need to borrow
circa. N900billion over the rest of this year. Given the foregoing, we adopt a
successful Eurobond issuance of $2.5billion, translating to N900billion to fully cover
our proposed borrowings by the FG and displacing the need for domestic
borrowings. We go on to provide a further N450billion (Q4 17 Bond issuance:
N300billion and Net T-bills issuances: N150billion). To add, we believe concerns
over mounting debt service burden will keep the FG mindful of borrowing cost in
the near term. On balance, this would mean moderated domestic borrowings for the
remainder of the year and, by extension, sustained yield downtrend at the long end.
Tying it all together, we see a subsisting downtrend in the level and slope of the naira
yield curve over the next six months with dovish monetary policy, lower domestic
borrowings, and perhaps some form of coordination with monetary policy to ease
financing costs to drive yields lower.
8 Going by current run rate of FG expenditure patterns, we project FY 2017 at N6.6 trillion.

[email protected] / +234 1 270 1652 ARM Securities
Figure 12: Bond sales and borrowing cost
Source: DMO, ARM Research
In our H2 Nigeria Strategy Report, we had predicted that sizable foreign and
domestic demand for equities, aided by improved fundamental picture and greater
pro-market FX initiatives, would underpin upbeat performance for naira equities.
True to this, the NSE ASI posted an 8.3% QoQ gain in Q3 17 largely reflecting
strong market performance in July (+8.5% MoM) which more than offset weaknesses
in August (-0.3% MoM) and September (-0.1% MoM). As foreign excitement over
the introduction of IEW tapered in July—with net FPI flows having shrunk 46%
MoM to N16.38 billion, it was domestic participation (+13% to N133.65 billion) that
left the bourse in positive territories. Precisely, the domestic support for markets came
from the relatively stickier institutional investors, ~60% of local equities participation
in the period (vs. 47% in May), who are less apt to cash in on profits in the near term.
That said, this resilience on the domestic front slightly gave way in August after
domestic retail investors extended profit taking activities to the home turf. As can be
inferred from the narrowing moderations in the nation’s equity market bourse
(September: -0.1% MoM), investors appear to be gradually re-entering to
strategically position ahead of the Q3 17 results.
Cascading to sectoral levels, our attribution analysis revealed that the food sub-sector
(+29.7% QoQ) had the greatest impact on the equity bourse in the quarter
0.0
50.0
100.0
150.0
200.0
250.0
300.0
15.0
15.5
16.0
16.5
17.0
17.5
Jan-1
7
Feb-1
7
Mar
-17
Apr-
17
May
-17
Jun-1
7
Jul-17
Aug-
17
Sep-1
7
Oct
-17
Nov-
17
Dec
-17
Bond Issuance (N'bln) RHS Marginal Clearing Rate (%)
Equities set to maintain upbeat momentum

[email protected] / +234 1 270 1652 ARM Securities
accounting for 49.7% of the uptrend in the NSE ASI with banking (+7.95% QoQ),
cement (+3.6% QoQ) and brewer’s stocks (+7.6% QoQ) following closely
contributing 32.3%, 14.3% and 13.0% respectively. On the food front, performance
was largely supported by rallies in Dangote Sugar (+52.2% QoQ), Dangote Flour
Mills (+27.9% QoQ), and Nestle (+34.0% QoQ) following substantial price
increases across product portfolios and improved dollar liquidity which buoyed
investor sentiments on earnings. Elsewhere, Nigerian banks tactfully cut back on
loans to private sector to rewrite lingering issues on asset quality and further stamp
their preference for lending to FG via treasuries—with the drive to the latter ably
aided by elevated interest rate environment. Similarly, cement sector largely rode
price-induced topline growth which offset the impact of expensive energy-mix across
the sector. On brewers, support largely stemmed from rallies in Guinness (+32.8%
QoQ) and International Breweries (+21.0% QoQ) following impact of price-induced
revenue growth and belt tightening measures on earnings. Beyond noted gains across
named sectors, investors were also endeared to Personal Care (+4.8%) sector in the
period.
Figure 13: Attribution analysis of quarterly sectoral performance
Source: NSE, ARM Research
Irrespective of the recent rallies, Nigeria’s equity bourse remains cheaper relative to
some Africa climes given its P/E of 13.2x (vs. 17.9x for JSE top 40, 14.5x for
LUSEIDX, and 13.2x for MXEE9). However, equity investing opportunities look
9 Bloomberg Emerging markets, Europe, Middle East, and Africa Index
-100%
-80%
-60%
-40%
-20%
0%
20%
40%
60%
80%
100%
Q1
13
Q2
13
Q3
13
Q4
13
Q1
14
Q2
14
Q3
14
Q4
14
Q1
15
Q2
15
Q3
15
Q4
15
Q1
16
Q2
16
Q3
16
Q4
16
Q1
17
Q2
17
Q3
17
CEMENT BANKING BREWERSFOOD PERSONAL CARE OIL& GASINSURANCE REAL ESTATE CONSTRUCTION

[email protected] / +234 1 270 1652 ARM Securities
more attractive in Egypt (EGX 30 P/E: 13.1x) with fall-outs from the country’s tilt
to pro-market initiatives such as removal of the cap on dollar deposits & withdrawals
and an eventual floatation of the Egyptian pound in late 2016 viewed as particularly
pivotal.
Figure 14: Historical P/E ratios NGSE vs. African peers
Source: Bloomberg, ARM Research
Equities to ride domestic and foreign excitements. In arriving at our broad
outlook for the rest of the year and the first half of 2018, we retain our view that the
trajectory of crude oil prices, domestic macro recovery, FX liquidity, fiscal policies,
and pension reforms will continue to dictate the performance of the equity market.
On crude oil, we believe that the concussion of US supply resurgence post hurricane
setbacks, reported production ramp-up in Nigeria and Libya, coupled with the
potential squeeze of spot crude demand & new contracts leave scope for deceleration
in crude prices going into 2018. Nonetheless, domestic macro appears set to extend
its positive momentum going into 2018 with recent PMI numbers providing earliest
indications of sustained resurgence. Beyond this, continued rise in crude export
proceeds leaves the nation’s reserves well above the $30 billion mark with CBN’s
cash flow position also providing positive re-assurances that the apex bank’s FX
market interventions across strata is not yet done and dusted. Needless to mention,
recent efforts at achieving unification of FX rates via relatively pro-market and
transparent measures are feelers that the market could still see further FPI flows to
0.0
5.0
10.0
15.0
20.0
25.0
30.0
35.0
40.0
Jan-1
5
Mar
-15
May
-15
Jul-15
Sep-1
5
Nov-
15
Jan-1
6
Mar
-16
May
-16
Jul-16
Sep-1
6
Nov-
16
Jan-1
7
Mar
-17
May
-17
Jul-17
Sep-1
7
NGSE EGX30 JSE Top 40 LUSEIDX

[email protected] / +234 1 270 1652 ARM Securities
equity. Perhaps providing some support for this view is the sharp resurgence in net
FPI inflows to equity (over seven-fold MoM to ~N123 billion) that came off the back
of some profit taking in August. To be clear, with the re-entry targeted towards the
end of the third quarter, we believe that foreign investors may have started taking
positions in anticipation of further FX-induced earnings. Elsewhere, we expect
domestic equity investors to carefully latch on to the bandwagon with key support
expected to come from institutional players. Precisely, with alternative yield-paying
investment outlets such as treasuries set to become relatively unattractive in line with
our expectation for yield downtrend, we expect domestic investors to pay greater
attention to equities with companies currently burdened with high domestic interest
expense potential benefactors.
Cascading to sectors, while lower interest rate environment should ordinarily deem
prospect for strong gains in interest income for most banks, we are of the view that
the gap would be largely plugged by a tilt towards private sector loan growth. In
addition, recent recoveries in crude oil prices and ongoing power sector loan
restructuring should limit concerns on asset quality front. Similarly, improved crude
production should give hand to upstream O&G share price even though weaker
margins in petrol segment—owing to higher input cost—remains likely to drive
earnings lower in the downstream. Elsewhere, sectors that largely rode on price-
induced gains this year (i.e. cement) are unlikely to reproduce the aggressive top-line
growth momentum in 2018, but investors are likely to take solace from a relatively
stable energy cost environment. On balance, we see improved economic
fundamentals and gradual recovery as potential drivers of a bull outlook in the
coming months.

[email protected] / +234 1 270 1652 ARM Securities
In our Fixed Income review and outlook section, we made our call of a further
downtrend in yields up till H1 2018 on the back of accommodative monetary policy
and FG lighter borrowing patterns on the domestic leg. To be clear, we see a
subsisting downtrend in the level and slope of the naira yield curve over the next six
months with dovish monetary policy, lower domestic borrowings, and perhaps some
form of coordination with monetary policy to ease financing costs to drive yields
lower.
Irrespective, beyond the first half of 2018 comes a looming risk that can volte-face
our call – political risk gearing towards the election. First off, increased electioneering
spending—expected to commence in the latter period of H2 18—raises scope for
some temperance in the pace of inflation deceleration towards the close of the year.
Secondly, a possible desperation by the FG to fulfil its earlier mandate will moderate
earlier sensitivity towards borrowing cost and channel a sizable portion of deficit
financing on the local market as the uncertainty gearing towards election may keep
foreign investors jittery, moderate inflows and stir capital flight, thus pushing yields
up. Consequently, naira would likely come under pressure. Tying it all together, we
see a more volatile pattern in the level and slope of the naira yield curve over the
next 15 months with dovish monetary policy and elevated repayment cycle in H1
2018 creating a gravitational pull on yields. Farther out, the political risk in H2 2018
implies some form of yield uptick, which would certainly point to further yield curve
twists.
Having framed our outlook, we see merits in positioning bond portfolios towards the
long end of the curve but slightly lowering position at the very long-end. Short and
medium term is a good place to be at this point because the segment has been doing
well. We are not completely in favor of going all-out long-end because that would
mean higher volatility as our H2 2018 call plays out. Basically, we recommend a
staggered approach to building duration with emphasis on mid-tenured bonds on
FI Strategy: Go long but be mindful of duration risk
Capital Market Strategy

[email protected] / +234 1 270 1652 ARM Securities
the downward slope of the naira curve in a bid to ‘run-down the curve’ as dovish
influences kick into gear over H1 2018. Farther out, as yield uptick slightly sets in
and currency shows up, we advise a rotation back into the money market to wait out
the political risk storm. Overall, our strategy calls for investors to position bond
portfolios with an eye on flexibility ahead of what promises to be a roller-coaster 15
months for debt markets.
In our H2 17 outlook, we held the view that investors adopted a contrarian approach
to selected names as against a ‘Buy and Hold’ strategy. This view reflects our less
sanguine outlook for equities over the second half of the year relative to H1 17 given
the rich valuation across most of our selected names in the equities space which
limited the scope of significant upside compared to H1 17. In all, we projected a
more tepid rise in the NSE-ASI with short term market volatility attributed to the
intersection of profit takers and bargain hunters. Indeed, the muted equity market
performance measured in terms of average daily traded (volume and value) in Q3 17
relative to Q2 17 suggests our call largely played out.
In arriving at our strategy for the rest of the year and the first half of 2018, we retain
our view that the trajectories of crude oil prices, domestic macro, FX liquidity, fiscal
policies, and pension reforms remain crucial with developments in the last four
expected to support further rallies. To be clear, we expect gains from the quartette
to make up for impact of potential interest rate hike and balance sheet downsizing in
US, European tilt towards hawkish monetary policy orientation and prospective
crude price contraction going into 2018. That said, initial reactions to global
monetary policy changes and shocks to oil are still likely to provoke transitory upsets
in the market even though our overriding view remains bullish. To re-iterate, a major
underpin for our equity market optimism is the projected moderation in yields that
would limit investment options for both domestic and foreign investors in the coming
months. Even now, institutional appear to have switched into panic mode as they
attempt to lock in higher yields for fear of the coming interest rate downslide. Thus,
with the allure of higher yield gone, 2018 should see a gravitation towards
investments powered by company fundamentals with companies currently burdened
by high domestic interest expense (i.e. UACN) likely to be among beneficiaries. In
Equity Strategy: See buying opportunities in coming shocks

[email protected] / +234 1 270 1652 ARM Securities
passing, we also note that on the back of expected rates moderation, tier two banks’
funding costs should fall more quickly than their interest income to provoke some
rebound in net interest margin in the coming year.
Thus, juxtaposing this tempered bullish run with the positive view on selected stocks,
we assume steady swings in coverage names for the rest of 2017 and H1 18 and thus
retain our recommendation of a flexible approach to comfortable stocks—buying the
dips and selling the rally as against a “Buy and Hold” strategy. For instance, we
expect the intersection of lower crude price as well as interest rate increase & balance
sheet downsizing in the US to present the last buying opportunity of 2017 by
December. Farther out, with 2017 largely a year of strong earnings rebound for most
coverage names, attractive dividend yields on FY 17 corporate result is expected to
spur buy momentum and create selling opportunities early in the second quarter of
2018. For clarity, this expected dividend play should also drive appetite for most part
in Q1 18 though with the incline for profit taking currently high amongst foreign
portfolio investors and domestic retail players, market gains are likely to be short-
lived.
In conclusion, we re-emphasize that times of higher market volatility, while often
trying for individual investors, can be opportunities for skilled active managers. For
us, we think after a strong counter trend move, if the longer-term outlook remains
intact, looking for opportunities to “buy the dip” and “sell the rally” will be a solid
investment strategy for choice names.
[email protected] / +234 1 270 1652 ARM Securities
Copyright © 2017 Asset & Resource Management Company Limited (“ARM”).
All rights reserved. Unauthorised use, reproduction, distribution or disclosure of this document is strictly prohibited.
This material has been issued by Asset & Resource Management Company Limited (“ARM”), a Company regulated by the Nigerian Securities and
Exchange Commission. The analyst(s) primarily responsible for preparing this research report, in whole or in part, certifies that with respect to each
security or issuer covered; all of the views expressed accurately reflect his/her personal views about the subject securities and issuers and no part of
his/her compensation was, is, or will be, directly or indirectly, related to the inclusion of specific recommendations or views in the report.
This research report is based on information from sources that ARM and its analysts believe to be reliable. Neither ARM nor any of its research analysts,
nor any member of the ARM Group, gives any representation or warranty, express or implied, or undertaking of any kind or assumes responsibility or
liability of any kind with respect to the accuracy or completeness of the information set out in this report or any third party’s use (or the results of such
use) of such information. This report is provided solely for informational purposes and is not to be construed as providing advice, recommendations, or
endorsements of any kind whatsoever. The investments and strategies discussed here may not be suitable for all investors; counsel of investment advisor
should be obtained with regard to such investments and or strategies. This research report is not a replacement for advice from an accountant, lawyer,
personal finance advisor or other category of investment advisor. The investments discussed in this report may oscillate in price or value. Opinions and
information provided are made as of the date of the report issue and are subject to change without notice. This research report is not intended as an
offer or solicitation for the purchase or sale of any financial instrument. Reference herein to any specific security or financial instrument does not
necessarily constitute or imply its endorsement or recommendation by ARM, its directors, officers, employees or designated agents. Members of ARM
may act as broker, advisor or lender, or make a market in any investments or issuers referenced in this report. Further information on any of the securities
discussed herein may be obtained upon request to ARM. By accepting this document, you agree to be bound by the foregoing limitations.