Pathogens and Pandemics Introduction. Pathogen Trivia What was the name of the viral epidemic that...
37
Pathogens and Pandemics Introduction
-
Upload
helen-anderson -
Category
Documents
-
view
217 -
download
0
Transcript of Pathogens and Pandemics Introduction. Pathogen Trivia What was the name of the viral epidemic that...

Pathogens and Pandemics
Introduction

Pathogen Trivia
• What was the name of the viral epidemic that happened in 1918?
• What virus was deliberately put on blankets by the English before giving the blankets to the Native Americans in 1754?
• What did the Tartars catapult across the walls of Kaffa in an ancient seige?
• What virus saved a Polish village from a Nazi attack during WWII?
• http://ed.ted.com/lessons/how-pandemics-spread

In June, 2009 – the following news report was given:
http://www.youtube.com/watch?v=-871tHE4jzg
The next few slides are adapted from an online PowerPoint created by Christine Herrmann, PhD.
The questions are in order of the slides.Turn in at end of hour.

www.BioEdOnline.org
Infectious Diseases - Definitions Disease – a pathological condition of body parts or tissues
characterized by an identifiable group of signs and symptoms.
Infectious disease – disease caused by an infectious agent such as a bacterium, virus, protozoan, or fungus that can be passed on to others.
Infection – occurs when an infectious agent enters the body and begins to reproduce; may or may not lead to disease.
Pathogen – an infectious agent that causes disease.
Host – an organism infected by another organism.
Virulence – the relative ability of an agent to cause rapid and severe disease in a host.(
BioEd Online

www.BioEdOnline.org
Infectious Diseases as a Cause of Death
Infectious diseases are responsible for a quarter to a third of all deaths worldwide.
Infectious diseases account for more than half of all deaths in children under the age of 5.
Of the top ten causes of death compiled by the World Health Organization, five are due to infectious diseases.
The top single agent killers are HIV/AIDS, malaria and tuberculosis. The other top killers are lower respiratory infections and diarrheal diseases, which are caused by a variety of agents.
BioEd Online

www.BioEdOnline.org
Infectious Diseases Throughout History
Infectious agents have probably always caused disease in humans.
Smallpox has been described in ancient Egyptian and Chinese writings and may have been responsible for more deaths than all other infectious diseases combined.
There is evidence that malaria and poliomyelitis have existed since ancient times.
In the 14th Century, the bubonic plague, or Black Death, killed about 20 million people in Europe alone.
In the 20th Century, the 1918 influenza may have killed up to 50 million people worldwide
Close to 20 million people have died of AIDS to date.
Courtesy of CDC
Recreated 1918 Influenza virions. The 1918 Spanish flu killed more than 500,000 people in the United States and up to 50 million worldwide.
BioEd Online

www.BioEdOnline.org
Koch’s Postulates
Koch developed four criteria to demon- strate that a specific disease is caused by a particular agent.1. The specific agent must be associated with
every case of the disease.2. The agent must be isolated from a diseased host
and grown in culture.3. When the culture-grown agent is introduced into
a healthy susceptible host, the agent must cause the same disease.
4. The same agent must again be isolated from the infected experimental host.
BioEd Online
www.BioEdOnline.org
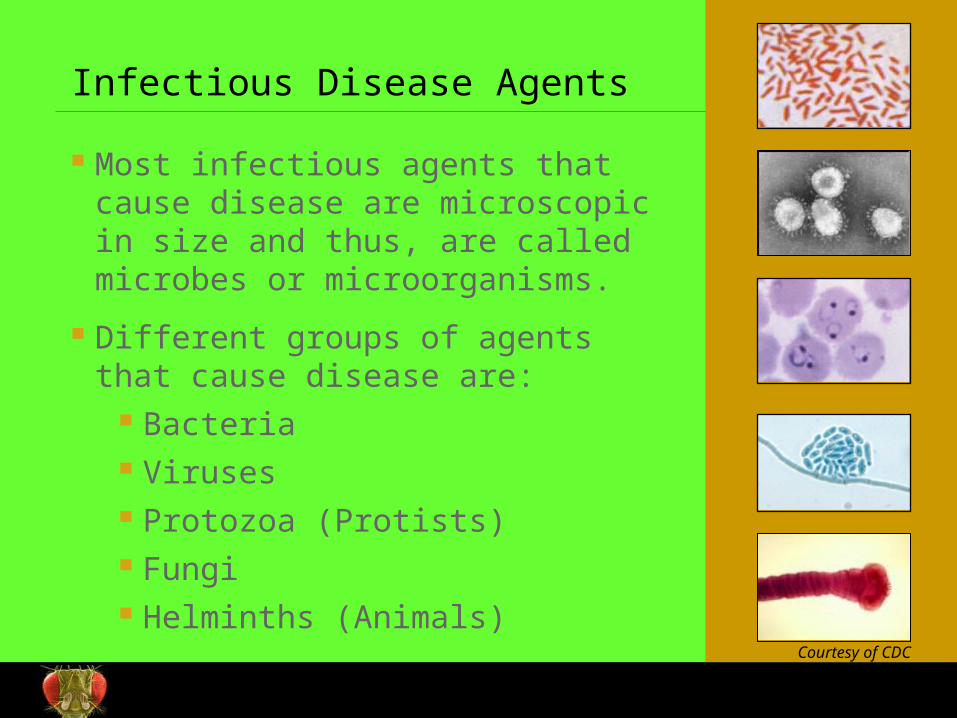
Infectious Disease Agents
Most infectious agents that cause disease are microscopic in size and thus, are called microbes or microorganisms.
Different groups of agents that cause disease are:
Bacteria Viruses Protozoa (Protists) Fungi Helminths (Animals)
Courtesy of CDC
BioEd Online

www.BioEdOnline.org
Transmission of Infectious Diseases
Agents that cause infectious diseases can be transmitted in many ways.
Through the air Through contaminated food or water Through body fluids By direct contact with contaminated
objects By animal vectors such as insects,
birds, bats, etc.
Courtesy of VOA
Chinese students wearing masks during a
SARS outbreak
Courtesy of CDC
Aedes aegypti mosquito Known to transmit
Dengue fever
BioEd Online

www.BioEdOnline.org
Phases of Infectious Disease
Incubation period – time between infection and the appearance of signs and symptoms.
Prodromal phase – mild, nonspecific symptoms that signal onset of some diseases.
Clinical phase – a person experiences typical signs and symptoms of disease.
Decline phase - subsidence of symptoms.
Recovery phase – symptoms have disappeared, tissues heal, and the body regains strength.
BioEd Online

www.BioEdOnline.org
Classification of Infectious Disease
By duration Acute – develops and runs its course quickly. Chronic – develops more slowly and is usually less severe,
but may persist for a long, indefinite period of time. Latent – characterized by periods of no symptoms
between outbreaks of illness.
By location Local – confined to a specific area of the body. Systemic – a generalized illness that infects most of the
body with pathogens distributed widely in tissues.
By timing Primary – initial infection in a previously healthy person. Secondary – infection that occurs in a person weakened
by a primary infection.
BioEd Online

www.BioEdOnline.org
How Infectious Agents Cause Disease
Production of poisons, such as toxins and enzymes, that destroy cells and tissues.
Direct invasion and destruction of host cells.
Triggering responses from the host’s immune system leading to disease signs and symptoms.
Courtesy of CDC
Human Immunodeficiency Virus. HIV-1 virions can
be seen on surface of lymphocytes.
BioEd Online

www.BioEdOnline.org
Example of an Infectious Disease - Flu
Acute contagious disease caused by the influenza virus.
Respiratory tract infection, but symptoms felt throughout entire body.
Epidemics occur seasonally with low fatality; more deadly pandemics occur several times each century.
Highly changeable virus that can infect multiple species, including humans, pigs, and birds.
Concern exists that current avian flu or H1N1 will lead to a new pandemic.
BioEd Online

www.BioEdOnline.org
Example of an Infectious Disease - AIDS
AIDS (Acquired Immune Deficiency Syndrome) is the disease caused by the virus called HIV (human immunodeficiency virus).
HIV attacks cells of the immune system and destroys their ability to fight infection by other agents.
HIV is spread through the direct exchange of body fluids.
There is a long period of time from HIV infection to the onset of AIDS.
Anti-HIV drugs prolong the length and quality of life, but there is no vaccine or cure for AIDS.
Courtesy of CDC
This highly magnified transmission electron micrographic (TEM) image revealed the
presence of mature forms of the human virus
immunodeficiency (HIV) in a tissue sample under
investigation.
BioEd Online

www.BioEdOnline.org
Emerging Infectious Diseases
Emerging diseases are those that have recently appeared within a population, or whose incidence or geographic range is increasing rapidly.
Diseases can emerge or re-emerge due to: appearance of a previously unknown agent. evolution of a new infectious agent. spread of an infectious agent to a new host. spread of an infectious agent to new locations. acquisition of resistance to anti-microbial drugs. deliberate introduction into a population.
BioEd Online

www.BioEdOnline.org
Reducing the Spread of Infectious Diseases
Vaccines
Antimicrobial drugs
Good personal hygiene and sanitation
Protection against mosquitoes
Quarantine
BioEd Online

• Read the Handwashing Fact Sheet
• The following slides are from a research study done on handwashing in America.
• View the research study and then answer the questions.

www.harrisinteractive.com
©2007, Harris Interactive Inc. All rights reserved.
A Survey of Handwashing Behavior (Trended)
Prepared for
September 2007

19
Research Objectives
The American Society for Microbiology and the Soap and Detergent Association are interested in continuing to monitor handwashing habits of people in public restrooms.
The objective of the research is to compare the actual observed number of U.S. adults who wash their hands after using a public restroom against the percentage who self-report that they wash their hands in several situations:
After petting a dog or cat
Before handling or eating food
After coughing or sneezing
After using a public restroom
After handling money
After changing a diaper
After using the bathroom in their home
The purpose of this research is to increase public awareness of the importance of handwashing.

20
Methodology – Telephone Survey
The data from the telephone survey are based on a nationally representative sample, stratified by census region and weighted by gender, education and ethnicity composure to represent the U.S. population.
This method assures a valid national probability sample.
Harris Interactive has conducted the self-reported handwashing habits among adult Americans in 2003, 2005, and 2007.
1,001 telephone interviews were conducted between August 17-20, 2007.
1,013 telephone interviews were conducted between August 19-22, 2005.
1,000 telephone interviews were conducted between August 22-26, 2003.
Findings from similar telephone studies in 2000 and 1996 are also referenced in this report.

21
2007 Methodology – Public Attractions Observations
Harris Interactive observed the behavior of 6,076 adults who appear to be age 18 and older in public restrooms located at major public attractions in the U.S. and recorded whether or not they washed their hands after using the facilities. The research was conducted in four cities and at six different locations:
Atlanta – Turner Field
Chicago – Museum of Science and Industry and Shedd Aquarium
New York City – Penn Station and Grand Central Station
San Francisco – Ferry Terminal Farmers Market
Observers discreetly watched and recorded whether or not adults using public restrooms washed their hands. Observers were instructed to groom themselves (comb their hair, put on make-up, etc.) while observing and to rotate bathrooms every hour or so to avoid counting repeat users more than once. Observers were also instructed to wash their hands no more than 10% of the time.
The 2007 observational research results can be directly compared to the 2005 findings (6,336 observations) they took place at the same locations using the same methodology. The 2003 observational research findings are not directly comparable to 2005 and 2007 because they took place at different locations.
The 2003 observational research represent the observed behavior of 7,541 individuals in public restrooms located in major metropolitan airports in the U.S. and Canada, specifically: New York City, Chicago, San Francisco, Dallas, Miami and Toronto.

22
2007 Methodology – Public Attractions Observations
City and Location Male Washers
Male Non-Washers
Female Washers
Female Non-Washers
TOTAL
Atlanta: Turner Field (Atlanta Braves baseball games)
464 351 723 38 1,576
Chicago: Museum of Science and Industry
251 88 392 58 789
Chicago: Shedd Aquarium 332 79 243 57 711
New York City: Grand Central Station 360 130 450 45 985
New York City: Penn Station 162 98 209 46 515
San Francisco: Ferry Terminal Farmers Market
469 281 630 120 1,500
TOTAL 2,038 1,027 2,647 364 6,076

23
Executive Summary
Similar to 2005, nine in ten (92%) adults say they always wash their hands after using public restrooms; however just over three in four (77%) were observed doing so (down from 83% in 2005 and unchanged from 78% observed in 2003).
The highest percentage of handwashing among men was observed in Chicago’s Shedd Aquarium (81%). For women, the highest percentage of handwashing was observed in Atlanta’s Turner Field (95%).
The decline in handwashing observations is largely due to males. The percentage of males observed washing their hands fell from 75% in 2005 to 66% in 2007. Overall, percentage of females observed washing their hands is down slightly from 90% in 2005 to 88% in 2007.
The largest decline in observations was seen among San Francisco males, down 15 percentage points from 85% in 2005 to 63% in 2007.
The largest decline in observations among females were observed at the Shedd Aquarium in Chicago (-12 pts) and Penn Station (-10 pts).
The largest gap between male and female handwashing patterns was observed at the Braves baseball game where 95% of women were observed washing their hands compared to 57% of males.
Among observational findings from public attractions in four major cities, the lowest percentage of hand washers were in Atlanta (Braves baseball game) and New York City (Penn & Grand Central Stations). The highest percentage of non-washers were observed at Penn Station (28%) and the Braves baseball game (25%).
While 92% of adult Americans self-report always washing their hands after using a public restroom and 86% self-report always washing their hands after using the bathroom in their home, only one-quarter (25%) self-report always washing their hands after handling money and one-third (34%) after coughing or sneezing.

24
2007 Detailed Findings

25
2007 Public Attractions Observations
– 2007 Observational Findings Among Complete Sample –
77
75
81
79
73
23
25
19
21
27
Total
Atlanta
Chicago
New York
SanFrancisco
2007 Based on the observation of 6,076 individuals in public restrooms located at major public attractions2005 Based on the observation of 6,336 individuals in public restrooms located at major public attractions
% %Washers
Non-Washers
2005
83
17
74
26
88
12
78
22
88
12
2005
87
13
89
11
79
21
77
23
81
81
82
72
19
19
18
28
Chicago - Museum ofScience and Industry
Chicago - SheddAquarium
New York - Grand CentralStation
New York - Penn Station

262007 Based on the observation of 3,065 males 2005 Based on the observation of 3,206 males
– 2007 Observational Findings Among Males –
66
57
78
70
63
34
43
22
30
37
Total
Atlanta
Chicago
New York
SanFrancisco
%
74
81
73
62
26
19
27
38
Chicago - Museum ofScience and Industry
Chicago - SheddAquarium
New York - Grand CentralStation
New York - Penn Station
%
2007 Public Attractions Observations
Washers
Non-Washers
2005
75
25
63
37
83
17
65
35
85
15
2005
81
19
85
15
67
33
64
36

272007 Based on the observation of 3,011 females 2005 Based on the observation of 3,130 females
– 2007 Observational Findings Among Females –
%
2007 Public Attractions Observations
88
95
85
88
84
12
5
15
12
16
Total
Atlanta
Chicago
New York
SanFrancisco
87
81
91
82
13
19
9
18
Chicago - Museum ofScience and Industry
Chicago - SheddAquarium
New York - GrandCentral Station
New York - Penn Station
%Washers
Non-Washers
2005
90
10
84
16
93
7
90
10
91
9
2005
93
7
93
7
89
11
92
8

28
After petting a dog or cat
Before handling or eating food
After coughing or sneezing
After using the bathroom in your home
After changing a diaper
After handling moneyAfter using a
public restroom
Handwashing Habits: National Telephone Survey Results How Frequently Do Americans Say They Are Washing Their Hands?
Always wash my hands
(Usually wash my hands)
– Self Reported Handwashing Practices: Total Sample (2003 to 2007) –
Q: I am going to read you a list of activities and I’d like you to tell me how often you make it a practice of washing your hands. How often do you wash your hands after…
2003
44%
(17%)
2005
42%
(16%)
2003
80%
(14%)
2003
31%
(27%)
2003
87%
(8%)
2005
77%
(14%)
2005
32%
(23%)
2005
83%
(10%)
2003
75%
(2%)
2005
73%
(4%)
2003
95%
(3%)
2005
91%
(6%)
2003
22%
(16%)
2005
21%
(18%)
2007
34%
(27%)
2007
78%
(13%)
2007
42%
(14%)
2007
86%
(9%)
2007
73%
(5%)
2007
25%
(19%)
2007
92%
(5%)

29
– Self Reported Handwashing Practices: Men vs. Women (2005 & 2007) –
Petting a Dog or Cat
Handling/ Eating Food
Coughing/ Sneezing
Using a Public
Restroom
Handling Money
Changing Diapers
Using Bathroom at Home
%2005 2007
2005 20072005 2007
2005 20072005 2007
2005 20072005 2007
Women Always/Usually
65 6493 95
66 6897 98
47 5287 84
96 99
Always 50 48 82 8439 39
94 9627 30
82 8088 89
Men Always/Usually
50 49 87 8744 53
96 9730 36
68 7190 92
Always 34 35 71 7124 28
88 8914 19
64 6578 82
Q: I am going to read you a list of activities and I’d like you to tell me how often you make it a practice of washing your hands. How often do you wash your hands after…
While men remain less likely than women to wash their hands regardless of activity, they appear more likely than last year to wash after coughing or sneezing. Similarly, both men and women are more likely to wash after handling money.

30
Petting a Dog or Cat
Handling/ Eating Food
Coughing/ Sneezing
Using a Public
Restroom
Handling Money
Changing Diapers
Using Bathroom at Home
% 2005 2007 2005 2007 2005 2007 2005 2007
2005 2007 2005 2007 2005 2007
Age <35 Always/Usually
61 53 85 87 56 64 98 100 37 42 76 81 91 92
Always 47 39 72 71 35 28 94 92 20 21 72 73 82 82
Age 35-54 Always/Usually
58 60 93 94 58 61 98 97 37 43 85 81 93 97
Always 39 44 77 80 32 37 93 94 21 24 80 76 83 88
Age 55+ Always/Usually
57 57 92 93 53 59 95 96 40 48 73 71 94 97
Always 43 44 80 83 30 37 88 92 20 29 68 69 84 89
Q: I am going to read you a list of activities and I’d like you to tell me how often you make it a practice of washing your hands. How often do you wash your hands after…
Generally, various age groups suggest similar washing patterns with the exception of lower percentages of adults 55+ washing after diaper changes and adults younger than 35 less likely to wash before handling/eating food.
– Self Reported Handwashing Practices: By Age (2005 & 2007) –

31
Petting a Dog or Cat
Handling/ Eating Food
Coughing/ Sneezing
Using a Public
Restroom
Handling Money
Changing Diapers
Using Bathroom at Home
% 2005 2007 2005 2007
2005 2007 2005 2007 2005 2007 2005 2007 2005 2007
Education:High School or Less
Always 45 46 80 78 32 37 88 89 21 31 69 72 83 85
Some College/College/Post Grad
Always 42 38 76 76 32 32 94 95 21 19 77 73 84 87
Income Level:Annual Income <$40K
Always 47 50 82 83 36 38 93 94 24 28 74 71 83 87
Annual Income $40K+
Always 37 35 72 75 27 29 92 91 18 19 76 75 84 85
Q: I am going to read you a list of activities and I’d like you to tell me how often you make it a practice of washing your hands. How often do you wash your hands after…
Those with higher education are more diligent about washing their hands after using a public restroom. Similar to 2005 those with lower incomes are more likely to wash after petting a dog/cat, before handling/eating food, after coughing/sneezing, and after handling money.
– Self Reported Handwashing Practices: By Education and Income Level (2005 & 2007) –

32
2007 Telephone Survey Demographics
Gender
48% Male
52% Female
Household Income
18% Less than $20,000
13% $20,000 to $30,000
9% $30,000 to $40,000
8% $40,000 to $50,000
34% $50,000 or more
Age
28% Younger than 35
38% 35-54
31% 55 or older
Education
13% Some high school
32% High school grad
28% Some College
17% College grad
9% Post grad
– Among U.S. Adults –

Answer questions about research
• What type of research study did they conduct? Why do you think that?
• What does the study conclude about handwashing in America today?
• Michigan Studyhttp://www.youtube.com/watch?v=PT45b7NLYCQ

To emphasize the point…to the Beatles tune, “I Wanna Hold
Your Hand”
• http://www.youtube.com/watch?v=AtlcS77LaB0

International Clean Hands Week
• September 20-26, 2009
• Juniors – You have high school. See individual group instructions for reminding the high school to have clean hands.
• Bookmarks – Rosa, Mike, Melissa
• Flyers – Shane, Kayla, Cody
• Brochures – Jake, Tuff

International Clean Hands Week
• September 20-26, 2009• Seniors – You have elementary school. See
individual group instructions for reminding the elementary school to have clean hands.
• Flyers – Erika, Cotton, Bryar• Bookmarks – Andrew, Austin, Cody, Tiffany• Brochures – Kerry, Devin, Ethan, Ian, Adam

Hall of Shame
• Select an infectious disease from the provided list.
• Find out the answers to the provided questions about your infectious disease.
• This will be due Thursday.
![WHOLE OF - SOCIETY PANDEMIC READINESS€¦ · • Pandemics ARE worldwide epidemics • Pandemics ARE unpredictable [Origin - Timing - Severity - Duration] • Pandemics HAVE happened](https://static.fdocuments.in/doc/165x107/60219e6a89cf726c976d409c/whole-of-society-pandemic-readiness-a-pandemics-are-worldwide-epidemics-a.jpg)