Pathogenesis of A b Ketosis-Prone Diabetes
11
Pathogenesis of A 2 b + Ketosis-Prone Diabetes Sanjeet G. Patel, 1 Jean W. Hsu, 2 Farook Jahoor, 2 Ivonne Coraza, 1 James R. Bain, 3,4 Robert D. Stevens, 3,4 Dinakar Iyer, 1 Ramaswami Nalini, 1,5 Kerem Ozer, 1,5 Christiane S. Hampe, 6 Christopher B. Newgard, 3,4 and Ashok Balasubramanyam 1,5 A 2 b + ketosis-prone diabetes (KPD) is an emerging syndrome of obesity, unprovoked ketoacidosis, reversible b-cell dysfunc- tion, and near-normoglycemic remission. We combined metab- olomics with targeted kinetic measurements to investigate its pathophysiology. Fasting plasma fatty acids, acylcarnitines, and amino acids were quantified in 20 KPD patients compared with 19 nondiabetic control subjects. Unique signatures in KPD—higher glutamate but lower glutamine and citrulline con- centrations, increased b-hydroxybutyryl-carnitine, decreased isovaleryl-carnitine (a leucine catabolite), and decreased tricar- boxylic acid (TCA) cycle intermediates—generated hypotheses that were tested through stable isotope/mass spectrometry pro- tocols in nine new-onset, stable KPD patients compared with seven nondiabetic control subjects. Free fatty acid flux and acetyl CoA flux and oxidation were similar, but KPD had slower acetyl CoA conversion to b-hydroxybutyrate; higher fasting b-hydroxybutyrate concentration; slower b-hydroxybutyrate oxidation; faster leucine oxidative decarboxylation; accelerated glutamine conversion to glutamate without increase in gluta- mate carbon oxidation; and slower citrulline flux, with dimin- ished glutamine amide–nitrogen transfer to citrulline. The confluence of metabolomic and kinetic data indicate a distinc- tive pathogenic sequence: impaired ketone oxidation and fatty acid utilization for energy, leading to accelerated leucine catab- olism and transamination of a-ketoglutarate to glutamate, with impaired TCA anaplerosis of glutamate carbon. They highlight a novel process of defective energy production and ketosis in A 2 b + KPD. K etosis-prone diabetes (KPD) is characterized by presentation with diabetic ketoacidosis (DKA) in persons who do not fit traditional categories of types 1 or 2 diabetes (1–5). We have defined four subgroups of KPD based on presence or absence of b-cell autoantibodies (A + or A 2 ), and recovery or lack of recovery of b-cell functional reserve following the index episode of DKA (b + or b 2 ) (1,6,7). The A 2 b + KPD subgroup represents a novel syndrome of severe but reversible b-cell dysfunction (1,3,5,8,9). Ap- proximately 50% of these patients develop DKA without a precipitating factor at diagnosis of diabetes. These new- onset, unprovoked A 2 b + KPD patients display male pre- dominance (10) and low frequencies of human leukocyte antigen class II susceptibility alleles for autoimmune di- abetes (11). b-Cell function increases markedly within 1–3 months after the index DKA, with sustained glycemic im- provement and insulin independence (1,9,11,12). The cause of the unprovoked ketoacidosis is unknown. Over 5– 10 years, patients may relapse to unprovoked ketosis (3,5). This syndrome provides a model to identify novel mechanisms of obesity, ketosis, and reversible b-cell dys- function. We used a metabolomics approach to identify unique alterations in A 2 b + KPD patients, with a kinetics approach to specify the pathophysiology. RESEARCH DESIGN AND METHODS Metabolomic analysis Human subjects. Protocols were approved by the Human Studies In- stitutional Review Boards of Baylor College of Medicine and Duke University (13). Written informed consent was obtained. New-onset, unprovoked male A 2 b + KPD patients (n = 20) were identified by absence of GAD65/67, IA-2, or ZnT8 autoantibodies and presence of b-cell functional reserve 4–8 weeks after the index DKA (1,6). Men (n = 19) from the Study of the Effects of Diet on Metabolism and Nutrition study (13) were nondiabetic obese control subjects. KPD patients were selected from a longitudinal database using the MatchIT program (15) to minimize intragroup differences in initial HbA 1c and in- tergroup differences in age, ethnicity, BMI, waist circumference, fasting C- peptide, glucose, and lipids. At the time of blood sampling, all patients were clinically stable, taking twice-daily neutral protamine Hagedorn insulin (6 short-acting insulin); three patients were also taking metformin (1 g daily). Five additional, newly diagnosed, unprovoked A 2 b + KPD patients were sub- sequently recruited for measurements of glutamine, glutamate, isoleucine, and leucine. Plasma collection. The KPD samples were collected in acid citrate dextrose (#364606, BD Biosciences) after an overnight fast before the morning dose of insulin, 20 days (median) after the index DKA (5). Blood was kept on ice for 2– 4 h, centrifuged at 4°C, and the plasma stored at 220°C. Control subjects’ samples were collected after an overnight fast in serum separator tubes (#366510, BD Biosciences), centrifuged, and the serum stored at 280°C. Blood samples were also taken from five fresh A 2 b + KPD patients 1 month after their index DKA, collected in serum separator tubes, processed immediately, and stored. Metabolite analysis. To measure 15 amino acids and 45 acylcarnitines, samples were deproteinized by methanol precipitation, esterified with hot, acidic methanol or n-butanol, and then analyzed by tandem mass spectrometry (MS/MS) with a Quattro Micro instrument (Waters Corporation, Milford, MA) (13). Leucine and isoleucine are reported as a single analyte (Leu/Ile) because they were not resolved by this method. These conditions partially hydrolyze glutamine to glutamate and asparagine to aspartate, so “glx” (Glu/Gln) or “asx” (Asp/Asn) signify glutamate or aspartate with contributions from hydrolysis reactions of glutamine and asparagine. Final concentrations of isoleucine, leucine, glutamine, and glutamate were measured by reverse-phase high-performance liquid chromatography (HPLC; Hewlett-Packard 1090; Hewlett-Packard, Avon- dale, PA); frozen samples were thawed on ice prior to HPLC and glutamine standards prepared fresh in ice-cold water. To measure seven nonesterified free fatty acids (FFAs), samples were methylated and purified by solid-phase extraction (13). Derivatized fatty acids From the 1 Translational Metabolism Unit, Diabetes/Endocrinology Research Center, Baylor College of Medicine, Houston, Texas; the 2 Department of Pediatrics, Children’s Nutrition Research Center, Baylor College of Medi- cine, Houston, Texas; the 3 Sarah W. Stedman Nutrition and Metabolism Center, Duke University Medical Center, Durham, North Carolina; the 4 De- partment of Pharmacology and Cancer Biology, Duke University Medical Center, Durham, North Carolina; the 5 Endocrine Service, Ben Taub General Hospital, Houston, Texas; and the 6 Department of Medicine, University of Washington, Seattle, Washington. Corresponding author: Ashok Balasubramanyam, [email protected]. Received 17 May 2012 and accepted 19 August 2012. DOI: 10.2337/db12-0624 S.G.P. and J.W.H. are joint first authors. S.G.P. is currently affiliated with the Department of Surgery, UCLA Medical Center, Los Angeles, California. Ó 2013 by the American Diabetes Association. Readers may use this article as long as the work is properly cited, the use is educational and not for profit, and the work is not altered. See http://creativecommons.org/licenses/by -nc-nd/3.0/ for details. See accompanying commentary, p. XXX. diabetes.diabetesjournals.org DIABETES 1 ORIGINAL ARTICLE Diabetes Publish Ahead of Print, published online November 16, 2012
Transcript of Pathogenesis of A b Ketosis-Prone Diabetes
Pathogenesis of A2b+ Ketosis-Prone DiabetesSanjeet G. Patel,
1Jean W. Hsu,
2Farook Jahoor,
2Ivonne Coraza,
1James R. Bain,
3,4Robert D. Stevens,
3,4
Dinakar Iyer,1Ramaswami Nalini,
1,5Kerem Ozer,
1,5Christiane S. Hampe,
6Christopher B. Newgard,
3,4and
Ashok Balasubramanyam1,5
A2b+ ketosis-prone diabetes (KPD) is an emerging syndromeof obesity, unprovoked ketoacidosis, reversible b-cell dysfunc-tion, and near-normoglycemic remission. We combined metab-olomics with targeted kinetic measurements to investigateits pathophysiology. Fasting plasma fatty acids, acylcarnitines,and amino acids were quantified in 20 KPD patients comparedwith 19 nondiabetic control subjects. Unique signatures inKPD—higher glutamate but lower glutamine and citrulline con-centrations, increased b-hydroxybutyryl-carnitine, decreasedisovaleryl-carnitine (a leucine catabolite), and decreased tricar-boxylic acid (TCA) cycle intermediates—generated hypothesesthat were tested through stable isotope/mass spectrometry pro-tocols in nine new-onset, stable KPD patients compared withseven nondiabetic control subjects. Free fatty acid flux andacetyl CoA flux and oxidation were similar, but KPD had sloweracetyl CoA conversion to b-hydroxybutyrate; higher fastingb-hydroxybutyrate concentration; slower b-hydroxybutyrateoxidation; faster leucine oxidative decarboxylation; acceleratedglutamine conversion to glutamate without increase in gluta-mate carbon oxidation; and slower citrulline flux, with dimin-ished glutamine amide–nitrogen transfer to citrulline. Theconfluence of metabolomic and kinetic data indicate a distinc-tive pathogenic sequence: impaired ketone oxidation and fattyacid utilization for energy, leading to accelerated leucine catab-olism and transamination of a-ketoglutarate to glutamate, withimpaired TCA anaplerosis of glutamate carbon. They highlighta novel process of defective energy production and ketosisin A2b+ KPD.
Ketosis-prone diabetes (KPD) is characterized bypresentation with diabetic ketoacidosis (DKA)in persons who do not fit traditional categoriesof types 1 or 2 diabetes (1–5). We have defined
four subgroups of KPD based on presence or absence ofb-cell autoantibodies (A+ or A2), and recovery or lack ofrecovery of b-cell functional reserve following the indexepisode of DKA (b+ or b2) (1,6,7).
The A2b+ KPD subgroup represents a novel syndromeof severe but reversible b-cell dysfunction (1,3,5,8,9). Ap-proximately 50% of these patients develop DKA withouta precipitating factor at diagnosis of diabetes. These new-onset, unprovoked A2b+ KPD patients display male pre-dominance (10) and low frequencies of human leukocyteantigen class II susceptibility alleles for autoimmune di-abetes (11). b-Cell function increases markedly within 1–3months after the index DKA, with sustained glycemic im-provement and insulin independence (1,9,11,12). Thecause of the unprovoked ketoacidosis is unknown. Over 5–10 years, patients may relapse to unprovoked ketosis (3,5).
This syndrome provides a model to identify novelmechanisms of obesity, ketosis, and reversible b-cell dys-function. We used a metabolomics approach to identifyunique alterations in A2b+ KPD patients, with a kineticsapproach to specify the pathophysiology.
RESEARCH DESIGN AND METHODS
Metabolomic analysis
Human subjects. Protocols were approved by the Human Studies In-stitutional Review Boards of Baylor College of Medicine and Duke University(13). Written informed consent was obtained. New-onset, unprovoked maleA2b+ KPD patients (n = 20) were identified by absence of GAD65/67, IA-2, orZnT8 autoantibodies and presence of b-cell functional reserve 4–8 weeks afterthe index DKA (1,6). Men (n = 19) from the Study of the Effects of Diet onMetabolism and Nutrition study (13) were nondiabetic obese control subjects.KPD patients were selected from a longitudinal database using the MatchITprogram (15) to minimize intragroup differences in initial HbA1c and in-tergroup differences in age, ethnicity, BMI, waist circumference, fasting C-peptide, glucose, and lipids. At the time of blood sampling, all patients wereclinically stable, taking twice-daily neutral protamine Hagedorn insulin (6short-acting insulin); three patients were also taking metformin (1 g daily).Five additional, newly diagnosed, unprovoked A2b+ KPD patients were sub-sequently recruited for measurements of glutamine, glutamate, isoleucine, andleucine.Plasma collection. The KPD samples were collected in acid citrate dextrose(#364606, BD Biosciences) after an overnight fast before the morning dose ofinsulin, 20 days (median) after the index DKA (5). Blood was kept on ice for 2–4 h, centrifuged at 4°C, and the plasma stored at 220°C. Control subjects’samples were collected after an overnight fast in serum separator tubes(#366510, BD Biosciences), centrifuged, and the serum stored at280°C. Bloodsamples were also taken from five fresh A2b+ KPD patients 1 month after theirindex DKA, collected in serum separator tubes, processed immediately, andstored.Metabolite analysis. To measure 15 amino acids and 45 acylcarnitines,samples were deproteinized by methanol precipitation, esterified with hot,acidic methanol or n-butanol, and then analyzed by tandem mass spectrometry(MS/MS) with a Quattro Micro instrument (Waters Corporation, Milford, MA)(13). Leucine and isoleucine are reported as a single analyte (Leu/Ile) becausethey were not resolved by this method. These conditions partially hydrolyzeglutamine to glutamate and asparagine to aspartate, so “glx” (Glu/Gln) or “asx”(Asp/Asn) signify glutamate or aspartate with contributions from hydrolysisreactions of glutamine and asparagine. Final concentrations of isoleucine, leucine,glutamine, and glutamate were measured by reverse-phase high-performanceliquid chromatography (HPLC; Hewlett-Packard 1090; Hewlett-Packard, Avon-dale, PA); frozen samples were thawed on ice prior to HPLC and glutaminestandards prepared fresh in ice-cold water.
To measure seven nonesterified free fatty acids (FFAs), samples weremethylated and purified by solid-phase extraction (13). Derivatized fatty acids
From the 1Translational Metabolism Unit, Diabetes/Endocrinology ResearchCenter, Baylor College of Medicine, Houston, Texas; the 2Department ofPediatrics, Children’s Nutrition Research Center, Baylor College of Medi-cine, Houston, Texas; the 3Sarah W. Stedman Nutrition and MetabolismCenter, Duke University Medical Center, Durham, North Carolina; the 4De-partment of Pharmacology and Cancer Biology, Duke University MedicalCenter, Durham, North Carolina; the 5Endocrine Service, Ben Taub GeneralHospital, Houston, Texas; and the 6Department of Medicine, University ofWashington, Seattle, Washington.
Corresponding author: Ashok Balasubramanyam, [email protected] 17 May 2012 and accepted 19 August 2012.DOI: 10.2337/db12-0624S.G.P. and J.W.H. are joint first authors.S.G.P. is currently affiliated with the Department of Surgery, UCLA Medical
Center, Los Angeles, California.� 2013 by the American Diabetes Association. Readers may use this article
as long as the work is properly cited, the use is educational and not for profit,and the work is not altered. See http://creativecommons.org/licenses/by-nc-nd/3.0/ for details.
See accompanying commentary, p. XXX.
diabetes.diabetesjournals.org DIABETES 1
ORIGINAL ARTICLE
Diabetes Publish Ahead of Print, published online November 16, 2012

were analyzed by gas chromatography/mass spectrometry (GC/MS; TraceDSQ; Thermo Electron Corporation, Austin, TX).
All MS analyses used stable isotope dilution to quantify metabolites (13).Because acid citrate dextrose tubes were used for the original KPD patients,a dilution correction factor (1.31) was used for analytes measured in thosesamples (16).
Plasma insulin, C-peptide, glucagon, cortisol, and free metanephrines weremeasured by radioimmunoassay (Linco, St. Louis, MO), and b-hydroxybutyrate(BOHB) by spectrophotometry (Wako, Richmond, VA).Statistical analysis. Data were inspected for normality using the Shapiro-Wilk tests. The t tests were used to compare levels of hormones, baselineclinical parameters, and metabolites. BOHB values were not normally dis-tributed, so median levels were compared using the Mann-Whitney U test. TheFisher exact test was used to assess deviations from the order of metabolitesas an indicator of substrate preference due to altered consumption or pro-duction. Significance was defined at P , 0.05.Kinetic analyses
Human subjects. The study was approved by the Baylor institutional reviewboard and written informed consent obtained. Nine new-onset, unprovokedA2b+ KPD patients (six men, three women), all clinically stable, wererecruited 6–8 weeks after the index DKA episode. Seven nondiabetic controlsubjects (six men, one woman) were matched for BMI, age, and ethnicity, withthe six men and one woman among the KPD patients. Exclusions were: serumcreatinine .1.2 mg/day, retinopathy, neuropathy, or heart failure; history ofalcohol abuse; alanine aminotransferase/ aspartate aminotransferase (AST)/alkaline phosphatase .23 upper limit of normal; medications likely to affectfat, glucose, or protein metabolism; and other chronic illnesses. Fastingplasma C-peptide and glucose, peak and area under the curve of C-peptideresponse to glucagon, fasting lipids, and liver and thyroid functions weremeasured. Details of the glucagon stimulation test and cutoffs to classify b-cellreserve have been reported (1).
Subjects underwent four stable isotope protocols in the General ClinicalResearch Center. For 2 days prior to each study, they consumed an isocaloric,standardized diet (30% calories from fat, 65% from carbohydrates, 1 g/kgprotein) prepared by the General Clinical Research Center kitchen. KPDpatients were treated with low doses of neutral protamine Hagedorn insulin for8 weeks prior to the studies. The last dose was administered at 8–10 P.M., andeach study commenced the following morning after a 10–14-h fast, with noinsulin administered until study completion. One venous catheter was placedfor infusions, with another in the opposite hand, heated for arterialized bloodsampling.Protocol 1. After baseline blood and breath sampling, an oral 50 mg/kg bolusof 2H2O was administered. After an intravenous priming dose of NaH13CO3
(1.2 mmol/kg), 2H5-glycerol (prime 4.5 mmol/kg, constant 9.0 mmol/kg/h), 2H2-potassium palmitate (prime 3 mmol/kg, constant 4 mmol/kg/h), and 13C1-acetate(prime 62.5 mmol/kg, constant 150 mmol/kg/h) were infused for 4 h. Blood wascollected hourly for the first 3 h and every 15 min during the fourth hour.Indirect calorimetry was performed during the last 30 min of the fourth hour.At hour 4, glycerol and palmitate infusions ceased, but the acetate infusioncontinued for another 2 h. Blood and breath samples were drawn every 15 minbetween hours 5 and 6.
Tracer-to-tracee ratios of plasma free palmitate, acetate, and BOHB weredetermined by negative chemical ionization GC/MS of its pentafluorobenzylderivative (17). Plasma palmitate and BOHB concentrations were measured byin vitro isotope dilution with U-13C-palmitate or 13C2-BOHB (Cambridge Iso-tope Laboratories, Andover, MA) as internal standards, using negative chem-ical ionization-GC/MS (17).
Tracer-to-tracee ratio of plasma glycerol was determined by electron impactionization GC/MS of its tripropionate derivative (18). Breath 13CO2 content wasdetermined by GC/gas isotope ratio MS. Zinc was used to reduce water in10-ml plasma in quartz vessels and 2H2 abundance of the resulting hydrogendetermined by GC/gas isotope ratio MS.Protocol 2. After baseline blood sampling, 2H2-citrulline (prime 1.0 mmol/kg,constant 1.0 mmol/kg/h), 15N1-amide-glutamine (prime 13.6 mmol/kg, constant13.6 mmol/kg/h), 2H8-valine (prime 1 mmol/kg, constant 1 mmol/kg/h), andNaH13CO3 (prime 4 mmol/kg, constant 4 mmol/kg/h) were infused. A 0.5-mmol/kg prime of 15N1-citrulline was also given. Citrulline, glutamine, and valinewere infused for 6 h. NaH13CO3 infusion was infused for 2 h; at the secondhour, 13C1-leucine (prime 4 mmol/kg, constant 4 mmol/kg/h) was started andinfused until hour 6. Blood was collected hourly during the first 4 h and every15 min during the fifth hour. Breath was collected at baseline and every 15 minbetween hours 1 and 2 and 5 and 6.
Tracer-to-tracee ratio of plasma a-ketoisocaproic acid (a-KICA) from leu-cine was measured by negative chemical ionization-GC/MS of its penta-fluorobenzyl derivative (17).
Plasma citrulline, glutamine, and valine isotopic enrichments (IE) weremeasured after conversion to their 5-(dimethylamino)-1-napthalene
sulfonamide derivatives by liquid chromatography-MS/MS (Synergi MAX-RPcolumn; Phenomenex, Torrance, CA) (19).Protocol 3. After baseline blood and breath sampling, 13C1-glutamine (prime13.6 mmol/kg, constant 13.6 mmol/kg/h) was infused for 6 h. A priming dose ofNaH13CO3 (4 mmol/kg) was given at hour 0. Indirect calorimetry was per-formed during the last 30 min of the fourth hour. Blood and breath werecollected hourly for 5 h and then every 15 min between hours 5 and 6.
Plasma glutamine and glutamate IE were measured by liquid chromatog-raphy-MS/MS as in protocol 2.Protocol 4. After baseline blood and breath sampling, a priming dose ofNaH13CO3 (4 mmol/kg) was given, and then 2,4-13C-b-hydroxybutyrate (prime20 mmol/kg, constant 12 mmol/kg/h) was infused for 3 h. Blood and breathwere collected hourly for the first 2 h and every 15 min during the third hour.Indirect calorimetry was performed during the last 30 min of the second hour.Blood was collected in K-EDTA tubes and spun immediately and one aliquotdeproteinized with perchloric acid and frozen in liquid nitrogen.
IE of BOHB was measured as in protocol 1.Plasma glucose was measured with a glucose analyzer (YSI, Yellow Springs
OH), insulin by radioimmunoassay (Linco) and FFAs by spectrophotometry(Wako). Amino acids were measured by HPLC.Calculations. Ra (palmitate, glycerol, acetate, or BOHB) (in mmol/kg/h):
Raðmmol $ kg2 1 $ h2 1Þ ¼�IEinf
IEp2 1
�3 i; Eq: ð1Þ
where IEinf is the IE (mole %) in the infusate, IEp is IE (mole %) in the plasmaat steady state, and i is the tracer infusion rate.
Rate of appearance of FFAs (mmol $ kg21 $ h21):
Ra FFA ¼ Ra palmitate½palmitate�p
½FFA�p
; Eq: ð2Þ
where Ra palmitate is the rate of appearance of palmitate (Eq. 1), [palmitate]p isthe concentration of plasma palmitate, and [FFA]p is the concentration ofplasma FFA.
Whole-body fatty acid oxidation is calculated from RQ, VO2, and _VCO2 (20).Rate of acetate oxidation (mmol $ kg21 $ h21) in the tricarboxylic acid
(TCA) cycle:
AcetateOX ¼��
_VCO2=0:56
�3 IECO2
��ðIEacetateÞ; Eq: ð3Þ
where _VCO2 is the CO2 excretion rate measured by indirect calorimetry, IECO2
is the IE of CO2 in the breath, IEacetate is the IE of plasma acetate, and 0.56 isthe acetate retention factor (21).
Acetate oxidized in the TCA cycle (%):
Percentoxidized ¼ ðAcetateOX=Ra acetateÞ 3 100; Eq: ð4ÞBOHB from acetate (mmol/kg/h):
Qacetate→BOHB ¼ RaBOHB 3�IEBOHB ðMþ1Þ=IEacetate
�; Eq: ð5Þ
where RaBOHB is the value from Eq. 1, IEBOHB is the M+1 isotopomer enrich-ment of BOHB derived from the 13C1-acetate infusate, and IEacetate is the IE ofacetate.
Total body water (TBW) (from oral deuterated water):
TBW ðmlÞ ¼E2H2O
3Dose
Ep2H2O
3 1:04; Eq: ð6Þ
where E2H2Ois the enrichment of deuterated water consumed, Ep2H2O
is theenrichment of plasma H2O at steady state, and the constant 1.04 corrects fordeuterium’s volume of distribution. Fat-free mass is TBW/0.72, where 0.72 isthe hydration constant of fat-free tissue. Fat mass (kg) = body weight (kg) 2fat-free mass.
Ra (citrulline or glutamine amide-N) (mmol/kg/h) was calculated as inEq. (1).
Rate of transfer of glutamine amide 15N to citrulline:
Qgln→cit ¼ Ra citrulline 3�IE15
N-citrulline=IE15N-glutamine
�; Eq: ð7Þ
where Ra citrulline is the value from Eq. 7, IE15N-citrulline is the isotopic (M+1)
enrichment of citrulline from 15N-glutamine, and IE15N-glutamine is the isotopic
(M+1) enrichment of glutamine.Flux of glutamine carbon is calculated as in Eq. (7).
PATHOGENESIS OF KPD
2 DIABETES diabetes.diabetesjournals.org

13C-glutamine reaches steady state quickly, but 13C-glutamate formed fromthe glutamine does not, because of the large whole-body free glutamate pool.
Hence, the fraction of the glutamate pool derived from glutamine (fractional
synthesis rate of glutamate from glutamine) is calculated using the precursor-
product equation:
FSRð%=hÞ ¼hðIEglut6 2 IEglut3Þ=IEglupl
i3 100=3; Eq: ð8Þ
where IEglut6 2 IEglut3 is the increase in glutamate IE from 3–6 h of the in-fusion, and IEglnpl is the plateau IE of glutamine.
Absolute synthesis rate (ASR) of glutamate from glutamine:
TABLE 1Metabolomic survey: demographic and biochemical data and fasting plasma concentrations of amino acids, acylcarnitines, and freefatty acids
Control subjects(N = 19)
A2b+ KPD(N = 20) P value
Age (years) 50.7 6 2.7 41.9 6 2.1 0.02BMI (kg/m2) 33.8 6 0.9 34.2 6 1.5 0.8Waist circumference (cm) 110.8 6 1.4 114.5 6 3.9 0.39InitialA fasting glucose (mg/dL) 106 6 3 241 6 18 ,0.001InitialA fasting C-peptide (ng/mL) 3.53 6 0.36 1.61 6 0.25 ,0.001InitialA C-peptide/glucose 0.03 6 0.001 0.01 6 0.001 ,0.001Insulin (mU/mL) 27.9 6 5.1 23.1 6 6.0 0.55QUICKIB 0.30 6 0.01 0.29 6 0.07 0.25b-Hydroxybutyrate (mmol/L) 37.8 6 4.5 74.1 6 40.7 0.4Total cholesterol (mg/dL) 194.2 6 6.1 191.5 6 10.8 0.8Triglycerides (mg/dL) 123.9 6 12.3 188.4 6 32.1 0.09HDL-C (mg/dL) 47.9 6 3.2 36.7 6 2.2 ,0.01Amino acids (mmol/L)Glycine 205.4 6 10.0 287.2 6 18.0 ,0.001Alanine 365.7 6 9.0 426.5 6 24.2 0.03Serine 81.0 6 4.3 117.0 6 5.4 ,0.001Proline 167.4 6 9.0 203.2 6 11.0 0.02Valine 215.7 6 9.5 230.5 6 11.8 0.34Isoleucine/leucine 156.3 6 7.8 178.5 6 9.7 0.08Total BCAA 372.0 6 17 409.0 6 21 0.2Isoleucine (by HPLC)C 62.2 6 5.3 59.6 6 7.0 0.78Leucine (by HPLC)C 137.3 6 7.7 128.8 6 11.6 0.55Methionine 27.8 6 1.2 23.6 6 1.3 0.02Histidine 69.3 6 2.5 85.2 6 3.1 ,0.001Phenylalanine 62.2 6 2.3 64.4 6 3.5 0.60Tyrosine 78.5 6 6.1 67.5 6 3.3 0.13Asx 12.5 6 0.8 28.9 6 3.8 ,0.01Glx 93.1 6 6.6 444.8 6 17.4 ,0.0001Glutamine (new KPD samples)D 437.9 6 16.8 207.2 6 10.3 0.0001Glutamate (new KPD samples)D 105.9 6 18.5 192.0 6 8.0 0.02Citrulline 31.9 6 1.7 25.5 6 1.9 0.02
FFAs (mmol/L)Myristic acid (C14) 9.3 6 1.2 6.8 6 1.1 0.12Palmitoleic acid (C16:1) 16.8 6 2.4 15.1 6 2.5 0.64Palmitic acid (C16) 131.8 6 12.5 111.7 6 13.6 0.30a-Linolenic acid (C18:3) 6.7 6 0.8 5.0 6 0.7 0.12Linoleic acid (C18:2) 76.1 6 7.4 86.5 6 14.0 0.50Oleic acid (C18:1) 178.4 6 18.5 142.4 6 19.2 0.19Stearic acid (C18) 44.3 6 3.7 39.7 6 4.8 0.45Molar sum of FFAs 463.4 6 44.5 407.1 6 53.9 0.43
Acylcarnitines (mmol/L)Acetylcarnitine (C2) 6.86 6 0.39 5.11 6 0.29 0.001Isobutyryl-carnitine (C4) 0.21 6 0.02 0.29 6 0.02 0.01Tiglyl-carnitine (C5:1) 0.05 6 0.001 0.06 6 0.001 0.11Isovaleryl-carnitine (2,3
methylbutyryl-carnitine) (C5) 0.16 6 0.01 0.12 6 0.01 0.003b-Hydroxybutyryl-carnitine (C4-OH) 0.02 6 0.001 0.06 6 0.01 0.01Methylmalonyl/succinyl-carnitine (C4-DC) 0.04 6 0.001 0.02 6 0.001 ,0.001Glutaryl-carnitine (C5-DC) 0.05 6 0.001 0.03 6 0.001 0.0013-Hydroxyisovaleryl-carnitine (C5-OH) 0.07 6 0.005 0.05 6 0.004 0.01
AIn blood sample obtained 4–12 weeks after recovery from the index episode of DKA. BQUICKI = 1/(log fasting glucose + log fasting insulin)(14). Insulin-sensitive persons without metabolic syndrome usually have QUICKI values .0.36 (3938). CData from a subset of 11 KPD patientsand 16 control subjects measured by HPLC. DData for KPD from five fresh, new-onset unprovoked A2b+ KPD patients; these samples werecollected and processed exactly as for the control subjects, and glutamine and glutamate in both these KPD samples and the control sampleswere measured by HPLC.
S.G. PATEL AND ASSOCIATES
diabetes.diabetesjournals.org DIABETES 3

ASRðmmol=L=hÞ ¼ ASR 3 Glutamine plasma concentration Eq: ð9ÞThe rate of formation of 13CO2 from 13C1-glutamine over the 6-h infusion, anindex of glutamate dehydrogenase activity, is calculated as follows:
13C1-glutamine oxidation (mmol/6 h) = area under the curve of breath13CO2 = AUC0–6 h of 13CO2:
AUC0-6 hof13CO2 ¼ AUC½ðVCO2=0:78Þ 3 IECO2�; Eq: ð10Þ
where VCO2/0.78 is the production rate of CO2, assuming 22% of CO2 is retainedin the bicarbonate pool (22), and IECO2 is the IE of CO2 (atom percent excess).
Fraction of 13CO1-glutamine oxidized ¼AUC0-6 h 13CO2=total 13C1-glutamine infused; Eq: ð11Þ
a relative measure of glutamate entry in the TCA cycle at a-ketoglutarate and anestimate of glutaminase plus glutamate dehydrogenase activity.
RESULTS
MetabolomicsClinical and biochemical parameters. BMI and waistcircumference were similar in KPD and control subjects(Table 1). KPD subjects had elevated initial HbA1c (13.51/20.5 %) and fasting plasma glucose levels 4–12 weeks after theindex DKA episode. Characteristically, HbA1c was markedlyimproved 3–6 months after the index DKA, (7.2 1/2 0.5),when the patients were on low doses of insulin (N = 13) oroff insulin (N = 7). Fasting C-peptide was higher in controlsubjects. The C-peptide/glucose ratio was one-third of thecontrol level in the KPD group. Fasting insulin levels werenot different, and Quantitative Insulin Sensitivity CheckIndex (QUICKI), an index of insulin sensitivity, demon-strated similar levels of insulin resistance in the twogroups. Triglycerides showed a trend to be higher, andHDL-cholesterol (HDL-C) was ;30% lower in KPD. Themean BOHB level was twice as high in KPD as in controlsubjects, but the difference did not attain statistical sig-nificance due to individual variability. KPD patients hadnormal fasting metanephrines and cortisol and normalthyroid, renal, and liver functions. The KPD group in-cluded 1 white, 7 African American, and 11 Hispanic sub-jects, whereas the control subjects included 14 white, 4African American, and no Hispanic subjects; ethnicity wasnot correlated with any inter- or intragroup differences inmetabolite or hormone levels.Amino acids and related acylcarnitines. “Asx” was2.3-fold (P , 0.01) and “glx” 4.8-fold (P , 0.0001) higher inthe KPD group (Table 1). Smaller elevations were observedin KPD for glycine (1.4-fold; P , 0.001), serine (1.4-fold;P, 0.001), alanine (1.2-fold; P = 0.03), proline (1.2-fold; P =0.02), and histidine (1.2-fold; P , 0.001). Methionine (0.85-fold; P = 0.02) and citrulline (0.75-fold; P = 0.02) werelower in KPD.
The unusually high levels of glx in KPD suggested partialex vivo conversion of glutamine to glutamate or pyroglut-amine (23–25) in those samples. HPLC also demonstratedvery low glutamine and very high glutamate levels in theKPD samples. To avoid alterations of glutamine and gluta-mate due to collection methods or storage, five additional,newly diagnosed A2b+ KPD patients were recruited andtheir plasma collected using stringent collection and pro-cessing methods (26). The mean glutamine concentration inthese new KPD samples was 207.20 6 10.29 mmol/L (0.56-fold less than control subjects; P = 0.0001) and the meanglutamate concentration 192.03 6 7.98 mmol/L (1.75-foldmore than control subjects; P = 0.02).
Concentrations of total branched chain amino acids(BCAA) were similar in KPD and control subjects, with no
significant differences in valine or isoleucine/leucine. Be-cause MS/MS cannot distinguish isoleucine from leucine,HPLC was used to separate them in samples from 11 KPDpatients and 16 control subjects. Leucine and isoleucineconcentrations were not different between KPD and con-trol subjects (128.8 6 11.6 vs. 137.3 6 7.7 and 59.6 6 7.0vs. 62.2 6 5.3 mmol/L, respectively; P = NS for both). Thiswas surprising because fasting plasma concentrations ofleucine and isoleucine are usually elevated in diabeticpatients with imperfect glycemic control (27–30). Hence,we tracked the catabolic pathways of BCAA throughacylcarnitine esters of their distinct ketoacid metabolites(Table 1). Isobutyryl-carnitine (C4-AC), from decarboxylationof the valine ketoacid, was 1.5-fold higher in KPD (P ,0.01). In contrast, C5-AC, representing acylcarnitine estersof both isovaleryl-CoA and a-isomethylbutyryl-CoA (fromdecarboxylation of the leucine and isoleucine ketoacids,respectively), was 1.3-fold lower in KPD (P , 0.01), buttiglyl-carnitine (C5:1-AC), an isoleucine-specific catabolite,was 1.2-fold higher in KPD (P = 0.1). In sum, these dataindicated that the leucine ketoacid metabolite was de-creased in KPD patients.
BCAA are deaminated by branch chain aminotransferase(BCAT) to produce KICA from leucine, a-keto-b-methyva-leric acid (KMVA) from isoleucine and a-ketoisovalericacid (KIVA) from valine, and the NH2 group is transferredto a-ketoglutarate to generate glutamate. The ketoacids are
TABLE 2Kinetic study: demographic, hormonal, and biochemical data
Control subjects(N = 7)
A2b+ KPD(N = 9) P value
Age (years) 43.4 6 3.1 48.3 6 4.4 0.37SexMale 6 6Female 1 3
Weight (kg) 83.5 6 5.3 87.9 6 10.9 0.72BMI (kg/m2) 28.0 6 0.9 32.4 6 2.8 0.16Fat mass (kg) 26.6 6 2.3 36.4 6 6.6 0.19Initial HbA1c (%) 13.1 6 0.4HbA1c 3 to 4months laterA (%) 5.6 6 0.1 6.5 6 0.1 ,0.001
Fasting glucose(mg/dL) 89 6 4 93 6 3 0.44
Fasting C-peptide(ng/mL) 1.57 6 0.3 1.70 6 0.4 0.8
Peak C-peptide(ng/mL) 4.39 6 0.6 3.20 6 0.5 0.14
Fasting C-peptide/glucose 0.02 6 0.003 0.02 6 0.004 0.61
Fasting insulin(mU/mL) 14.1 6 3.2 22.8 6 3.5 ,0.01
QUICKIB 0.33 6 0.3 0.30 6 0.2 0.05TSH (mU/mL) 2.3 6 0.5 1.6 6 0.3 0.28BUN (mg/dL) 13.3 6 1.2 16.0 6 1.5 0.19Creatinine(mg/dL) 0.97 6 0.04 0.88 6 0.09 0.36
ALT (IU/dL) 25 6 2 47 6 4 ,0.001AST (IU/dL) 28 6 4 31 6 5 0.57
ALT, alanine aminotransferase; BUN, blood urea nitrogen; TSH, thyroid-stimulating hormone. AThree to 4 months later applies to KPD patientsonly. For control subjects, HbA1c was measured once. BQUICKI =1/(log fasting glucose + log fasting insulin) (14). Insulin-sensitivepersons without metabolic syndrome usually have QUICKI values.0.36 (38).
PATHOGENESIS OF KPD
4 DIABETES diabetes.diabetesjournals.org
processed by branch chain ketoacid dehydrogenase(BCKDH) and subsequently follow distinct pathways toeither generate ketone bodies (KICA, KMVA) or enter theTCA cycle for oxidation (KIVA, KMVA). Glutamate isexported from mitochondria with aspartate and theremaining ketoacids. Glutamate, aspartate, KMVA, andKIVA are precursors for gluconeogenesis; in contrast, KICAis a primary amino acid source of ketones. The metab-olomic data suggested acceleration of the initial steps ofBCAA catabolism in muscle as an explanation for keymetabolic signatures in KPD patients: lack of elevatedBCAA, low C5-AC, elevated glutamate, and elevatedketones.TCA/anaplerotic metabolites. Acetylcarnitine (C2,acylcarnitine ester of acetyl CoA) was lower in KPD (1.3-fold; P = 0.001), suggesting either decreased production ofacetyl CoA or increased shunting of acetyl CoA into oxi-dative or synthetic pathways (Table 1). b-hydroxybutyryl-carnitine (C4-OH), representing intracellular BOHB, wasthreefold higher in KPD (P = 0.01), suggesting increasedketone synthesis or diminished ketone oxidation. Othershort-chain acylcarnitines (C4-DC, C5-DC), which includemetabolites arising distal to a-ketoglutarate in the TCA
cycle, such as methylmalonyl/succinyl-carnitine and glu-taryl-carnitine, were diminished in KPD.Fatty acids and ketones. The molar sum of the sevenmost abundant fatty acids was similar in KPD and controlsubjects (Table 1). Persons consuming American dietshave the following rank order of fasting fatty acid con-centrations: oleate . palmitate $ linoleate (31); this orderwas preserved in both groups, and levels of palmitate andoleate were similar, making it unlikely that there weregroup differences in habitual dietary fat composition.These data suggested that the proclivity for ketosis in KPDpatients is not due to excessive fatty acid supply.Kinetics. In the kinetic study cohort, age, weight, and BMIwere similar in the two groups (Table 2). HbA1c was veryhigh in the KPD patients at the time of the index DKA; 3 to4 months later, mean HbA1c and fasting glucose weremarkedly improved, but still higher than in the controlsubjects. At that time, fasting and glucagon-stimulatedpeak C-peptide and C-peptide/glucose ratio were similar inKPD and control subjects. Fasting insulin levels werehigher in KPD; however, they were very similar to those ofthe KPD patients in the metabolomics study (Table 1), andQUICKI demonstrated a significantly higher degree of
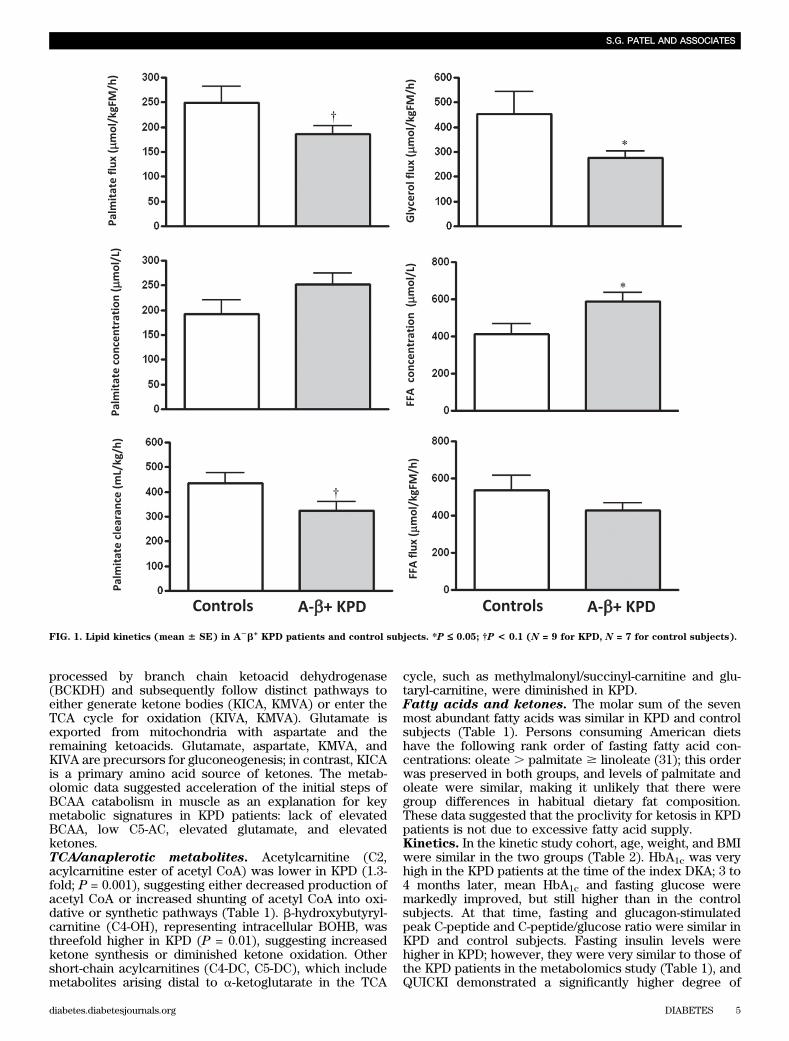
FIG. 1. Lipid kinetics (mean 6 SE) in A2b+
KPD patients and control subjects. *P £ 0.05; †P < 0.1 (N = 9 for KPD, N = 7 for control subjects).
S.G. PATEL AND ASSOCIATES
diabetes.diabetesjournals.org DIABETES 5

insulin resistance in KPD. Thyroid-stimulating hormone,blood urea nitrogen, creatinine, and AST were normal andsimilar in both groups. Triglycerides (163 6 9 mg/dL) wereelevated, whereas HDL-C (40.6 6 3.9 mg/dL) was low, andLDL-cholesterol level was 85 6 9 mg/dL in the KPD group.Fasting rates of FFA release and acetyl CoA flux aresimilar in KPD and control subjects. BOHB oxida-tion and fatty acid disposal are slowed, leading toelevated plasma concentrations of BOHB and FFA.
Ra FFA (total FFA flux) was not different, whereas Raglycerol (index of triglyceride hydrolysis) was significantlylower, and Ra palmitate (palmitate flux) trended lower in
KPD (Fig. 1). Furthermore, Ra acetate (index of whole-body acetyl CoA flux) was similar in KPD and controlsubjects (1,344 6 260 vs. 1,570 6 141 mmol/kgFM/h; P =0.50), and acetate oxidation (breath 13CO2 liberated byisocitrate dehydrogenase activity, reflecting acetyl CoAflux through the TCA cycle) was also similar (8616 175 vs.1,007 6 87 mmol/kgFM/h; P = 0.49). Despite the similarFFA flux, plasma concentration of FFA was higher in KPD(587 6 51 vs. 412 6 8 mmol/L; P = 0.04) (Fig. 1), sugges-ting slower FFA disposal (corroborated by the slowerpalmitate clearance). Plasma concentration of BOHB wasalso higher in the KPD patients (976 17 vs. 436 10 mmol/L;
FIG. 2. BOHB concentration, rate of conversion of acetate to BOHB, BOHB flux, and BOHB oxidation (mean 6 SE) in A2b+
KPD patients andcontrol subjects. (For BOHB concentration: N = 9 for KPD, N = 7 for control subjects; for all other measurements; N = 7 for KPD, N = 3 for controlsubjects.) *P < 0.05; †P = 0.09.
PATHOGENESIS OF KPD
6 DIABETES diabetes.diabetesjournals.org

P = 0.02) in the face of slower conversion of acetyl CoAto BOHB (Fig. 2). Collectively, these findings indi-cated defective BOHB and fatty acid disposal, which, af-ter a 10–14-h fast, is predominantly oxidative. To testBOHB oxidation directly, protocol 4 was performed inthree control subjects and seven KPD patients. KPD hadslower BOHB flux (330 6 80 vs. 696 6 103 mmol/kgFM/h;P = 0.03) but also slower oxidative BOHB disposal (191 647 vs. 427 6 84 mmol/kgFM/h; P = 0.03), a combinationthat would increase BOHB concentration. (Of note,plasma BOHB enrichment was used in this study asa proxy for intracellular acetate or acetyl CoA enrich-ment; in reality, it is acetyl CoA that is oxidized. The IE ofthe acetyl CoA would be lower than the plasma BOHBenrichment, because there are additional sources of un-labeled acetyl CoA in the intracellular pool. Because themore highly enriched BOHB is the denominator used inthe calculations, the actual oxidation rate of BOHB[which must first be converted to acetyl CoA to be oxi-dized via intermediates in the TCA cycle] is probablyunderestimated in all subjects.)Oxidative decarboxylation of leucine is acceleratedin KPD. There was no difference between KPD and con-trol subjects in leucine flux and a trend toward highervaline flux in KPD (Fig. 3). The rate of oxidative de-carboxylation, or removal of the #1 carbon of leucine byBCKDH, showed a strong trend to be faster in KPD (60.062.8 vs. 51.7 6 2.9 mmol/kgFFM/h; P = 0.06). IncreasedBCKDH activity requires increased flux through the earlierBCAT-catalyzed step that drives transfer of NH2 fromleucine to a-ketoglutarate to generate glutamate 32). Un-less matched by acceleration of the opposing reaction thatoxidatively deaminates glutamate to a-ketoglutarate, thiswould promote accumulation of glutamate.Conversion of glutamine to glutamate is acceleratedin KPD, without a parallel increase in glutamatecarbon oxidation. There was no group difference inglutamine flux, but plasma glutamine concentration tren-ded lower in KPD (557 6 29 vs. 655 6 36 mmol/L; P = 0.06)(Fig. 4A). The rate of glutamine carbon transfer to gluta-mate was faster in KPD by several measures: slope ofchange, absolute synthesis rate of glutamate from gluta-mine (Fig. 4A), and fractional synthesis rate of glutamatefrom glutamine (Fig. 4B). However, the rate of oxidation ofthe same glutamate carbon in the TCA cycle was not dif-ferent between the groups (Fig. 4B). Thus, increased glu-tamate production from glutamine in KPD is not matchedby a parallel increase in glutamate carbon anaplerosis intothe TCA cycle, as predicted from the results of the leucineinfusion study.Transfer of amide nitrogen from glutamine tocitrulline is slower in KPD. Citrulline flux was slowerin KPD than in control subjects (Fig. 5), with a trend to-ward slower transfer of glutamine amide nitrogen to or-nithine (7.8 6 0.4 vs. 8.6 6 0.3 mmol/kgFFM/h; P = 0.1) forcitrulline synthesis.
DISCUSSION
In this study, the pathophysiology of A2b+ KPD was in-vestigated comprehensively using a two-step discoverymethod. First, fasting plasma metabolomics comparedKPD patients to nondiabetic obese subjects. Hypothesesgenerated from key differences were tested by kinetictracer studies targeting the suspected metabolic pathwaysin a fresh cohort of patients and control subjects.
The metabolomic analysis revealed signals of alteredBCAA catabolism in KPD associated with changes in glu-tamine/glutamate. We hypothesized that the lack of ele-vated leucine in KPD was due to accelerated catabolism ofthis amino acid, indicated by decreased C5-AC and ele-vated glutamate (33,34). Evidence that accelerated leucinecatabolism extended beyond isovaleryl CoA to b-methyl-crotonyl CoA and ketogenesis was provided by the lowerlevel of 3-hydroxyisovaleryl-carnitine (C5-OH). Concomi-tantly, glutamine was 50% lower, whereas glutamate was175% higher, in KPD. Glutamine and glutamate are
FIG. 3. Leucine flux, oxidative decarboxylation, and nonoxidative dis-posal and valine flux (mean 6 SE) in A
2b+KPD patients and control
subjects. †P = 0.06. (N = 9 for KPD, N = 7 for control subjects.)
S.G. PATEL AND ASSOCIATES
diabetes.diabetesjournals.org DIABETES 7

nitrogen sinks for catabolism of other amino acids, in-cluding BCAA, in the fasted state. Elevated glutamate anddecreased glutamine levels could reflect absence of upre-gulation of glutamate oxidation rates in KPD subjects inthe face of faster conversion of glutamine to glutamate andaccelerated leucine deamidation.
Changes in small-chain acylcarnitines reflecting TCAcycle intermediates and anaplerosis broadened the path-ophysiologic hypothesis. Acetylcarnitine was significantlylower in KPD, suggesting decreased production or in-creased consumption of acetyl CoA. Acylcarnitines thatinclude glutaryl CoA and succinyl CoA were lower andb-hydroxybutyryl-carnitine was threefold higher in KPD,suggesting diversion of acetyl CoA disposal toward
ketogenesis. Finally, fasting FFA levels and compositionwere similar in KPD and control subjects, suggesting thatexcessive fatty acid flux from lipolysis is not the driver ofketogenesis in KPD.
In sum, the metabolomic data suggested that patientswith unprovoked A2b+ KPD have accelerated leucine ca-tabolism toward ketogenesis. This would expand the ni-trogen sinks of transamination reactions, resulting inelevated levels of glutamate and aspartate. The data alsoindicated that KPD patients have defects in transferringcarbon from glutamine/glutamate to the TCA cycle andnitrogen from glutamine/glutamate to the urea cycle.
The results of the kinetic studies confirmed the hy-pothesis and revealed also that KPD patients have altered
FIG. 4. A: Glutamine flux, glutamine plasma concentration, and absolute conversion rate of glutamine to glutamate (mean 6 SE) in A2b+
KPDpatients and control subjects (N = 9 for KPD, N = 7 for control subjects). B: Fractional synthesis rate of glutamate from glutamine, oxidation ofglutamate carbon (derived from glutamine), and glutamate plasma concentration (mean 6 SE) in A
2b+KPD patients and control subjects. *P <
0.05; †P = 0.06 (N = 9 for KPD, N = 7 for control subjects).
PATHOGENESIS OF KPD
8 DIABETES diabetes.diabetesjournals.org

ketone oxidation. Clinically stable KPD patients with ex-cellent glycemic control have elevated plasma BOHB. Thecause is not excessive fatty acid–derived ketone pro-duction—the conversion of acetyl CoA to BOHB is slower,and rates of acetyl CoA flux and isocitrate decarboxylationare unaltered. However, the rate of ketone oxidation issignificantly slowed in KPD, leading to elevated concen-trations of BOHB and its intracellular metabolites, and thislikely plays a prominent role in the most unique charac-teristic of the phenotype, proclivity for ketosis. Fatty aciddisposal is also impaired.
Unable to maximize rates of oxidation of fat-derivedsources for energy, KPD patients after an overnight fastdraw upon amino acids for energy. There is increased fluxthrough the leucine catabolic pathway toward ketoneproduction. Acceleration of leucine catabolism also leads,through reductive deamination of a-ketoglutarate, to glu-tamate accumulation (exacerbated by increased conver-sion from glutamine) and blunted glucose carbonanaplerosis in the TCA cycle as manifested by an un-changed rate of glutamate carbon oxidation. A similarcascade occurs in McArdle syndrome, in which acceler-ated BCAA catabolism eventually reduces flux into theTCA cycle through increased conversion of a-ketoglutarateto glutamate (35).
Peripheral oxidation of ketone bodies is a TCA cycle-dependent process; in this regard, an apparent conflictarises between the finding of slowed BOHB oxidationin KPD and the finding that there is no difference in therate of oxidation in the TCA cycle when the groupsare challenged with a similar flux of oxidative substrate
(13C1-acetate). This apparent paradox may be explainedbecause our measurements specifically demonstrate thatKPD show no defect in the rate of removal of CO2 fromisocitrate (at the step of isocitrate dehydrogenase) in theTCA cycle, and this leaves open the possibility of kineticdefects distal to that step in the TCA cycle and therefore inthe rates at which reduced energy intermediates are de-livered for oxidative phosphorylation. The data suggestthat there may be such a kinetic defect at the level ofa-ketoglutarate dehydrogenase associated with more rapiddecarboxylation of leucine, as evidenced by the accumula-tion of glutamate and reduced levels of acylcarnitines ofTCA intermediates beyond that step.
This study combines for the first time an unbiasedmetabolomics approach and a targeted kinetics approachto specify the pathophysiology of a novel diabetic syn-drome (Fig. 6). Umpierrez et al. (36) previously exploredthe pathophysiology of ketosis-prone type 2 diabetes,a condition identical to unprovoked A2b+ KPD. Theyreported no ketosis or b-cell decompensation followingprolonged infusion of fatty acids, supporting the conceptthat proneness to ketosis in KPD is not due to excessivefatty acid flux to the liver.
Defective oxidation of ketones and accelerated leucinecatabolism are key defects of fasting energy metabolismthat underlie the distinctive syndrome of unprovokedA2b+ KPD. The findings indicate the need to investigatemitochondrial function and BCAT and BCKDH regulationin the skeletal muscle of KPD patients. These defects areassociated with pronounced changes in glutamine/gluta-mate metabolism; interestingly, elevated glutamate pre-dicted type 1 diabetes in a longitudinal metabolomicsstudy (38,37). Clinically and metabolically, patients withA2b+ KPD manifest features of both type 1 and type 2diabetes. The present data explain how overweightpatients with a type 2 diabetes phenotype and adequateb-cell reserve are prone to developing unprovoked ketoa-cidosis. The coupled metabolomics-kinetics approachshould be useful in elucidating the pathophysiology ofother phenotypes of diabetes.
ACKNOWLEDGMENTS
This study was supported by National Institutes of Health(NIH) R21-DK-082827 (to A.B.), the Diabetes and Endocri-nology Research Center (P30-DK-079638) at Baylor Col-lege of Medicine, NIH RO1-DK-056689 (to F.J.), funds fromthe U.S. Department of Agriculture, Agricultural ResearchService under Cooperative Agreement Number 58-6250-6001, and NIH PO1-DK-58398 (to C.B.N.).
No potential conflicts of interest relevant to this articlewere reported.
S.G.P. and F.J. helped to design the kinetic studies,analyzed data, and edited the manuscript. J.W.H. per-formed mass spectrometric analyses and analyzed data.I.C. recruited subjects and implemented the stable iso-tope protocols. J.R.B. and R.D.S. performed metabolomicanalyses and reviewed the manuscript. D.I. performedbiochemical assays. R.N. and K.O. maintained clinicalcare of the study subjects and edited the manuscript.C.S.H. performed autoantibody testing of the study sub-jects and reviewed the manuscript. C.B.N. helped withstudy design, supervised the metabolomic analyses, andedited the manuscript. A.B. designed and obtained fundingfor the study, implemented the kinetic protocols, analyzeddata, and wrote the manuscript. A.B. is the guarantor of
FIG. 5. Citrulline flux and rate of transfer of glutamine amide-N tocitrulline (mean 6 SE) in A2b+
KPD patients and control subjects.*P < 0.05; †P = 0.10 (N = 9 for KPD, N = 7 for control subjects).
S.G. PATEL AND ASSOCIATES
diabetes.diabetesjournals.org DIABETES 9

this work and, as such, had full access to all the data in thestudy and takes responsibility for the integrity of the dataand the accuracy of the data analysis.
Parts of this study were presented in poster form at the71st Scientific Sessions of the American Diabetes Associ-ation, San Diego, California, 24–28 June 2011.
The authors thank Elizabeth Fraser, Vy Pham, and ToniOplt (all from Baylor College of Medicine) for technicalassistance, Resa Labbe-Morris, RN, and the nursing staff of
the Baylor College of Medicine General Clinical ResearchCenter for meticulous attention to protocol and care of thestudy subjects, Varsha Patel, RPh, and the InvestigationalPharmacy (The Methodist Hospital Research Institute,Houston, TX) for stable isotope preparation, Drs. HeinrichTaegtmeyer (University of Texas Health Sciences Center,Houston, TX), William Mitch, and Arun Sreekumar (bothfrom Baylor College of Medicine) for helpful discussions,and all of the study subjects.
FIG. 6. Schematic representation of metabolic defects in KPD as revealed by a combination of metabolomics and kinetics. Short black arrowsrepresent increase or decrease in a metabolite measured in the metabolomics survey, whereas short white arrows represent increase, decrease, orno change in a metabolite measured in the kinetic studies. Lipid bilayer indicates the boundary of a liver cell. Dashed long arrows indicate de-creased flux, and solid long arrows indicate increased flux. See text for details. CPS, carbamoyl phosphate synthetase; GDH, glutamate de-hydrogenase; alpha-KG, alpha-ketoglutarate.
PATHOGENESIS OF KPD
10 DIABETES diabetes.diabetesjournals.org

REFERENCES
1. Maldonado M, Hampe CS, Gaur LK, et al. Ketosis-prone diabetes: dissec-tion of a heterogeneous syndrome using an immunogenetic and beta-cellfunctional classification, prospective analysis, and clinical outcomes. JClin Endocrinol Metab 2003;88:5090–5098
2. Kitabchi AE. Ketosis-prone diabetes—a new subgroup of patients withatypical type 1 and type 2 diabetes? J Clin Endocrinol Metab 2003;88:5087–5089
3. Mauvais-Jarvis F, Sobngwi E, Porcher R, et al. Ketosis-prone type 2 di-abetes in patients of sub-Saharan African origin: clinical pathophysiologyand natural history of beta-cell dysfunction and insulin resistance. Di-abetes 2004;53:645–653
4. Umpierrez GE, Smiley D, Kitabchi AE. Narrative review: ketosis-pronetype 2 diabetes mellitus. Ann Intern Med 2006;144:350–357
5. Balasubramanyam A, Nalini R, Hampe CS, Maldonado M. Syndromes ofketosis-prone diabetes mellitus. Endocr Rev 2008;29:292–302
6. Balasubramanyam A, Garza G, Rodriguez L, et al. Accuracy and predictivevalue of classification schemes for ketosis-prone diabetes. Diabetes Care2006;29:2575–2579
7. Banerji MA, Dham S. A comparison of classification schemes for ketosis-prone diabetes. Nat Clin Pract Endocrinol Metab 2007;3:506–507
8. Umpierrez GE, Casals MM, Gebhart SP, Mixon PS, Clark WS, Phillips LS.Diabetic ketoacidosis in obese African-Americans. Diabetes 1995;44:790–795
9. Maldonado MR, Otiniano ME, Cheema F, Rodriguez L, BalasubramanyamA. Factors associated with insulin discontinuation in subjects with ketosis-prone diabetes but preserved beta-cell function. Diabet Med 2005;22:1744–1750
10. Nalini R, Ozer K, Maldonado M, et al. Presence or absence of a knowndiabetic ketoacidosis precipitant defines distinct syndromes of “A-b+”ketosis-prone diabetes based on long-term b-cell function, human leuko-cyte antigen class II alleles, and sex predilection. Metabolism 2010;59:1448–1455
11. Nalini R, Gaur LK, Maldonado M, et al. HLA class II alleles specify phe-notypes of ketosis-prone diabetes. Diabetes Care 2008;31:1195–1200
12. Rasouli N, Elbein SC. Improved glycemic control in subjects with atypicaldiabetes results from restored insulin secretion, but not improved insulinsensitivity. J Clin Endocrinol Metab 2004;89:6331–6335
13. Newgard CB, An J, Bain JR, et al. A branched-chain amino acid-relatedmetabolic signature that differentiates obese and lean humans and con-tributes to insulin resistance. Cell Metab 2009;9:311–326
14. Chen H, Sullivan G, Quon MJ. Assessing the predictive accuracy of QUICKIas a surrogate index for insulin sensitivity using a calibration model. Di-abetes 2005;54:1914–1925
15. Ho DE, Imai K, King G, Stuart EA. MatchIt: Nonparametric preprocessingfor parametric causal inference. Journal of Statistical Software 42:8; onlineat http://www.jstatsoft.org/v42/i08
16. Duarte NL, Wang XL, Wilcken DE. Effects of anticoagulant and time ofplasma separation on measurement of homocysteine. Clin Chem 2002;48:665–668
17. Hachey DL, Patterson BW, Reeds PJ, Elsas LJ. Isotopic determination oforganic keto acid pentafluorobenzyl esters in biological fluids by negativechemical ionization gas chromatography/mass spectrometry. Anal Chem1991;63:919–923
18. Mohammad MA, Sunehag AL, Rodriguez LA, Haymond MW. Galactosepromotes fat mobilization in obese lactating and nonlactating women. AmJ Clin Nutr 2011;93:374–381
19. Kao CC, Bandi V, Guntupalli KK, Wu M, Castillo L, Jahoor F. Arginine,citrulline and nitric oxide metabolism in sepsis. Clin Sci (Lond) 2009;117:23–30
20. Frayn KN. Calculation of substrate oxidation rates in vivo from gaseousexchange. J Appl Physiol 1983;55:628–634
21. Sidossis LS, Coggan AR, Gastaldelli A, Wolfe RR. A new correction factorfor use in tracer estimations of plasma fatty acid oxidation. Am J Physiol1995;269:E649–E656
22. Wolfe RR, Jahoor F. Recovery of labeled CO2 during the infusion of C-1- vsC-2-labeled acetate: implications for tracer studies of substrate oxidation.Am J Clin Nutr 1990;51:248–252
23. Schaefer A, Piquard F, Haberey P. Plasma amino-acids analysis: effects ofdelayed samples preparation and of storage. Clin Chim Acta 1987;164:163–169
24. Reichert MC. Innovations in sterilization technology for instrument pro-cessing. Med Instrum 1983;17:89–90
25. Ukida M, Schäfer K, Bode JC. Effect of storage at 20° C on the concen-tration of amino acids in plasma. J Clin Chem Clin Biochem 1981;19:1193–1195
26. Scriver CR, Lamm P, Clow CL. Plasma amino acids: screening, quantita-tion, and interpretation. Am J Clin Nutr 1971;24:876–890
27. Felig P, Marliss E, Ohman JL, Cahill CF Jr. Plasma amino acid levels indiabetic ketoacidosis. Diabetes 1970;19:727–728
28. Wahren J, Felig P, Cerasi E, Luft R. Splanchnic and peripheral glucose andamino acid metabolism in diabetes mellitus. J Clin Invest 1972;51:1870–1878
29. Carlsten A, Hallgren B, Jagenburg R, Svanborg A, Werkö L. Amino acidsand free fatty acids in plasma in diabetes. I. The effect of insulin on thearterial levels. Acta Med Scand 1966;179:361–370
30. Nair KS, Garrow JS, Ford C, Mahler RF, Halliday D. Effect of poor diabeticcontrol and obesity on whole body protein metabolism in man. Dia-betologia 1983;25:400–403
31. Stefan N, Wahl HG, Fritsche A, Häring H, Stumvoll M. Effect of the patternof elevated free fatty acids on insulin sensitivity and insulin secretion inhealthy humans. Horm Metab Res 2001;33:432–438
32. Hutson SM. The case for regulating indispensable amino acid metabolism:the branched-chain alpha-keto acid dehydrogenase kinase-knockoutmouse. Biochem J 2006;400:e1–e3
33. Darmaun D, Déchelotte P. Role of leucine as a precursor of gluta-mine alpha-amino nitrogen in vivo in humans. Am J Physiol 1991;260:E326–E329
34. Darmaun D, Matthews DE, Bier DM. Physiological hypercortisolemia in-creases proteolysis, glutamine, and alanine production. Am J Physiol 1988;255:E366–E373
35. Wagenmakers AJ, Coakley JH, Edwards RH. Metabolism of branched-chain amino acids and ammonia during exercise: clues from McArdle’sdisease. Int J Sports Med 1990;11(Suppl 2):S101–S113
36. Umpierrez GE, Smiley D, Robalino G, Peng L, Gosmanov AR, Kitabchi AE.Lack of lipotoxicity effect on beta-cell dysfunction in ketosis-prone type 2diabetes. Diabetes Care 2010;33:626–631
37. Oresic M, Simell S, Sysi-Aho M, et al. Dysregulation of lipid and amino acidmetabolism precedes islet autoimmunity in children who later progress totype 1 diabetes. J Exp Med 2008;205:2975–2984
38. Hrebícek J, Janout V, Malincíková J, Horáková D, Cízek L. Detection ofinsulin resistance by simple quantitative insulin sensitivity check indexQUICKI for epidemiological assessment and prevention. J Clin EndocrinolMetab 2002;87:144–147
S.G. PATEL AND ASSOCIATES
diabetes.diabetesjournals.org DIABETES 11