PATH TO 5G: KEY T - Wireless Communications & Signal...
32
P ATH TO 5G: KEY TECHNOLOGIES Charlie (Jianzhong) Zhang Samsung Dec 12, 2013 IEEE Globecom 2013 workshop on“Emerging Technologies for LTE-Advanced and Beyond 4G”
Transcript of PATH TO 5G: KEY T - Wireless Communications & Signal...
PATH TO 5G: KEY TECHNOLOGIES
Charlie (Jianzhong) Zhang
Samsung
Dec 12, 2013
IEEE Globecom 2013 workshop on“Emerging Technologies for LTE-Advanced and Beyond 4G”
CONTENTS
1
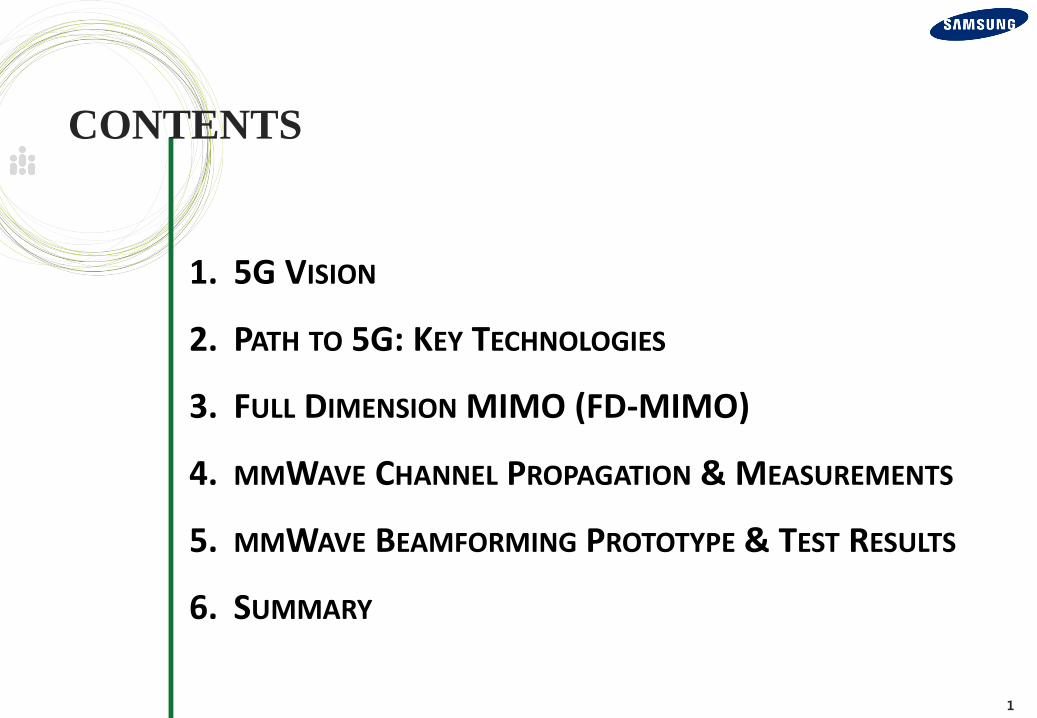
1. 5G VISION
2. PATH TO 5G: KEY TECHNOLOGIES
3. FULL DIMENSION MIMO (FD-MIMO)
4. MMWAVE CHANNEL PROPAGATION & MEASUREMENTS
5. MMWAVE BEAMFORMING PROTOTYPE & TEST RESULTS
6. SUMMARY

2
1. 5G VISION

3
5G Service Vision
Wearable/Flexible Mobile Device
Ubiquitous Health Care Mobile Cloud
Smart Map/Navigation Real-Time Interactive Game UHD Video Streaming
4
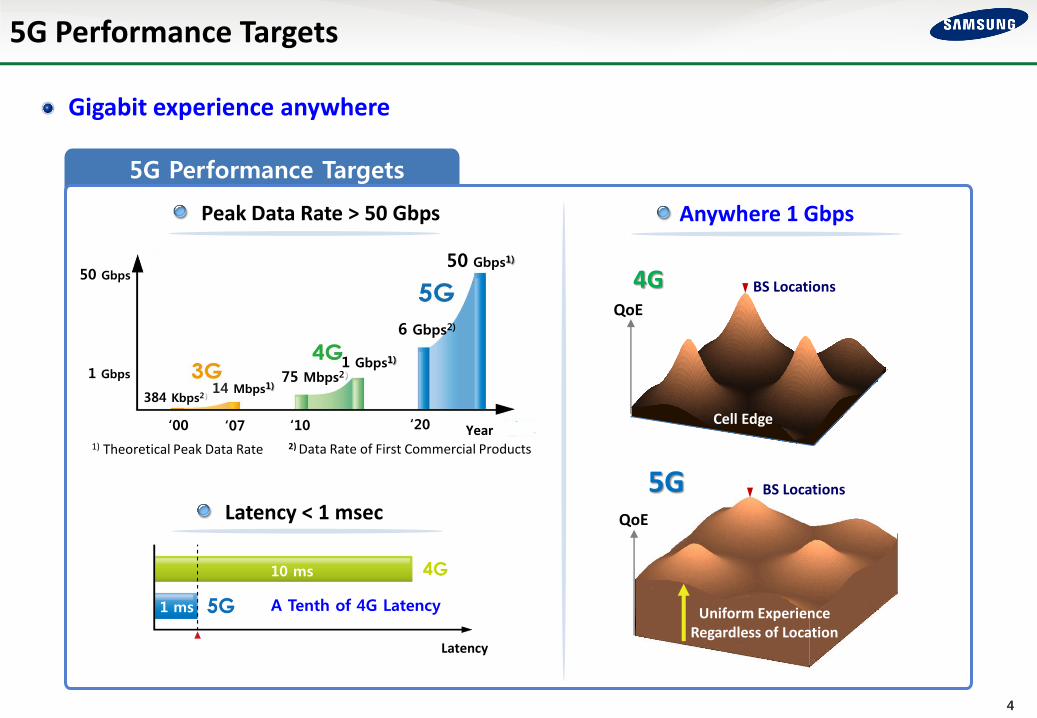
5G Performance Targets
5G Performance Targets
1) Theoretical Peak Data Rate 2) Data Rate of First Commercial Products
Peak Data Rate > 50 Gbps Anywhere 1 Gbps
QoE
BS Locations 4G
Cell Edge
QoE
BS Locations 5G
Uniform Experience Regardless of Location
Latency < 1 msec
Gigabit experience anywhere
10 ms
1 ms A Tenth of 4G Latency
Latency
50 Gbps1)
‘10 ‘00 ‘20 ‘07
384 Kbps2)
75 Mbps2)
6 Gbps2)
14 Mbps1)
1 Gbps1)
50 Gbps
1 Gbps
50 Gbps1)
Year
5
2. PATH TO 5G: KEY TECHNOLOGIES

6
Path to 5G: Key Technologies (1/2)
4G frequencies New higher frequencies
Peak Rate 1 Gbps Peak Rate 50 Gbps
Frequency band
.
Time/Frequency/Space
Orthogonal Multiple Access
Non-orthogonal Multiple Access
Time/Frequency/Space
Filter-bank Multi-carrier Enhancing areal spectral efficiency
Updated user-centric virtual cell
No cell boundary
Previous virtual cell
mmWave System Tech. Adv. Small Cell
Adv. Coding & Modulation Device-to-Devie (D2D)

7
Path to 5G: Key Technologies (2/2)
BSM-BS
BS M-BS
InternetLocation Registry
BS
CN
Collocated BS/AP
AP
5G Core Network
Non-collocated BS/AP
.
Large scale Multi-antenna
Half-wavelength
Interference alignment
Enhanced Flat NW IWK/Integration w/ Wi-Fi
Adv. MIMO/BF (e.g., FD-MIMO) Interference Management

8
3. FULL DIMENSION MIMO (FD-MIMO)

9
Full Dimension MIMO (FD-MIMO) for Cellular Bands
Solution Benefit
State of industry
- 2020, 1000 times traffic increase
- Need for new innovation
Pain Point
FD-MIMO 1) 2D Active Antenna Array (AAA)
up to ~100 antennas at eNB
2) MU-MIMO with 10s of Ues
3) 3D channel model
Cell capacity benefit
- FD-MIMO is a key technology
for path to 5G
- Promising capacity gain for
operators and consumers
- Comparable cost to
conventional eNB 0%
50%
100%
150%
200%
250%
300%
HSPA(2005)
LTE(2008)
LTE -A(2011)
CPRI
LTE Infrastructure
IP
FD-MIMO eNB
High order MU-MIMO transmission to more than 10 UEs
Rel-10 FD-MIMO 32-64TX
FD-MIMO 100TX
96cm @ 2.5GHz69cm @ 3.5GHz
4V X 8H
Transceiver
Array Panel
48cm @ 2.5GHz35cm @ 3.5GHz
10
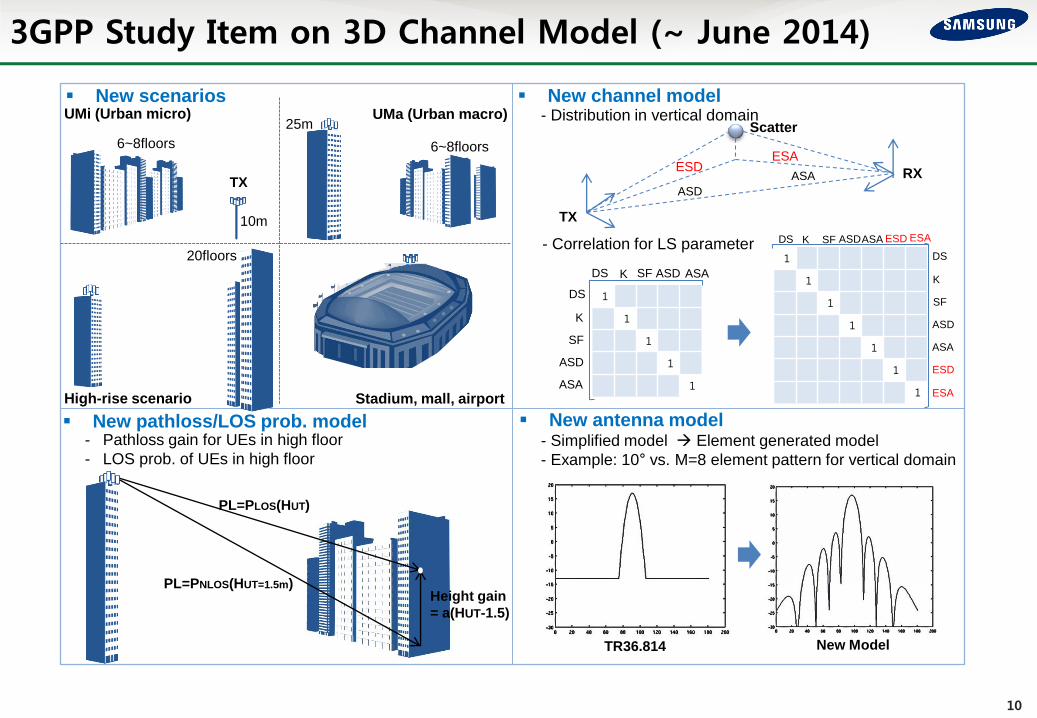
3GPP Study Item on 3D Channel Model (~ June 2014)
New scenarios New channel model
New antenna model New pathloss/LOS prob. model - Simplified model Element generated model
- Example: 10° vs. M=8 element pattern for vertical domain
TR36.814 New Model
1
1
1
1
1
- Distribution in vertical domain
- Correlation for LS parameter
DS
DS
K
SF
ASD
ASA
K SF ASD ASA
1
1
1
1
1
1
1
DS K SF ASD ASA ESD ESA
DS
K
SF
ASD
ASA
ESD
ESA
TX
RX
ASD
ASA ESD
ESA
Scatter
- Pathloss gain for UEs in high floor
- LOS prob. of UEs in high floor
PL=PLOS(HUT)
PL=PNLOS(HUT=1.5m) Height gain
= a(HUT-1.5)
UMi (Urban micro) UMa (Urban macro)
High-rise scenario Stadium, mall, airport
6~8floors
10m
TX
6~8floors
25m
20floors

-1500 -1000 -500 0 500 1000 1500-1500
-1000
-500
0
500
1000
1500
12
34
56
78
910
1112
13
14
1516
1718
19
12
34
56
78
910
1112
13
14
1516
1718
19
12
34
56
78
910
1112
13
14
1516
1718
191
23
4
56
78
910
1112
13
14
1516
1718
19
12
34
56
78
910
1112
13
14
1516
1718
19
12
34
56
78
910
1112
13
14
1516
1718
19
12
34
56
78
910
1112
13
14
1516
1718
19
• In a TDD system, up to 6X gain for cell average, and up to 10X for cell edge users
• FD-MIMO: 8H8V at base station, 2 Rx at terminal
• Baseline: Rel-10 4H1V at base station, 2 Rx at terminal
0.0437
0.3156
0.4632
0.30830.3367
0
0.05
0.1
0.15
0.2
0.25
0.3
0.35
0.4
0.45
0.5
Baseline CR-4 (CB) AUFB (CB) CR-4 (SLNR) AUFB (SLNR)
Cell Edge
• 3D-UMa, up-to-date 3GPP 3D channel model
• 57 sectors/wraparound, and M=10 2-Rx UEs per sector
• UEs dropped uniformly across floors in 4-8 floor buildings
• UEs dropped 80% Indoor and 20% outdoor (mobility 3kmh)
• Carrier frequency 2GHz, bandwidth 10 MHz
• Full-buffer
• AUFB: All UE full BW
• CR-4: Correlation scheduling wi
th max 4 UEs
• CB: Conjugate beamforming
• SLNR: Signal to leakage + noi
se ratio
(b/s/Hz) (b/s/Hz)
1.848
7.3829
8.4361
9.7406
13.0039
0
2
4
6
8
10
12
14
Baseline CR-4 (CB) AUFB (CB) CR-4 (SLNR) AUFB (SLNR)
Cell Average

12
4. MMWAVE CHANNEL PROPAGATION & MEASUREMENTS

13
Higher Frequency Candidates
Spectrum Candidates
Candidates for large chunks of contiguous spectrum
- 13.4~14 GHz, 18.1~18.6 GHz, 27~29.5 GHz, 38~39.5 GHz, etc.
.
EESS (Earth Exploration-Satellite Service) FSS (Fixed Satellite Service) RL (RadioLocation service), MS (Mobile Service) FS (Fixed Service) P-P (Point to Point) LMDS (Local Multipoint Distribution Services)
ITU
13.4 14 27 29.5 38 39.5
26.5 29.5 31.3 33.4 40.2 42.5
27.5 29.5 31.3 33.8 41 42.5 38.6 40
MOBILE Primary
No MOBILE
MS FS
FSS
EESS FSS RL
MS FS
FSS
MS FS
FSS
Current Usage US: LMDS, FSS EU: Fixed P-P link , FSS earth sta. China: Mobile, FSS Korea : Maritime use
Current Usage US: Fixed P-P system EU: Fixed P-P link Korea : None
18.6 18.1
14
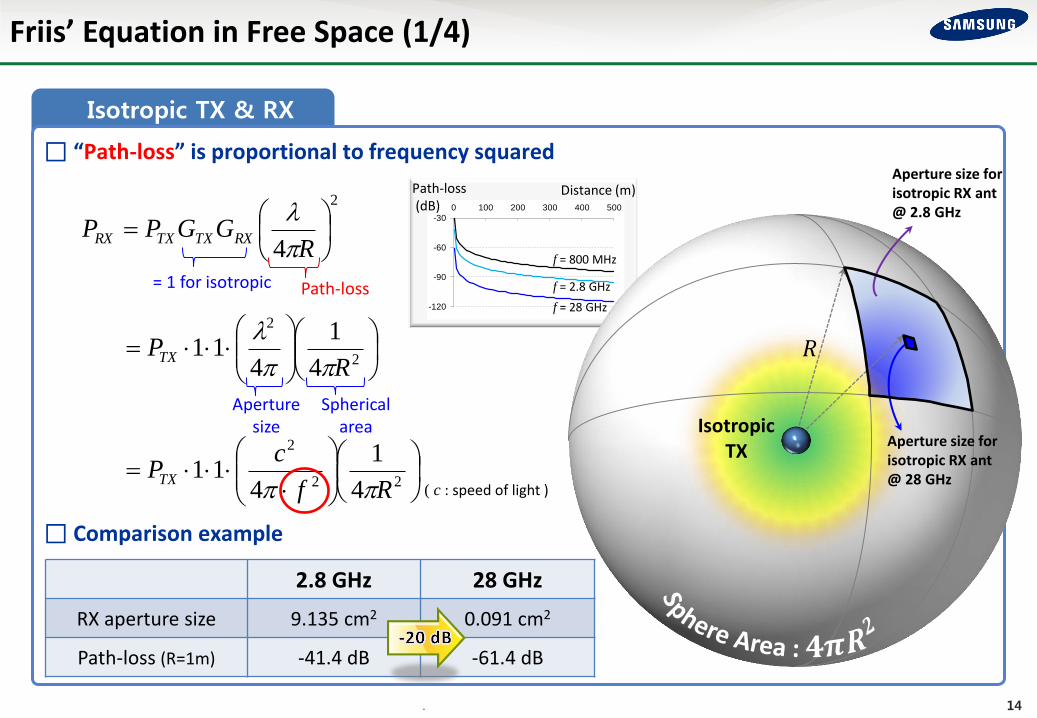
Isotropic TX & RX Antennas
□ “Path-loss” is proportional to frequency squared
□ Comparison example
22
2
2
2
2
4
1
411
4
1
411
4
Rf
cP
RP
RGGPP
TX
TX
RXTXTXRX
Friis’ Equation in Free Space (1/4)
Spherical area
Aperture size
.
Path-loss
2.8 GHz 28 GHz
RX aperture size 9.135 cm2 0.091 cm2
Path-loss (R=1m) -41.4 dB -61.4 dB
= 1 for isotropic
( c : speed of light )
g
-120
-90
-60
-30
0 100 200 300 400 500
f = 800 MHz
f = 2.8 GHz
f = 28 GHz
Distance (m) Path-loss (dB)
𝑅
Isotropic TX
Aperture size for isotropic RX ant @ 2.8 GHz
Aperture size for isotropic RX ant @ 28 GHz
15
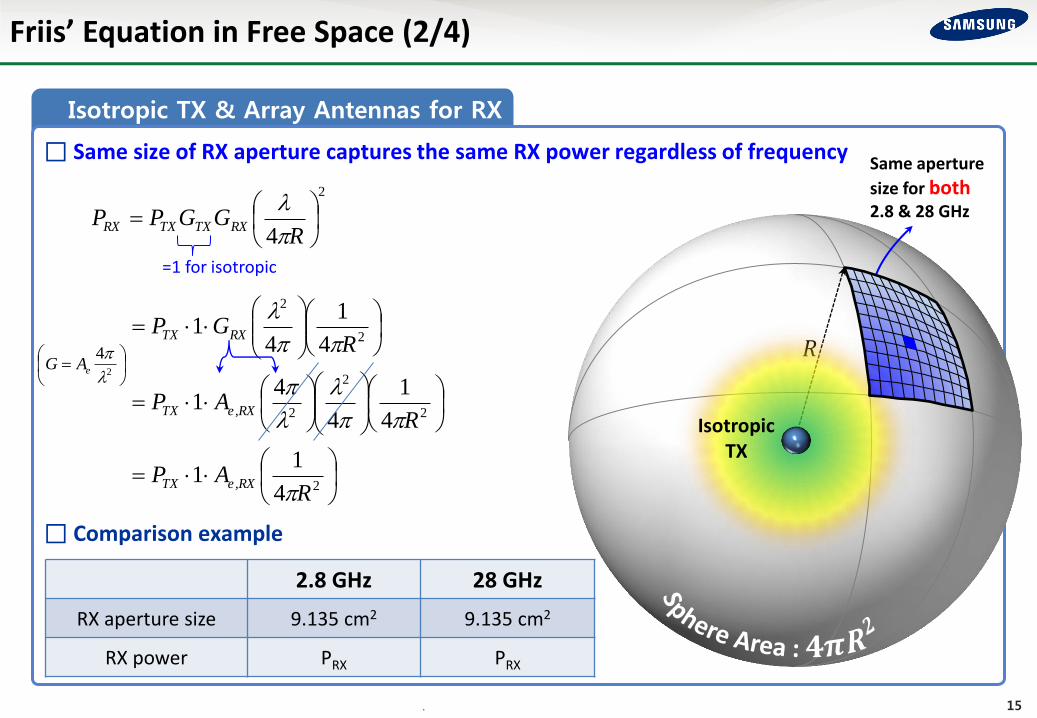
Isotropic TX & Array Antennas for RX
Friis’ Equation in Free Space (2/4)
□ Same size of RX aperture captures the same RX power regardless of frequency
□ Comparison example
.
2
2
2
2
2
2
2
4
11
4
1
4
41
4
1
41
4
RAP
RAP
RGP
RGGPP
RX,eTX
RX,eTX
RXTX
RXTXTXRX
𝑅
Same aperture
size for both 2.8 & 28 GHz
2
4
eAG
=1 for isotropic
2.8 GHz 28 GHz
RX aperture size 9.135 cm2 9.135 cm2
RX power PRX PRX
Isotropic TX

16
Friis’ Equation in Free Space (3/4)
Array Antennas for Both TX & RX
□ RX power is even bigger at higher frequency with array antennas for both TX & RX
□ Comparison example
.
𝑅
2.8 GHz 28 GHz
RX power PRX PRX + 20 dB
Array antennas
2
4
eAG
22
2
2
4
14
4
Rc
fAAP
RGGPP
RX,eTX,eTX
RXTXTXRX
22
2
2
22
2
2
4
14
4
1
4
44
4
1
4
RAAP
RAAP
RGGP
RX,eTX,eTX
RX,eTX,eTX
RXTXTX
( c : speed of light )
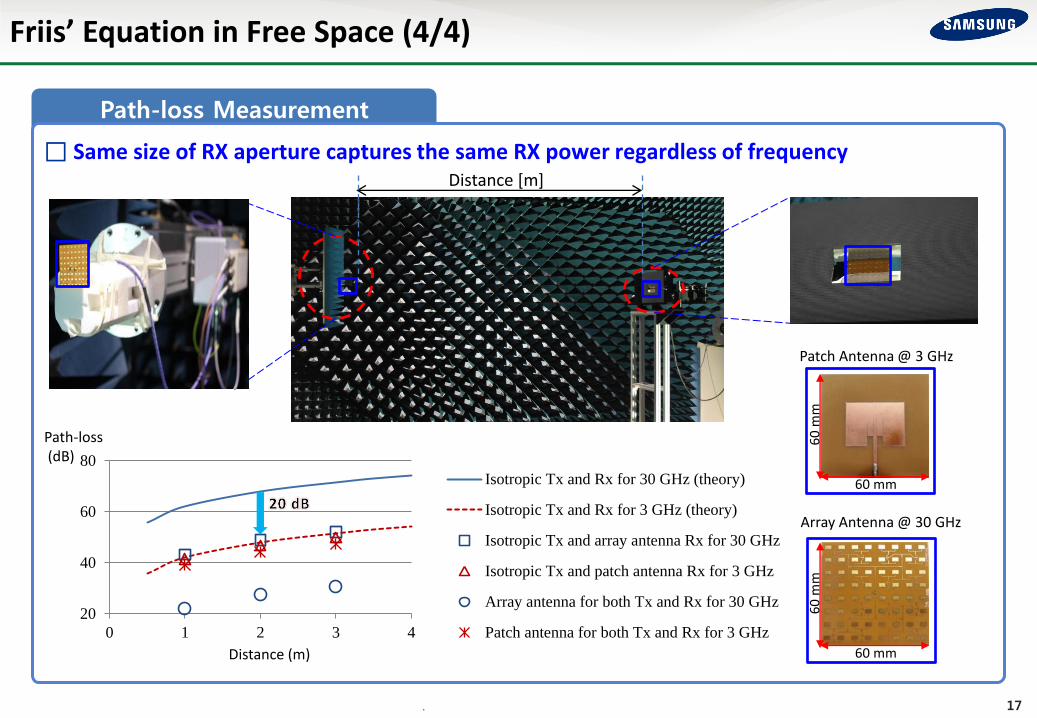
17
Path-loss Measurement
20
40
60
80
0 1 2 3 4
Isotropic Tx and Rx for 30 GHz (theory)
Isotropic Tx and Rx for 3 GHz (theory)
Isotropic Tx and array antenna Rx for 30 GHz
Isotropic Tx and patch antenna Rx for 3 GHz
Array antenna for both Tx and Rx for 30 GHz
Patch antenna for both Tx and Rx for 3 GHz
Friis’ Equation in Free Space (4/4)
□ Same size of RX aperture captures the same RX power regardless of frequency
.
Distance [m]
Patch Antenna @ 3 GHz
Array Antenna @ 30 GHz
60 mm
60
mm
60 mm
60
mm
Distance (m)
Path-loss (dB)

18
Atmospheric Absorption Loss
Atmospheric absorption loss due to H2O & O2 at 28 GHz is negligible
Atmospheric Absorption
[Ref.] M. Marcus and B. Pattan. Millimeter wave propagation: spectrum management implications. IEEE Microwave Magazine, June 2005.
.
□ H2O absorption @ 28 GHz is about 0.09 dB/km (=0.018 dB/200 m)
□ O2 absorption @ 28 GHz is about 0.02 dB/km (=0.004 dB/200 m)
[Specific attenuation due to oxygen and water vapor ] [Conditions ]

19
Precipitation Loss
At 28GHz, approximately 4 dB at 200 m even for 110 mm/hour intensity
Precipitation Loss
□ 100-year recurrence 1-hour rain intensity is approximately 110 mm/hour (Seoul, Korea)
□ 100-year recurrence 1-hour rain intensity is approximately 70-127 mm/hour (US east cost)
[Attenuation due to rain]
[Ref.] M. Marcus and B. Pattan. Millimeter wave propagation: spectrum management implications. IEEE Microwave Magazine, June 2005. [Ref.] http://www.nws.noaa.gov/ohd/hdsc/On-line_reports/
100-year recurrence 1-hour rain intensity (US east cost)
Florida : 127 mm/hour
Washington D.C. : 76.2 mm/hour
New York : 69.85 mm/hour

20
Foliage Loss
Foliage Loss
Loss in dense foliage is not negligible, but other reflection paths are expected in urban environments
.
□ Additional loss of 28 GHz compared to 2.8 GHz: 3.3 dB (2 m foliage), 8.6 dB (10 m foliage)
- In urban environments, other reflection paths are highly expected from surroundings
dB 2.0 6.03.0 DfL foliage
Empirical relationship for loss :
where f : frequency in MHz, D : depth of foliage transverse in meters (D < 400 m)
[Ref.] M. Marcus and B. Pattan. Millimeter wave propagation: spectrum management implications. IEEE Microwave Magazine, June 2005.

21
UT Austin Campus, US
Transmitter
Receiver
Channel Measurement – Sub-Urban
Similar path-loss exponent & smaller delay spread measured (w.r.t. current cellular bands)
Samsung Campus, Korea
101
102
-70
-60
-50
-40
-30
-20
-10
0
Distance [m]
Receiv
ed p
ow
er
[dB
m]
Received power for 10->60
LOS
n=2.22, s=4.18dB
NLOS-best
n=3.69, s=3.58dB
NLOS-all
n=4.20, s=7.38dB
5
[Received Power]
LOS NLOS
Path Loss Exponent 2.22 3.69
RMS Delay Spread [ns]
Median 4.0 34.2
99% 11.4 168.7
LOS NLOS
Path Loss Exponent 2.21 3.18
RMS Delay Spread [ns]
Median 1.9 15.5
99% 13.7 166
[Received Power]
Tx (10o) Rx (60o)
28 GHz
Tx (7.8o) Rx (49o)
37.6 GHz
University of Texas at Austin, TX
- Measurements were made by using horn-type antennas at 28 GHz and 38 GHz in 2011
Transmitter
Receiver
Suwon, Korea
* Reference : Prof. Ted Rappaport, UT Austin, 2011
22
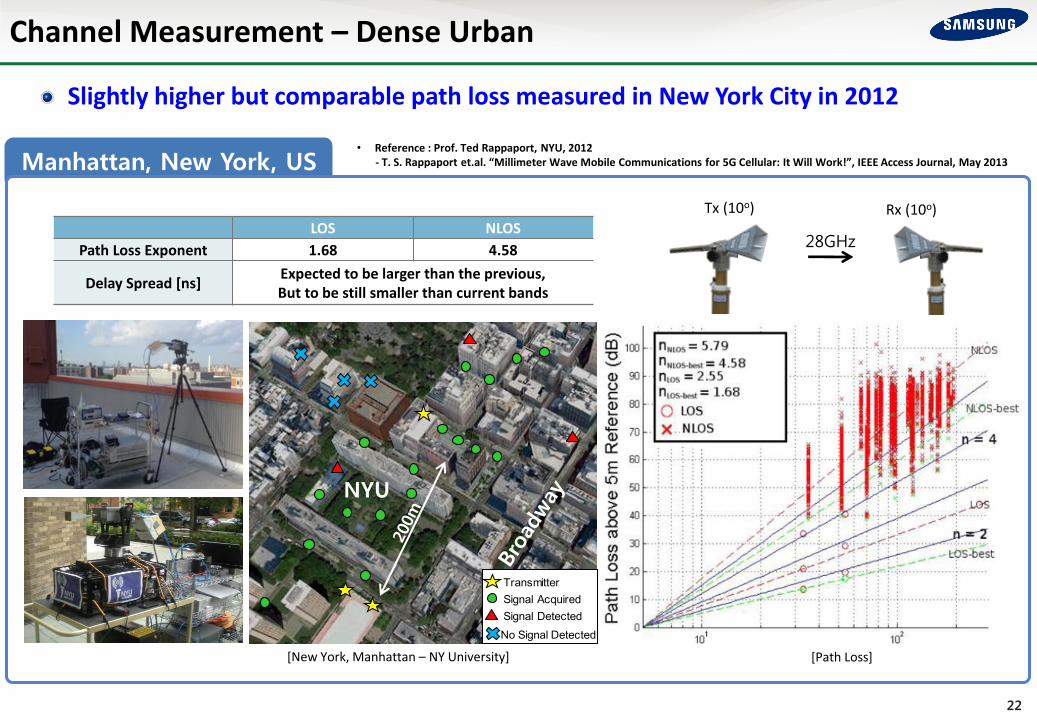
Channel Measurement – Dense Urban
Slightly higher but comparable path loss measured in New York City in 2012
Manhattan, New York, US
[New York, Manhattan – NY University] [Path Loss]
LOS NLOS
Path Loss Exponent 1.68 4.58
Delay Spread [ns] Expected to be larger than the previous, But to be still smaller than current bands
Tx (10o) Rx (10o)
28GHz
NYU
Transmitter
Signal Acquired
Signal Detected
No Signal Detected
• Reference : Prof. Ted Rappaport, NYU, 2012 - T. S. Rappaport et.al. “Millimeter Wave Mobile Communications for 5G Cellular: It Will Work!”, IEEE Access Journal, May 2013
23
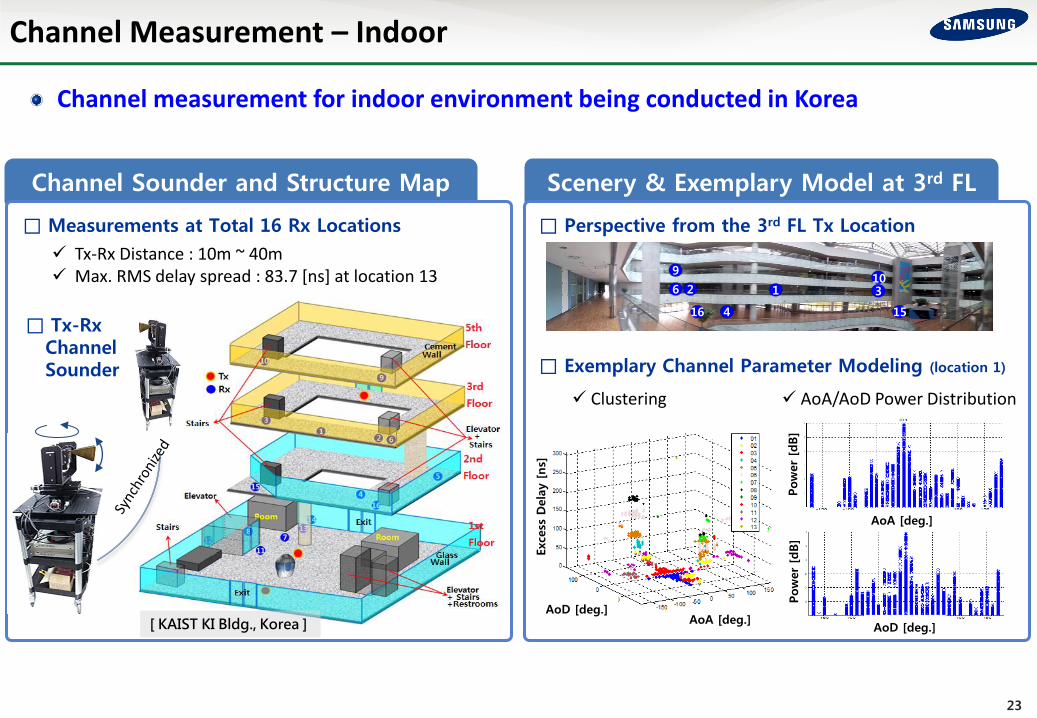
Channel Measurement – Indoor
Channel Sounder and Structure Map Scenery & Exemplary Model at 3rd FL
Channel measurement for indoor environment being conducted in Korea
□ Measurements at Total 16 Rx Locations
Tx-Rx Distance : 10m ~ 40m Max. RMS delay spread : 83.7 [ns] at location 13
1 6 2
9
4 16 15
3 10
□ Perspective from the 3rd FL Tx Location
□ Exemplary Channel Parameter Modeling (location 1)
AoA/AoD Power Distribution Clustering
Exce
ss D
ela
y [
ns]
AoD [deg.] AoA [deg.]
Pow
er
[dB]
Pow
er
[dB]
AoA [deg.]
AoD [deg.]
□ Tx-Rx Channel Sounder
[ KAIST KI Bldg., Korea ]

24
5. MMWAVE BEAMFORMING PROTOTYPE & TEST RESULTS
25
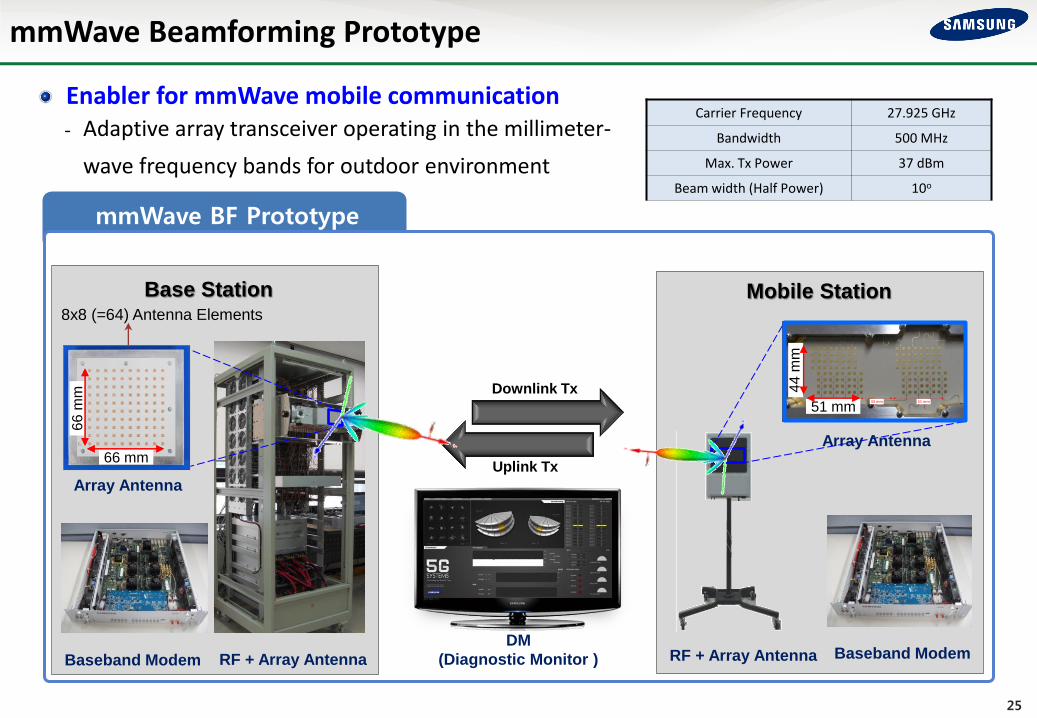
mmWave Beamforming Prototype
- Adaptive array transceiver operating in the millimeter-
wave frequency bands for outdoor environment
Enabler for mmWave mobile communication Carrier Frequency 27.925 GHz
Bandwidth 500 MHz
Max. Tx Power 37 dBm
Beam width (Half Power) 10o
mmWave BF Prototype
DM
(Diagnostic Monitor ) RF + Array Antenna Baseband Modem Baseband Modem RF + Array Antenna
8x8 (=64) Antenna Elements
Downlink Tx
Uplink Tx
Base Station
66 mm
66
mm
44
mm
51 mm 33 mm 51 mm
Array Antenna
Array Antenna
Mobile Station
66 mm
66 m
m 44 m
m
51 mm

26
System Parameters & Test Results
PARAMETER VALUE
Carrier Frequency 27.925 GHz
Bandwidth 500 MHz
Duplexing TDD
Array Antenna Size 8x8 (64 elements)
8x4 (32 elements)
Beam-width (Half Power) 10o
Channel Coding LDPC
Modulation QPSK / 16QAM
PARAMETER VALUE REMARKS
Supported
Data Rates
1,056Mbps
528Mbps
264Mbps
Max Tx Range Up to 2km @ LoS >10 dB Tx power
headroom
Performance tests of mmWave OFDM prototype
Measurements with DM
Test Results of mmWave Beamforming Prototype
- OFDM system parameters designed for mmWave bands
- Indoor & outdoor measurements performed for different data rates and transmission ranges
UHD & Full-HD Video Streaming
Full-HD
4K UHD

27
LoS Range
Outdoor LoS range test
Test Results – Range
- Error-free communications possible at 1.7 km LoS with > 10dB Tx power headroom
- Pencil beamforming at both transmitter and receiver supporting long range communications
- 1710m LOS 측정 자료로 수정 예정
1.7 km
Base
Station
Mobile
Station
Suwon Campus, Korea □ Support wide-range LoS coverage
16-QAM (528Mbps) : BLER 10-6
QPSK (264Mbps) : Error Free
BLER : Block Error Rate QPSK : Quadrature Phase Shift Keying QAM : Quadrature Amplitude Modulation

28
Mobility Support in NLoS
Outdoor NLoS mobility tests
Test Results – Mobility
- Adaptive joint beamforming & tracking supports 8 km/h mobility even in NLOS
□ Mobility support up to 8 km/h at outdoor NLoS environments
16-QAM (528Mbps) : BLER 0~0.5%
QPSK (264Mbps) : Error Free
[ DM Screen during Mobility Test]
Base
Station
Mobile
Station

29
Outdoor to Indoor #2 Outdoor to Indoor #1
□ Signal measured inside office on 7th FL of R2
- QPSK : BLER 0.0005~0.6% (Target : < BLER 10%)
□ Signal measured inside the lobby at R4
- QPSK : BLER 0.0005~0.3% (Target : < BLER 10%)
Test Results – Building Penetration
Outdoor-to-indoor penetration tests
R2
R1
- Indoor MS can successfully receive most signals sent from outdoor BS
- Outdoor-to-indoor penetration made through tinted glasses and doors
R4
R2
160 m 65 m
Mobile
Station
Base
Station
Mobile
Station
Base
Station
30
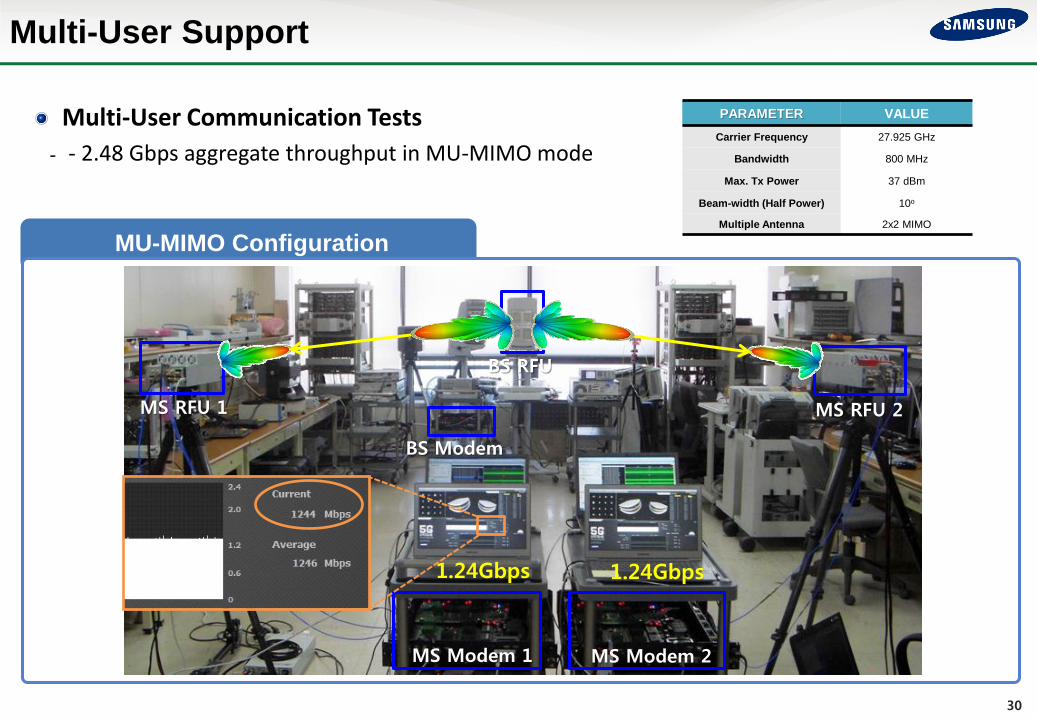
Multi-User Support
MU-MIMO Configuration
Multi-User Communication Tests
- - 2.48 Gbps aggregate throughput in MU-MIMO mode
1.24Gbps 1.24Gbps
MS Modem 1 MS Modem 2
MS RFU 2 MS RFU 1
BS RFU
BS Modem
PARAMETER VALUE
Carrier Frequency 27.925 GHz
Bandwidth 800 MHz
Max. Tx Power 37 dBm
Beam-width (Half Power) 10o
Multiple Antenna 2x2 MIMO

31
Summary
FD-MIMO to provide 4-5x capacity compared to existing LTE-Adv
• 2D Active Antenna Array (AAA) at eNB with MU-MIMO of 10s of UEs
• Comparable cost to conventional eNB
• 3GPP study item on 3D channel model to be developed until December 2013
mmWave BF technology as a viable solution to provide Gbps experience
• Promising mmWave channel measurement data obtained and modeling to follow
• Encouraging results of outdoor coverage and indoor penetration tests shown
• Real-time adaptive beamforming and tracking implemented to show mobility support
5G = more productive society and a better world