Mike Paterson Uri Zwick Overhang. Mike Paterson Uri Zwick Overhang.

Microspectroscopy Beamline
Accelerator Science School and Workshop25 March 2008
David Paterson

The Synchrotron World Map
– as seen from Australia

Operating at full speed = 200 mA @ 3 GeV

� Energy range4 keV to 25 keV
� Nanoprobe
100 nm spatial resolution� Elements accessible
atomic number ≥ 11, sodium & heavier by XRFatomic number ≥ 22, titanium & heavier by XAS
� MeasurementsX-ray fluorescence (XRF), X-ray absorption spectra (XAS), µXANES & µEXAFS – spatially resolved
� InformationElemental mapping, chemical state mapping, ppm sensitivity, long & short range structure
� Synchrotron benefits compared to lab sourceSpot size (0.1-10 µm), energy scanning, intensity/sensitivity
Microspectroscopy beamline
– vital statistics
Pt spectrum located in a tumour cellHambley et al, U Sydney

Conceptual layout
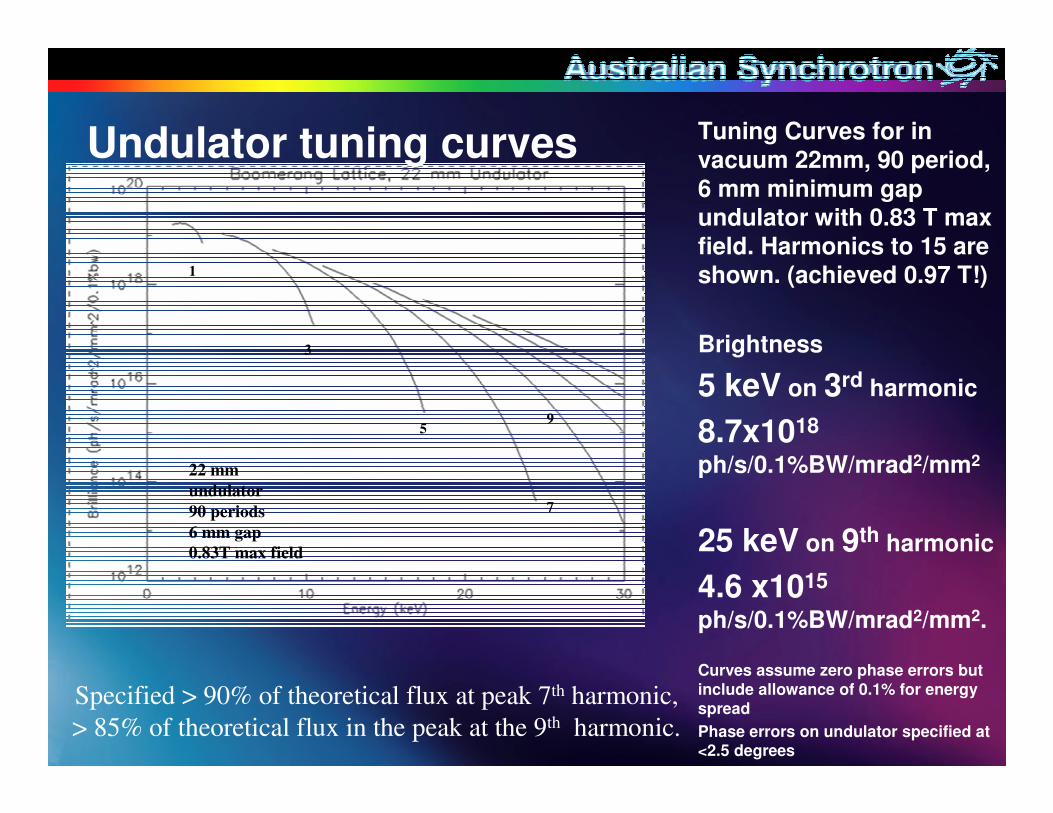
Undulator tuning curves Tuning Curves for in vacuum 22mm, 90 period,
6 mm minimum gap undulator with 0.83 T max field. Harmonics to 15 are shown. (achieved 0.97 T!)
Brightness
5 keV on 3rd harmonic
8.7x10¹⁸
ph/s/0.1%BW/mrad2/mm2
25 keV on 9th harmonic
4.6 x10¹⁵
ph/s/0.1%BW/mrad2/mm2.
Curves assume zero phase errors but include allowance of 0.1% for energy spread
Phase errors on undulator specified at <2.5 degrees
22 mm
undulator
90 periods
6 mm gap
0.83T max field
1
3
5
7
9
Specified > 90% of theoretical flux at peak 7th harmonic,
> 85% of theoretical flux in the peak at the 9th harmonic.
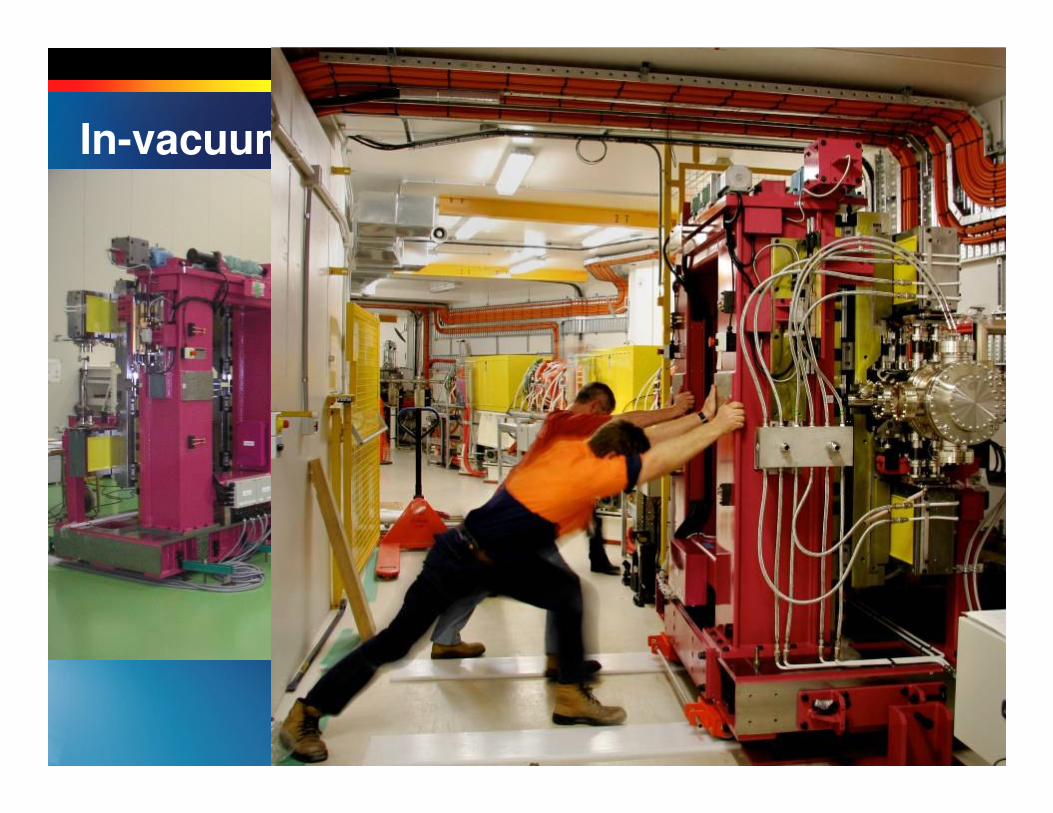
In-vacuum undulator

Optics only in horizontal
S0.5LD λ=

Coherent illumination - van Cittert-Zernike theorem
the spatial coherence over a space illuminated by an incoherent extended source is described by the Fourier transform of the intensity distribution over the source
77200.622018.83848BDA
72370.622037.676816Vert
4370.6220753.536320Horiz
16 µm124201.241023.54810BDA
Vertical source size143371.241037.676816Vert
7371.2410753.536320Horiz
BDA @ 17 m310202.48518.83848BDA
287372.48537.676816Vert
Horizontal 320 µm14372.485753.536320Horiz
Diam
(µµµµm)(m)(A)(keV)FWHM
(µµµµm)1σ σ σ σ (µµµµm)
NoteCohillumLλλλλ
Energy
Source SizeSource Size
S0.5LD λ=

Horizontal diffraction geometry
Polarization losses?
Pi polarization
Acceptance of nanoprobe
optics = 6.7 µrad
Throughput becomes
5.0 keV 50% -> 80%
10 keV 91% -> 99%

KB mirrors horizontal acceptance

Horizontal compound focusing

Horizontal bounce DCM
Optics only horizontal Horizontal focussing mirror
Detailed final design

Double multilayer monochromatorIntegrated design:
Double Crystal Monochromator & Double Multilayer MonochromatorDCM-Si(111): 0.02% ∆E/E 1×10¹² ph/s @ 12 keV in 10 µm4×1010 ph/s @ 12 keV in 1 µmDMM: 2% ∆E/E, 1×10¹³ ph/s in 10 µm
1st Crystal
Assembly
Cooled
Via Braid
2nd Crystal
Cage
Providing
Pitch, Roll &
Yaw
Y Motor
Bragg Motor
Bragg
Rotary
Table
LN2
Supply
Pipe
Kinematic
mount
DCM Mechanism
DMM Second Multilayer Cage
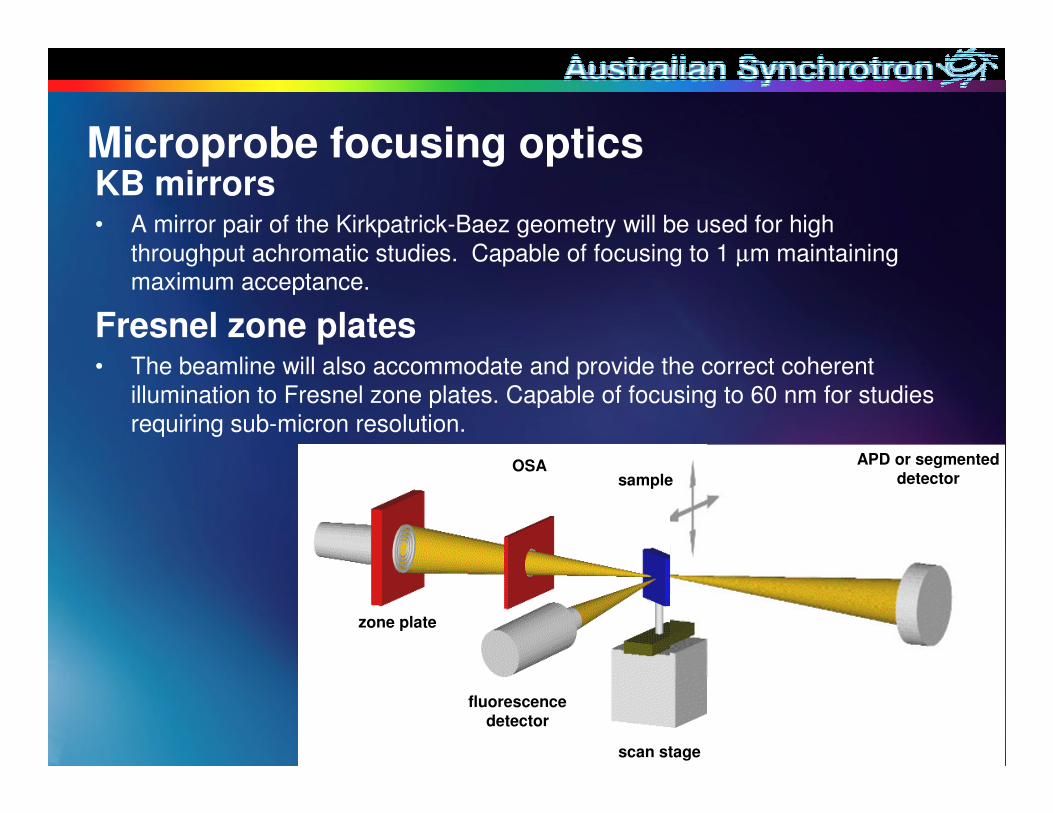
Microprobe focusing opticsKB mirrors• A mirror pair of the Kirkpatrick-Baez geometry will be used for high
throughput achromatic studies. Capable of focusing to 1 µm maintaining maximum acceptance.
Fresnel zone plates• The beamline will also accommodate and provide the correct coherent
illumination to Fresnel zone plates. Capable of focusing to 60 nm for studies requiring sub-micron resolution.
OSA
scan stage
sample
zone plate
APD or segmented detector
fluorescence detector

Integrated KB mirrors and zone plate optics

Cou
rtes
y S
RR
C, T
aiw
an
Absorption SpectroscopyImaging absorption and
phase contrast
Trace element analysisChemical information
Surface science
Structural analysis
Interaction of X-rays with matter

Applications: biological & environmental sciences
Trace metal mapping and speciation

What killed Beethoven?Using synchrotron light to analyse six strands of Beethoven’s hair, US scientists discovered 100 times the safe level of lead.
The result showed his deafness, other illnesses and death were likely to have been caused by lead poisoning.
Uses and applicationsMicrospectroscopy

Forged documents and counterfeit money can be detected using synchrotron techniques.
Extremely small samples from crime scenes can be analysedusing synchrotron technology.
Characterise at the crime scene - safeguarding Australia
Forensics

Air pollution control strategies are very expensive so it’s important to target the right sources.
Airborne particles can be “fingerprinted”to identify their source - and dealt with !
Pollution Control
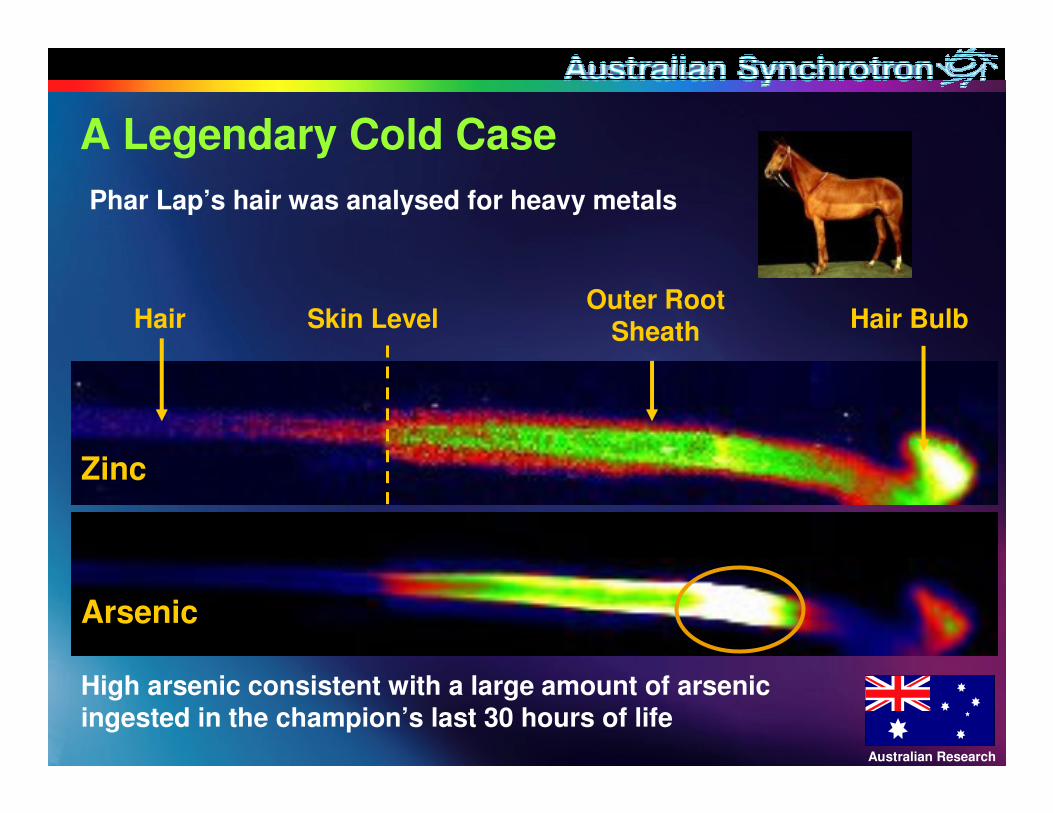
Phar Lap’s hair was analysed for heavy metals
High arsenic consistent with a large amount of arsenic ingested in the champion’s last 30 hours of life
Skin LevelHair Hair BulbOuter Root
Sheath
Zinc
Arsenic
Australian Research
A Legendary Cold Case

Spectromicroscopy examples
0.0
500
1000
1500
2000
2500
0.0
2.465 2.47 2.475 2.48 2.485 2.49 2.495
Y
X
Flu
ore
scen
ce / a
.u.
2.465 2.470 2.475 2.480 2.485 2.490 2.495 Photon Energy / eV
E =
247
2.6
eV
O
rga
nic
dis
ulfid
e S
Absorption edge
E = 2477.5 eV
E =
247
3.7
eV
T
hio
l / org
an
ic m
on
os
ulfid
e S
E =
247
5.7
eV
S
ulfo
xid
e S
E =
248
0.5
eV
S
ulfo
ne
S
E =
248
2.0
eV
S
ulfa
te S
Chemical analysis:IntegratedReduced ⇔ Oxidized
J. Prietzel, J. Thieme,U. Neuhäusler, J. Susini,I. Kögel-Knabner,EJSS 54(2003) 1-11

Spectromicroscopy examples
443322
1
50×50 µm2, 400×400 pixels, 125 nm, 0.5 sec dwell/pixel, full spectrum @ a pixel
sulfursulfur aluminiumaluminium siliconsilicon overlayoverlay

Australian research example: Speciation and distribution of phosphorus in fertilized soil
In calcareous soils of southern Australia the agronomic efficiency of P fertilizers is strongly dependent on the form of fertilizer
Liquid technical grade monoammonium phosphate (TG-MAP) was 4 to 15 times more effective in increasing the grain yield of wheat than granular MAP
Similar results were obtained when a number of fluid and granular products were compared in both greenhouse and field studies
Chemical and physical factors in combination cause fluid fertilizers to be more efficient than similar granular products� Soil diffusion of P from granular products is more limited than
when P is supplied with fluid fertilizers � may be the result of an increase precipitation in or around P
fertilizer granules, Specific mechanisms responsible for the differential response are
still poorly understood.

Si P
Al
75 nm pixels
5 µµµµm
P µXANES: identifying the forms of P in soil

eV
2120 2130 2140 2150 2160 2170 2180 2190 2200
Ammonium phosphate
Monocalcium Phosphate
Apatite
Iron Phosphate P on Fe particle
P hotspot
eV
2120 2130 2140 2150 2160 2170 2180 2190 2200
Ammonium phosphate
E. Lombi, K. G. Scheckel, R.D. Armstrong, J.N. Cutler and D. PatersonAmerican Soil Science Society Journal 70, 2038 (2006).
Point spectroscopy

Mg Phosphates?
P Mg
Si Sum
Fine scale fluorescence maps show elemental associations with P
2 microns

Al P
Si Sum
2 microns
Al Phosphates?

Diffuse phosphorus not associated with Mg, Na, Al or Si may be organic materials like cell walls
Al P
Si Sum
2 microns
Organic phosphates?

Effingham Inlet Oxic Site Surface Sediment
Polyphosphates occur in submicron scaleblobs - similar to those found in bacterial cells
Polyphosphates seen primarily in Effingham oxic surface sediments and rarely in anoxic sediments
Elemental mapping and spectroscopy

X-ray fluorescence map and spectra of marine sediment
20 µµµµm
ApatitePolyphosphate
Polyphosphate
Apatite
Red = phosphorus
Blue = aluminum
Green = magnesium

Diagenetic transformation of polyphosphate to apatite
Diaz et al Science , in pressa
b
c
d
apatite
polyphosphate
e

Detectors: optimum geometry for fluorescence detection
Traditional geometry
•Detector perpendicular to incident beam •sample @ 75-45°
•Minimises elastic scatter detection•Limits solid angle, lateral sample size and scan range
Annular geometry
•Maximises solid angle, sample @ 90°
•No constraint on lateral sample size and scan range
Horizontal sample scan
detectordetector
Solid angleSolid angle
detecto
rd
etector
Transmission Transmission
DPC DPC
detectordetector

50 msec dwell Emperor pyrite 800 x 500 10 µm pixel acquisition time in 5.5 hours
Next generation x-ray microspectroscopy: Fluorescence tomography and

6 ms/pixel = 2000 X 2000 pixels in 6.7 hours
XANES image stack collected at 20 photon energies, each with 300 x 300 pixels at a dwell time of 10 ms could be achieved in 5 hours

5 ms dwell, 6 hours total scan time!
Fe-Y-Cu RGB composite (1500 x 2624 pixels, 13 x 21 mm2)
Fe
Iron oxide nodules, Rose Dam WA
Sh
ad
es o
f thin
gs to
co
me …

Fluorescence tomography

600 µm
Detectors: Differential Phase Contrast
Why phase contrast?
Carbon

Phase contrast imaging
Trials @ APS 2-ID-B � 2 msec dwell, sub-msec achievable� Diatom @ 1790 eV fly scan� 25 nm pixel, 1000 X 1000 pixels, 40 min� Xradia 50 nm zone plate
10 µm10 µm
600 µm

10 µm
10 µm
b
a
Phase contrast imaging - intermediate energy

DPC tomography

Hard x-ray example - differential phase contrast
Scans of a cardiac myocyte, taken at 10 keV incident X-ray energy at 2-ID-E:ABS absorption contrast image showing mostly salt deposits that remained from sample preparation, note beam noise and intensity fluctuationsDPC differential phase contrast - visualizes the biological structure of the cellVLM visible light micrograph of the same cellDPC image gives significantly better representation of the biological mass of the specimen than the absorption contrast, and self normalizes against intensity fluctuations, ideal for fast fly scans
ABS DPC VLM
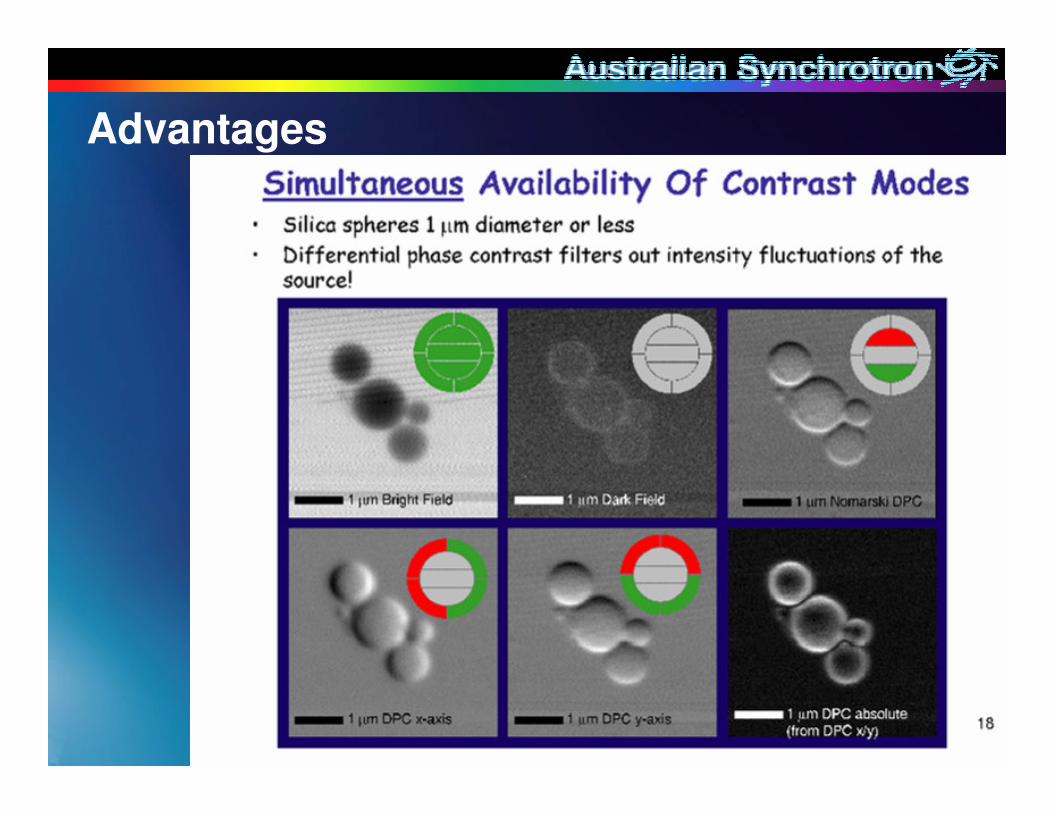
Advantages

How to correlate element distribution with biological structure ?
Hard X-ray microscopy: great sensitivity for medium/high Z elements,
but mapping of biological mass and structure (mostly C,N,H ) difficult:
very low photoelectric absorption(hard x-rays !)
very low fluorescence yield
at the same time:
• exact correlation of elemental maps with biological structure critical !!
Are these the same striations ???
Zn fluorescence
Visible light micrograph
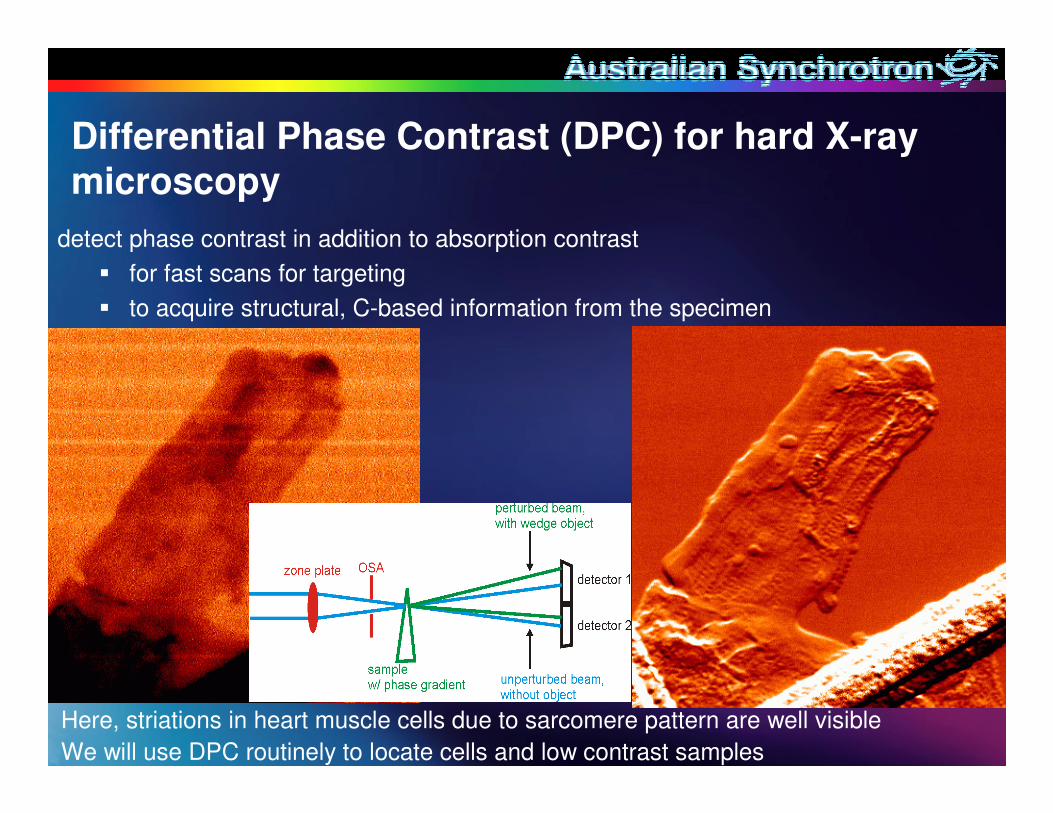
Differential Phase Contrast (DPC) for hard X-ray microscopy
Here, striations in heart muscle cells due to sarcomere pattern are well visibleWe will use DPC routinely to locate cells and low contrast samples
detect phase contrast in addition to absorption contrast� for fast scans for targeting� to acquire structural, C-based information from the specimen
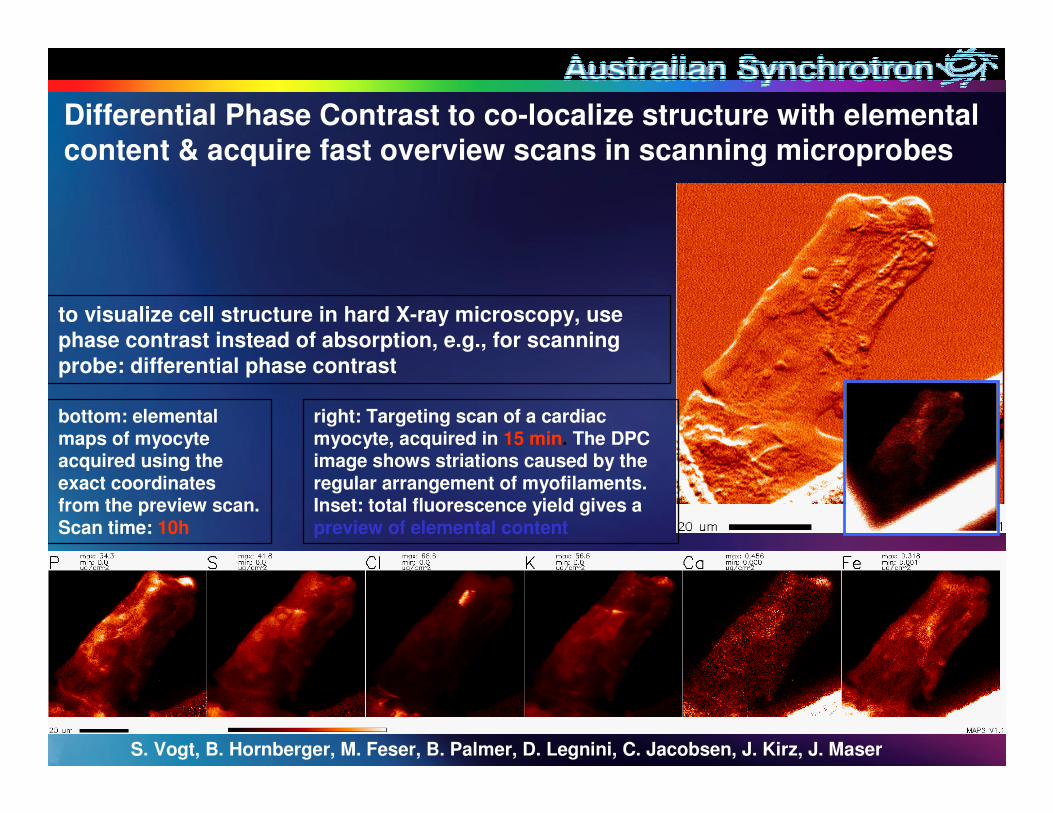
Differential Phase Contrast to co-localize structure with elemental content & acquire fast overview scans in scanning microprobes
right: Targeting scan of a cardiac myocyte, acquired in 15 min. The DPC image shows striations caused by the regular arrangement of myofilaments. Inset: total fluorescence yield gives apreview of elemental content
bottom: elemental maps of myocyte acquired using the exact coordinates from the preview scan. Scan time: 10h
S. Vogt, B. Hornberger, M. Feser, B. Palmer, D. Legnini, C. Jacobsen, J. Kirz, J. Maser
to visualize cell structure in hard X-ray microscopy, use phase contrast instead of absorption, e.g., for scanning
probe: differential phase contrast

Acknowledgements
Chris Ryan CSIRODavid Cohen ANSTOMartin de Jonge, Jonathan McKinlay Australian SynchrotronJörg Maser, Stefan Vogt, Ian McNulty, Barry Lai APS
• Invitation to postdocs and students interested in studying at the Australia Synchrotron
• Contact the relevant beamline [email protected]

Australian Synchrotronwww.synchrotron.org.au

1. High-throughput protein crystallography 3-BM1 5–23 keV2. Protein microcrystal & small molecule 3-ID 5.5–20 keV 3. Powder X-ray diffraction 10-BM1 4–37 keV (0.41-3.1 Å)4. Small and wide angle X-ray scattering 13-ID 5.5–20 keV5. X-ray absorption spectroscopy 12-ID 4–65 keV6. Soft X-ray spectroscopy 14-ID 0.1–2.5 keV7. Vacuum ultraviolet (VUV) ID 10–350 eV8. Infrared spectroscopy 1-BM 0.001–1 eV (2–10,000 cm–1) 9. Microspectroscopy 5-ID 4.5–20 keV
10. Imaging & medical therapy 8-ID 10–65 keV11. Microdiffraction and fluorescence probe BM 4–37 keV12. Circular dichroism BM 2–10 eV13. Lithography BM 2–25 keV
ID = Insertion Device BM = Bending Magnet
Initial Beamlines
P: 8.1 - 1.0 µg/cm2 S: 3.2 - 0.3 Cl: 1.4 - 0.2 Ca: 1.1- 0.0 Fe: 0.62-0.01 Cu: 0.017- 0.000 Zn: 0.076-0.001
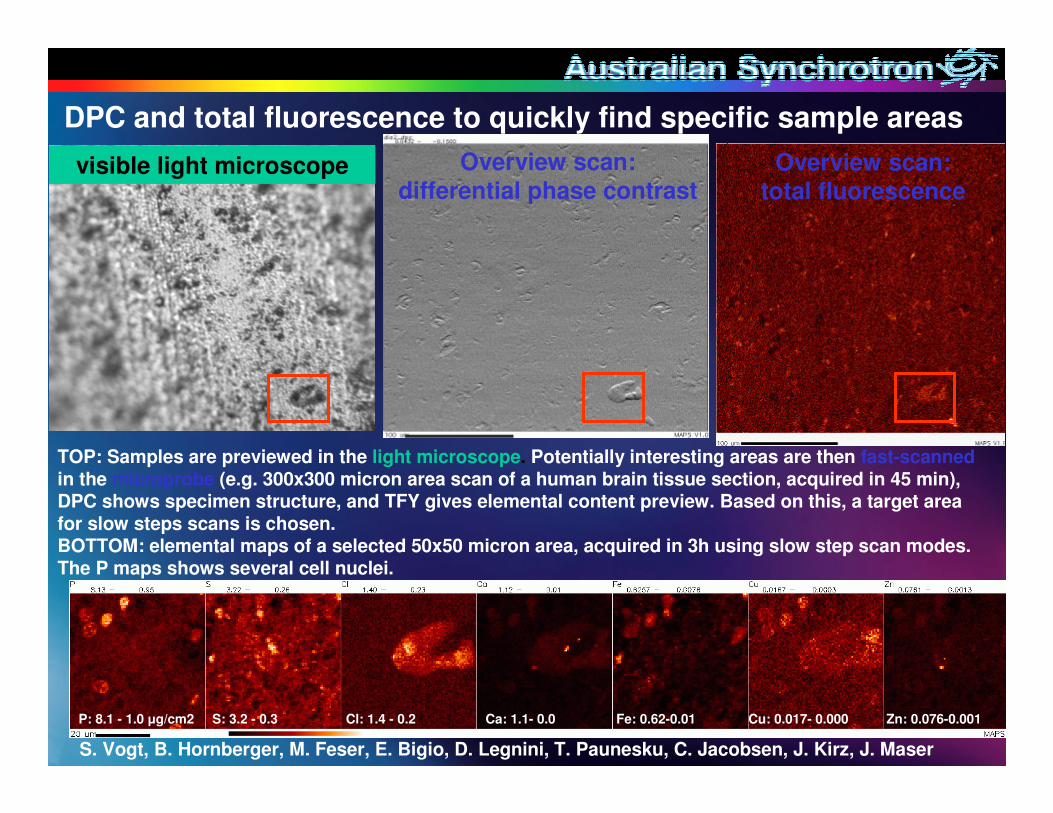
DPC and total fluorescence to quickly find specific sample areas
TOP: Samples are previewed in the light microscope. Potentially interesting areas are then fast-scannedin the microprobe (e.g. 300x300 micron area scan of a human brain tissue section, acquired in 45 min), DPC shows specimen structure, and TFY gives elemental content preview. Based on this, a target area for slow steps scans is chosen. BOTTOM: elemental maps of a selected 50x50 micron area, acquired in 3h using slow step scan modes. The P maps shows several cell nuclei.
S. Vogt, B. Hornberger, M. Feser, E. Bigio, D. Legnini, T. Paunesku, C. Jacobsen, J. Kirz, J. Maser
Overview scan: X-ray diff. phase contrast
visible light microscope Overview scan:total fluorescence
Overview scan: differential phase contrast