Pasture Range Forage Insurance is a very good product...
36
Pasture Range & Forage Insurance is a very good product because of the subsidies provided by USDA‐Risk Management Agency. These subsidies should offset any of the complaints that I have heard about the problems with NOAA’s rain gauges, i.e., your ranch did not get a rain but the grid index was above average. However, the insurance is very complicated and it takes a great deal of effort to understand it and to use it as an effective financial and range management tool. There is not time today to discuss all of the intricacies or show how all of the numbers were derived. Rather than to understand this presentation in detail try to grasp general concepts and trends. There is a handout with the highlights of this talk and it will be posted on the San Angelo website. 1
Transcript of Pasture Range Forage Insurance is a very good product...

Pasture Range & Forage Insurance is a very good product because of the subsidies provided by USDA‐Risk Management Agency. These subsidies should offset any of the complaints that I have heard about the problems with NOAA’s rain gauges, i.e., your ranch did not get a rain but the grid index was above average.
However, the insurance is very complicated and it takes a great deal of effort to understand it and to use it as an effective financial and range management tool. There is not time today to discuss all of the intricacies or show how all of the numbers were derived. Rather than to understand this presentation in detail try to grasp general concepts and trends.
There is a handout with the highlights of this talk and it will be posted on the San Angelo website.
1

Your acreage can be distributed in multiple ways among the different intervals as long as each interval has a minimum of 10% and no more than 50% of the enrolled acreage. At 10 percentage unit increments that creates over 300 more choices, which multiplied by the 92,700 results in over 27 million choices.
If you make 4 mouse clicks every second, 24 hours a day between now (Sept. 6) and the November 15, 2012 deadline for signing up for PRF insurance in 2013 you just might get through all 27,000,000 calculations
2

3

4

Do you have life insurance? Clearly, if you have life insurance, and if you are reading this, you don’t mind paying a premium even though you have not received an indemnity. In fact you never will receive an indemnity for your life insurance.
Do you have homeowner’s insurance? Did you make a claim against it last year? But you still pay the premiums.
One of the biggest mistakes that has recently been made with PRF insurance is that in 2010 people who took out PRF paid big premiums so they did not take it out in 2011.
Do you plan to die or have your home destroyed in the next 5 years? Do you expect there will be a drought in the next 5 years? Do you expect there could be more than 1 drought in the next 5 years?
That is the big difference between PRF and other types of insurance that you are familiar with. With other types of insurance you don’t expect to use them but with PRF you expect to have a drought and to collect an indemnity, which in part is why when you have to pay a premium it ishigh.
5

6
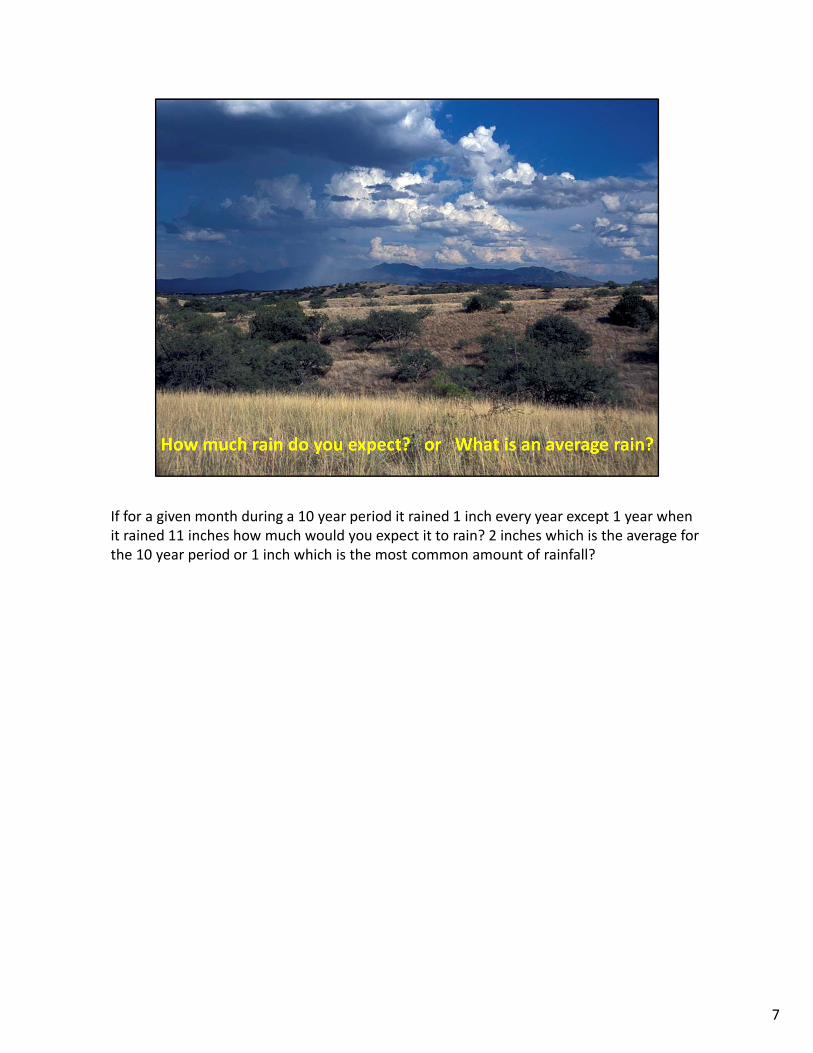
If for a given month during a 10 year period it rained 1 inch every year except 1 year when it rained 11 inches how much would you expect it to rain? 2 inches which is the average for the 10 year period or 1 inch which is the most common amount of rainfall?
7

May has had as much as over 11 inches of rain in the past 30 years and the average is about 2.7 inches but the median is 2 inches. The median for the year is 81% of the average a number that I will show the relevance to the PRF decisions latter.
8

9

10

This is the website to access the Decision Support Tool to evaluate different PRF insurance options for your property.
11

Current Extension budgets for this area assume a lease rate of 13.50/Animal Unit Month.The county based average of $8.25/acres is the equivalent of a stocking rate of 20 ac/ AU.
If you think the rental price for pasturing a cow should be different than $13.50 per month you can calculate the effect of that rental price on the equivalent stocking rate of the county base value using the following formula:
Equivalent Stocking Rate (ac/cow) = monthly rate x 12 ÷ count base value13.50 x 12 ÷ 8.25 = 19.6 ac/cow10 x 12 ÷ 8.25 = 14.5 ac/cow
If you believe that your carrying capacity is different from stocking rate based on the county base value it can be adjusted using the Protection Factor. For instance, if you think the actual carrying capacity for your ranch is 30 ac/cow the Protection Factor adjustment would be 20 ÷ 30 x 100 = 66% .
12

• Coverage Level is like the deductible on a home owners insurance – how much of the loss will you cover?
• When deciding what coverage level you want recall that for San Angelo the Median Rainfall of 16.6 inches is 81% of the Average Rainfall
• Protection Factor is like the valuation of the home.
13

14

There are several thing to note on this chart1. Premiums decrease as the amount of coverage declines, which is the equivalent of
lowering your premiums by increasing your deductible.2. The cost of coverage is quite high. Homeowner’s insurance for this area is generally less
than $1/$100 of coverage. PRF insurance averaged across all intervals and Coverage Levels is $22 / $100, i.e., 22 times as high, which reflects the fact that we expect to be in a drought.
3. The cost of coverage varies for the different periods.
15

The Protection Factor affects both the Premium Rate per $100 and the subsidy level. The higher the Protection Factor the higher the Premium Rate, because you will be indemnified more often.
16

• The subsidy for Producer Premium does not change between 70 & 75% or 80 & 85% Coverage Levels.
• Producer Premiums for the highest cost interval is nearly twice a great as for the lowest cost interval.
• Because the median rainfall which is really the most reasonable amount of rain to expect is 81% of the average rainfall and because the subsidy is the same for the 80 or 85% coverage level this is a very reasonable coverage level to consider.
17

Net returns presented in this chart is the average net return averaged across 64 years and all 11 intervals within a year.
Net returns are highest at the higher coverage levels and higher Protection Factors because you are using more of RMA’s funds on an actual dollar basis.
At the 70% Coverage Level and 60% Protection Factor the total premium is $3.47/ac and RMA contributes $2.04.At the 90% Coverage Level and 150% Protection Factor the total premium is $11.14/ac and RMA contributes $5.68.Even though at the 90% Coverage Level the percentage subsidy is lower (51% compared to 59% for 70% Coverage Level) the amount of dollars leveraged is greater resulting in a higher net return.
BUT! In a wet year the premiums will also be much higher $5.46/ac compared to 1.43/ac. You must be certain that you can afford the premiums.
18

On average and over the long haul the number of intervals insured does not affect average net return per acre.However, next year is not a long‐term average it is a single year and by taking only 2 intervals you could pay a high premium because of a large rainfall event in one of the intervals that you selected even though you are in the middle of a drought, but by continuing the program every year this will not happen.
19

20

El Niño AKA El Niño Southern Oscillation (ENSO) or Oceanic Niño Index (ONI) affects rainfall. In years when a La Niña occurs, there tends to be warmer and drier conditions in many areas, including Texas. State climatologist John Nielsen‐Gammon says. “In general terms, a La Niña period means drier weather patterns for Texas. There are numerous studies on how El Niño and La Niña affect weather patterns, specifically hurricanes and their intensity. Some research indicates that the type of hurricanes that affect Texas are more common during La Niña periods than during a neutral or El Niño year.”
21

The Net Returns in this chart are the average net return across all years for a given ONI condition and all 11 intervals.
I defined El Niño years as having an average surface temperature +0.5 above normal and to be above +0.5 during at least a 6 months during the year. La Niña years were just the opposite. By this criteria during the past 64 years there have been 14 El Niño years, 14 La Niña years and 34 neutral years. As discussed in the previous slide, La Niña tends to produce drought conditions. Witness 2011, thus the La Niña years had net returns nearly 3 times as great as El Niño or Neutral years. And surprisingly, even though El Niño is supposed to result in above average rainfall there was no difference between El Niño and Neutral years.
Finally over the long‐term all ONI conditions produced a positive result, this reflects the subsidy on producer premiums.
22

This chart shows how net returns were distributed across the 11 intervals for grid 19619. It is different for each of the ONI conditions and you should consider distributing your insurance according to the historic variation in returns.
23

PRF would be the perfect insurance product if you could decide what intervals to insure at the end of the year instead of 2 months before the beginning of the year. Knowing that the ONI affects amounts and patterns of rainfall you have to use predictions of the ONI that come out in the middle of each month.
24
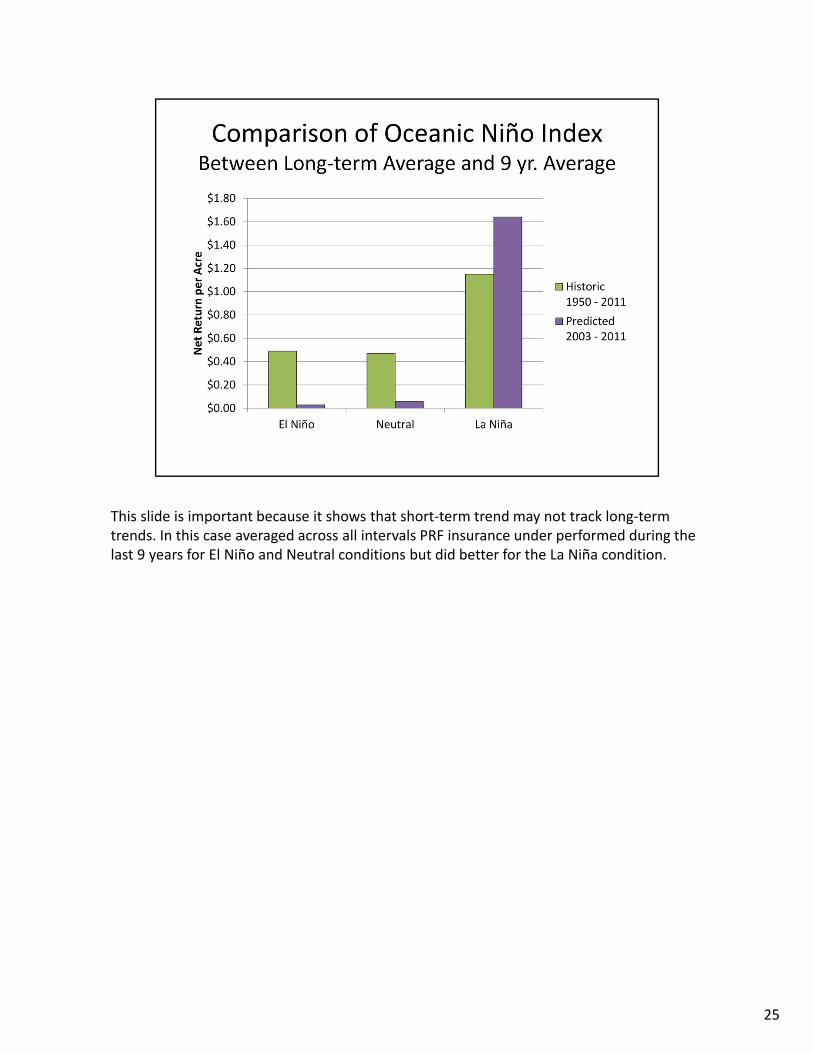
This slide is important because it shows that short‐term trend may not track long‐termtrends. In this case averaged across all intervals PRF insurance under performed during the last 9 years for El Niño and Neutral conditions but did better for the La Niña condition.
25

These recommendations are rather intuitive, but are based on:1. The fact that number of intervals insured did not appear to affect net return.2. Adjustments for intervals that will result in above average returns should not exceed
about 10 percentage units of an equal distribution of all acres.
29

30

31

32

The 9 year average means very little if in say 2004 you could not pay the premium and when bankrupt. A couple of things to notice on this slide.1. The only difference between the profit maximizer and the risk minimizer scenario 1 is
the size of the indemnities received and premiums paid. The profit maximizer all ways received larger indemnities and paid larger premiums because he used more of RMA’s money. But the pattern between the 2 is the same because they both distributed their acreage the same for the different scenarios.
2. Spreading his risk across all intervals never paid off for the risk minimizer in scenario 2.3. By distributing their acreage according to the suggested distribution for a predicted El
Niño condition the net return in the years when indemnities were received was nearly as high in the non‐La Niña years and in the La Niña years
33

34

35

36

There will be other predictions in mid‐September and mid‐October before the November 15 deadline.
37

These recommendations are rather intuitive, but are based on:1. The fact that number of intervals insured did not appear to affect net return.2. Adjustments for intervals that will result in above average returns should not exceed
about 10 percentage units of an equal distribution of all acres.
38

39