PASTORAL INDUSTRY OF CAPE YORK PENINSULA
330
CAPE YORK PENINSULA LAND USE STRATEGY (CYPLUS) Land Use Program PASTORAL INDUSTRY OF CAPE YORK PENINSULA R. Walker Landcare Management Services, Toowoomba 1995 CYPLUS is ii joint initiative of the Queensland and Commonwealth Governments
Transcript of PASTORAL INDUSTRY OF CAPE YORK PENINSULA
CAPE YORK PENINSULA LAND USE STRATEGY (CY PLUS)
Land Use Program
PASTORAL INDUSTRY OF
CAPE YORK PENINSULA
R. Walker
Landcare Management Services, Toowoomba 1995
CYPLUS is ii joint initiative of the Queensland and Commonwealth Governments

Reco~nlnended citation:
Walker, R. (1995). 'Pastoral Industry of Cape York Peninsula'. (Cape York Peninsula Land Use Strategy, Office of the Co-ordinator General of Queensland, Brisbane, Department of the Environment, Sport and Territories, Canberra and Landcare Management Services, Toowoomba.)
Note:
Due to the timing of publication, reports on other CYPLUS projects may not be fully cited in the BIBLIOGRAPHY section. However, they should be able to be located by author, agency or subject.
r ' ISBN 7242 6237 7
@ The State of Queensland and Commonwealth of Australia 1995.
Copyright protects this publication. Except for purposes permitted by the Copyright Act 1968, no part may be reproduced by any means without the prior written permission of the Office of the Co-ordinator General of Queensland and the Australian Government Publishing Service. Requests and inquiries concerning reproduction and rights should be addressed to:
Office of the Co-ordinator General, Government of Queensland PO Box 185 BRISBANE ALBERT STREET Q 4002
The Manager, Commonwealth Information Services GPO Box 84 CANBERRA ACT 2601

CAPE YORK PENINSULA LAND USE STRATEGY STAGE I
PREFACE TO PROJECT REPORTS
Cape York Peninsula Land Use Strategy (CYPLUS) is an initiative to provide a basis for public participation in planning for the ecologically sustainable development of Cape York Peninsula. It is jointly funded by the Queensland and Commonwealth Governments and is being carried out in three stages:
a Stage I - information gathering; a Stage I1 - development of principles, policies and processes; and a Stage I11 - implementation and review.
The project dealt with in this report is a part of Stage I of CYPLUS. The main components of Stage I of CYPLUS consist of two data collection programs, the development of a Geographic Information System (GIs) and the establishment of processes for public participation.
The data collection and collation work was conducted within two broad programs, the Natural Resources Analysis Program (NRAP) and the Land Use Program (LUP). The project reported on here forms part of one of these programs.
The objectives of NRAP were to collect and interpret base data on the natural resources of Cape York Peninsula to provide input to:
, r ' - a evaluation of the potential of those resources for a range of activities related to the
use and management of land in line with economic, environmental and social values; and
a formulation of the land use policies, principles and processes of CYPLUS.
Projects examining both physical and biological resources were included in NRAP together with Geographic Information System (GIs) projects. NRAP projects are listed in the following Table.
Bedrock geological data - digitising and integration (NR05)
Physical ResourceIGIS Projects
Airborne geophysical survey (NR15)
Biological Resource Projects
Coastal environment geoscience survey (NR14)
I
Mineral resource inventory (NR04)
Water resource investigation (groundwater) (NR16)
Regolith terrain mapping (NR12)
Vegetation mapping (NRO1)
Marine (seagrasslmangrove) distribution (NR06)
Insect fauna survey (NR17)
Fish fauna survey (NR10)
Terrestrial vertebrate fauna survey (NR03)
Wetland fauna survey (NR09)

Physical Resource/GIS Projects I Biological Resource Projects
Land resource inventory (NR02) Flora data and modelling (NR18)
Environmental region analysis (NRl1) Fauna distribution modelling (NR19)
CYPLUS data into NRIC database FINDAR Golden-shouldered parrot conservation (NR20) management (NR2 1)
Queensland GIs devglopment and maintenance (NR08)
* These projects are accumulating and storing all Stage I data that is submitted in GIs
compatible formats.
Research priorities for. the LUP were set through the public participation process with the objectives of:
collecting information on a wide range of social, cultural, economic and environmental issues relevant to Cape York Peninsula; and highlighting interactions between people, land (resource use) and nature sectors.
Projects were undertaken within these sector areas and are listed in the following Table.
- People Projects Land Projects Nature Projects 1
Population
Transport services and infrastructure
Values, needs and aspirations
Services and infrastructure
Economic assessment
Secondary and tertiary industries
Traditional activities
Current administrative structures
Current land use
Land tenure
Indigenous management of land and sea
Pastoral industry
Primary industries (non-pastoral, non-forestry)
Forest resources
Commercial and non commercial fisheries
Mineral resource potential and mining industry
Surface water resources
Fire
Feral and pest animals
weeds Land degradation and soil erosion
Conservation and natural heritage assessment
Conservation and National Park management
Tourism industry

CONTENTS
Acknowledgements
Executive Summary
Page
I SECTION A: PROJECT OUTLINE AND METHODOLOGY I 1 Introduction
1.1 Purpose of the Project 1.2 Terms of ~eference 1.3 CYPLUS Planning Process 1.4 Methodology
I SECTION B: CATTLE INDUSTRY OVERVIEW
2 Overview 2.1 Production Systems and Cattle Breeds 2.2 Climate and Pastures 2.3 Industry Structure 2.4 Livestock Transportation 2.5 On-Farm Marketing 2.6 Trends in the Beef Industry 2.7 Industry Strategies
SECTION C: TENURE AND LAND USE I 3 Land Tenure and Land Use
3.1 Current Regional Tenure Distribution 3.2 Aboriginal and Torres Strait Islander Tenure 3.3 National Park Tenure '
3.4 State Forests and Timber Reserves 3.5 Analysis 3.6 Current Pastoral Tenures and Conditions 3.7 Sizes of Pastoral Leases 3.8 Ownership of Leases 3.9 Improvements on Leases
Page
4 Land Use 4.1 Current Land Use 4.2 Pastoral Land Use
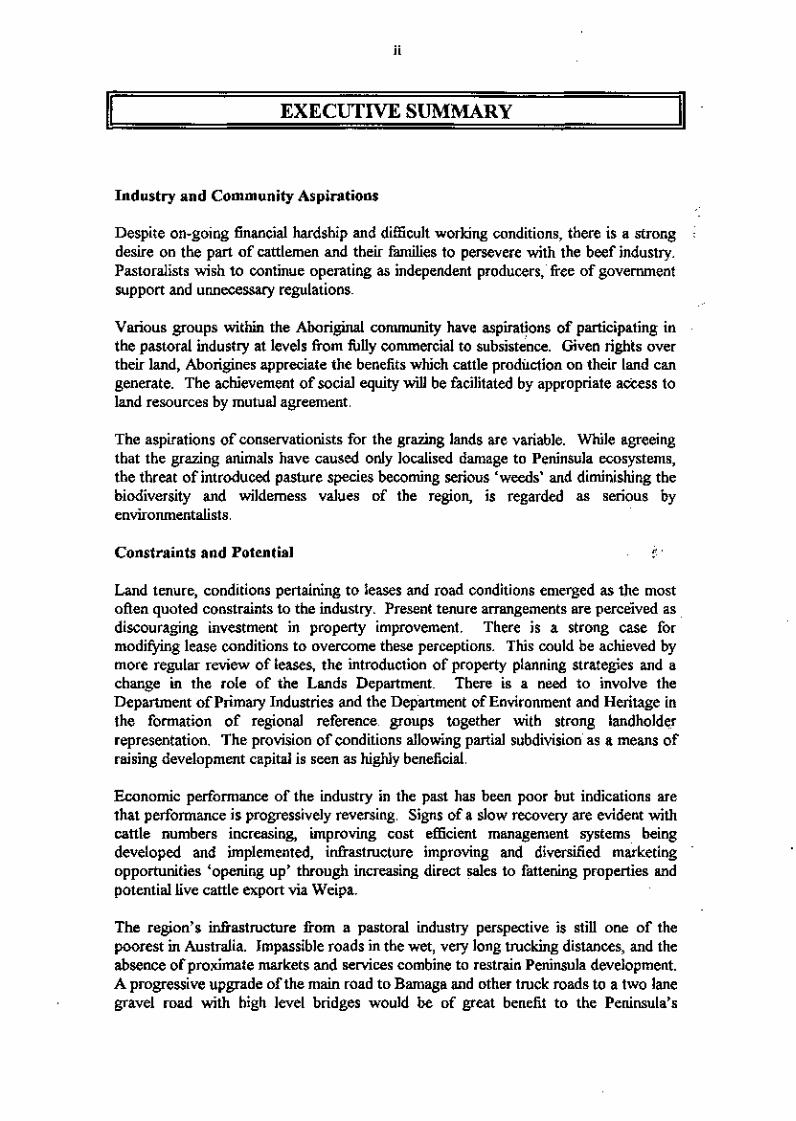
I SECTION D: DESCRIPTION OF THE CURRENT INDUSTRY 1; 5 Production Patterns 32
5.1 Past Production 32 5.2 Current Production 37 5.3 Production for Mareeba Saleyard Disposal 39 5.4 Production for Direct Sales 44
6 Management Systems and Technology 6.1 Climatic Factors 6.2 Management Practice 6.3 Operation and Management System Alternatives 6.4 Production Effects of Management Systems on Regional
Production 6.5 Production Effects of Management Systems on Property
Production Levels 6.6 Land Suitability and Alternative Management Systems 6.7 Implementation of Alternative Management Systems 6.8 Carrying Capacities 6.9 Constraints and Opportunities
7 Economic Performance 7.1 Regional Performance 7.2 Regional Economic Multipliers 7.3 Regional Economic Multiplier Effects 7.4 Economic Analysis of Existing Management Systems 7.5 Traditional Husbandry Management System 7.6 Improved Husbandry Management System 7.7 Pasture Systems 7.8 Economic Survivors of the Industry
8 Marketing 8.1 Present Marketing Arrangements and Prospects 8.2 Market Description 8.3 Marketing Constraints 8.4 Marketing Potential and Industry Background
9 Infrastructure 9.1 Roads and Transport 9.2 Licenced Abattoirs and Accredited Slaughter Houses and
Saleyards

I SECTION E: ISSUES AND ASPIRATIONS
Page
10 Pastoral Industry Issues and Aspirations 10.1 Consultation Process and Response 10.2 Current Industry Issues 10.3 Current Industry Attitudes 10.4 Future Industry Aspirations 10.5 Opportunities and Constraints
1 1 Non Pastoral Industry Issues and Aspirations 1 1.1 Consultation Process 1 1.2 Current Mon Pastoral Industry Issues 11.3 current Non Pastoral Attitudes and Aspirations 1 1.4 Opportunities and Constraints
SECTION F: ENVIRONMENTAL AND SOCIO-ECONOMIC IMPACT ANALYSIS
12 Environmental Analysis 12.1 Land Condition Analysis 12.2 Catchment Condition Analysis 12.3 Pastoral Use Impacts on Natural Resources 12.4 Pastoral Use Impacts on Biodiversity 12.5 Potential Impacts of Pastoralism 12.6 Mapping of Production and Conservation Land Units 12.7 The Precautionary Principle and the NRAP Maps
13 Socio-Economic Analysis 13.1 Socio-Economic Impacts 13.2 Social Justice and Equity of Resource Access 13.3 Animal Health Implications
SECTION G: PROPOSED MANAGEMENT GUIDELINES FOR THE PASTORAL INDUSTRY
14 Principles, Policy and Strategies 130
15 Property Management Planning 15.1 Government Role 15.2 Property Management Planning Process 15.3 Property Enterprise Agreements 15.4 Application to the Peninsi~la
16 Government Role

17 Tenure
18 Land Allocation Criteria 18.1 Land Suitability 18.2 Production and Sustainability 18.3 Future Technologies and Marketing Opportunities 18.4 Changing Land Use Patterns
19 Economic Efficiency of Alternative Land Uses and Possible Boundary Changes
20 Property Boundary Reconfiguration Criteria
2 1 Multiple Use,: Management and Access $48
22 Criteria Used for Setting of Carrying Capacities 15 1
23 Environmental Indicators for Monitoring the Condition of Pastoral Lands 15 1
BLBLIOGRAPHY 152
LIST OF MAPS - ATTACHMENT 1 , 5 '
Map 1: Map 2: Map 3 : Map 4: Map 5: Map 6: Map 7: Map 8: Map 9: Map 10: Map 11: Map 12:
Natural Carrying Capacity Potential Carrying Capacity Pastoral Tenures General Tenure Classifications Viability of Pastoral Holdings based on Existing Carrying Capacity Viability of Pastoral Holdings based on Potential Carrying Capacity Land UseDisturbance General Climatic Zones Suitability for Low Input Pastures Suitability for Medium Input Pastures Suitability for High Input Pastures Sizes of Pastoral Holdings
LIST OF FIGURES
Figure 1.1 : Figure 2.1 : Figure 2.2: Figure 2.3 : Figure 2.4: Figure 2.5: Figure 2.6 Figure 5.1 :
Task Interrelationships Cattle Numbers in Australia Beef and Veal Production Cattle on Feed in Australia Total Adult Cattle Slaughter Protein Consumption in Australia Beef and Veal Domestic Utilisation Production Trends (Aurukun, Torres and Cook Shires)

Page
Figure 5.2: Production Trends (Carpentaria Shire) 36 Figure 5.3 : Mareeba Saleyard Averages for February 1989 to June 1994 40 Figure 5.4: Cape York Peninsula Cattle Categories sold through the
Mareeba Saleyard from February 1989 to June 1994 4 1
LIST OF TABLES
Table 2.1 : Table 2.2
Table 3.1: Table 3.2: Table 3.3: Table 3.4: Table 3.5: Table 3.6: Table 4.1 : Table 5.1: Table 5.2:
Table 5.3: Table 5.4: Table 5.5 : Table 6.1 : Table 6.2: Table 6.3:
Table 6.4:
Table 6.5:
Table 6.6: Table 6.7: Table 6.8:
Table 6.9: Table 6.10: Table 7.1 :
Table 7.2: Table 7.3 : Table 7.4: Table 7.5: Table 7.6: Table 7.7:
Livestock movements by origin and destination 12 Livestock movements by cominercial livestock transporters and primary producers 12 Land tenures and areas (km2) 20 Aboriginal communities and census counts 22 Pastoral leases for Cape York 23 Lease size and distribution 2 5 Lease ownership 26 Value of improvements 27 Major land uses 28 Total meat cattle numbers in Cook, Aurukun and Torres Shires 32 Aurukun, Torres and Cook Shires, meat cattle numbers, sales and . deaths 3 3 Carpentaria Shire, meat cattle numbers, sales and deaths 3 4 Meat cattle averages in Cook Shire at 3 1 March 1993 '38 r ' Direct sales 44 Management system comparison 49 The native pasture communities found in each zone 50 Advantages and disadvantages of high, medium and low input pastures 50 Carrying capacity and weight gains of steers for native and sown pasture in each zone 5 1 Estimated herd structure in Cook, Aurukun and Torres Shires in 1993 52' Estimated herd structure and increased returns 5 2 Estimated herd structure and increased returns 53 A comparison of the results of traditional management and improved management in Cape York herds 5 4 Carrying capacity for native and sown pastures 5 7 Potential cattle numbers 5 7 Estimates of Gross Regional Product at factor cost of the Cape York region, which consists of the Shires of Aurukun, Cook and Torres 6 0 Disaggregated value added multipliers far north: animal sector 63 Disaggregated output multipliers far north: animal sector 63 Disaggregated income multipliers far north: animal sector 64 Disaggregated employment multipliers far north: animal sector 6 5 Comparative economics of three production systems 67 Selling costs and farm gate returdhead 6 8

Page
Table 7.8 : Table 7.9: Table 7.10: Table 7.1 1 : Table 7.12: Table 7.13 : Table 7.14: Table 7.15: Table 7.16: Table 8.1 :
Table 8.2: Table 8.3: Table 8.4: Table 10.1': Table 11.1: Table 11.2: Table 11.3: Table 18.1 :
Gross margins - traditional husbandry Cattle enterprise costs Improved husbandry systems Management systems and operations Comparison of systems of pasture establishment Typical annual production costs ($/head) Comparisons between sown pasture systems Comparisons between sown pasture systems Summary of development costs and cash flow Turnoff/marketing of Cape York Peninsula cattle for past year (1 993) Cattle freight costs per tnlcWkln Cattle: transport costs Live cattle costs and returns Opportunities and constraints - pastoral industry perceptions Current non pastoral industry issues Community attitudes and issues Opportunities and constraints - non pastoral industry perceptions Condition trends in native pastures
APPENDICES TO PASTORAL INDUSTRY REPORT 9 5 '

ACKNOWLEDGEMENTS I The authors of this report wish to acknowledge and thank a number of organisations and individuals who assisted in the report's preparation. In particular, the following have assisted in supplying information as expediously as possible:
CYPLUS Taskforce - particularly John Lane, Mark Horstmann and Keny Trapnell. Department of Primary Industries, particularly John Boorman, local stock inspectors, Andrew Biggs and the drafting section. Department of Lands, particularly Graham McColm and Gary Cotter. Department of Environment and Heritage, particularly Peter Stanton.
In regard to other organisations and individuals that assisted with the report's consultations, input . from . the following organisations greatly assisted in the development of the final report: - >,-.
Cape York Peninsula Pastoral Advisory Group (CYPPAG), particularly Bob Wincen's efforts Cairns and Far North Environmental Centre (CAFNEC), particularly Jim Downey's efforts Cape York Land Council (CYLC), particularly Joan Staples' efforts Cape York Peninsula Development Association (CYPDA) the 30 graziers who responded to our questionnaire the Peninsula families who attended the Musgrave meeting 5
the case study property owners for their time.
Of particular mention, I would like to thank John Lane and John Boorman for their constructive inputs during all stages of the project.
The compilation of the report was a team effort from all consultants involved in the project team. Significant input into the writing of the draft stages of this report were received from Brian Roberts, Jock Douglas, Peter McKeague and Peter Leis. The final compilation was completed by Bob Walker. The final report is an honest, objective assessment of the pastoral industry in Cape York Peninsula based on information reviewed and information communicated to us. Some differences of opinion exist within the project team on individual items, however, the team is supportive of most of the central themes developed in the report.
Finally, sincere thanks are extended to Valerie Eldershaw and Marie Schulz for their .
editorial and typing efforts.
BOB WALKER LANDCARE MANAGEMENT SERVICES 25 May 1995

I EXECUTIVE SUMMARY I
Industry and Community Aspirations
Despite on-going financial hardship and difficult working conditions, there is a strong :
desire on the part of cattlemen and their families to persevere with the beef industry. Pastoralists wish to continue operating as independent producers, free of government support and unnecessary regulations.
Various groups within the Aboriginal community have aspirations of participating in the pastoral industry at levels fiom fully commercial to subsistence. Given rights over their land, Aborigines appreciate the benefits which cattle production on their land can generate. The achievement of social equity will be facilitated by appropriate adcess to land resources by mutual agreement.
The aspirations of conservationists for the grazing lands are variable. While agreeing that the grazing animals have caused only localised damage to Peninsula ecosystems, the threat of introduced pasture species becoming serious 'weeds' and diminishing the biodiversity and wilderness values of the region, is regarded as serious by environmentalists.
Constraints and Potential . C'
Land tenure, conditions pertaining to leases and road conditions emerged as the most often quoted constraints to the industry. Present tenure arrangements are perceived as discouraging investment in property improvement. There is a strong case for modifjing lease conditions to overcome these perceptions. This could be achieved by more regular review of leases, the introduction of property planning strategies and a change in the role of the Lands Department. There is a need to involve the Department of Primary Industries and the Department of Environment and Heritage in the formation of regional reference, groups together with strong landholder representation. The provision of conditions allowing partial subdivision as a means of raising development capital is seen as highly beneficial.
Economic performance of the industry in the past has been poor but indications are that performance is progressively reversing. Signs of a slow recovery are evident with cattle numbers increasing, improving cost efficient management systems being developed and implemented, infiastructure improving and diversified marketing opportunities 'opening up' through increasing direct sales to fattening properties and potential live cattle export via Weipa.
The region's infrastructure fiom a pastoral industry perspective is still one of the poorest in Australia. Impassible roads in the wet, very long trucking distances, and the absence of proximate markets and services combine to restrain Peninsula development. A progressive upgrade of the main road to Barnaga and other truck roads to a two lane gravel road with high level bridges would be of great benefit to the Peninsula's

iii
industry. For the pastoral industry, these improvements would result in significantly extending the length of time available to cattle producers for cattle movement. Bringing the long-heralded export harbour at Weipa to hition would benefit most sectors of the Peninsula community through the multiplier effect. Funding options and priority setting for the improvement of these infrastructure requirements need to be assessed and implementation could include negotiations between government and 'user' industry organisations. Benefit-cost analysis for all 'user' industries would be a '. usefbl starting point for negotiations on capital funding and financial viability :
assessment of infkastructure investment.
A range of production systems of varying intensity and costhenefit are available to Peninsula producers. Investment and risk increase with intensification but careful selection of site quality could increase the success rate and return on capital invested in higher-input systems. Overall success of beef enterprises is dependent also on 'animal management proficiency and access to higher quality grazing land. There is no shortage of technological solutions to production problems but economic technology transfer to a greater proportion of producers requires more attention.
Economic Performance Possibilities
The financial success of beef enterprises to date, has been limited by poor nutrition, high transport costs, inefficient animal management, low cattle prices and a shortage of developmental capital. Most of these constraints can be overcome by improved export, transport facilities and management systems. It is, however, essential that the total Peninsula herd size remains above the industry viability threshold if infrastruhre and its benefits are to materialise. Continued excision of grazing land fkom pastoral uses will result in an industry too small to justifjl improved transport and export infrastructure. The future contribution of Aboriginal land and National Parks to total carrying capacity will be crucial to maintaining 'critical mass' in the industry.
The benefits of the reliable seasonal rainfall of the region can be maximised by improvements in marketing and management up to a level dictated by land capability. The expansion of fattening properties and small farms for finishing animals in the Cooktown area warrants serious consideration.
Improved animal husbandry techniques can sigruticantly increase productivity both at low cost and in the short term. The time-lag in gaining a return on capital invested in intensive systems may require special financing.
Cultural Impacts
The future well-being of Aborigines in the Peninsula will be partially dependent on their level of participation in commercial pastoralism. That community's -long experience as practical stockmen needs to be developed and expanded by the provision . of management training and operational decision-making training.
The culture, traditions and heritage of four generations of Peninsula cattlemen needs to be preserved as an element of the regional social fabric. By respecting complementary
cultures with diverse origins, a united h r e which preserves the richness of both backgrounds may be achieved.
Environmental Impacts
Past surveys point to localised environmental effects of the pastoral industry on Peninsula landscapes. With the exception of narrow riverine environments and very '. limited clearing, the vegetation and soils are overall in relatively good condition. This fortunate situation probably results from the natural limitations on animal numbers on grazing leases. However, industry of the past cannot be extrapolated to a similarly sustainable intensified future industry. There is every indication that widespread adoption of higher-input systems will require significantly more environmentally- sensitive management, if the condition of much of the Peninsula is to be preserved. The preferred development option of introducing improved cattle husbandry technologies developed around a mosaic of pasture paddocks for cattle control, would be less likely to cause environmental damage.
With the exception of the effects of cattle near permanent waters, the causal links between the industry and landscape condition are not well documented. The report urges caution in the optimistic interpretation of the CYPLUS Natural Resources Analysis Program (NRAP) land suitability and potential cropping maps.
Timber clearing requires especially good information before it is deemed appropriate. Tree clearing guidelines, responsive to regional constraints, could provide this information. - r '
The application of ESD principles is achievable, if the criteria for sound grazing management as set out in the report are adhered to, irrespective of land ownership by particular groups.
Principles and Guidelines for a Proposed Land Use Strategy
The encouragement of good land management is largely dependent on tenure and the serious implementation of lease conditions. Land. management through Property Management Planning could be the key to a permanent beef industry.
The reconfiguration of land portion boundaries warrants serious consideration as a major factor in achieving equitable and efficient resource use. Boundary changes are of particular relevance to National Parks, many of which bear no resemblance to the patterns of the ecosystems they were set up to protect. The excision of quality grazing land from many parks would facilitate the management of both Parks and adjacent
.
grazing leases. While the squared survey pattern which ignores physical boundaries is unnatural, enlightened access agreements between various land users can allow full and appropriate resource use, if approached in a spirit of cooperation and unity of purpose. -
Without a planned subdivision/amalgarnation program, the present serious economic problems confronting grazing leases cannot be easily overcome. While the holding of multiple leases by one lessee alleviates the situation, clearly the majority of Peninsula leases are economically unviable at their present size and at their present level of

management. Changing management strategies are progressively reversing this situation and alternative management approaches should be integrated into subdivision/amalgamation programs.
Accessibility guidelines can provide a workable firamework for co-management and multiple use strategies. Serious consideration must be given to mutually beneficial access agreements. Complementary systems of sharing resources and responsibilities -,
hold great promise as a basis for a harmonious land use strategy.
Recreation and tourism should be encouraged on grazing leases for the financial benefit of producers. Landholders can be remunerated for custodial stewardship duties in preserving conservation or cultural sites on their leases. In this context, it is considered that the present boundaries and extent of the National Parks network be reviewed as an issue for Stage 2 of the CYPLUS process. Two serious shortcomings of the present Parks estate require attention: (a) the present inclusion of vast areas in Parks which are of no particular biodiversity significance, and (b) the present absence from Parks of representative samples of a number of major plant communities and habitats. The configuration of the present Parks network, composed of inappropriate whole lease blocks, limits the achievement of conservation and pastoral objectives.
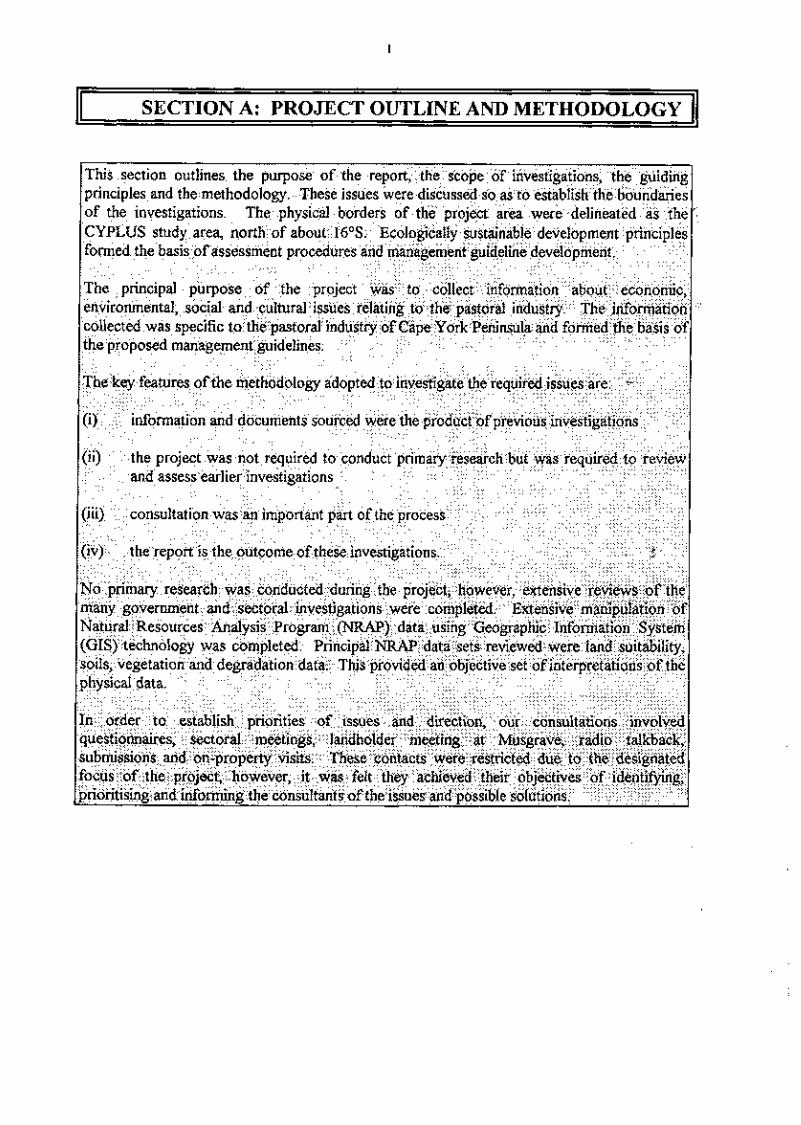
11 SECTION A: PROJECT OUTLINE AND METHODOLOGY 11

1 INTRODUCTION
1.1 Purpose of the Project
This report presents an overview of the pastoral industry of Cape York Peninsula in terms of its economic, environmental and social conditions. Landcare Management Services was awarded the project in June 1994.
The work undertaken for the project interpreted information from CYPLUS Natural Resource Assessment Program (NRAP) projects, previous related research investigations and community consultations. Field trips undertaken were not designed to collect new information, but were intended to address community consultation obligations and to assess preliminary findings. Consequently, this project report relies heavily on previous studies and regional community opinion.
The structure of the report developed around the requirements of the briefc. These requirements are listed in Section 1.2 of the report and subsequently form the basis for issue identification. Sectional strategic issues discussed in detail in the report include:
aspirations for the pastoral industry tenure and land use economic performance and potential marketing arrangements infrastructure support production patterns management systems and technology land condition environmental impact socio-economic impact.
Analysis of these topics form the basis for the project findings and conclusions.
1.2 Terms of Reference
Planning for Cape York under CYPLUS is a large regional exercise. Input information and data are supplied at a regional scale (usually 1:250,000 or broader). Subsequently, planning for the pastoral industry is at a regional strategic level. Some case study investigations have been completed at a more detailed scale, however, the overall focus is at the regional level.
CYPLUS has set terms of reference that require investigation of the economic, tenure and environmental aspects of the pastoral industry in Cape York. These terms require a rGew to - be completed at a strategic level for the whole of Cape York Peninsula. The terms of reference are divided into three sections, namely economic, tenure and enviionmental. Details of these terms are:
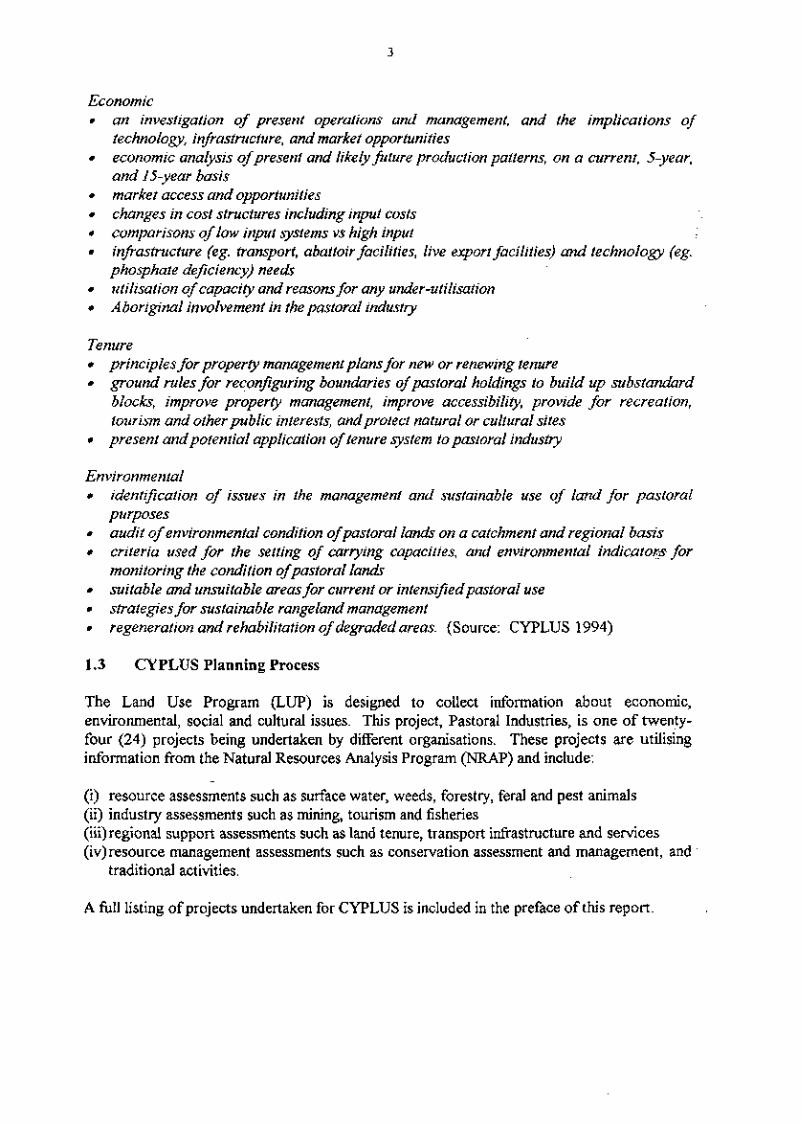
Economic an investigation of present operations and management, and the implications of technology, in$-astructure, and market opportunities economic analysis of present and likely fiture production patterns, on a current, 5-year, and 1 5-year basis market access and opportunities changes in cost structures including input costs comparisons of low input systems vs high input infrastructure (eg. transport, abattoir facilities, live export facilities) and technology (eg. phosphate deficiency) nee& zrtilisation of capacity and reasons for any under-utilisation Aboriginal involvement in the pastoral industry
Tenure principles for property management plans for new or renewing tenure ground rules for reconfiguring boundaries of pastoral holdings to build up substandard blocks, improve property management, improve accessibility, provide for recreation, tourism and other public interests, and protect natural or cultural sites present andpotential application of tenure system to pastoral industry
Environmental identlfication of issues in the management and sustainable use of land for pastoral purposes audit of environmental condition of pastoral Ian& on a catchment and regional basis criteria used for the setting of carrying capacities, and environmental indicczto<gr. for monitoring the condition of pastoral l a d suitable and unsuitable areas for current or intenszfiedpastoral use strategies for sustainable rangeland management regeneration and rehabilitation of degraded areas. (Source: CYPLUS 1 994)
1.3 CYPLUS Planning Process
The Land Use Program (LUP) is designed to collect information about economic, environmental, social and cultural issues. This project, Pastoral Industries, is one of twenty- four (24) projects being undertaken by different organisations. These projects are utilising information fiom the Natural Resources Analysis Program (NRAP) and include:
- (i) resource assessments such as surface water, weeds, forestry, feral and pest animals (ii) industry assessments such as mining, tourism and fisheries (iii)regional support assessments such as land tenure, transport infrastructure and services (iv)resource management assessments such as conservation assessment and management, and
traditional activities.
A full listing of projects undertaken for CYPLUS is included in the preface of this report.
A review of CYPLUS projects quickly highlights that this pastoral industries project is one cog in the workings of a dynamic region. Findings emanating from this project will be weighed against findings and conciusions of the many other projects. A measure of the success of this and the other projects' findings will be gauged by their compliance with ecologically sustainable development (ESD) principles and benchmarks.
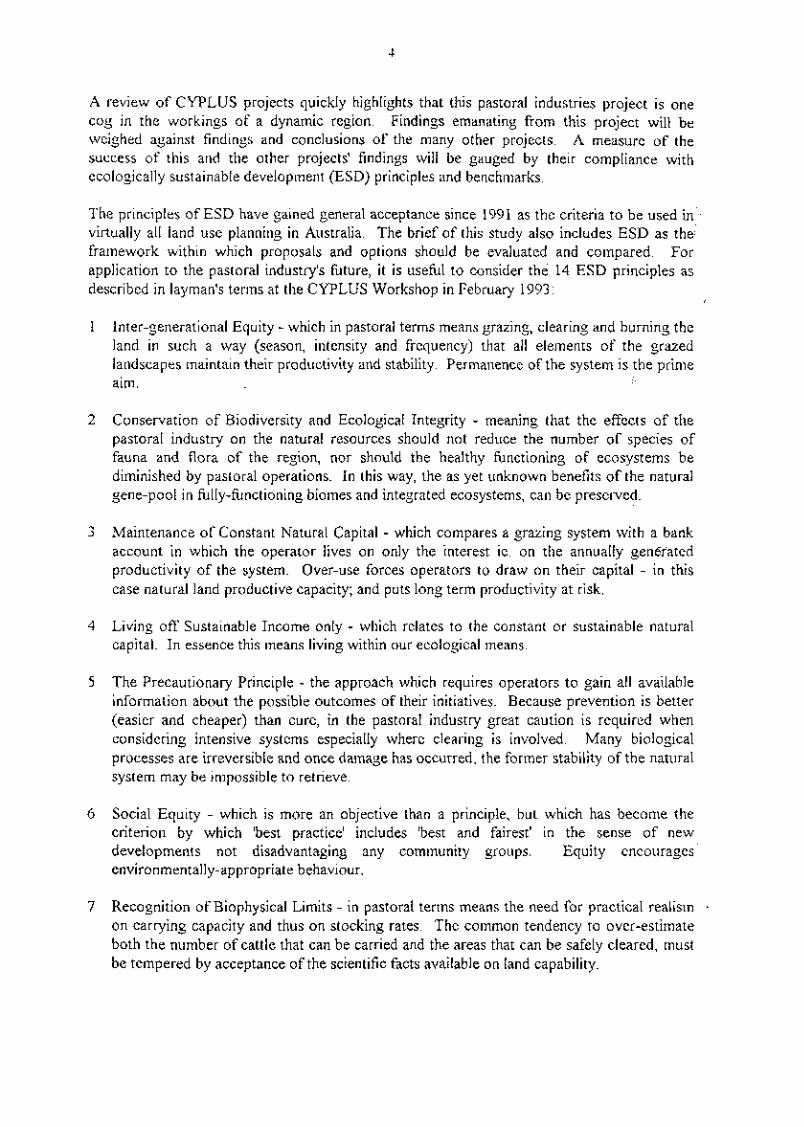
The principles of ESD have gained general acceptance since 1991 as the criteria to be used in virtually all land use planning in Australia. The brief of this study also includes ESD as the: framework within which proposals and options should be evaluated and compared. For application to the pastoral industry's future, it is useful to consider the 14 ESD principles as described in layman's terms at the CYPLUS Workshop in February 1993:
1 Inter-generational Equity - which in pastoral terms means grazing, clearing and burning the land in such a way (season, intensity and frequency) that all elements of the grazed landscapes maintain their productivity and stability. Permanence of the system is the prime aim. :,-.
2 Conservation of Biodiversity and Ecological Integrity - meaning that the effects of the pastoral industry on the natural resources should not reduce the number of species of fauna and flora of the region, nor should the healthy fbnctioning of ecosystems be diminished by pastoral operations. In this way, the as yet unknown benefits of the natural gene-pool in fblly-functioning biomes and integrated ecosystems, can be preserved.
3 Maintenance of Constant Natural Capital - which compares a grazing system with a bank account in which the operator lives on only the interest ie. on the annually generated productivity of the system. Over-use forces operators to draw on their capital - in this case natural land productive capacity; and puts long term productivity at risk.
4 Living off Sustainable Income only - which relates to the constant or sustainable natural capital. In essence this means living within our ecological means.
5 The Precautionary Principle - the approach which requires operators to gain all available information about the possible outcomes of their initiatives. Because prevention is better (easier and cheaper) than cure, in the pastoral industry great caution is required when considering intensive systems especially where clearing is involved. Many biological processes are irreversible and once damage has occurred, the former stability of the natural system may be impossible to retrieve.
6 Social Equity - which is more an objective than a principle, but which has become the criterion by which 'best practice' includes 'best and fairest' in the sense of new developments not disadvantaging any community groups. Equity encourages. environmentally-appropriate behaviour.
7 Recognition of Biophysical Limits - in pastoral terms means the need for practical realism - on carrying capacity and thus on stocking rates. The common tendency to over-estimate both the number of cattle that can be carried and the areas that can be safely cleared, must be tempered by acceptance of the scientific facts available on land capability.

8 Encouragement of Qualitative Development - meaning that our past quest for higher production and economic growth, now needs to be at least partially replaced by an appreciation of quality of life and a move toward environmental quality. In essence this is a challenge to the basic community values of the materialistic society.
9 Implementation of Full Costing of Natural Resources - referring to the past approach which regarded resources as 'free goods' (soil, water, clean air) and calling now for: environmental accounting which requires ecologically-realistic values and prices to be puc on these resources. In a monetary society, wastage and proper use are best controlled by appropriate costing mechanisms.
10 Striving for Efficiency of Resource Use - an objective which is linked to the previous " concept of costing. Efficiency can be encouraged by policies which reward environmental efficiency and minimal waste.
11 Creation of a Global Perspective - meaning that our actions should reflect our awareness of being part of a world-wide community which ultimately will stand or fall together, as population, resources and pollution affect our survival. The "Lucky Country" must shoulder special responsibilities proportional to its good fortune.
12 Ensuring Resilience in Land Use Systems - on a regional basis this implies having a diverse economy, not relying on only one sector. Production systems themselves are resilient when they can easily regain equilibrium after suffering stress (flood, drought, *cyclone). They also have the capacity to adapt to changes in the physical and economic environment.
. r. '
13 Maintaining External Economic Balance - which refers to our balance of payments, and implies that we should never reach national debt levels which cause us to draw on our environmental capital.
14 Maximising Community Participation - a fundamental principle which develops 'ownership' by the people of sound development plans to which a wide range of individuals have contributed knowledge and experience. Consultation and participation greatly enhance the acceptance of environmental policy and develop peer pressure to improve standards of planning aimed at both equity and eficiency.
1.4 Methodology <
Approach to Investigation
Methodology involved the completion of the following tasks:
(i) review documentation, practice and roles of pastoral industry in Cape York Peninsula (ii) preliminary analysis of strategic issue areas
economic performance marketing and technology Aboriginal involvement land condition and indicators land tenure infrastructure

rangeland management national parks and conservation areas
($identify physical impacts of pastoral industries in Cape York Peninsula (iv)final analysis of strategic issue areas (v) propose management guidelines for the regional and catchment development of the
pastoral industry in Cape York Peninsula.
At various stages throughout the project, structured consultation sessions with industry,: sectoral and community representatives were conducted to validate findings and to obtain informed opinion on interim strategies. A representation of these is presented as Figure 1.1.
The methodology adopted utilised information sources from individuals or organisations that expressed an interest in planning the fiture direction of the pastoral industry in Cape York Peninsula. Data relating to environmental and cultural aspects of the pastoral industry were considered along with production and economic data, in accordance with the brief. Data relating to wider community issues were considered as they became available. Th'ese wider data sources were not required to be collated by this project, however, as they became available (eg. CYPLUS projects) relevant information was integrated into this project. Attached to this report is a list of appendices that are referred to at different sections of the report.
Information Sources
A comprehensive listing of main reports reviewed and NRAP data interrogated is attached as the bibliography at the back of this report. A wider review of our working bibliograpyl'was also completed. These sources were reviewed and interrogated for their relevance to the pastoral industry.
As the project developed, inputs from other LUP projects assisted in strategy development. Of particular interest, inputs from the following projects were sourced:
values, needs and aspirations tenure survey land degradation current land use surface water resources land resource survey vegetation mapping land suitability mapping (DPI) Lands Department mapping groundwater resource salinity transport land tenure.
Many of these reports have attached GIs layers of information and where appropriate, this digital information was transferred and analysed.

Consultation Process
The methodology adopted a multi-disciplinary approach to consultation. Contact throughout the project was made with:
Peninsula pastoralists via Musgrave meeting, property visits, questionnaires and telephone. Stakeholder bodies via two meetings, one conference (CAFNEC, CYLC, Aboriginal Co- '. ordinating Council (ACC), CYPPAG, and the Cook Shire Council (CSC)). Government agencies - Department of Primary Industries (DPI), Department of Environment and Heritage (DEH), Australian Heritage Commission, Lands, Department of Housing Local Government and Planning @HLG&P). CYPLUS land working group (two meetings). CYPLUS Taskforce - regular updates. Other LUP project team members.
These contacts were instrumental in identifling issues, improving regional awareness, validating strategies and developing wider understanding.

Figurel. 1 Task

I SECTION B: CATTLE INDUSTRY OVERVIEW 1
2 OVERVIEW
The size of the Australian beef herd in 1994 was approximately 24.6 million. Annual beef cattle production to 30 June 1994, measured in terms of livestock slaughterings, was estirhated at 7,289,300 adult cattle and 991,000 calves. This represents an average turnoff percentage of 33% for the Australian herd. These cattle are usually produced in mixed farming and grazing enterprises to the south and generally single commodity enterprises over large areas of land in northern Australia. This section of the report will provide an overview of the Australian cattle industry, with an emphasis on the northern Australian industry. Reference to the Cape York Peninsula industry, as part of the national industry, will be made when appropriate.
2.1 Production Systems and Cattle Breeds
Production systems adopted in the Australian beef industry depend on regional seasonal conditions. The climate of southern Australia is generally similar to Europe and subsequently these areas support EuropeanlBritish pastures and EuropeanlBritish cattle breeds and their crosses.
The development of production systems for northern Australia has been a learning exercise due to the substantial differences in climate, soils and socio-economic development rates. The . animals initially introduced were British breeds. These breeds were not suited to the hot and humid climates of the north. They needed to develop the capacity to reproduce and grow under conditions where water was scarce and feed was of poor quality. Ticks created . problems due to their debilitating effect on the animals but also for their ability to spread disease. In response to these constraints, Bus indicus breed cattle have been introduced to northern Australia. Approximately 75% of northern cattle carry at least 318 Bos indicus blood. Bos indicus breed cattle exhibit attributes vital to the northern Australian cattle industry, namely:

tolerant of hot conditions permitting them to graze for longer periods of the day requirement for energy and protein to maintain body weight is lower than that for a European breed of similar size increased immunity to cattle tick breeding habits where the breeder normally becomes pregnant only if her body weight is reasonably high and the chances of surviving pregnancy are improved. ability to walk longer distances and digest higher fibre roughage.
Increased productivity resulting from hybrid vigour crosses is the focus for continued attention in the northern Australian industry. In an attempt to sustain productivity gain, current research is investigating the impacts of introducing Belmont Red, Boran and Tuli cattle from other countries to local areas to recapture hybrid vigour. Breeding strategies to improve the - '
northern herd are relevant to the Peninsula's industry as they will improve the genetic base for the industry.
2.2 Climate and Pastures
The supply and nutritional value of pastures in northern areas differ from those in southern areas. Fundamentally, the climatic features of sunshine, temperature and rainfall determine pasture distribution and yield. Rainfall is the most important climatic influence. Light and temperature constraints are only severely restrictive in limited geographical areas where extremes exist.
A broad dissection of Australia's rainfall distribution divides the country into: r , , -
(i) a summer rain zone supporting tropical pasture species. This extends from about 12"s to about 30°S, representing an area from close to the Queensland-New South Wales border north
(ii) an area south of the Queensland-New South Wales border that experiences general rainfall in all seasons, supporting temperate pasture production
(iii) an area hrther south supporting mediterranean patterns with rainfall in the colder months.
Pastures of southern Australia comprise some native grasses and legumes, however, much of the productive pastures rely on introduced species from the temperate and mediterranean regions of Europe.- Pasture growth commences with autumn rains (MarchfApril) following dry summers, slows in colder months and accelerates in spring until the plant matures and dies back during summer. Grazing management maintains a l e e vegetative growth for as long as possible. These vegetative stages of grasses and clovers are of high nutritional value (more than 75% digestible) and even at maturity they are 50% digestible and have a protein content . of 10%.
The situation in northern areas is different where large areas of natural pasture still prevail. . Australian Beef (1993) notes that:
'It was many years before the inherent limitations to animal production imposed by natural pastures on infertile northern soils were filly appreciated ... Pasture development in northern Australia has depended on species collected in the wild during the past 50 years ... The

technology required to maintain an adequate balance of legumes and grasses in a pasture under relatively uncontrolled grazing needs fbrther development.'
Pasture development in northern Australia does not have the world historical research background of temperate pastures, however, it does have a long local research background. CSIRO's Tropical Pastures Division and DPI have researched the potential role of tropical pastures and legumes for the northern Australian cattle industry. This research has assisted .. with the development of the northern cattle industry and has generated considerable local. benefits. Locally, an export seed industry is now established in north Queensland.
This research experience shows that tropical grasses have a capacity to mature and set seed rapidly to survive. This growth pattern, in combination with high temperatures, produces :-.
plants with a high fibre content. Digestibility of these tropical grasses reach 65% during vegetative growth, but more often 40% to 50%. Protein and mineral levels are adequate for animal production for short periods, but more typically, levels are inadequate in the quickly developing plants. Areas of inherent low fertility produce pasture unable to meet the protein needs of the animal. Cape York Peninsula, as one zone of the northern Australian beef industry, is typical of tropical pastures in its relatively low nutrient value.
2.3 Industry Structure
'The Australian beef industry is truly national in character' (Australian Beef 1993). Key industry statistics are:
(i) 45,000 establishments involved in beef production from weaners to finished stcrck, jn all States and the Northern Territory
(ii) 121 major processing works throughout Australia, 63 export and 58 domestic. Domestic facilities are located mainly in major regional centres and meat is transported to wholesalers or retailers in refrigerated trucks
(iii)40% of total beef production is consumed on the domestic market, through the wholesalelretail sectors
(iv)60% of total beef production is handled by the export sector. These markets have strict production, storage, handling and transportation requirements. The world average export percentage is <lo%, New Zealand being the only country that exports a higher percentage (75%)
(v) the average annual world production of beef and veal between 1987-1990 is estimated at 48.3 million tomes. This constituted 29% of the world's total meat production. (Pork, constituted 40%, Poultry 23% and SheepIGoats 5%). Australia accounts for around 3% of world beef and veal production (US Department of Agriculture 1992) but is second only to the EEC in terms of total export volume. Australia and the European Community . combined produced 45% of the world exported beef and veal.

2.4 Livestock Transportation
Livestock are moved between farms, saleyards, abattoirs and ports. Table 2.1 summarises these movements nation-wide.
Table 2.1. Livestock movements by origin and destination
Destination Farm (%) Origin Saleyard (%) Total (%)
Farm Saleyard Abattoir Live Export
1 TOTAL 63 37 100 (Source: Australian Livestock Transporters Association 1993)
Many of these movements involve small numbers of stock and are undertaken in farmers' trucks. Livestock transporters dominate the movement of stock fiom local saleyards to abattoirs and ports.
The movement of livestock is an integral part of the Australian industry. Commercial transporters are constantly improving their operations so that bruising and stress to livestock are minimised and cattle are delivered efficiently and safely. Professional livestock transporters are responsible for carrying about 65% of livestock around Australia. More Queensland and New South Wales cattle are carried much longer distances than other States, constituting 24% and 26% respectively of the national total. Table 2.2 details livestock movements.
Table 2.2. Livestock movements by commercial livestock transporters and primary producers
New South Wales 709 315 1,025~ 69 Victoria 422 165 586 72 Queensland 599 345 944 63 South Australia 152 146 298 5 1 Western Australia 394 161 556 7 1 Tasmania 25 19 44 57 Northern Territory 226 212 43 8 52 ACT 5 55 60 8 Australia 2,530 1,364 3,894 65 (Source: Australian Livestock Transporters Association 1993) ' million tonnes/kilometre

Livestock are moved by approximately 2,500 full time livestock transporting companies operating about 6,000 vehicles and constituting around 5% of the Australian road transport task.
With respect to ongoing economics of the industry, the following features expressed by the Australian Livestock Transporters Association have significant impact, namely:
'The economics of livestock transporting are very much affected by the fact that loading is generally only available one way. As a result livestock transporters are on average, loaded for 44% of the distance (allowing for empty running to reposition vehicles) compared to a load factor of 87% for typical road transport businesses.
The condition of rural roadr also has a big impact on livestock traiisporters. Roa& in poor condition (which are all too common in rural areas) increase operating costs through greater fuel consumption, more wear, greater tyre wear and slower speeds which in outbqck areas can average as low as 15 to 20 kmh on unformed roads. .'
These features are of particular significance to Peninsula cattle producers. The huge one- way distances travelled over poor quality roads is a major constraint which substantially affects the economics of the Peninsula's industry.
2.5 On-Farm Marketing
Livestock selling systems vary with geographic location. In southern areas, the saleyard js the main selling centre and cattle do not have to travel far to processing works. In the Aorth, cattle are transported long distances either for finishing on improved pasture or in feedlots or for processing. In the past, Cape York Peninsula cattle were trucked to Mareeba for sale and subsequent processing. Cattle sold in these circumstances result in the cattle producer being a price taker, with inflexible marketing options. This predicament is especially typical of the situation for remote cattle producers. Some changes to the marketing of 'remote area' cattle are alleviating this situation with increasing numbers being traded by direct sales or by electronic marketing (Computer Aided Livestock Marketing). This situation is presently developing in the Peninsula.
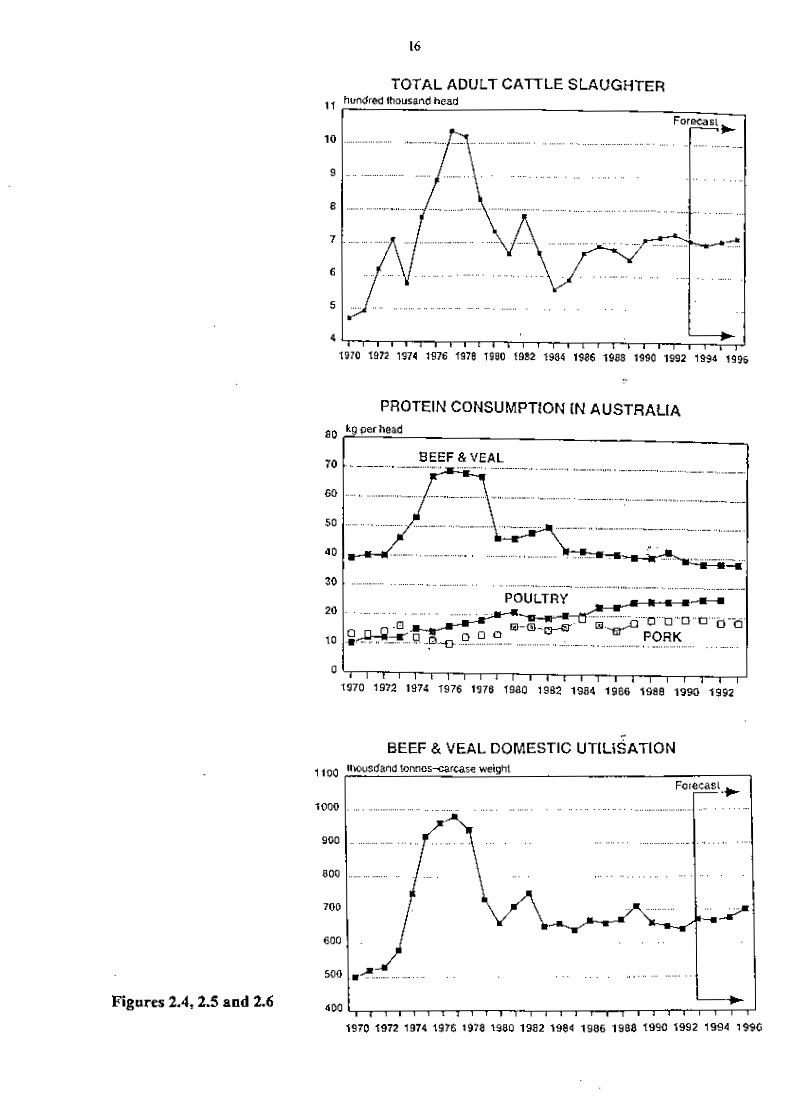
2.6 Trends in the Beef Industry -
Figures 2.1-2.3 reflect trends in cattle numbers and production in Australia since 1970. Figures 2.4-2.6 show slaughter and consumption trends.
Major developments that influenced production levels during this period were:
(i) Australia's exports to US soared in response to service high demand in the early 70s. Numbers peaked at 33 million in 1976
(ii) late seventies saw a closure of key markets and rising freight rates due to the oil crisis resulting in dramatic reduction in numbers
(iii) late seventies saw production tiom southern areas decline and northern areas increase

(iv)early eighties showed steady buildup of cattle numbers due to an improving Japanese market and improving seasonal conditions
(v) late eighties to the present saw growth in the developing Asian market and maintenance of the United States market.
Other factors impacting on the beef industry were:
(i) increased competition from poultry and pork for protein consumption - see Figure 2.5
(ii) stabilisation of beef and veal domestic utilisation levels - see Figure 2.6
(iii) increasing numbers of cattle being grown on feed - see Figure 2.3
(iv) increasing development and broadening of the export orientation of the industry.
In response to these trends and projected export opportunities, the industry is in the middle of an informed, market-driven resurgence. An overview of this position is presented by Elizabeth Moore, Senior Market Analyst with the Australian Meat and Livestock Corporation (AMLC) (Australian Beef 1993):
'The past 20 years have seen the cattle industry come of age.
This new maturity has come about as Australian beef exports have increasingly moved to the Asian market place. The United States (US) is still Australia's largest mqkeg- .but increasingly markets such as Japan, Korea and Taiwan are taking a higher pro$le dnd a higher percentage of Australian exports.
In the past decade Australian exporters have carefully wooed these markets resulting in the diversification of the beef market into specialisedproducts.
Australia is now well established as a leading supplier to Japan and Korea, taking a leading role in the opening and liberalisation of these markets. n i s role continues as Australia, with the United States and New Zeal&, negotiates for greater access to the Korean market and keenly monitors the liberalisation of the Japanese market place.
The United States still takes around 50 percent of Australia's total beef exports. However, other markets are developing rapidly to rival the US, not only in terms of tonnage shipped, but also in terms of the value of exports to the industry. This has been hastened in recent years as the Meat Import Law (ML) has increasingly impeded exports to the US, forcing exporters to seek and develop alternative markets.
This change in direction has brought about a revolution in the industy, with the rapidly growing markets of North Asia demanding more specialisedproducts than the manufacturing . grade beef shipped to the US. As a consequence, the livestock producer who based production decisions on traditional factors such as the appearance of cattle are disappearing. 171efuture of the industry lies clearly with the more aware, market conscious grower who turns out cattle destined for particular markets and who is able to meet exactly the specific requirements of users in these markets.'

BEEF AND VEAL PRODUCTlON thousand tonnes carcase weight
........ ........................
...........................................
......................
....................................................
CAlTLE ON FEED IN AUSTRALIA 350 thousand head
r 1
Figures 2.1,2.2 and 2.3
Figures 2.4,2.5 and 2.6
TOTAL ADULT CATTLE SLAUGHTER hundred thousand head
...................
, ......................
............ .- .......
4 1 1 1 1 1 ~ ~ ~ ~ ~ ~ 1 1 1 1 1 1 1 1 1 1 1 1 1 1
1970 1972 1974 1976 1978 1980 1982 1984 1986 1988, 1990 1992 1994 1996
PROTEIN CONSUMPTION IN AUSTRALIA
80 kg per head
BEEF & VEAL 70 ... .- ....... .............. .
r-7
OO lhousdand tonnes-carcase .weight
I

The Peninsula's pastoral industry is steadily responding to these market changes by producing cattle types suited to diversifjmg market opportunities.
2.7 Industry Strategies
In attempting to meet market changes, strategic planning is an ongoing process for the cattle industry. Attempts are continually being made to improve productivity and sustainability of -; the industry. Some of the future strategies currently being developed are:
Feedlotting
In feedlotting, cattle are kept in yards and fed high quality grain based diets for periods ranging from 70 to 300 days. This feed regime depends on the specifications of the market and use, and produces a consistent, tender product required by cei'tain high priced markets. Feedlotting adds considerable value to beef production.
In northern herds, the producer must check the financial considerations of feedlots in the decision to either sell young cattle to the feedlot or to retain the beast on the property for maturing. The northern areas also operate within the constraints of limited cattle movement between October and March due to high temperatures and rainfall. This restricts feedlot operators in their desire to maintain a constant supply of cattle.
Clean Beef Production
A recent market initiative of the beef industry is to maintain its reputation of supplyingdean beef, produced with minimal involvement of pharmaceutical products. Research is conti&ally enhancing the production of chemical-free high quality meat by developing breeds that are resistant to disease, or developing breeds that achieve faster growth rates and vaccines that are free of chemicals. These animal husbandry improvements are being complemented by development of better pasture species. These efforts apply both nationally and to the Cape York industry.
Sustainability
The industry itself is now challenging the old belief that 'the land always comes back' from natural disasters. It is recognised that it doesn't and it requires carefbl management. In an effort to address environmental concerns, the industry is involved in environmental programs. Some of the issues under investigation include:
the decline in the range of fodder plants soil degradation dryland salinity and scalding protection of native vegetation control of native pests eg. kangaroos rangeland management ESD policy directions.

The industry's involvement in the Landcare movement (Douglas 1988) is substantial throughout Queensland. This involvement has increased awareness of long term consequences of land degradation. Also, its involvement with Drought Policy, the Rural Adjustment Scheme, Water Quality and Biodiversity have all involved industry and property planning. This planning approach has, of recent times, broadened to encompass an overall natural resource management approach to issue resolution.
In support of this approach, environmental policies developed around ESD principles are. supported. The basic tenet of environmental policy permitting continued economic and social development is supported.
Market Changes
Producers in the Peninsula will need to continually update managemeht and technologies to be able to klfil wider industry directions and aspirations. The export orientation of the present industry structure is driving individual sections of the industry to conform if they,-want to maintain market contact.
Producers in Cape York are well aware of the market driven orientation of their industry and the need to continually review their management and technical expertise.

I SECTION C: TENURE AND LAND USE I
3 LAND TENURE AND LAND USE
Security of tenure is recognised as one of the main issues of concern for the pastoral industry. This concern stems fiom industry uncertainty, misinformation, changing legislatios -and conflicting advices. Resolution of these issues is considered findarnental to any meaninal development of strategies involving the pastoral industry.
For the purpose of this study, land tenure is viewed as 'the means by which the right to use and occupy land is allocated to various industries or organisations, with varying degrees of security of ownership' (Lands Department 1994).
The present analysis of tenure assumes that security of tenure is attained if
(i) 'a person is secure or safe in his holding', and (ii) 'the person is able to transfer his rights over the land with certainty and ease'. (Wolfe,
1990). -
Security of tenure is not only a question of possession, occupation or ownership but more a question of being confident that the established rights attributed to land can be kept secure. Landholders will be secure if their rights to the use of land are clearly presented and . supported. Uncertainty presently is undermining the confidence of the pastoral industry and subsequent land use decisions.
3.1 Current Regional Tenure Distribution
The CYPLUS study area covers an area of approximately 136,700 square kilometres (km2). The tenures of study areas are presently in a number of forms. An outline of these tenures with areas is represented in Table 3.1 and on Map 4.

Table 3.1. Land Tenures and Areas (km2)
Type km2 % of Peninsula
Freehold Crown Reserves Aboriginal and Torres Strait Islander Lands (DOGIT and inalienable freehold)
1 Crown Land (vacant crown land) National Parks State Forests and Timber Reserves Pastoral Leases Other (special purpose lease etc) Perpetual Mining Tenure Roads and Natural Features Other TOTAL , 136,700 100% (Source: Lands Department 1994)
Freehold tenure permits the owner of freehold title to occupy the land while paying off the purchase price over a period. It is the tenure of land most alienated from the Crown. Freehold land is distributed predominantly in the southeast corner of the study area.
Freeholding is the process whereby 'leasehold tenure of Crown land is converted to .an estate in fee simple' (Wolfe, 1990). Little land use control is exerted on freehold land upon the completion of payments (rents) to the Crown and any exclusions are noted on the original deeds of grant. Existing tenures where freeholding conditions apply include:
(i) (ii) (iii) (iv) (v) (6) (vii) (viii) (ix) (x)
agricultural farm grazing homestead freeholding lease auction purchase freehold perpetual town leases perpetual lease selection auction perpetual lease special lease purchase freehold miners' homestead lease miners' homestead perpetual lease residence areas, business areas.
Of these tenures, those highlighted are of significance to this study.
In addition to these leases with fieehold conditions, the following lease categories may be converted to a grazing homestead perpetual lease, namely:
(i) pasture development holding (ii) pastoral holding (ii) preferential pastoral holding.

These grazing homestead perpetual leases may then be converted to grazing homestead freeholding leases. Section 3.6 presents a summary of these leases while Appendix 3.1 contains a summation of lease conditions governing various tenures. It is noteworthy that the new Lands Act 1994 will have only two types of lease and does not convert existing leases to the new type.
3.2 Aboriginal and Torres Strait Islander Tenure
Aboriginal and Torres Strait Islander Lands comprise 20,232 km2 or 14.8% of the study area. The categories of Aboriginal tenure that exist in the study area include:
(i) Aboriginal Land Lease - This is a special purpose lease granted for the objects and purposes of the Local Government (Aboriginal Lands) Act 1978 to make secure, for the benefit of Aborigines who reside on the demised land, preservation of their traditional rights, use and occupancy of the demised land
(ii) Deed of Grant in Trust (DOGIT) - Granted in trust under the Land Act 1962 for the benefit of Aboriginal inhabitants or for the purpose of Aboriginal 'Reserve'
(iii) Transferable Land - Land that is granted under the Local Government (Aboriginal Lands) Act 1978 for the benefit of Aboriginal people without a claim being made under the Aboriginal Land Act for the land. This is land that CAN be transferred
(iv) Transferred Land - Land that is granted under the Local Government (Aborisinal Lands) Act 1978 for the benefit of Aboriginal people without a claim being made under the Aboriginal Land Act for the land. This is land that HAS been transferred
NOTE: Both Transferable and Transferred Land must already be either an Aboriginal Reserve, Lease or DOGIT.
(v) Aboriginal Reserve - Land set apart under the Land Act 1962 for an Aboriginal Reserve or for the benefit of Aboriginal inhabitants
(vi) Aboriginal Lease - The Land Tribunal recommends to the Minister that an area of land be granted to a group of Aboriginal people by way of a Lease in Perpetuity or a Lease for a specified term of years
(vii) Gazetted claimable Land - Land that may be claimable by, and granted under the Local Government (Aboriginal Lands) Act 1978 to Aboriginal people. (Source: Department of Lands, 1994)
The distribution of the Aboriginal tenured leases are centred on their communities. Tabie 3.2 provides a listing of Aboriginal communities and their census counts.

Table 3.2. Aboriginal communities and census counts -
3.3 National Park Tenure
National Parks constitute some 13,672 km2 or 10% of the study area. The designation of this land to national park impacts on the regional pastoral industry as it effectively withdraws the designated areas fiom pastoral use. Pastoral uses on National Parks are not permitted under the provision of the new Nature Conservation legislation.
r ' - 3.4 State Forests and Timber Reserves
State Forests and Timber Reserves comprise 2,187 km2 or 1.6% of the study area.
3.5 Analysis
A review of the study area's tenure statistics described to this point illustrates that the amount of land used for the purposes of
Area (km2) % of Study Area
(i) National Parks 13,672 10 (ii) Roads and natural features and other 2,323 1.7 (iii) Aboriginal and Torres Strait Islander Lands 20,232 14.8 (iv) State Forests and Timber Reserves 2,187 1.6 (v) Crown Reserves 4,647 3.4
totals 43,061 kid, or 31.5% of the study area. This compares with about 7% State wide (Lands Department 1994). From a pastoral industry perspective, most of these lease types are - available for pastoral use, however, present pastoral use is light compared to other past lease types.

3.6 Current Pastoral Tenures and Conditions
Extensive cattle grazing on pastoral holdings is the predominant primary industry in Cape York Peninsula (Connell Wagner 1989). Pastoral lease holdings constitute over half the total area of the study area (78,192 km2), comprising 57%. This figure compares with 72% of Queensland's State land in the form of perpetual lease, term lease, licence or permit. As is the case on a State basis, grazing is the primary use on these holdings.
Cotter (1994) in his 'Study of the Pastoral Industry of Cape York Peninsula' identified the pastoral land tenure in the study area as:
(i) pastoral holdings (ii) grazing homestead perpetual leases (iii) special leases (iv) occupation licences (v) permits to occupy.
A description of the five terms and conditions of these tenures is presented in Appendix 3.1 A summary of these leases is tabled below:
Table 3.3. Pastoral leases for Cape York - -
Grazing Homestead Perpetual Lease - Primary tenure for grazing and agricultural purposes which are held in perpetuity (ie. forever). Generally seen as the family unit tenure a& one which takes over from the pioneer pastoral lease type. Freeholding may take place subject to public interests etc.
Occupational Licence - An interim tenure for occupational purposes only - usually over expired pastoral holdings while hture land use is being sorted out.
Pastoral Holding - Pioneer tenure for grazing and agricultural purposes and for the larger mostly unsurveyed leases in the distant areas of the State. Term is up to 50 years.
Permit to Occupy - To permit the use of Crown Land, reserve or road, while at the same time preserving the underlying lawfbl usage. It is a low security tenure to enable occupation of land eg. will allow-grazing on a road without limiting the use of the area for road purposes. Generally has no term and continues by: the payment of annual rent.
Special Lease - A multi-purpose tenure which can be used for any purpose over Crown Land and reserved land. It can cover large rural properties, town lots, tourist purposes, special
[projects, leases over State Forests reserves etc. (Source: Cotter 1994 and Wolfe Report 1990)
Appendix 3.2 is included for identification of leases and this information will be used in various sections of this report.

An analysis of current tenure indicates three important characteristics:
(i) The present high percentage of land held under Pastoral Holding tenure is a deterent to development for many pastoralists who are genuinely interested in developing the properties. Costs involved in developing Peninsula properties are substantial, and an improved security of ownership would encourage development. A change in lease designation from Pastoral Holding to Grazing Homestead Perpetual Lease on these ', types of properties would provide an incentive to development.
Conversely, the existing Pastoral Holding designation is reflective in some cases of properties that are presently undeveloped and whose owners have no intention to develop them in accordance with negotiated property management planning guidelines. '
This lease designation is reflective of the stage of development of these properties- pioneering.
(ii) Amalgamations and subdivisions are permissable under most types of pastoi.al leases utilised in Cape York Peninsula. Based on the evidence assessed for this report, amalgamations of holdings cannot be supported where the properties to be amalgamated are undeveloped and no negotiated plan of management for development has been approved.
With respect to subdivisions, clarification from the Department of Lands of circumstances when subdivisions are permissable would remove some of the insecurity of tenure concerns. This report proposes guidelines for subdivision for the region's consideration. - c .
(iii) The distribution of the pastoral lease holdings over the Peninsula affects planning of the pastoral industry in the Peninsula. A review of the CYPLUS tenure map' (Map 3) highlights a number of points:
(a) pastoral activity is concentrated to the west of the main range (b) fragmentation of pastoral land use is progressively occurring as tenure
changes eg. National Parks (c) smaller properties exist in the south eastern part of the study area (d) non pastoral holding tenure exist in the south eastern part of the study area.
3.7 Sizes of Pastoral Leases
Cotter (1994) has analysed the 112 pastoral leases of the region for size distribution. This study area covered approximately 93,526 km2. His analysis concluded that the average size of the leases was 83,506 hectares (or 835 km2), but this average was distorted by a number of. very large leases. Cotter concludes that 90,000 ha (900 krn2) is the upper limit of area workable by a family unit. This conclusion is viewed as conservative by industry sources, as implementation of management strategies such as trapping and supplementation, allows for . considerably larger areas to be managed by a family unit. Table 3.4 represents the size distribution of the leases. The distribution of these leases is represented on Map 3.

Table 3.4. Lease size and distribution -
Size Number Accumulated Total
250,000 ha - 5 112 (Source: Cotter, 1994)
An analysis shows the following characteristics:
(i) 27 leases are 15,000 ha (150 km2) or less. This distribution is represented o n r ~ a p 12. Generally, these leases are located in the southeastern corner and are lightly scattered in the central southern sections of the Peninsula. The southern leases are reasonabl$ well positioned to fbnction as breeding country properties for southern fattening blocks (eg. Atherton Tableland).
(ii) 74 leases are 90,000 ha (900 km2) or less. This distribution is represented on Map 12. Generally, these leases are located either side of the development road. These leases are relatively better serviced by roads that may be able to move cattle for live export.
(iii)38 leases are larger than 90,000 ha (900 b 2 ) . These areas are in excess of Cotter's upper limit for a workable family unit. This distribution is represented on Map 12. Generally, these leases are located in areas west of the range.
(iv) Cotter recognises that larger leases have 'potential to have areas excised for amalgamation with substandard blocks, or indeed subdivision to provide additional separate leases'. This investigation supports the principle of amalgamation and subdivision, however, other criteria (developed in later sections of this report) would need to be satisfied before changes could be recommended.
3.8 Ownership of Leases
The summary of the ownership of leases within the study area is represented below in Table 3.5.

Table 3.5. Lease ownership
Foreign companies 5,682 and individuals 6.2 7.2
Private companies 29,555 32.4 32.6 Individuals or groups of individuals 48,068 52.7 5 1.3 Aboriginal interests 6,520 7.3 6.6
1,300 2.3 Public company 1.4
An analysis shows the following characteristics:
(i) foreign owned properties have a higher carrying capacity than average. Possible explanations for this result are:
the'country is inherently better (eg. better soils), or the improvements on the property are above district average the properties are more efficiently managed.
A clear explanation of the reasons would need fbrther detailed investigation. However, based on regional investigations, foreign-owned properties have been developed on some better quality land. Also, foreign-held leases have undergone the greatest amount of development. Past developmental efforts by foreign companies, although not generally successfbl, have been of significant benefit to the Cape York pastoral indust@ ' In summary, foreign investment in pastoralism has accrued the following benefits:
provision of additional employment opportunity provision of 'test cases' for property development strategies provision of companies of size to utilise Peninsula land as breeding country for their southern fattening blocks
(ii) private companies manage 32.4% of the Peninsula's area which cames approximately 32.6% of the region's assessed capacity
(iii)individuals comprise the dominant ownership type on the Peninsula, comprising over 50% of the study area and the assessed carrying capacity. The size of these individual leases range fiom 500-ha to 283,000 ha (2,830 krnz), with an average of 66,800 ha (668 km2). The use of these holdings range from open grazing to store production to cattle fattening enterprises. Some migration of cattle to associated southern fattening enterprises originate from some of these holdings.
(iv)Aboriginal interests are limited to four (4) leases, however limited grazing occurs on other designated Aboriginal tenured land. These four (4) leases total 652,000 ha (6,520 krn2) or 6.6% of the study area.
(v) the only lease held by a public company is Sudley Pastoral Holding near Weipa. The presence of this lease is strategic due to its location close to the port and local market of Weipa, its extensive development and its small abattoir.

The mix of ownership types is significant at this stage of the pastoral industry development in Cape York Peninsula. Maintenance of this tenure mix and subsequent capacity to integrate new technologies with market-driven initiatives will be crucial for the industry's immediate, medium and long term development.
3.9 Improvements on Leases
Cotter has estimated that the combined unimproved value of the studied leases is $8 million, or about 86 cents per hectare. This information is not strictly current due to varying valuation assessment dates, however, it can act as a guide for discussion purposes..
The unimproved value is based on grazing usage. Some properties may have been allocated a higher valuation due to market perceptions that land has a potential for a higher usage such as tourism. However, the above unimproved figure does suggest that '@roperties in the Cape are underdeveloped, particularly in relation to fencing and timber treatment' (Cotter, 1994).
'I-.
With respect to the approximate value of improvements, Cotter estimates that $16.1 million have been invested. This expenditure has been allocated to structures, yards, fencing, water and timber treatment (including pasture improvement). Table 3.6 details the proportion of the expenditure on each item.
Table 3.6. Value of improvements
An analysis of this table highlights a number of points:
(i) the costs of property development, based on traditional systems of fencing, water and structures, are excessively high due to isolation and large areas
(ii) property management systems that require minimal capital input have been practised @)any kture development of the industry will be required to build from a low investment
base.

4 LAND USE
4.1 Current Land Use
Current land use reflects tenure and tenure conditions. Major land uses in Cape York Peninsula and their associated tenures are represented in Table 4.1.
Table 4.1. Major land uses
Tenure Land Use Area (km2) Percentage of Total Area
State Forests and Timber Reserves .
Roads, Natural Features and Other
Perpetual Mining Crown Reserve
Freehold
Crown Lands and Other Lease
National Parks Aboriginal and Torres Strait Islander Lands
Forest product 2,187
Roads, natural features 1,093
Mining 3,964 Recreation, water supply, Aboriginal purposes, other specific purpose 4,647 Townships, limited grazing and agriculture 5,604
Specific purpose 7,109 Conservation~tourism 13,672
Aboriginal and Torrest Strait Islander Communities, Aboriginal purposes, limited grazing 20,232 14.8%
Pastoral Holding Cattle grazing 78,192 57.2% (Source: Lands Department 1994)
Over half the region is occupied by pastoral holdings and leases for pastoral purposes. Aboriginal land, constituting 14.8% of the region, is used for traditional and cultural purposes and supports few or no cattle. National park lands, constituting 10% of the region, supports only limited grazing and this is diminishing rapidly as the new environmental legislation prohibits grazing in National Parks. Some grazing is permitted on the other tenures mentioned. From a regional tenure perspective, 80% of the region is under either Pastoral Holding, Aboriginal or National Park related tenures. These dominant tenures effectively. determine land use and are represented in Map 4.

4.2 Pastoral Land Use
History and Develooment of the Pastoral Industry
Recent evidence on human habitation of the Peninsula indicates that prior to the land-bridge connecting Australia to Papua New Guinea and Indonesia, there was no human presence in this portion of what was Gondwana. Aboriginal history goes back some 40,000 years and ', European exploration is recorded fiom Dutch landings in 1606. This was followed by Cook's. sojourn to Cooktown in 1770 and Kennedy's expedition to the interior, that is today's Cook Shire, in 1848. Somerset was established in 1863 and in 1865 the Jardines introduced the first cattle to the Peninsula. This venture is widely regarded as the commencement of pastoralism in the northern Peninsula, followed by a local increase in the demand for meat as a result of .
Hann and Mulligan verifjnng the existence of gold on the Palmer River fields in 1872-3. This activity led to a population of over 40,000 in the Palmer area by late 1874.
The early grazing selections were: ,-.
Butchers Hill (Lakeland Downs) 1874 Mt Mulgrave 1876 Frome (Fairlight) 1879 Lakefield 188 1 Lallarookh (Silver Plains) 1882 Rokeby 1884 Kalkah (Glengarland) 1884 York Downs (Sudley) 1884 Koolburra 1 884 Pine Creek (Merluna, Wolverton) 1887 Bertiehaugh 1888 Lockerbie (Galloway) 1892.
In the period 1874-1 883 the telegraph line was surveyed between Cooktown and the Cape and completed in 1886. The railway line planned fiom Cooktown to the goldfields, only reached Laura and was terminated there in 1888. (It was finally closed by the State government in 1961.) Sugar and rice industries initiated in the 188.0s at Bloomfield and Cooktown respectively, both failed. When bauxite was rediscovered at Weipa in 1955, the ~eninsula's biggest enterprise commenced. The beef industry gained by the introduction of Brahman (Bos indicus) cattle in the 1950s and the first transport of cattle by boat in 1953.
By 1959 the American hamburger market provided a market for otherwise unsaleable cattle and in 196 1 the establishment of legume pastures began. By 1965 overseas owners purchased grazing leases and commenced pasture improvement. In 1967 the Mareeba-Laura road became part of the 'beef roads' scheme of inland Australia. Notably, the standard of the roads in the Peninsula is not up to the standards of much of the 'beef roads' of inland Australia. In 1969 the first major cropping scheme in the Peninsula commenced at Lakeland Downs.
Since 1969 to the present, the pastoral industry has met with mixed fortunes. Cattle numbers have been dramatically affected by the Brucellosis and Tuberculosis Eradication Campaign (BTEC), with over 225,000 head of cattle destocked in the 1980s. Many of the properties that were destocked have not yet been brought back into production. Increasing numbers of

cattle are now direct sold to southern fattening properties and live cattle export markets and infrastructure are now being developed.
Aboriginal and Torres Strait Islander Involvement in the Pastoral Industry
The Aboriginal and Torres Strait Islander communities have experience as stockmen, musterers, drovers and trackers. They have supplied much of the labour force that attended to . the stock management role of property management and served a significant role in the -
development of the Peninsula's pastoral industry. Unfortunately, Aboriginal people lack property management experience.
As is the case with the non Aboriginal and Torres Strait Islander section of the Peninsula's pastoral industry, the overall level of enthusiasm of the Aboriginal and Torres Strait Islander communities towards the pastoral industry is diverse. Some groups are keen to develop commercial herds, others desire subsistence herds only, others again want no cattle on their land, preferring to procure their meat from wildlife and feral pigs. For those wishing to develop their pastoral property management skills, training would need to occur, possibly over the period of a generation. For those not wishing to develop into pastoral enterprises, consideration must be given to changing land tenure so as to reflect Aboriginal needs for land ownership. This will affect the critical mass of the pastoral industry in the Peninsula.
Unfortunately, many of the 'commercial' properties of the past have not been economically successfbl. Reasons for difficulties in transferring stock management skills to wider broperty management skills are varied. At the risk of generalisation camouflaging the facts, some of the constraints suggested during our consultations included: . . c '
poor quality of land lack of skills training cultural attitudes to land development 'public purse' cycle diminishing initiative.
If the Aboriginal and Torres Strait Islander communities are to benefit from continued expanded participation in the Peninsula's pastoral industry, these identified constraints have to be recognised.
As is the case with all sectors of the industry in the Peninsula, proper property planning and skills training need-to be continued. This process will need to be cognisant of both wider cultural and industry consideration. Any serious entry of Aboriginal landholders into commercial pastoralism would most likely be based on low-input and thus low-cost management. While output per unit area may be lower from such extensive production, it .
requires less resources, less technical knowledge and decision-making, and has decidedly lower financial risk. This management approach is responsive to Aboriginal and Torres Strait Islander peoples' spiritual links with land.
National Park Involvement in the Pastoral Industry
Permits to graze in National Parks have been part of the Queensland pastoral industry for decades. Such arrangements presumed that fauna and flora can be maintained under a grazing regime, given appropriate stocking rates and effective distribution of cattle. Grazing of parks

has been challenged by conservationists as detrimental to the ecological integrity and wilderness values of parks. Theoretically, the network of parks in the Peninsula has been planned so as to represent a framework of sufficiently large examples of each of the major land forms and their associated biodiversity. In practice, while several additional parcels of Crown land have been identified and recommended by DEH staff as necessary and appropriate fiture parks, only those leases which have become available through the political processes and pressures of the day, have become proclaimed as National Parks. Some present parks include .
some of the best grazing land in the Cape, eg. Lakefield, Archer Bend, Silver Plains, but the. new Nature Conservation Act prevents grazing in parks.


h
I SECTION D: DESCRIPTION OF THE CURRENT INDUSTRY
5 PRODUCTION PATTERNS -
5.1 Past Production
Total Cattle Numbers
Table 5.1 summarises total cattle numbers in the shires of Cook, Aurukun and Torres measured in five year increments.
Table 5.1. Total Meat Cattle Numbers in Cook, Aurukun and Torres Shires
Year Cattle Numbers . Significant changes occurring "
1960 99,344 1965 99,794 1970 101,506 1975 132,844 Cattle industry price slump (beef depression 1974-77) 1977 150,424 Cattle numbers peaked 1977 .
1980 141,415 1985 130,248 BTEC campaign 198 1-89. Cattle numbers reached their 1989 119,233 lowest point 1989 1990 124,867 1993 130,528 (Source: Boorman Submission, 1995)

Analysis of Table 5.1 highlights a number of events in the past that have influenced cattle numbers in the Peninsula:
cattle numbers rose in the early 1970s in response to increasing market prices despite a price crash in 1974, cattle numbers continued to increase as pastoralists could not afford to sell old breeders cattle numbers peaked in 1977 at 150,424 the Brucellosis and Tuberculosis Eradication Campaign (BTEC) commenced in 198 1 in the late 1970s and through to 1989, cattle numbers driRed down to their lowest level since 1973 amounting to 119,233 head BTEC finished in 1989 despite destocking resulting from BTEC, cattle numbers in 1989 were 20% above 1960s levels (ie. 99,344) post 1989, cattle numbers have increased considerably and this increase occurred in spite of some properties being still totally destocked due to BTEC and the loss of pastoral production on properties converted to National Parks twenty (20) properties in the Peninsula were either totally or partially destocked under BTEC.
This summation of past production events does not cover the Carpentaria Shire section of the study area. However, departmental and industry advice suggest the events and effects on cattle numbers are similar for both areas.
Herd composition
A more detailed statistical review was completed for the period 1984 to 1993.
The Australian Bureau of Statistics, Agricultural Census Data, has collated data on cattle numbers, sales and deaths for the Aurukun, Torres and Cook Shires. These data are presented as Table 5.2.
Table 5.2. Aurukun, Torres and Cook Shires, Meat Cattle Numbers, Sales and Deaths
14002 15428 14465 13679 12571 14951 15469 12557 12221 10596 Cows and Heifers 1 Yr and
4557 4246 3109 6454 4636 7545 5219 4628 6016 6276 Calves under 1 Yr - Number 68 1160
These shires are not a complete representation of cattle numbers north of 16". A section of Carpentaria Shire is also included in the south western section of the region. Statistics for this shire are presented as Table 5.3.

34
Table 5.3. Carpentaria Shire, Meat Cattle Numbers, Sales and Deaths
Commodity 1984 1985 1986 1987 1988 1989 1990 1991 1992 1993
Meat cattle on holding at 3 1 March 308989 299746 281034 294888 334895 343919 344601 309625 298104 307423
Sales: (Year ending 3 1 March) Steers, Bullocks and Bulls, 1 Yr and over 30838 34591 29165 31998 37644 42000 31680 31544 16240 28233
Cows and Heifers 1 Yr and over 12053 13803 14887 14038 14567 24218 15044 31195 18149 22902
Calves under 1 Yr - Number 33 1 205 3357 2178 1331 4898 1780 5325 1254 6226
Deaths on Holding: (Yr ending 3 1 March)
Cows & Heifers 1 Yr and over 15589 16685 14495 9547 10036 12774 10944 5366 14155 6694
Calves under 1 Yr 3080 6245 2694 2679 2073 2554 1507 2221 3430 2723 Other Cattle 1 Yr and over 5743 6000 10514 5510 3945 7911 5759 2402 3081 1762
These statistics are presented graphically in Figures 5.1 and 5.2.
Analysis of Tables 5.2 and 5.3 highlight property production responses to earlier mentioned events affecting cattle numbers:
during the BTEC period (1984-89), cow and heifer (1 year and over) deaths increased at an increasing rate, peaking at 13,514 in 1989 in response to the eradication scheme the decline in cattle numbers up to 1989 was mainly due to destocks and destruction of all classes of stock during BTEC the sales of cows and heifers have shown an erratic pattern but with a trend for incre'asing sales leading up to the completion of BTEC due to the BTEC fieight subsidy reducing marketing costs since 1989, sales of cows and heifers have decreased as graziers build up breeder numbers following BTEC.

M E A T C A ~ ~ E D U W o~~owrn'o, AURUKUH.TOICRES A . COOK S R l l l f S
(leu din( 31 M u d )
MEAT CATTLS S h L n . AURIIKUN. TO- AND COOK SRIRIg
6- mdlg J1 M d )
F i g u r e 5.1. P r o d u c t i o n T r e n d s (Aurukun, T o r r e s and Cook S h i r e s )

HUT U T T U O N ROLDNC, CARIRCIIIIA sRI1LI (,a dlq 31 H d )
, it" -
F i g u r e 5.2. P r o d u c t i o n T r e n d s ( C a r p e n t a r i a S h i r e )

Effects of BTEC
BTEC has influenced the Peninsula's past production of cattle. The destocking program associated with BTEC resulted in graziers recovering compensation for 99,401 head of cattle that were eradicated (DPI Stock Inspectors). In addition, cleanskin bulls were shot, but compensation was not paid on these cattle. Discussions with stock inspectors involved with BTEC in the Peninsula consider that a total of 225,000 head of cattle were destocked from 20 -, properties over the nine (9) year BTEC period. This averages out at a destock of 25,000 head: per year from the 20 properties. In Cook, Aurukun and Torres Shires compensation was paid on 42,465 head, translating to a destock figure of about 95,000 head.
BTEC has resulted in a reduction in cattle numbers, however, the extent of this reduction is '
not dramatic when compared to longer term production indices. At the end of 1989, when BTEC and destocking had concluded, cattle numbers were still 20% above 1960s levels. Also it is noted that three large properties had been converted to National Parks around or soon after this period.
Despite total cattle numbers not being dramatically affected by BTEC, herd composition and management were affected. Breeder numbers declined during BTEC and graziers appear to be working on rebuilding breeder numbers since 1989. BTEC caused an adjustment of management strategies in order to re-establish some balance in the composition of their herds.
5.2 Current Production
Our statistical analysis of Australian Bureau of Statistics (ABS) data uses data current as 41t 3 1 March 1993. These data have been extracted to quantify the present 'state of the industry' in the Cook Shire and is presented as Table 5.4. Analysis of the ABS data highlights the following key features:
(i) average herd size is 1,695 head. The significance of this figure is that it is low when compared to the Lands Department nominated 3,000-3,500 head requirement for viability. This indicates that, on average, properties are stocked with herd sizes below 'viable' levels
(ii) average herd size increases with an increase in the size of the property. Average herd size of 5,000 head requires an average property size of 180,000 ha. If these average figures were proportioned, a herd size of say 3,500 head would require on average a property size of 126,000 ha, under present production systems
(iii)identified herd sizes and property sizes reflect average carrying capacities. The average carrying capacity for Cook Shire is 61 hahead. Management systems for these carrying capacities require large areas of land. The carrying capacity increased with larger herd sizes to 36 hahead. The carrying capacity decreased. with smaller herd sizes to 132 hakead
(iv)smaller herd size properties did not run many cattle (16,359 head)


(v) properties running larger herd sizes carry a proportionally high percentage of cattle (54%) compared to their area percentage (32%). The other herd size categories run substantially fewer cattle on a percentage basis than their respective percentage of area utilised.
Table 5.4 relates to the Cook Shire only. Advice from the Australian Bureau of Agricultural and Resource Economics (BARE) is that there were 'mostly no cattle in Aurukun, Weipa and Torres - only in Cook and Carpentaria'. With respect to Carpentaria, BARE'S advice is' that 'stations in the northern part of Carpentaria are very different (to the Peninsula). They are corporate owned, large and transfer considerable numbers of cattle onto and off the stations.' Logistical difficulties in statistics collection prevented an estimate of cattle numbers in this part of the study area. Total Carpentaria statistics have been included and an arbitary percentage could be used to assess 'ball park' numbers for the Carpentaria Shire's cattle within the study area.
5.3 Production for Mareeba Saleyard Disposal
An analysis of cattle being sold through Mareeba was completed and this is represented in Figures 5.3 and 5.4. Key findings of this analysis are:
(i) identified cattle categories are principal turnoWsale types from Cape York Peninsula
(ii) Cape York Peninsula cattle categories and percentages as estimated by DPI Stock Inspectors in Mareeba are bullocks 2%, medium steers 10%' export steers 45%, light cows 5%, light bulls 28% and heavy bulls 10%
,. ,
@)average of the categories of cattle over a 65 month period was 95.7 cents per kg live at Mareeba yards
(iv)adjusted average price for Cape York Peninsula cattle over this period is 88.7- cents per kg at Mareeba
(v) statistics for store cattle sold for direct sale or company transfers are not recorded through the saleyard system. It is difficult to estimate the extent of this practice, with anecdotal evidence suggesting it is significant, but this assertion was not supported by questionnaire returns received for this project. The following projection analysis considers cattle numbers moving through the Mareeba saleyards and does not include cattle sold for direct sale or company transfer.
Production Pro-iections for Mareeba Saleyard
A firther analysis was completed of cattle numbers being sold through Mareeba to establish* trends in production.
The analysis methodology and model used in this Section are detailed in Appendix 5.1.
Monthly data on the numbers of cattle sold through the Mareeba Saleyard from January 1989 through November 1994 reveal various features, some of which are readily discernible by visual inspection, whereas others are uncovered only by more detailed analysis (see Figures 5.3 and 5.4).

F i g u r e 5-30 Mareeba Saleyard Averages f o i February 1989 to June 1994 (Centslkg and Numbers Sold Monthly)
Feb, Apr, Jun, Aug, Oct, Dec, Feb, Apr, Jun, Aug, Oct, Dec, Feb, Apr, ~ u n , Aug, Oct, Dec, Feb, Apr, Jun, Aug, Oct, Dec, Feb, Apr, Jun, Aug, Oct, Dec, Feb, Apr, Jun, 1989 1989 1989 1989 1989 1989 1990 1990 1990 1990 1990 1990 1991 1991 1991 1991 1991 1991 1992 1992 1992 1992 1992 1992 1993 1993 1993 1993 1993 1993 1994 1994 1994
Month
l o v e r the 65 month period 147,211 cattle averaged 90.45 centslkg]
.. . - amm Number Recorded
-e Average Cents lkg

F i g u r e 5 - 4 . CAPE YORK PENINSULA CATTLE CATEGORIES SOLD THROUGH THE MAREEBA SALEYARD
FROM FEBRUARY 1989 TO JUNE 1994
THESE CAITLE CATEGORIES ARE PRINCIPAL TURNOFFISALE TYPES FROM CAPE YORK PENINSULA. HOWEVER. FURTHER ADJUSTMENT IS NEEDED TO ALIGN TOTAL TURNOFFISALE NUMBERS TO CYP STOCK CATEGORIES AND PERCENTAGES OF EACH AS ESTIMATED BY DPI STOCK INSPECTORS IN MAREEBA - BULLOCKS 2%. MEDIUM STEERS 10%. EXPORT STEERS 45%. LIGHT COWS 5%, LIGHT BULLS 28% AND HEAVY BULLS 10%.
THE CAPE YORK PENINSULA TURNOFF ADJUSTMENT IS CALCULATED AT 92.69%
AVERAGE OF THE CATEGORIES OF CATTLE OVER A 65 MONTH PERIOD WAS 95.7CENTS PER KG LIVE AT MAREEBA YARDS
ADJUSTED AVERAGE PRICE FOR CAPE YORK PENINSULA CATTLE OVER THIS PERIOD IS 88.7 CENTS PER KG AT MAREEBA.

First, a line plot of these data is characterised by: extreme variability the possibility of non-stationarity with the variations in the fluctuation increasing over time little, if any, autoregressive aspect (ie. current values do not depend on previous values) noticeable seasonality, with low points in the December-January-February period.
Second, a simple regression of cattle numbers on time (while problematic due to the extreme -+; variability) reveals:
little variation in cattle numbers accounted for by the effluxion of time only a positive trend which is statistically significant at the 5% level for each month extra, an additional 17 head pass through the saleyard, from a base point of .
1,643 head (on average) in January 1989 this model is not a good fit to the data.
Third, a Box Jenkins auforegressive integrated moving average (ARTMA) model suggests the following:
the data are non-stationary and appear to include a random component (ie. the mean fluctuates with, possibly, some trend pattern over time) no autoregressive aspect in the original data (ie. current values do not appear to depend on previous values) no moving average aspect in the original data (ie. current values do not appear to depend on error terms) seasonality, with a 12 period (monthly) seasonality. - r .
The most appropriate model appears to take the Box Jenkins ARTMA form:
log of (010)(211)12.
This model is statistically valid on all grounds. This model produces forecasts of progressively lower turnoff numbers being marketed through the Mareeba saleyards:
First year out: 20,535 head Second year out: 18,496 head Third year out: 16,092 head Fourth year out: - 1 1,936 head Fifth year out: 8,699 head Sixth year out: 6,228 head and so on.
Cattle numbers being marketed through Mareeba saleyards are progressively reducing in number. It is projected that, based on current prices and trends, that this trend of lower.'cattle numbers moving through Mareeba saleyards is likely to continue. It should be noted that these . cattle numbers do not include cattle transferred as direct sales or cattle shifted as part of company transfers. Evidence received during our consultations demonstrate that the number of cattle bypassing the Mareeba saleyards is significant. This assessment indicates the potential vulnerability of the presently so-called organised selling system through Mareeba and the opportunities for alternative marketing strategies throughout the Peninsula.

Monthly data on prices of various categories of stock have been weighted by the relevant percentage weightings of these categories passing through the saleyard. These weightings are: bullocks (2%); medium steers (10%); export steers (45%); light cows (5%); light bulls (28%) and heavy bulls (1 0%). The data used extend fiom January 1989 through November 1 994.
First, a line plot of these data is characterised by:
some periods of extreme variability a possible slight negative trend some indications of a possible autoregressive aspect (ie. current values depending on previous values).
Second, a simple regression of cattle prices on time (while problehatic due to the extreme variability) reveals:
',..
little variation in cattle price accounted for by the effluxion of time only a negative, but statistically insignificant, trend this model is not a good fit to the data.
Third, a Box Jenkins autoregressive integrated moving average (ARIMA) model suggests the following:
the data are characterised by non-seasonality there is an autoregressive aspect (ie. current values depend on values two periods previous) there is no moving average aspect there is stationarity after logarithmic transformation (ie. no noticeable increase or decline in the data, and the variance of the fluctuation remains relatively constant over time).
The most appropriate model appears to take the Box Jenkins ARlMA form:
This model is statistically valid on all grounds.
Forecasting: For one year out, the model forecasts prices fluctuating narrowly around 91 to 92 cents, with the price settling at 92.4 cents after 12 months. It remains at this price for the projected future.
In summary, based on Mareeba saleyards data, the long term trend is for decreasing cattle. numbers moving through the yard and for the long term price to remain around 92 cents. These figures do not take into account cattle movements by way of direct transfers and company transfers, and their numbers could be significant. Also, the region has endured ,
reductions in cattle numbers emanating fiom the BTEC scheme and loss of properties out of pastoral use in recent times. These factors have negatively impacted on cattle numbers.

5.4 Production for Direct Sales
Table 5.5 represents the destination, numbers and cattle types of stock that are not sold through the Mareeba saleyards.
Table 5.5. Direct Sales
Southwest area (Carpentaria shire not including Dunbar) 1,850 5,400 c300 900
Cooktown/Lakeland area 43 0 800 200 . - Dry tropics peninsula . 700 4,900 450 5.5 0 Totals 2,980 11,100 1,950 1,450 (Source: DPI Stock Inspectors)
This totals 17,480 going direct to meatworks, fattening on properties under the same ownership in other areas, sold direct to fattening properties, including feedlots, going to live export, or going to fatten on agistment.
Fattening of Peninsula cattle bought by property owners in the Lakeland, Cooktown and McIvor River areas make up a significant proportion of the 430 meatworks cattle in the'fable above. However, most of the Peninsula cattle fattened in this area go through Mareeba saleyards.

6 MANAGEMENT SYSTEMS AND TECHNOLOGY
6.1 Climatic Factors
In the context of productivity of the pastoral industry of the Peninsula, the climatic pattern provides the pastoral industry with a number of advantages. Regular monsoonal rains provide predictabiity and reliability of rainfall not available in many areas of Australia. This assists hi planning for production.
The high rainfall zone north of Princess Charlotte Bay comprises a huge area receiving over 1,200 rnm rainfall annually. South of this humid climatic zone is the moderate rainfall zone of over 13M ha receiving 800-1,200 mm annually. Both zones receive rain concentrated in the' 4-5 month summer period and both zones enjoy unusually reliable rainfall by Australian standards (less than 25% variation expressed as mean deviation about the averag'e rainfall). The length of the pasture growing season is a direct function of soil moisture availability, unlike the temperature controls operating in southern States. The most northern zone has a pasture growing season of greater than 20 weeks (5 months) while the southern zone's season varies fiom 16-20 weeks and is somewhat more variable than the northern zone. The major climatic zones based on rainfall and temperature are shown in Map 8.
Over 85% of the mean total rain falls in summer, although winter rain can be 30% of total annual falls in some years. Cyclonic and monsoonal rainfall intensities are characteristic of the summer downpours every year. The summer dominance and reliability of the7 Peninsula rainfall are important positive parameters for land use planning in this region. As such, climatic factors are less constraining to cattle production, than are nutritional gactors associated with infertile soil types and a lack of high-protein native legumes.
Clearly the effects of monsoonal storms and flooding on mobility limit property 'operations during 'the wet', but these situations are largely predictable and can be planned for. An additional land use planning factor related to climate is the huge volume of high quality river water produced by the Peninsula catchments which is presently almost totally unused before it enters the sea on the east and west coasts.
6.2 Management Practice
Native Pasture and Natural Watering Points
Management systems based on large herd size, managed on large unimproved properties, are difficult and expensive to control. Native pastures in the Peninsula are capable of supporting only light carrying capacities. The nitrogen and phosphorus status of the pastures is below the liveweight maintenance requirements for cattle for most of the year. Cattle require large areiis of land over which to graze, and in some cases, a large proportion of the property may be irregularly grazed resulting in a large proportion of the grass being uneaten. Pastures that are not burned by wildfires during the dry season or by lightning strikes at storm time, will b e 'fired' by graziers at storm time to provide 'fresh feed' for cattle throughout the following year. Most graziers realise end of year fires are valuable, and, to obtain a sufficient body of material to support a "hot" fire, burning is best carried out only once in every 3 or 4 years. These regulated fires:

control the spread of sucker regrowth assist in mustering as cattle graze the fiesh regrowth of pastures following fire establish firebreaks used to control end of dry season wildfires.
The relatively high and reliable summer rainfall often leads to stream flooding, impassable roads and water-logged country. During the equally predictable dry season the streams and lagoons shrink back to the larger water holes. This increasingly congregates the cattle as the -; season becomes progressively drier.
Dry Season Mustering and Stock Control
Mustering is done in 'rounds'. This generally starts as the country dries out after the wet - .
season. Following the wet season, strategic areas are burnt to facilitate mustering and to establish a pattern of firebreaks that will make it easier to control Gld fires later in the year. Land that carries a 'heavy body' of grass is burnt before mustering commences. Cattle are attracted to the resulting green grass growth. It is easy to traverse the burnt country since fallen timber and ground 'break-aways' can be seen.
On many properties, sale cattle which are found during the general muster are sold direct from the yards. On such properties 'weaners' are often used as coachers to facilitate mustering. On a few properties, weaners and sale cattle are paddocked. Paddocking of sale cattle allows much more efficient marketing.
Mustering on unfenced properties that do not implement cattle control strategies is inefficient; 3040% of the cattle are often missed. This leads to a proportion of the herd being l e a n skins' (unbranded) or feral cattle. Occasionally, producers use helicopter musters in some areas if they feel there are sufficient clean skin cattle to pay for the helicopter. Under this system, cattle are often turned off in mixed lines, in which cull cows, bullocks, clean skin bulls, etc are used to 'make up the load'.
Fencing
Strategic fencing is playing an increasingly important role in property management. 'Fences and improved stock control are now recognised as vital to efficient management. Management of improved pastures requires fencing to control grazing pressure' (CYPPAG 1995).
- However, where there are light carrying capacities of the native pastures, fencing for stock segregation is uneconomic (McKeague, 1992). The number of cattle that can be run within a .
fenced paddock cannot pay for the cost and upkeep of the fencing. Boundary fences are seldom erected or maintained in these areas. In joint musters between lessees, the unbranded . cattle are generally divided on heredity lines or according to the individual input to the muster.
...
Extension of fencing is dependent on the economic viability of development programs. .
Strategic fencing is now part of development strategies, however economic appraisal of the complete strategy is a prerequisite before fencing is usually commenced.

Husbandry Practices
Improvement to production and financial returns can be achieved by addressing the on- property stock nutritional and management problems. Boorman (1991) demonstrated a turn- off improvement of over 100% by changing from the traditional animal management to an improved animal management system in which husbandry practices serve an important function.
Boorman (1991) nominated nine husbandry practices to improve management and herd quality. These practices are:
botulism vaccination dehorning breeding your own bulls crossing British herds with Brahman bulls early weaning weaner education molasses based feed wet season phosphorus feeding vibriosis vaccination.
Supplementation
For optimum production in the dry monsoonal tropics, cattle require a soil phosphorus level of 8 ppm or higher (Partridge and Miller, 1991) but only very isolated areas in Cape~York Peninsula have soils above this level. Also, except for a short six to eight week period during the growing season, the native pastures are low or deficient in nitrogen and thus in protein. Supplementary feeding is a viable option on some properties.
The supplementation program currently used by some properties contains phosphorus as Kynofos, nitrogen as urea and sulfur. The ratio of Kynofos to urea is increased during the wet season when the pastures are green, and decreased in the dry season when the nitrogen deficiency becomes more critical. Sulfur is needed to allow production of some proteins (skins, horns, hair) that can only be formed in the presence of adequate supplies of sulfur. Urea does not contain any sulfur, so that sulfur is added to the lick. Protein supplementation is economic only if used in conjunction with wet season phosphorus supplementation and early weaning.
The intake of supplement is regulated by adding salt to give breeders log of phosphorus per head per day and dry cattle 6g of phosphorus per head per day during the wet season. The benefits from adopting phosphorus supplementation will be cumulative over a three yeai period and the full benefits may not be realised until the third or fourth .year. The cost of supplementing (for four years) is about $15 per head per year or $180,000 for a 3,000 head herd. To some producers this is a barrier to adoption (Appendix 6.1 Case Studies) and - options such as the sale of older and additional breeders produced by the supplementation programs are considered.

6.3 Operation and Management System Alternatives
A review of the literature suggests that there is considerable potential for intensification of cattle management in some regions of the Peninsula. While this potential is physically determined primarily by soil type and rainfall, its exploitation is limited by economic constraints. A number of analysts have examined the types and levels of intensification which have been proposed and trialled at least on an experimental scale. The range of views on- desirable levels of intensification are described below.
Management systems used in the Peninsula have been outlined by McKeague and Boorman (undated), Partridge and Miller (1991) and Biggs and Philip (1994). The descriptions of the management systems by these various authors overlap to some extent and only the . predominant types are presented in this report. Importantly, all authors do not have a preferred system that is applicable for the whole Peninsula, and the selection of an appropriate system is determined by individual property considerations.
McKeague and Boonnan Approach
McKeague and Boorman (undated) have described five management systems available to Peninsula graziers. These systems are:
1 Traditional Management All cattle are run on native pasture. Cattle are mustered once a year when calves are branded and castrated and sale cattle are removed.
*" ' - 2 Traditional Management with Sale Cattle or Sown Pastures
The breeders are run under similar husbandry practices as used in system 1. Steers, from weaning, and cull cows are run on sown pastures which have been established by clearing, fertilising and seeding. Maintenance fertiliser is applied every second year. The pasture species that can be used include Brachiaria (Signal grass), Tully grass, Para grass, Verano, Seca, Centro and Glen Jointvetch.
3 Improved Management All cattle are run on native pastures and mustered twice each year. Phosphorus supplementation, early weaning, botulism and vibriosis vaccinations are used.
4 Improved Management with Nucleus of Sown Pastures Breeders are run under similar husbandry practices to those described in system 3. Weaners, cull cows, steers, spayed heifers and weak breeders are run on sown pastures similar to those described in system 2.
5 Complete Herd Run on Sown Pastures The whole herd is run on sown pastures similar to those described in system 2. Husbandry practices are similar to those described in system 3, with the exception of phosphorus supplementation. (Source: McKeague and Boorman, undated)
The standard for comparison between these management systems is a cattle herd comprising 1,000 breeders and their progeny. Male cattle are sold at two-and-a-half years of age with females being sold as cull for age cows or spayed heifers at two-and-a-half years of age.

The results of their investigations are presented in Table 6.1.
Table 6.1. Management System Comparison
Total Herd
Aged cows Steers 2-3 y.0. Steers 3+ y.0. Heifers 2-3 y.0. Total % hun-off
Native Pasture Sown Pasture
2,216 Sale Cattle
64 272 29
143 508 23
Area (ha) 35,460
- Total 36,500 26,970 35,460 19,000 2,180
(Source: McKeague and Boonnan, undated)
McKeague and Boorman's discussion of the alternative management systems highlights the reasons why alternative management systems to the traditional systems should be encouraged. From a cattle production and economic viewpoint, the poor cattle control of the traditional system results in lower turnoff percentages, higher mortality rates, lower calving rates, and poor herd compositions. The aims of the alternative management systems are to rgierse traditional production and economic trends. Turnoff percentages increase, cattle numbers increase, herd composition improves and the area required to support their notional 1,000 breeder herd is reduced.
McKeague and Boorman adopted the following carrying capacities for the alternative management systems:
1 beast to 2 1 ha on native pasture without supplements 1 beast to 15 ha on native pasture with supplements 1 beast to 0.75 ha on sown pasture.
Partridge and ~ i l l e ; Approach
Partridge and Miller (1 991) examined the Cape in two zones:
Zone A - north of Princess Charlotte Bay, 1,200 mm rainfall and over 20 weeks pasture growing season. . .. .
Zone B - Cairns to Princess Charlotte Bay, 800-1,200 mm rainfall and 16-20 weeks . pasture growing season.
These zones are represented on Map 8.
They tabulate the native pasture types in these two zones as follows:

Table 6.2. The native pasture communities found in each zone
Native pasture community
Zone A (Monsoon tallgrass) Pastures sparse or absent Fire grass* Native sorghum
Zone B (Monsoon tallgrass, tropical Fire grass tallgrass, rnidgrass) Native sorghum .
Black spear grass (north) Wirehlue grasses Spinifex
*Schizachyriumfiagile and Chrysopogon fallax
Partridge and Miller (1991) have assessed natural carrying capacities for Zone A between 15- 55 h a e a s t and for Zone B between 4-20 habeast. They also identified three alternative management systems, namely high, medium and low inputs. A description of the inputs to each system and the strengths and weaknesses of these systems are described in Table 6.3 and their distribution is represented on Maps 9, 10 and 1 1.
Table 6.3. Advantages and disadvantages of high, medium and low input pastures
ponded paragrass High quality feed during High capital cost,
High quality during dry Establishment
High carrying capacity, good animal production
Sown legume, native grass, Lower cost than high input Lower carrying
In terms of the comparative cattle production gains of native and improved pastures, Partridge and Miller give the following generalised estimates for the northern (A) and southern @) Peninsula:

Table 6.4. Carrying capacity and weight gains of steers for native and sown pasture in each zone
k g s and Philip Approach
During their investigations for the development of 'Soil Survey and Agricultural Land Suitability of Cape York Peninsula', Biggs and Philip recognised the requirement to assess land based on its ability to support varying levels of pasture development. The categories they used were:
1 High input pastures implies timber clearing, cultivation, fertiliser application and sown , t" pastures -
2 Medium input pastures implies sown legumes, native grasses and fertiliser application
3 Low input pastures implies sown legumes, native grasses and possible phosphorus supplementation
4 Land not currently suitable for the assessed land uses (ie. cropping or improved pastures). It is considered to be unsuitable for support of viable beef production systems on a stand-alone basis, but can be an integral component of grazing systems based on improved pasture
5 Land unsuitable for any agricultural use because of excessive slope, rockiness, flooding or other factors.
These categories are similar to those proposed by Partridge and Miller.
6.4 Production Effects of Management Systems on Regional Production
This report has tabulated ABS statistics of cattle numbers, sales and deaths for the period 1984-1993. This is tabled in Section 5 of this report as Table 5.2. Based on these statistics and data from Appendix 6.2, Boorman @PI Mareeba) has developed a 'hard profile of a herd' in Cook, Aurukun and Torres Shires in 1993. The results are tabled in Table 6.5.

Table 6.5. Estimated Herd Structure in Cook, Aurukun and Torres Shires in 1993*
Total herd in Cook, Aurukun and Torres Shires 130,528 Estimated Adult Equivalents (AE7s) 133,637 Total turnoff 17,113 Turnoff as % of total herd 13.1 1 Estimated % of herd mated (cows and heifers) 49 Estimated number of cows and heifers mated 63,958 * Calculations are based on: (a) Table 5.4 of this report (b) Summary herd structure and turnoff data in Appendix 9.3.
These calculations take account of the fact that some producers are presently using some improved husbandry.
Table 6.6 is the predicted profile of a Peninsula herd if 50% of the adult equivalents in the area in 1993 has been under improved husbandry and what effect that would have had on costs and returns.
Table 6.6. Estimated Herd Structure and Increased ReturnsX
[Assuming Adult Equivalents are held at the same level as in Table 6.5 and 50% of Total 1993 Adult Equivalents are subjected to improved husbandry.]
r .
Adult Equivalents (AE's) subjected to traditional management 66,818 Estimated cows and heifers mated 33,857 .
Estimated cows and heifers sold 1,609 Estimated steers and bullocks sold 6,340
AE7s subjected to improved husbandry 66,s 18 Estimated cows and heifers mated under improved husbandry 26,28 1 Estimated cows and heifers sold 5,837 .
Estimated steers and bullocks sold 7,714
Estimated total cattle sales Estimated turnoff a5 % of total herd Estimated % of herd (cows and heifers) mated
Estimated nett extra value of females sold from herds using improved husbandry $936,150
Estimated nett extra value of steers and bullocks sold from herds using improved husbandry $775,169
l~st imated total nett increased returns $1,711,319 I *Calculations are based on: (a) Table 5.4 of this report. (b) Summary herd structure and turnoff data in Appendix 6.2.

Note: This outcome would require extra expenditure by producers with service industries (licks, fodder, vaccines, transport etc) in the order of $632,000 and would incur extra yard dues, commissions, levies and cattle transport costs (Table 8.3) in the order of $233,000.
Table 6.7 is the predicted profile of a Peninsula herd if 50% of the breeders had been under improved husbandry and it also illustrates the effects on stocking rates, costs and returns.
Table 6.7. Estimated Herd Structure and Increased Returns*
[Assuming 50% of 1993 Estimated Breeder Numbers in Aurukun, Torres and Cook Shires (Table 6.5) are subjected to improved husbandry and Adult Equivalents are allowed to increase accordingly. *]
Estimated cows and heifers mated under traditional management -. 3 1,979 Estimated Adult Equivalents in traditional herds 63,078 Estimated cows and heifers sold 1,5 19,- Estimated steers and bullocks sold 5,985'
Estimated cows and heifers mated under improved husbandry Estimated Adult Equivalents under improved husbandry Estimated cows and heifers sold Estimated steers and bullocks sold
Estimated total cattle sales Estimated turnoff as % of total herd
Estimated % of herd (cows and heifers) mated 43 Estimated nett extra value of females sold from herds using improved husbandry $1,218,000
Estimated nett extra value of steers and bullocks when sold from herds using improved husbandry $1,388,192
Estimated total nett increased returns $2,606,192 I * Calculations are based on (a) Table 5.4 of this report (b) Summary herd structure and turnoff data in Appendix 9.3.
- Note: This outcome would require extra expenditure by producers with service indust'ries in the order of $877,000 and would incur extra yard dues, commissions, levies and cattle transport costs (Table 8.3) in the order of $365,300.
Analysis of these tables highlights that the technology is available that will assist graziers to increase herd size, increase turnoff percentages and sales and to improve 'herd composition. Implementation of these strategies, and in this example, improved husbandry practices, will ,
result in substantial increases in cattle numbers and substantial increases in returns.

6.5 Production Effects of Management Systems on Property Production Levels
An economic analysis of the alternative management systems is presented in Section 7 of this report. Cost factors largely influence the system selected.
From a pastoralist's perspective, the selection of the management system suitable for individual properties is determined by:
property owner's aspirations capability of the land financial capacity market analysis location.
However, Boorman has attempted to predict what the effects of improved management practices will have on property herd composition. His predictions are presented in Table 6.8 and they demonstrate that implementation of improved management practices can assist in overcoming major Peninsula production impediments, namely low turnoff percentages, high death rates, low brandings and low calving breeding rates.
Table 6.8. A comparison of the results of traditional management and improved management in Cape York herds
eder death rate % Number of bulls
Annual dry cattle death rate %
Yearlings (female breeding) Yearlings (female culls) 2-year-old heifers mated 2 1/2-year-old store steers (sales) 2 112-year old cull heifers (sales) Number of 10-year-old cows culled (sales)
Turn-off as % total herd Total effective herd*
* Total effective herd consists of: breeders to 10 years of age, calves, bulls, yearling steers,

6.6 Land Suitability and Alternative Management Systems -
This report accepts departmental opinion that outlined management systems are capable of increasing production. The potential of implementing the various systems now needs consideration. Our assessment of this potential for pastoral expansion relies on the investigations completed by Biggs and Philip where they assessed the Agricultural Land Suitability of Cape York Peninsula categorising the lands of the Peninsula into suitability for - peanuts, sorghudmaize, and three pasture improvement categories. Pasture improvement , categories assessed were for low input, high input and medium input pastures. These pasture categories are similar to those presented by Partridge and Miller.
The principal outcomes of this investigation with respect to management strategies are that the .
assessment indicated the following areas were suitable for:
peanuts and sorghudmaize (243,300 ha) sorghudmaize (1,s 12,000 ha) high input pastures (3,445,300 ha) low/medium input pastures (4,448,400 ha).
Also, Biggs and Philip have assessed that the high input pasture area contains:
'(i) 392,750 ha suitable for the assessed cropping systems of peanuts or sorghum and maize (representing 11% of the area suitable for high input pastures) and -
(ii) 3,363,050 ha suitable for low and medium input pastures (representing 98% of th9area suitable for high input pastures).
(iii) 58,800 ha is suitable for high input pasture ONLY which is due to limiting factors within the suitability framework'.
Based on this information @PI 1995), substantial physical potential exists for the development of all of the alternative management systems proposed, although their profitability is not guaranteed.
6.7 Implementation of Alternative Management Systems
Boorman (1991) identified a number of the constraints that impede the implementation of alternative management systems. Boorman suggests to pastoralists that:
'Making changes to an existing system is always difficult. To change a property management system you must attack a three-fold problem. Firstly, steer your thinking away fiom'the old, - comfortable ways and habits. Secondly, learn as much as possible about the new practices and choose those that will work best for you in your situation. ' Commit yourself to making the changes and applying the practices. Thirdly, organise your finances to hnd the changes.
It is possible, but expensive, to implement all of the practices in one year. Staging the program makes it affordable. The practices in each successive stage will generate enough profit to start the new one.'
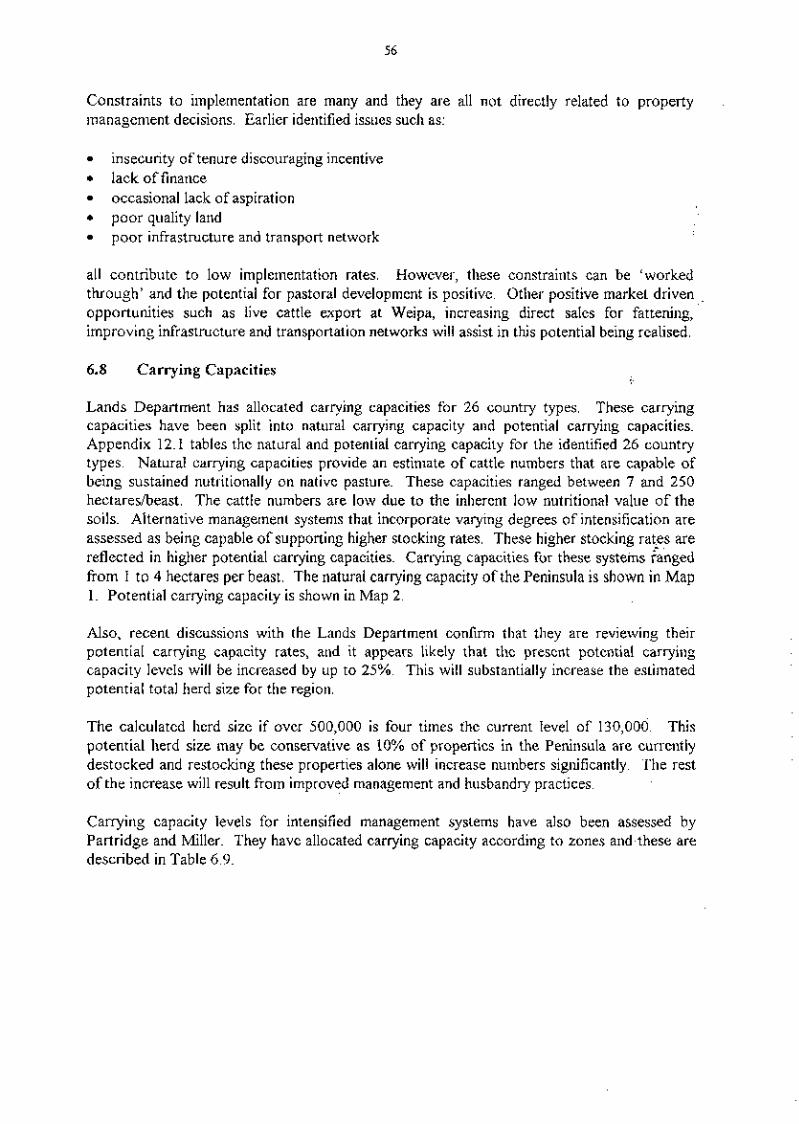
Constraints to implementation are many and they are all not directly related to property management decisions. Earlier identified issues such as:
insecurity of tenure discouraging incentive lack of finance occasional lack of aspiration poor quality land poor infrastructure and transport network
all contribute to low implementation rates. However, these constraints can be 'worked through' and the potential for pastoral development is positive. Other positive market driven ,
opportunities such as live cattle export at Weipa, increasing direct sales for fattening, improving infrastructure and transportation networks will assist in this potential being realised.
6.8 Carrying Capacities ,-.
Lands Department has allocated carrying capacities for 26 country types. These carrying capacities have been split into natural carrying capacity and potential carrying capacities. Appendix 12.1 tables the natural and potential carrying capacity for the identified 26 country types. Natural carrying capacities provide an estimate of cattle numbers that are capable of being sustained nutritionally on native pasture. These capacities ranged between 7 and 250 hectaresheast. The cattle numbers are low due to the inherent low nutritional value of the soils. Alternative management systems that incorporate varying degrees of intensification are assessed as being capable of supporting higher stocking rates. These higher stocking rates are reflected in higher potential carrying capacities. Carrying capacities for these systeins ianged from 1 to 4 hectares per beast. The natural carrying capacity of the Peninsula is shown in Map 1. Potential carrying capacity is shown in Map 2.
Also, recent discussions with the Lands Department confirm that they are reviewing their potential carrying capacity rates, and it appears likely that the present potential carrying. capacity levels will be increased by up to 25%. This will substantially increase the estimated potential total herd size for the region.
The calculated herd size if over 500,000 is four times the current level of 130,000. This potential herd size may be conservative as 10% of properties in the Peninsula are currently destocked and restocking these properties alone will increase numbers significantly. The rest of the increase will result from improved management and husbandry practices.
Carrying capacity levels for intensified management systems have also been assessed by Partridge and Miller. They have allocated carrying capacity according to zones and.these are described in Table 6.9.

Table 6.9. Carrying capacity for native and sown pastures --
From a purely pastoral production viewpoint, an estimate of the potential herd size i's possible if these potential carrying capacities are matched to the DPI suitability assessments. These details are presented in Table 6.10.
Table 6.10. Potential Cattle Numbers
2,871,083-3,445,300 Land suitable for medium
and low input pastures 1,112,100-2,224,200 Land suitable for low
intensity grazing of native 11 1,783-1,537,025
However, a more usefbl assessment involves the use of the DEH vegetation database and the Lands Department's carrying capacity database. Viability of holdings has been computed and mapped. Pastoral holdings have been classed as viable (over 4,000 head c.c.), makinally viable (3,000-4,000 head), non-viable (below 3,000 head) and presently not managed for grazing (National Parks and Aboriginal land). The existing carrying capacities and potential carrying capacities have been mapped on the GIs as shown in Maps 5 and 6. These maps are of particular significance in planning the hture of the Peninsula's pastoral industry. The .
existing and potential capacities of each lease are shown in alphabetical order in Appendix 6.3. This appendix demonstrates that the existing carrying capacities can support a herd size of 182,308 and potential carrying capacity can support a herd size of 539,813.
These calculations have not taken into account areas designated as "unavailable". This designation was allocated due to the unavailability of information and relates principally to '
DOGIT lands. Industry sources have estimated that upon "A quick review of Pormpuraaw, Aurukun, Lockhart River, Weipa, Old Mapoon, Kowanyama, Hopevale, the Northern Aboriginal Reserve areas will show that they total 2,436,910 hectares and have an unimproved carrying capacity of 70,495 cattle."

The addition of these figures to the other estimates and comparing these figures with actual population, suggests that a deal of underutilised capacity exists within individual properties and the regions as a whole.
Types of assessments such as those completed in this section are usefbl for generalised analysis. However, they oversimplify a more complex picture because of sometimes overriding factors of:
market expectation tenure infrastructure support landholder aspirations distribution of land types.
Our analysis of the carrying capacities is that they should be assessed on an individual property basis which can take into consideration some of these determining factors. The 'ball park' estimates could vary up or down depending on the factors and these could vary &th time. Carrying capacity figures exhibit a degree of variance and it appears that fbrther research is required to confidently predict sustainable levels.
The identified potential carrying capacities are of concern to the conservation sector. They consider that expansion of the industry to this extent will 'be an environmental disaster' due to the fragility of the Peninsula's environment. However, based on investigations and observations completed by the Departments of Lands and Primary Industries, the authors of this report support these Departments' views that carrying capacities are capable of being increased. The increase will not result in accelerated degradation levels provided th& the increase in herd size is well planned and occurs slowly to avoid overstocking of controlled areas in the initial stages of the process.
The issues of fragmentation of conservation and cultural areas are not directly related to the potential carrying capacities issues. This section of the report identifies the potential carrying capacity of the region. Other factors such as fragmentation may reduce the amount of land that support beef cattle production.
6.9 Constraints and Opportunities
An analysis of the production data supports the view that the basic land resource of the Peninsula is physicdly capable of sustaining an expanded pastoral industry. However, the structure of the pastoral industry of the'fbture would be different to the present structure.
Based on the data reviewed, past industry structures have been characterised by:
marketing arrangements whereby the producers are price takers (at Mareeba) remoteness a lack of control in herd management and poor musterability grazing of nutritionally deficit pastures that are poorly watered despite reliable rainfall poor infrastructure support, reflected by high input costs and poor transportation networks lack of finances to institute changes/improvements to management changing tenures of pastoral leases.

These are progressively changing. Marketing arrangements are more diversified with an increasing number of sales occurring outside the Mareeba saleyards structure, constraints associated with remoteness are being overcome by improving roads and telecommunications, and putting in place cattle management systems have been developed to improve cattle control and production levels.
These changing features have impacted on the production levels to the stage where it appears '
that properties adopting traditional management systems and are filly stocked, are not capable ' of significantly increasing production levels. Some of these properties are presently losing money under present management and are being supported by outside income. A majority of pastoralists are implementing alternative management strategies of production. Their levels of .
production are progressively increasing as they adapt to changing markets and improving technology.
The key to production sustainability for the industry in the Peninsula is its ability to introduce alternative management-systems. Extreme bio-physical constraints of some areas make this impossible, and consequently difficult to break the poor performance cycles. Poor quality pastures and/or remoteness predominate these areas, making it difficult to change management on existing property configurations. However, technological advances in management systems have provided the management framework to develop change. Management systems of varying degrees of intensification have been investigated and trialled. These have been demonstrated to be capable of increasing production levels provided the findamental bio- physical resource is available. Logically, the first step in the development process is the 'on property' identification of land suitable for some form of intensification. This process should take into account environmental and cultural considerations. Secondly, a f inanc ia~~~lan describing and assessing the development proposed should be formulated. This plan will take into account the issues of the existing financial position of the pastoralist, the cost-benefit of the development and the aspirations of the pastoralist. The successfil completion of this phase is not to be considered in isolation of the other constraints identified.
This report considers that a managed, incremental introduction of the proposed changes is more likely to produce sustained positive impacts. A managed intensification in areas suitable for development resulting in better cattle control, better disease control and reduced weed infestation will enable the Peninsula's environment to support a managed increase in' cattle numbers. Unbridled and quick changes to cattle numbers resulting fiom unmanaged development strategies such as wholesale clearing and degrading stocking rates are not supported by this report. These options may be justified on economic grounds, however, the sustainability of these changes need to be assessed and monitored progressively.

7 ECONOMIC PERFORMANCE
7.1 Regional Performance
The Centre for Applied Economic Research and Analysis (CAERA) has estimated the Gross Regional Product at factor cost of ~najor industries in the Aurukun, Cook and Torres Shires. The analysis shows the contribution of each industry sector over time in terms of its-. percentage contribution to total output. These data, compiled for 1985186 and 1991192, are.' presented in Table 7.1.
Table 7.1. Estimates of Gross Regional Product at factor cost of the Cape York region, which consists of the Shires of Aurukun, Cook and Torres
[1985-86 and 1991-92 in current prices $ million]
0.2 = 11 1.6 (57.7) 0.0 =156.6 (5 1.6) - -
Electricity, gas & water
Wholesale & retail trade Transport & communication 7.9 Finance & business services 1.3 Public administration &
community services Recreation, personal &
Ownership of dwellings General governmetit 2.8 =72.5 (37.5) - 4.2 =130..6 (43.1)
Total GRP at factor cost
* Pastoral Project Calculations ** Sector Percentage of Total GRP (Source: CAERA 1994) Note: GRP - is a measure of regional activity which includes expenditure on goods and services produced in the region and sold to consumers in the region, plus the value of exports produced and sold by the region, less imports purchased by the region.

A general analysis of these statistics show the following:
(i) the statistics do not incorporate Carpentaria sections, a major cattle area of the region - departmental and statistical estimates suggest that the Carpentaria produces 30-50% of the region's cattle
(ii) within the sectors, agriculture produces 5.3% of total GRP, with livestock producing 2.4% : of the total GRP
(iii) the mining sector produces 5 1.6% of total GRP
(iv) the service sector supporting the production sectors produces 43.1% of total GRP
(v) the fastest growing industries in the 85/86 to 91/92 period, in order of growth, were:
silica mining (2 14%) finance and business services (1 69%) recreation, personal and other services (153%) crops (133%) public administration and community services (95%) livestock (85%) ownership of dwellings (84%) wholesale and retail trade (82%)
(vi) apart from silica development, the fastest growth in production industries is taking plpce in agriculture. Additionally, the actual growth rate for livestock industries is probably higher than indicated due to the statistics not incorporating Carpentaria - an area suited to livestock production
(vii)industries servicing the main wealth-generating industries grew at rates ranging from 14% to 28%.
7.2 Regional Economic Multipliers
Background
Related economic multipliers have been computated to assess the effect of changing pastoral industry income levels. The methodology adopted for this section of the economic analysis is presented in Appendix 5.1. Multipliers measure the impact of a unit increase in final demand on variables such as output, income and employment, and are usually a measure of responses to economic stimuli introduced into the system. Two types of multipliers are normally- reported:
(i) one measuring the combined direct and indirect effects for that additional sale from a particular industry across all other industry categories
(ii) the other measuring these effects in addition to those which result from the flow-on to consumer spending at the household level.

In accounting for the induced household income effects, a fixed pattern of consumer spending is assumed. It is considered convention that these latter milltipliers are maximum estimates.
The computation of multipliers requires extensive data, and as such they are usually available only for broader statistical divisions. The industry sector for which data are available is the 'animal industries', which includes the Australian Standard Industrial Classification Sectors of sheep, meat cattle, milk cattle and pigs. These four animal sectors are not equally representea; in the Cape, although the multipliers discussed below refer to these in aggregate.
The Far North Statistical Division
The Australian Bureau of Statistics, Statistical Division No. 34, the Far North, includes the. majority of the area under investigation, but it also extends over a similarly large section south of the 16"s. A map delineating these boundaries is attached as ~ ~ p e n d i x 7.1. Caution needs to be exercised in interpreting this divisional data, in the light of the different activities practised in the two sections of this Statistical Division, viz. north and south of the t6"S. The more intensive agricultural activities including the fruit and vegetable industries, and a concentration of tourism activities in the southern half of this Statistical Division inflates the estimated gross regional product prospects beyond that attributable to the concentration on pastoralism in the north. Nonetheless, the share of agriculture, forestry and fishing in the gross regional product for this Division is nearly twice the national share for these industries (9 percent vis-a-vis 4.7 percent on a national basis).
The Far North Division has been ranked number seven (from the 56 Divisions across Australia) in terms of projected average annual gross regional product for the period 1992193 to 2000101, with a projected average annual growth rate of marginally over 4%. For comparison purposes, the highest ranked is the North West (Queensland) Division (4.7 percent); the Darling Downs Division at 3.3 percent and ranked 37th; and the Central West (Queensland) Division ranked lowest at 2.7 percent. The Far North (Queensland) Division is identified in terms of primary industry intensity, as middle-range with strong growth prospects. In addition, the Far North (Queensland) Division is characterised as having a mid-range export intensity. The share of the region's output which is exported abroad occurs in the range of 10 to 15 percent.
Regional Multipliers
Four multipliers will be discussed, viz. disaggregated value-added multipliers, disasgregated output multipliers, disaggregated income multipliers, and disaggregated employment multipliers. These multipliers have been compiled by Jensen et nl. (1994).
Table 7.2 identifies both the incremental and total effects of multipliers in the Far North* Division.

Table 7.2. Disaggregated value added multipliers(a) far north: animal sector
Animal 0.544 0.002 0.546 0.547 I Machinery Manufacture 0.000 0.044 0.044 0.045
Elec. Goods 0.000 0.006 0.007 0.01 1 Trade 0.000 0.016 0.019 0.053 Transport 0.000 0.013 0.015 0.023 Finance 0.000 0.007 0.010 0.035 Public Admin 0.000 0.005 0.006 0.012 Community Services 0.000 0.004 0.005 0.03 1 Entertainment 0,000 0.001 0.001 0.014 Multiplier 1.000 1.224 1.460 Notes: (a) Based on 1990 data. (Source: Jensen et al. 1994)
Analysis
The industry multiplier of 1.224 indicates that an additional output of $1.22 has been created across the industrial economy of this division, ie. an additional effect of 22 cents attributable to the initial one extra dollar of animal sales. The machinery, manufacturing, trade (wholesale, retail and repairs) and transport sectors provide services to the animal sector in its proddction of additional output. The other-mentioned sectors, eg. electrical goods, finance, public administration, community services and entertainment contribute to a lesser extent. The industries benefiting most from the additional household consumption are the trade industries, finance and community services, with the entertainment industries capturing some flow-on.
Table 7.3 lists selected data on disaggregated output multipliers for this statistical division.
Other Agriculture - Food Manufacture
I Machinery Manufacture Electrical Goods Trade Transport Finance Public Administration Community Services Entertainment Multiplier 1.242 1.478 Notes: (a) Based on 1990 data. (Source: Sensen et al. 1994)

Analysis
The multiplier 1.242 points to a 24 cent increase in output across all other industry sectors needed to accommodate a one dollar increase in sales from the animals sector. The major industry sectors contributing are listed, with the trade sector and transport expanding by some four and two cents respectively to provide for the additional one dollar of output from the animal sector. When the household consumption sector is included, an additional 24 cents of- consumption is drawn upon in bringing forth the initial one dollar of sales to final demand.. This additional consumption is expended in the food manufacturing, trade, finance, community' services and entertainment sectors, and results from the increased output providing krther household income.
Disaggregated income multipliers for selected sectors are listed in Table 7.4.
Table 7.4. Disaggregated income multipliers(a) far north: animal sector
Animal Machinery Manufacture Trade Transport Finance Public Administration Community Services Entertainment Multiplier 1.242 1.503 . I Notes: (a) Based on 1990 data. (Source: Jensen et al. 1994)
Analysis
For an increase in sales to final demand by the animal sector of one dollar, household income to the animal sector increases by $0.3 1. The machinery manufacturing sector benefits,.by about three cents, and the trade and transport sectors by about one cent each. The trade, finance and community services sectors benefit most from the flow-on, with transport, public administration and entertainment deriving some benefit. In all, the multiplier of 1.503 -is quite low; the additional one dollar of sales: to final demand, while producing $0.3 1 of additional household income to the animal sector, produces only $0.16 of additional income elsewhere.
Selected disaggregated employment multipliers are presented in Table 7.5.

Table 7.5. Disaggregated employment multipliers(a) far north: animal sector . .
Animal Machinery Manufacture Trade Transport Finance Community Services
I
Notes: (a) Based on 1990 data. (Source: Jensen et al. 1994)
The type I1 multiplier, 1.428, points to an additional four+ employees being taken up elsewhere in the local economy for each additional ten persons employed in the animal sector. $1 million of additional sales in the animal sector requires one extra person employed in the machinery manufacturing sector and one in the trade sector. This additional employment in these sectors induces additional employment in sectors supplying into household consumption.
7.3 Regional Economic Multiplier Effects
Changes to management systems result in changes to input cost structures and these chnges affect the wider community through multiplier effects. Changing input costs will result in:
(i) changing investment expenditures by farmers which will affect demand for some non- fm goods and services, with subsequent multiplier effects
(ii) changes to intermediate inputs used in the farm sector which will affect demand for goods and services in the non-farm sector, with subsequent multiplier effects
(iii)changes to some non-farm household income will be affected by changes in the value of farm production, with subsequent multiplier effects.
In the Peninsula, the continuation of existing production systems that develop on low or reducing input costs and low or reducing turnover, restrict wealth-generating enterprises resulting in a constriction for the industry and subsequently a constriction in allied industries and the wider regional economy. With industry multipliers in the order of 1.2 to 1.4, a reduction in money spent within and outside the industry will have a flow-on effect. A- reduction to the present $16.2M earned by agricultural industries, compounded by any W r e income loss incurring opportunity costs for the industry, will result in a multiplied loss-.to the wider community.

Alternatively, a managed expansion of the industry will generate wealth within the industry, but also it will generate multiplied wealth in allied industries and the wider regional economy. Any expansion of the industry is likely to result in an expansion of the associated industries of trade, transport, communication and machinery. The extra income generated by these industries will generate multiplied wealth-generation in the wider community.
7.4 Economic Analysis of Existing Management Systems
An assessment of the economic health of the current industry is difficult to accurately complete on a regional basis. Detailed individual property appraisal would be required as a wide diversity of management systems are implemented throughout the Peninsula, biophysical attributes vary significantly and access to market varies. A more usekl approach is the '
assessment of the main management systems implemented throughout the Peninsula. Management systems assessed include the traditional husbandry, improved husbandfy and the various input pasture systems. This assessment relies on data emanating from the DPI's economic models BREEDCOW and DYNAMA, run on actual data from many properties in the Peninsula. These data have been generalised to assess the actual costs and additional revenues for low- input systems. Appendix 6.2, BREEDCOW and DYNAMA Calculations and Findings, are summaries of typical property situations. Analysis of these summaries are developed on a management system proposed by Boorman and Miller. These summaries compare the present traditional system with a number of other systems in terms of:
gross margin analysis variable costs comparison expected changes in production indices (eg. mortality rates, breeder sales and so on) 5 development debt levels nett cash flow.
The actual costs and returns from the present traditional system of uncontrolled stocking are compared to the expected costs and expected returns with the more controlled and highly managed systems of Boorman (1994). Their proposed system relies principally on improved animal husbandry practices for improved cattle control. A summary of their findings is detailed in Table 7.6 and property case studies are presented in Appendix 6.1.

' . Table 7.6. Comparative economics of three production systems
2, L
Production Indices Variable costs( l X2) Fixed ~ o s t s ( l X ~ ) Family Expenses Management Female Death Male Death Branding 1993 ' 1994 1996 2000 2003 1993 1994 1996 2000 2003 1993 1994 1996 2000 2003 System (Annual %) (Annual %) Rates (%) (1,000 breeders)
Present traditional 5-15 5-7 45 16,000 16,000 16,000 16,000 16,000 55,000 55,000 55,000 55,000 55,000 15,000 15,000 15,000 15,000 15,000
Improved husbandry
(limited breeder sales) 3.5-8 3.5 65 16,000 46,144 37,077 37,192 37,270 55,000 55,000 55,000 55,000 55,000 15,000 15,000 15,000 15,000 15,000 Improved husbandry
(increased breeder sales) 3.5-8 3.5 65 16,000 43,464 32,761 36,277 37,256 55,000 55,000 55,000 55,000 55,000 15,000 15,000 15,000 15,000 15,000
Tuxnoff % Cash Flow (from cattle trading) Net Cash Flow (for debt service) Total Debt
Present traditional 85,233 85,233 85,233 85,233 85,233 (767) (767) (767) (767) (767) 0 853 853+ 853+ 853+
(indicative only) (indicative only) (indicative only) Improved husbandry higher % turnoff 85,233 85,099 159,539 159,797 166,564 (767) (31,046) 52,462 52,606 59,294 0 853 (15,616) (152,303) (289,344)
(limited breeder sales) Improved husbandry higher % turnoff 85,233 121,134 150,351 137,356 167,332 (767) 7,669 47,590 31,078 60,077 0 853 60,839 (140,595) (324,733)
(increased breeder sales)
(I) All costs measured at 1993 dollar values L
(2) Additional variable costs for change comprise of: botulism vaccination, dehorning, early weaning, molasses, phosphorus feeding, vibriosis vaccination. (3) Fixed costs of horse feed etc, helfiubricants, gadavgas, wages, cartage, mustering contracts, insurance, irrigation, Queensland transport, protective clothing, rcpairdmaintenance,
royalties. saddlery, poison, accountant fees, donations, papers, ratedrent, subscriptions, telephone, workers compensation, bank charges, dog maintenance, sundries.

7.5 Traditional Husbandry Management System
Traditional husbandry is generally characterised by:
use of native pastures and natural watering points no stock segregation high breeder mortality (16%) high weaner mortality (5-40%) low calving (45%) low mustering efficiency low turnoff percentages.
McKeague @PI 1992) explains the cost structures associated with the traditional system:
'A consideration of the property case operating costs including the costs of transport and selling stock demonstrates the financial bind associated with the low productivity in Cape York Peninsula. For example, a family owned property in the Archer to Wenlock River area (646 km to Mareeba saleyards), the average sale liveweight of the cattle is 420 kg, the average sale price is 85ckg and the cattle are transported in a hired semi-trailer. The cash operating costs of this property are tabulated in Table 7.7.
Table 7.7, Selling costs and farm gate returnhead
The cash living and operating cost for a family in this situation is about $40,00O/year. Some 152 head are required to be sold to meet these costs. At 15% turnoff, a herd of 1,000 head is required to produce these cattle.
When paid labour has to be used and mustering costs are $15 to $30/head, the farm gate return fiom 1,000 head will finance two musters per year. This leaves little or no income to cover other costs.
The off-property work which has to be:done to survive in this region leads to less work being done on the property and makes property development slow if not impossible.'
McKeague's findings are supported by modelling exercises completed for this project. DPI *
modelling highlighted that traditional systems are running at a small profit,. with little surplus to service loans and property development. Gross margin analysis confirms this conclusion. Gross margins for the traditional husbandry system are tabled below:

69
Table 7.8. Gross margins - traditional husbandry
Bull replacement and husbandry
Table 7.8 suggests a gross margin of $69,223 before interest. With fixed costs in the order of $55,000, properties of 1,000 breeders using traditional management systems are making about '
$14,000 per year. Additional outside income is needed to suppoG the property should the owner be servicing a loan or wishes to fund property development.
7.6 Improved Husbandry Management System
The proposed change in management improves the production indices. However, in order to introduce these changes, input costs are higher. A comparison of some input costs increases are presented in Table 7.9.
Table 7.9. Cattle enterprise costs
The improved husbandry management system results in between 1 and 3 years of negative cash flow, depending on the attitude of the pastoralist to selling breeders. Negative cash flow can be avoided by selling surplus breeders in the first 3 years. The present reluctance to sell breeder cattle results in higher debt levels for longer. ' This is a major decision ibr the pastoralists and it is influenced by assessments of seasonal forecasts, price fluctuations, personal aspirations and stage ofbreeder number buildup following BTEC. By years 5 to 7, positive cash flows-can be achieved without reducing turnoff through fewer deaths and high branding rates due to improved herd management and herd quality.
The magnitude of the debt incurred to improve management of a 1,000 breeder herd property is up to $50,000. Levels slightly higher than this could be expected due to time lags in cattle sales and monies recovered.
The overall financial position of the property 'turns around' significantly after year 1 or year 3, '
depending on breeder sale attitude and seasonal conditions. The magnitude of the improvement is significant with debts being converted into profits after the transitional stage. These profits are in excess of $100,000 after year 7. The gross margin for the improved husbandry system is $96,48 1, producing a positive cash flow (see Table 7.10) after interest.

Table 7. LO. Improved husba11dr-y systems -
$/Herd $/Beast $/A.E. *
Net cattle sales $173,141 $74.65 $76.0 1 Direct costs excluding bulls $ 36,489 $15.73 $16.02 Bull replacement and husbandry $ 8,171 $ 3.52 $ 3.59
Cattle Gross Margin $128,48 1 $55.40 $56.40 Cattle Gross Margin after interest $ 96,481 $41.60 $42.35
* Animal equivalent
Introduction of these management changes is not without risk and the figures presented reflect cash flow predictions before interest. Should the interest on the loan be high, the level of debt would have to be re-assessed. Gross margin of the improved husbandry system is $128,481, producing a positive cash flow. ' I - .
7.7 Pasture Systems
Partridge and lMiller have identified a number of pasture management systems and these are described in Table 7.1 I .
Table 7.11. Management systems and operations
pastures Medium input Sown legumes, native grasses and fertiliser application Low input Sown legumes, native grasses and possible phosphorus
supplementation (Source: Partridge and Miller 199 1)
A review of the economics of implementing the various .management systems is difficult. to complete on a regional basis and is better performed on a property by property basis. The economics of the development process will vary with the quality of soil, vegetation type, biodiversity assessment, and access to market. However, in an attempt to illustrate the scale of the costs involved for the different 'systems, the following regionalised development costs are included. moreo over, more specific property case studies have been analysed; property case studies are presented as Appendix 6.1.
Regional Pasture Development Costs
Costs involved in establishing pastures are significant. The decision to develop pastures needs .
to be considered in light of this cost factor. Partridge and Miller (1991) give the following view of hnding of improved pastures, using the high lending rates of 199019 1 :

'Cash on hand and cash-flow are obvious major factors in investment planning. A project may appear profitable but cash reserves and the existing cash flow must be able to fund the development until the benefits begin to roll in.
Funds for development can be from own cash reserves, borrowings or from equity partners, or combinations of each. The cost of funds will be interest charges where funds are borrowed, lost income from alternative investments where own reserves are used, and a loss of equity: where outside investors are introduced as partners.
In addition to their establishment costs, improved pastures oRen need hnds for livestock capital because they affect herd composition and herd size. For example, where turnoff cattle are congregated on small areas and are sold younger, country previously used for them can be '
used for breeders. This increased capacity can be met by buying breeders or by keeping heifers.
Whether funds are borrowed or are from own reserves, their cost is high. Lendingrates for the agricultural sector from normal commercial sources range from 20 to 24% (1980's rates). Bank interest on deposits can be as high as 18.5%. At these rates, the cost of funds becomes a major consideration when evaluating pasture development although taxation levels may have to be considered.
At 22%, a pasture development which costs $200 per beast area and is hnded from borrowing will need an annual profit of $44 to cover interest costs from development alone. b n top of this, interest on working capital, interest on livestock capital, and a return on labour, starting capital and management have to be earned. . r '
It is rarely economical to borrow funds for pasture development. This has traditionally been done with profits from the existing operation.'
Partridge and Miller (1991) sum up their comparison of pasture establishment options by listing the relative costs, time to earn a return on investment (lead time) and predicted carrying capacity as follows:
Table 7.12. Comparison of systems of pasture establishment
Fire, seed 5 0 4 2.5 Fire, partial cultivation, seed 50 3 2.5 Tree pulling, fire, seed 100 2 1.5 Tree clearing, fire, stick raking, fire, I plough, seed 250 1 1.0 1. "excludes cost of fertiliser, fencing, water and extra cattle.

Pasture improvement changes annual production costs. The effect of congregating cattle allows for easier mustering and cattle control. Mustering costs on native pastures range from $6 to $25 per beast, thus impacting on profitability. Mustering costs on improved pasture varies from $ 1 to $4.25 per beast. Balancing the reduced mustering costs, the maintenance costs of fertilising pastures are high, costing about $1 1.25 per hectare annually. Phosphorus supplements, costing $8-10 per beast per year are cheaper and can be used where phosphorus is the only major nutrient in short supply.
Partridge and Miller also assessed typical annual production costs for the different systems, and these are represented in Table 7.13.
Table 7.13. Typical annual production costs ($/head)
Partridge and Miller have compared costs for the different systems and this is presented as Table 7.14.
Table 7.14. Comparisons between sown pasture systems i
pull 40 rake 80 plough x 2 100 fertiliser - 40 kg P 160 seed (including 2 kg grass) 3 Total 420
Medium input (1,045 ha) pull 40 '
fertiliser - 10 kg P 40 seed (including 2 kg grass) 2 Total 110
4 ...
2 Minimum input (645 ha) fertiliser - 10 kg P 40 seed 3 0 -
70

Shaw and Kernot (DPI 1992) have also compared costs for different systems. Management associated with each of these systems varies from Partiidge and Miller's systems in that their medium input system involves chain pulling of trees and the exclusion of cattle for 12 to 18 months to build-up he1 for a hot clean-up fire.
Shaw and Kernot's costs are estimated as dollars per beast area and at dollars per hectare. Comparative costs are tabled as Table 7.15.
Table 7.15. Comparisons between sown pasture systems
I Low input Medium input
1 ~ i g h input- 300 200 I (Source: Shaw, K and Kernot, J., DPI, Mareeba, 'Sown Pastures in the Dry Tropicsof North Queensland: 1. Northern High Rainfall Area (> 1200 mm)' .
Further to these development costs, ABARE have assessed prices paid for production input costs. This assessment based on ABARE data over the decade ending 1993, highlights a number of points:
(i) average total prices paid increased by an indexed factor of 5.44 (ii) relative indexes of input prices paid on:
fodder and feedstuff 4.13 store and breeding stock 3.38 fertiliser 5.77 fuel and lubricants 5.79 labour 5.42 freight outwards 5.07 selling expenses 5.08 total marketing 5.06.
These indices indicate that fuel, lubricants and fertiliser inputs are increasing at a faster rate than other inputs. This variable rate of price increase of selected inputs could impact on the selection of pasture system chosen by pastoralists, especially those with mimimal capital backing. -
High and Medium-Input Pasture Systems
In order to evaluate the biophysical potential of high-input pastures on a geographical (and -
thus total area) basis, it is necessary to extract areas of high agricultural potential fiom the GIs system developed by CYPLUS. Map 11 shows the areas of the Peninsula suitable for high- input pastures.
An assessment of the high and high-to-medium-input pasture systems relies on the detailed investigations completed by P. McKeague, as presented in the DPI publication 'The Cattle Industry of Cape York Peninsula', for the Batavia Downs property. The full economic analyses of this section of this report are presented below to avoid any misrepresentation:

'Batavia Downs was a Department of Primary Industries pastoral grazing lease in the Weipa hinterland. In 1989 it was completely destocked under BTEC and most of the structural improvements were in a poor state of repair. In this state, it presented an opportunity to assess the viability and cost of establishing a cattle property using this production technology.
Management objectives
The property development was designed to meet the following management objectives:
maintain a branding rate of 75% or better limit death rates: weaners 5%; steers and heifers 2%; breeders 4% maintain annual live weight gain of steers: 140 kgha and heifers 120 kglha maintain segregation between stock classes educate weaners contain labour costs. maximise marketability presewe and respect the environmental integrity of the area.
The following structures, pastures and husbandry practices are designed to meet these objectives:
To maintain branding rate at 75% or better heifers run on sown pastures from weaning until they wean their first calf after weaning the first calf, all breeders run on native pasture with phosphorus supplements heifers without a calf at first calf weaning culled , - r ,
supplement sheds provided at 1 shed/125 head twicelyear weaning heifers run on low input sown pastures with phosphorus supplements heifers mated to calve in November (predicted break in dry season) heifers and bulls vaccinated against vibriosis.
Control death rates early weaning high input pastures for weaners all stock fed phosphorus supplements meal and non protein nitrogen supplements fed to weaners high input pasture for hospital paddock heifers run on low input sown pastures until first calf is weaned inoculation for botulism.
Maintain live weight gain of steers and heifers steers and heifers run on low input sown pastures with phosphorus supplementation.
Stock segregation 4 breeder paddocks (4,000-8,000 ha) 10 steer and heifer paddocks (500-800 ha) 5 weaner, horse and hospital paddocks (25-75 ha).

Weaner education weaners fed in yards for 10 days weaners given hrther handling while run on intensive pasture for 6 weeks.
Contain labour costs use of dams with trap yards in the breeder paddocks Wenlock River not used for watering cattle property boundary fenced. This would not be necessary if the neighbouring land were being used for similar types of grazing 2 sets of cattle yards cattle requiring regular handling eg. weaner, first calf heifer, sale cattle run at higher stocking rates sown pasture, higher stocking rate areas adjacent to yards areas unsuitable for grazing fenced out.
Maxiinise marketability . dehorn educate weaners phosphorus supplementation wean twicelyear.
Preserve and respect environmental integrity fire remains the main vegetation control measure in 80% of area heavily grazed areas stabilised with sown pastures identified environmentally important areas eg. Embley Range, deciduous and riterine forests not developed.
Property &velop~?feilt decisior~s
In order to contain costs and lnaximise production during the developlnent process a number of management practices are observed:
dams are built in the dry season before fencing or paddock construction the number of cattle that can be handled in one group is used to determine paddock 'size ie. 200 to 300 head in sown pasture paddocks low input sown pastures require relatively heavy grazing in the early years of establishment. The rate of development is dependent on the availability of stock to supply this grazing high input pastures do not require stocking during the establishment phase and therefore they can be planted in advance of stocking requirement nitrogen (urea) as well as phosphorus is fed as supplement in the low input sown pastures while the legumes are becoming established to take advantage of natural spread, low input pastures are planted as early as possible in the development sequence unequipped dams are the cheapest way to supply stock water; reliable rainfall reduces the size of dams required.

Economic assessment
The effects of development on cash flow are shown in Table 7.16.
The development program, which is designed to reach full production as quickly as is practical, takes 9 years. The cattle numbers and turnoff are stabilised by year 11. The ratio of different age breeders in the herd profile takes longer to stabilise.
Table 7.16. Summary of development costs and cash flow
An operating cash surplus is reached in year 8, but by then the cuinulative combined- costs are $3,100,000.
" , *.
Therefore, the total cost of reaching a positive cash flow situation is about $3 million and expenditure of these levels is rarely affordable.
Partridge and Miller have also concluded that it is rarely econo~nical to borrow hnds for pasture development. Pasture development has traditionally been done with profits from the existing operation.
Development of medium to high input pastures in the past has met with limited success. McKeague (1 991) gives the following overview of past trends:
'The Cape York Peninsula .beef industry has never had a financially buoyant or boom period, but individual properties have been through boom and bust sequences.
The availability of large areas of land at seemingly cheap prices has attracted entrepreneurial investors. In general, these investors have tried to apply current or fashionable technology from other grazing areas in Australia or in some cases from other parts of the world. For a- few years this has seen a flurry of activity on individual properties. New watering points (dams and bores), paddock fencing, fresh blood lines, timber clearing, sown pastures and improved accommodation have been tried on properties such as Batavia Downs, Merluna, . Silver Plains, Lakefield, Holroyd River and Bertiehaugh.

After an initial flurry of actiyity the source of investment capital dried up as properties did not show a return on the investment. Management and labour inputs were reduced. A large percentage of the herds became feral. The properties were often stripped of the readily musterable cattle and then sold.
This process of selling all the musterable cattle and then selling the lease is continuing in recent times eg. Meripah, Bonny Glenn, Holroyd River.'
From an economic perspective, it is clear that wholesale development of high input pastures is a risky and expensive exercise. Large scale development of these pastures could only be supported if detailed investigations were conducted into risk assessment, cost-benefit analysis and environmental impact assessment.
7.8 Economic Survivors of the Industry
This report concludes. assessments of risk, financial cost-benefit and wider {regional, environmental and cultural considerations are required before any change in management system should be considered. The economic survivors in the Peninsula, and for that matter anywhere in Australia, are going to be businessmen who assess these issues.
History of economic survival in the Peninsula is surnmarised by McKeague (1991) under the headings of 'The Survivors':
'In Cape York Peninsula there are a group of graziers who have lived there for up to four generations. These people are descendants of the earlier pioneers eg. the Shephards, Raymonds, Gordons, Gostelows. In most, if not all cases, cattle production has not been their only form of income. Contract fencing, mustering, sleeper cutting, yard building, road works, trucking, bull dozing, water drilling and more recently supplying tourist facilities and amenities, have augmented and supported their pastoral activities.'
However, the Peninsula will always attract risk takers, albeit in the form of companies or overseas investors, interested in high intensity development of properties. Provided these risk takers can demonstrate, by way of appropriate investigations, that their plans are sustainable and non-degrading, managed development of suitable areas of the region should be encouraged.
It is clear that the-hture of high-input systems need to overcome both the biological and economic risks of failure if they are to: be perceived as a sound investment by landholders in the Peninsula. The first step in confidently recommending such investments is the accurate mapping of the portions of each lease which satis@ the soil and moisture requirements for improved pastures. The second step is to satisfy the needs of Aboriginal cultural values, . biodiversity preservation and erosion control before change is decided on. . The third step, if incorporating pasture development, is to select only the hardiest and most persistent pasture species, preferably with only moderate fertiliser requirements. The fourth step is to ensure . that fire protection of sensitive pasture legumes has been planned. The fifth step is to plan for the fencing and stock waters associated with pasture, in such a way as to allow an effective grazing system which will promote maximum persistence of the perennial pasture species.

From a beef economics point of view there is presently a strong case for encouraging the cattle husbandry approach (cf. Boorman, 1991) with a de-emphasis of the agronomic (improved pasture) approach. This conclusion is supported by the latest (October 1994) qualifications to the Agricultural Land Suitability map (Briggs and Philip, 1994) which classes virtually the whole of the eastern Peninsula as 'low intensity grazing of native pastures ... unsuitable for support of viable beef production systems on a stand-alone basis, but can be an integral part of grazing systems based on improved pasture.'

8 MARKETING
8.1 Present Marketing Arrangements and Prospects
Marketing of cattle from the Cape York Peninsula region presently offers few options, being almost largely confined to selling at the Mareeba saleyards' weekly cattle sales. A significant number of cattle are sold direct to store cattle buyers for hrther fattening; some Peninsula : cattle are bought by property owners in the Lakeland, Cooktown, McIvor River areas for: fattening and some are moved to fattening properties outside the region. Also, there is little direct consignment to meatworks or 'on hook' sales. Sale cattle are usually turned off Cape York Peninsula properties in small, mixed lots not conducive to direct consignment sales. There is some Aboriginal production and processing for community use but this is outside '
normal market arrangements and is a very small part of Cape York Peninsula production.
Although the marketing of Peninsula cattle is diversibng away from saleyard disposal and moving toward direct selling and increasing live cattle exports, the poor standard of the development road and long haulage distances restrict a majority of pastoralists to being 'price takers' instead of 'price makers'. The relatively low level of pasture nutrients in this scenario is the main negative influence, but distance from markets and poor infrastructure are strong supplementary features. These combine to provide a constrained economic and agronomic cycle where it is difficult to produce high quality animals. So, although there is a high and reliable rainfall in the region, there are few instances where landholders have broken out of this low economic cycle to develop pastures and management for improved quality of cattle.
Cattle from Cape York Peninsula are well suited to the U.S. hamburger or MX (grinding meat) trade. This U.S. MX market is Australia's largest export market and the most reliable. It underpins the whole Australian beef cattle industry. While the U.S. market is a most consistent one, it generally is in a lower price range than other markets. High value beef markets have evolved in Japan and Korea over the past decade to become very significant end users of Australian beef. Specifications for these markets are strict and production is specialised. Specifications include a dentition evaluation to describe the age of each animal. Older or 'full mouthed' animals are not acceptable. Slow growth rates on the low nutrient native pastures of Cape York Peninsula have mitigated against cattle production for these markets in the past, however there is a growing awareness for the need to change management to accommodate marketing opportunities.
Cape York Peninsula cattle production studies have identified the low nutrientflow value market constraints but these have been restricted to consideration of Cape York Peninsula cattle being processed in Australia close to the region. The recent development of live cattle export markets in the Phillipines and Indonesia present distinct opportunities to Cape York Peninsula cattle producers. The expansion of Asian economies and Cape York Peninsula's. proximity to the region could reverse the logistical constraints of present cattle marketing.
The live cattle export market has radically improved the economic outlook for cattle . producers in the Northern Territory. The Northern Territory government has provided considerable infrastructure at Darwin to help develop the market opportunities. It is possible that parallel live export markets will place the Cape York Peninsula pastoral industry on an economic plane to provide profitability for on-property re-investment and development.

The development of live cattle export infrastructure near Weipa is an aspiration of the cattle industry. 'The Weipa Hinterland is suggested as the firsrfocid area. This area could develop a live export market through Weipa which would benefit most of Cape York Peninsula' (Cattlemen's Union 1990).
Logistically, a live cattle export infiastructure (assembly, weight gain, quarantine) near Weipa offers considerable advantages:
Price at port for cattle is currently 135-145 cents per kilogram liveweight. This can be* compared with a Mareeba saleyard average of 88.7 cents.
Transport distances and costs would be much less. Also trucks would be able to backload older cattle to Mareeba saleyards (cows, bulls, ox) after carrying export steers to Weipa.
In summary, the constraints of cattle marketing fiom Cape York Peninsula are dictated by inherent conditions and logistics, but opportunities are now evident because of developing markets in the Asian region. Cape York Peninsula could become a reliable breeding area for live export steers destined for nearby markets.
8.2 Market Description
The market outlets/turnoff destinations for Cape York Peninsula cattle are described in seven categories:
(a) The Mareeba Saleyard . C .
(b) Fattening on properties under the same ownership in other areas (c) Sold direct to fattening properties (including feedlots) (d) Live cattle exports (e) Direct consignment to meatwork. (0 Cattle slaughtered within Cape York Peninsula for local consumption (g) Agistment for fattening purposes.
Average cattle turnoff over the last five years is estimated to range between 30,000 to 45,000 head per annum fiom the region. It has been estimated that 33,500 head were turned off last year (1 993).
These cattle are sold at the Mareeba saleyards and by direct sales outlets. An estimated turnoff by number~descri~tion is given for the past year. It should be understood that market price opportunity and seasonal factors always influence cattle movements and marketing .
destination. The cattle industry operates on an open market with unsubsidised production. The market price for cattle fluctuates with supply and demand.
The following table illustrates the turnoff marketing pattern. .

Table 8.1.- Turnofflmarketing of Cape York Peninsula cattle for past year (1993) (estimation made in conjunction with DPI Stock Inspectors, Mareeba)
CooktownLakeland
(Source: DPI Stock Inspectors)
Mareeba Saleyards
These saleyards are a major outlet for Cape York Peninsula cattle. Situated at the southern end of the Peninsula Developmental Road and in reasonable proximity to export meatworks, Mareeba is an important service centre for the far north Queensland cattle industry. -
Weekly sales are held, which are attended by buyers from export processing works and,local butcheries plus cattle fatteners and traders.
-
The market itself is an auction with cattle from the various vendors drafted into similar type and sold mainly on a cents per kilogram live basis. Some are sold on an 'open auction' o'rprice per animal basis.
The market price is determined by the suitability of the animals offered to the end use of the purchaser and is influenced by supply and demand.
Dissemination of the Mareeba saleyards average price index over a 65 month period, February 1989 to June 1994, indicates a fluctuating average market price between 70c and 114c per kilogram liveweight, with an overall average price of 90.45~ through that period (see Appendix 8.1). his average price is adjusted to reconcile with the principal types of cattle sourced from Cape York Peninsula to give an average price over that period of 88.7 cents per kilogram liveweight (see Appendix 8.2).
Mareeba prices are generally low when compared with the rest of the State. The 90 .45~ average for Mareeba compares with an overall average'price over the same period for Queensland (Queensland cattle market index - QLMA) of 125.9 cents. This reflects the lack of suitability and low average weight of cattle and it could also reflect restricted competition because of limited processing facilities. Note: The latter situation bears comment in that supply of cattle and market outlets for meat dictate the number of abattoirs which service a given region. Abattoir location and cattle sourcing are quite regionalised within Queensland because of the high cost to transport livestock. There is no restriction to hrther export abattoir facilities being developed in the region, other than being constructed and operated to

the high standard required. However, there is no indication of new or expanded export processing capacity being developed to service Cape York Peninsula.
Selling costs strongly influence marketing of cattle. The overall gross return and cost of marketing cattle at Mareeba is given for a 350 kg liveweight animal at the average price (transport costs are not included):
Gross: $3 10.45 350 kg @ 8 8 . 7 ~ per kg
Saleyard charges @ 1% 3.10 Scale fees to weigh 2.00 Agents commission @ 4% 12.40 Industry levy (AMLC, MRC etc) 3.60
Store Cattle Turnoff Outside Mareeba
Store cattle sales and turnoff outside the Mareeba saleyards fluctuate and are more difficult to quantify. . . - The main movement of cattle in this category are those which are sold to be fattened in other more favoured areas with higher nutritional grazing. There are some enterprises which own breeding properties within Cape York Peninsula and breedinglfattening properties in southern and western regions of Queensland. Cattle are bred on the Cape York Peninsula property and transported direct to the outside property to be hrther prepared for market.
Agistment of stock is a developing feature of the cattle industry in Queensland. Cattle are moved to agistment because of poor seasonal conditions. Cattle are taken on agistment because of favourable seasonal conditions and low stock numbers on a particular property. Many landholders take cattle on agistment regularly as a means of augmenting cash flow. This development in the industry allows cattle from the Cape York Peninsula area to be moved to better nutritional gazing conditions to meet the age and weight specifications of high value Japanese and Korean beef markets. Currently, the Kowanyama Aboriginal community has approximately 1,000 head of cattle agisted. These could be sold direct from the agistment property. Kulata is an example of cattle from a Cape York Peninsula property moving to- another in the same ownership outside the region; some 2,500 head were involved in this turnoff. There is also some direct sale of store cattle to fatteners outside Cape York Peninsula, mainly on the Atherton Tableland.
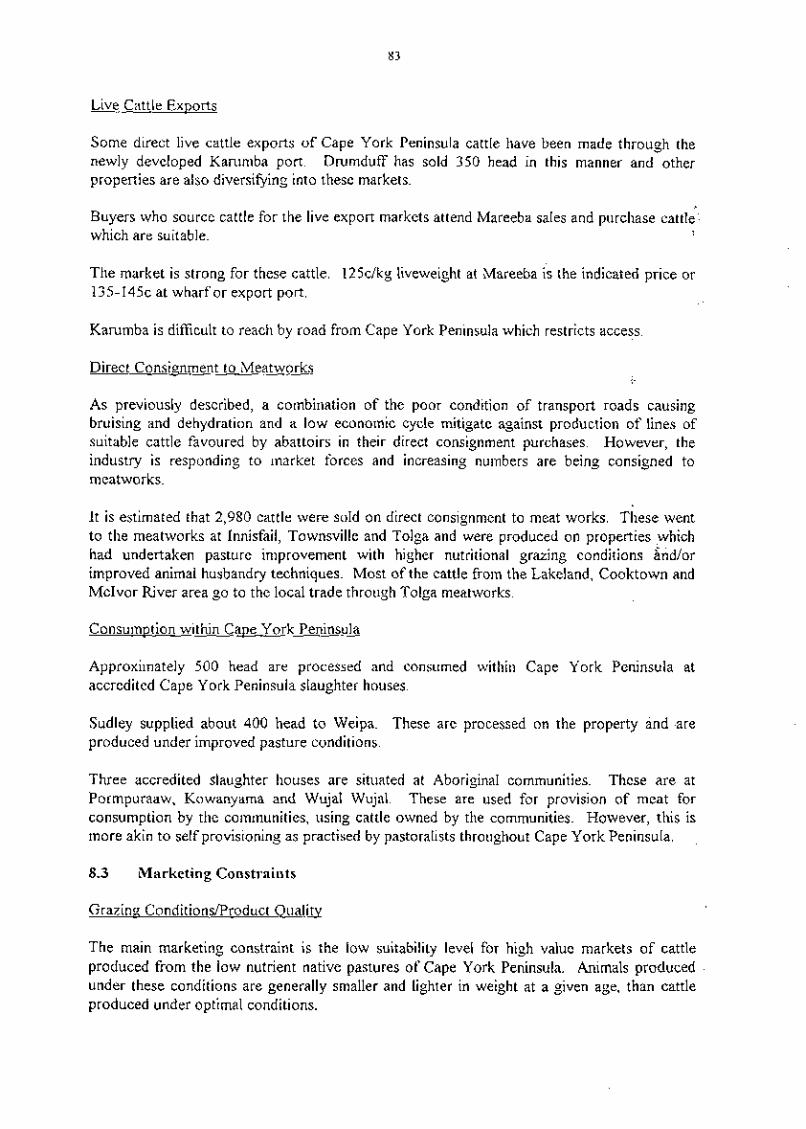
Live Cattle Exports
Some direct live cattle exports of Cape York Peninsula cattle have been made through the newly developed Karumba port. Drumduff has sold 350 head in this manner and other properties are also diversifying into these markets.
Buyers who source cattle for the live export markets attend Mareeba sales and purchase cattle: which are suitable.
The market is strong for these cattle. 125clkg liveweight at Mareeba is the indicated price or 135-145c at wharf or export port. .:..
Karumba is difficult to reach by road from Cape York Peninsula which restricts access.
Direct Consignment to Meatworks
As previously described, a combination of the poor condition of transport roads causing bruising and dehydration and a low economic cycle mitigate against production of lines of suitable cattle favoured by abattoirs in their direct consignment purchases. However, the industry is responding to market forces and increasing numbers are being consigned to meatworks.
It is estimated that 2,980 cattle were sold on direct consignment to meat works. These went to the meatworks at Innisfail, Townsville and Tolga and were produced on properties which had undertaken pasture improvement with higher nutritional grazing conditions And/or improved animal husbandry techniques. Most of the cattle from the Lakeland, Cooktown and McIvor River area go to the local trade through Tolga meatworks.
Consumption within Cape York Peninsula
Approximately 500 head are processed and consumed within Cape York Peninsula at accredited Cape York Peninsula slaughter houses.
Sudley supplied about 400 head to Weipa. These are processed on the property and .are produced under improved pasture conditions.
Three accredited slaughter houses are situated at Aboriginal communities. These are at Pormpuraaw, Kowanyama and Wujai Wujal. These are used for provision of meat for .
consumption by the communities, using cattle owned by the communities. However, this is more akin to self provisioning as practised by pastoralists throughout Cape York Peninsula.
8.3 Marketing Constraillts
Grazinp ConditionsProduct Quality
The main marketing constraint is the low suitability level for high value markets of cattle produced from the low nutrient native pastures of Cape York Peninsula. Animals produced under these conditions are generally smaller and lighter in weight at a given age, than cattle produced under optimal conditions.

Animal Husbandrv/Herd Management
General profitability is limited because of the low nutritional grazing conditions of native pastures. This, in turn, limits re-investment in property improvements and genetic improvement of cattle. Herd management, mustering and marketing is often basic, with opportunity turnoff of small consignments of mixed cattle being common. The inability to' present larger, even 'lines' of cattle for sale has a negative effect on price.
Controlled mating using genetically superior bulls has brought significant production gains to the Australian cattle industry. The Cape York Peninsula conditions under which cattle are run make it difficult to control mating. (Unselected male progeny or 'mickey bulls' must be. castrated before reaching sexual maturity.)
Lack of InfrastructuretTransport Costs
The tyranny of distance and poor roads throughout Cape York Peninsula present a number of marketing problems with distance to markets up to 700 kilometres.
Cape York Peninsula is serviced by the Peninsula Developmental Road. This road is largely unsealed and prone to seasonal flooding, making it impassable for up to three months in the northern section during the wet season.
Mustering and cattle turnoff are normally confined to the dry season. This gives a shorter marketing season. While this does not necessarily affect the sale price of U.S. market%tock (because meatworks are also seasonal), store cattle prices can rise through the wet season. This can result in a missed marketing opportunity.
Rough and dusty road conditions, particularly on feeder roads, cause increased bruising of cattle and unattractive presentation at sale. The Queensland Department of Transport study of the Peninsula Developmental Road (1986) stated that carriers consistently reported an operating cost on gravel surfaces three to four times that on bitumen, and that bruising of cattle is reported due to corrugation and swaying caused by gullies and sharp corners. Death of cattle suffocated in dusty road conditions has also been reported.
Freight cost penalties in Cape York Peninsula result from lack of a sealed road system. Transport costs when marketing cattle are a major inhibiting factor on industry profitability.
Cape York Peninsula has largely been neglected in the provision of a reasonable road system on a comparative State and national basis. As described in the Regional Opportunities Identification Study for Major Projects Cape York: 'Most other parts of Australia not only have all weather road access, but are served by railways'. ,
The report goes on to describe freight cost penalties in the following table:
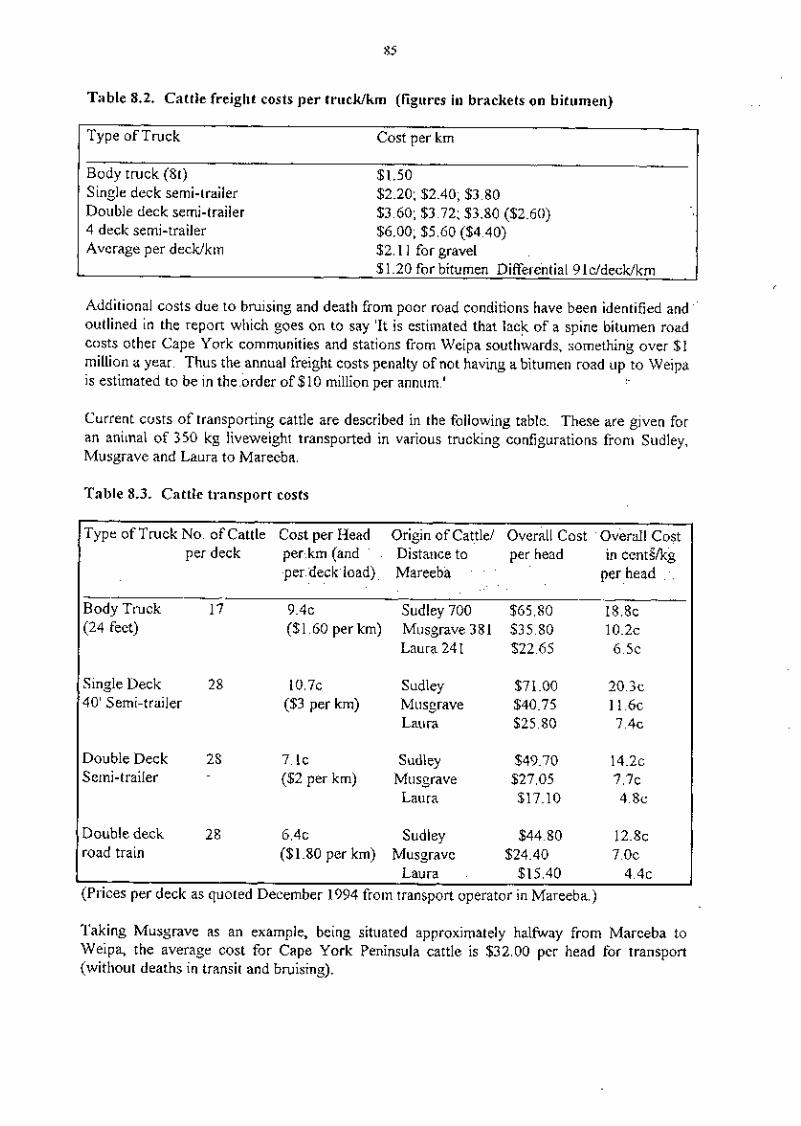
Table 8.2. Cattle freight costs per trucklkm (figures in brackets on bitumen)
Type of Truck Cost per km
Body truck (St) $1.50 Single deck semi-trailer $2.20; $2.40; $3.80 Double deck semi-trailer $3.60; $3.72; $3.80 ($2.60) 4 deck semi-trailer $6.00; $5.60 ($4.40) Average per decWkm $2.1 1 for gravel
$1.20 for bitumen Differential 9 1 cldecWkm
Additional costs due to bruising and death from poor road conditions have been identified and outlined in the report which goes on to say 'It is estimated that lack of a spine bitumen road costs other Cape York communities and stations from Weipa southwards, something over $1 million a year. Thus the annual freight costs penalty of not having a bitumen road up to Weipa is estimated to be in the-order of $10 million per annum.'
Current costs of transporting cattle are described in the following table. These are given for an animal of 350 kg liveweight transported in various trucking configurations from Sudley, Musgrave and Laura to Mareeba.
Table 8.3. Cattle transport costs
Single Deck 2 8 1 0 . 7 ~ Sudley $71 .OO 2 0 . 3 ~ 40' Semi-trailer ($3 per km) Musgrave $40.75 1 1 . 6 ~
Laura . $25.80 7 . 4 ~
Double Deck 28 7. l c Sudley $49.70 1 4 . 2 ~ Semi-trailer - ($2 per km) Musgrave $27.05 7 . 7 ~
Laura $17.10 4 . 8 ~
Double deck 28 6 . 4 ~ Sudley $44.80 1 2 . 8 ~ road train ($1.80 per km) Musgrave $24.40 7 . 0 ~ 1 I Laura $15.40, 4 . 4 ~ 1 (Prices per deck as quoted December 1994 from transport operator in Mareeba.)
Taking Musgrave as an example, being situated approximately halfway from Mareeba to Weipa, the average cost for Cape York Peninsula cattle is $32.00 per head for transport (without deaths in transit and bruising).
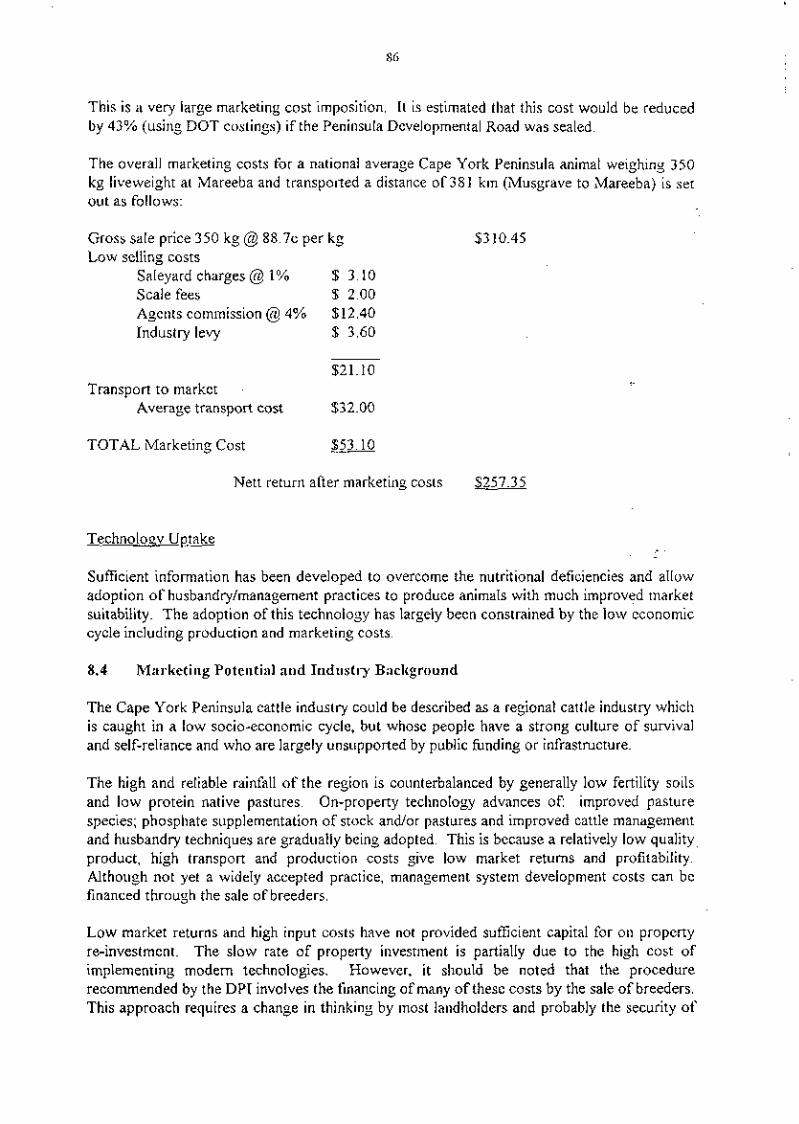
This is a very large marketing cost imposition. It is estimated that this cost would be reduced by 43% (using DOT costings) if the Peninsula Developmental Road was sealed.
The overall marketing costs for a national average Cape York Peninsula animal weighing 350 kg liveweight at Mareeba and transported a distance of 38 1 km (Musgrave to Mareeba) is set out as follows:
$3 10.45 Gross sale price 350 kg @ 8 8 . 7 ~ per kg Low selling costs
Saleyard charges @ 1 % $ 3.10 Scale fees $ 2.00 Agents cominission @ 4% $12.40 Industry levy $ 3.60
$21.10 Transport to market -
Average transport cost $32.00
TOTAL Marketing Cost $53.10
Nett return after marketing costs $257.35
Technoloq Uptake ,. , - Sufficient information has been developed to overcome the nutritional deficiencies and allow adoption of husbandrylmanagement practices to produce animals with much improved market suitability. The adoption of this technology has largely been constrained by the low economic cycle including production and marketing costs.
8.4 Marketing Potential and Indust~y Background
The Cape York Peninsula cattle industry could be described as a regional cattle industry which is caught in a low socio-economic cycle, but whose people have a strong culture of survival and self-reliance and who are largely unsupported by public hnding or infrastructure.
The high and reliable rainfall of the region is counterbalanced by generally low fertility soils and low protein native pastures. On-property technology advances of improved pasture species; phosphate supplementation of stock and/or pastures and improved cattle management and husbandry techniques are gradually being adopted. This is because a relatively low quality, product, high transport and production costs give low market returns and profitability. Although not yet a widely accepted practice, management system development costs can be financed through the sale of breeders.
Low market returns and high input costs have not provided sufficient capital for on property re-investment. The slow rate of property investment is partially due to the high cost of implementing modern technologies. However, it should be noted that 'the procedure recommended by the DPI involves the financing of many of these costs by the sale of breeders. This approach requires a change in thinking by most landholders and probably the security of

back-up capital would hasten implementation rates. Failure to apply improved technologies will lock ownerloperators into the low economic cycle. Introduction of capital can break the cycle but for the regional cattle industry to be viable, investment capital should be self- generating.
Currently people in the cattle industry supplement their income from a variety of outside sources, but generally are prepared to live in conditions well below the accepted standard (or' poverty line) and with minimal government assistance.
There are four developments which have potential to provide conditions for a breakout from the low economic cycle and benefit the Cape York Peninsula cattle industry:
(a) The developnzent of the Asian economies and markets and their proximity to the region. This has already led to a rapid expansion of the live cattle expbrt market. The trend is strongly towards increased numbers of cattle required. This market gives returns almost 50% above the current average price for Cape York Peninsula cattle at Mareebai-saleyard, the major market place. An additional benefit is that the average Cape York Peninsula transport cost to market cattle would be substantially reduced if a live export facility was available at Weipa.
(b) Tourism development. Large numbers of Australian and international tourists are visiting Cairns. Opportunities for tourism for Cape York Peninsula landholders are expanding giving strength to diversification for cattle industry people.
(c) The development of conservation and biodiversity values in Australia. Community yalues have shifted quickly to place a greater value on nature conservation, biodiversity and sustainable development. There is a growing acceptance of the need to enlist resident landholders as managers of nature conservation and to compensate or reward 'them for doing so. In Cape York Peninsula a huge extent of unmodified land has tourism and biodiversity value which could be of benefit to resident landholders. Given the right policy settings this would allow sound on property diversification and regional development. The extent and potential of unmodified land also allows for a planned incremental development of part of cattle properties, with only a minor, acceptable impact on the conservation and biodiversity values. There is strong evidence that native fauna species thrive -in the conditions where pasture nutrient levels are raised and permanent water is provided for cattle.
- (d) Technology development. Cattle management and pasture technology have developed to
the stage where it is possible to introduce higher protein pastures, supplementary feeding of phosphates and herd management techniques to produce stock suited to the high value live export market and for southern fatteners. The widespread uptake of that technology awaits an economic catalyst. The live cattle export market has the potential to provide that catalyst.
The cattle industry of the Northern Territory and the Kimberleys have recently developed substantially and these areas owe their good fortune in part to the expansion of live cattle export markets and the establishment of a network of bitumen roads for distribution. This support has not been provided to the same extent in Cape York Peninsula. In order to achieve the region's market potential, development of these areas will be required.

Live Export Market
The livestock export market is expanding particularly to Indonesia and the Philippines where the imports are linked to government programs to place the expansion on a sound basis.
Specifications for the animals required for Indonesia and the Philippines suit north Queensland .-, production where the cattle have a high Bos indicus content. (Requirement is for at least 50% I Bos indicus content.)
The price offered is currently around 145c/kg live at port or 125cfkg live at Mareeba saleyard. This is significantly higher than the average price of cattle marketed at Mareeba and is very - '
similar to the average indexed price for Queensland over a three year period.
Description: .,-.
'The tremendous growth of Australia's livestock trade to the Asia Pacific region continued throughout the 1993 calendar year. The live cattle trade constituted 98.6% of Australia's global cattle exports and reached 207,277 head, an increase of 40% compared to the volume in 1992. This prodigious growth is from a strong base as live cattle exports in 1992 had increased 27% from 199 1.
The total livestock trade to the region was worth A$90.1 million . . . . I (Asia Livestock Marketing, John Maher, AMLC). This report goes on to describe the two major markets: The Philippines and Indonesia. , - i . ,
Philippines
In 1993 Philippine importers purchased a total of 94,465 head consisting of 8,512 breeding cattle and 85,953 feeder steers. The total trade was valued at $34.4 million.
In February 1994 a Philippines Department of Agriculture Administrative order was signed by the Secretary of Agriculture with the following features:
the necessary accreditation of bona fide feedlot operators (or cattle consortiums) to import cattle the requiremen6 effective 1 March 1994, that for every nine feeder steers imported, one pregnant breeding heifer must be imported the imposition of heavy penalties for both suppliers and importers violating the new regulations.
From 1 July 1994, a 3% tariff will apply to all feeder and breeding cattle imported.
Indonesia
The AMLC reported 'phenomenal' growth of the feeder steer trade from Australia to Indonesia rising 136% from 1992 to 1993 with a total of 58,534 head worth $24.5 million.
Malaysia
Cattle exports to Malaysia declined by 17% during 1993 to 22,959 head worth $9.5 million.
Live Cattle Exports - Infrastructure Requirements:
Lower Peninsula data indicate that live cattle exports could increase gross margins by 50% to A,
100%. However, in order to encourage live exports, facilities (roads and terminals) need establishing in Cape York Peninsula. The poor quality of the developmental road is the main factor inhibiting development of the area.
Assembly of cattle prior to export is required to undertake the health/husbandry protocols of .
importing countries. Animals are required to be isolated from others to enable health testing. This is normally undertaken by exporting companies in their facilities: Loading facilities at the wharf are required. Normally the trucks drive onto the wharves and load direct to ships using temporary ramps.
Cape York Peninsula producers currently have limited access to a live export port. The closest are at Karumba and Townsville. Roads from Cape York Peninsula to Karumba are such that only the southwest area of Cape York Peninsula can economically access that port. Townsville is at a disadvantage to Darwin and Karumba for the Indonesian market with considerably extra sailing days to the destination.
Weipa is now an open port and offers significant advantages as a live export port. It is a deep water port and can handle large ships. It is well situated for both the Philippine ,and Indonesian markets. However, Weipa has the disadvantages of poor quality road access, a limited supply base of cattle and lack of assembly facilities for export cattle.
Weipa is one of the ports administered by the Ports Corporation. The Ports Corporation is responsible for the trading ports of Weipa and Cape Flattery, the community port of Thursday Island, and the non-trading port of Cooktown. Being an owner and developer of these port facilities, the role of the Corporation is to identify port needs and to work with both existing and potential port users to ensure these needs are met efficiently and effectively.
The Ports Corporation has advised that the appropriate facility to use at Weipa is ~ u m b u ~ Wharf which is used for general cargo and is currently being upgraded for the export of bagged kaolin. The Ports Corporation has structured its leasing arrangements to provide multi-user access to such facilities and access can be provided to the facility. There are currently no facilities such as holding yards to support live cattle exports at Weipa.
Karumba is another port to consider. Live cattle exports are established in the :port and- relevant facilities (such as holding yards) are under the control of Integrated Resource Industries. Their leasing arrangements require them to allow access to others to export cattle at reasonable rates. The lack of direct access road between the Peninsula and Karumba . mitigates against movement of large numbers of stock.
It should be noted that the Northern Territory Government has strongly supported live cattle export expansion and has invested in infrastructure at Darwin.

The marketing advantage of a live cattle export capacity is illustrated in the following table:
Table 8.4. Live cattle costs and returns
animal at Mareeba at Weipa
Saleyards charges @ 1% $ 3.10 I Scales (weighing) fees $ 2.00 - Agents commission 4% and 2.5%* $ 12.40 $ 8.00 Industry levy $ 3.60 $ 3.60 Transport cost (same distances) $ 32.00 $ 28.00 Total marketing cost $ 53.10 ' $ 39.60 Gross sale price $3 10.45 $432.00 Nett per head return ( f q gate) $257.35 $392.40 *Paddock sale commission rate charged by agents. Direct sales without agents are possible.
Note: Gross sale price at Mareeba is calculated for a 350 kg animal at 88.7ckg liveweight. Gross sale price for live export steers is calculated for a 320 kg animal at 135ckg liveweight Weipa.
In summary, the live cattle export market offers considerable potential for the Cape York Peninsula cattle industry with major benefits to those close to Weipa if assembly facilities are established there. - " .
Other Potential Markets
The expansion of tourism in north Queensland and growth in population provide an expanded table meat market. Two scenarios are likely:
(a) Aboriginal communities have significant land holdings. It is possible these will move towards greater self-sufficiency and (i) increasingly produce cattle for their own consumption and (ii) gradually move to commercial cattle production as part of the cattle industry.
(b) An improved demand for table meats with increased urban populations in far north Queensland could see an increased cattle fattening capability in favoured areas such as the Atherton Tableland and Lakelands. This could trigger a younger turnoff age of stock and a market for breeding enterprises to service younger animals. Fatteners in the more favoured areas could look to Cape York Peninsula to invest as a means of s e ~ c i n g these cattle. This would follow the normal trend of response to supply and demand within the industry.

Infrastructure underpins the cattle industry of Cape York Peninsula. The large area of Cape York Peninsula, with small population and low production output, together with constraining natural features, present difficulties for the development of infrastructure.
The infrastructure which supports the pastoral industry of Cape York Peninsula is much ;̂ less well developed than for the same industry in other parts of Queensland and Australia.
Infrastructure features for the pastoral industry are listed under the following headinss:
1 Roads and road transport 2 meatw works and cattle processing facilities 3 Saleyards and selling facilities 4 Air services 5 Ports 6 Technical service provision 7 Telecommunications 8 TV and radio 9 Electricity.
9.1 Roads and Tra~lsport
Within Cape York Peninsula the single most important infrastnlcture feature is the Peninsula Developmental Road. This is a central access road running froin Mareeba to Weipa, a distance of 702 kilometres Feeder roads into the Peninsula ~ e v e l o ~ m e n t a l Road occur along its length to service pastoral properties and Aboriginal settlements.
The following companies and instrumentalities have funding, road building and maintenance responsibilities: Department of Transport, Cook Shire Council, Carpentaria Shire Council, Torres Shire Council, Aurukun Shire Council, Aboriginal Communities, Comalco, other companies, beef producers and the Australian Army (Connell W a g e r 1989).
The natural constraints to provision of roads for the region include annual wet season flooding which cuts roads for many months, and the scarcity of suitable road building material along most of the length of the Peninsula Developmental Road.
Connell Wagner reported as follows on the general condition of roads: 'The roads in Cape York Peninsula are predominantly unsealed and may offer only six to eight months accessibility each year ... Travel speeds on these roads are much lower than 'in more. developed areas of Australia, with speeds of not more than 60 to 80 kilometres per hour being typically attainable under favourable conditions' and 'Funding has not been available to provide roads in Cape York Peninsula with a flood immunity'.

The Peninsula Developmental Road is unsealed for the major part of its length. Bitumen sealing of the roads extends north from Mareeba, with a Department of .Transport projection of completing sealing from Mareeba to Lakeland by 1996 Transport costs over the rough? dusty unsealed section of the Peninsula Developmental Road and feeder roads add considerably to cattle selling costs.
The projections for sealing of the Peninsula Developmental Road are long term - to: Musgrave by 2016 and Archer River by 2021. The GH & D report to CYPLUS on; Transport Services and Infrastructure in Cape York Peninsula estimates that the costs of upgrading the Peninsula Developmental Road to bitumen standard is $217M, access roads to Aboriginal communities at $365M and the Cooktown Developmental Road at $30M. Alternative improvements such as the improvement of the roads to a two lane gravel road - a
standard with high level bridges involves costs of $78M for the Peninsula Develop~nental Road and $77M for access to Aboriginal communities.
At these levels of hnding 'major arterial and arterial roads cannot be upgraded;-to a two (2) lane gravel standard before 2020 ....'. Of the 1,476 kms to be upgraded, only 670 kms are St&e controlled roads and the remainder are the responsibility of Shire and Aboriginal Councils. Local roads (200 kms) under Council control have not been included in these figures.
The cost of maintaining existing roads is $1,00O/km. Presently, pastoralists grade the road from their property to the major road network to keep the road trafficable .for stock movement.
. r .
A shortfall in road finding is evident on the Peninsula and the finding opti;ns to overcome this shortfall are presented in the GH & D report.
Cook Shire operates under a low rate base from leasehold and freehold land in its area and has sought assistance for maintenance because of road use from outside the shire (tourism, Comalco) and a lowered rate base with leasehold land being acquired for National Parks by the State Government (National Parks and other public lands are not rateable).
Connell Wagner reports that the Cook Shire concentrates on areas of higher rate contribution and responds on a needs basis at landowners' request, that access (feeder) roads sometimes do not exist 'in a practical or dedicated sense' and that permanent works were limited to-an upgrading of trouble spots.
Ports
Major port facilities are established at Weipa and Cape Flattery with minor facilities at Thursday Island. Also there are barge unloading facilities or basic port facilities at most other coastal towns or settlements.

The pastoral industry very largely relies on road transport to Mareeba for the sale of cattle produced. However, the recent large growth of live cattle export markets in the nearby Asian region and future projections, point to Cape York Peninsula having live export potential. Weipa is the obvious port to service this new market. Weipa is a publicly owned port giving access to live cattle exporters. Infrastructure to support live cattle exports (assembly areas) would need to be developed in reasonable proximity to Weipa.
Karumba, in the southern Gulf of Carpentaria, is currently developing as a potential live: cattle port, having already been used in 1994. However, the logistics of Cape York Peninsula cattle accessing Karumba are difficult and expensive. Some pastoral properties and Aboriginal communities north and east of Karumba could benefit from the development but the great bulk of Cape York Peninsula would not, as Weipa would be . '
their preferred port.
Air Services 1..
Air services are well developed in Cape York Peninsula and form a vital part of the transport system because of the seasonal nature of the roads. The Queensland Government regulates and subsidises aviation services within Cape York Peninsula while the Co~n~nonwealth Government regulates operational and safety matters.
There are two categories of air service licence:
(a) regular public transport (b) charter. , + r '
Most towns, cotn~nunities and some cattle properties are serviced by regular public air transport. Mail and freight to cattle properties is provided by charter contractors - 28 charter companies service Cape York Peninsula. Cape York Air Services is the major operator with mailffreight flown to 65 properties. It is important to note that these services are based in Cairns and charter services are regularly used when public transport cannot be coordinated.
Licenced aerodromes are situated at Cooktown, Horn Island, Lockhart River,. Co.en, Bamaga, Aun~kun, Edward River and Kowanyama.
The air serviceinfrastructure is important for the provision of healthlaccident response services throughout Cape York Peninsula. It is also vital to maintain freight and mail services through the wet season. The mail service is Government hnded, whereas passenger and freight services are not subsidised.

Technical Services
The Cape York Peninsula pastoral ind~~stry is serviced by an extensive technical information service provided by the Queensland Department of Primary Industries (DPI) and by private consultants.
The DPI service is mainly based at Mareeba so the service suffers from the disadvantages-; of distance and isolation. However, DPI ofXcers attempt to overcome this by regularly: travelling through the region and by attending cattle industry meetings.
A DPI Research Station at Batavia Downs which was producing agronomic information for the area, was recently closed.
The DPI has accumulated significant production and land use iiiformation relevant to the region, much of it generated by DPI ofXcers who are recognised by cattle producers as an important information source.
Private; consultants for the cattle industry in Cape York Peninsula are not widely used, however, there is some consultancy use, particularly on properties under development using capital from outside the area.
Telecommunications
A major upgrading of services by Teleco~n was completed in 1989. Telephone, fax and computer cornm~inications infrastructure is ~nostly in place, but access is still limited., .This infrastructure provides the potential for improvement to co~nrnunication througho;t the region with consequent benefit in the areas of health, lifestyle and access to production information.
TV and Radio
Generally the radio reception is poor, particularly during the wet season when atmospherics and lightning-induced static interferes with reception. The ABC regional radio based at Cairns provides useful industry information through its early morning and 'country hour' programs. Unfortunately, reception from Cairns is not good, and Peninsula listeners receive better reception from Longreach, Mt Isa and Emerald. These western services are not-targetted to Peninsula issues.
The knowledge and experience of ABC rural journalists based in Cairns is highly regarded by the Cape York Peninsula cattle industry as expressed at industry meetings. The issues covered, range from topical relevant social issues, to production, animal health and- marketing information. 'Notice board' information on meetings and coming events is also provided by ABC radio for the region. I~nprovernent df reception froh Cairns would be of benefit to the Peninsula community.

TV reception is limited to within close range of larger centres (except where satellite dish antennae are used). The Department of Community Services is fbnding re-broadcast equipment for the Aboriginal communities of Hopevale, Lockhart River, Aurukun, Edward River, Kowanyama, Bamaga and Thursday Island.
Electricity
The Queensland grid extends only as far north as Laura and Cooktown with no plans to- extend further.
These towns experience 'end of line' supply problems of voltage surge and lightning-strike failures. Electrical installations require expensive protection equipment.
Power supply on cattle properties is mainly supplied with'private diesel or petrol generators.
:,-
9.2 Licenced ~liattoirs and Accredited Slaughter Houses and Saleyards
A decreasing percentage of Cape York Peninsula turnoff cattle are marketed at the Mareeba saleyards. Last year (1993), approximately 50% of these turnoff cattle were marketed through Mareeba saleyards. The cattle are sold on a live weight basis at open auction. Cape York Peninsula cattle are generally suited to the U.S. MX or hamburger meat market. There are three major licenced export abattoirs which regularly purchase cattle at Mareeba sales for processing and exporting to a variety of destinations with some cuts being sold on the Australian domestic market. . 5 '
These are:
AMH, Townsville QME, Townsville Innisfail Butchering Co., Innisfail.
Occasionally, abattoirs located near Bowen purchase cattle at Mareeba.
Ten accredited slaughter houses are situated within reasonable proximity to Cape York Peninsula and the Mareeba saleyards. These service slaughter and store cattle buyers from the south and local butchers. A substantial number of cattle are directly sold to Tableland properties and on selling of fattened cattle for the local market. Poorer quality meat bits service local butcher shops for sausage or mince production.
Within Cape York Peninsula itself the major accredited slaughter house is situated at- Sudley. This processes animals for sale in Weipa.
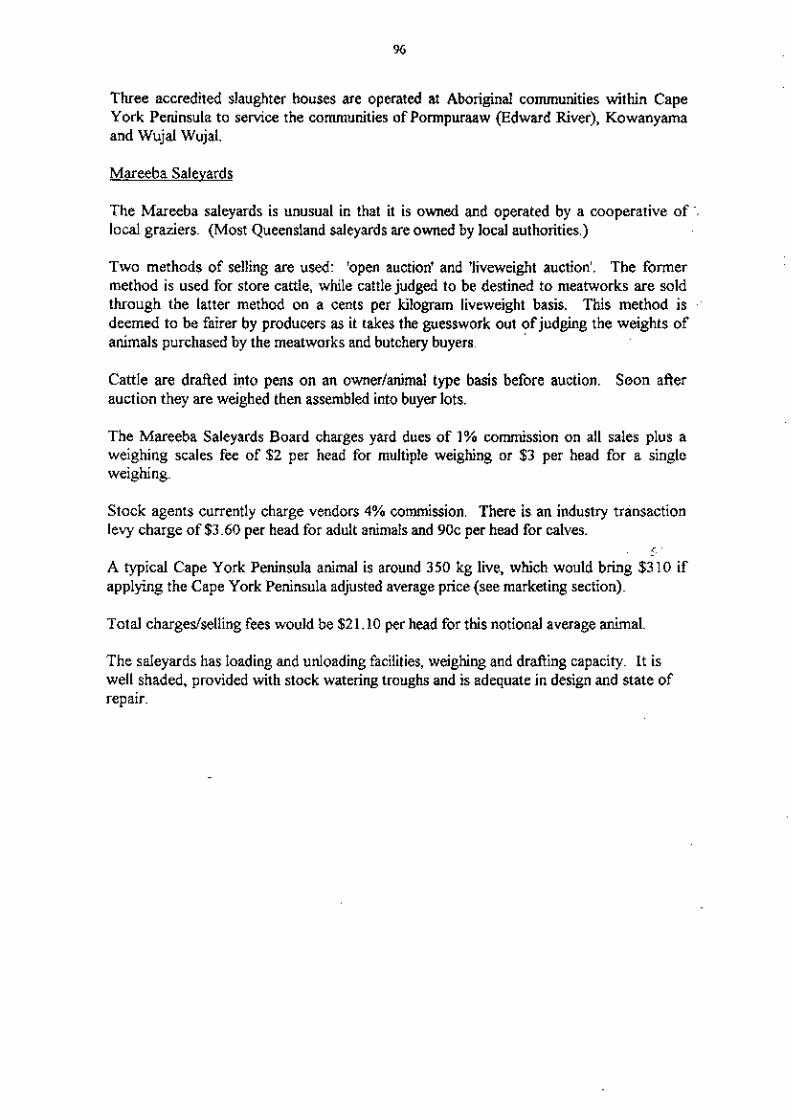
Three accredited slaughter houses are operated at Aboriginal communities within Cape York Peninsula to service the communities of Ponnpuraaw @idward River), Kowanyarna and Wujal Wujal.
Mareeba Salevards
The Mareeba saleyards is unusual in that it is owned and operated by a cooperative of -. local graziers. (Most Queensland saleyards are owned by local authorities.)
Two methods of selling are used: 'open auction' and 'liveweight auction'. The former method is used for store cattle, while cattle judged to be destined to meatworks are sold through the latter method on a cents per kilogram liveweight basis. This method is .
deemed to be fairer by producers as it takes the guesswork out of judging the weights of animals purchased by the meatworks and butchery buyers.
Cattle are drafted into pens on an ownerlanimal type basis before auction. Soon after auction they are weighed then assembled into buyer lots.
The Mareeba Saleyards Board charges yard dues of 1% commission on all sales plus a weighing scales fee of $2 per head for multiple weighing or $3 per head for a single weighing.
Stock agents currently charge vendors 4% commission. There is an industry transaction levy charge of $3.60 per head for adult animals and 90c per head for calves.
r '
A typical Cape York Peninsula animal is around 350 kg live, which would bring $310 if applying the Cape York Peninsula adjusted average price (see marketing section).
Total charges/selling fees would be $21.10 per head for this notional average animal.
The saleyards has loading and unloading facilities, weighing and drafting capacity. It is well shaded, provided with stock watering troughs and is adequate in design and state of repair.


I SECTION E: ISSUES AND ASPIRATIONS I
10 PASTORAL INDUSTRY ISSUES AND ASPIRATIONS
10.1 Consultation Process and Response
An assessment of the current attitudes and aspirations of pastoralists was conducted by consultation with industry representatives, individual pastoralists, and CYPLUS Land Working Group. Also a questionnaire was circulated to property owners and managers involved in the pastoral industry. Industry representatives included CYPPAG, Cattlemen's Union and Bob Wincen. A meeting convened at Musgrave (8 October 1994) gave individual pastoralists an opportunity to convey their opinions, attitudes and aspirations. These opinions were re-affirmed during property visits conducted during the project. For those pastoralists unable to be visited or unable to attend meetings, the questionnaire was forwarded for completion.
The response to this questionnaire was a 30% return. Analysis from this return highlights the following points: -
(i) surveys were completed predominately by owners of larger leasehold cattle properties who have worked the properties for longer than 10 years
(ii) cattle turnoff percentages were higher than expected. Some anomalies exist here
(iii) a majority propose some development of their property in the future
(iv) property development techniques proposed to be adopted include pasture improvement, selective land clearing, strategic fencing, phosphate improvement, increased use of licks, improved watering

(v) factors identified as limiting to the industry's development included low nutrition pastures, poor soils, poor transportation networks, poor cattle control and poor marketing opportunities
(vi) factors that were thought to restrict the implementation of development techniques were lack of finance, restrictive lease conditions, poor access
(vii) a majority of producers considered that the condition of their land was stable or improving
(viii) a majority of producers considered that they could not subdivide their land under present tenure arrangements
(ix) a minority of producers would consider subdivision of their lease
(x) reasons given for subdivision were to generate more capital for property development and for easier property management.
A summary of results from the questionnaire have been collated and presented as Appendix 10.1.
10.2 Current Ir~dustry Issues
Current issues that influence industry attitude include:
the Native Title claim by the Wik people the likelihood of other claims probable establishment of the Aboriginal land acquisition h n d to purchase Peninsula properties rapid conversion of significant areas of pastoral properties to National Park tenure, eg. Starke, Lakefield, Silver Plains EARC's review of local authority boundaries CYPLUS planning process the Wolf Report on Tenures changing legislations.
The complexities of these issues make it difficult for the industry to appreciate the implications of proposed changes and then determine a position. Decision-making is founded on 'shifting sands' and continuation of these circumstances will act as an impediment to effective long term planning.
The key feature of each of these issues for the beef industry is not always the content or objective of the issue, but rather the uncertainty it generates for fbture planning. Each of these issues could result in some structural change for the industry. The likelihood of structural change is not feared by the industry, however, there is a perception that structural change will occur without ineaninghl input from the industry. A feeling of 'not knowing' pervades the industry and should structural change occur, it is feared that this change might prejudice industry interests.

However, despite these diiliculties, other more specific industry issues oiTer the Peninsula industry encouragement. These issues include:
the ongoing improvement to the Peninsula Develop~nental Road, especially the northern sections in the Archer and Weipa area
the continued interest in developing Weipa Port as a possible live cattle export facility
the gradual restocking of properties following the BTEC rundown
the gradual acceptance of improved cattle husbandry techniques
the gradual improvement in services supporting the Peninsula.
It is important to recognise that gradual structural change is occurring within the industry and these incremental structural changes are addressing the existing constraints to industry growth. In particular, the infrastructure cannot be rapidly addressed. Poor transportation networks and coininunications have been long term impediments to industry development. Improvement to infrastructure will support potential improved marketing prospects emanating froin live cattle export, ex Weipa.
10.3 Current Indust~y Attitudes
Attitudes in the Peninsula are a product of the region's remoteness, development history, relatively poor service infrastructure support and evolving government policies. Current industry attitudes have subsequently developed in response to the region's history and present day issues. The underlying attitudes of producers in the Peninsula is one developed on a culture of survival and self reliance. This culture res~~lts in an industry structured to support producers with varying aspirations. These aspirations range from highly commercial orientated business to producers who view pastoralism as a way of life with involvement in the industry not only on financial grounds. The pastoral industry is currently caught in a low socio-economic cycle and has long suffered from poor infrastructure support, extremes in wet season conditions, poor cominunications and remoteness from markets. However, it has survived. The people working in the pastoral industry have worked together to develop the industry. The history of pastoralism in Cape York is peppered with some conflict, however, all parties involved have shown a strength for survival. This attitude of survival is still present and can contribute to fi~ture planning.
With respect to the industry's attitude to the current Peninsula issues, the following summaries are presented.
Uncertaintv in Decision-Makina
The industry is presently confised by past conflicting advice and policy administration decisions made by governments. These inconsistencies have led to uncertainty caused by the lack of clear decisions. Uncertainty created by past actions is made no clearer by the present period of structural change. The complexity of the present issues bring with them uncertainty. This feeling of uncertainty develops tentative attitudes towards:

security of tenure investment decisions property improvement decisions infrastructure support decisions stocking numbers breeding programs.
It is a fbndarnental business principle that the amount and rate of business activity is a fbnction of expectation. If expectation is fkelled by uncertainty, as it is in Cape York Peninsula, the overall impact on the industry will be negative.
In order to rectiG this position, the industry considers that better decision-making based on effective consultation and factual information inputs is required. However, the industry considers that 'at present, the fkture of the Peninsula is being governed by political decisions, or in many cases, lack of decisions, with little regard for the interests of resident stakeholders' (CYPPAG, 1995).
Sustainable Development
Many in the industry consider that the Peninsula is lightly stocked. Low cattle numbers are a product of existing management technologies involving limited cattle control, minimal fencing and extensive grazing strategies. The result of this management approach is an environment that is generally stable in condition.
A perception of the industry is that the Peninsula is capable of supporting higher cattle numbers. The resultant increase in cattle numbers, it is thought, relies on development strategies resulting in better cattle control. These strategies generally result in more intensive management.
Specific practices of the more intensive management regime that have proved successfbl in the Peninsula include improved husbandry practices such as botulism vaccination, dehorning, early weaning, supplementation and vibriosis vaccination and strategic pasture improved areas. The implementation rate of these practices has been slow and piecemeal. Reasons suggested for the low and piecemeal adoption of these practices are:
poor access and transport networks pastoralist's resistance to change lack of finance (for development) lack of infrastructure support (eg. ports, saleyards) restrictive lease conditions size of the property tenure insecurity.
The industry considers that overcoming these barriers is the logical first step to change and subsequent industry revitalisation.

Pastoral Lease Use
In the Cattlemen's Union Working Paper on 'An Assessment of the Future Directions of the Pastoral Industry in Cape York Peninsula', the industry estimates '30% of the total area could be considered unsuitable for grazing at present because of its soil properties or vegetation type'. Of the remaining 70%' many properties are running well below potential carrying capacities.
Reasons why properties are carrying stock numbers less than capacity are complex and often are property specific. However, some of the factors that have contributed to low stock numbers of recent times include:
(i) destocking as a result of the Brucellosis and Tubercullosis Eradication Scheme
(ii) high costs of restocking destocked properties
(iii) lack of confidence in the long term security of the pastoral industry on the Peninsula, discouraging investment
(iv) low breeding rates due to existing stock management practices
(v) land speculation.
A disturbing issue that is associated with the low stock numbers is a trend for leasehold land with a pastoral designation not to be used for pastoral purposes. These areas of land are not running cattle or just a few head and result in a non-productive use of this land. The exclusion of these areas from pastoral use erodes the industry's development.
The attitude of the industry is that if the designation of the lease is pastoral, a genuine effort should be made to run cattle on that lease. Non-pastoral dominant use of pastoral leases is considered to be inefficient from an industry perspective.
Conversely, provision presently is not made for smaller hobby properties near population centres (eg. Weipa) or near fattening areas (eg. Tablelands). The industry's attitude is that the provision of 'smaller hobby farm' leases would be consistent with its overall attitude to pastoral use for pastoral leases and it would satisfy a demand for these blocks.
- Multiple-Use Planning
The industry appears to be supportive of the concept of multiple use planning. This support has been gauged from responses emanating from the Musgrave meeting (8 October 1994), circulated questionnaire replies and CYPLUS working group discussions.
Multiple use planning is not a foreign concept to the industry and it has been informally practised throughout the history of pastoralism in the Peninsula. Aboriginal access to culturally significant sites has been a regular occurrence throughout the industry's history. Environmentally sensitive areas of properties have either been only lightly grazed or not grazed at all with a view of maintaining the integrity of these areas.
It is the industry's attitude that 'Cape York needs to accommodate the widest possible range of business activity and land use'. There is room for a vastly expanded pastoral industry alongside mining, tourism, national parks, wilderness areas, strategic defence use, and Aboriginal land.
The principles of multiple use planning were supported by the industry at the Musgrave meeting and subsequent consultations. The logistics of fbrther developing these principles of multi-use beyond existing informal arrangements are the subject of conflict within the industry. The CYPPAG position on this issue is that 'pastoral leases have been granted and are legally binding agreements between the Crown and leasees. The degree that outside parties are allowed to participate in drawing up these agreements (for multiple use, access) is, and should remain, negligible.
These informal arrangements could change to more formalised legally binding agreements on properties subject to Native Title claim. This action is conjecture until mediations involved with the claims are finalised. However, individual properties have the right to negotiate individual agreements with respect to multiple use and access, regardless of ownership. These agreements are likely to be responsive to market forces and government policy. Interestingly, historians suggest that early lease conditions provided for access onto leasehold land.
Government Policy Making
The industry's current attitude to the government has developed fiom past inaction on the part of land authorities. Governments, in their roles as custodians of Crown or leasehold land, are perceived to have failed to supply supporting social and economic infrastructure required for industry development. Basic infrastructure support such as services, decent roads, communications, and social support are all deficient in the Cape. This contrasts with other areas throughout the State and, of more recent times, in the Northern Territory where the government sponsored infrastructure support has facilitated the expansion of live cattle exports fi-om Darwin.
With respect to production related problems, the industry perceives the government's attitude to pastoral lease conditions as limiting. The past practice of requiring traditional fencing and watering points, structures and improvements on leases are considered to be ineffective in Cape York. More flexibility, more security of tenure and more production incentive related conditions are considered relevant to the present industry.
Also, the industry considers that the policy of destocking for BTEC has had the effect of 'stripping' properties and subsequently many of these properties cannot afford to restock. In contrast, DPI has given positive support in investigating and working on production systems for the Cape, although the recent closure of the Batavia Downs research station has reduced this commitment.
In response to these concerns about government policy making, the industry has coordinated its efforts and formed the Cape York Peninsula Pastoral Advisory Group (CYPPAG), a local industry representative committee. CYPPAG coordinates comments on policy and develops and evaluates land use initiatives.

10.4 Future Industry Aspirations
A review of the industry's hture aspirations suggest that there is a view that the region is positioned to benefit from a number of 'windows of opportunity'. This optimism is tempered by individual and industry constraints.
National Perspective
From a national perspective, the local industry considers its location offers comparative advantages and serves a number of hnctions.
The basis for the comparative advantage assertion relate to the region's reliability of seasonal rainfall and closeness to Asian markets for live cattle exports. The high reliability of rainfall provides a security for planning needed for hrther development of the industry. Secondly, the Asian market is an expanding market for live cattle exports and Cape York Peninsula is physically well positioned to serve this market. The live cattle export market to Asia is expanding at around 20% per annum, with around 130,000 head exported out of Darwin in 1994.
Other national changes that will impact on the Peninsula's pastoral industry is the trend for northern Australian cattle to be marketed at a younger age and to 'changes in the pasture available, the increased mobility of cattle through the use of motor transport and the more rapid growth in cattle fattened in feedlots, are seeing northern cattle also marketed at a younger age' (Australian Beef 1993). Similar trends are expected in the Peninsula provided transportation networks are progressively improved and cattle control strategies are implemented.
Marketing Perspective
The Australian Meat and Livestock Corporation have identified that the hture of the industry 'lies clearly with the more aware, market-conscious grower who turns off cattle destined for particular markets and who is able to meet exactly the specific requirements of users in these markets'. Australia's entry in the 'fastidious markets of North Asia' with its tight specifications is 'encouraging the Australian industry to re-evaluate their production systems' (Australian Beef 1993).
The region is well positioned to supply live beef cattle to Asian markets via Gulf port facilities. The locational advantages warrant hrther attention to live cattle exports from Weipa and Karumba. The development of these markets beyond the 'pipe dream' stage will require changes to production systems and intiastructure support. Some sectors of the Cape York Peninsula cattle industry have aspirations of meeting this market-driven demand. Market related changes such as improved cattle control improving continuity of supply, improved infrastructure on and off property and the use of strategic 'finishing off paddocks will develop the existing store cattle production systems to maxirnise market potential.
Production Systems
Changes to production systems and infrastructure underpin the aspirations of those sections of the industry that see the industry developing in the future. The current management style is viewed as being 'not financially self supporting' (Cattlemen's Union Working Paper 1990).
When considering future production systems, the full spectrum is covered with some sectors promoting clearing of large tracts of land, other sectors promoting clearing of strategically located small areas to assist with cattle control, and other sectors relying on improved animal husbandry techniques. The decision on appropriate technology is determined by individual circumstance and also by specific regional constraints. Constraints to be considered include security of tenure, financial position, stage of life of pastoralist, existing property resources and infrastructure.
Cultural Considerations
Aspirations of participation in pastoralism within Aboriginal and Torres Strait Islander (ATSI) communities are as diverse as in non-ATSI. Land that is suitable for pastoralism under Aboriginal and Torres Strait Islander control or management is frequently under-utilised for cattle production. Aspirations for the future range from non-use of land for cattle production, to managed use for the supply of cattle for their own consumption to an expanded use initiated by improved marketing opportunities.
Initiatives involving cooperative marketing strategies, slaughter houses and associated infrastructure have been proposed by ATSI communities as opportunities for communities to move into the cattle industry. These developing production, management and marketing systems, supported by managed training schemes are essential to their involvement with the industry.
Competing Land Use Demands
Attitudes towards managed development of the Peninsula's cattle industry are predictably parochial. The industry is aware of competing land users' demands and objectives. However, the industry considers that the beef industry can develop in harmony with other land use requirements. The CYPLUS planning process provides a forum for a better exchange of views based on objective data. Resolution of land use disputes is best achieved at a grassroots level, within agreed procedures and protocols and based on sound information sources reflecting national goals.
Sustainable Development and Stewardship
The Australian cattle industry has recognised the increasing community awareness of the need for integrated natural resource management and appropriate environment policies. Land degradation issues such as soil erosion, salination, acidification, declining water quality, reduced ground cover of native species and habitat decline resulting in reduced biodiversity and endangered species are concerns of the wider industry. More specifically, two predominant concerns to policy makers are:

the effects of vegetation clearance and decline in the number and range of native plants and animals the impacts of agricultural activity on water quality and availability.
In Cape York Peninsula, many cattle producers aspire to protect their land for the purpose of handing on the property to the next generation in a sound condition. Management systems reflecting this aspiration will have to consider environment condition. Some of the wider industry issues and approaches mentioned earlier are present on the Peninsula, however the underlying commitment to sound stewardship of the land is part of the Peninsula's approach to land management. The role of the pastoralist as a steward of the land is on-going and inter- generational.
10.5 Opportunities and Constraints
Table 10.1 is an assessment of the pastoral industry's perceptions of the opportunities and constraints emanating fiom continued pastoral development in the region.
Table 10.1. Opportunities and Constraints - Pastoral Industry Perceptions
1 Native Title cIaims 2 Lease conditions 3 Government policy (living area
concept, land clearing) 4 Tenure classification (pastoral holding)
5 Existing condition of roa+ 6 Proposed improvement of roads (within 50 years) 7 Services 8 Port facility at Weipa
9 Cattle management systems & technology 10 Soil types, pasture condition 1 1 Climate/Rainfall pattern J
12 Alternative marketing outlets to Mareeba saleyards J
13 Weipa export facility
14 Levels of capital for development 15 Foreign Ownership 16 Changing land use to non pastoral
Environmental 17 Biodiversity 18 National Parks (present policy) 19 Pest and disease control

With respect to the pastoral industry's current attitudes and aspirations, this report considers an opportunity exists for the industry to develop in cooperation with competing land uses. It is considered that 'multiple-use strategies' for the pastoral industry can facilitate the achievement of objectives of other sectoral groups, as well as foster pastoral industry ambitions. This can be achieved by making decisions based on the objective data, by recognising existing legislative frameworks and by developing acceptable performance standards to monitor progress. Effective consultation at grassroots, regional and government levels underpins the success of the process.
In order for the industry to realise its potential, industry, government and the community need to focus on resolving the identified constraints to managed development. The tenure constraints restrict the industry's development by not providing a security of tenure to encourage development. Infrastructure constraints are a significant problem to all sectors on the Peninsula and a progressive improvement will facilitate improved marketing opportunities and the continued introduction of sustainable production systems. The continued implementation of sustajnable production systems is the key to the progressive resolution of the economic constraints. These investigations suggest that the industry is capable of a progressive improvement in economic performance and the rate of improvement will be affected by the rate of resolution of the identified constraints.
Sustained development with improved infrastructure, improved employment prospects for the region's youth, increased wealth-generation emanating from industry diversification, preservation of environmental values and maintenance of cultural values are potential outcomes, provided the pastoral industry of the kture can be developed on sustainable and multiple-use principles.

11 NON PASTORAL INDUSTRY ISSUES AND ASPIRATIONS
11.1 Consultation Process
A preliminary assessment of the current attitudes and aspirations of the non pastoral community was conducted by consultation with government agencies, representative sectoral groups and the CYPLUS consultation processes. Government agencies contacted included Lands Department, Department of Primary Industries and Department of Environment and Heritage. Sectoral groups contacted include ACC, CYLC and CAFNEC. The CYPLUS process included two meetings with the Land Working Group and discussions with other CYPLUS LUP consultants. No specific non-pastoral community analysis was completed as other LUP projects, in particular the Value, Needs and Aspirations report, addressed these issues. With respect to community aspirations for the pastoral industry in the Peninsula, data &om Professor John Holmes' investigations have been used. Holmes' (1995) report has been used in the absence of any other documented survey data being found at the time of writing. Assessing the validity of Professor Holmes' findings was not seen as the province of this Pastoral Industry Report and Holmes' findings are represented as objectively as possible.
11.2 Current Non Pastoral Industry Issues
Based on the findings of our limited research and other reports earlier mentioned in this section, Table 11.1 represents a summary of key issues we perceive are both important to the non pastoral industry sectors of the Peninsula and also may have impact on the future development of the industry.
Aboriginal and Torres . Recognition of their race. Strait Islander sector . Land ownership as a right, as stipulated in the provisions of the Native
Title Act. . Resolution of existing Native Title claims. . Land Management strategies observing management protocols linked to
their cultural heritage. . Access to sites of cultural signiJicance. . Access to funds for land acquisition. . Protection of areas of high cultural value. . Assistance to improve pastoral and industry management skills.
Environmental sector - . Need for representative reserve system eg. National Parks, protected areas . off reserve conservation management. . Alternative land use to pastoralism in areas that are ecologically
unsustainable or economically unviable. . Development based on ESD. . Resourcing of Aboriginal and Torres Strait Islander people for ecological
land management. . Protection of areas of high conservation value.
Other non pastoral industry . Managed economic growth. sectors . Increased employment.
. Increased regional wealth.
. Protection of areas of high conservation, mining, pastoral, cultural value.
. Sustainable development.
. Diversity of industry.

With respect to the generic cate~ories of economic, social, environmental and tenure, the issues relating to them are presented in Table 11.2. These issues are not presented in any order of priority.
Table 11.2. Community attitudes and issues
Insecurity of tenure. Multi use tenures - for and against. Cooperation and co-existence in management. Lease control/land subdivision. Difficulties in managing National Parks due to low budgets. Fallacy of acquiring National Parks based on old property boundaries.
Environmental Protection of sensitive conservation area. Sustainable development of rangelands. Impacts of intensification of pastoralism. Weed invasion from introduced species. Wilderness and heritage value. Weed control (eg. rubber vine) and degradation. High sediment loads in rivers. Maintenance of 'wild and natural lands in their present condition'.
Preservation of sites that are culturally significant. Aboriginal decision-making based on families. Non specific identification of cultural sites. Tree clearing constraints due to cultural reasons. Maintenance of generational non-Aboriginal culture.
Economic efficiency vs social equity. Poor economic performance of existing systems. Cooperative advantage for industry. Wealth generation attributes.
- Live cattle export potential.
With respect to sectional opinion on specific issues, Professor Holmes surveyed the major Peninsula stakeholders:
Cape York Development Association (CYDA) Cape York Peninsula Pastoral Advisory Group (CYPPAG) Cairns and Far North Environment Centre (CAFNEC) Cape York Land Council (CYLC) Aboriginal Coordinating Council (ACC)

Queensland Mining Council and Comalco (QMC) Cook Shire Council (CSC).
In summary, Professor Holmes identified the following issues as in need of attention:
lease subdivision Aboriginal access on pastoral leases (more urgent) measures to preserve valued habitats and species (longer term) procedures for approving alternative, third party use land management planning - voluntary vs compulsory clearing controls on leases tenure options for pastoral leases purchased for Aboriginal peoples.
The detail of addressing these issues draw divergent views among the project's participants. The divergence of views persisted mainly between CAFNECICYLC and CYPDNCYPPAG.
Other important issues that did not have such divergent views included:
riparian access and management land management planning - concept zoning near population centres private uses in National Parks a new public tenure to accommodate private uses.
All the issues raised in this section are related to the pastoral industry. They are significant and will impact on the hture development. These issues have been taken into account in this pastoral industry project.
This section simplifies the findings of the Tenure report, however we consider it addresses the key elements of the report presented by Professor Holmes. The represented findings as those of Professor Holmes as determined by his investigations.
11.3 Current Non Pastoral Attitudes and Aspirations
Australia is presently evolving through a phase of re-assessment of attitudes. Traditional values on most social issues are being questioned and society as a whole is re-evaluating attitudes. In general terms, social attitudes towards our environment, our heritage, our past history, roles of women in society, ownership of land, our approach to land management, and our general government approach are all being questioned. Many of these issues have a strong focus on Cape York Peninsula.
Changing legislations and government policies are evolving community sectoral responses to these issues that are generating misunderstanding and insecurity. The seeds of misunderstanding and insecurity usually grow into forms of social division. This circumstance has the potential to occur in Cape York Peninsula due to the complexities and number of social change issues that need to be resolved.
With respect to the pastoral industry issues, sectoral grassroots responses are presently balanced, with a central attitude of working together to resolve the issues as they arise. It would be naive to suggest that no antagonism exists, however the seeds of misunderstanding and security have not matured yet.
Sectoral responses to our contact have ranged fiom the extreme single sector control, use and management of land to the middle ground whereby cooperative use and management strategies are preferred to those sectors satisfied with the status quo. Interestingly, all sectors contained extremist, middle ground and status quo elements. This study does not align itself with any preferred grouping and its aim is to present its findings on the pastoral industry fiom an independent position determined by the brief The existing laws of the land are accepted and any proposed changes are geared towards sustainable development for Cape York Peninsula.
It would be trite for this report to attempt to express stakeholders' viewpoints on the many issues raised, suffice to mention the list of issues is not exhaustive, but it is representative of consulted stakeholder opinion. From the project's viewpoint, the complexity of issues will make it difficult to propose 'one right' solution. The region's land use strategy process should be reflective of these issues.
11.4 Opportunities and Constraints
Table 1 1.3 is an assessment of the non pastoral industry's perceptions of the opportunities and constraints emanating fiom continued pastoral development in the region.

Table 11.3. Opportunities and Constraints - Non Pastoral Industry Perceptions
1 Recognition of their race 2 Land ownership as a right 3 Native Title claim 4 Cultural land management strategies 5 Sites of cultural significance -
protection and access 6 Land acquisition fund J
7 Involvement in industry Environmental sector
8 Representative resene system 9 off reserve conservation management J
10 Non pastoral use of 'unviable' and 'unsustainable' properties
1 1 ESD principles 12 Aboriginal involvement in the industry 13 Protection of high conservation value
Other non pastoral interests 14 Managed economic growth 15 Employment 16 Regional wealth


' SECTION F: ENVIRONMENTAL AND SOCIO-ECONOMIC IMPACT ANALYSIS
12 ENVIRONMENTAL ANALYSIS
12.1 Land Condition Analysis
Previous Studies
Environmental impacts are taken as including landscape, vegetation, soil, water and air. Monitoring of air pollution is non-existent in the study area, with the exception of the Weipa bauxite and kaolin mine sites where Comalco practise dust suppression techniques and monitor dust levels. Apart from sediment and nutrient estimates (Moss et al. 1993), water pollution has not been intensively studied in Cape York Peninsula although Comalco monitor the effects of mining and loading operations at Weipa. Vegetation changes as a result of the pastoral industry have been referred to in a number of studies but estimates of the location and area of cleared land are not easily available from the Lands Department office in Cairns. Data from the QDPI database gives a 'disturbance map' as shown in Map 7.
The impacts of the pastoral industry on the native pastures (ground cover) and soils of the study area have been estimated by various researchers (Weston et al. 1981). The first- estimate of soil erosion was made in 1975 for the shires of Cook, Carpentaria, Croydon and Etheridge, including sections of the shires of Burke, Mareeba and Herberton (QDPI .1.975). At that time there was only 0.03% of the area under cultivation, so the erosion survey was ,
essentially a grazingland condition survey, covering a total area managed by 390 landholders.
Approximately 85% of the 1975 survey area consisted of native pastures used for beef cattle breeding and fattening on properties which averaged 100,000 ha. That survey estimated the eroded area from the length of the Peninsula rivers based on the observation that virtually all

the erosion occurred on the river frontages, levees and floodplains near permanent water. Based on a 10 km wide strip of frontage country being affected along a total of 1,981 krn of rivers an area of 3 14,000 ha was estimated to be eroded and in need of treatment. A total cost of $2,080,000 was calculated as the value of fencing and water trough provision as a means of overcoming the degradation problem. The original field notes from the 1975 survey warrant documentation here:
'Friable earths and clays fairly stable. Duplex and massive earths highly erodible when; disturbed. Main soils very permeable with poor moisture holding capacity. Inherent fertility very low. Grazing land erosion is mainly on frontage country of all the rivers and permanent waters. Necessity for stock to walk down river banks for water and concentration on grazing frontage country. Definitely not economic for property owners to provide pumped water '
supplies and necessary fencing. Natural drainage system [shows] very severe streambank erosion due to high runoff from ranges and incised cattle pads down'river banks. Fldoding of lower floodplains [occurs] annually with frequent substantial stock losses and damage to fences and waterpoints- Most properties in the zone have not been financially rewarding except for peak years when the market suited the type of stock produced. Management practices are generally of a low standard. There is much burning of pasture in selected areas to assist in mustering large areas. This accentuates the erosion risk. High risk of damage by fire and flood does not encourage management aids such as subdivision [fences] and pumped water supplies.' (Field Notes for Inter-departmental Report 1978)
In a more recent survey by Tothill and Gillies, the 1978-80 estimates of pasture condition are compared with the 1991 estimates for the three major types of grazingland in the Peninsula:
, *"' - 1978-SO(%) 1 99 1 (%)
Good Fair Poor Good Fair Poor
1 Native Sorghum 90 5 5 90 5 5 2* Plains and low hills 80 10 10 20 70 10 3 * Northern flooded alluvial
plains 45 35 20 30 50 20
* Schizachyrium grassland
The areas of these three types have a capacity of 31,000, 139,000 and 56,000 cattle equivalents respectively (Tothill and Gillies 1994).
Other studies such as CSIRO's general 'degradation severity index' based on the ARIS survey .
dated 12 January 1988, maps the whole of the present study areas as being 'moderately' degraded, ie. the second most severely degraded in four classes (severe, moderate, &ld and not degraded) (Ive and Cocks 1989).
...
In reviewing recent changes in Cape York ecosystems, Stanton (1992) reports that the most . threatened habitats in the Peninsula are the grasslands. The threat, in Stanton's view, comes &om the absence of earlier Aboriginal burning, and the invasion of exotic pasture grasses which may be beneficial from a pastoral viewpoint but detrimental in terms of native fauna habitat (Winter and Allison 1980). The removal of cattle fiom Lakefield N.P. has led to localised spreading of Digitaria decumbens pangola grass) in low lying areas. We are a

advised by CYPPAG that the areas of pangola grass on Lakefield National Park total only- - -
several hectares out of a total area of over 500,0% ha.- These areas are being monitored by DEH staff. The other extensive grasslands are around Princess Charlotte Bay, on the west coast south of Aurukun, along the east coast between Silver Plains and Lockhart River in the valleys of rivers such as the Nesbit. A similar threat is held by Para grass (Brachinria muticn) for the wetlands of places like Aurukun, in the same way as it has ruined the Townsville Common Bird Sanctuary, according to Stanton.
In some regions of the Peninsula, the most significant change in the vegetation is the result of the replacement of cool mosaic burns (as practised by the Aborigines) by widespread late season hot fires (Crowley 1994). Stanton records that these fires are often started by lightning and that their effect is to scorch and kill the margins of the rainforest and replace those areas .
with grassland. There is no doubt that rainforest does not presently occupy all the soils which it can occupy. On the moist east coast, rainforest is expanding prim&rily due to less burning.
Early burns in the dry season are often limited to small areas in an effort to concentrate cattle grazing. This causes severe loss of cover until the rains come and leads to unfettered invasion of tree saplings in the absence of grass which means no competition and no hot shrub-killing fire the next season.
Another vegetation change indirectly associated with cattle is the effect of feral pigs. Feral pigs have a massive effect in churning up the riverine wetlands. The wetlands are further threatened, in Stanton's view, by the introduced tall wetland grasses (ponded -pastures) Hynzennchne amplexicnzrlis and Echirlochlon polystnchn. The floating masses of vegetation formed by these grasses could conceivably smother the Peninsula's lagoons. . - C '
The relationship between the pastoral industry and the worst weed in this region, namely the exotic Rubber Vine (Cryphtostegin grand~jlora), is complex and not well understood. ,It has choked much riverine vegetation in the southern Peninsula, killing trees and forming impenetrable thickets. Rubber Vine establishes best in silt and is sensitive to fire. Where heavy grazing along streams has removed grass competition and fire, this weed flourishes. Stanton has shown at Lakefield N.P. that if caught early in its establishment, the vine can be controlled by hot fires from sufficient grass.
A very different form of degradation in the study area is the water erosion emanating from roads and tracks. While this form is by no means limited to the pastoral industry, much of this damage occurs on _cattle properties where multiple tracks are formed, concentrating surface water flows and directing runoff water out of the natural drainage. This issue is of particular significance in areas of highly erodible topsoils in landscapes with long (not necessarily steep) slopes, as occur in the vast grazing areas underlain by 'massive earths (Bb4)' (Northcote 1980).
12.2 Catchment Condition Analysis
The normal connotation of catchment condition, as used in southern Australia, has not been appropriate to the Peninsula under its past and current land use. The reason for this is, that in its virtually natural state, the surface hydrology of the region has been so little changed by land use, that landholders downstream in the Peninsula river systems probably cannot identi@ any significant changes in the volume and quality of river flow which can be positively associated

with land use. There may be limited exceptions to this where localised clearing has occurred, such as on Lakeland Downs, Heathlands and Lockhart River holdings, and in the much- publicised case of the Mitchell River (only part in study area).
This report makes mention in several sections, of the concentration of cattle near permanent waters, resulting in some streambank erosion and increased turbidity of the water. However, the undeveloped nature of lower reaches of most of the Peninsula rivers, together with the. vast volumes of runoff during the monsoon season, have tended to mask the significance o f ' any deterioration in catchment condition which may have occurred to date. This situation is' markedly different from that in southern Australia where off-site effects of clearing, salinity, nutrient enrichment and sedimentation have had serious economic consequences for water users downstream.
The studies of Pain et al. (1994) and Moss ef al. (1993) have recently studied the ,potential soil loss and surface water quality respectively, in the Peninsula. The former authors have attempted to apply the Universal Soil Loss Equation to the area and conclude that the erosion hazard for most of the CYPLUS study area is 'in the range of very low to low mainli because of the high permeability of the sandy soils ...'. They recommend conservative stocking rates, location of stock watering points away from areas of high erosion risk, fencing off of eroded or erosion-prone areas, and planning roads with erosion minimisation in mind. QDPI have identified significant areas of erodible massive earths and duplex soils in the Peninsula. These areas would need to be carehlly managed and strategies proposed by them should be considered on these areas.
The results of Moss et al.'s (1993) assessments of sediment and nutrients in Peninsula rivers indicate relatively high levels of nitrogen and phosphorus, recorded from thk nktural (undeveloped) catchments of north-east Cape York Peninsula. In addition, relatively high silt loads were recorded for these rivers despite low cattle numbers in the catchment. These authors state that 'more than 61% of the north-east Cape York Peninsula catchment is used for grazing and could not be rated as pristine'. The Fitzroy, Burdekin and north-east Cape York Peninsula were recorded as the State's highest sediment-yielding coastal catchments. The extent to which there is a causal relationship with grazing requires clarification before it is assumed in the present report.
12.3 Pastoral Use Impacts on Natural Resources
Under-Use of Pastoral Land
Of all the grazinglands in Australia, those of Cape York Peninsula have been shown by several studies to be in better general condition than any other pastoral regions. As referred to elsewhere, approximately 90% of the major native pasture type of the Peninsula is, in good condition. For the State overall, this figure is nearer 30% (Weston et al. 1981).
It must be concluded that the unusually good condition of most of the Peninsula's native pastures, is due primarily to under-use, ie. an unusually low overall stocking rate for the total
'
area. This is due to the lack of property infrastructure which in turn is the result of a general lack of finance. The outcome of this situation is an unusually uneven distribution of cattle over the property as a whole, leading to high concentrations near the waterways and very low use or even non use of the outlying areas of the property. Techniques such as patch burning

..- . and wide distribution of supplements do assist in attracting animals away from the water to - - -
some extent, but by and large the under-use of the 'outside country' is a very widespread phenomena.
The questions must thus be asked when attempting to predict the hture impacts of pastoralism, 'Where and how can sustainable cattle production be practised-in the Peninsula?'_. and 'Is cattle production in the Peninsula in the best national interest?'.
Over-use of Pastoral Land
As reported earlier, the land of Cape York Peninsula used for pastoralism has been over- and . under-used on a mosaic pattern determined by the location of permanent water and to a lesser extent the position of roads and access tracks. The under-use is evident in country which is distant from reliable waterholes, or inaccessible or vegetated by -plant communities which provide little or no grazing (heathlands, rainforest, mangroves). The 26 major vegetation types have recently been mapped (NRAP 1994) and their areas calculated as a'-basis for potential carrying capacity computation.
Those areas which are under-used by cattle are, however, not necessarily in pristine condition since feral animals such as pigs, and encroaching weeds such as Rubber Vine are causing major changes to such ungrazed areas. The over-used areas, though much smaller in total size, are of special significance in this overview of the pastoral industry. Several.forms of degradation have already been described under Environmental Impacts and it is appropriate to exemplify these by way of the Kowanyama case study: . .?' - The Kowanyama Deed of Grant in Trust Lands are showing'signs of several forms of over-use according to Clark (1 992), namely:
soil loss from water erosion in heavily stocked localities soil structure decline from trampling weed invasion from species associated with stock and stock feed invasion by feral animals such as pigs which feed partially on dead stock excessive harvesting of fauna by personnel associated with the pastoral industry decline of wetlands due to trampling and grazing by cattle ecological changes in vegetation due to a changed fire regime suited to the pastoral industry erosion due to vehicle tracks and road-making.
To overcome these degradation problems it was agreed by participants at the Kowanyama Land Degradation Conference (KAL,NRMO 1992) 'that cooperative land management. strategies (can) be developed in the future, and within which, the Kowanyama Aboriginal Community will continue to play an active role.'
Beef production impacts from over-use of the resources is at the heart of several of the basic '
problems. It was awareness of these problems which led the Kowanyama community to be instrumental in the formation of the Mitchell River Watershed Group (ARRI 1994). In 1992 the community had called for a consultant to assist with their Kowanyama Cattle Company management plan.

12.4 Pastoral Use Impacts on Biodiversity
In an era of environmental awareness there will inevitably be a critical evaluation of the effect of a land use such as pastoralism on the conservation values as measured in terms of biodiversity. The study of Winter and Allison (1985) suggests that there was no evidence a decade ago, that any species of endemic (locally unique) fauna had become extinct anywhere in the Peninsula, at least not during the past 30 years. Apart from marine mammals, there are-;, 81 mammal species in the study area. The unique Australian monotremes (platypus and echidna) are two of these, marsupials number 33, rodents 14, bats 31 and carnivores 1. A total of 76 of these had been recorded by 1948, and a hrther five between 1949 and 1980.
Other CYPLUS projects will report on the value of the biodiversity of the region but for this " study of the fbture of the pastoral industry, it is sufficient to note that the fauna and flora of the Peninsula are richer in species diversity than virtually any region in Australia. Bats are a case in point, where 3 1 of Australia's 59 species occur in Cape York Peninsula. The bird population of the region, with 108 species of water birds and 258 species of land birds Wkkawa 1976), is amongst the richest in the world. In terms of the number of plant species, the area is also noted as the most diverse in Australia, ie. 2,533 plant species (Cocks 1992). The richness of the ecology of the Peninsula stems from its geological origin as a 'meeting place' of the great faunas (and their habitats) of wet tropical Papua New Guinea and dry inland Australia.
The pastoral leases share the Peninsula with principally National Parks and ~boriginal land use. Some of the areas, while not presently proclaimed as parks, have special environmental significance. For several historic reasons the coastal areas presently designated for qecial uses are concentrated on the east coast at least in the northern section of the Peninsula. This is despite the abundance of archeological evidence of concentrations of Aboriginal population at a number of west coast sites indicating a strong case for Aboriginal association in these areas.
The distribution of the cattle industry is presently concentrated in the centre of the Peninsula, with the majority of the west coast allocated to Aboriginal land use, some of which includes cattle raising. Except for a section of reserves across the centre (Archer, Coen and Wenlock river areas) all the present National Parks and Aboriginal lands bound the coastline. ., ..
The present NRAP studies should identi@ all areas of special environmental interest including habitats which waFrant protection from cattle grazing and trampling. The wetlands will probably be shown to be of special significance.
Considering the Peninsula as a whole, the McIlwraith Range (NE of Coen) is considered to have the highest diversity of birds and mammals and as such warrants special attention from' biodiversity analysts. Similarly the upper and lower Jardine river and Lockerbie rainforests are
<.. of special significance.

12.5 Potential Impacts of Pastoralism - -
High versus Low Input Systems
Potential impacts on the economic sectors of Cape York Peninsula are more clearcut than impacts on the landscape which may be measured using either social or environmental criteria.
As referred to earlier, present grazing leases total 75 and constitute 9,352,676 ha or an: average size of 83,506 ha. About 46% of leases are under 45,000 ha and five leases exceed 250,000 ha. No big public companies such as Stanbroke Pastoral or Australian Agricultural hold leases in the study area. The Sudley holding held by Comalco is the only public company lease.
It is difficult to confirm a single figure for the natural or potential capacity of the Peninsula. The Lands Department (1994) estimates the total (natural) carrying capacity of Cape York Peninsula leases at 207,680 cattle based on one beast per 45 ha. As pasture technology expands so the potential carrying capacity will increase. The unimproved value of the leases totals $8,095,700 or 86cha based on 'grazing value' not 'higher value' and it is in this context that development for pastoral purposes must be evaluated.
Intensification of pastoral systems ranges from historical use of native pastures through a series of increasing inputs of improved husbandry practices to improved grass and legumes together with associated fertiliser increases, in a physical framework of more fences; smaller paddocks, reticulated watering points and supplement feeding structures.
5
It appears that a general lack of knds resulting from poor turnoff rates and high transport costs, has prevented the more rapid adoption of these 'improved' technologies. Uncertainty on issues such as permanent tenure has no doubt also been a major reason for lessees not to invest more heavily in property improvements and infrastructure. Delays in gaining government commitment to an abattoir near Cooktown and full export loading facilities at Weipa have been additional factors which reduced producers' will to invest in intensification. The construction and maintenance costs of fencing on relatively low carrying capacity country (1 :30-80) is another long-standing deterrent.
Provision of water is usually in the form of simple gully dams, with very few well-equipped earth banks or bores. Artesian bores are rare and limited to a few leases on the western side of the Peninsula where mining operations sunk bores in the past (WRC 1988). However, pastoralists advise that "presently artesian bores are (now more) common through most of the Peninsula" (CYPPAG, 1995).
Much has been written about the trials and potential of improved pastures, as detailed in Sections 6 and 7. As a cost-effective alternative to protein supplements, properly fertilised legume pastures have been reasonably successfbl in selected areas of good soil. Phosphorus licks for cattle are also recommended. Presently legumes such as Wynn cassia and others including Seca and Verano can be well established but may not persist especially when burned. It is common to find however, that the heavier grazing pressure associated with legume pastures tends to eliminate the upright tufted native grasses and can lead to bare areas and resultant sheet erosion.

Legumes plus 50-80 kglha of fertiliser can increase carrying capacity from 1:30 ha to about 1:3.5 ha a few years after establishment. In its most intensive form such improvement would
-
require initial clearing of all timber before establisment and fertiliser application at least every three years. Clearing is expensive and control of regrowth causes on-going maintenance costs. In addition, the ecological effects of clearing trees which act as 'mineral pumps' on infertile soils are not well understood, nor has the effect of timber removal on ecosystem biodiversity been hlly studied although the reduction in total species is well documented.
In high intensity management systems, the best of the improved pastures may reach a carrying capacity of 1.2 ha which for a viable herd of 3,000 cattle may require 5,000 ha to be cleared. Unless on-going inputs of fertiliser and management are maintained, the pasture and its productivity will dissipate and the return on the investment in clearing, fencing and" establishment will be lost. The application of this practice is recognised by the industry as being limited to a small number of larger pastoral operators. It is presently beyond the financial capacity of most individuals.
The historic low intensity beef production system by contrast is low cost, simple and requires minimal management. Cattle are run year round on native pasture and mustered only once per annum when all operations and drafting are done. Mortality is high, calving rates are low and weight gains are slow in this system. Advantages of the system are low costs, low management requirements and simple infrastructure (often no more than three fenced paddocks). The inefficiency of mustering in vast unfenced areas has led to a build-up of feral cattle in some less accessible and lighter carrying capacity country. These areas may be mustered only once in two or three years. The cattle that are found there are mainly bred in these areas, however, occasional additions from better accessible country stray into thb hrea. Because of the low costs of this system, many lessees with little capital have been able to establish themselves in the Peninsula cattle industry. Because of unusually low production per unit area, economies of scale do not result in larger areas necessarily becoming viable economic units in the absence of intensification and development.
In addition, the transport distances in the northern region of the Peninsula are such that trucking costs are beyond the level which can be absorbed by this system while still yielding a good profit margin. See Anning's (1980) overview for a general description of the problems and possibilities of pasture intensification in the Peninsula, .as seen by the QDPI at that time.
As discussed, a number of management options are available and used by the pastoralists of the Peninsula. These options range from high intensity complex improved pastures to low intensity open grazing situations. These high and low management intensity extremes are not recognised as appropriate to properties on the Peninsula, however, they are presented to demonstrate the level of potential impact if significant areas (not properties) were developed under either system. The predominant management involves a combination of improved husbandry practices and strategic pasture improved areas.
. ..
The administering authority of the grazing leases, ie. the Lands Department, has no preferred . production system, provided the land is maintained in good condition and the revenue raised through rentals meets the State's expectations. Somewhere between the basic traditional

system and the highly developed intensive system of beef production in the study area, is an improved management system which is a compromise between the high and low cost systems. This improved management system is based on early weaning, phosphate supplementation and disease control, notably botulism (which is associated with phosphorus deficiency) and vibriosis, as detailed in Section 6.
Whatever the system used, special attention must be given to resource maintenance and', Landcare in all its facets - weed control, gully reclamation, creek bank restoration, scald rehabilitation, salinity control, contamination control (arsenic dips) and pasture degradation and its associated erosion.
Size of Holdings
There are presently significant problems in interpreting the ~ a n h s Department's carrying capacity estimates since they vary by 300 to 400% for many types of country. However, this information is presented as it was being applied by the Department of Lands at the-time this report was prepared. Additional data will become available from the CYPLUS planning process and this will provide the Department of Lands with recent objective data in the fbture to establish better researched carrying capacities and holding size requirements.
Of the current leases, about 90 may be deemed to be too small, ie. less than the so-called 'living area' (3,500 head) as designated by the Department of Lands. Only about 15 leases are above the desired size for a living area. These estimates assume a carrying capacity based on unimproved native pasture, so if large scale development of properties was to allow significant intensification and thus an increase in carrying capacity, very few leases would be deemed too small. The chances of this happening are analysed in Sections 6 and 7. It should be noted that Aborigines presently hold four leases (3.5%) averaging 162,000 ha or a carrying capacity equivalent of 3,5 13 head. (Bonny Glen, Helmsley, Ancilia and Coen river pastoral leases.) Nine leases (8%) totalling 568,270 ha (15,379 herd equivalent) are held in the study area by foreign owners, and only one lease (130,000 ha; 5,200 head) is held by a public Australian company (0.9%). The 72 leases (not all 'grazing leases') held by private individuals (60%) average about 63,000 ha with a capacity of about 1,530 head each on average (including approximately 15 leases with a carrying capacity of less than 100 head).
The environmental influence of property size is difficult to estimate because of three major factors:
- the type of country and its carrying capacity the extent of development and pasture improvement the uneven environmental effects caused by very localised distribution of stock in the vicinity of permanent water.
Of the 26 major types of pastoral country (Appendix 12.1)- the heaviest stocking pressure would usually be concentrated on no more than six of these types (Lands Department lb, 4a and b, 5b, 6a and 8d), all of which are located in low lying areas where storm runoff concentrates in the wet season. It is also within these areas that permanent water and thus stock concentration occur.

Roughly half of the types of country available (12 of 26) are regarded by the Lands Department (1994) as having no potential for improvement (increase in careing capacity) and are thus disregarded as areas for increasing viability through development.
An examination of the 112 leases indicates that 26 are regarded as capable of improvement in terms of carrying capacity. This represents 23% of the Peninsula's leases. Based on the Lands Department's (1994) figure of 3;500 head as an economically viable herd, aboutf, 160,000 ha constitutes a living area in the current cost/price structure. While some individuals: hold more than one lease, a number of the family properties will require amalgamation or intensification if they are to achieve commercial viability.
However, a more useful assessment involves the use of the DEH vegetation database and the - '
Lands Department's carrying capacity database. Viability of holdings has been computed and mapped. Pastoral holdings have been classed as viable (over 4,000 head c.c.), marginally viable (3,000-4,000 head), non-viable (below 3,000 head) and presently not managed for grazing (National Parks and Aboriginal land). The viability of pastoral holdings %ased on existing carrying capacities and potential carrying capacities have been mapped on the GIs as shown in Maps 5 and 6. These maps are of particular significance in planning the fbture of the Peninsula's pastoral industry. The existing and potential capacities of each lease are shown in alphabetical order in Appendix 6.3. This appendix demonstrates that the existing carrying capacities can support a herd size of 182,308 and potential carrying capacity can support a herd size of 539,813.
The appropriate size of properties cannot, however, be finalised without reference to the way of life and thus the economic expectations of the landholders. Thus Aboriginal cornmMties wishing to run cattle primarily for consumption by themselves, could satisfy their needs and the requirements for environmental stability with relatively small numbers of cattle. This could translate into either smaller properties or lower stocking rates or both. The environmental effects of cattle are, however, primarily the result of distribution of animals on the frontages, rather than the result of overall stocking rates or overgrazing in general. It should a l s ~ be noted that many graziers responding to this study's questionnaire, indicated no intention of high intensification.
12.6 Mapping of Productior~ and Conservation Land. Units
The tropical tall grass pastures of the Peninsula make up 10.4M ha or 6.0% of the State's native pastures. Their estimated total carrying capacity may be 190,000 head of cattle or 1.5% of the total Queensland herd. By comparison, Black speargrass pastures carry 2.6% of the State's cattle, Brigalow country carries 17%, Mitchell grass 15.5% and Mulga 4% of the beef herd (Weston et nl. 198 1).
Against this background, the grazing country of the Peninsula should now be mapped to identify its production and conservation areas in detail to allow for the application of categories of land use as proposed by Morton et nl. (1994) for Central Australia. These . workers propose four categories of land management units (see Appendix 12.2):
(a) National Parks (including Aboriginal traditional use). (b) Excised Management Units (EMUS) - small conservation areas. (c) Restricted Use Units (RUUs) - pastoralism and tourism.

(d) Sustainable Use and Living Areas (SULAs) - multiple use areas for grazing, mining, tourism, Aboriginal settlements.
This division of land was proposed for arid Australia and requires modification and adaptation for Cape York Peninsula, but the basic concept holds promise as a framework for coexistence of a range of community interests in the Peninsula. Appendix 12.3 shows the scale and criteria proposed for the arid zone and indicates how cost-sharing may be achieved, including salaries for land stewards as referred to elsewhere. This approach should be given priority by the: CYPLUS Taskforce as a basis for planning of Peninsula land allocation.
In a recent paper by Friedel (1994), in answering the question 'Is it possible to maintain livestock grazing industries and conserve biodiversity at the same time?', Friedel says 'The - '
simple answer is that there is no real alternative. The biodiversity of the rangelands is too great to be represented in existing park systems, and the community cannot afford to acquire and manage large traditional tracts of land. Instead, we must accept that biodiversity conservation and productive use of land can and do coexist in many areas.' Friedel infers that especially where pastoral production is not economically viable, serious consideration must be given to reviewing land use in the context of balanced community objectives on a regional scale.
12.7 Tile Precaution;i~y P~*inciple anci the NRAP Maps
The CYPLUS program has provided for the most comprehensive mapping of land iesources undertaken anywhere in modern Australia on such a vast scale. Despite this multi-disciplinary use of the GIs technology, many questions will still remain unanswered at local level, n~tably on the distribution and status of rare fauna and flora, including insects and lower plants. The same uncertainty surrounds the 'degradation' surveys which, at their present scales, may overlook not only the more subtle changes in species (as in grass species composition), but even the more obvious symptoms such as erosion associated with roads and tracks and the botanical effects of changes in fire regimes.
One of the subjective judgements which will be required in developing CYPLUS policy, is the extent to which susceptibility to degradation (eg. as shown on erosion and salinity maps) should influence land allocation decisions. Soils mapped as potentially erodible or saline, may cause planners to be cautious about future uses - thus the need to heed 'precautionary principle' which states that until a particular land use or development can be proven not to degrade the environment, approval of such use should be withheld.
There are real problems in applying this principle at Cape York Peninsula, firstly because much of the land has already been used for a particular purpose for the past century, and secondly because even when a particular land use appears to meet theoretical environmental requirements, the level of day-to-day management becomes the determining factor in its effects on resources. The size of properties, isolation, wet season constraints, and-poor transportation networks will affect day-to-day decision making in Cape York Peninsula.
The interpretation of NRAP maps such as those for erosion and salinity potential will no doubt be different for optimists and pessimists (or idealists and realists). Thus in attempting to sketch the filture of the Peninsula beef industry within environmentally safe limits, not only the spatial distribution of filture cattle grazing, but the level of intensification (development),

stocking rates and infrastructure will need to be agreed on, preferably in the form of a comprehensive Property Management Plan (PMP).

13 SOCIO-ECONOMIC ANALYSIS
13.1 Socio-Economic Impacts
Positive Impacts
Several estimates of the economic benefits of the Cape York beef industry have been '. published. These estimates range from the Connell Wagner gross market value of $20M to - CAERA Gross Regional Product (GRP) figure of $7.2M in 1991-92. Analysis of the CAERA data demonstrates that pastoral industries have contributed to the economy of the Peninsula on a regular basis. This contribution may be relatively small, especially when compared to mining, however, the impact is positive. Economic benefits have been derived in the '
associated regional industries of transport, trade and finance. Connell Wagner also identified income generated by the road transport industry amounts to approximately $1.5M from trucking cattle and $300,000 from other freight. The value of vehicles and associated transport equipment is $10.4M (Connell Wagner 1989; ABARE 1988). The rates and taxes paid by the rural sector (primarily pastoral and mining) varies from $258,000 to $662,000 depending on the year. Total property debt in the region varied from $7.5M to $13.8M from 1985 to 1988. The average rate of return on capital (excluding capital appreciation) varied from -1.3% to 12.1% between 1985 and 1988 and averaged approximately 6% during the decade before. Multiplier values in the order of 1.5 for the pastoral industry will generate hrther wealth for the Peninsula economy.
Social studies related to the beef industry are sketchy and incomplete and are best dealt with in the social program of CYPLUS. . r f
A number of current sources of economic information have been canvassed. The Peninsula cattle stations employ about 400 workers in total. The lessees and their families, together with these workers, form the bulk of the non-indigenous Peninsula rural community. They are augmented by a small population of service personnel and government officers stationed in the small towns of the Peninsula.
The distribution of wealth and the spread of benefits among the various community groups of the Peninsula indicates major discontinuities in economic status. The most striking example of this is in the mining sector where vast investment in plant and labour has led to relatively small economic gain to the region's community. In the pastoral industry vast tracts of land have produced a meager disposable income for most graziers and their families, and little benefit to Aborigines other than stockmen's wages. However, the industry has been a regular contributor to regional wealth levels, albeit at modest amounts.
Contact with representatives of the pastoral industry indicates a clear and unambiguous. perception by the pastoral families as seeing themselves as the backbone of the Peninsula social fabric. This image of the grazier community is probably not supported by the Aborigines or tourism operators who recognise other values, more associated with the . absence of producers and their cattle. There is clearly no single social value attached to the presence of one particular group.
It is clear that the beef industry has had a major influence on-the economy of Cape York -
Peninsula and has been the major source of income and source of social fabric for the non- indigenous Peninsula community. The present study recognises that in the absence of the grazier community, under present land use allocation, the area would be largely unpopulated, with the exception of concentrations of inhabitants at settlements such as Kowanyama, Weipa, Laura and Bamaga. The report makes no value judgement on this situation.
The social impacts of the pastoral industry are most noticeable at cattle centres such as: Mareeba and Coen and in the basic infrastructure of roads, telephone lines and kel stations which serve this widespread community. The purchasing power of grazier families has expanded the social impacts of this community to those sinall service towns in the region on which the pastoralists depend.
The positive economic impacts of the pastoral industry are derived from approximately 130,000 cattle run on about 75 properties on Cape York Peninsula. The northern section is sparsely populated and- the industry there employs only about 60 workers while 'the most productive properties are in the south-eastern zone of the Peninsula. The south-western zone includes the Gulf Plains with its large stations and 'relatively fertile' alluvial plains and coastal deltas which suffer localised erosion on the waterways (QDPI 1975).
As referred to earlier, the pastoral leases account for 57.2% of the Peninsula's land area; National Parks about 10% and Aboriginal land about 14.8%. The 78,192 km2 under grazing is the most recently 'settled' region of Queensland and for several reasons is in better overall ecological condition than any other part of the State. In essence the nutrient deficiencies, unusually low calving percentages and the high cost of restocking all contributed.to .&'low overall stocking rate. Thus despite localised degradation associated with permanent watering sites, it is important to appreciate that pastoralism in the past has largely kept intact 90% or more of the Peninsula grazinglands, at least as estimated by condition surveys (weston et al. 198 1).
Negative Impacts
In view of the positive contribution of the grazier community to the non-indigenous social structure of the Peninsula, it is difficult to substantiate any significant negative social influence which has resulted specifically from the pastoral industry per se. Again the effects of this industry on the social situation of Aborigines are in some cases the exception to the otherwise positive influence on the social structure of Cape York Peninsula. The effect of pastoralism on the Aboriginal community (Wynter and Hill 1991) can be interpreted as having both positive and negative influences, the positive elements including the provision of employment eg. stockmen, assistance and support by grazier families in the fields of education, health and access to services generally.
In a somewhat different interpretation of the economy, it has been argued that the Ab6riginal economy has been disadvantaged by the large proportion of previously Aboriginal (Tindale 1974) land which has been allocated to pastoral leases since the late 1800s. In a cash economy such as that which operates in white Australia, there are fundamental difficulties in quantifying and thus valuing the 'economic' losses incurred by Aborigines as a result of being denied ownership or access to certain leases (Jones 1994). In evaluating social influences on Aboriginals, a distinction must be made between the effects of historical official policy and the
etYects of the pastoral industry per sc. The means of righting of historical wrongs and the achievement of an equitable tolerant multi-racial community are beyond the scope of this study.
13.2 Social Justice and Equity of Resoi~rce Access
Many areas of the Peninsula are clearly suited to more than one land use. The selection o f . single land use options or multi-purpose land use (Stanton 1976) is both an ecological and a: political decision. Much of the present grazing land is equally suited to pastoralism, tourism, Aboriginal cultural use and national parks.
The present study focuses on the future of the pastoral industry but by any social equity and :-. justice criteria, competing claims on grazingland require democratic consideration. - Consider first the equity issues relating to the grazing community. The graziers of Cape York have developed homes and a social structure under difficult isolated conditions over, the past century (Holmes 1987). The claim that several generations of pioneer grazing families have a right to continued use df their leases is a logical legitimate claim. This claim is strengthened by the fact that the grazing leases are generally in good condition (of the order of 80% classed as good).
However, Aborigines also consider they have legitimate claims for land in Cape York Peninsula. The issues of Aboriginal recognition, Native Title, Aboriginal ownership, Aboriginal access and the protection of areas of cultural significance are all -of great importance to Aboriginal society. Our meetings with the Aboriginal stakeholder groups working within the CYPLUS framework did not result in the identification of si@s of importance to the Aboriginal community, however, issues relating to the outstanding Native Title Wik claim did demonstrate the issues of Native Title and land ownership will impact on the development of the pastoral industry in Cape York Peninsula.
Other stakeholder groups also consider they have legitimate claims for land in Cape York Peninsula. Conservation groups view the issues of maintenance of biodiversity, establishment of a representative reserve system and retention of habitat as important. The present network of National Parks and reserves have been defined based on historic cadastral boundaries and conservation sectors have differing views on the representativeness of the existing system. Complete alienation of this land to satis@ the interests of conservation stakeholders, resulting in the exclusion of pastoral interests will impact on the development of the pastoral industry in Cape York Peninsula.
Similar agreements of resource use, management and access could be forcibly put for other interest groups, for example the tourist industry, mining, defence and transport sectors.
The determination of how land is allocated is a matter of social policy and political judgement. Social policy should take into account historic events, good and bad, and propose.-future directions that strengthen the social fabric of society. With respect to how social policy . impacts on the pastoral industry of Cape York Peninsula, this report is of the view that the issues of land ownership, resource use, management and access need resolution before any fkture planning for the industry can proceed.

Resource Use
A social policy that operates on the acceptance of a non-commercial land use position will have severe negative socio-economic impacts on the pastoral industry. Exclusion of land from pastoral activities will diminish the potential for managed expansion of the pastoral industry. The potential to reach critical stock numbers to support export facilities and improvements to existing transportation network would be reduced. Also, unmanaged land increases the risk-; for the spread of animal diseases and this would place the region's, the state's and the nation's cattle industry at risk.
Some social justice commentators emphasise acceptance of non-commercial land use as a legitimate alternative to commercial beef production (Roberts 1994a). Many observers of the .' Cape York Peninsula situation would recognise the need for no particular group (pastoralist, Aborigine, conservationist) to be seen as 'more than equal' despite the case made for 'catch-up' policies to compensate for perceived past inequities. The natural land use option may appear attractive, however, the.re is overwhelming evidence that education, employment a d income are necessary elements of any group seeking survival and prosperity in the world of the future. If all Peninsula stakeholders can maximise the opportunities offered to them to participate in a market economy without losing the richness of their environment and culture, they can have the best of both worlds. The concept of multi-use has wide application on the land users of the Peninsula.
Resource Manacement
The present condition of the Peninsula's pastoral lands is considered to be good. A number of reasons account for this present situation. The region has been managed extensively for centuries, both by Aborigines and pastoralists. Brian Roberts (1991) has argued that the reasons for the relatively minor effect which Aborigines had on their traditional lands should not be confixed with simply a lack of the non-Aboriginal technology associated with land degradation (steel axes, crosscut saws, rifles, motor vehicles, bulldozers, in that order). In an era when conscious informed land stewardship by Aborigines is quoted as one reason to grant Native Title, this ideal may be no more than a deficiency in the means of exploitation. The Kowanyama Landcare Group has, for instance, recognised that their own Aboriginal Cattle Company should take all precautions against fbrther damage to their grazingland, notably at the billabongs and other watering places (KALNRMO 1992).
Similarly, the pastoralists have not adopted many of the land management technologies that resulted in land degradation in other areas of Australia. The Peninsula has been lightly grazed resulting in minimal damage, so in this sense of isolation has been beneficial to the Peninsula during Australia's development phase since European settlement. Any change in management technology needs to take into account environmental considerations.
The relatively recent land use phenomenon of allocating land for a conservation purp6se by way of National Parks and other reserves has generated a new set of concerns relating to the . management of land in the Peninsula. The management of conservation areas in the Peninsula has varied from intensive management in high traffic areas to a complete lack of management inputs. Recognising the fact that some of these areas serve an important role in preserving biodiversity and habitat retention, other issues such as weed infestation, difficulties in cattle

control along unfenced boundaries and disease control negatively impact on the pastoral industry. --
The Green report, which reviewed the adequacy of resourcing national parks in the Peninsula, concluded that 'National Parks in Cape York are seriously under resourced in respect of staff levels and operating and capital works budgets'. A continuation of the process to purchase land for National Parks and then remain unmanaged presents management difficulties to the -, pastoral industry of Cape York Peninsula. A cooperative arrangement between neighbouring- pastoralists and National Park owners aimed at improving the management of these areas is required. Pastoral use of these areas has a role to play in some cases. .
Access
The notion of totally fiee and open access to all lands on the Peniri'sula in order for: sectoral groups to satisfjr their production, cultural or conservation requirements is desirable, but neither practical nor achievable. All sectors have an interest in the land, however the control of access remains with the landholders or their representatives. Land ownership is determined by the nation's legislation and forms the basis for access arrangements.
A majority of the Peninsula's land is owned by the Crown and governments can exercise controls over access by way of proprietorial controls or regulatory controls. The Crown maintains ownership of the land until it is licenced, leased or freeholded. Access arrangements re-incorporated into appropriate title conditions may be negotiated at this stage. Alternatively, the government may exercise regulatory control by restricting the way the land is used and managed. In this case, the title holder would negotiate access based on conditions. , + i
Presently, the Peninsula's leaseholders negotiate with other sectoral groups on access. These negotiations establish the conditions upon which access is granted and are dependent on the predominant use allocation. The present arrangement places constraints on the authorities in changing the existing conditions of use or restricting the range of uses currently permitted through either the regulating or proprietoral methods. Any such change would require compensation payments.
Access agreements are vital to multiple-resource use. The recognised owners, be they pastoralist lessee, Aboriginal community or government, establish the conditions for entry and possible use. The government in the long term can influence the direction of access agreements by enforcing proprietorial or regulatory controls.
13.3 Animal Health Implications
Owing to its proximity to northern land masses, Cape York Peninsula is an important area in -
terms of its potential exposure to exotic disease.
Protection of Australia's animal industries from the threat of exotic disease depends heavily ,
upon:
(i) early and accurate diagnosis of disease (ii) rapid and effective response to the outbreak.

Livestock control is an essential element of these reactions. Whatever form the pastoral --
industry on Cape York Peninsula may take, control of livestock needs to be a hndamental - -
consideration.
All sectors of the industry should operate within a legislative harmony which would accommodate a rapid response to a disease threat.
Education of all livestock owners in disease recognition and reporting obligations is another: important facet of disease control.

SECTION G: PROPOSED MANAGEMENT GUIDELINES FOR THE PASTORAL INDUSTRY
consider. Guidelines p
property manage government roles land allocation cri boundary recon multiple use conce
14 PRINCIPLES, POLICY AND STRATEGIES
Proposed management guidelines presented in this section of the report are developed on ecological sustainable development (ESD) principles and integrated catchment management (ICM) principles.
With respect to ESD principles, three core objectives were considered with referehce to Cape York' s pastoral industry:
to enhance individual and cornmunity well being by following a path of economic development that safeguards the welfare of future generations to provide for equity within and between generations to protect biological diversity and maintain ecological processes and systems. (ESD Draft National Strategy) .
Integrated Catchment Management principles of importance are:
(i) Land and water resources are basic and interactive components of natural systems. (ii) Managemefit of land and water resources should be based on geographic units-which
account for the interactions between these resources. (iii) River catchments are continuously changing in response to natural processes. (iv) Management of land and water resources must be coordinated. (v) Land and water resource management decisions must be based on the best available
information. (vi) In a democratic society sound land and water management is best achieved through
the informed action of the individual users and managers of these resources. (vii) A balance between economic development and conservation of land and water
resources must be maintained. (DPI, ICM Strategy)

Principles on which conclusions and proposed guidelines are developed are:
effective integration of economic, environmental and social considerations paying due regard to the precautionary principle recognition of the global dimension development of a strong, growing and diversified economy adoption of cost effective and flexible policy instruments acknowledgment of the value and necessity of consulting and involving the broad community.
The proposed strategies for sustainable pastoralism, as outlined in Appendix 14.1, Sustainable Pastoralism in Northern Australia, provides a useful framework for the managed development of the pastoral industry in Cape York Peninsula.

15 PROPERTY MANAGEMENT PLANNING -- -
Property Management Planning (PMP) is a voluntary process that allows producers to plan the development and management of their properties. This process can be expanded to incorporate financial decisions, improvement planning and husbandry strategies if desired. This report believes PMP is critical to the ongoing planning process for the Peninsula. Appendix 7.2 outlines the objectives, strategies and processes involved with PME'.
15.1 Government Role
The DPI is the lead government agency for Property Management Planning in Queensland and Property Management Planning is seen as an important extension approach. The importance " of Property Management Planning in improving the ability of pQmary producers to make decisions based on the principles of sustainable agriculture and in providing them with ownership of the decision making process has been recognised by the Ecologically Sustainable Development Agriculture Working Group, the Commonwealth and Queensland Decade of Landcare Plans, the Queensland State Economic Development Policy, the National Drought Policy and the Queensland Drought Policy.
The Queensland Landcare Council (QLC) has taken a leading role in developing mechanisms to encourage and assist landholders to become involved in PMP.
The Queensland government aims to facilitate/promote a PMP service that: encourages voluntary participation by rural producers uses adult education and action learning principles consistent with the DPI .Ext&nsion Strategy to assist landholders to use and develop their existing knowledge and slulls to plan the management of their properties where possible, uses a workshop format to encourage a pooling and sharing of knowledge actively encourages a coordinated, whole of government approach to service delivery by utilising existing government extension services that have an adult educationlaction learning format in the delivery of modules to suit the training and information needs of clients provides equal opportunity for non-government providers including consultants, training bodies and industry groups to provide or participate in delivering a PMP service
.
15.2 Property Management Planning Process
Property Management Planning is a flexible approach to fardproperty management. It uses a business planning process which recognises:
the importance of long term goal setting in management that the land is the basic resource of any farminglgrazing enterprise .
the importance of the human component in agricultural enterprises that financial viability is essential to sustainable land management.
From a landholder's perspective, the following extract from an article written by Jock Douglas (QLC) for a landholder group, describes the practical applications of the planning process.

-- . 'Property mantrgemerrt plmrtirtg is n~1 cxtgoirtg rnantrgemertt process-which only b~@trs with a - A
map of the physical resorlrce featr~res inside the borirrdnry fence. PhiP irrclz~des the planned zlse of resources so that /turd, stock ta~d.firrattcial mtnragen~ent is conzbined and continzring. The process irlvolves:
(i) having a good think and talk ahorlt personal ainzs nrrd objectives.fir the property (ii) attend a DPI org~rrrised PMP ~vorkshop jbr the mapping o f soils, timber, jhnces, creeks '
etc on aerial photof~aph overlays (iii)compare ideas with district fanlilies at the workshop (iv)con~plete the mapping- by driving and riding through all the pa&o@s. This ir~volves
having a really good look with at1 eye to the jiitzire, pirpointirg the hot spots such as eroded grllies, btrdly placed roads and fences, fertiliiy r1inUTO1~vr1 and overgr~rzed. paddocks
(v) conzpare conzpleted map ol)erlays with other landholders.
PMP is an ongoirlg process. Every three months the plan is zised as a basis to nzhnitor the condition of land, stock and3rrances.
For land, notes are made on the state of pastt/res andhr crops in each paddock after an irrspectiorz. Progress on atte~rtiorl to 'hot.~pots' is recorded
With stock, notes are nlade on coitditirt/weiht., health, sales, pzlrchases and expectations.
Financial management involves book-keeping for each quarter to run a reconciliation of cheqves drmvrz, look at the actllal inconze and expenditlire for the previous q~irteF.'and conlpare that with the predicted. Then a prediction for the next qrmarter is ilzade to see If finances and seasons allow progress with in~provenzents and developnzent.
Property nzarlagement ylarlning car1 improve property sitlintions in a nurnber of wajls:
the groi~p workshop allows,for better ir$ornzntiorr about and understanding of properties the q~iarterly assessn~ent of Inn4 stock and$rrances tightens managenzent cor~sidembly, particzrlarly land andflnancial nzanngement the condition of lmrd improves from closer attention being given to it workshop go~rps g o w closer together and this makes for better districts lij%style is ii~lproved through better control of the.firtzire.'
- Topics that can be addressed at PMP workshops include:
Personal/fnnzily Goal setting problem solving and strategic planning Handing the farm down and estate planning Choosing an enterprise type
Farm Blukzess Mcmngenzent Markets and marketing Financial management Testing costs and benefits of options Risk management (including drought)

Livestock Prod~lction Market suitability of product Nutrition Breeding Handling/mustering Health, disease and pest control Water requirements Risk management (eg. conservative stocking) Pasture monitoring
Nntliml Resoxace Land suitabilitylcapability Soillwater conservation Nature conservation Rehabilitation/revegetation Risk management (eg. conservation tillage)
15.3 Property Enterprise Agreements
Property Enterprise Agreements forin part of the Regional Adjustment Program for South- West Queensland to accompany interest rate assistance for property build up.
Agreements will be between the landholder, the government and the lending institution. It is proposed that they include:
property lease conditions property plans (Resource Inventory Map) financial plans.
Initiatives such as Property Enterprise Agreements are worthy of consideration in any ongoing review of Cape York Peninsula's pastoral industry.
Subregional planning groups should consider formation along boundaries nominated as 'Landscapes' in the DPI's Suitability Report. These subregions are Heathlands, Batavia, Lockhart River, Edward River, Ebagoola, Mitchell and Hodgkinson. These landscape divisions are differentiated on the basis of physiography, geology, vegetation and current land use. -
15.4 Application to the Peninsula
This report supports the process of property management planning as a vehicle for assessing at the property level, the Peninsula's resource use, management and access issues. The property management plan is capable of developing the regional NRAP data to a level that will facilitate sound land use decision making. It is at the grassroots level that the 'nuts and bolts' decision making is made. It is at this level where effective pastoral development will occur, effective conservation planning will occur, effective cultural planning will occur and effective community interaction will occur. The Property Management Planning process is seen as integral to the ongoing development of the CYPLUS process as it structures all the biophysical data collected, the economic data and the aspirations of stakeholders.

- - . Me- - -
16 GOVERNMENT ROLE
Controls by government over the allocation of resources such as land and natural resources are generally accepted. However, according to industry sources, indecision, lack of policy direction and poor policy initiatives in the past have handicapped development in the Peninsula. Continued government involvement should result in a reduction of overlap between departments, clear policies with accountability and more local industry and : community input. Consideration should be given to changes in the reallocation of proprietorial, regulatory and land planning controls and responsibility.
In a democracy, the stakeholders have a right to have input into the decision making process " that allocates resources. Allocation of resources can no longer be, determined in isolation. Possible structures and their various roles are suggested in this section for consideration by the Cape York Peninsula community.
Cape York Peninsula Government A~encv Group
A joint Cape York Peninsula Government Agency Group (CYPGAG) should be considered to provide a multi-disciplinary approach to land allocation.
This CYPGAG would consist of representatives from Department of Lands, Primary Industries, DHLG&P, Environment and Heritage and local authority representatives. Their main fbnctions would be to advise the Department of Lands, as the lead agency, in the areas of: , r . -
land allocation in accordance with a regional strategy that is regularly updated lease conditions liaise with CYPRPAG (see below) in the development of regional planning policies (that are consistent with State planning policies). These policies should be integrated into regional andlor local planning schemes.
Cape York Peninsula Regional Planning Advisory Group
A Cape York Peninsula Regional Planning Advisory Group (CYPRPAG) should be considered to provide local input into the regulatory and land planning fbnction of government. -
The advisory group (CYPRPAG) would consist of representatives from the Government Agency Group (CYPGAG), local authorities, sectoral groups and local community groups. Their main fbnction would be to:
develop regional planning policies in consultation with CYPGAG and local authorities that are reflective of regional attitudes and aspirations develop a regional land use strategic plan based on regional policies for State government approval recommend lease conditions appropriate to designated use allocation of the regional land use strategy for consideration by CYPGAG

coordinate regional responses to development proposals (eg. live cattle export ex. Weipa, -
road improvements).
CYPPAG representation is recommended on this Group. Ideally, CYPRPAG, through its Chairman, should have direct access to State Ministers.
Local authorities need to take a lead hnction in land planning in consultation with the '. Department of Housing, Local Government and Planning @HLG&P) and CYPRPAG. Local- authorities should take into account the pastoral industry in their strategic planning by considering industry constraints and opportunities.
Regional Open Space Svstem
State and local government agencies should facilitate the development of multiple-use planning by initiating the formation of a Regional Open Space System (ROSS) for the Peninsula.
This ROSS would constitute a network of corridors linked throughout the Peninsula that would achieve the multiple-use fhnctions of
controlled grazing land wildlife corridors and fauna reserves buffers between competing land uses protection of wetland sites recreation and tourist value , I '
water supply.
It is suggested that the land that constitutes ROSS be managed jointly by the Department of Lands. Management agreements relating to cattle use, tourist, access and so on, would be determined by the Department in consultation with CYPRPAG.
Suggested criteria for the designation of a ROSS area are:
interconnectivity for corridor establishment representativeness of region ability to provide infrastructure support ability to provid-e cultural benefit.
From a Peninsula pastoral industry perspective, the ROSS would provide an extended stock route corridor network suitable for the temporary agistment of cattle awaiting marketing. In order to fulfil this function, some infrastructure by way of watering points, holding paddocks and yards should be progressively developed in these areas. This would assist, when located near the road network, with the movement of cattle to market outlets. Also, it would assist with long term property management in times of property development, drought management .
and fire management. The management of these areas so that the productive capacity and environmental integrity of the area is maintained is crucial to the long term use of these areas.

17 TENURE
Insecurity of tenure has been identified as a major constraint to the future development of the industry. Tenure security issues should be clarified following a judgement on the \VIK people's Native Title claim in terms of a decision andlor conditions of use, management and access.
The following approaches are proposed for consideration:
Lease conditions should provide incentives to lessees to introduce sustainable cattle control strategies.
Lease conditions should be improved to encourage investment in property development.
Lease valuations and rentals should provide financial incentives to lessees to introduce sustainable cattle control strategies. ,-.
Lease conditions should be reviewed on a regular basis to progressively convert the lease into more secure lease categories as approved cattle control strategies are implemented. Under the new Act, this will involve a staged upgrade from term to perpetual lease, depending on the extent of improvement. Conditions of the upgraded lease will require the lessee to provide evidence that the strategies are being maintained and are effective.
Lease conditions should provide disincentives to the under utilisation of land leased for pastoral purposes. Lease conditions should be reviewed on a regular basis and rglated - pastoral use applications be assessed on their merits.
A review of existing tenures to take into account NRAP data. This review should consider, in consultation with lessees, industry and community groups, a reconfiguration of existing boundaries, development requirements and valuations. This review should ideally be conducted in association with strategic planning requirements of local authorities. Security of planning is a benefit of improved security of tenure.
Lease conditions should be flexible so as to encourage multiple use of leases. The additional uses should be developed as part of an overall strategy for particular leases and should b e developed in accordance with the local authority's strategic plan objectives. Data supplied from NRAF' will co-ntribute to the data requirements of the planning process.

18 LAND ALLOCATION CRITERIA
The base resource of the industry is primarily an open woodland with a ground cover of tall summer-growing grasses. In evaluating the opportunities for sustainable pastoral production, four factors require consideration and in the following sequence:
(a) Which country is inherently suited to cattle grazing as assessed by its carrying capacity and *; tolerance of grazing and trampling on a year-long basis?
(b) What management techniques are most likely to meet the needs of production and sustainability?
(c) What changes will fbture technology, improved marketing op~ortunities and improved economic performance have on potential production and sustainability?
(d) What will changes to land use patterns along coastal Queensland resulting from urbanisation have on existing land use allocations in the Peninsula?
18.1 Land Suitability
The Lands Department's (1994) tabulated summary of the carrying capacity of each of the 26 recognised types of country in the Peninsula reflects the significantly higher natural productivity of a small number of these types eg. 2, 8 and 11. When the vegetation map is overlaid on the property boundary map it can be seen that many leases consist largely of less productive country with small sections of better country interspaced between the poorer w e s . These assertions will need individual property confirmation by detailed suitability assessment developed around the property planning process and will need to be updated with objective data developed from the CYPLUS process.
Interpretation of the regional NRAP data on land suitability and country types highlights the inappropriateness of the original squared survey blocks in this era of integrated multi-use land planning. Since very few boundary fences have been constructed, one might argue that the shape of properties is somewhat academic - at least as a determinant of effective land use. However, since there is increasing pressure on government to make at least a portion-of the present grazing leases available for other purposes (Aboriginal land, National Parks, Tourism), a series of decision strata should be recognised. The NRAP vegetation and soil maps can now offer, for the first time, a more accurate and detailed database for identification of the most productive and stable grazinglands.
One approach to designating the W r e grazing lands would be a two step approach in which possible resumption of less suitable grazing land could be delineated on the combined. vegetation and property map for consideration when present leases expire. The property plan is an important document in this procedure as the property planning process will identifjr, in consultation with the lessee and lessor, areas that have the potential for development through - the introduction of modern management technologies. From the pastoralists' perspective, it is only those areas of low potential carrying capacity or areas that cannot easily be managed, that would be considered for reallocation. Possible outcomes of this process are:

amalgamation of some areas with adjoining lands, be they land used for pastoral, conservation or cultural use designation of these areas for non pastoral use with appropriate management in practice subdivision of existing pastoral leases, based on the productivity capacity.
Following the satisfactory completion of the property plan either prior to lease renewal or earlier, the second stage decision on resumption and compensation could be made. In the -, interim it may be established that a proportion of lessees may welcome the opportunity to- terminate their leases early, given reasonable financial conditions. The desire to leave will be partially dependent on government commitment to new marketing facilities in the northern portion of the Peninsula, notably deep-water loading facilities at places like Weipa and the ability for the remainder of the property to be developed using modern technologies. This '
process could fund property development. ,
18.2 Production and Sustainability
The productivity maintenance and sustainability questions must be considered in the light of hller use of country distant from the major watercourses. There are real fears at least by ecologists, that development of fences and watering points across all the lighter carrying country (often the more fragile ecosystems) could easily and quickly lead to widespread devastation including weed invasion and soil erosion, especially on highly erodible soils; thus the importance of research which establishes the stability of various types of country under increasing grazing pressure. Portions of the Palmer River catchment may offer historic pointers in this regard.
. r.'
The stability of various Cape York ecosystems under grazing does not assume a constant or static ecological situation, but rather the ability of a particular type of country to recover from periods of stress eg. heavy grazing, drought, fire, flood, cyclone, insects or pathogens (Gardner and McIvor 1987). Slow continuous or discontinuous change in the vegetation and its associated fauna is an inherent natural phenomenon. Plant migrations along coastlines and rivers are part of the evolutionary process, so some changes must be recognised as natural and not indicative of disturbance or malpractice. The same applies to the sediment loads of the eastern Peninsula as recorded by Moss et al. (1993).
Downey (1994) refers to the survey of Tothill and Gillies (1992) in attempting to answer the question 'What has been the impact of grazing over the past 100 years or so on the Peninsula?'. This survey indicated that the largest grazingland type (native sorghum) is in unusually good condition overall. The' 1980 and 1991 condition assessments and the upward or downward trend in each of the 13 pasture types in Northern Australia are shown in Table 18.1 for comparative purposes:

140
Table 18.1. Condition Trends in Native Pastures
Pasture type Classed good Classed 'A' Direction 1978-80 (%) 1991 (oh)
1 Native sorghum, Cape York 90 90 Stable 2 Alluvial floodplains, W. Cape York 45 30 Down 3 Heathland na na -
Blady grass Black speargrass Golden speargrass Aristih-Clhrysopogon Einasleigh Aristida-Clhrysopogorl Southern Gulf Aristida- Triodia Bluegrass-browntop Mitchell grass - Soft spinifex
Down Down UP UP UP - Down ~ 6 w n Down
1 13 Littoral 70 90 UD (Source: Tothill and Gillies, 1994)
These data are difficult to interpret in the context of the Peninsula alone, however, they do indicate that the major grazingland types which occur in this study area (Types 1,.7 and 8) have not deteriorated under grazing although Type 2 may require closer examination. It will be noted that these Alluvial Floodplains of the western Cape York Peninsula had apparently deteriorated to the extent that 55% of their area was in less than good condition' a cfecade before the 1991 re-survey when 70% of these plains were estimated as having been degraded. As referred to elsewhere, the NRAP salinity map warrants interpretation in terms of future land management of these plains.
The specific effects of cattle on biodiversity cannot be gauged on the broad scale of the above condition surveys and must be examined at a local level, especially near permanent waters. Similar processes would evaluate the opportunities for areas of conservation value. Objective baseline data should be a product of the CYPLUS planning process and this data should be
, used as a basis for monitoring environmental performance of production and ecological systems.
18.3 Future TeChnologies and Marketing Opportunities
These issues are for the future, however, they are worthy of consideration for the CYPLUS process. Technology will improve, marketing opportunities will improve and the economics. will subsequently change as a result of technology. These potential improvements will further develop the pastoral industry, however, the extent of the improvement is difficult to predict. Importantly, the strategy proposed should be flexible enough to incorporate further change as it occurs and not be so rigid to develop strategies based just on present day factors.
The preferred pattern of development for pastoralism in the Peninsula is that determined by pastoral suitability assessment. These assessments suggest that the potential for growth of pastoralis~n in the Peninsula is substantial. The realisation of this potential depends on the

resolution of issues earlier identified and the introduction--of sustainable management options. - '-T-
This report is of the view that the expansion of the industry is capable of developing in a number of complementary forms.
Firstly, individual pastoralists without substantial capital backing are capable of developing their properties progressively, implementing the less intensive improved cattle husbandry-. technology as a vehicle for improving economic performance. Funding of these changes.: should be considered from a number of sources, depending on the individual's position,' namely:
borrowings sale of breeders subdivision (dependent on government policy).
This approach to development is likely to be acceptable to the Aboriginal and Toges Strait Islander communities involved in pastoralism as it involves minimal disturbance of the land.
Secondly, in areas suited for low and medium input pasture development, pastoralists are capable of developing their properties so that they integrate small areas of improved pastures and other pasture development strategies into property management. This form of development involves the establishment of a mosaic of pasture paddocks aimed at further improving cattle control. Benefits accruing from this approach are the ability to provide a inore reliable supply of cattle, provide a better product and to improve economic eficiency.
Another form of development is that of intensive pasture development. Any lirge'icale expansion of this practice would be subject to appraisals of land suitability, economic benefit, cost, environmental performance and risk analysis.
The complementary forms of development would provide a range of cattle descriptions capable of satisfLing most market requirements. A market-driven resurgence of the pastoral industry based on technological advances improving economic efficiencies is possible in the Peninsula provided environ~nental standards are set and the land allocation process is practical.
In order to be satisfied that the technology predictions are correct, it is appropriate that 'checks be put in place to monitor environmental performance. Assessment and monitoring of environmental performance is critical to 'knowing' whether the development strategies are sustainable. PerfGrmance standards such as water quality measurement, sediment load, pasture cover at critical times of the year (measured by satellite imagery) and biodiversity assessments should be considered as possible measures of sustainability. The establishment of appropriate standards, consistent with ESD and ICM principles, would be a negotiated. arrangement between the owner and the user of the land.
18.4 Changing Land Use Pattenls
Similarly, changing land use patterns along coastal Queensland may place pressure on some areas in the Peninsula for intensification of land use beyond pastoral use. These changes would be subject to scrutiny and investigation, however, they could eventuate. Flexibility of planning process is required to accommodate potential future changes.

19 ECONOMIC EFFICIENCY OF ALTERNATIVE - LAND USES AND _ POSSIBLE BOUNDARY CHANGES
It is usual for modern western societies to compare the merits of alternative land uses or development projects on the basis of their economic efficiency, ie. the wealth that can be generated per unit of monetary investment. On this basis the Peninsula cattle industry competes favourably with tourism only on certain land types. Both these industries can be-, made more efficient by changes in infrastructure; for example, Weipa beef export facility and extension of all weather tourist roads.
In addition to the merits of economic efficiency, another method of comparing alternative land uses is the multi-cultural concept of 'social efficiency'. Social efficiency necessarily includes.. the full social value of Aboriginal land-based beliefs and this warrants consideration on the list of criteria for Peninsula land allocation. This concept is in many ways similar to the values inherent in national park allocation. Social efficiency includes elements, not only of equity and justice, but also of links to 'mother earth' - an idea written about by western societies but not fully appreciated in the full context of its cultural significance (Williams and Baines 1993). The non-Aboriginal community might not appreciate the value of 'sitting on' the land without using the land resources. Equally the Aborigines may not appreciate that there is no hture for the children of a non-productive society in the modern world. Such a statement may appear insensitive, but all the evidence points to an appropriate Aboriginal land use which generates income without losing the traditional links to the land of this most ancient of cultures (Heritage Unit 1 989).
The identification of present leasehold land which nlny be eqzlitnbly converted fronz pcwtoral holdirgs to alternative land uses, requires a multipurpose approach. Issues such as, but not restricted to:
location of sites scenic value coastline access cultural value conservation value tourism value lifestyle and remoteness value economic performance
- will be determining factors. Depending on the circumstance and the aspirations of particular .
tenants, any one of these factors could be overriding in the decision making process.
From an economic efficiency perspective, it makes economic sense to use carrying capacity (current and potential) and improvements (facilities) as selection criteria. .As an example, the following leases are recorded as having a carrying capacity of 1 on 75 ha or less and have no recorded value of improveinents carried out by the lessees ( Lands Department 1994) at the time of assessment:

- A. Lease No - -Station - -.. -- Carrying eapacity Improvements -
1 I
Punsand Bay Kalpowar (portion) Harkness Crosbie Elderslie (portion) Karma Waters (unnamed) Diggers Creek
These leases are examples of large tracks of low carrying country which the lessees had not attempted to develop up to the date of the last assessment. The reasons for this lack of investment are several:
the lessee had no intention of entering the pastoral industry but saw potential i i the land for other purposes the economics of developing the property for pastoral purposes may not be favourable lessees may be unaware of modern cattle management technologies or unwilling to implement these technologies lessees may be happy with their present lifestyles.
A second group of stations contains those which do have infrastructure investment but which remain very low carrying country with no substantial opportunity to increase their stqcking rates through pasture development. Examples of these are:
-
Lease No Station Carrying Capacity Improvement I
I
Shelburne Bromley Wattle Hills Kendall River Blue Mountains Southwell Denman Astrea ~ i x i e (portion)
It can be seen that investment in these stations has been minimal in most cases. The reason for- this may be a serious lack of development capital, given the poor gross margins of beef production in this region. Closer examination of the distribution of the more productive land on these stations is expected to indicate that the cattle are largely supported on a small proportion of the total lease, notably on the river frontages and flood plains. The 'outside' country in these cases may be deemed as more valuable for purposes other than cattle grazing.
Boundary recol?fig.l.rrntion cannot rely on existing Department of Lands' information on carrying capacity. Detailed assessments of the suitability of land for pastoral production is required before boundary reconfigurations are implemented. These suitability assessments and

access to biophysical data have only recently become available. Anexamination of these more detailed NRAP maps will identifil land of low value for pastoral uses.
Alternative management strategies for land of low value for pastoral uses need consideration in consultation with the present lessees of these lands. Past experience has shown that due to the large areas involved and the severe budgetary constraints on government, management of these lands for a conservation purpose by the Department of Environment and Heritage would, be minimal. Past experience also has shown that management of large areas by ATSI communities would be minimal. Therefore, fiom a land management (weed control, noxious disease control) and sustainabiity consideration, an alternative would be to negotiate terms and conditions for the grazier to manage those areas incorporating high grade biological reserves within the boundary of properties and for the ATSI communities to receive training' so that they can manage areas of conservation value within their boundaries. Preferably, the ownerlmanager would be trained and paid to do it. Provided standards are satisfied and monitored, this would provide a cheaper and satisfactory outcome for all the main stakeholders. Secondly, implementation of improved cattle husbandry techniques may allow for increased areas of this low value land to be better incorporated into property management.
The following criteria are suggested as a mechanism for 'first cut' property reconfiguration:
(i) properties of low potential carrying capacity (say 1:75) and low improvement values be considered for non pastoral land uses. These alternative land uses must be managed (eg. appropriate fire strategies, weed control) to limit degradation, weed invasion and habitat value decline
.t
(ii) properties comprising a mix of land types comprising varying carrying capacities andlor property improvements should be managed by the present stakeholders, the pastoralists. These pastoralists would require some training, with the view that the low potential carrying capacity areas would be managed for a much reduced cattle use and an enhanced conservation use. The aim is to protect smaller areas of high conservation through an off reserve network on the property
(iii) some boundary changes of existing pastoral leases and national parks areas may need to be considered. The aim is to protect areas of high conservation value, through a reserve system, and reallocate existing national park land of low conservation value, but high pastoral use value to pastoral lease
(iv) similar principles would apply: to all pastoral lands, regardless of ownership. In areas of non Aboriginal ownership, negotiations between the present stakeholders (pastoralist, national park) and Aboriginal groups for access and use would be a negotiated arrangement.
Reconfiguration arrangements such as these proposals could have several benefits for both the graziers and the alternative users of what is presently pastoral lease country:
(a) Graziers' rentals relative to their stock numbers could be sigdcantly reduced. (b) Country which is low-grade grazing but high-grade ecological reserve could be protected
and managed appropriately (Stanton 1992).

(c) Aboriginals could have access to important cultural sites or bush tucker locations (river .. frontages) (Stewart, undated) at no serious econo~nic disadvantage to cattle producers.
(d) Cattle producers could apply much better management to smaller more productive units, reducing their costs and improving their efficiency.
Referring back to Map 1, which shows natural carryin2 capacities of each section of the Peninsula, the total areas of high, medium and low capacity have been calculated as shown; below:
MAP 1: Existing Carrying Capacity
If the potential for intensification is developed as shown in Map 2 (Potential Carrying Capacity), the following total areas can be computed:
MAP 2: Potential Carrying Capacity
This analysis suggests that even with high-input systems applied to the most favourable pockets of country; huge areas of very low carrying capacity country will need to be utilised appropriately.

20 PROPERTY BOUNDARY RECONFIGURATION CRITERIA
Ground rules to consider for reconfiguring boundaries of pastoral holdings are:
take into account overall regional land use strategy and local authority strategic plans
most new properties should be capable of supporting herd sizes that are sustainable *; utilising available management practices and technologies, should the landholder desire i
carrying capacities used to determine potential herd size should adopt the more conservative potential carrying capacity estimates developed by government departments, unless landholders can demonstrate that alternative rates will not result in increased - '
degradation levels
boundary lines should relate to prominent natural features that influence stock management eg. ridges and rivers
amalgaination of properties should not proceed unless it can be demonstrated that the amalgamated property is capable of supporting a stocking rate that is higher than the original property and that this stocking rate is higher than 75 hectares per head
subdivision of properties should be encouraged where it can be demonstrated that the subdivided portions of the property will be:
. better managed using available technologies
. transferred to a use compatible with its biophysical and cultural attributes . 5 '
. providing regional infrastructure required for industry development (eg. holding paddocks for live cattle network)
country types that have low natural and potential carrying capacities should be managed. Very light carrying country (eg. 75 hectares per head or less) is difficult to manage economically. The management of these areas, be it for pastoral use or conservation use is critical if disease outbreaks such as rabies and screw worm are to be controlled. (Note: the distribution of these country types is equally important. If small areas of these country types exist, they could be integrated into property operations. Large areas of poor country present the most difficulty for pastoral management)
reconfiguration-strategies should encourage better cattle control strategies instead of increasing the size of substandard blocks
multiple land use options should be encouraged.
Adherence to these ground rules will result in some properties or sections thereof
amalgamating with adjoining properties to form viable units
amalgamating with adjoining public land to serve a particular hnction
subdividing to form a viable property with surplus land used for other purposes

. smaller blocks being developed to provide breeding blocks for fattening properties south and south-west of the Peninsula, in accordance with strategic planning objectives of the government and local authority
smaller blocks to service Aboriginal outstation family-run pastoral enterprises
smaller blocks to service 'hobby farm' demand near major centres
flexible reconfigurations to accommodate multiple use options eg. extension to creek areas near major access routes.
Consistent with improved stock control is improved access. Accessibility constraints can be reduced by planning improved stock control so that accessibility is available. This may involve re-aligning boundaries so that properties have direct access to the proposed improved road network and the proposed expanded stock route system (eg. ROSS).
These accessibility considerations are also important to recreation and tourism users. The ability of properties to perform multiple-use functions will be influenced by accessibility to transport corridors and open space systems. Existing boundaries may require change to perform these functions.
Part of the multiple use function of properties is the protection of natural or cultural sites. Boundary reconfigurations may be required to maintain the integrity of these sites in one entity. Management agreements or property transfer will need to be developed on an as needs basis to accommodate these requirements. I' ' . -
These arrangements can be facilitated by PMP and should be integrated into the proposed Regional Open Space System where appropriate.

148
21 MULTIPLE USE, MANAGEMENT AND ACCESS
The principles associated with multiple use, management and access to land are worthy of consideration in the future planning for the pastoral industry in the Peninsula. Examples of joint responsibility include:
(a) Lessees of pastoral holdings acting as paid custodians of sites of special conservation-, value.
(b) Aborigines having access to lease sites of special cultural significance. (c) Tourists having access to roads and camping sites on leases. (d) Pastoral lessees having access to grazing on Aboriginal land and National Parks. (e) Aboriginals having access to National Parks. (f) Excision of land to encourage investment in industry infrastructure.
Obviously there will be a need for negotiated conditions of access to each of the three types of tenure (Pastoral, National Parks, Aboriginal land). It would seem reasonable to request each of the three groups of landholders to help develop 'Access Guidelines' (AG) for those wishing to access other land resources. In many cases there is little prospect of single use tenure using all the resources on a property sized block of land to their hll potential (economic, cultural, aesthetic, scientific and recreational).
The proposition put forward by Curry and Hacker (1990) was the first formal analysis of how graziers could meet ESD criteria in the pastoral zone of Australia. It is well known that many leaseholders had long accepted their role of environmental custodians of special habitats on their leases (notably waterholes and forest patches) - thus the repeated claim from protjucers that 'we're all conservationists at heart' (a sentiment challenged by conservation gr6ups). There is no reason why present Peninsula lessees should not be remunerated for formally entering into a custodial agreement relating to specific areas of their lease. Such agreements could be initiated by the lessees in response to sites in need of particular management (which may include prescribed fire and/or exclusion of stock) as identified by the Department of Environment and Heritage, National Parks and Aboriginal authorities. In this way, the holders of pastoral leases could not only be seen to be contributing to complementary land use, but could justifiably receive economic benefit from such cooperation. The Access Guideline document could also stipulate how the cost of fencing, roadmaking, litter collection and other management costs could be carried by those using the sites concerned.
In the case of Abqriginal access to their cultural sites on grazing leases, it is assumed that these sites would be of significance ,primarily to the historical tribal people of the land concerned. As shown in Appendix 21.1, Aboriginal values pertaining to land sometimes concern whole landscapes and where the land and its fauna and flora are deemed to be 'hurt' by cattle grazing operations and their required infrastructure, special arrangements for meeting the needs of Aboriginals and pastoral lessees may be complex and difficult to implement. Access by Aborigines to present leases may include food gathering in various seasons as shown in Appendix 21.1. Provided those collecting 'bush tucker' do not disturb grazing . animals or interfere with station infrastructure, Access Guidelines should be workable.
Tourist access to grazing leases already occurs to a large extent but it is difficult to cater for self-sufficient individual travellers who often prefer to extend their adventure by 'going bush', making their own tracks and selecting their own camp sites. No doubt suitable access

agreements can be reached with tour bus and aeroplane operators to incorporate the lessees and their families as meaningfkl economic beneficiaries of the tourist industry.
The historic differences between graziers and Aborigines could be replaced with a mutually beneficial 'symbiosis' if Access Guidelines could provide either for graziers' cattle to utilise suitable Aboriginal land at an agreed rental, or for graziers to be remunerated for managinq. Aboriginal cattle on their own land. Such complementary effort could generate much-needed. income for Aborigines, allow fuller use of the resources desired by graziers, and promote harmonious co-management to replace the inefficiencies associated with exclusive use.
In the case of grazing in National Parks, if co-use of conservation reserves is again to be allowed in the future, the development of guidelines for grazing in National Parks will need to " take the local conditions of each park into consideration. On the negative side, grazing has been shown to have several disadvantages which in the view o r some specialisti make it incompatible with the long-term objectives of National Parks. Negative effects include:
disturbance of vegetation leading to weed invasion overuse of frontage country and damage to the natural condition of waterholes development of vehicle tracks, leading to erosion and the spread of weed seeds from vehicles and cattle complication and sometimes elimination of ecologically-planned burning programs aimed at enhancing biodiversity.
Positive effects emanating from managed grazing of National Parks include: , r . -
managed control of undergrowth managed control of feral animals graded buffering zone between areas of high conservation value and high pastoral value fire management control.
Co-use will require an assessment of both the positive and negative impacts and these assessments will form part of the management planning process.
Each National Park is planned to run on the basis of a management plan. Such plans iriclude a fire strategy, weed control, feral animal control, an access road plan including roadside erosion control, and the control of tourist activities in natural and man-made settings. Generally the park authorities do-not recommend the construction of perimeter firebreaks because they tend to serve as invasion routes for weeds, iead to soil erosion on the bared surface and are used as unauthorised access tracks by visitors and neighbours. In addition, unless breaks are very wide, they do not prevent the spread of wildfires in windy weather. Despite the problems associated with firebreaks, park management makes provision for the use of fire in virtually any month of the year when the grass will burn. Co-use strategies would assist in this area.
Also, the issue of fkture grazing in parks must be considered in conjunction with plans to . conserve current and potential rare and threatened species. The more visionary staff in DEH recognise that concentrating only on the protection of species known to be presently threatened may be seriously short-sighted. By identifLing those areas most likely to come under pressure in the fiiture, early precautions can be taken to preserve sufficient (number and

size) good examples before their biodiversity is degraded, eg. grassy plains on heavy clay soils. Co-use procedures provide a mechanism for achieving this objective.
One of the problems of grazing in parks has been the spread and dominance of certain aggressive exotic grasses and legumes. The species used in ponded pastures are particularly prone to take over the finely-balanced natural wetland habitats, which are some of the most important sites in National parks.
Despite the above negative conservation influences of grazing, the National Parks staff can become meaningklly involved in the pastoral industry, by providing guidance and monitoring of conservation sites on grazing leases - notably on Pastoral Holdings where the appointment of graziers as rangers or custodial stewards of environmentally-significant sites could be a :i- major element in the Cape York conservation strategy. The use of graziers as rangers utilises the acquired knowledge of the grazier and helps alleviate the problem of under resourcing in DEH for the management of National Parks. In the same way, several former Peninsula graziers are already making a major contribution to conservation in the Peninsula, by performing as the best rangers in the employ of DEH, using their practical experience and knowledge of the land for the benefit of park management. This arrangement could have considerable security benefits as well.
Aboriginal access to National Parks has been considered for some years. The non-destructive use of former tribal lands in parks is an obvious case for complementary land use. However, the conservation constraints relating to rare and threatened species require evaluation within the laws governing protected fauna and flora. Harvesting of such species should be subject to the same assessment and monitoring as that which is supposed to apply to Abogginal - harvesting of 'traditional' food species such as turtles and dugongs in marine ecosystems.
The new Land Act 1994 incorporates the following five general principles of land administration.
to use land in the best calculated way to serve the whole of the people to prevent monopolies in land to make land available in areas suitable for the requirements of applicants to ensure the steady flow of land back to the Crown (Government) to meet the progressive needs of land settlement, and to manage land for sustainable resource use and development to ensure existing needs are met and the reswrces are conserved for the benefit of future generations. (Hardy 1995)
It would seem that co-management and multiple-use access arrangements could greatly contribute toward all these objectives given the political will to facilitate such arrangements, and peer pressure in all user groups to approach Access Guidelines in a cooperative and- positive spirit.

22 CRITERIA USED FOR SETTING OF CARRYING CAPACITJES -- A
In terms of the criteria used for setting ,carrying capacities, the relationships between soil type, rainfall and dry matter production per unit area remain the most reliable scientific basis. For instance, the Monsoon Tall Grass region in the 750-1,100 mm rainfall zone produces 112-270 dm2 per annum. This generalised range of productivity can be converted to stocking rates by using a daily dry matter intake requirement of the order of 9 kg. In this way realistic average. stocking rates can be calculated, making provision for using not more than 50% of totd herbage to meet ecological and erosion control requirements.
23 ENVIRONMENTAL INDICATORS FOR MONITORING THE CONDITION '
OF PASTORAL LANDS
Environmental indicators used to monitor the condition of pastorai land on the Peninsula are percentage ground cover and botanical composition of that pasture. In Cape York,:the highly reliable rainf" produces regular growth of pasture. However, this growth is not maintained following the wet season due, at least in part, to the poor quality of the soils. Nutrient deficiencies of these soils will also result in the density of dry season pastures being generally low. Composition of the pasture varies with grazing pressure and grazing pressure is a function of seasonal conditions. Recognition of the good indicator plants (key species) will be an important element of condition assessment.
With respect to changing production systems, monitoring of these environmental indices will provide localised assessment of the condition of the pasture land. From a wider regional perspective, assessments of sediment loads in drainage systems will provide a generalised assessment of the condition of the catchment. The establishment of baseline data on sediment loads is essential before monitoring of alternative production systems can be undertaken.
The establishment of a monitoring program to assess ground cover, botanical composition and sediment load is considered to be an important phase of any large scale development process.

1 BIBLIOGRAPHY -
ABARE. (1988) Farm Surveys of Properties in Cape York Peninsula, Canberra.
ABS. (1994) Cattle nos. Cook Shire. Farm Survey Report. Australian Bureau of Statistics. .-;
Anning, P. (1980) Pastures for Cape York. Qld. Agric. J., April: 158-171
ARRI. (1994) Proposal on Sustainable Rural Enterprise - Oriners Cattle Station Kowanyama Management Ofice. Aboriginal Rural Resources Initiative, Canberra.
Australian Beef (1993) The Complete Reference on Australia's-:Beef Industry (Ed. Bob Coombs)
Australian Livestock Transporters Association. (1993) Data presented in '~ustralian Beef 1993.
Biggs, A. and Philip, S. (1994) Agricultural Land Suitability Map. Project NR02, Land Use Program, CYPLUS, Cairns.
Boorman, J. (199 1) Bone Chewing Country. Information Series Q190032. QDPI, Brisbane.
Boorman, J. and Miller, J. (1994) BREEDCOW, Steady State Herd Model and DYNWA, , d
Multi Year Herd Model.
CAERA. (1994) (GRP for CY). Centre for Applied Economic Research and Analysis, James Cook University, Townsville.
Cattlemen's Union. (1990) Working Paper on Cape York.
Clark, Gary. (1992) Land Degradation on Aboriginal Land: Kowanyama Trust Lands. Kowanyama Community Council.
Cocks, D. (1992) Use with Care. NSW University Press: 85.
Connell Wagner. (f989) Cape York Peninsula Resource Analysis. Cairns,
Cotter, G. (1995) Management of the Pastoral Holdings in Cape York Peninsula. Dept. Lands, Cairns.
Crowley, G. M. (1995) Fire on Cape York Peninsula. Artemis Station, Cairns.
CSIRO. (1985) Pasture Research in Northern Australia. Research Report No 4, Division of Tropical Crops and Pastures, Brisbane.
Curry, P. and Hacker, R. (1990) Can pastoral grazing management satisfy endorsed conservation objectives in arid Western Australia? J.Environmenta1 Management 30: 295-320.

Curry, P. and Hacker, R. (1990) Can pastoral grazing management satisfy endorsed conservation objectives in arid Western Australia? J.Environrnenta1 Management 30: 295-320.
CYPLUS. (1994) Brief for Pastoral Industry Project. CYPLUS, Cairns.
Douglas, J. (1988) A Proposal to Establish Landcare Programmes for Australian Agriculture. Cattlemen's Union, Rockhampton, 22 March.
Downey, J. (1994) Conservationists and Pastoralists: Can We Live Together? CYPLUS Talkback, Issue 5, July.
Friedel, M.H. (1994) Can pastoralism and biodiversity conservation coexist in the rangelands? . Aus. Rangel. Soc. Conf., Katherine, N.T. : 97- 100.
Gall, B. (1 994) A Review of the Adequacy of Resourcing of the National Parks of Cape York Peninsula, Queensland. Department of Environment and Heritage.
Gardener, C.J. and McIvor, J.G. (1987) Pasture Stability in the Semi-Arid Tropics of North Eastern Australia. In: Ecology and Management of the World's Savannas (eds. J. Tothill and J. Mott). Australian Academy of Science, Canberra.
Hardy, M. (1994) Discussion Paper: Land Tenure Project, CYPLUS. Dept. Lands, Cairns.
Heritage Unit. (1989) Site Register. Office of Heritage and the Arts, Brisbane. *- .
Holmes, J.H. (1987) An Assessment of Cattle Grazing in the Cape York Peninsula. Unpublished Report, University of Queensland.
Holmes, J. (1990) Ricardo Revisited: Submarginal land and non-viable cattle enterprises in the N.T. Gulf District. J. Rural Studies 6(1): 45-65.
Ive, J. and Cocks, D. (1989) Rural Land Degradation in Australia. CSIRO Survey based on ARIS (1 1/1/88). Australian Conservation Farmer l(3): 18-22.
Jensen ef al. (1994) Paper on Multipliers. Economics Department, University of Queensland.
Jones, N. (1994) Mabo, implications for land management. Proc. Australian Rangelands Society Conf., Katherine, NT.
f(ALNRM0. (1992) Land Degradation Workshop. Kowanyama, July.
Kikkawa, J. (1976) The Birds of Cape York Peninsula. Distributional Patterns, Part 2. The Sunbird 2(4): 81 -95.
Kowanyama Community Council. (1994) Aboriginal Rural Resources Initiative Project Proposal of the Kowanyama Aboriginal Land and Natural Resources Management Office, Kowanyama.
Lands Department. (1994) Land Tenure in Queensland.

McKeague, P. (1992) The Cattle Industry of Cape York Peninsula. QDPI, Brisbane.
McKeague, P. (1990) Working Paper for Queensland Cattlemen's Union.
Morton, S.R., Stafford-Smith, D.M., Friedel, M.H., Griffin, G.F. and Pickup, G. (1994) The stewardship of arid Australia - ecology and landscape management. J. Environmental Management (in press).
Moss, A.J. et al. (1993) A preliminary assessment of Sediment and Nutrient Exports from Queensland Coastal Catchments. Envir. Tech. Rep. 5, DEH, Brisbane..
Nash, R. (1 99 1) The Rights of Nature. Primevera Press, Wisconsin.
Northcote, K.H. (1980) Soils Resources Map. Atlas of Australian Resources. Division of National Mapping, Canberra.
NRAP. (1994) Vegetation Types. Draft CYPLUS Report. Queensland Herbarium, DEH, Brisbane.
Pain, C. et al. (1994) Potential Soil Loss by Water Erosion. CYPLUS Report, Div. Regional Geol. & Minerals. AGSO, Canberra.
Partridge, I. and Miller, C. (1991) Sown Pastures for the Seasonally Dry- Tropics. Conference Series QC9 1002, QDPI, Brisbane.
. r . - Pedley, L. and Isbell, R.F. (1971) Plant Communities of Cape -York Peninsula. Proc. Royal Society of Queensland 82(5): 5 1-74.
Queensland Department of Primary Industries. (1975) Land Degradation Assessment of the Gulf-Peninsula Region. Original field tables for National Survey 'A Basis for Soil Conservation Policy in Australia' (1978) Dept. Environment, Housing and Community Development, Canberra.
Queensland Department of Primary Industries. (1994) DraR Erosion Assessment for Cape York. Compiled by A. Biggs and C. Payne, Mareeba.
Roberts, B.R. (1991) The Evolution of an Australian Land Ethic and the Landcare Movement. In: Communities, Education and Stability (ed. M. Keen). Australian National University, Canberra.
Roberts, C. (1994) Injinoo Fire Management Program. CYPLUS Talkback, Cairns; July: 5-- 6.
Roberts, C. (1994a) Scoping Study for Injinoo Custodial Lands of Cape York. Pajinka, . September.
Sinnamon, V. (1992) Gulf of Carpentaria Coast and River Management - An Aboriginal Management Agency Perspective. Qld. Environmental Law Association Conf, 15 May.

Stanton, J.P. (1976) National Parks for Cape York Peninsula. Australian Conservation Foundation, Melbourne.
Stanton, J. (1992) Neglected Lands: Recent changes in the ecosystems of Cape York Peninsula and the challenge of their management. Queensland Geographical Journal 7: 1- 18.
Stanton, P. (1994) Personal Interview. Dept. Environment and Heritage, Cairns.
Stewart, G. (undated) People, Plants and Wangarr Wirws: Notes on Traditional Healing. Resource Management Office, Kowanyama.
Tindale, N.B. (1974) Aboriginal Tribes of Australia. Australian National University, Canberra.
Tothill, J.C. and Gillies, C. (1992) Pasture Lands of Northern Australia. Tropical Grassland Society of Australia, Occasional Publication No 5 . ,-.
Tothill, J.C. et al. (1987) Land Use and the productive potential of Australian savanna lands. In: Ecology and Management of the World's Savannas (eds. J. Tothill and J. Mott). Australian Academy of Science, Canberra: 125-14 1.
Transport Department. (1986) Far North Queensland Transport Study. Cairns.
USDA. (1 992) Data presented in 'Australian Beef 1993. . r. '
Water Resources Commission. (1988) Water Resources of Queensland. QDPI, Brisbane.
Weston, E.J. et al. (1981) Assessment of the Agricultural and Pastoral Potential of Queensland.
Williams, Nancy and Baines, G. (1993) Traditional Ecological Knowledge - Wisdom for Sustainable Development. CRES, Australian National University, Canberra.
Winter, J. W. and Allison, F.R. (1 980) The Native Mammals of Cape York Peninsula. - changes in status since the 1948 Archbold Expeditions. In: Contemporary Cape York (eds: N Stevens and A. Bailey). Royal Soc. Qld., Brisbane: 3 1-44.
- Winter, J. and Atherton, R. (1985) Fauna survey of the natural habitats in the Weipa Region. Proc. N. Aus. Mine Rehabilitation Workshop No. 9. (Ed. J. Lawrie). COMALCO, Weipa.
Wolfe, P. (1990) Report of a Review of the Land Policy and Administration in Queensland. - Dept. Lands, Brisbane.
WPSQ. (1987) A conservation strategy for Cape York Peninsula. Wildlife Preservation . Society of Queensland, Brisbane.
Wynter, J. and =ll, J. (1991) Pathways to Community Economic Development. Cook Shire Development Project, Cairns.

ATTACHMENT 1 - MAPS 1 - 12


CAPE YORK PENNINSULA LAND USE STRATEGY
CYPLUS b a joint Inhtive between the Queensland and Commonwealth Governments.
Landcare
PASTORAL INDUSTRY STUDY Senrices
The lnfonnatlon show on the rnap have been suppliedbyDepertmentofLands. Initial enquiries regarding this informah should be directed to the Latxk Deparbnent.
0 60 100 160
~ r a m m m ~urcmor ~o~ecllon zone & : ~ a b n ~ l p QIM
Prepared and produced by Landcare Management Services (LMS), wlth permission, Twwoornba, December 1994.
Copyright O The State of Queensland, Department of Lands, 1994.
40 h 04 EDITION NO 1 LMS - M W S
PASTORAL TENURES
This infwmation Is subject to change and ils currency should be checked through the appropiete depatlment
LEGEND
Pastoral Holdings
Grazing Homestead Perpetual Lease
Licence To Occupy
Freehold
Special Lease
Freeholding Lease
Perpetual Lease
0 Non-Pastoral Tenure
- Pastoral Holdlngs
- NomPestoral Holdings


VIABILITY OF PASTORAL HOLDINGS -= CAPE YORK rn PENNINSULA 'L- - Based on Potential Carrying Capacity LAND USE STRATEGY
CYPLUS is a joint inidative between the Queensland and Commonwealth Qovernments.
Landcare
Manweme" PASTORAL INDUSTRY STUDY Servlces
The information shown on the map have been supplied by Departments of Lands and Environment and Heritage. I n M enquiries regarding the lnformathm should be directed to the appro@ate Depertment.
This infwmation is subject to change and its currency should be checked through the appropriate deparbnent.
- Pastoral Holdlngs
- NokPastoral Holdlngs
0 50 100 150 201) Km
Tramverse Mercalur Fmjdon Zone 54 : Awlrallan Map (Md
Prepared and produced by Landcare Management Services (LMS), wlth perrnlsdon, Toowoomba, December 1994.
Copyright O The State of Queensland, Departments of Envlronmeqt and Herltage and Lands, 1994.
18 RC (I( EDITION NO 1 LMS - MU 0
LEGEND
Viable Holding
I Marginally Viable
Non Vlabte
0 Unavailable
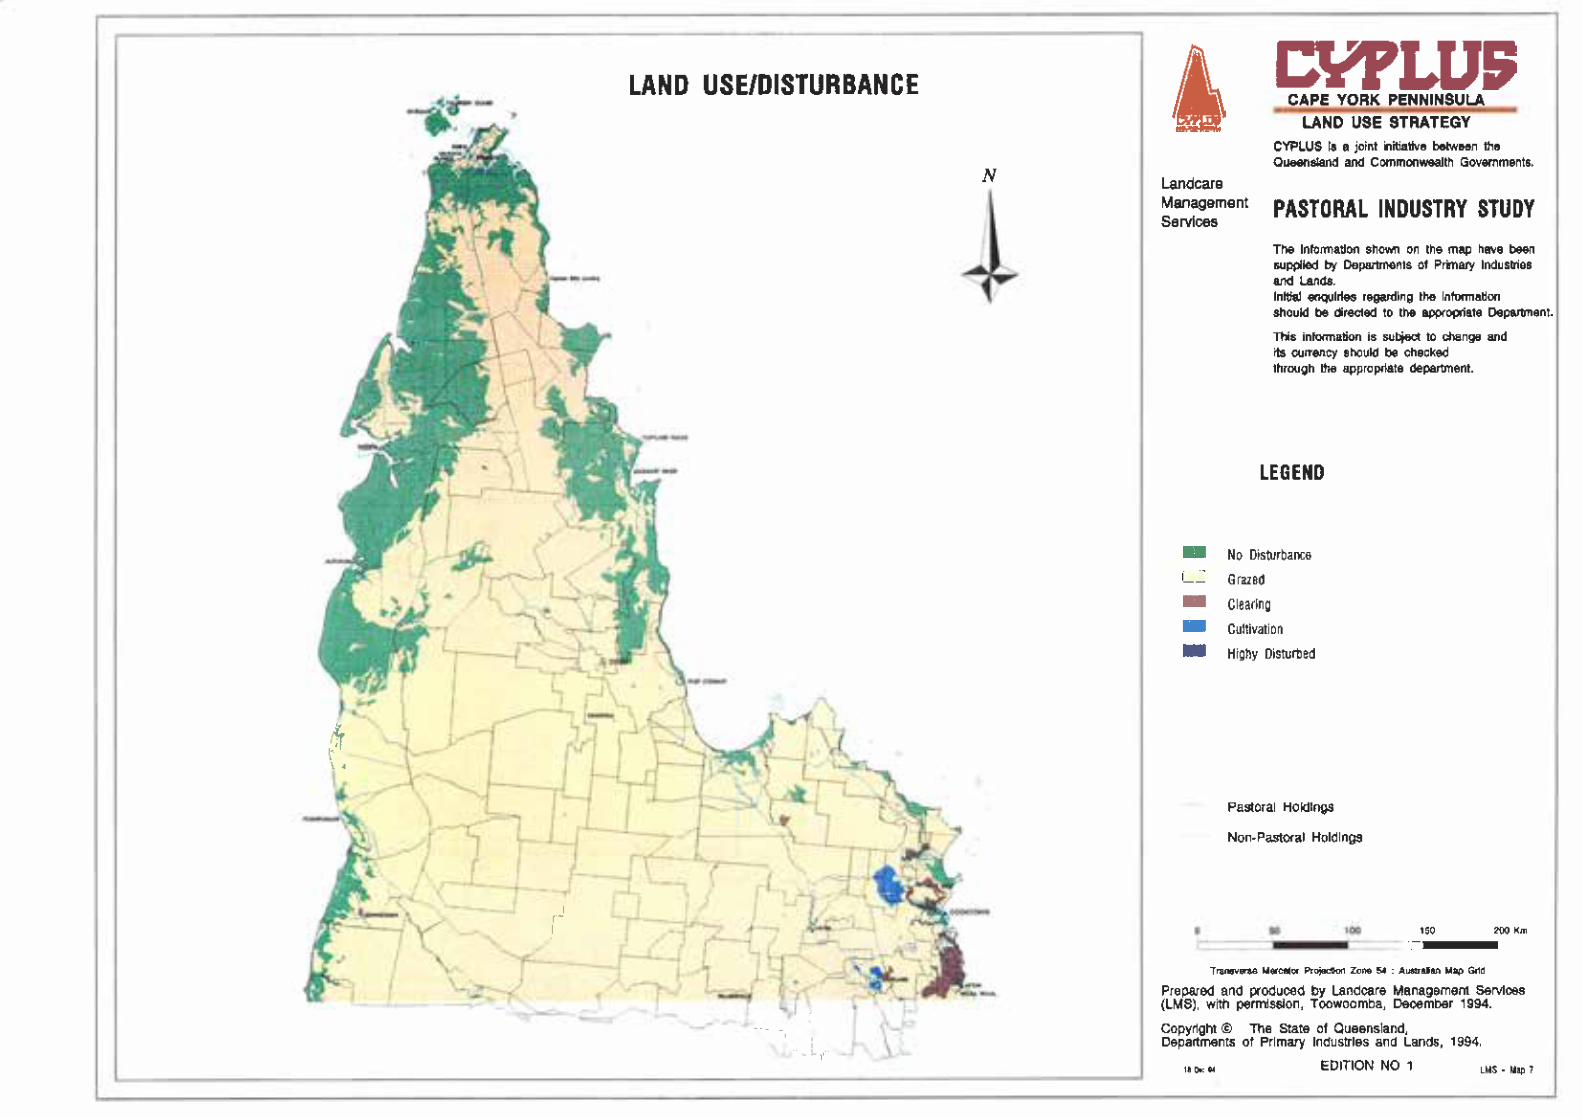


Landcare Management Services
CAPE YORK PENNINSULA LAND USE STRATEGY
CYPLUS is a joint initiative between the Queensland and Commonwealth Governments.
PASTORAL INDUSTRY STUDY The information shown on the map have been supplied by Deparbnents of Primary Industries and Lands. inltlal enqulrles regarding the Information should be directed to the eppropriate Dqmlmenl.
This information is subject to change and its currency should be checked through the appropriate department.
LEGEND
Suitable
m Suitable with Minor Limitations
Suitable wtth Moderate Llmttations
Marginal
Unsuitable wlth Excessive Limitations
Pastoral Holdings
NokPaShXal Holdings
T m a m e Mmaa Pm$dlon Zone 54 : Wnl ian Map (;rfd
~repahd and produced by Landcare Management Servlces (LMS), wtth permisdon, Toowoomba, December 1994.
Copyright O The State of Queensland, Departments of Prlmary Indusbles and Lands, 1994.
EDITION NO 1 LMS - Map 9

SUITABILITY FOR MEDIUM INPUT PASTURES
P
CAPE YORK PEN.,...,UtA LAND USE STRAtEGY
CYPLUS is a joint initiative between the Queensland and Commonwealth Oovemments.
Landcare Management Services PASTORAL INDUSTRY STUDY
The information shown on the map have been supplied by Departments of Prlmary Industries and lnlttal Lands. enquiries regarding the Information
should be directed to the appropiate Deparbna
This information is subject to change and its currency should be checked through the appropriate deperbnent.
LEGEND
Suitable
Suitable with Minor Limitations
Sultable wtth Moderate Llrnltatlons
' Marginal
Unsuitable with Excessive Limitations
- - Pastoral Holdings
Non-Pastoral Holdlngs
Trarrsverae Mercator Ro$dlon Z m 54 : Warn Map Grld
Prepared and produced by Landcare Management Setvlces (LMS), with permission, Twwoomba, December 1994.
Copyright O The State of Queensland, Departments of Primary Industries and Lands, 1994.
18 DSC w EDITION NO 1 LMs - Map 10

APPENDICES


LIST OF APPENDICES
Pastoral Land Tenures
Lands Department Pastoral Leases
Economic Analysis Methodology
Cattle Property Case Studies
BREEDCOW and DYNAMA Calculations and Findings
Statistics for Maps 5 & 6, Existing and Potential Carrying Capacity by Property
Statistical Divisions
Property Management Planning
Mareeba Saleyards Averages for February 1989 to June 1994
Cattle Categories Sold Through Mareeba Saleyards from February 1989 to June 1994
Questionnaire Analysis
Carrying Capacity and Potential of Peninsula Lands
Proposed Land Management Units
Costing of Proposed Land Management Units
Sustainable Pastoralism in Northern Australia
An Overview of Aboriginal Land Resource Use in Cape York
Page
2
12
26
34
4 1
7 1

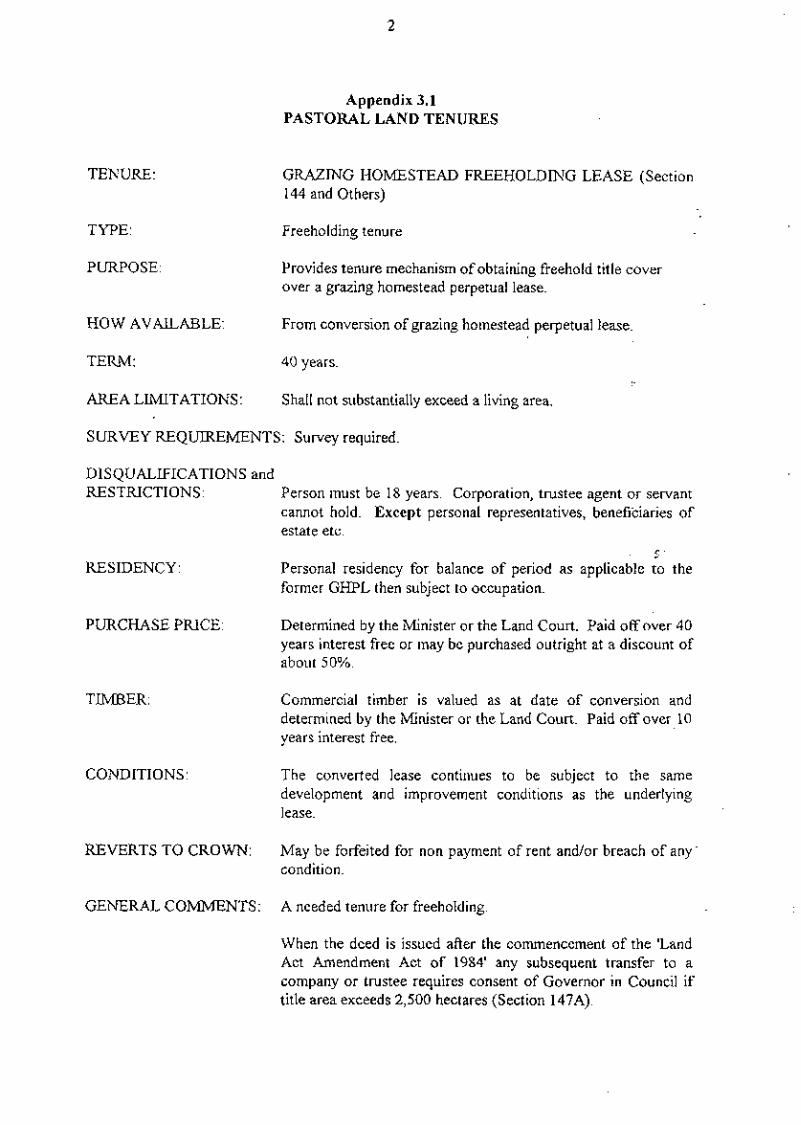
Appendix 3.1 PASTORAL LAND TENURES
TENURE: GRAZING HOMESTEAD FREEHOLDING LEASE (Section 144 and Others)
TYPE: Freeholding tenure
PURPOSE: Provides tenure mechanism of obtaining freehold title cover over a grazing homestead perpetual lease.
HOW AVAILABLE: From conversion of grazing homestead perpetual lease.
TERM: 40 years. ,-.
AREA LIMITATIONS : Shall not substantially exceed a living area.
SURVEY REQUIREMENTS : Survey required.
DISQUALIFICATIONS and RESTRICTIONS : Person must be 18 years. Corporation, trustee agent or servant
cannot hold. Except personal representatives, beneficiaries of estate etc.
. C'
RESIDENCY: Personal residency for balance of period as applicable to the former GHPL then subject to occupation.
PURCHASE PRICE: Determined by the Minister or the Land Court. Paid off over 40 years interest free or may be purchased outright at a discount of about 50%.
TIMBER: Commercial timber is valued as at date of conversion and determined by the Minister or the Land Court. Paid off over 10 years interest free.
CONDITIONS : The converted lease continues to be subject to the same development and improvement conditions as the underlying lease.
REVERTS TO CROWN: May be forfeited for non payment of rent and/or breach of anys condition.
...
GENERAL COMMENTS: A needed tenure for freeholding.
When the deed is issued afier the commencement of the 'Land Act Amendment Act of 1984' any subsequent transfer to a company or trustee requires consent of Governor in Council if title area exceeds 2,500 hectares (Section 147A).

The Comn~ittee would see that restrictions sllould be placed on the issue of this tenure until such tirlie as the appropriate controls are placed on all lands of the State to control misuse and wanton destruction of trees along water courses, steep slopes, wildlife habitat, etc and until the matter of reservation in title of extractive industries is considered.
The temls of the purchase price have been addressed elsewhere.

TENURE:
TYPE:
GRAZING HOMESTEAD PERPETUAL LEASE (Section 6 1 and others)
Primary tenure for grazing and agricultural purposes.
HOW AVAILABLE: By ballot, renewal of lease, or conversion from pastoral lease types in certain instances.
TERM: Perpetuity (ie. forever).
AREA LIMITATIONS: Shall not substantially exceed a living area.
SURVEY REQUIREMENTS: Survey usually insisted upon.
DISQUALIFICATIONS and RESTRICTIONS: Person must be 18 years. A person cannot apply for or hold
two or more GHPL's in excess of two living areas.
Corporation, trustee agent or servant cannot hold. Except personal representatives, beneficiaries of estates, etc.
RESIDENCY: Ballot block - personal resident maybe imposed for the first seven years, thereafter occupation.
RENT: Determined by Minister or Land Court in accord-with the ~ q m e - principles as for a pastoral holding.
CONDITIONS: As required on the opening lease which the Minister may impose. No trees may be destroyed without first obtaining a permit from the Land Commissioner.
REVERTS TO CROWN: May be forfeited for non payment of rent andlor breach of any condition.
GENERAL COMMENTS: Generally seen as the family unit tenure and one which takes over fiom the pioneer pastoral lease type. Freeholding may take place subject to public interests, etc.
This is a relevant tenure and is still required and necessary.

TENURE: PASTORAL HOLDING (Section 49 to 6 1)
.- TYPE: Leasehold.
PURPOSE: Pioneer tenure for grazing and agricultural purposes and for the .
larger mostly unsurveyed leases in the distant areas of the State.
HOW AVAILABLE: Ballot, renewal of lease, or as an additional area.
TERM: Up to 50 years. (Extended from the previous 30 years term by the 1966 Amending Act No 3 1 .)
AREA LIMITATIONS: No limitations on area or numbers of holdings held in the one ownership.
SURVEY REQUIREMENTS: Survey not required. ,-.
DISQUALIFICATIONS and RESTRICTIONS : Person must be 18 years of age. Registered and company and
incorporated organisations can hold. Must be used for pastoral or agricultural purposes unless with the Minister's prior approval in writing for alternative use, eg. tourism. No restrictions on ownership but Minister's consent is required for transfer, as is the case for all leases and licences (Section 286).
RESIDENCY:
RENT:
CONDITIONS:
FREEHOLDING:
. . -. , . C.' None prescribed.
.Determined by Minister; can be referred to the Land Court if rent is over $100.00 per annum. Rental is based on a netfrate per head of estimated long term average carrying capacity; reassessed every 10 years. If land is .classed as arable then rental is struck at 2.5% of the unimproved capital value of such land as at the date of assessment.
Development and improvement conditions as considered relevant by Minister. No trees- may be destroyed without first obtaining a permit from the Land Commissioner.
Direct freeholding of this tenure is not available. Conversion to grazing homestead perpetual lease may be allowed in specific instances with Ministerial approval.
REVERTS TO CROWN: May be forfeited for non payment of rent andlor breach of conditions. Resumption provisions do not now apply tothis tenure although in the past there was provision to resume up to one third of a lease after the first 15 years of its term.

GENERAL COMMENTS: Generally used as the 'first up' tenure, and is now predominantly associated with the larger cattle and sheep properties in the outer areas of the State.
This tenure needs to be retained. Some of these leases could provide land for closer settlement if such could be made available.

TENURE:
TYPE:
PURPOSE:
OCCUPATION LICENCE (Section 75-79)
Occupation purposes only - usually over expired pastoral holdings while fiiture land use is being sorted out.
Interim tenure to allow continued occupation of land pending the issue of a new lease; sometimes used over areas such as +,
mining fields where other tenures are inappropriate.
HOW AVAILABLE: Can be auctioned, but generally priority. is given to current occupier of land who would be the lessee of the previous expired lease.
TERM: Renewed yearly by payment of annual rental.
AREA LIMITATIONS: No limitations.
SURVEY REQUIREMENTS: Survey not required.
DISQUALIFICATIONS and RESTRICTIONS: Person must be 18 years. Companies are incorporated and
organisations can hold. Minister's permission needed for transfer.
RESIDENCY:
RENT:
CONDITIONS:
C ' .- _. -. None prescribed.
Determined by Minister generally in line with pastoral lease rents when in the grazing areas or amount bid by, successfbl applicant if auctioned.
Improvement conditions may be imposed by the Minister.
No improvements are to be effected without the prior consent of the Minister.
No trees may be destroyed without first obtaining a permit from the Land Commissioner.
REVERTS TO CROWN: By giving three months notice by Minister.
FREEHOLDING: Not permitted.
GENERAL COMMENTS: This tenure is seldom used.
When the passing of the Mineral Resources Act this type of licence will not be needed for lands situated in the mining fields because better tenures can then be used.

Section 159A of the Land Act makes provisions for -the Governor in Council to extend an expired Iiolding lcasc fix up to nine (9) n~onths where an application has bccn made for a new lease belbre expiry,

TENURE:
TYPE:
PURPOSE
SPECIAL LEASE (Section 198-207)
Leasehold (freehold conditions can be built in under Section 205 in certain instances).
Can be used for any purpose over Crown land and reserved land - can cover large rural properties, towns lots, tourist purposes, --.
special projects, leases over State forests, reserves, etc. A nlulti purpose tenure which has outgrown its original intent.
HOW AVAEAEiLE: By auction and in priority.
TERM: Up to 30 years by action where the auction determines the first period rental. Up to 75 years where conditions require substantial improvements or where conversion to freehold is not allowed.
PLREA LIMITATIONS: No specific area limitations but usually in accord with areas available as GHPL where rural lands are concerned.
SURVEY REQUIREMENTS: Survey not required unless freeholding is taking place.
DISQUALIFICATIONS and RESTRICTIONS: Person must be 18 years. Registered company and incorporated
organisations can hold. Minister's permission requested ,for J -
transfer.
RESIDENCY:
RENT:
CONDITIONS:
None prescribed.
Rents are fixed or determined by the Minister and shall be an amount an experienced person would pay for the lease. Reassessment is not specific but is usually every five years.
Auction - rent determined by the successhl bidder (amount stated as upset rent). Reassessment - determined by the Minister and may be referred to the Land Court if above $200.00 per annum.
Development conditions as considered relevant; also there is a specified purpose for which lease is to be used.
No trees may be destroyed without first obtaining a permit from the Land Commissioner. ...
REVERTS TO CROWN: May be forfeited by non payment of rent andlor breach of any condition.

ENERAL COMMENTS: The lessee has the right to apply for freehold tenure if not expressly prevented in the lease. Where Crown land is costly to develop a lease can issue as a prelude to freehold with a pre- determined purchase price and would include specific development conditions, eg. tourist leases.
If the lease expires the land reverts to the Crown for further -,
dealing. This tenure has evolved over time and has become a : general use tenure for many varied circumstances.

'TENURE:
TYPE:
PURPOSE
PERMIT TO OCCUPY (Section 37 1 A)
Occupation.
To permit use of Crown land, reserve or road, while at the same time preserving the underlying lawhl usage.
HOW AVAILABLE: Can be granted over Crown land, reserve or road without the .
need for cancelling the reserve or closing the road.
TERM: Generally has no term and continues by payment of annual rent.
AREA LIMITATIONS: None prescribed.
SURVEY REQUIREMENTS: None required.
DISQUALIFICATIONS and RESTRICTJONS: None.
RESIDENCY: None prescribed.
RENT: Determined by Minister.
CONDITIONS: Conditions such as fencing and others as considered relevant. No timber destruction allowed unless with the consent o f jhe . > Conservator of Forests. .
REVERTS TO CROWN: Terminable at will by the Minister.
GENERAL COMMENTS: Low security tenure to enable occupation of land without interfering with the underlying usage eg. will allow grazing on a road but without limiting the use of the area for road purposes.
Permits have occasionally been issued liberally in the past 'or long time arrangements when- a lease would have been more relevant.
There is also problem that the underlying land authority always remains intact and consequently available for its legal use. Any improvements technically interfere with this underlying use, eg. beach huts on explanade which is a contr~4iction in terms:
A very useful tenure but in need .of some refinements.

Appendix 3.2 12
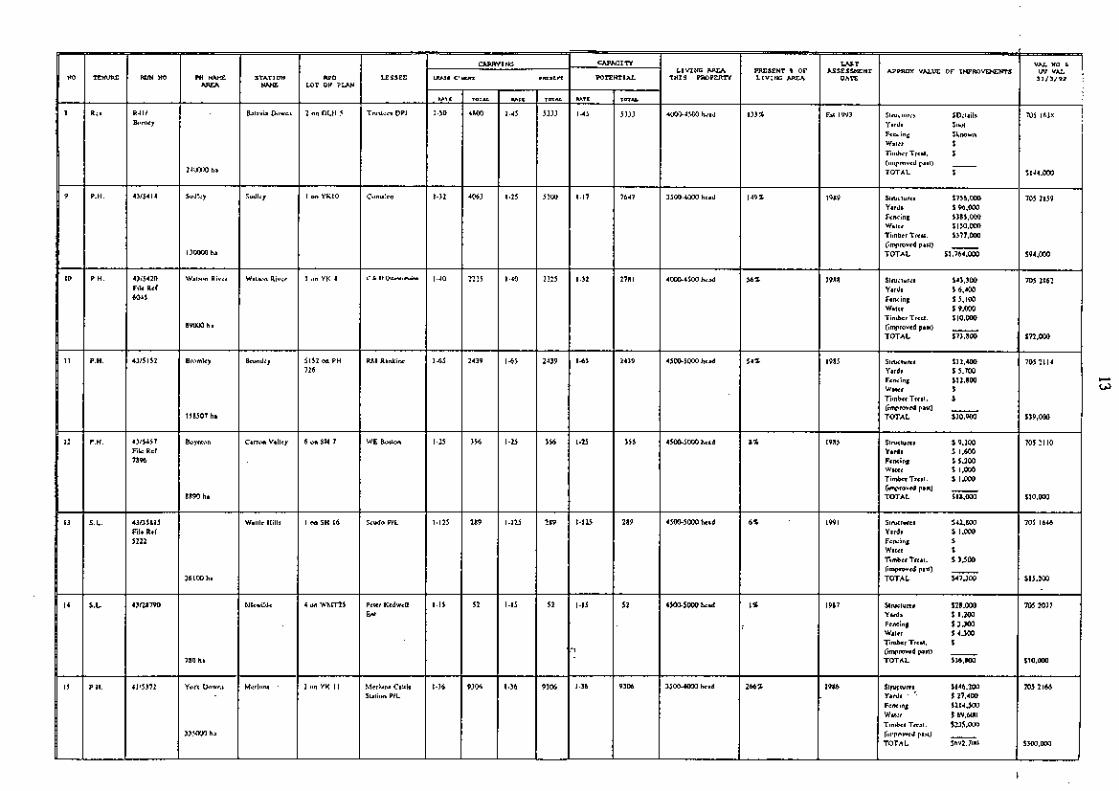
NO
8
9
10
I I
I 2
I 3
I 4
I5
LIVING AREA THIS PROPERTY
4000-4500 hrnd
3500-4000 hend
4000-4500 hend
4500-5000 head
4500-5000 head
4500-5000 head
45004000 head
35004000 head
TEMIRE
RPS
P.H.
P.H.
P.H.
P.H.
S.L.
S.L.
P.H.
PRESENT 8 OF LIVING AREA
133%
149%
56%
54%
8%
6%
116
:. . ..
266 % .
RUN NO
R 4 l l &,may
4315414
4315420 File Ref 6045
4315152
4315557 File Ref 7896
43/l58I5 File Ref 5222
43/28790
4115172
W T ASSESSMENT
DATE
L t IYY3
1989
1988
1985
1985
1991
1987
I986 ..
PH NAME AREA
24IXXM ha
Sudlcy
13MMO ha
Walala River
89000 ha
Bmmley
IS8S07 hn
Buynton
8890 ha
36100 ha
780 ha
Yerk Dnwns
3 3 0 0 0 ha
APPROX VALUE OF IMPROVEHEWS
Stmrlurcs SDelnilu Yardr Snol Fencing $known Wnter S Tinther Trent. 5 (i~npmved port) - TOTAL S
Structure. $756,000 Yards 5 96.000 Fencing $385.000 Woler S150.000 Timber Trenl. 5377.000 (i~nproved pnsl) - TOTAL S1.764.000
S l ~ c l u r ~ r 553.300 Ynrda $ 6.400 Fencing 5 5.100 Water S 9.000 Timber Trent. $10.000 (improved part) - TOTAL 573.800
Strucares 512.400 Yards S 5.700 Fencing S12.800 Water 5 Timber Treal. S (improved past) - TOTAL 530.900
Structures S 9.200 Yards 5 1.600 Fencing 5 5.200 Wstcr S 1.000 Timber Treat. S 1.000 (improved part) - TOTAL $18.000
S l ~ c l u r ~ s 552.800 Yards 5 1.000 Fencing s Walcr Timber Trent. S 3.500 (improved paa) - TOTAL $47.30
Slructures $28.000 Yards S 1.200 Fencing S 3300 Water S 4300 Timber Treal. 5 (improved past) - TOTAL 136.800
Slyuplure: S146.200 Yards ' ' S 27.400 Fencing S214.500 Wnlor S6Y.W Tin~bcr Tn.nl. S?JS.O(IO (itt~pn,ved pnxl) - TOTAL S6Y2.7IX)
STATION NAME
Bnlnvin Downs
Sudluy
Wntron Rivor
Bmntloy
C s m n Valley
W a l l i l l
ldlcwildc
Mdrlll6la .
VAL NO C W VAL 31/3/92
705 16JX
5144,000
705 2159
S94.OW
705 2162
572.000
705 2114
539,000
705 2110
510.000
705 1646
f 15.200
705 2077
$1 0.000
705 2166
S300.000
RPD LOT ON P W I
2 on DLH 5
I on YKlO
I un YK 4
5152 on PH 726
6 on SH 7
I on SH 16
4 on Whfr25
2 un YK I I
LESSEE
Tmslcus DPI
Cocnnlco
C* I X Y * ' M ~ ~
Rh.1 Rnnkinc
WE Burton
Scudo PIL
Peter Kedwcll En1
hierluno Calllo Sution PIL
ruzl
RATS
1-50
1.32
1-40
1-65
1-25
1-125
1-15
1-36
FAIL
1-45
1-17
1-32
1-65
1-25
1-125
1-15
,* ,
1-36
CAPACITY
WTENTIAL
T O T U
5333
7657
2781
2439
356
289
5 1
9306
P ~ S L K I
TOTAL
5333
52W
2225
24l9
356
289
52
'
9306
CARRYING
c'mm
l O T I L
4800
4063
2225
2439
356
289
52
9JOh
RATE
1-45
1-25
1-40
1-65
1-25
1-125
1-15
1-36
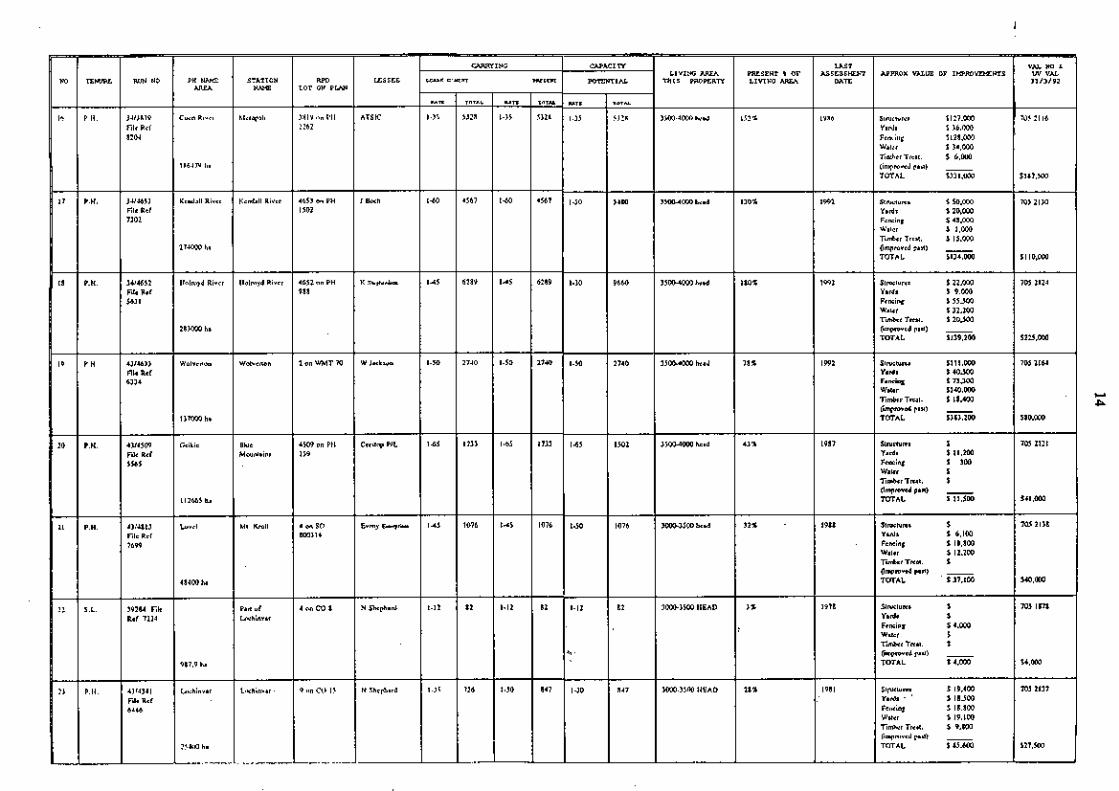
d
LIVING AIW TRIS PROPERTY
3500-4W0 lhvod
3500.4000 head
3500-4000 hcad
3500-4000 head
3 5 W 0 0 0 head
3 W 3 5 0 0 head
3000-3500 HEAD
3000-3500 IIEAD
ruc;a
U T C
1-15
1-60
1-45
1-50
1-65
1-45
1-12
1.35
RPD LOT ON PLAN
3819 4118 PI1 2262
4653 on PH 1502
4652 on PH 988
2 on WMT 70
4509 on PH 159
RATE
1-35
1-50
1.30
1-50
1-65
1-50
1-12
.h. .
1-30 I J I p . I 4314341 Lohhy ~nchitwar. O; cO ti S h c p h d File Ref 6446
25400 ha
LESSEE
ATSIC
l Boch
K ShepbnLon
W Jaekwn
Crestnp PIL
4 on SO 800314
4on CO 8
PH NAME AREA
Cwn River
186479 Itn
KendnII River
274000 ha
Holnryd River
283000 ha
Wolvenon
137000 ha
Gcikic
PRESENT b OF LIVING AIW
152%
130%
180%
78 %
43 1
32% "
3%
:. . .
28%
RUN NO
3413819 File Rcf 82W
3414653 File Ref 7202
3414652 File Re f 563 1
4314633 File Ref 6334
4314509 File Ref
- NO
16
17
I 8
19
20
CARRYING
c'uzm
TOTAL
5328
4567
6289
2740
1733
1076
82
726
CAPACITY
POTENTIAL
T O I N .
5328
5480
9660
2740
1502
1076
82
847
Evruy &*rpri.a
N Shephard
STATION NRME
Mrrapnl~
Kandall River
Hulmyd River
Wolvcnon
Blue Mountains
11 2665 ha
b v e l
48400 ha
987.9 ha
5565
4314813 File Ref 7699
39284 File Raf 7225
TENURE
P.H.
P.H.
P.H.
P.H.
P.H.
I 21
22
M I Kmll
Pan of Lwhinvar
LAST ASSESSMENT
DATE
I986
1992
1992
1992
1987
1988
.
1978
1981 . . .
P.H.
S.L.
T
1-35
1-60
1-45
1-50
1-65
1-45
1-12
1-30
PRESENT
T O T l L
5328
4567
6289
2740
1733
1076
82
847
APPROX VALUE OF IMPROVPeNTS
Slruclurea 5127.WO Yards S 36.000 Fcncing $128,000 Wotcr S 34.000 Tinlhcr Trent. S 6.000 (illlpruvdd pall) - TOTAL $331.000
SlIUclUrcr 5 50.000 Yard. S 20.000 Fsncing S 48.000 Waler S 1.000 Tin~hcr Trcat. S 15.000 (impmvcd past) - TOTAL 5134.000
Slcuctu~z $ 22.000 Y d s S 9.000 Fencing S 55.500 Waar S 32.200 Timber Treat. S 20.500 (improved pan) - TOTAL S 139.200
Stcuce~s SIII.000 Yards S 40.500 Fencing S 73.300 Water $140,000 Timbcr Tmal. S 18.400 (impmved past) - TOTAL ' 9383.200
Slcuclures S Yards S ll.200 Fencing S 300 Water S TimberTnl . S (Improved psn) - TOTAL S11.SOO
Stcuclures S Yards S 6.100 Fencing S 18.800 Waler S 12.200 TimbcrTreat. S (improved pan) - TOTAL ' 'S37.100
Slcuclu~s S Yard1 f Fencing S 4.000 Wntcr S Timber Treat. S (improved past) - TOTAL S 4.000
S Ip~ Ium l $ 19.400 Yanl. - '. S 18.500 Fcacing S 18.800 Watcr S 19.I00 Tit11hL.r Treat. S 9.800 (impmved paxl) - TOTAL S 85.600
VAL NO C W VAL 31/3/92
705 21 16
S 187.500
705 2130
S110.000
705 2124
$?2(,000
705 2164
580.000
705 2121
S4l.000
705 2138
$40.000
705 1878
f 4.000
105 2137
527.500


NO
48
49
50
51
53
54
55
56
LIVING AREA THIS PROPERTX
3500-4000 Itcad
3500-4000 head
3500-4000 hend
4000-4500 head
40004500 head
3500-4000 head
3500-4000 head
3500.4W head
TENURE
P H I
P H
S L
P H
P.H
P H
P.H.
P D 11
PRESENT * OF LIVINO AREA
39 1
1261
0.3%
41 %
28 16
121% -
139%
3551
RUN 110
1414710
I4fl498 File Ref 5105
26670 expired Ftle Re l 5087
3414695
3414829 Alc Ref 5368
3415545 f i le Ref 5369
34A546
3411796
lAST ASSESSMENT
DATE
1984
1993
1984
1984
1980
1988
1988
1983
Pll NNlE AREA
Ljthe
1727S1 ha
Slarclc
177000 ha
479 ha
Baluga
116000 ha
senon
78995 ha
Helrnqley
233000 ha
Kulsta
170000 hn
Rulland Pln~ttr
236000 hn
APPROX VALUE OF 1MPROVU.IENTS
Stmcmrcs SNll Yards S Fenctng S w a l d ~ $ Timber Trent. 5 (improved pan) - TOTAL S
S l r u c a ~ r S 1.000 Yards S Fcnc~ng S 5.800 Water S 16.200 Timber Trent. S 34.400 (improved part) - TOTAL S 57.400
S l ~ c t v n r S Ntl Yenla 5 Fencing S Water S T i ~ t ~ b c r Tnnl. S (improved past) - TOTAL S
Structums S Yards S 1.350 Fencing S Water S Timber Tnmt. S (Improved past) - TOTAL S 1.350
S t ~ ~ c l u m r S 5.200 Yard1 S 8,400 Fencing S Water s Timber T n l . S (improved paa) - TOTAL S 13.600
Slmclum; S 15,600 Yard; S 34,000 Fencing S 7500 Water S Timber Treat. S 3.000 (improved pnn) - TOTAL S 60.100
SINCIUKS $150.000 Yard; f 77,500 Fencing S236.000 Water S 40.000 Timber Treat. S 5.000 (impmved past) - TOTAL S508.500
S l ~ c l u m r SIJ2.000 Yard8 ' S 48.800 Fencing S136.700 Water SI50.000 Tintbcr Treat. $ (ietproved pant) - TOTAL S487,SM
-.--
VAL NO C W VAL 31/3/92
705 2108
MI.000
705 2156
S212.500
705 2156
S40.000
705 2104
SW.000
705 2151
S27.000
705 2135
915 982
S124.000
915 982
S102.000
915 999
S320,oOO
STATION NAME
Part 1,f
K.rlpawnr
Slarclc
Pal( ofStarcle
Balurga
senon
Onnoo
Koolamh
Ratlnnd Pbms
RPO LOT ON PLAN
4780 on PII 2247
2498 on PH 1402
3 on 8S 81
4695 on PH 1656
4829 on PH 436
I 2 on CTh 3
13 on CTH 3
1796 am PI1 IJ72
LESSEE
Wnlsnn PIL
Gcorge Quaid Holdings PIL
George Quaid tloldiags PIL
D A Price
N H Ftnch
Kowanyama Co~nntunbty Council
GL.CB,HM Hughes
M D l l PIL
r u q c
W I G
1-125
1-40
1-40
1-70
1-70
1-55
1-35
1-22
CAPXI
RATE
1.125
1-34
1-40
1-70
1-70
1-55
1-35
t.,
1.19
CRRRYING
cencwr
TOTAL
1382
4425
I 2
1657
1129
4236
4857
ton1
Ti P
POTENTIAL
TOTAL
13x2
5206
I 2
1657
1129
4236
4857
12421
RITE
1-125
1-40
1.40
1-70
1-70
1-55
1-35
1.22
PVZSTH~
TOTAL
1382
4125
12
1657
1129
4236
4857
lam

LIVING AREA THIS PRDPERlY
3500-4000 head
3500-4000 hond
3500-4000 hand
3500-4000 hcad
3500-4000 head
35004000 head
3500-4000 hcad
3500-4000 head
RUN NO
3414862
3414732
3414682 F i b Rel 5581
146541 5480 Filc R c l 5961
346481 File R c l 8887
34R007 File R c l 5211
1414579 Filc RcP 6259
I4152624 File Rel 8108
PH NAME AREA
Dunbar
68300 ha
Harkner~
136751 ha
lnglrhy So111h
l 13000 ha
Pcringa
140000 ha
Wulpan
262000 ha
Drumdull
204000 ha
Morehead
37800 ha
4JIlWl 111
NO
57
58
59
60
61
62
63
64
PRESENT OF LIVING AREA
488%
52%
46%
62%
115%
194% '"
27 %
.:. . ..
22%
TENVRE
P.H.
P.H.
P.M.
P.H.
P.H.
P.H.
P.M.
S.L.
STATION NAME
Dsnbnr
Harknrrr
Cruxhic
Pan of Dixie
pan of Dixie
DrumduR
May Valley
Pan of ~n j inga
LAST ASSESSMENT
DATE
1984
1984
1992
1984
1984
1982
1974 &pan 1987
1990
.
RPD LOT ON PLAN
3 a11 M M ?
4732 on PH 2209
4682 on PH 1137
l on WR 4
l on WR 3
2 on SN 848571
4579 on PH 1783
36 on CP 8501 I4
APPROX VALVE OF IMPROVEMENTS
Structumr $55.200 Yards $149.600 Fencing $151,600 Waler 5 56.000 Timhcr TICPI. S (improved past) - TOTAL $412,400
St~ctures $Ni l Yards 5 Fencing 5 Wakr $ Timber Treat. $ (improvcd part) - TOTAL $
Slruclurcs $Nil Yards S Fcncing S Wntcr 5 Timber Treat. S (improved past) - TOTAL $
Slructurcs $112.800 Yards 5 33.000 Fencing S 80.000 Walcr S 29,000 TimbcrTreal. f 7,000 (improved paa) - I TOTAL $29 1,800
Slructures $ Yards 5 6,400 Fencing S 14.500 Watcr S 2,000 I Timber Tre.1. 5 (impmvcd past) - 1 TOTAL S 22.900
Structures S 46.500 Yards $ 44,700 Fencing 5 53,500 Walcr $ 8.800 Tinthcr Treat. $ (improved past) - TOTAL $153,500
Structures S 12,000 Yards S 5.600 Fencing 5 38.200 Water 1 4.300 l imber Trent. S 3.000 (improved pan) - TOTAL S63.100
S l ~ c m r e ~ $ Yards' ' S Fencing $ Wnter S 6.300 Timber Treal. $ (imgmvcd pnrl) - TOTAL $ 6.300
VAL NO L W VAL 31/3/92
915 974
712 6757
S683.MX)
705 2173
544.000
705 2128
$40,000
705 2148
577.000
705 2148
S103.MX)
705 2119
712 6758
5285.000
705 2141
S4l.000
705 1872
S35.000
LESSEE
M D H PIL
III Faloon
Gorin PIL
Dixic Holdings R y Ltd
Dixie Holdings R y U d
GL,CB.HM Hughes
M I & CF Shephard
RP.U.MG llnrtly
L U S C
RATS
1-40
1-75
1-10
1-65
1-65
1-30
1-40
1-55
RATE
1-32
1-75
1-70
1-55
1-65
1-30
1-40
4 . h
1-55
CAPACITY
POTENTIAL
Term
21344
1823
1614
2154
403 1
6800
945
784
CRRRYING
C.HENI'
TOTN.
7
1813
1614
2154
4031
6800
945
784
RATE
1-40
1-75
1-70
1-65
1-65
1-30
1-40
5
PDEStm
TOTAL
17975
1823
1614
2154
4031
6800
945
784

I 480 lam 11?.000
lESSEE
RP.U.MG Hsnly
KI Duffy
PT O'Shea
GC & RG Raymond C & M lnnet
Cc & RG Raymond. C & M Innel
Sand Ranch PIL
JM Kazicka
G&CTumcr & Grca~ur Finance
CARRYING CAPACI N
RPD LOT ON PLAN
37 on CP 8.501 I4
5228 un PH 1242
2570 on PH 2050
47 on C 8l68SS
48 on CP 846855
2367 on PH 2069
l on SN 848572
2 on WR 5
LLTZ .
1-15
1-55
1-55
1-65
1-65
1-35
I-2S
1-15
LIVING AREA THIS PROPER'IY
3500-4000 head
3500-4000 head
35004000 head
3SW-4000 head
3500-4000 head
3500-4000HEAD
3500-4000 head
'
3500-4000 hcad
NO
65
66
67
68
69
70
71
72
POTENTIAL
r m u
2440 ,
482
1837
962
480
2174
3734
wnsr
T
1-35
I
1-65
- 6 5
1-65
1-43
1-26
1-35
LAST ASSESSMENT
DATE
1990
1988
1991
1988
1988
1992
'
1979
PRESENT % OF LIVING AREA
3.5 8
14%
52%
27%
14%
6 2 8
107%
-
PH NAME AREA
43100 hn
lmooyn
26500 ha
Wipella
101009 ha
Kimba
62500 ha
31200 ha
King luncliun
76081 ha
**le*cn
93347 ha
LLTE
1-35
1-44
1-55
1-65
1-65
1-35
1-15
1-35
c'wm
TOTAL
1046
482
1554
962
480
1769
3590
42
STATION NRME
Pnrc uf Kalingr
ltnooya
Killnrnuy
Kimba
O i n ~ c l c r
King lunclion
m l h h
The H ~ A Roadhouse
mNVRE
CHPL
P.H.
P.H.
P.H.
P.H.
P.H.
P.H.
S.L.
v ~ s c m
TOTAL
1046
482
1837
962
480
2174
3734
t ,>
42
APPROX VALVE OF IMPROVP(ENT3
Stnlcturcr S 79,000 Yards S 7.300 Fencing S 36.600 Wacr S 41.800 Timhcr Trcal. $135,500 (improved pam) - TOTAL $300,200
~lruclurcr $ 44.000 Ynrds 1 17.600 Fencing S 30.000 Water S Timber Trcal. S 5.000 (improved past) - TOTAL 5 96.600
Slruclurer $189.600 Yards S 23.400 Feneing S 56.800 Waler S 89.500 Timber Treat. S 6.000 (improved part) - TOTAL $365.300
S l ~ ~ l u r e a $132.000 Yards S 14.400 , Fencing S 35.200 Water s Iz.100 ! Timber Treat. $ (itnprovcd pnrl) - TOTAL $193.700
Slruclvrer $ 53.200 Yard1 s 12.900 Fencing S 7.200 wa1er s 20.000 Timber Treat. S 7.200 (improved p a 9 - TOTAL $100.500
S I N C I U ~ S S 113.900 Yards S 17.400 Fencing $ 60.000 Wafer S 6,900 Timber T n l . S 44,200 (improved pas) - TOTAL 5242,400
Slructure~ f 5O.MX) Yards S 15.300 Fencing S 8.600 Waler S 4,300 Timber Treat. S 15.000 (improved past) - TOTAL S 93.200
RUH NO
141235 Filc Ref 8109
3415228
34rU70
3415565 File Ref 5111
3415564 Filc Ref 8123
3412367 File Ref 8148
3411434 File Rcf 8148
49495
VAL NO C W VAL 31/1/92
705 1872
$37.000
705 2126
f 16.000
705 2163
$48.000
705 2131
S 29.000
705 2150
514.500
705 2132
S85.000
705 215815
712 6792
$152.000
705 1871

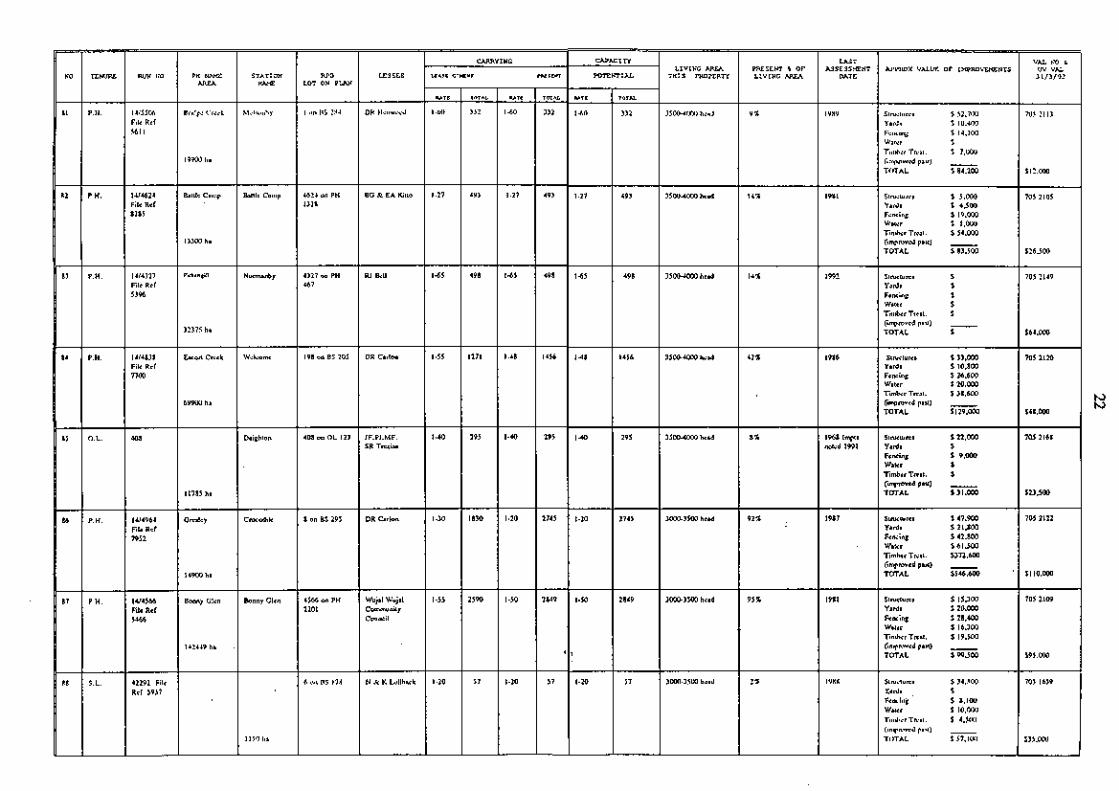
NO
81
82
83
84
85
86
I 87
88
RlTI
1-60
1-27
1-65
1-48
1-40
1-20
1-50
$
1-20
PH NAME AREA
Bridge Creek
19900 Iin
Ballle CWII~
13300 ha
P*t=ndll
32375 ha
Escort Creek
69900 ha
11785 ha
Gesley
54900 ha
b n n y Glcn
142449 ha :.
LIVING AREA THIS PROPERW
3500-4U00 hand
3 5 W m head
3500-4003 head
3500.4000 hard
3 5 W 0 0 0 hcad
3000-3500 herd
3000-3500 hcnd
3000-35IXI hood
LEIS=
U T E
I ~bO
1-27
5
1-55
1-40
1-30
1-55
1.20
C A ~ A C I ~
POTENTIAL
TOTAL
332
493
498
1456
295
2745
2849
57
TENURE
P.H.
P.H.
P.H.
P.H.
O.L.
P.H.
P.H.
S.L.
PATC
0
1-27
1-55
1-48
1-40
1-20
1-50
1-20
CRR8YING
c'mllt
TOTAL
312
493
498
1271
295
1830
2590
. 57
STATION NAME
hlelwttby
Bnllle Cmnp
Normnnhy
Wolconie
Deighlon
C n r d i l e
b n n y Glen
I IS0 ltn
PRESENT * OF LIVING AREA
9%
1416
1416
42 16
816
922 . ,:
95 16
... . ,.
2%
RUN NO
1415506 File Ref 5661
1414624 File Ref 8285
1414327 File Rcf 5396
1Y4838 File Ref 7700
408
1414964 File Ref 7952
1414566 File Ref 5466
42292 File Rel 5937
PILTSCNI
T O T U
332
493
498
1456
295
2745
2849
(,
57
RPD LOT ON PLAN
I on llS 284
4624 on PH 1328
4327 on PH 467
198 on BS 205
408 on OL 123
8 on BS 295
4566 on PH 2201
6 on RS 178
XAST ASSESSMENT
DATE
I 98')
1981
1992
1986
1968 lmpts notcd 1991
1987
1981
I'IXX
.
LESSEE
DR I l ~ ~ w t x h J
BG & EA Kitto
RI kll
DR Carlon
1F.PI.MF. SR Tezise
DR Carlon
Wujal Wujal Community Council
N a K Lullbnck
APPROX VALVE OF IHPROVEMENTS
Stntclumr S 52.7lK) Yards S IO.400 Fcncia~g S l4. lW Water S i h T a t . S 7,000 (itnpnrved pnsl) - TOTAL 5 84.200
Smclurer S 5.000 Yards S 4.500 Funsing S 19.000 Wnlor S 1 . m Tin~hur Treat. S 54.000 (impmvod past) - TOTAL S 83,500
Sl~ctures S Yards S Fencing S Waler S Timber Trenl. S (impmvcd past) - TOTAL S
Slruclues S 33.000 Yards S 10.800 Fencing S 26.600 Wntsr S 20.000 Timhcr Trent. S 38.600 (inipmved purl) - TOTAL . S129.000
Structure S 22.000 Yards S Fencing S 9,000 Wntcr S Timber Treat. S (impmved pa*) - TOTAL S 31.000
Slructuns S 47.900 Yards S 21.800 Fencing 5 42.800 Wntsr S 61500 Tinther Twat. S372.600 (iniproved part) - TOTAL $546.600
SWCWKS S lSJ00 Yards $20,000 Fencing S 28.400 Wntsr S 16.300 Tiniher Tent. S 19500 (inlpmvcd past) - TOTAL S 99.500
Stn~ctt,ms S34.500 gads ,, S Fo~wlnp ' S X.100 Walor S IO.O(X) Ti11t1tr.r Twnl. S 4.SlX) (~,,I~*"Ivc~ pa*!) - TOTAL S 57.100
VAL NO C W VAL 31/3/92
705 21 13
Sl?.000
705 2105
$26.500
705 2149
564.000
705 2120
SJ8.000
705 2168
SU$W
705 2122
S110.000
705 2109
S95.0
705 1659
f35.000


LIVING AREA THIS PROPERTY
3000-3500 head
3000-3500
3000=3500 hcnd
3000-3500 hoad
3WO.3500 head
3000-3500 head
3lW-3500 head
3000-3500 head
PH NAME AREA
18900 ha
Darnum
4144 ha
Cal~wIa
18100 ha
Bccrbike
2200 ha
18700 ha
45600 ha
sphsnb
56000 ha
MI hfulpnvs
30?(XXl ha
RUH NO
231 Filc Ref 6809
1413317 File Ref 7898
1414634 f i le R C ~
5372
1412713 f i le Ref 7574
234 File Ref 6319
U J File Ref 6147
I4R.12 File Ref 5662
341233 File Ref 5554
NO
97
98
99
I la,
101
lo:
l m
IN
PRESENT O OF LIVING AREA
10%
6%
24%
3%
25%
3856 L
67%
... . ..
336%
LAST ASSESSMENT
DATE
1'4x7
198%
1987
1993
1986
1986
,
1986 -
I V U ~ port 1989
TENURE
GIIPL
P.H.
P.H.
P.H.
GHPL
GHPL
P.H.
P.M.
STATION NAME
Alkuo~llia
Pan of Ookey
Pan of Oakcy
Beesbike
Pan of Kings Plains
Part of Kings Plains
S~rhy-rb
hlt Mulgrpvs
APPROX VALUE OF IMPROVDSNTS
Lmulawr S 13.800 Yadr S 5.800 Fcnci~ag S 8.000 Wnlcr S 3.000 Tin>lwr Treat. S (i~rpnnved pad) - TOTAL S 30.600
Slruetures S Yards S Fencing S 3.900 Water S 2.600 Tinlhur Treat. S (ialpmved past) - TOTAL S 6.500
Struelures S 2.000 Yards S 11.300 Fencing 126.900 Water S 14,200 Timbor Treat. S (improved part) - TCITAL S 54,400
i S~lvcturcr S Yards S Fencing 5 16.400 Water 5 6.000 Timber Treat. S (impmvcd part) - TOTAL ' 5 22.400
S~ructurcs 5 Yards S 16.300 Fencing S 47.300 Water S 16.400 Timber Treat. S 6.000 (improved past) - TOTAL S 86.000
Slruclurer 5 Yards S 24.700 Fencing S 22.800 Water S 6.600 WnBerTrenI. S On~pmved pasl) - TOTAL S 54.100
SlNClUP21 5 44.300 Yards S 18.400 Fencing S 43.800 Walcr S 18.700 TintherTre.1. S 53.500 (impwed pan) - TOTAL $178,700
~tructurcr S 144.500 Ydnls. '*. S168.000 Foneinp $129.000 Walcr $134,500 r T I . S (i#ttl>ntved ltaxt) - TI )TAL S576.MY)
VAL NO C W VAL 31/3/92
i05 1870
S47.000
705 21 15
$16.800
705 21 15
573.000
705 2106
SU.000
705 214511
548500
705 214511
556.000
705 2155
1102,000
705 2144
712 6774
I560.000
RPD LOT ON P W I
4623 on BS 285
3317 on PH 2213
634 on BS 286
2713 on PH 1003
2009 on BS 297
1980 on BS 296
212 on PH 1265
233 on PI1 1796
LESSEE
RS Hardy AE I10lt11r.s
CJ Manin
CJ Martin
G & V Meewn
DR & SV Brcmnnh.n,
DR & SV Bwsnnhon
D Bower & O n
LW Wenaway &
Ora
CAPACITY
POTENTIAL
TOTAL
29 1
166
724
96
748
I I40
2000
10067
LUSE
E
1-65
1-25
1-25
1-25
1-28
1-40
1-30
1-30
CRRRYING
c'rpm
TOTAL
291
166
724
88
619
1140
1867 .
lass7
RLre
I 4 5
1-25
1-25
1-23
1-25
1-40
1-28
1-30
- PRLSCNT
TOTAL
291
166
724
- 96
- 748
1140
2000
1 ~ x 7
1-25
'-I5
1-40
1-28
1.3.
1-30

NO
105
I06
107
108
109
110
Ill
112
- TENVRE
P.14.
S.L.
S.L.
P.H.
P.H.
S.L.
O.L.
P.H.
RUN NO
1415422 File R C ~
5827
14/51 181 File Ref 7468
15151679 File Ref 5845
14Ll113
1514646 File Ref ml
14144344 File Ref 6M)4
570 File Ref 7712
WN555 File R e f 7691
STATION NANE
P a i l 1
Kantm Wolen
Pan Maillland Downs
Maillond Downs
PH NlUlE AREA
Rlmerville
13600 hn
19700 ha
200 ha amble
Msitland Downs
70300 ha
Mcrunt Gihsun
3500 ha
19100 ha
9842 ha
Diggcrr Creek
6475 ha
Re0 LOT ON PLAN
2 011 CF 10
I on CF 14
3 on CF 16
113 on CF 16
4646 on PI1 1534
1 onCF9
570 on OL 059
4555 on PH 2083
LESSEE
AG Wilson
A & I! PeJcrren
G & I Ahlars
G & I Ahlen
K & 8 Robwn
Naiwbi Holdings PIL
N S i m ~
TM Firkc
LIVING AFlEA THIS PROPERW
3500-4000 head
3000-3500 head
3000-3500 hcod
3000-3500 hcnd
]OW-3500 heod
3 m 3 5 0 0 hcnd
3000-3500 head
3000-3500 head
wc
PATI
1-55
1-100
1-55
1-55
1-85
1-80
1-85
5
~ n r r
1-55
1-100
1-55
1-50
1-85
1-80 .
1-85
t,b,
1-85
PRESENT t OF LIVING AREA
70 I
7%
3 5
4 7 i
14%
8%
4%
. . _.
3%
CNU(YIkIG
c.mm
rorm
2473
197
91
1278
412
238
116
76
W A C X N
POTENTIAL
TOTAL
2475
197
91
1406
412
238
I16
76
U T ASSESSMENT
DATE
I984
1988
1985
1985
1978
1991
~w ' 1962
1981
. ..
nnrc
I -
1-100
1-53
1-50
1-15
1-80
- 5
1-85
Pv.Cscm
TOTAL
2573
197
91
1406
412
238
116
76
APPROX VALVE OF IMPROVEMENTS
Strucltwc.~ S 9.000 Yards S IO.000 Fcncitip S 47.000 Wnttr S 20.600 Tinher Treol. S 21.500 (improv~d p.51) - TOTAL 5108.100
Stwctures $Nil Yards S Fencing S Water S Timber Trent. S (improved past) - TOTAL S
S~ructures S Yards S Fencing S Water S 7.300 Tinibcr Treat. S (improved pan) - TOTAL S 7.300
Structures S 108.000 Ynrdr S 24.000 Fencing S 39,500 Water S 62.300 Timber Treat. S 70.000 (iniproved past) - TOTAL . $303,800
Structurer S 2.900 Yards f Fencing S Water S 6,000 Timber T n t . S (improved past) - TOTAL S 8,900
Structures S 57.400 Yndr S Fencing S Water S l0.000 Tinlber Twn. S (improved past) - TOTAL S 67.400
Structures f Nil Yadr S fencing 5 Water S Tinihrr Trent. S (impmved pad) - TOTAL S
Structums $Nil Yanb . 5 Fe~teiny. . ''. s Wator S Ti~ i t l~or Tmnl, S ( i t t~pn~v~'d pall) - TOTAL S
VAL NO C W VAL 3113f92
705 2147
$96,000
705 185815
712 6723
S4.W
705 2139
56.000
705 2139
712 6772
$58.000
705 2142
S21,OM)
705 2094
712 6731
$22,600
705 2174
712 4000
518,400
705 2118
707 4002
f 16.300

Appendix 5.1
* " ' M U L T I P L E R E G R E S S I O N * * * a
. . >lstt;isc D c i e t i c ? o f Missing Data
- ;quacion Nunher 1 Dependent V a r i a b l e . . CATNOS
- . - : c ' c ~ Nuniber- 1. :42';h06: En:er TIME
.. . >.-.-, . ;, -,ble - ( s ! E - r e r ? d cn S t e p Nurrher
1 . . Tl;"'z
I . : z l t ip le R . 2 5 1 3 5
K Square . 0 6 3 1 7 .L.tjusted R S a ~ c ? r e . 0 4 9 6 0
Standard Srror 1 3 7 5 . 7 2 7 0 3
. U a l y s i s of Vcr ience D F Sum of Sq-dares Mean Square - . ~ e c ~ r s s s i o n 1 6 8 0 6 4 0 6 . 8 5 1 2 4 8 8 0 6 4 0 6 . 8 5 1 2 4
Kesidua? 6 9 1 3 0 5 9 1 1 1 6 . 1 3 4 6 7 1 8 9 2 6 2 4 . 6 7 1 5 2
\ ' a r i aS? e E SE S Beta T S i g T
EX^ lock xxrrksr 1 All reques ted v a r i a b l e s e n t e r e d

. . \ . . ..L .= .-> lahie ( s ) E ~ t e r e d 02 SLep !.jdnSer
i . . TI:4E
L i z l y s i s cf V a r i a n c e r: z' -. S n z af S q u a r e s Mean S q u a r e
Reg:-essi~?r, 1 153.91255 153 .91255 R e s i d u a l f5 C 5 7 7 4 . 0 7 6 9 4 8 3 . 6 8 2 3 0
- - - - - - - - - - - - - - - - - - \ izr:-h:; L c - - ~ s in cht: Equaticn - - - - - - - - - - - -. - - - - - -
V a r i a b l e -, ,- . - SE ? Beta T S i o f
End Eiock Nuii-her 1 r e q u e s t e d v z r i a b l e s e n t e r e d .

F01; IIC/iSTlNG MODEI, F(?R CATNOS
:I pior of' illc dalii is sfloirn bcIo\\.:
tine index
Due to noticeable mend. seasonality and i~icreasing variance. a 102 function atas undertaken arid1 both non season31 differencing and seasonal differencing. Tlle resuldng plot beco~nes:
I Nonseasonal. D ifferencks I SeasonaL Differences


FORECASTS O F PRICE MODEI,
A plot trf tiic data is s i~o\ \~n belo\\!:
Origi11aL Series
time index , 4 ,
miere would appear to be seasorla1 uifluences. sligh~ mend and irlcreasing \.aria~lce. However, analysis of the trend coinponeilt ~ l i o \ \ ~ s t11at the uend is insignlficanr ( supported by regression analysis ) and that the seasonal influence is not strong enoegh to model. This was confumed by running a sequence of alternative models wilere trend and seasonal models all performed u*orse than simple exponential smcotliing models ( which assume no trend or seasonalit! ),
I-lence. we undertook only lops of the data 10 sellloire the i~lcreasine variance. L

i~,rii:lysiny :I rlnn seasonal ARIMA rriodcl, wc ricr-ivcd tllc f o l l o ~ i n g model:
c Estimate Stnd.er-ror - J ' - v ; L I u c P-value AT<( i j .99929 .I 153s 5.66100 .OOOOO AR ( 2j -.?7564 .I I727 -3.2051(; .00207 MEAS 4.52565 .02 142 2 '1 1.24545 .OOOOO CONSTANT 1.7032 1
. . . . . . . . . . . . . . . . . . . . . . . . . . . . . . . . . . . . . . . . . . . . . . . . . . . . . . . . . . . . . . . . . . . . . . . . . . . . . . . .
!3tlrnated v/hrte noise variance = 4.66728E-3 with G8 de, grees of f r e e d ~ . ~ Estimated white noise standard deviation (std err) = 0.0683 175 Chi-square test statistic on first 20 residual autocorrelations = 13.235
with probability of a larger value given whire noise = 0.7203 17 Backforecasting: yes Number of iterations performed: 2 :-
Final model is simply ( 2 0 0 ) ( 0 0 0 ) I2
I t is interesting to note that forecasts, using this model, remain constant after period 24 i.e. after 2 years. Forecasts for Iiext 24 periods are :
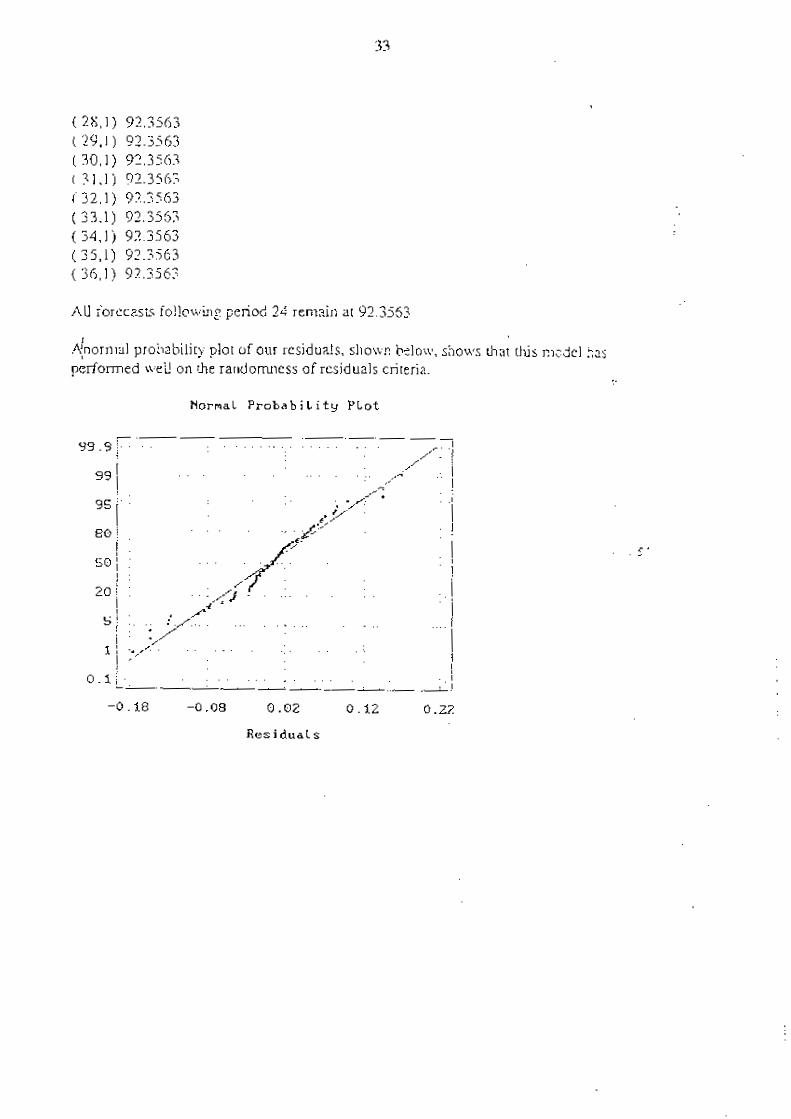
All forecass fo!lo\i;ing period 24 remain at 92.3553
I +normal probability plot of our residuals, shown bcloiv. sllonls that this model t o s performed wel! on the randomness of residuals criteria.
NormaL ProbabiLity PLot
Res i dua L s

Appendix 6.1
CATTLE PROPERTY CASE STUDIES
In an attempt to portray an understanding of the managerial, financial, physical and attitudinal aspects of cattle production on Cape York Peninsula cattle properties, three properties are selected for detailed study. These properties are private, fanlily owned and operated' properties. Their cooperation is appreciated and anonymity must be respected.
Case Study A
Family property - children past school age. Neighbouring National Park and other unused land. Area: 126,609 Rainfall: 1050 mm annually. Distance to Mareeba Sale Yards: 364 km
Estimated Herd Profile:
Class Number LossIDeath % Number Lost Branding Rate
Calves~Weaners Heifers 1 yr Heifers 2 yrs Cows 3-10 yrs Steers 1 yr Steers 2 yrs Bullocks 3 yrs Bullocks 4 yrs Bullocks 5 yrs Herd Bulls
Total 3,326 352
Annual loss/death as percentage of herd Current stocking rate 38 ka/beast.

Sales (Annual):
Class Number Price (Nett after selling costs) Gross
Cows 63 $162/head Steers 2 yrs 207 $204/head Bullocks 3 yrs 58 $3 1 Okead Bullocks 4 yrs 10 $4 1 7kead Bullocks 5 yrs 9 $524/head Herd Bulls 2 $400kead
Total 349 $80,100
Purchases - 10 bulls, $600/head Sales less purchases
Operating Costs: ,-.
(a) variable' Costs per beast
This includes supplements, inoculations, growth promotants etc. Weaners $2.60 Other cattle $1.40
Total herd variable costs $ 4.983
(b) Fixed Costs . A. ,. ,
Horse feed etc $5,400 GasIAvgas $2,500 Mustering Contracts $9,650 Water $ 477 Protective Clothing $ 650 Royalties $1,910 Poisons $ 110 Donations $ 120 Subscriptions $ 96 Workers Compensation$ 572
Fuel & Lubes $ 9,880 Wages $ 3,200 Insurance $ 1,360 Qld. Transport $ 1,443 Repairs & Maintenance $ 5,120 Saddlery $ 935 Accountancy $ 825 Rates & Rents $ 4,800 Telephone $ 1,164 Bank Charges $ 250 Sundries $1 1.729
Total $62,306 Total Annual Operating Costs$67.289
Funds available for living, debt service, property development etc $1 1,794 Marketing costs at Mareeba sale yard per steer (300 kg)
$25/hd ... Contract cartage
Yard fees, commission etc $25/hd Total $5O/hd

Discussion: -
The scenario outlined in this management system has attributes which, to varying degrees, are representative of most of the older surviving family properties in Cape York Peninsula.
This is survival rather than productior! management. In most years the operating costs are '
kept equal to the income by, if necessary, reducing the operating costs.
Off-property income, eg. contract fencing, cattle cartage, sleeper cutting etc, is used to maintain a basic living standard.
Cattle are often missed during muster. This leads to a few aged male cattle and 'clean skills' .
being turned OR
Property development, housing improvement, new vehicles etc are only undertaken when cattle prices and gross returns are favourable.
In years of low cattle prices, cattle are withheld from market.
Cattle husbandry costs are reduced by neighbouring families working together
Stocking rates are low, 1 head138 ha.
Efficiency of turn-off is low at 10.6% of total herd. , + - '
<
The system is financially secure provided there is little regular financial commitment such as loan repayment.
Environmentally, this is a very sensitive system. The low stocking rate and land management through burning is responsible for the lack of land degradation in Cape York Peninsula.
This management system provides a self-sufficient lifestyle which contributes to the wider community through cattle turn-off, operating costs and fiee land management.
The system cannot be maintained. There is insufficient fbnds to provide for the retirement of older family members or to allow one sibling to purchase another's share in the property.
Case Study B
Family owned and run property. School aged children. Property - neighbours, National Parks and other unused land. Property is in early stages of complementing a phosphorus supplementation program. Area of lease: 26,842 ha Rainfall: 1,100 rnrn per annum. Distance to Mareeba sale yards 502 km. Distance to Weipa: 255 km.

Estimated Herd Profile:
Class Number DeathlLoss Rate
Weaners Heifers 1 yr Heifers 2 yrs Cows 3-6 yrs Cows 7-8 yrs Cows 9+ yrs Spayed Cows Steers 1 yr Steers 2 yrs Bullocks 3 yrs Bullocks 4 yrs Bullocks 5 yrs Bulls Total
Annual deatMoss as percentage of herd 7.9% Current stocking rate 8.18 halbeast
Sales (Annual)
Class Number Price
Cows 10 yrs Cows 1 I+ yrs Spayed Cows Bullocks 3 yrs Bullocks 4 yrs Bullocks 5 yrs Herd Bulls
Purchases: 5 bulls @ $2,00O/hd Sales less purchases
Operating Costs
Number Lost Branding Rate
Gross
(a) Variable costs per head Herd average $8.92
Total variable costs $26.055

(b) Fixed Costs
Fuel $ 7,000 Wages $15,000 Insurance $ 2,000 Repairs & Maintenance $ 2,000
RatesIRent $ 5,000 Compensation $ 500 Accounting $ 1,200 Education $20,000
Total fixed costs $56.280 Total operating costs $82.335
Funds available for living, debt services etc ...... $5,000
Discussion:
Compared to Case Study A, the selling prices for stock are much lower. This is a reflection of the increased distance fiom markets, price fluctuations at Mareeba sale yards, and the unreliable road access restricting the selling periods.
The production benefits from the supplementation program are not yet apparent in the herd. The turn-off, 11% of herd, is very low.
The ability of this property to continue its phosphorus supplementation program is dependent upon an improved cash flow.
The straying of cattle onto unmustered neighbouring land and lease insecurity through the Lack of agreement of the impending lease renewal, place extra pressures on this property.
' -
The carrying rate at 8 habeast is too high for this class of country. Part of the herd must be grazing on unfenced neighbouring lands.
This situation is not regarded as exceptional on Cape York Peninsula. Historically, the grazing community has placed more importance on a producer's ability and commitment to manage his cattle rather than containing them inside unfenced boundaries. This attitude or custom has been necessary for individual independence and the survival of the industry. .
The acquisition of land for non-grazing interests is in conflict uiith this custom. The producing properties which are disadvantaged by this changed attitude to land use or land ownership sequence compensation through boundary changes which include additional land in the grazing lease.
Sensitivity to Potential Market Options
The market options for the property used in Case Study B would change with'an improvement of the access road to southern abattoirs or the development of a live cattle export market through Weipa.
The sale prices fiom Case Study A are used to represent an improvement in road access.
The live export market is represented by the sale of 2 yr steers for $335/head.

Using BCOWSPAY - Steady State Herd Model (W. Holmes), the gross margins and return per beast (adult equivalent) are compared.
Sale Price Comparisons:
Case Study B Case Study A Export (Weipa) *;
Age (male) 2 yrs 5yrs 2yrs 5 yrs 2 yrs
Sale Price $ 150 $ 345 $ 204 $ 510 $ 335 Gross Margin $21,584 $49,864 $37,802 $85,464 $69,000 $/beast (AE) $ 7.01 $ 12.27 $ 11.23 $ 27.75 $ 22.40
I
Discussion: ,-.
With the current situation the development of an export market at Weipa gives this property a considerably increased income.
If the road to the southern markets were upgraded to the stage where market options were improved, the financial advantage could be in favour of marketing older cattle to southern markets.
The advantage to marketing older cattle is relatively common to breeding properties in n w h Australia with low branding rates and high mortality rates.
..
Potential for Improved Carrying Capacity
The agricultural land suitability mapping and classification undertaken for CYPLUS by the Queensland Department of Primary Industries provides a base for estimating a potential carrying capacity for Cape York Peninsula. Because of the scale of mapping there are limitations in accuracy when this is applied to individual properties.
In this estimation the pasture suitability classes are included'at their most productive pasture class. The stocking rates from each class are taken from the Queensland Department of Primary Industries publication 'Sown Pastures for the Seasonally Dry Tropics'.
Case Study A
Carrying Capacity Potential Land Suitability Area (ha) Stocking Rate (hahd) Stock Number
Low Input Sown Pasture used in higher class Medium Input Sown Pasture 4,500 3 High Input Sown Pasture 23,791 2 Native Pasture 98,2 17 3 8
Total

Discussion:
This property is currently carrying about 3,000 head. Therefore there is a potential for a five fold increase in stocking rate.
Because of the low soil phosphorus level, large areas of this property are down graded to native pasture only class. In a different economic climate this classification could change.
This data clearly demonstrates that a relatively small amount of improved pasture can have a vast impact on production.


Appendix 6.2 41 y~<sp,..vf Z-s-4 4 q ~ . / j;&,&,,., -. ,' JPI.;: kc. ;- j ~ ~ h y . ; ~ - st,eaav stare +I.$? kpk1 - ' J ? ~ . s ~ ~ . Y I !. illj hams: iiac~l:er-,.&cowltanr,i.A.-r.tclti worl..shh:~ 2 1 Pate: I;Q~~I : s j by i(.E.tioiw;. C1.f. I . T~wisville, Qld. IXM I : ~EI::I~JN 4: CALVIN6 AND DEATH RATE ASSIMFTIONS _____-_-_---__----------------------------------------------------------------------------------------------------------------
..... Cattle age start, year C31v.2.; 1 2 3 4 5 b e -7 9 i ? Lattie a.;e er>j year' ....... 1 2 3 4 5 6 3 -7 7 U 10 !! _ L _ - _ _ _ _ _ _ - _ _ - - - _ - - - - - - - - - - - - - - - - - - - - - - - - - - - - - - - - - - - - - - - - - - - - - - - - - - - - - - - - - - - - - - - - - - - - - - - - - - - - - - - - - - - - - - - - - - - - - - - - - - - - - - - - - - - - -
Br.at:j; r13 rake ............. na 0 4 5 . 45. I!:( 45. II:C 45. OK 45.~1:i 45. O X 45.0X 45.3:{. 45. 0:; . , ......... F--lea:e~J?3z1~rati3 7.0X 5 . 1 15.0:( i . 15.UX 19.0:,' 15.0:i 5 , 15.0:i j5.Q:: l:.]:.~ Xale death rats ........... 7. 1 5.5:i 5 . 5 5.5:: 5.5:: 5.SX ?b3 s t ~ t r i s s ;i ic.ried for b~;j !,I,:$. .;vel- t; j - r 5
N.>t;, 2: Peathi c a l v e ~ +,o 1 yr 31-2 deaths from brit-r:im t o age 1 year. 2r-alxdj~g 2 b) :3 yr; i i t;ral>jilw from 2 yr oid mzting e k .
5EI:TIBI B: SALE PRICES . . . . . . . . . . . . . . . . . . . . . . . . . . . . . . . . . . . . . . . . . . . . . . . . . . . . . . . . . . . . . . . . . . . . . . . . . . . . . . . . . . . . . . . . . . . . . . . . . . . . . . . . . . . . . . . . . . . . . . . . . . . . . .
1 ,, 7 v 4 5 t S ;:-,-,t,ie ass at 5 3 1 ~ i>!ys . - I I.' . . . .
---------------------------------------------------------------------------------------:------------------:-------------------
j+ifers!c;x; . , . , . 5.75 $ 1 5 $31) 9.X5 $3;>5 $:jI).S $305 $135 $:>I]. $:XI) $27.: .$.:&:>
S~eer;/bu!loiks . . 475 C50 $311) $450 $490 4510 5550 ?&I entries ailoied ii..l-.-bui iock:s evel- t yl-:
___________________----------------------------------------------------------------------------------------------------------- idote I-?: Ft!1 price; are to t;e r ~ t o f selling & freight ~ ~ s t ; .
-7 - . btl,TiON C: F E E STRETIE One year c;!d heifer.; to be r e t a i n 4 ......... 20? itSnter 297.01 A92 a t f i r s t joinirw (1 ot- 2 yrsi ........... 2 to sive required Cci; cuiling age (ir:teger ~x:iy, rnax 11 year51 1 1 nuz5er of AEs j i '~auir+j lierd size { & h i t Eq;ilivalmt;) ...... 2275 _____--______-_----------------------------------------------------------------------------------------------------.---------.
................. . C;GW a* ;txt year i 2 :-'ow 39? end year- ................... .? 3 . . . . . . . . . . . . . . . . . . . . . . . . . . . . . . . . . . . . . . . . . . . . . . . . . . . . . . . .
c.o.rij;t>e;fet-s E M ~ ]able ~ t 2 r - t year . . ;!I? . . .
1'37 ,.--* ... ,-wclt)ll;_i 5a!,?i ::' ;t;r-t ~ 4 2 1 . C~IIH; Q,I?~):;
::-HZ ioid s t x t ~e21- ............... - 12
...... :Izcis joirxd :I> each 2 . 3 ?r.y.ii. . . 19: tki;.es br-all,&.j fl-ca 3:-.;:a . . , . , 0 00 v,,
..... ,iL,;ws wid heif2r-,- sold 1? Cow s;Ies/total szie; $i;i.pi!j; heifers ~:ulie,j i yj- 2 .... Heifer- l ~ i i i i t ~ s ? 1;jj.i;; and he; fgr.; $3k+d .... 11)gfl I;il,<e:/c;ws g;_L,& ,::C , hi, ie; br-a%3+j ............ 450 Lai;ls_-,/cam; sut-v:;.:nq Bre*det- death.; ............ 152 E r e ~ i ~ r - deat!~i :i .... ---------------------------------------------------------------- fk,t2 4: ~f k - ' - ,!=~:er- c.--:iiir:? I-;',? is nsa t ive , opticnai sale-,
lu;t $+ !-84~:aj, or ow casting a.?e :ncreas+j.

~~~E~:cI;I)W - Stea6y State Herd fi42! - Vet.;i01\ 1. 1111 Naiw: 6anker5.A:~:~ur>t,ant,s, &erlt5 ~ ~ r k ~ i - w LL Date:
~;:Il)tI D: STm MU1 BULLIXI: HERD S T W T I H A
-z=r ........ %,axirnua bullock turmff age 6 _____----------_--------------------------------------------------------------------------
............... St?j_r or- bul lock: 3 y 1 2 4 5 t ?
_ _ _ L _ _ - - _ - - - - - _ _ _ - _ - - - - - - - - - - - - - - - - - - - - - - - - - - - - - - - - - - - - - - - - - - - - - - - - - - - - - - - - - - - - - - - - - - - - - - -
:byi&r avai Iabls at, s t a r t ~"231- ..... !ili%sr t -es~rved a; b;! Is ........... - . z;:.jc~al sa!es :< ................... T:-z:?;fe~-s t o b ~ l ! herd ............. . . .. ..-- I=.== at, each age ..........,....... ------------------------------------ .Iciz: steer-, ,I-,j bul L~i.ks ;old ..... 181 Average ~ ~ - i r e = N.Ci4.31j <-:!:Ti%! E: E ! ! f i E Q l j i m N T S . . . . . . . . ~;.:,L;..H r a t l o ..................... 5.1!!% P J J ~ ! ~ rey~ i r -ed = 5 !j ?;>;,i:; ?ij l-&aiej/yr. :< ;;f t o ta l b12ll.i 22.511:i i i $ p r i c e $131113 _.:.;-. .,.. b,.i:- ]i.--t . . ...u .. a-, /yl-. % ::f total t?u!ls 0. X i 11 $ y a ! l ~ s 531G z2., : ! = ... %>ldiyc-. (ra!lr:ilated) ................. 10 $ p r i c e $550 . . . -.., , ....A; 5eatii; ........................ 2.01)X I
..... &era* value per {=ad o f bu l l s XI hatlij $542 ........... !kt b u l l r-wlammslt c o s t itokll $$9R !kt &ll r-wl3cswt ~05t; E r 2:alf Sranjed . . $19.3:
.$:.TI:X f: TOT& CliTKE AN9 RBJLT E~IVALEWS ------------------_----------------------------------------------------
N~;~tier AE/ha;t TOT$ RE Carr ied ( k k i f y ) f IN m>F
. . . . . . . . . . . . . . . . . . . . . . . . . . . . . . . . . . . . . . . . . . . . . . . . . . . . . . . . . . . . . . . . . . . . . . . - . . . . a i v ~ c.);l-r-, a: ;tart, :;ear- 450 0.50 3 . 5 . - -,;. . -.-- .-.,=, = aged i a t s t a r t yr 2 7 l. l10 3) 7 . . - -;_::er-s a& 2 at, s t a r t yl- , .-<?
I % / 1.3 24.5 ...... :..y45 z??d 3 y rs p i l l s 'J.. c,~.Y J I . 25 1 (!!j4
:ts;?-s . . - - . .\;jj - - - i at; 5t,al-t, yi-1- 2119 1.03 2!>4 * . ...- ,.=-;, = 3pe;j 2 a t s+sr t year- 174 1,!j0 - . . , .-
i 7 4 ;.;::.:.I;:; a%.; -. a t ~ta1.t yl- 66 1. !lo . . Gt . . ,,. ..,:..-..- ,.-- t:s 2q.z 4 ;t zt;-l-t YI- 44 I. Ol) - . . 14
:;i ,.1..:;:5 .-.qe,j 5 a t ;t,il-f. y:- 23 1.06 > .
29 .,, . - '.r:.: ..................... 50 1.50 7- : .; -----------------------------------------------------------------------

$/Pzrd Oika;k $ ; f i . c C a p l b l Value of &I-d (ex s a 1 ~ 1 Z Tot,;
. - - ?k t .~lt.+,!+ sai+-, .......... 194219 $42.29 .t.- ;A Vailx of females a d calves ........ -?-- &2>J
...... t i r . tc t r 0 5 t i s x c l . b u l ! ~ .. 115669 57.03 ) ) ::- Value o f -;tee!-5 a d b u l l ~ k s ....... $17112; $4. I t : ... J i I I 1 : . & b a t . . IF31 7 :,! ~9 Valw of b u l l s 2 years and ol&!- $4:1!+
_____-_ - -_________- - - - - - - - - - - - - - - - - - - - - - - - - - - - - - - - - - - - - - - - - - - - - - - - - - - - - - _-_-_-___--__-__-_-- - - - - - - - - - - - - - - - - - - - - - - - - - ....... ..... ...................... S 1 . 0 7 .:;:;I: , .;? Catt ie ko; ; %+r<in M3233 T o b l ;.. W7i7.3
::act,:;. !;H af',+r int.ere;t . . $ : > Y ~ I ) $17.i1) 317.22 Intel-z;t cm i>s!-l: ~ a p i ta! i! 5 . 2 3 .1301j:: _____-____-_-______-- - - - - - - - - - - - - - - - - - - - - - - - - - - - - - - - - - - - - - - - - - - - - - - - - - - - - - - - - - - - - m e - - - - - - - - - - - - - - - - - - - - - L-----------_
fbi7l Run fix> Run Run Rul RUI Tur-rmf F Turrp~f f Trlrraf f T~ir~tJf f ilirtwff Ti~rnoff k : t G M
?? .,-.70 !ct,ai a d ~ i t sq:;ival%t-, ............ ~ ~ 7 8 2 7 8 227E 2238 2278 2238 i~,,
31 1 T,jt,ai ,--tti+ ,-a:l-i+~j ............... ,L~.J 2 2 0 2 2 5 2226 2227 2 2 8 -73 ...... Ill:* year' o id i-2; fsr; retained ZEr? 240 220 214 Lllj 2117 2'1) ....... Totai c+wi at+; i-eiis_r= mated 1'296 1159 10M 1 3 1 0 . 1001) 1052
Total calve3 b ~ - a n & + j ............... x3 5521 479 465 456 45 0 473 . C3ivss/row; :l ................ 45.60:I 4 . 0 1 45. OK! 45.011:i 45.00% -'45.1103 4.00:< 8 .: ai.4e,. :-., .. LL+~; ;urviving :( ............ 5?. l15:C 53.051 53.05X 53. 115:i; 5-3. 051 .53,05:C 5:3.115i:
........... Overaii & a t k X 7 15.17i 15.17:i l5.17Y 15.1X 15.17:C 15.1X ,-.
. F.- lmalasal .z / total s l ez : i ......... 15.4iX 1 9 . Z i 20.0G 211.28% 21J,.59;1 20.73X L"lJ,13:( ........ io ta ; c o s a1-d \.r2ifer-s sold 6 1 .55 50 49 48 47 50
Maxir;.tm cow o~i 1 i r ~ age ............ 11 11 11 11 11 11 11 ................. - 2 2 2 2 H~ifec- joining a= 2 Z
211ey1-o idhe i f e r i a1e ; a f i j ; payX. 1.11SX 1.0.5'X 0 1.05% 1.05% 1 . 0 Z G.OO:C Trio yt- o ld heifer s a l e i a d spay X . 0 1 0.001 0.00:( O.lll)% O.OO:( 0.011:( O.0O:C Tokai . i ts+r; atid Suilorsf:5 ;old ..... 27 1 22'29 20 0 191 1 ?4 181 197
........ fri>.:ti;o~in 01~1 leek t u t - m ~ i i age i 2 3 4 5 6 3 - Average female ~ r i r i l ............... $256.03 $255.03 4256.03 $2.%. 113 11:3 42.X. 113 $26.2.39
........ Averay? .iteer-/kwi!ock .price 530.011 $210.00 $432.35 Sli45.47 W 9 . 4 0 $454.90 $4.5!1.1)0 .............. . . Sapi tal va!!re of k r ; j 5.525624 $530293 9544.593 $.55892!1 $567699 $577119 $546.364
Elet cattls_ 31% ................... SEW9 S.51125 $P345E 9.371379 1951411 . 53.1219 S!11147:3 ....... P i r a ~ t , rc3ks exri l>j im bui!s $is844 $ 1 515707 115G39 f.!.%77 f :EJAS f 157ijl;
5.1i 1 r + l a r e m t , a td Iwzbardr-y ..... $12!1>:1 5 107% $591.': $91522 8 4 : X 59317 $9795 . . iit-os; gar-iiin for herd .............. 95.5574 5.%46? 47:3272 $72068 170022 $69253 $75974 hr- oj, -- r+sr-gin per- a d ~ l t eq~ivalenf, . . S4.40 m . 6 7 $3-2.41 f3L.M $:30.74 9:!0.39 $ : :2 ,3 !inputeJ ink:-*st on &I-,j rapit;! :( . 5.21)X 5. I 5.213; 5 . 3 % 5,2!:!:1: 5.3% 5,2i]%
....... 6#/& izphsj inter-%\ $!Z.tI) .$13.% 813.98 $is.% 417.74 5 i 7 . Z 29.s

flats: :omli+~ by #.E.tb2iw3. C1.F. i. Tomis-ille, Bld. KHc: ..-.- .
jEZT:OFI A: 13XVIffi AEiG CEATH RATE AS!3&PTIfJNS . . . . . . . . . . . . . . . . . . . . . . . . . . . . . . . . . . . . . . . . . . . . . . . . . . . . . . . . . . . . . . . . . . . . . . . . . . . . . . . . . . . . . . . . . . . . . . . . . . . . . . . . . . . . . . . . . . . . . . . . . . - - - ..+ l . 1 :J . . . , , - age stat-t year ..... 1:alves - 3 4 5 r', I G 7
- L C '
9 14 : ....... .< *, ,;, 39e end year 1 .? 3 4 5 6 7 c: 3 10 -. t :
::a'ir**?1::9 rat,;, ............. na I. 1 6.5. I)X F,S,f):! 6.5. OX 5 . 6%. 0 65. I):< 5 . 0 65.0:~ 65. .;;: a a r . , . 3.5:; 3 . 5 0 >:.OX $.OX E.0X S.OX b.l>X 8.0X 0 : 8. .;:. 4 - :a ........... , , ; -deathrate 3.5X .?.5:i 3.5); 3..5:( 3.X 3.5X ~ & ~ b , a ~ % r i ~ i a ' l l ~ w d i o r b u l l ~ c k i ~ ~ v ~ r [ . y , - ~ ___________________---------------------------------------------------------------------------------------------------------- ::of,;_ 2: Cegth; ~ ; l . i s i to 1 yr- are 323t115 from branding to age ! year
Et-at~dir-g 2 t,.) 3 yrs is bratding from 2 yr old w%illq etc. r r r r n h t c A , ) # 2. . SALE ??ICES
-ii :-,...al? a* at ii-!e Ca1'ie.s 1 2 .I 4 5 L 7 F. 9 1 :? 1 : ' A
.,- . c - --/ 3 1 1 2 I.w- 2 ..... $75 SlE.5 5245 9305 6320 $320 $LEO $321) 9x11 $320 $L- $xc - . A : . . $75 5270 2Z5t) $560 f.530 9.540 2.590 I\b; s,t,rie; a i l ~ x e j f ~ r . b ~ l l ~ : k i owr i yc:
,-. ._----------------_-----------------------------------------------------------------------------------------------------------
!:.;t? 3: All prices ;I-. to be net, of iellins atd freight cost,;, :,',-T 7 _%., ILN C: Fw E R G STKIP:TIffiE ;!is ;.eat- old heifers tu be retaitmj ......... 2% (G~ter 2S.45 :;.e at, f i rs t loininq ( 1 or 3 yri) ..,........ 2 t~ give required 1r.w culiin.: age (ir,te.?er oniy, max 11 year;) 11 rwmber of .Xs) 1 ;iiuired herd size (Adrrlt Equivalentsj ...... >?X j 1 - -_------------_--_----------------------------------------------------------------------------------------------------------- I
1 J - ........ ........ J 4 5 9 ,I 2 9 :.xi a* s2:art ye;r , f i i: I .I
2 ................... 3 4 6 3 9 10 5 :,:w ags a>d j;s_ar 8 ! i --------------------------------------------------------------------------------------------------------------*-------------- _. . - I
229 cz -.- - ., :.:a,'hei fet-5 avai i&ls ;C,art ysar . . 259 249 87 $0 7 4 62 57 .--. ... btiot;al sales X stat-% ysar cws IM O.OOK 8 Il.OO:i : C 0,00:( 0.01!:( 0.Ot)X 11.~10X iI.OE
............... 11 11 1 ::5 11 0 1). 11 ;:I > \ 1.745 soiii i t a r t yeat- I! I - 1 - -,-.ws - joined in each 3 9 5 t - c ~ ~ ...... 0 249 95 Z7 80 I* 6 ,. a: . 52 .y .---. c 3
..... I;lvs_s bratided frr.;z 4r.2::.p 0 1 6.5 6 1 57 !j? $4 44 40 57 .,, - . ...: .; , 1 ------------------------------------------------------------------------------------------------------------------------------
- . .? :..an= at>! heifer; ;:>Id , .... 184 CIM . i a l e~ / t ,~ t a l ~21.15 43.80:i fg,ai? pi-ir.t $38. 1 I
.... 0 : . . 4 , - p l ~ f i heifers 83;; led 1 ?r i f i t g X . 0.07% i s he 1 r z . , . . Q.5
I Ca!ves/c~x; ~lat ,d X . G5.l!O% I
3 ;_ :ve; bt-;i~:&jtd ............ 53; C a l v e s i i ~ ~ sarvivicq 70.f3L ?i-=ber deat11s ........... , G6 Et-.zejer h t h i K ..., 8.30):
i ------------------------------------------------------------------------ I 1
4: if I;e;f?r culiin? r;te :; neyative, ~~t i ;z ;a l sale; "., ,.- 4. I.,= )-;,4, ,,->,4 1
~ M V J Z . , L - - 2 A - - J 1 31- CI:~ 53-:ti1lJ i4e itIrreas+j,

SECTItYl li: STEER C\NE WLKK HERli STfiIXllRE %ax ;.;;;a bu! lark. turnoff age ........ 6 . . . . . . . . . . . . . . . . . . . . . . . . . . . . . . . . . . . . . . . . . . . . . . . . . .
!.te+r i r bullock age ............... I
Naw: G a n k s t - ; , A:c*jlnlta~lt 3, A w I ~ . 5 ~ * ) ~ . k i l > ; ~ 3 Date:
. . . . . . . . . . . . . . . . . . . . . . . . . . . . . . . . . . . . . . . . . . . . . . . . . . . . . . . . . . . . . . . . . . . . . . . . . . . . . . . . . . . . . . . . . . ..... ::.z&+!. aval lable a t ;tart veal- 259 2511 212 $2 55 3 7
b b --L. - . A ~ U ~ I . ! -+ i+t - .<$j 5; bi~ll ; ........... 1) 1)
......... !::ct;~;t:iliai+~:i ................... ? Gl>.l)iJX 3!l.:1C:l .~I].I)I):( IM
7!.3!~if+;; t~ 5111 1 ~ l . d ............. 112 0 -.5.;!e-; a t ear11 age .................. 111 :! 11 127 25 17 ? 7 . . . . . . . . . . . . . . . . . . . . . . . . . . . . . . . . . . . . . . . . . . . . . . . . . . . . . . . . . . . . . . . . . . . . . . . . . . . . . . . . . . . . . . . . . .
*'Ti I l , . d l - ;tee~-; at~~: buil~ck:; ioid ..... 236 &era% ~ ~ - i c e = 1502.54
-X!:T!*i E: E6,KL FLFC!JJIKMENTS - . . ;:I.;, ;;.~.m raklil ..................... 5.130:i E ' J - J ~ ~ Z r e q ~ i r & = 11 5;: :: ~.;jr,-i:a;eij,'yr-. X of tot21 b1~1l.j 72..5t3:< 3 @ ~ r i r e $1300 BY,:! ,,,,, kg ,! 1 - keptlyr. X of total bulls 0.01):C 0 @ v a ! ~ ~ ,+:3.51)
................. 242; is -,oldlyr. (call:ulaf~j) 8 Q price 4.559 Bi 1 1 deaths ........................ 2 , ill):( 1
..... Avaraw valrs p r I~zad of bulls ~rn h a d $942 Net bull replaceamt cost ( total l ........... $7411 Ekt bull r w l a ~ w n t cozt per calf brand4 . . $i:3,C3
5E1:i'ilIN F: TOTAL CATTLE AND AUJLT EIJJJIVALS4TS _____-------------------------------------------------------------------
NJ&-~ AEiBeast TlITAC AE Cart- i e j !Sxci P j ) FPi? &?a-F
-----------_------------------------------------------------------------ !:a!ves &>I-I: at, s t a r t p a r ZY, 0.53 2F,; He; i+;-s 3@ 1 a t ;tart yl- .-co L.E, :.Ell qcp Ld,
Hs;f+r: aYyd 2 a t ;kat-t, y;- 24 9 < L . .-sc L., 312 ....... ::oK~ 3-l 3 v1-5 ~11.45 575 . 1-25 . 7!9
SLsel-i aged 1 a t ;tart, year 255 i.120 5 9 .Steer.; awj 2 a t s t a r t year 2 0 !.00 .>:n --. RjJi ; . - t . - ~ ~ ~ - r . a a w l 3 at, tart yr p.5 i . l)l) $5 2~.:l!ock.; aged 4 a t .itat+, yr 57 ! . 0 11 57 B~l!ari;.s a y d 5 at, skt-t yr 39 1. 00 39 EIJ!!.~ ..................... 41 !. 50 62 ------------------------------------------------------------------------ 7 - L _ I zc~ce, %&I- il'+j X ....... 2213 2 7 8 ------------------------------------------------------------------------ .- :.El_ - ~ r i ) ~ ! ,,,4 r G : CATTLE ENTERFRIFE COSTS ------------------------------------------------------------------------------------------------------------------------------ . - - & L ! . ...--,Z,JLY Inc~barjt-y c ; ~ k . i fer head $/&a~xr f / k i f e r Or ,:ow a-f: f / S t - ~ - or jlll l ~ c k a w j : $is;! i , - . , ..=GF!!+> aat s t ~ i - t of year) to 1 ?:.a I-.?-- L j t 3 ~- :2~ , - ; :>jl-5 + 1-9 ~ j l t .- II 2-.!;lrs :!-4yrs 4-Firs S*y-s+ , . , . . c
--------------------------------------------------------------------------------------------------------------:--------------- - - . - ........... i1i~,i'.rst>:f:.'<accil.p_ek $L . fQ $ 3 ' 5 1 . X $1.35 5t.3.'; 5 . 5 1 . 5 ~ i . 3 5 $1,:; $;..z? - . , . +::a:aer. licks, i~$plm&; eb: ..... $17.92 f.il2.92 $1.3.67 $:?.!I? 9.10.x .$11;.v 411?,92 j:!j,?2 $;1:!.52 $15 .07
her- .............................. 51). ijl:l $ 1 . ! I ) ! . i .$ $ij.iji> $I!.$$ J!),$I) .$$.$I; $a , ij;? 5Cs ::!j ----------------------------------------------------------------------------------------------------------------------:-------
;.:r.;_! 5l;b;r>j:-.j co;k/grc~.p ......... f:~]..:; j12,:7 $1.5. I!: $18,:; $12.27 $ 1 ; 5 ~ 2 . 2 3 $12.27 $12.27 xi,: i'? .r .... .L

fat?: .;€STION H: CALCULATION W IjfiCG MSlNS
- ~ ~ _ _ ~ ~ ~ ~ _ _ ~ ~ ~ ~ - - ~ - - - - - - - - - ~ ~ ~ ~ ~ ~ ~ ~ ~ ~ ~ ~ ~ ~ ~ ~ \cDo L u k --
SI'&r d P' % / k a i t $ ; G , E . Capital Val12 o i &I-J (ex i a l j s ) S Tob; _ _ _ _ _ _ _ _ _ _ _ _ _ _ _ _ _ _ _ - - - - - - - - - - - - - - - - - - - - - - - - - - - - - - - - - - - - - - - - - - - - - - - - - - - - - - - - -_--__-_-------- - - - - - - - - - - - - - - - - - - - - - - - - --
.......... \Is? c a t t l s ia1.i 9173141 S74.G fX.01 Vallp2 of fsmals; and calve-, ........ $335433 >ir-e<t ~ ~ i t , i ?:tcl. b ~ l l 5 . . S'?&485' 115.73 f i5 ,02 V311.e ~f ik??f5 31); b~l1@1ki C2411]?1 ....... 3ii ! I-ec!rt. 4 bsllibafijr-:i . . s171 53.52 5;. .53 Value of b ~ l l ; i year; al?d o i~kt - ... $:33357
....... . : i t t ie 6r-oi; k r q i n f lX4El 5 5 . 4 0 $5;,. 10 Total ............................ .:. rsls;! .,sit is r3M a f t e r Inter~. .s t . . I?64F,1 $41. C.0 $42.35 11;t;ere;t or, herd i a ~ : t a ! I S21301) ______-- - - - -_______-- - - - - - - - - - - - - - - - - - - - - - - - - - - - - - - - - - - - - - - - - - - - - - - - - - - - --____---------------------------------------
Ftun R J ~ iilm Eun RU-I Rim Run T?lrnoff T u r n ~ f f T!u-nof i Tur-l;of: TI;I-IP;~ f Jut-nuf f #d::E?!
?') Tctal a & ~ i t 5q~iva lenh; ............ i i 7 g 2279 2278 2278 2 7 $ 2278 278 Tckal c a t t i e cat-r ied ............... 2 3 : ~ 232>: 2323 .>.>.? -,-I 23-20 2 1 9 2322
...... - j r ~ ?*a!- old hei fi.1-5 rekaitxd 364 214 2:. -,,, 1 270 263 25': -277 i.;tai row, ;t-td hsifet-5 a b e d ....... 1160 10011 896 $6 1 8.3 $5 k>;:;
C - ., i ~ : t a l r a ! v e ; b r a t ~ j d ............... 754 G 11 ,522 J ~ I ) 545 536 574 hZalve~ic~w; mated I ................ 5 . 0 0 65.0O:C €5. I)I!L fA.OO:C 65.00% 65.00:l ,-.
: : a iv~i rows m r v i v i n s % ............ 70.6YX 70. L5X 70. LS! 71?.65:C ?rl.F,TX 70.6.5:5:! 7!j. F,5:l, 3vet-ai 1 b r w k r deaths I ........... 8. )!OX 8. OD:! 8,OtI:C 8.00:< 0 $,t)CX E. 0111 'enaie sa!ei/ki:kal s a l e s :i ......... 4 1.52% 2 . 43.152 43.45% 2 13.80:i 43.26:C rotal ci)~';, a d I%ifer-5 w!d ........ 259 223 199 132 187 1% 197
............ la:< i ;x.a ;:OH CUI 1 ing age 11 I I I f I I ! 1 !! I t 6 ................. +ifel- j o i n i t q aqe 0 C )
& 2 2 2 L
:I-* yr old h e i f e r z a l s and ;pay 1 . O.O?X 0.07X 0, I ~).i)% 1).0jX 0,07,/ $,GI):( .;is ;;I- old Iisifsl- ;:les and 'SFX~ :C . 0.00X 0.00:( 2. OO:i 1 . 1 : 1 . 0 0,00:! 11,1)0:( , j t i l steer-, ar,d bul loc8:i so!d ..... ,344 .?fi:j ?x.? - - - 249 24 1 '.-,& L.Z, 2% ' 2% iwzn b:~! ll:.:C: tut-nof f a ~ e ........ 1 2 3 4 c 6 .:. ... . ,.,
Fci~ale prl,:@ ............... 539.28 $ 3 8 . 3 Qt&. 28 f2W.2 : $3;. $:%.ii $:3-::::.!)1) . - , . - . - - - r r t a s ~ke..~_t./br~l!~>:k pr ice ........ 9270.110 k30 .00 $4-t8i. 43 $451.47 $.is>:. 14 .5502..% $500. I]!)
;api %a 1 value o f het-d .............. $525E:L'F, $.5.3E2S07 556587.5 f 5$$s:l41 9;1):?375 f615:3$1 f 56..?35: ?i?t c a t t l e s a l ~ .................,. S17$21?1 812.113 1185956 1179754 $175764 917:3141 $.1Yl,$5i:1 :tir?ct ~ri;;t; e::.c!r.riling bcri!; ....... $39954 f.Y;31!] 53723 5:2.&$ff5 $3-537 $364F4 437!]93 3 ~ 1 1 rep!a~:*nmt ax! kisbar!cil-.i ..... $1 1496 $991:3 18E75 St.53ll $8312 rfEi7i $5749 :5:-,5; margin f o r herd .............. $12.24! $!2.1181 $I33856 $i.>i.?LB $:?Sd15 $122481 15!4@)!jt: ?!-o.z;, ,a t -gin p?.r a d ~ l t e q ~ i v a l e n t . . $%,.34 $%. 5 $ 1 0 $.:8,99 $57.43 $56,4ij SF,.!,!)? I :spute: inter=% *In 1ier.d . r ~ ! t a l X . 5.2!)3: rj.21];; 5.21:: I j 5.211% 5 . 3 1 ~ I ! :%/% 2ft2:- i~.r+.& ~~ntere:', ....... $12.:34 $ 4 2 . 2 $ 4 $4.5..?& $43.64 2 - 2 5 $51.12 1
I

Datz: :+.: :+: t;r W.E.iio:ws. D . P . I . , T8~1ivi i i . t . Q11j. QCIY I :
- . ':: ;t vzar- 211~!.; . . . . . Ge:auber 1392
:lots :: In table; 1-6 r'r 8. yr I data ccpie; aut~ :~a t i ca l l y t . ~ yr-s 2- 11. brlt b? o . + e r n r i t t ~ ~ .
- , - ,., - rn JA2LE 1 - FLYKE CATTLE 3WTH RATE5
- - .=!.: 9f ? e x Expeckd amwal & a t i ~ r a t s (:(I sach year:
i59.3 kt934 +:.::~;p~lJ;~~ L9J5 1% 1347 1332 19%' 20011 200 1 :!J cz-, 2:);; 3 -----.-----------------------------------------------------------------------------------------------------------------:----------- .; 5.1- ra!vei,'wsa~~r-; 7.0% x 5.5:; k,:3.5% 3.5X 3.51 2.S( 3.5x 3. 5:C :j. 5: .! . 5 1 -3 4. c.. ... .&. C -. :?I-; 1 V ~ I - 5 . 0 ~ 4 . 5 ' f 2 . 5 ~ 2.SX ., .: . .,.< <., :!.5% 3.SA . 3.55 I!. YL 3. .% . -. -
'- . -,.\ :; ; fs_r; 2 yeat-.; 15. O X X !2.G% Xld. OX )(8. OX 8. ?):( 1 8.11% 8. I):< 8. 0% ., . 11.:. .., s, $:<
2 ~ ~ 2 1 . 2 i6.11X 12,1?:( l C , I l X 8. 0P 8.OX 8.0:( $.OX U . 8.?:i 8, I):( g ;,': -. .-,. - , - , z z : 2 15.!1% 12.0:i 10. IIX e. I):( 8.0% $ . O X 8. ox 8. IIX 8.0:: e. 111" E. c:.:
:.a: 5 y?z~-.i i5. OX 12.02 11). 0% 8.OX . $.OX 8.0% 8.OX 8.11% 8; 01 t:. 0:; 2. e:; -. .- _-= 6 p a l - ~ 15.0X 12. OX 11).!)% E. OX E . OX 8.1lX 2. I)X 8. I):< -9. O X 8. 0 ,,a:
v. V . .
:~d: 7 yea1-i 15.0% 12.49 10,O:C 8.OX 8.iIX 8.R 2.1YL 8. OX 8. OX E. OX 2.11; in.: 8 yeat-5 15.OX 12.0X 10.O.X 8.0% 8.OX & O X 8. OX 8. OX e. OX 8. OX 8. 0:;: t:+s 9 years 15.0X 12.OX 1O.UX 8.0% $.OX 8.01 8.0% E. OX 8.5% 8.0% 8. OX ,745 10 years and over 15.0X 1.2. OX 10. OX E. OX >:.OX 8.0% 8. OX 8. OX 8.0% 8.0% s. I):< - - , . -.= y etj a:s~-s 11. OX 0. OX 0. OX 0. 0% 0 . 1 0.VL 0.0% 0. 111 0. J). 01 0.0;; ----__--------_-------------------------------------------------------------------------------------------------------------------- ;Tk T A K E 2 - F&+E CATTLE DEATH RATES ---------------_------------------------------------------------------------------------------------------------------------------- -,i!-t. of Year E x ~ d bhaU> rake3 (:i) each year: ---. =:+-: i p % i c t ~ 1393 3 1994 159'5 1 W, !%7 1'3x2 1999 2000 2001 2002 21:;1;.3 ----------------------------------------------------------------------------------------------------------------------------------- - - - .=Ti- ~ a l . i s z i w e m e r i 7. 1 ) i . 5 . )( 3 . 5 ~ 3. 3 3. .52 2.5X .3. .% 3. .5X 3.5% 3. ::C -.. : T. -..b
. - + .c<t-i 1 yeat- 5.5% y.4.52 y.3.5X :3. Si 3.5% 3 .X 3.5% 3.5% 3.5:( ,: :>,51 - .. -.. - . , . - _' . _'..
* i i!:,:ki 2 yeari 5.5:i 4.5% :3..5i: 3. .T, 3 . 3 3 .,.st. -., :I. !Xi 3. S i :2,.5X ;. i . .- 5" .\ 3 =.; . -i . ..!in>:k; 3 year5 5 . x 4.5:< 3.5% 3. Yx' 3.5:( 3.52 3.51 3.5;: 3 .,. 5~ . '3 .-.. ti:' -- ,. .-.. .̂ =. ..'..
.llcc'r:; 4 years 5.5% 4.5% :2 ,5x 3.5% 3.5X 3 .Z 2. -5;C 3.5K :3,% 3.57; . < -. . - -.. -... . . . ..; ;->I*:; 5 years ~ i s ~ f 5.51 4 . x 3.5'A 3.5, :!..5;i 3 . 3 :3,.5'E; 3.5% :3,5% : -3. .> .J C'J :. T. c.: --. . --,:. ---------------------------------------------------------------------------------------------------------------------------------- ,TG T A U 3 - CALF i%ANDIh& RATES ! c a l v ~ brai&j/ct% naked % - iirxi~&-s prlrdlase c~wuc-,) ---------------------------------------------------------------------------------------------------------------------------------- -6 X z t i ~ ~ q 51-)>.q E:(~..-ctt,e brar>jirtg rate: (2 a61 :;ear:
1 j'j':: k !%4 199.5 1396 199? 1'38 1-39 2000 2!3!) 1 2002 i 7 ... ,> ... :, :. ,
---------------------------------------------------------------------------------------------------------------------------------- " 5 a a t d 1 y r a id 0. OX 0.0:;' 3. OX 9. 0. 0% ! ij! I). OX i). 0.0,? ' .O;O>: !; .. .. . . . '
+G =at& 2 yr; 45.61 )i *:.or X s?.at X 59.61 ~g.1)~ Q.I)P Q.UX i;1.0:( Q. o:( 6 5 . 0 ~ ;,.c _ _ . .-. ., .: ., . .- - = naked :2 y;; .- .. 45.0% 4.5. OX 52. O X 9 . 65.9); 65. I]:( 65. $:< 65, I):! 65, $5. ,I:{ '. 2 . '.: ; ~s ffiak2J t :it-; 45.0:: 4 . 1 52. I);' 53.0X 6.5. I):( 65.1)X F,.~.I):.: 5 , [.5,0:( I 6:. .I.. -z 22k& .5 ?I-5 .- !5. I)? 4 . 1 52. Oi 54, ax 5 I ) 65.?:( 65,!';:< 62, i)X c,5,C:< ' 65.!]::: L _ .A. . .-, .?.. .. . ..: g te , j 6 :?.t-: 45.01 4.5.0X .52.:1% 5 9 . O X I ( 65.21 E.!:I:( 5 ) 5 . .<.5.5:. ..: 7 YI--, 45.01 45.0~ 52.0;: 53,1):( 6.5. 0 i 5 , I 65, $:( 55. 0% 6.5. 13X 55. !j:. .:.:.. .- .. : . - 5 zat.+if F; yl- s.s.!]x 4.5.lj% 5Y.OX 5P.IYL &".I)P fi.ll:i 6.5.13X &5.1):( &5.11x &s.fir< <2.:.'; -5 sitetj 9 yl-; 45.01 J5.1):! 52. OX 59. O X F,Fi.O:! 5 . 6-5.0:: 0 65.0!1: t;5.!jX 5:. .- .. ... . . r4t.5,: 10 vr; i 4.5. 0:i' 45.?:1: 52.0% 9 . 5 . ~ 5 , (I:! 65.9~ I ) 6.5.0:{ 65, 0:; .... .. 5 : . ':.. - - - - - - - - - - - - - - - - - - - - - - - - - - - - - - - - - - - - - - - - - - - - - - - - - - - - - - - - - - - - - - - - - - - - - - - - - - - - - - - L - - - - - - - - - - - - - - - - - - - - - - - - - - - - - - - - - - - - - - - . - - - - - . . .

; ~ r ! ! 15. :8f:~MCI - Multi Y?ar &I-J &>&I - Vi.r-;t8n l.il11 Revis 1.112 Naw: Dynana Bankeri,&:*:l~mt,ant;?A-ntj wrkshlp.
Bate: :o.t:;+j by W.E.KI~~P_;, G.F.I., Tlmia41ll~, Qld. 1x4 1 : =:1-5t yeat- Y f i d ~ . . , . . Gi.l:ernbi)t- 1993- . * - r , + ; r t T A U 4 - CATTLE WCW% PRICES t inclwiing freiht, % b ~ y i t ~ costsi
. . );_z-IT ipt,:mi a d A p : 393 1994 1% 1596 1347 i 3% 1345 11)00 21101 2002 --.- -.n.. . I , ; . . .+: f.zr calv~!+iearwrj 3 0 4.11 50 $1) 50 $0 SC 5 11 5 1) $0 > - :: - inif?ri 1 year 51 50 $0 50 $6 5 1) I0 § 1) $3 5 1) :'- - .. L ~ f e t - i 2 years 5 0 5;) $0 911 $0 30 SO 2 11 S 0 : $i) .. +:; ._. :.:i.ci .3 years atid wet- 5a J 11 40 $11 3 11 5 0 $0 $0 3 I! $0 = - -. i tzr calvesiieawr; $9 $11 $0 $41 $0 5 11 $0 . 50 $0 fr: - C~
c - - , - C '.I.==. , 1 year 5 {I $C 60 SO 5 I> 50 90 50 5 I! 5 0 $; . ,. . , . -1 . - .--
. A . ->>-A, - j ~ d t - ~ 4.0 2 1) $0 SO 5. 0 $0 30 f 11 5.0 !.0 s .'j
. . , . - - A : L 1 s - k ~ 3 ~ ~ a t - = $0 I 0 9 11 5 1) 9 0 S 11 $1) $0 3 I? 5 0 5 :> :; i !.,3,5:-, .( year-, $0 $0 20 5 0 $0 9 I! $0 211 5 1) $5 c ; C', . . ..:.I 1 ; ; 21300 $1300 $1200 $13110 31.2110 $1.00 313b0 413CO 3Z00 f12OO -"?".3 - z d k 3 . 2
.___-___--__-__---_--- - - - - - - - - - - - - - - - - - - - - - - - - - - - - - - - - - - - - - - - - - - - - - - - - - - - - - - - - - - - - - - - - - - - - - - - - - - - - - - - - - - - - - - - - - - - - - - - - - - - - - - - - - - - - - -
:AT2 T W 5 - COjl SALE PRICES (wt of wiling and freidlt cost,;) ,-. __---_-_---------------------------------------------------------------------------------------------------------------------------- a=,-C. -,-, iptian z d E x p d s d sale price each yyer:
! 393 1994 1995 1996 1997 .-------------------------------------------------------.-----------------
ki fs_r ralves/seancr= 575 $75 $?5 $75 975 ieifers 1 year 9175 %17G $161 $184 sic5 ! - . - , e ~ ? s r s 2 yesrs 3511 Jil-55 .%Xi.!? 5262 926.5 %.. .- ; .,,= :3 year.; . - b 9 )j$290 jws >*?!:I) xf:?05 .:i~z : year5 5305 $3021 %31:3 3317 X$.?M ::;a: 5 year-; $:205 $309 M13 t3i7 $321) 7x5 F, yeat-.: S395 $309 Z13 E l 7 $328 - -, ,- i -3 / '+Bars $309 $:3:309 $313 $317 $:321>
.:w; 8 yitaf.5 $:31!5 $:31)9 $313 3:; 1 7 $220
.:.wW3 9 year's $L?lj $L% $310 431 7 $-.>;I)
.%z 111 years $275 f'Z0 5235 1290 4295 ?+I; I1 years anid owr s61J $2h" $2711 927.5 $Xi1 >?y+j ~:~~~ 40 5 11 6 0 2C ID
c ~ ~ r i ~ t i k i n wj @ Exm-tej sale price each year: 1 592 1554 1395 I956 1 9 7 1 9??8 1 :E'Y 20llll 21]1j1' .. 2302 * .. ,,.11'1 i ..' . .,.-.
----------------------------------------------------------------------------------------------------------------------------------- tc2r ca!.s;!nemer; $75 $75 $75 $75 $75 $3 275 f 75 $75 $75 + :-r , _. iccr: 1 year 5250 ~ S Z ~ P $270 1271) $2711 $270 1270 p7!3 82711 ~ ' 2 7 ~ ~ r i !.:~:ks 2 years f31!) a 1 0 1339 k$:31350 Sjzij 53-51) $:~ZI] $:!51) 5x2 C-:LC <;-,I-. -I <.--, I?c .-I 1:
. . ui i;:.:ka 3 yeat-5 54.51) S.511 9470 '$450 sf"& f :*?I) 54711 $491: $490 . $.51)2 !;I i2:':;::ks 4 year; 8491j 3 490 $5 10 $530 $2 5.54 0 $5A!> f5All $:A!] $F;;i:j 554 .a: i3;:b-, 3 ye3r.5 %S;i) $5111 9530 $.zfj $.SO E70 5570 1576 $.yc $570 $5:::
. I i . - . - L . - ..- rY. -h3 6 years FIU; f 551) 35.50 f 570 3530 $590 S.531) 5.550 6.5911 5591; s53!) sz?:? +:-,: $2 1 : .i S51j 85-51) $5711 $591) $st:! $.59 I! f 9911 $3Ij f 5?!) 59C .c;$h -------------------------------------------------------------------------------:---------------------------------------------------

, - _ _ - _ . . . . . . . . . . . . . . . . . . . . . . . . . . . . . . . . . . . . . . . . . . . . . . . . . . . . . . . . . . . . . . . - - - - - - - - - - _ _ _ _ _ - _ _ - - - - - - - - - - - - - - - - - - - - - - - - - - - - -
1393 1993 1593 1993 1 S?.! 1351 199-! 1354 1 '94 195: Stal-t z f Y~ar AEiIhj. Stark Ysal- FIJI-dl %ay 5 i 1;1.);1ng I f i~rch -. jpay - L 1 I::Q;~~,.;
>+;$:f 1 pt, 1 ~3n f r (Entar !bj (Etlter! (-Enter) . ( E n t ~ r ) Nf~nberi Nm&rs tEntsr) (Ent;.trl <Etit,s_r 1 % , s c ~ ~ ~ ~ . . . . . . . . . . . . . . . . . . . . . . . . . . . . . . . . . . . . . . . . . . . . . . . . . . . . . . . . . . . . . . . . . . . . . . . . - - - - - - - - _ _ _ _ _ _ _ _ - _ _ - - - - - - - - - - - - - - - - - - - - - - - - - - - -
- - .. - - ---t -2. .r- ;;; :;i
H.2 ; fa- ,:a lve; lu+ar,sr; 1). 51) 225 k i f c r i 1 : i ~ 1.00 2119
,3 . -- L j t . 1.25 197 .,.;hs; .; ',l'lj 1 .?5 1 if7 ::.7*i 4 ,yr; 1.25 ! 40 - - ... ;h; ; ;rt-; 1.25 119 .-?;,,: i ~ : 4 t - 5 .. 1.25 101 .-;+I ? \;yi 1 . '25 ,--, is i
.;:y,+5 c yr; 1 . 3 73
1 2 : ~ ' ; 9 yri 1-25 62 1 ; ~ : 10 yr; 1.25 s:! -,-&s ..-- I a a i t 1 .25 45 Izaysd cow; 1.011 11 Q l e calve;lwea%r; 0.50 ;Leer; 1 yt- o ld 1.00 209
2 :*A -- 1.1)1) 1% kllccks :3 yr; I. 00 1 64 . 7 ,
3;; r l x k s J yt-; 1.00 62 ; u l l ~ c k s 5 yr i 1.00 4 1 v l lwk5 6 yrr t 1.00 27 9-d bulls 1.50 49 'YO b f ~ l l - i I-etairM 6 2 'yri ..... 0 ---------------------------- ---------------
na M 45fj c;a !? - 1. -.
Ll;
, 0 L'. ?,');. , I) ..:j . -.
I ! :
11 'i) i 47 1; 7 t] 12.: I) i1 i 05
!I !.! cj
11 [I -. i r
11 :I 'L-. i z
fi 0 r c . - . - - :j 1;
; i) 45 111
c;a !I I!
.na 0 .> -: ~1.2 112 0 .?, L*J*, 2;
na '7 ' L1 1 gk
t;d '3 83 na 1 '5 42 na 12 27 na 27 0 r,a ! 0 49 n;i na r~
................... C~xG c~akej ................... 1000 CGW; mated ~!)I)I)
................ Brandinq rate 45.1111X BranJi~~g rat2 ................ 45.0CX Bill15 rewired ........... , ... 50 B ~ ~ l l s r e s ~ i r e d ............... .,., c n
&;I l/cow ratio ............... 5.01lX D,~~llic.~cc r a k i , ~ ......'......... s,!?~: B ~ 1 i ~ f ~ r c h a s e : C b ~ l l ; r eq~ i r?d 22.50X 5111 p~ir&;e :( k l i . 5 r . sq~~ i r+ j X,~I>:< EYO retention X &~11i r .w~ire- j O.!JOX 8YO r e twt ion X b ~ l l z rs.;ui~-+j I>, CG< Eu! 1 &a% rat% .............. 2.OO:C Dill death rat2 .............. 2. gg:< Hitiinfm sales o f wenir;ir b ~ l l ; 20.YZ Xir~iav.a;ale;ilf,yh-lnir~b-I!!; 2C!,Y2;
----------------------------------------------------------------------------------------------------------------------------------- l i - s j sa;nal-y 1 Yfl 1354 !395 1996 1\79? 1998 1.39 21)01) 21)!]: 2!) 1)2 -. -. ....... ,,.n.- . - -------------------------------------------------------------------------------;---------------------------------------------------

5 0 :~:::s~!:$i TABLE 7 - t!@D M'/ELOFME:iT A t i l l TWJW F M STmT / d k r i i 15. 195 . . . . . . . . . . . . . . . . . . . . . . - - - - - - - - - - - - - - - - - - - - - - - - - - - - - - - - - - - - - - - - - - -___ - - - _ _ - _ _ _ _ _ _ _ _ _ _ _ _ _ - - - - - - - - - - . - - - - - - - - -
1995 1995 1995 1995 19% 19% 19% 1996 1 ;c.-; 1396 Stat-t o f Year- Opening Fur& $ a ~ 1 1 Closlng Open~nc;. P e e - " AI ,A , .Spa-{ 51.-11 Closlnj. - .. Cl+ra-i~t iotl- N L a n b ~ i (Enter) ( f i ~ k r j - i ~ n t ~ r ) W e r ; ElraPb.tr; (Enter) (Ent2r) ih tm I &&ri _ _ _ _ _ _ _ _ _ _ _ _ _ _ - _ _ - - - - - . . . . . . . . . . . . . . . . . . . . . . . . . . . . . . . . . . . . . . . . . _-____________i____------------ - _ _ _ _ _ _ _ _ _ _ _ _ _ I& ':a i ~ . t i t:a r la IM na 537 1a3 na na M 53; 92: fe r calve;/wanec-s 225 0 na 0 t!? 269 11 na :I .%q &.,-.
21 3 0 0 8 7 c '.{ei f+rz 1 y r 217 0 1) 1) 204 I - . ; , = , , e ~ - ; 2 y r i 2110 3 0 0 A 100 ., 205 0 3 &; 89 .:.yd; .3 ?I..; 173 0 0 0 1 % 1) 0 ,% '. F:7 .:,:a; 4 yrs 147 (1 0 0 132 13; I! 0 143 j:,x5 -5 yt.; 124 0 0 0 11 1 1 :z I) 0 0 122 <;;ws 6 yrs 105 0 0 1) 95 111 L' 0 3 1) 7-t . .;.,(.I.; - 7 yr; 83 0 1) 1) go 5.5 1) 27 62 <.,i;; t: yt-s - P
15 0 0 11 t;e 8 1) 0 0 18 . ,+ q7 , 6.5 1) 1) 62 0 <.x; 9 y!-s !I 58 .'i !! c .---. :
.;ow; iO yr; 55 3 0 Q 43 58 d O 5 4.3 ::.;ws I I yr.5 anj over 47 :I (1 17 (I 49 . ' I) 0 ' 49 I:!
. ~ a y e , j c , ~ 0 na IM 1) 0 3 na na 0 11 &I+ c.alvc;/wamr: 225 0 na 0 217 269 0 IN 0 259
I - .
Steel-; ! yr old 213 0 na 0 205 217 3 na 11 3 9 s tee rs 2 y1.5 200 0 M - ~1 < 370 205 0 na 5 174 lu!lacks 3 yrs 1 6.L 0 na !dt) M 170 0 na 102 W 5ulllxusk3 4 yr-s 63 0 na 13 12 k5-t 1) na 19 43 ?:A] l11cks 5 yrs 42 M na 12 2s 42 . na na 1 :? 29 31111>:ks 6 yr; + 27 na na 27 0 3 na na 2; 0 +1-,2 b f ~ i 1s 49 13 IM 1 11 51 5 1 5 na 11 4.5 ::YO bull; retdirgd $ 2 0 M na na 113 11 112 na . nil na ---------------------- . . . . . . . . . . . . . . . . . . . . . . . . . . . . . . . . . . . . . . . . - - - - - -___-_________-- - - - - - - - - - - - - - - - - - - - - - - - - - - :,;ial # - - & & I D
be+.,L- 2.51) 1 13 0 223 26th >[,LA 3 423 2c.65 C
--------------------- - - - - - - - - - - - - - - - - - - - - - - - - - - - - - - - - - - - - - - ... . . . - b~+ti mate3 ................... l0.X C a > ~ i n a k j ................... 508
................ El-at~jing r a t e 52.0!1% Et-a~!.ji~~: r a t e ................ 59. ~!l):<
611 l l 5 1 - q 1 1 i r e j ............... 52 Bf11ll; r e q ~ i r e d .......... .., ... 45 ............... B~ll/l:cw r a t i o ............... 5.1lrJX h l l / c ~ ; w ratio 5.!)O:i
B.111 purduze :C bull.; required 22,ijrlX 3111 pa-lchass :( bull; i - e q ~ i r ~ j 2.50X EYO r e t a l t i c n I bul l s resuir-e.:! I).:)OX BY0 retwkion :! b ~ r l l s r.wir;z! 0.013X B ~ l i death r a t e .............. 2. OOX Bull d.tatii r a te ..,........... 2. !It):( R i n i r m s a l e s o f i ; ~e~ i t ;gbu l l ; ZI).~?,X P?iiiiliir.:r;, 5a!i.; of cpmit~ ~ J J I : ~ 21?.5"3:
kt.,! 5.aaar-y

!t.r.d .:alvzs hs_:fet- ~ralc . t ; iwawr3 42; fc1-z [ ;c
+: f2r.s 2 ? ! - 5
::.:d; 3 ?I-; ::,;* 5 4 yf-.: - *-.:.Hz > ;f:-: ::,:.uz 6 :f r-; .- 5<3k5 7 yt-S
r;.:.w; F; y1.s !;owr; 3 yt-5 I- _ .*:-y: 11: :;r: <.-A: 11 yrs u.j sjver i$& yed >:c~z 8aie ialve;l,xeaners Stes_t-i 1 r r old c-ewrS .? .jt-r , L 3
Bu! i~>:ki 3 yrs BJl 10:k: 4 yrs 9:ll llXk:s 5 yr-i
BuIlacks 6 yr-s t
Se!-d b ~ 1 l . j S'i!j bull; r e t a i d 4 2 ---------------------- Toial Ca t t l e
1 8 7 1997 1'37 1997 1397 L'HS 19% 1 15% 1 99% Omling P u r d ~ %ay Sel l Cloiin.; Ocen~ng P ~ r c h .say . 1 1 C l o i i n j Nuabet-;_., (Enbet-i -(Enter) (Entar) timber; Number; ( G t e r l (Er~tdr-1 (Etitzr-1 Nmb~t-5 . . . . . . . . . . . . . . . . . . . . . . . . . . . . . . . . . . . . . . . . __________-________- - - - - - - - - - - - - - - - - - - - - - - - - - - -
na na na 11 rla 0 0 !? 11 11 0 0 11 ij 9s 11 0 11 0 !) 0
'1 . 0 :37 0 0 0 0 11 0 11 9 11 0 0 - 0
- !) :I 49
na IM 1)
0 na 0 0 na : I)
11 na 3 0 0 na 107 0 na 21)
na na 13 na na 23 9 na >:
na na IM
2tx5 6 0 421 -----------------------------------------
Cl; ;pat& ................... Eranjin~ ra te ................ Eul l i r e q ~ i r e d ............... B~li/cc%i r a t i o ............... Eull ~lrrcha- X blills r s r i r ~ d WO r e t e n t i i x ~ X brrili required B J ~ ! death r a t s .............. Miniam sales o f cpening Lulls
267! 9 0 1392 27C8 ..............................................
C '
Cw5 a a L J ................. .: gL3 6 r a m ? i 1 ~ ra% ................ &5.130:i Bull; r e q i i r d ............... 41 6ul licow r a t i o ................ 5.095 Brl! pr~rtchase X bul l s . reqr i red ?3.51!X EYr) r e t . a t i m i! r e q ~ i r e j O.l!~?:i h l l &ath r a t e .............. 2 , :)!]): filinim~rm s a l e s o f oml ing bull= 3.YX

- - - - - - - - - - - - - - - - - - - - - - - - - - - - - - - - - - - - - - - - - - -________________-- - - - - - - - - - - - - - - - - - - - - - - - - - - 19'3'9 1799 1999 1999 1999 20110 2001) 21) 110 21) I)I) 2r:r)O
Start, ~ J F Year- w i n g fi~rch Spay .%I1 Ulos i i~ . Opening fi~rlrh spay + l l Clo=:nq . C ,$- -=s- r :p t~w - FkrPb~r; (Entar - (Enter) (Enter l' N8il'oet-5 -rs =' ( € n t > t , (Entsr l M-at-r;
. - _ _ _ _ _ _ _ _ _ - - - - - - - - - - - - - - - - - - - - - - - - - - - - - - - - - - - - - - - - - - - - - - - - - - - - - - - -__________--___-- - - - - - - - - - - - - - - - - - - - - - - - - - - - :c+w calves na -2 1 f ~ t - ca lveir'war~t-; zk>;
.ia;iers 1 yr 3 3
.++i +I-5 2 y1.5 L . ? d 9
.:.;xi 1 y:-2 2:2 0 ::L?ni 4 y r i $7 ::.,wi 5 yI-5 2 1)
':OHS 6 yri 74 .:.;wi 7 yri 66 ;:.>w; F; yt'; 4 J L ?
I:.:%-, 9 yrz 57 L:ydi 10 yr; .>J <'3
:;.;HZ 11 yrs arb! ovsr 49 ifJ~2:ied CJ>% 0 Male calves/~atv-r-5 2s Steer; 1 yr old 259 jteers 2 yri 250 t i l . i l l>~k~ 3 yt-i 212 3;l!olrkr 4 yrs 69 Gullocks 5 yrs 45 i;;.il lwkr 6 yri t 30 <+t.;1 bills 4 1) 3':'ij bull; r e t a iw j (A 2 0 ---------------------- ............................................... Total Cattle 2708 9 i) 114 2 Z 3
----------------------------------------------- Cot.-~ a a t d ................... 8'25 Eraildinq rate ................ Q.0O:C DAls r w ~ i r d ............... 41
............... DAII/CGH ratio 5.0111 0.111 pur&;e X buils rcq~ired 22.511% BY0 rekention :( bC1115 req~ired 0.00X Eull deatn rats .............. 2. dOX Minima .sale; of ~ p e n i n q bl~lls 211.72!
----------------------------------------------- 2723 9 0 418 2 7 3
c. r - Cows mated ................... :;~5 Bradirq rat._ ................ W.rjOX P~11; rewired 4 . ............... .ti
Bul l/cow ratio .............. ; 5.02: b~i lp : .~r~nar ;e~Cb~l l ; reql~ir+j .Z..cj!::X BY0 r e t a ~ t i m xlX b ~ l l s reqvir& O . C C X 3.~11 death rat? .............. 2 .OCX #inior;m sales of -ins b~!i.; 2 0 . W

:F;[j:~jfl IAECE 7 - HEFD tOiEiCFMENT ANB T!JR?$lFF FROM START ... _ _ _ _ _ _ _ _ _ _ _ _ _ _ _ _ _ _ _ - . - . . . . . . . . . . . . . . . . . . . . . . . . . . . . . . . . . . . . . . . . . . . . . . .
200 1 201) 1 2011 1 200 1 200 1 Start of Year Cpwit~g b ~ r d ~ Spay 51211 Closrnq % ; i r ~ p t l ~ n tbder-3 (Giter) (Enter-) (Enter) W e r i . . . . . . . . . . . . . . . . . . . . . . . . . . . . . . . . . . . . . . . . . . . . . . . . . . . . . . . . . . . . . . . . . . . . . -& .:a lve; IM na na na 536 + I i2r e a l v ~ - , / w i ~ ~ s _ ~ . s 2t.f 0 na 0 259 -%!fa-; 1 YI- 259 :I 0 0 250 <elfel--, 2 y,-; 3 0 O 11 0 230 3 . ; ~ ; 3 y-rs -- ??.j 0 0 135 $7 :,>: 4 yt-; 87 0 11 0 F; 11 : 1 ~ 5 5 ? r i E 1) 0 I1 0 74 l,.>Wi t y1.5 74 il 11 0 G3
j 7 ?I-i 6>: O O O 62 I - , > > H . ~ CJ :i1-5 iJ2 0 1) 0 57 S.3~5 3 yr-s 57 0 11 0 s" CGNZ l!l yri 52 0 0 0 43 I:GHS 11 yt-; r;~>r 49 1) C 49 0 5~.ays6 CW; 0 na na 0 0 #Yale ~aIves/~wanei-; 11 na 1) 253 Steers 1 yr old 3 9 0 na 11 250 %?el-.; 2 yr; 2S.l 0 na 3 0 212 hllock..: 3 yr.5 212 0 na 127 .JL C-7
%.~:l!lock; 4 yt-5 82 11 na 25 .55 B i i l ~ ~ k s 5 yr; 55 IM na 17 3 7 Bullock; 6 yrs + 3 1 na na 31 0 2er-J b ~ l l s 40 9 na & 4 11 Z'fG u ~ l l ; retail& if 2 0 M na na na ---------------------- ----------------------------------------------- Tata! Cattle 27733 9 0 422 2 73 9 ---------------------- -----------------------------------------------
&ws wtsj ................,.. 825 Bratditw rate ................ 65.00X h l l s r w ~ i r e d ....... , ....... 41 D~llicGt4 rrah ............... f j .Oc)%
J r e :( 1 I Z.51JX EYO r e b n t i ~ m :i bulls rgq~rired 0.1lCX h l l Qath rate .............. 2.110% Witliwn =ales o f opwing b~11; Z0.92:i
1 I 1 1 _ _ _ - - - . - - . - - - - - -__ . . . . . . . . . . . . . . . . . . . . . , .2002 2002 21102 2011; 2002
IjFeli~q Furch . . %ay Sell Closiw Nunber; iEnter) (Enter) (Enter) fh~akeri . I
--------------------------------- c '
1 <
i:w5 mate-j ,.................. Bratding rake ................ b ~ i l s rewired ............... Eull/con ra t io ................ Eull pur;z!-zm :C bJl1.i t-s.tire4 BY0 r e t a ~ t i m X br~ll; rey~ired %ill &ath rake .............. Winiwm sales o f ~xening bulls

54
.Ec [ j[ijyi TABLE 7 - HERD DEVELIPKVT MG TU?ED)FF Fmn STMT ________-------------- -----------------------------------------------
2003 2003 20113 2063 20113 Stat-!; of Year Owil.r? ft~rch Spay b l l Ciosin~ 5orrr iption ;Vl&er; (Enter1 (Enter) (Enter) b h r s . . . . . . . . . . . . . . . . . . . . . . ----------------------------------------------- :leu calves na na IM na S36 4. i f s r ca lve:/tearwr; 2& 0 IM 0 259 is i isr; I yr 25 9 11 0 0 250 i e ~ i e r : 1 yrs 3 1 ) 11 C 1) qT, L.,O ;an; .3 yrs 230 0 0 1 3 87 ::our 1 yrs 57 0 0 0 80 f : ,~ . r ; 5 yrs 80 11 0 11 71 : b ~ 5 yt-5 74 0 0 (1 a i ~ u ; 7 yrs 68 0 1) :I c3 ::JIG 8 yr: 62 0 11 0 57 :.;w; 5 yr: 57 0 0 0 53' 1-., C ,~,+l> 10 yr: s3 0 0 0 49 -:r3u5 11 yr; and aver 49 0 0 49 11 Spayed cows 11 M na 0 11 %le calvslwatxrs 268 0 M 0 259
.XP~S I yr old 259 0 na 0 250 : tcer; 2 yrs 250 U na 30 212 5ul i ~ k r 3 yrs , 212 11 na 127 (2
3ull~xks 4 yr: 82 0 na 25 55 ?J.JIII>:~: 5' yrs 55 na na 17 37 ? u l l ~ x k s 6 yrs + 37 na na 37 0 -erd b ~ l l i 4 1) 9 na 8 4 11
.:YO bulls rekitmi Q 2 0 na M na na .-_------------------- -----------------_----------------------------- .o ta l i h t t l s 2739 9 0 128 27.33 ---------------------- -----------------------------------------------
................... ~ N S me& $25 Brarxfing rate ................ 65.01YL Bulls required ............... 11 ............... BrrIl/~mrat;io 5.1)ilX Bill pclrchase X b ~ l l s rWl i rd Z.50X ~ ~ 0 ' r e t w t i m X bulls reyuird 0.0111 0~11 death rake .............. 2.1113X Niniwm sales of rming; brllls 20.m
.---------------------
krd .Sllhur;arey .---------------------

55
.\c1-1i 15. 1 9 9 :,':!(;(MA - kl t~ Year Herd #>&_I - Yci-z~on 1.f)Il fiilvl; 1.02 Naw: Dynama Bankers.kb~~mtant;.&-~rti nor-kzlwc.
Gat*: .:o.tl:+j by W.E.tblns;, D.P.I.. T w w ~ ~ i l e . 1116. lX!4 I : -~r; t , year adz ..... b i d e r 1993 :::!ST5 TAME 8 - VX1AEl-E ANG FIXD 1:fijiS
?bta 3: Do rwt i n c l h debt service. interest., faally
l i v i y a1 l8man:e. or dvr-sciatial in these t~ble; . Ikif,~ apply to ;tart o f pa r - wd;Pbers after adding ~n purrIu;s-5 arb1 takirv CJJ~, sales a d spaying;. \I.. ' - - - . .. .I
. . . . .. -. x w ; al-J_ a15ted to s?ay+j *:IN grmIt.cp. .__________________------------------------------------------------------------------------------------------------------------------
ii:-;&.k ~:ost:&a;t 1 3 3 1994 l??5 1995 1997 1938 1399 21)110 21)1) 1 211 0 2 2~1)5 __________-_____L__- - - - - - - - - - - - - - - - - - - - - - - - - - - - - - - - - - - - - - - - - - - - - - - - - - - - - - - - - - - - - - - - - - - - - - - - - - - - - - - - - - - - - - - - - - - - - - - - - - - - - - - - - - - - - - - - -
-. . . i t ; ,..A \ = .,-:A ,c, ,. , c :=a.d, $3.40 $~I J . .T~ I . -520.32 $2(1.:2 $ 0 , : I ) $21>.:32 a). 32 $2tj.:>> $j2!), 32 ;?!- [:el fg fi .62 916.52 2i2.27 $12.27 412.27 $12.27 112.27 $12.27 512.27 412.27 $1>,25 :*I. heifer 2 years . 515.30 515.O2 515.02 $15.02 515.02 115.02 $1.5.02 $15.02 $15.6 315.02 Z , c e - . -. ,>x :> y - 5 plijs $4.62 524.78 418.42 $18.42 518.42 518.42 $14.42 flC.42 518.42 $18.42 518.41 ' ~ r i ~ a y s d ccr $11.01) 511.00 sil.00 50.011 90.01) ec.00 $o.-~Ic slj.00 90.111) 40.00 ~ 0 . 0 0 z.2:- s t e r 1 year $6.62 $16.52 412.27 $12.27 $12.17 512.27 512.27 $12.27 $12.27 $12.27 $12.27 "21- b l . i l I ~ k 2 year; $6.62 $16.52 $12.27 312.27 412.27 $12.27 512.27 112.27 $12.27 $12.2? f12.2? "2:- b~llwk 3 year; $6.62 516.52 $12.27 $12.27 512.27 $12.27 $12.27 412.27 $!jy'.'27 $12.27 $12.23 =.tr b ~ l l c c k 4 year; 16.62 516.52 512.27 , 412.27 $12.27 $12.27 $12.27 $12.27 112.27 412.27 3i2.27 = + I - L I ; ~ l~xk: 5 yr; i $6.62 516.52 $12.27 $12.27 $12.27 $12.27 $12.27 612.27 $12.27 $12.27 $12.2: "2r hsrd b ~ l l f L C 2 424.78 418.42 $15.42 flE.42 $18.42 $18.42 518.42 118.42 218.42 518.42 _-----_---------___----------------------------------------------------------------------------------------------------------------- --i.- ~ . . ~ e l '8: far herj . . . . $161)01) $46!44 $37525 $37077 $35537 $24875 $37069 537152 $37270 537270 937270 ---_-------------_------------------------------------------------------------------------------------------------------------------ ----_--_-_------___----------------------------------------------------------------------------------------------------------------- - ..,- -'*.*j 1:xt: 1 -3 1994 1995 1396 1997 1998 1 499 2001) 2110 1 21)1)2 'L L O ~ c q
------------------_----------------------------------------------------------------------------------------------------------------- 3,;!-:~ fee; *::. 5.0 $0 40 $11 $11 $6 $0 $0 . $ r j i : $0 $6 - =i.;~l, ' l~hri+:~~t; $0 5 0 f 11 $r! 9 0 $ 11 $ !j 2 1) 50 1 C 5 1;
;a; :av~a; 90 $:! $12 5 1) 40 S 11 $0 40 $0 $.:I $0 *r;gl;s 40 20 $0 5 0 $0 5 11 5.0 91 , $1) f O $0 :;;-\ZG-; $11 I 11 $0 $0 f. 1) 2 0 90 40 $I) -' 5 !! b, 1) %. ..a2..~ritig .-..- ;ronf,racts f ij $0 I0 50 $0 $0 2 1) $1 . $0 $0 9 I:! L :*:igran:e $0 $0 $0 $0 $1) S 11 SC $O $1) $fi .,I) C i.
--,-:--&;. . . '>a,. '#A 4 1; $1) $0 50 $1) 511 $0 6 0 5 1) 50 f!!
.; i.! k~-;nsplf-t $0 $0 It 11 $0 $0 $ 1) $0 f 0 S 1) $11 $1) - . - ! - 7 - ., 12i:t i ve r I o t t~ i tlg 9 0 60 90 S 0 50 $0 0 :I $1) 5 11 5 C 5:::
?;sa i r s i rna i t~kwa:~ $11 90 $0 9 1) 5 t) 4 0 $11 5rJ $0 5 1) 2!1. =;y;iti+; $1) 90 5 1) 4 11 $0 5 ;I $11 $0 : .. I!) $1: - . . L ;.:L::sr-y 4 1) 9 0 $11 $ !! 9 0 $0 $0 $0 5 0 S 0 -v t ,: .., . -.-.
+ A 2 4 60 4 1) f0 f I: $ !> $!I 4 I! . a#) +, $!) f 11 4 a-8' -., -:.:+~-g-,t :r.,k f * ? ~ $0 S 11 $0 50 $0 S 111 f ~ j -s, it (8 $0 $ !) -,. = I , .. : :rat i.:.~:: $0 f I! ?.I> $ 0 j. 2 2 n $0 z l> $0 ..#J $ij ., ., 5 I.! :---
=+=I-: $3 I I) $0 $0 f 1) $0 f I> $I> J. !) 40 . ...I r i.
Z . . = ~ . ' I ? I - C 5 I! 5 I? f. 11 5 !I $9 $!I f !) $0 ti) +.) $0 +.!?
: 7.-.-,. : -4.; . :. .-.=.-. ;F...r,,~~: $0 $$ 5 1) i !I $0 9 11 $1:: 4. I? ..., t ~ ? 40 ; .: - ,-. - .
"c)'~:r!+ $0 f 1) 5 11 2 1; f 1) $0 . $11 S 1) f!j 5 1) 5 I:! n:r;i*:. : ,:.>r+ $0 5.G $1) $1) $1) $11 4 1) 5 0 $9 5 0 f.!) . --.-
f . . : ! x i ~ - ~ ? ~ 50 3 11 f.0 S I! SO 3 11 fO SO 50 ..-- 5 :) s !: - - _ - ..., -
uta i. rn.ci\~i:+ J 1; $0 $ !3 5:) 9 1) $0 $1) s!j 5 1) f l .
9:! .'I_.
. .- 4.. , - - :, .. . >. : r z 3 2 5 1) 5 1) $0 50 80 5 11 r 1) r 8 J I I! < *\ S 1: 5 9 I I? 5 1) 4 1) J 11 $5 Q 11 5 11 ; i:
f..%1)1)0 I ) : I ) $ I =5!3:)1) $ ~ ~ I ) I ) I ) $5.51)01) IZOI)I] $551)1jl] f55?l!)d j:-5:?!?2 $0 5 1) Ill 5 0 $1) 4 1) s 0 $0 $11 Ill $ C
----------------------------------------------------------------------------------------------------------------------------------- - 2 ~ 3 1 ~ 1 : e . j ~;,it; . . . . $550111) $s~I)I)I) S51)1)1) mi)~]~) $.SOI)I) $S~IIOII $55000 ~ I I I I I ) W~I)I)O 15.5111111 rS51)OG

:t(r::),$ :LEG 9 - ~:f\Ut FLOW BEFCXE INTEES1
199:3 1334 1% 19% 1357 1998 15% MOO ____________-______----------------------------------------------------------------------------------------------------
i ---
,-. Li:a=h f i w f raa cPcat.tie tr-adin4 ............ a 2 2 3 PA099 SUP227. 5159539 21591jl $144745 51571:B . $153747 iI3pltal d ~ i p o s a l s ........................ 10 $11 $11 111 $0 SO 5 1) $!I 41rr!t-'j i r>:*xns_ ............................ $0 $0 $11 $0 $0 9) 50 SO ___________________------------------------------------------------------------------------------------------------------- ' : a r r a b l s a t d f i x s d r o i t ; ................. 57100i) $101144 X $9207 191527 f31C7.5 192069 $9212
r::apita! addit18wz ........................ 51) b 1) $0 SO 3 1) 50 $0 5 1)
L ~ z 3 i i ! , i 1 ~ i t ~ e : ( ~ ~ 1 3 e ; ................... $15111)11 1151J110 $1.5000 1!5001) 2.1.5000 $1501)11 $1.5111)1) $!5:)[1$ i;xati:n paid on prs_vlwz year'; ifc~tw . . $0 9 11 $11 $1) $11 6 11 $11 j $C --------------------------------------------------------------------------------------------------------------------------
L4rt caih flow ava i ld j le for d&~t service . ($767) IM10461 ($191991 15262 f521'4 I:3?$711 fiBOd4 fi2i;i;C. ' _ _ _ _ _ _ _ _ _ _ _ _ _ _ _ _ _ _ _ - - - - - + - - - - - - - - - - - - - - - - - - - - - - - - - - - - - - - - - - - - - - - - - - - - - - - - - - - - - - - - - - - - - - - - - - - - - - - - - - - - - - - - - - - - - - - - - - - - - - - - -
;3l;d, pianh G! ieprov?ments value s t a r t yr . $11 $0 2 11 $11 5 1) $1) .. $2
Llept-xiation e;t iaate .................... 9 0 $0 40 9 11 $0 5 1) 41) . -r t p .. t3t-d.. p lant anj iwrovements va l?e e t d yr. $0 $11 $0 B 11 $1) $0 . 50 . t !., .-.
.............. T~t ,a l d&t a t shark o f year $1) S S 3 $611$39 .a9319 ($45106) iS71111)) ($:6:>5?4) ................ TotaI &bt ai; ad of yeat- $53 ~ 5 V X SiIE39 99319 (H.51063 ($47100) (/140544) ( r l % 4 3 ! ,-. --------------------------------------------------------------------------------------------------------------------------
tkt * ; r t h a t ~ t a r t year .................. %,51&2 4E51Y4 W X 2 $678396 $727559 $783150 PA3155 $YO:?00 ................. Nst w.>rth a t end of year $6.SS@l4 ~~SYA2 f67W96 $727559 $7%3150 bt'd3155 $494400 $?61;f2!
:335h f l o ~ iroa c a t t l e trading ............ $161677 4165336 41665€4 Capik ! d i s p x a l s ........................ $0 $0 9.0 h s i r y incme ............................ $0 211 211
;iar-iabls ad fixed c,jsi; .............,... 9Y270 $?Sf)?L27I) S 2 7 0 C a p i t i l a W i t i a ~ s ........................ $0 $0 $0 Faai ly !ivir;g e:ipmies ................... Ib150l1~1 $151130 21500f1 ia:cati~:a paid on frevi~x~.; year'.; irx~,ae . . 2 11 $0 $0
-?kt ca;h f l ~ ~ rravai!able for- d&t = ~ v i c e . $5+4116 1 $53294 ------------------------------------------------------------------------ Lat;.j p!ar,t .I iaprovmmts v a l r s ;i;art yr. S 11 10 50
.................... k ~ r - e r i a t i o n e i t i a a t e §U $0 20 Land, p l a t ad irepro.ieaw\t.s value wj yr. $ 0 $0 $0 ------------------------------------------------------------------------ -
.............. iota! &bt a t stsr-t of yeat- ($1%029) ($258747) ($:?247Z3) - 7 ~ t ; a i dek,t 31; en3 nf year ................ iE2%74?) ($3247331 ( I 3 : X X )
----___----__----------------------------------------------------------- .'.kt- w;lr-t%i 2'; i t a r t yew .................. $5'67<;21 ,$!031953 411!311030 ;;<; w..-Ll. ...... a t s_r\,i of ysar ................. $10:315? '41101)0:31) 911L5X

-1 , ; . A % hi!, . TAELE 10 .---------------------
Ters Loan; . . . . . . . . . . . . . . . . . . . . . . . . . . . . . . . . .
Ters ~-MI: 1 ... ... . ... ?era loat] 2 . .. .. ..... Term ! e m 3 .......... . . . . . . . . . . . . . . . . . . . . . .
i o ta ; k r - ; 1 11x1; .. . ..
~ l j v ~ ~ - ~ ~ t - a f k / ~ t o z k f i rn . Cast, ;:;t-p!~xs_; . . . . . . . . . . . . . . . . . . . . . . . . . . . . .
!let t;3lancs; a l l l m s . . . . . . . . . . . . . . . . . . . . . .
. . . . . . . . . . . . . . . . . . . . . . . . . . . . . . . . . . . . .
1993 1993 1993 1993 Opemnq Repayment interest Interpi t Balance !n:l. Int. Rat&- ~.fi&x~t . . . . . . . . . . . . . . . . . . . . . . . . . . . . . . . . . . . . .
$0 9 0 0. OOX 5 11 SO S 1) 0. O O X 6 1)
$0 S I) 11.00% J 0 . . . . . . . . . . . . . . . . . . . . . . . . . . . . . . . . . . . . .
so SO I I) -------------------------------------
(lr~:r%azel s 1) 5767 i 1 . S X 3% 5 0 5 0 2.5tIX $0
. . . . . . . . . . . . . . . . . . . . . . . . . . . . . . . . . . . . . $0 M m QFA
-------------------------------------

=
Tilrm Lmn; ........... . . . . . . . . . . . . . . . . . . . . . .
ier-a 11xn L . . . . . .. . . . Ye1-4 10dll 2 . . . . . . . . . . Tern i s m 3 .... . . .... - - - - - - - - - - - - - - - - - - - - - -
Total tsr.o 11m1-; . . . . . . . . . . . . . . . . . . . . . . . . . . .
! l ve rd ra f t~s to rk . f i:-a . Cash s ~ r r p l u i s s . . . . . . . -.--------------------
Xct baiarcs-; a i 1 icm; - - - - - - - - - - - - - - - - - - - - - -
1'3% 1995 19% 1335 O P M L ~ ~ . ... Repyaten t Inter& interest B3lawe Incl . Int. Rate b m t . . . . . . . . . . . . . . . . . . . . . . . . . . . . . . . . . . . . .
$0 $0 11. OO:( 5 0 50 SO 0. 110X $0 $11 9 0 11. Oo:( f O
. . . . . . . . . . . . . . . . . . . . . . . . . . . . . . . . . . . . .
0.0 8 I) 9 0 -------------------------------------
(increase) 9354E8 213159 1 1 . $6152
$0 I 0 2.5tIX $1) . . . . . . . . . . . . . . . . . . . . . . . . . . . . . . . . . . . . . 55'54% na na $6152
- - - - - - - - - - - - * - - - -__- - - - - - - - - - - - - - - - - -
1996 1996 1996 1 9 6 %)~ening Repayment, Inter-?.st Inter.&. Balance 11b:I. Ink. Rate holmt . . . . . . . . . . . . . . . . . . . . . . . . . . . . . . . . . . . . .
5.0 5 I) 11 . I) 1l:l S 0 S 1) e I! 1) . 11 ox S !! $11 P 1) 0 . 1) c:< t o
. . . . . . . . . . . . . . . . . . . . . . . . . . . . . . . . . . . . .

. -
ier-la Loans . .... . . . .. .
;?I-m ioali : . . . . . . . ... ;st-a loall 2 . . . . . . . . . . r ~ 1 - m loan -3 . . . . . . . . . . rota1 tet-a lsjd~; . . . . . . . . . . . . . . . . . . . . . . . . . . .
,!-k ,=. , k l a n ~ ~ s a l l IIXIIZ - - - - - - - - - - - - - - - - - - - - - -
1 997 1997 1997 1 9 7 19% 13% 1J9G 1 iketllng Repaya& Intsrsst I~%I-est, - - r k s u t ~ - Rvaywnt In te rs t -Interest Balance I t ~ l . Int. Rate A m t Balat~e In:l.Int,. Rate &,~134mt.

Tet-ra Loan; . .. . .. .. ... . . . . . . . . . . . . . . . . . . . . . .
:el-~ lad!> 1 . . . . . . . . . . i x m I ~ a n Z . ... ... ... is rx I,:.arl 3 . . . . . . . . . . . . . . . . . . . . . . . . . . . . . . . .
Tots! tern lea;; . . . . . - - - - - - - - - - - - - - - - - - - - - -
O'i?rd1-~ft/ika2~i: i i rn . !;a;h ;uc-p i l ~ ~ . . . . . . . . . . . . . . . . . . . . . . . . . . . . .
!kt bala~vze; a!. i 1can; - - - - - - - - - - - - - - - - - - - - - -
- - - - - - - - - - - - - - - - - - - - - - - - - - - - - - - - - - - - - 1999 1999 1939 1999
Qxnlrw Rwaywit Ititerest Inter-est Galan_u~~*l.Int: Rate &o~mt-- - - - - - - - - - - - + - - - - - - - - - - - - - - - - - - - - - - - - -
s I) $0 I). 110% 9 1) s 11 40 11. 1111% $0 e I) $0 0. 4 11
. . . . . . . . . . . . . . . . . . . . . . . . . . . . . . . . . . . . . PI) S 0 9 0
------------------------------------- i I~>:reas+l
50 $0 11.25: 8 1) 4C71CO $501164 2.51]:< %3:23
------------------------------------- (ZF;?i!)O) IM IM (5343) -------------------------------------
. . . . . . . . . . . . . . . . . . . . . . . . . . . . . . . . . . . . . 20111) 2000 20011 200ll
~ h e n i w Repayment Interezt. Interest Bala~~aInc l . In t , - - Rate AkP56~1t . . . . . . . . . . . . . . . . . . . . . . . . . . . . . . . . . . . . .
$11 $0 0 . OIIX eo 40 5 0 11. I ) O X 5 1) $rj 50 I). I ~ I ) X . $1)
. . . . . . . . . . . . . . . . . . . . . . . . . . . . . . . . . . . . . $1) E 1) $0
. . . . . . . . . . . . . . . . . . . . . . . . . . . . . . . . . . . . . lt\:reai~)
fl) 511 11.25% 6 11 5140594 552606 >.50:( Sh2310 -------------------------------------
($140594 I na na (SE30)

~i:i\n?lS TABLE 1 :) - - - - - - - - - - - - - - - - - - - - - - - - - - - - - - - - - - - - - - - - - - - - - - - - - - - - - - - - - - -
2011 1 2011 1 Z O O 1 200 1 Openir~-f iwaywit , . I n t e r e s t I n t e r e s t
Term Lbxn; . . . . . . . . . . . Ealat>:il In~l. 111t. Rate k ~ m t
Ter-m loan 1 . ... . .. . . . g. 1) 60 0.001 SO [sf-a loat: t . ........ . E 1) 5 0 0.00X f 0 TGI-m ioan 3 ......... . 5 i) 5 11 11. 0 O X P 1)
Net balances a l l loa-I; !91980293 na M ($f.f:j'ilI
- - - - - - - - - - - - - - - - - - - - - - - - - - - - - - - - - - - - - 2002 2002 2002 201):
Openit- R e p a y m t I n k r e s t In t e re s t BaIarxe 11x1. In t . Rate b ~ ~ l t . . . . . . . . . . . . . . . . . . . . . . . . . . . . . . . . . . . . .
5 1) so 0. orlx $0 St! I 0 0.~10X I I! 9 :I '1 0 1). 1111:< Q i)
. . . . . . . . . . . . . . . . . . . . . . . . . . . . . . . . . . . . .
P lj P 0 '1 :I . . . . . . . . . . . . . . . . . . . . . . . . . . . . . . . . . . . . .

ie1-g l-x-irl I .......... T+r-; :oan 2 .......... i+!.> :.:-ill -; .......... - - - - - . - - - - - - - - - - - - - - - -
Tot?! eel-~, ioar~; .....
tkt balarcsz a l l Isit>; - - - - - - - - - - - - - - - - - - - - - -
- - - - - - - - - - - - - - - - - - - - - - - - - - - - - - - - - - - - - 2 0 0 : ~ 210.3 2003 ~ o n 2
Opmlnq Rspaymt; Inter&, I n t s r ~ t Ea1ar-c. 11x1. In t . Rate Arsolmf;

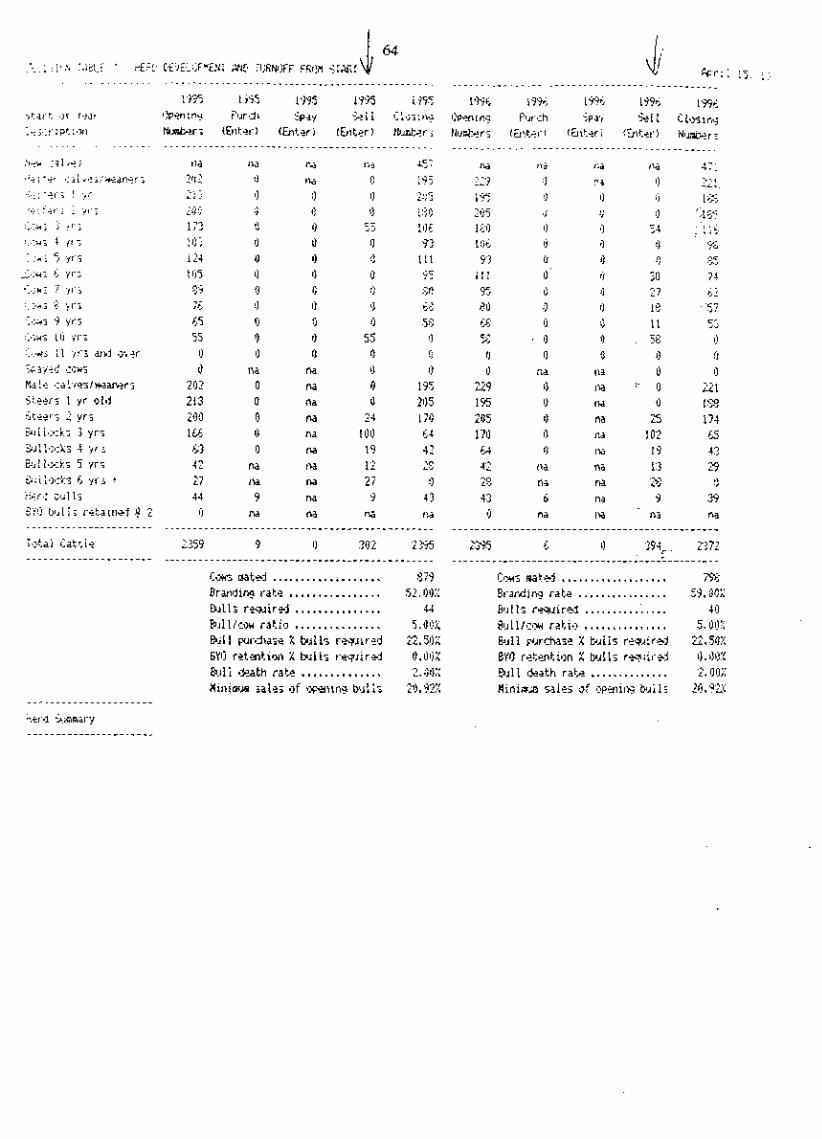
: J ~ W t:al'++i Ild
; I > . - . , -, T+!. 4 1 i i i?.i;'&dn+f5 21j 2 . . - ..- . ,-.:?I.: [ :,r -, : -> L L 2
a + ; :el.: , - : .{,.; 21j!>
, - - 3 .,..+, : ; > 1. 2 1 72 !:,?d: 4 : 11:; :I.:": 5 ? I - 5 1 N
_L.;+.,: FJ yl-5 LljS <-.?M: . - 7 11-5 cj :-.:;,+: 5 ?I-2 -7- 1.5
Tc;;rr; 3 yys F.5 !:,;a5 ltj y y 5 55 :,.;*; : 1 y r - i a ~ > j .y,er- 0 .cgayed ;:I;w'~ 0 Fki Le ~calqfei/wawr-, 2 0 2 Skeet-; 1 yr old 213 St+.rr-s 2 vr; 200 3.~1 11xkz :I yrs 1u 3~l:ot-k; 4 yr: GI &.I[ lock= 5 yr; 42 Biilock; 6 yr.5 + 27 , . . xe:-d a.il 15 44
SY!j bul!; retained @ 'I 0
C m m a t ~ d ................... $7'3 ................ Branding rate S2,f)l)X
hJlI.5 r e w i r d ............... 44 Fr~ll/mw ratio ............... .5.111l:C %ill w d ~ a = e X bulls rw~i l -ed .Z.S11X 6 M retention X bills r e q ~ i r e j 0.1)liX
.............. Br.11 i death r a k 3,. i11)X W i n i a t r s i a L e i ~ ~ f ~ ~ > i n ~ b ~ ~ l l z 2!1.?2%
Clxi5 wat9j ................... AX BI-atding rate ................ 53.GrIX ENJ1I.i r e w i r d ......... .; ..... 415 Bull/rwrat,i~> ............... S.l)tl:~; B~11 p ~ r h i e X tv~i15 r e y ~ i r d 22..59:1 EYO retenkion X bull; rq . i i~ -%j I). 013X
.............. B ~ l l death rat2 2.00i: W i n i m a ~ l e s a f o p ~ l i t ~ b ~ l l s 211.?Z

:hi *I i l ' / . ? i
t!* r fer- 813 l~+e;, '~aet.i :ie: f a - i 1 f l+i 7el-Z l(1.i I;~>WZ j ,yt.:
I:~:*s 4 yr; ;:.;+,; 5 yt-3
41,345 g, y1-; - . i;.,.21; 7 yr-i !:8yd3 : ( l - i
; l t ;~z 9 yrz Ccwi 10 y r i 1166 1 ! yr5 dr~d over spayed CW5
Wale ralvez/ieawr; S%.lri 1 yr ald Sk*t.i 2 yt- i E u ~ 1841k:i 3 'jr'i Bu 1 l ~ x k s 4 yt-i kill~~k: 5 yri 2 u l l ~ c k . i b yr.5 + Her-d bill5 2Y11 bulls retained @ 2 . . . . . . . . . . . . . . . . . . . . . .
. . . . . . . . . . . . . . . . . . . . . . . . . . . . . . . . . . . . . . . . . . . . . . . 1Y?Q 1598 19-34 1.. I qqp ., 199$
Opeirncj Furrh kay ' 2 1 ; L ~ Q $ I ! I ~ # A e r ; <Enter! (E.nts_r~ ( r i i ta - ! lh~ber i . . . . . . . . . . . . . . . . . . . . . . . . . . . . . . . . . . . . . . . . . . . . . . .
!!A ~a ni !ii 5 l ? -c ' L ~ I J :j n? IJ 212 2 7 ~j 11 ! j 2 ~ 4
212 0 !j '; 196 -. ! 73 0 1) , :J : 55
121 0 0 0 i l l 106 1) 0 1 9F; 63 rj 0 0 {..2 62 !j ~j !j L? ', '. ti 0 0 0 .: ,- - .
5 7 I! 0 . I! . 7 a, 7
53 -,. 0 !j 53 0 1) 11 11 0 !]
0 ni 1x3 !I 0 3 0 0 na :" 0 242 227 11 M 0 2i9 213 r! na 26 1El 160 0 na 9; 62 67 11 t ~ a 21) 45 44 ni na 13 3 I) 23 t!a t~ 29 p 50 dJ 10 rri u S :?9 0 na M na ria
2327 10 0 31;. .*,q.-, y
' - L..>L
. . . . . . . . . . . . . . . . . . . . . . . . . . . . . . . . . . . . . . . . . . . . . . . &24; mat& ................... Brancli~g rate ................ B ~ l l s r w i r d ............... B A ~ ~ / ~ I I M ratio ............... B.41 purchase :( b u l l s r w ~ i r e d EYO retentitxi X brrll.; req~ircd
.............. B ~ l l &ath rate Hinim~ sale: .;of awning tall:
................... 770 CWS m t d 65. 611:; Era-ding rate ................
:39 Eulls r w ~ i r e d ............... 5.tl Xi ~ ~ A ~ ~ / E ~ J H ratio ...............
2-2.51jx P.rl! p~rdMlje :C b~lllj requird 0.01';% BY0 rebntiot~ :i bulls r ~ ~ i l - e d 2. tl!!:( D A ! ~ &at11 t-ate ..............
.-, I] . y::: Miniaim 5ale3; of m i t w bulls ---------------------- Herd Suzmary ----------------------

...
.)_;.[ ;;:]:c I,\fiLE ,? - t i F D tE'/ELCFUE:I: dt!b F1;Fp(i:1fF ?i)~:# 5TClpr k r i i :5, i.! ................................................................................................................... -
i '5% l '.V9 1999 1959 1999 Lf)1)0 L1lld blrlll 211110 L0l)l) - 5t.it.t .)f Ysar +w, in? b ~ t ' . ~ h $pay 1 1 Cloring Ops11ny P~rrh ' 5pa.y Sel: Cior;iw La+z~r :pk L O J I ~ H.i;csri (Etltrr-1 (Ent~r ) (Enter) ~Iumbr; Mrntxr;. (Entsrj iEt;tc?r-1 E k b T 3 . _ _ _ _ ~ ~ ~ ~ ~ _ . ~ ~ ~ ~ ~ ~ ~ ~ ~ . . . . . . . . . . . . . . . . . . . . . . . . . . . . . . . . . . . . . . . . . . _ _ _ _ _ _ _ _ _ _ _ - _ _ _ _ _ _ - - - - - - - - - - - - - - - - - - - - - - - - - - - - -
:(SH .Id I 'i.? i
ii? i t e r ,:a i.re;iweawr; +; f ? r - i 1 yt.
%lf31.; : Y r S
i::;~: .; .f 1. ;
1::xi 4 yl-;
!;,:.*i 5 yt-5
;,a.rc; ;, yri {:ow; 7 yr-i 16+7,,: : ) I - ;
!;~zw; 9 y1.3
i:;>kqz 11> ;{I-5 11 yr; a~d over-
cow; Sale calve;/wamr; L;tea-5 1 yr old St*-r< 2 ;lp: E ~ J 1 ! l>~ki 3 YI-5
f3.1 L l d i i 4 y~
Biiiocki 5 yrs 3.iilo:ks 6 yr; t
k r d bull.; BY11 b~l!; riltaimai 6 2 . . . . . . . . . . . . . . . . . . . . . . Tots1 Cattlr
r;a r~a IM 11-3 522 11a rid na 112 2& 26 8 0 M 1) 250 26 ! na J 25:. :,-, . ..: - 11 11 1) 233 251) 11 a1 2 S ! -. I -. ... , 9 0 0 LU; Pi zJ 11 1) 9 .-;.;14 i. .
1% 11 0 98 Y 11 202 0 0 95 : '32 55 0 11 11 87 90 6 0 r; ~3
: I ! 1) 1) 0 102 $7 0 0 0 0 11 ., , 99 I) o 0 9 1112 6 1) 94 ; 7 , , 0 0 11 58 9 0 0 !j 0 3 3 . - '2,
t i il 1 1) 57 .% 0 !j O .:" q? r).,
57 0 0 0 5.2 5 7 0 12 . 0 c 2 ..-, - ? 3 - 2 0 0 5.3 11 .5Ci -.- 0 0 5.3 O
1) 0 0 1) 1) 0 0 11 i] 13
11 IM M 0 0 1 rd na ' !I 0 26:) 0 na 0 250 26 1 11 na :" I) 252 242 0 na 0 233 '250 0 na 11 242 2i9 0 1~ 26 186 233 0 na -" .?o 1% !El 0 na 1% 7!! 1% 0 na 112 ?2 62 0 na le 42 70 0 na 21 47 4.5 r ~ i na 14 3 1 42 na M 12 '23 '3 I] na na 30 1) 3 1 na na .?a -2 1 0 .x .a, 9 na 8 39 3 10 na 8 4 11
0 na re na r,a 0 M na I:a t:a - - - - - - - - - - - - - - - - - - - - - - - - - - - - - - - - - - - - - - - - - --_-_------_-----------------------------------
---:-? ~4.~2- 9 0 358 259.5 3% 1 1) 0 ::C,!) 2(@-,
4 . - - - - - - - - - - - - - - - - - - - - - - - - - - - - - - - - - - - - - - - - - ---------------------.-----------'----=----------
................... Zam a a t 4 ................... 803 $24 Cl;m a a t d 6rabjinq rate .. , ............. W.OII:~ Braxi in~ra% ................ 65.Ol)X BAI!; rwiirei! ..........,.... 411 %ill5 req~ired ......... ; ...... 4 1 Eull/rowratia ............... 5.001 Eull/cow ratio ................ 5. 110X 1 p a b 1 I 22.50:! 1 i r e b r U.5CX WO r~tention :C bull; required 0. OlX BY0 retmti~sn :C b~ll.; reqiired Q.0CX 3.11l &ath rate .............. 2.00X 2ull death rate .......... , , .. 2, I]!>%
Niniw,n ;alss o f m i n q bills 2lIsYZ< Mit1imj~\sal6or '1yenir;9buli ; 20 .9Z

2 . . . . . . , :f,Z 5 :.;":'I m ' f : YE!( i ,;;)[$ fl-fi!&;FF j7i;ja j r , q T . . . . . , ,,.:4 . :d-- . . . _ a _i.,
....................................................................................................................
3011 1 200 1 200 1 200! i l ) l ) ! 21102 ;!-!I) ' -;t . . . . ,I - :01!2 ~i.11) 2 . .
-:.til-?, O F ' tear :;Feniry F\uraI11 $ay %i 1 i k ~ i ~ i ~ Furrt~ Scav $1 l ~::o.si,q - .. - r . ... .... -.IA.-. LC'. . c 3 s t i iEtltdr.) iEnta-I iEntsr1 kiber; E k d r ; (inter) ( t ~ t ~ r ) i t i t e t - 1 ~ ; n ~ r ; _ _ _ _ _ _ _ _ _ - - - - - - - _ - - - - - - - - - - - - - - - - - - - - - - - - - - - - - - - - - - - - - - - - - - - - - _ _ _ _ _ _ _ _ _ _ _ _ _ _ _ _ _ _ _ - - - - - - - - - - - - - - - - - - - - - - - - - - - - ;{en CJ 1'4.3: t : i t~a na ~a 5.54 n~ na ~ ) a IIJ
;'-r i f+r- #:a 1 ve;/warer; ?&>; 0 r,a .-CP L.- 2 277 9 M ij 267. . - . I - : ' -
<- , : . f f -c- > L,i 0 1) 1) 2 1 3 -5% 9 1) I 24.3 ".: f 5 _ 1 - { ; ',Ti ;- :, 4 L I !I 0 I
- - , .? , . ..-- -. ' .; Ld. IJ 0 ij ...%.,. >
C i 2
, .. - ...+: j ;F; -. j ~ 4 0 0 .+ , , : L O - - - I' 'I 11 -A.- C 1 4: 6.3 .:,:i: .: . I , - ; 9 8 11 1) !j 3 11 I l l ) I) 0 11 101 ;:.:,.,s 5 yt-; .;-> .;., 1) 0 1) 76 30 :j 4 !I 37 .>,
. :-*: C > T i 5 !; r] I:, 8 74 ib !) . 1) !> -. -.
i :j :;,:.++; : yt-; ?? 0 rj 0 53 ?4 1) 11 d t:; . . z;.:~; s y l - i 53 11 11 0 76 ,-, 9 - I 0 I j 1) :$ij
.->.r; Y 3 1 - i d 2 0 1) 1) 49 76 1) 1) . 0 7!: :.:a: !I1 yr: c; , I! 0 S 49 -.t 11 11 ; 49 0 - - - . . .
1:~;4; 11 yr; a1d owl- 11 0 0 0 0 11 0 3 0 0 - - - , . I+-dj'?d 11 IM M 0 0 0 IU na 0 0 .,.:- -
5 cal~%/iea1er; 269 0 na 0 5 8 277 0 na - 0 267 Sksjr; 1 yr old 2-52 I) na 0 ? - , 140 258 11 na 0 243 <t*er; 2 yrz 242 0 ra 29 20.5 242 il na 29 206 €41 iocki 3 yrs 19s 0 na 119 76 205 ", na 123 -,.-
I?
51i l * > ~ k i 4 yrs -- I) I i na 22 49 76 11 na iy 52
?iii locks 5 yr; 4 7 IM na 14 .X 49 M 1% 15 rj
3~Ii.41ki 6 yr; + 3; IU na 3; 0 32 n3 n2 32 0 +!-d b11115 4 !) 11 M E' 42 42 3 fI-3 4 j !
?'I!: bull; retaiwd $ 2 0 na na r,a !:a 1) 113 na na 11.3
---------------------- - - - - - - - - - - - - - - - - - - - - - - - - - - - - - - - - - - - - - - - - - - - ............................................... T.;t.si !:atti* -.A*, ? c .< 11 I] :243 2743 274:: 9 I) f26. 2747
r % - - - - - - - - - - - - - - - - - - - - - - - - - - - - - - - - - - - - - - - - - - - - - - - - - - - - - - - - - - - - - - ---------------------------------------:---------
G:M; ~a t+d .. , ................ ~ 3 2 CCii; & ~ t & .,............. 83 1 .... ................ Brading ra te ................ L5.r)O'X E~31.+dil~ rate SS.OBX
............ . B~l!z r.*f~ired ............... 43 B~ll; rewired .. .,. Q
B.il l/o,w ra t i o ............... 5.05:( Eull/c~~w ratio ................ 5.r)Xi E l r a e l I 22.50Z Euli p.ir15aze X bulls r w ~ i r e j .2.511X BY0 r e f ~ k i m Z bulls r e q ~ i r d 2rf0.00:( 6 Y O r s t i r ? i ; i a 1 X b ~ ~ l l = r ~ ~ i r a j g.llll:<
.............. Bull death rate ... , .......... 2. OOX Bl~l l ~Ieat11 rate Z.OIlK i4inieum x l e = of o i i m b~l l ; 211.92 I Y i n i r r ~ .iaie= of t;c\mir,q bil ls 213.92X
15. I?;
j
, 1 1
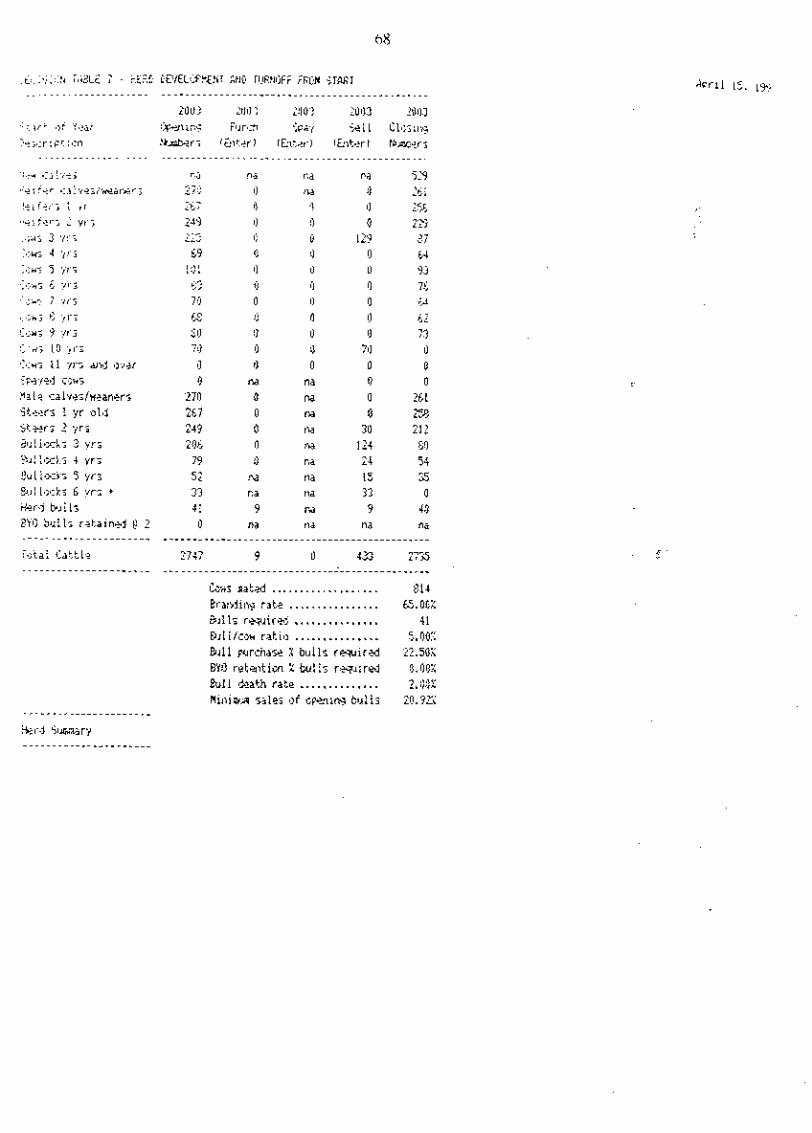
. . . . -.t:.:ji::!c iAECE 7 - ?E2$ EEiELCFYL!II AHB FI!R!ItjFF FRrjN
- - - - - - - - - - - - - - - - - - - - - - - - * - - - - - - - - - - - - - - - - - - - - - -
2002 210 ; 2110:3 20113 -2003 .i.'lr' .)f Year I~+I I ng ?urch I-:~ay % i I Cl~:<ity :a+:h:r- :#;n !C&.tri !G~t.tr) (Ei~ksr-) !biter-) Hms_r; ....................................................................
" . ,<* o - ~ : ( - , na n-i r;a na 529 . . - n... .<e 1 r+r c~! .dez;warer i hi!: 1) IM 1) 26 ( .!+if+{-; ; .,r ~ 6 , 7 . - 1) !I 1) 258 - i + i f+y - , yl-; 243 1) !) 0 -.-"-. L L ~
.,.-< :.;ic-, 3 - j r s LL., 1) 0 129 $7 :ow; 4 ~ r ' : 89 0 0 0 64 :<+I; 5 71.5 !:I i 0 d 0 33
6 y1.z - . ~3 11 0 0 76 7 ./r-; 79 0 1) 1) 6 4
l. .&; :it-z 68 tj 0 11 62 !:u;w; 3 :/1--5 3 1) 1) 0 I1 73 !;.:.w; 10 :i1-s 7 1) 1) !I 7 1) 0 ':ow: 11 ?I-5 ;llhj 13'411- 8 1) 0 0 0 $ . ~ ~ i e d c o ~ ; 11 na na 0 0 #ale caivei/weaners 270 I) na 0 261 Steer; I yr old 267 0 M 0 FS3 Stiwr; 2 yrs 249 0 IM 30 CI t l ; -, Sl i ! l*~ki 2 ~ r ; ? ' LO b 0 na 124 $1)
.31:i1xk:5 4 yrs 79 11 na 24 54 &ul locks 5 yr; 52 na na I5 35 8ullock; 6 yr; + 33 r,a na 33 0 #er~j b ~ i l ; 4 L 9 na 9 40 2Yi) b?i!li r e t a i n 4 $ 2 0 na na na na ---------------------- ............................................... T.)ta! C a t t l e 2747 3 0 $3 27.35 - - - - - - - - - - - - - - - - - - - - -_ -----------------------------------------------
Cw; a a t d ................... 814 ................ Era t> i i t . ~ rat..- €3. 00:i
Erllli rewired . .. ............. 4 1 DAI i/cou ra t io ............... 5.01lX B l ~ l l p ~ r & a ~ : I b u l l i r ~ i r k J . "2.50X BYO t-steltion X bu!!; required 11.00:i
.............. Eull deakh r a t s ? . 9 Q K flitlims sile; o f cpming bull= 21?.'32'~

+ t . i I !?. I.?: . : i t - I I I ; e l - r I.011 R . t v ~ i 1.02 hae: 3yr1aaa h L e ~ i . AI.T~I~xI~~I\~;. A->t: i 0 1 . i :t-+:+ Z
Date: LSi4;34 is.,l.;e~J 3y !d.E.H~l.wr;, i s . ? . : . . i.>ml;vil!+. Qld. QCX [ :
... - - ' : I . ; : : izar sn!; . . . . . :<~..me! 1993 ,,?% '5 8 - '/&:!;%- 3i5 Fii&fi I:!)sr",
::ot+ 3: :.0 !-nt :r,b:!r~je tjebt, ;;-rq41c?. ;nt-._rs-zt. f a r 1 . j i : , t ; t ~ ; 3 i l ~ ~ a n : ~ , or &pt-xiat ia~ in tlxzz t,aS i s . .:.;z;i i ~ p i - j t.0 itart, ~f ~ ~ i k f i aft,+t. add~n.; :;; p.;r.:hi+i arbj taking ~ t , ;a13 and i?aj'lllJi. '&if 5;13jr+d OH; at-s added t o ;payild con q-oc~p.
. :!. i :a;+ I ~ ~ > : ~ ~ + ; ~ + , : 393 1??1 ! 39.5 1536 1337 !?92 i 8 E 9 . 2111111 c.11 ,I I L.:., L 3 2 2 -. .: !> !? . : . . . . . . . . . . . . . . . . . . . . . . . . . . . . . . . . . . .
:+,. a+Zrt2r ! s;pe;,:: 59.41) 521).:32 $20.?2 c0..32 $ 2 0 . : ~ 520.32 z:rl .32 6211. :32 23:. ~2 s:!) .32 $2:;. .I:: . . : :! ::elfe!. i ~2;r $i',,62 316.52 $.!2,27 $12.27 $12.27 $12'27 $:2.?7 $12.27 $12.27 5.:2.?? t . - - a q -
.-i;.'/
?.I. ;,%if+r 2 years j 519,.3) $l5.1)2 $15.02 $tfj.1)2 615.02 5:5.1)2 $15.01 $15."' , 5;5.!)2 f;?,:);
;;_I. ,:,:w .2 :ir; p I : i ~ 56.81 $24.78 $18.42 218.12 $18.42 5iS.42 518;32 118.42 $is. 4; 515.42 r:.;. 42 ;-r :~;yetj CGH f:) . i f~) ff].l)l) ! ) I ) I ) $ ) t 512.01) $!>.GI] f1!.0!? $l].!?r] $!).!?ij $::,!)I;
;;_I- i t s e r I year 5 6 . c 9i6.52 $!1.27 $:2.27 $12.27 512.2: SL2.27 $12.27 112.27 512.27 $ 1 ~ , 2 7 - . +r ocrllocir 2 year5 fi.62 $16.52 $12.17 $12.27 3i2.27 512.27 $12.27 $12.27 f l2 .27 512.27 $11.27
blAll -1. - ~OLF. .> YCX; , , 916.52 $12.27 $12.27. 612.27 $12.27 $12.27 $12.27 912.17 312.27 212.27 F?! S:. i l io~k 4 .j;.ar-5 , t i $ 2 , $16.52 $12.27 $12.27 $12.27 $12.27 $12.27 $12.27 $12.27 $ 1 2 . 3 Si2.27 ?+;- kq:lot-b: 5 yr; t $F,,c.= .$:6,52 $12.27 $12.27 fi2.27 $12.27 $;2,27 $12.27 $12,27 512.27 $?.'-?- .-. -i .:,<I. !-,et-;i bt41 1 , s4.7F; $!e.42 $18.42 $ 4 fiS.42 5 . 4 518.42 518.42 I18.U fiY.42 ___________________----------------------------------------------------------------------------------------------------------------- ; . I T . ~ : \$I: for herd . . . . Jl$~?I)fj $ 4 : $3605 $32761 533052 $34.504 53.5430 5.6277 %7:!i3 4375.32 $37255
_----------------_------------------------------------------------------------------------------------------------------------------ ,: i :i +j 1;;s t , ~ 1993 1 S"?: 1 9 5 1996 1'393 !'NC 1339 21)00 2110 1 21)1j2 ;I)!):; _--_-_-----------_---------------------------------------------------------------------------------------------&~------------------ - tior;..- i2..d 2t1:. $0 ,4 I) $0 $0 $0 $3 $0 9 0 9 0 $11 9 :) ; z . ~ ~ ; ; :I& i,Ia:ti 5 [I 9 1) $0 3 I) $0 ro 5 1) i I) $0 5 o 5 I! ;;15;3;.Ja.s 4 1) $11 $0 $.I) $11 9 0 $0 I I: . $:j fij 2 !I a 2 2 ,-.>= &-=#-- fl) $11 I t ) $0 $0 3 11 5 1) $11 2 !) 5 81 $0 ::it-t,ae $11 $ 1) $0 $0 9 :I $0 50 $I) $!j S !) $3 %~;kj_rifi.; c;;ntr;ct; s 1) $11 $0 511 $11 $11 $10 $13 5 I! $0 s!! !,.-. . .. ,=...t-31-?:4 90 21) 5 11 40 $11 eo $11 BI) 3 0 4 11 5:) I:-? ;gak.im 5 I? f 1) I 0 s 11 $1) 4 0 S t 50 50 5 1) f!)
-21.; r,l-zfi;pjrh 5 1) 9 11 90 5 1) 5.11 I 11 5.0 $9 $1) 80 $0 =:-:,i*ct laje ,:!ot,hir:s $I2 6 1) $0 $0 3 1) $0 fi? ) 1) $9 11j 50
~ ~ ~ i t - ~ i ~ a i r i t ~ ~ ~ ~ $0 $0 I 0 20 4.0 40 $0 $0 J 9 $0 < _ t n +ya! t i ~ ; 511 fO $11 $1) f 1) $9 f O $0 5 !I 5 12 -C s i> .-,
i i . jd ie1-y 50 4.0 $0 9 1) I I! 50 9 1) $0 $:I .- a 11 ... .,I, :<I
$11 $0 93 $0 50 50 5 I! 50 $:j $0 * -. *,. r..:
8 i s &:ra.u;?,at:t f s i I !I $3 0 !I 90 fr) 9 0 .-IU 50 cli <,, I!] : .; :, .. . .:~:i:; < ~~3-i: I !I 30 $11 I I! 3 1) 5 0 O 1; 5 I? $0 .* I< : . > >:
r .>
:c T 2 1 - i - 8 1) $0 90 $0 . $1) $I? 5 5 1) f!j 5 ;) 3:; 7 i ~ ; j ~ - a ~ ~ ~ 5 1) f 0 $0 $1) 5 1) $0 5 !) i!) ,$ij 5:) >:I
- .- i...t..;,:r- ;t, i 91;: 5 0 fO $0 $0 5 1) 2 1) 5 1) 30 $11 $!j 5;;
-3 1 s~hi;ne $1) $ ? $ 1) $1) $0 f !I f 11 f 1) $!j 5 !I 2 I> - :,
v~rk:cl-; t:~;w $0 $0 $0 $9 5.1) $0 $4 3 I! $!.i.. < t .l .: - x ... -
Xi: , ~ h X g + i 3 11 $1) 3 I) $ i! .6 ;? $0 3 !I 19 f o $3 J ;. , .: ->.: ~aa ~ n t a ~ n r e 5 1) 5 1) 5. 11 511 $0 S 1) 511 3.0 5 ij 30 5 .::
4 - . ,I-t 12.2 5 1) 50 5 11 $0 ":I I 1) 5 $3 9) i ;) *:? . .. C 'l
$1) $1) $8 0-1: b 1) $9 $0 $1) 3 0 31) f!j
fcj.5:)1)1] I ) $.551)01) f5.51)flij fi51)1)1) . : ) I ) I ) ) ) I I ) $55001: S5?:I:)l? $z.?l!l.?c $0 $0 $1) $0 I;) $1) 50 $0 9 0 5 :; $ Cf

;:.:. ..?&: ,',;I;LL :I . .A;;! FL!jW REF(!FE LI1'ITEi;ES i .......................................................................................................................
1953 1994 1 9 5 1496 1997 1998 13% 2001) - A
$PC'" 1:3ii: f l c w trca .13t:i+ tri.jltlq ............ 3 $12: 134 1 I F1'3.531 S12I)I)N $13064 $~! : : f id !:&-.u.it.il 8 j : l i ~ r ~ ~ d ; i ........................ 2 1) 6 1) $0 2 1) Si: s 1) 5 0 s 1) :lhr;3~".+ r11.1oa.r ............................ 6 I J 5 1) I 0 5 1) $1) $1) 50 3 1)
:~ ! - ; ._b i+ and CS...-J , ,...elz .-:,= ---;- ..; I I 555:4C,4 $%A05 $8776L 6kX052 SE95{!4 I $.?i277 ................. 1 ; 3 ~ : r , ~ : .ic!dltl;;r,; ........................ f I! + 1) $11 5 (1. 5 I! 511 $0 ..; 3:; Fa- . ' . ................... .,iAl l i~~l>gI : ( ;+nZ+j 115G1)I) d!501)0 XL511i10 $'15000 515000 $151!0O $i.51)01) ;$15~01?
$1) $0 5.1) 5 11 $0 5 1) r,i:::r ; S ~ I ) paid 1:n ? r ? . f i ~ : s year ' 2 LI-XOGE . . 50 5 I? . . . . . . . . . . . . . . . . . . . . . . . . . . . . . . . . . . . . . . . . . . . . . . . . . . . . . . . . . . . . . . . . . . . . . . . . . . . . . . . . . . . . . . . . . . . . . . . . . . . . . . . . . . . . . . . . . . . . . . . . . . ? ; f , ; : ; , 7 3 $47590 a& )($:~?l + ~ t ) & : ~ ~ fl:!j;$ _ _ _ _ _ _ _ _ _ _ _ _ _ _ _ _ _ _ _ - - - - - - - - - - - - _--_-_-_-------- - - - - - - - - - - - - - - - - - - - - - - - - - - - - - - - - - - - - - - - - - - - - - - - - - - - - - - - - - - - - - - - - - - - - - - - - - -
d f . . -:I!:. p i i n t !i ~;&rs,;encr,i.i valr - itark y r . 50 92 S 0 5 11 5 11 $1) $1) :;" $1)
Ce~t-+.:iat~on e;ki=k .,..,............... 5 1) J I! 111 50 50 I . $0 $5 Laid, piant anJ : ~ i a ~ i & ~ g ~ t ~ value mj yr. 9 11 $9 $0 $0 - $11 30 , 51) 3 1; __ - -__ -_____ -______ - - - - - - - - - - - - - - - - - - - - - - - - - - * - - - - - - - - - - - - - - - - - - - - - - - - - - - - - - - - - - - - - - - - - - - - - - - - - - - - - - - - - - - - - - - - - - - - - - - - - - - -
T o t ~ ! ,J&f. a t st,-rrL, o f year .............. $0 $ 3 !SF,?%) i515616) (i647&1 (N9502) !.51179.5::(1 i$153:?3) f o t ~ i &bt, at; of p a r ................ S5.3 (§6'3261 1 . 5 1 (fi.17861 (B955'021 ( S l l B 3 ) ~$lrjn1):3) (SlEi9&5) __--_----_-_-----__------------------------------------------------------------------------------------------------------- Flet i+x-th a t s t a r t year .................. St.51222 $555894 $U5CJ1:3 S9'222 57320% $773333 9.9Ztl803 5874;3 Net wor-ti1 a t e;.i o f :,+ir ................. 56.55294 f&5.5618 %9'1:X2 S M 3 % $77333. 5'3'2OSr13 W74L5.5 9:32:E7 -_--__-----_--_____-------------------------------------------------------------------------------------------------------
200 1 20112 2003 -_-------_-_-____-_----------------------------------------------------- f:;sii flow from cn:at;t l.t t r ad i r~ ; ............ f :4!):72C, 51&31? SlB7:?32
...... !:aF: t a i di.iw:al; ................ ; 5r! S 0 10 L):a%?r y inbi;e\s_ ............................ $1) 5 0 fij --_-_-------------------------------------------------------------------
................. 5.92213 39'332 =.54 ........................ Cacitai adifibion; 5 1) 80 -, ti?
Faal i:; livit-lg e:cpanies ................... SL501111 515t)i31! Slfjl:!~!!) Ta;ci:~.;fa paid on pl .+$i i~l~i year'; it1s:njw .. $0 $G 4.g _ _ _ _ - - - - - _ - - - _ _ - _ - _ - - - - - - - - - - - - - - - - - - - - - - - - - ---------
~ i z h f l s ~ auai i d l e f.;r t j&t . rer , i ta . La1113 Y~557Efj "j1)077 _-----_-__------___----------------------------------------------------
Lan:, plant fL i r p r ~ * i r ? r + ~ va1w ;tart yr. $1: 60 6 I) 2;-1_~1-eciati:>n e;ti;rrab .................... fi) f I:! $9 iat-$2, platit; x,d i w r ~ u w - f i t ~ va!w et~i j 'jr. $1; $0 B !I
T*jtai ::ebt a t i t i t - t of e a t - .............. (S1873fW (=L51)2) (SW:344i Ttjt.;! debt at; =if .:i .js_dr ................ (F2255i32) (12.3341 !9358i561

7 1
Appendix 6 . 3 ,
I MAP 5: Existing Carrying Capacity B.y Property.
(Sorted by Propert yl
! Property Name f Existing Carrying Capacity AGLAIA ALCESTIS ANCILIA ARTEMIS ASTREA AURORA BALURGA BATTLE CAMP
151 2284 1818 2738 1019 2466 271 7 395
BEESBIKE 1 82 BERTIEHAUGH BIRTHDAY PLAINS BONNY GLEN BOYNTON EiRAMWELL BRANNIGHAN BRIDGE CREEK BROMLEY CALOOLA COEN RIVER DARNUM DENMAN DIGGERS CREEK DRUMDUFF DUNBAR ESCORT CREEK - GElKlE - GRESLEY HARKNESS
2489 1400 797 147 71 4 129 316 2282 550 6653 155
3099 15
3975 871 5 1830 2480 1381 2188
HELMSLEY HIGHBURY HOLROYD RIVER IMOOYA INGLEBY INGLELEY SOUTH JACK LAKES - .- - . - - KALPOWAR
-. -.... ..... KENDALL RIVER - -. - - - - - -. - . - - KlMBA -. . - - - .- . - . . - - KING JUNCTION - - - -- - . - KING RIVER - ...... ......... KOOLBURRA -- ................. KULATA - - - - - - - -. - - -. . - - LECONSFIELD - -- - - . - . - - LILY VALE - ....................... LOCHINVAR - .....-....-..... LOVEL - - _ _ _ _ _ . I _ . . _. - _. .- LYTHE - . ............. ,MAITLAND DOWNS
5156 6 5
6313 971 1 28'1 2088. 1976 -- --- - -
-- 2465 ... -- - ..............
540 1 ............ -- .. - 1407 .................
-- 2027 .... . -
1187 . - .. ---
391 9 ...... . . . . . . - 501 4' - -- - - - -. - -
- --- 2340 ... ..... 639 -- - -- - . . -
-- -- 4 10 . . . . . . . . . - 101 0 .....................
- - 3398 - -- .........-....... - 93

L
MlNKA MOREHEAD MOUNT GIBSON MOUNT JACK MOUNT MULGRAVE OLIVE VALE PALMERVILLE PEAK HILL PERINGA PICKERSGILL PINNACLES PORMPURAAW PRYDE RICHARDSON RUTLAND PLAINS SEFTON SHELBURNE SILVER PLAINS SOUTH WELL SPRINGVALE STAUNTON STRATHBURN STRATHLEVEN SUDLEY TUNGIN 1 VIOLETVALE
2628 895 171 63 7 1080 3878 504 2 8
5138 692 705
6987 9 7
1612 10170 121 3 668
41 15 2465 1855 108
5286 -
977 2833 81 1 1607
WATSON RIVER I 1909 WIPELLA 3205 WOLVERTON I 2571 WULPAN 5741 YAMBO I 21 27 YORK DOWNS 1 9450
TOTAL 1 182308 I
5

MAP 6: Po ten tia/ Carrying Capacity By Property (Sorted by Property)
f Property Name I Potential Carrying Capacity
AGLAIA ALCESTIS - ANCILIA ARTEMIS ASTREA AURORA BALURGA BATTLE CAMP BEESBIKE BERTIEHAUGH BIRTHDAY PLAINS
664 481 5 31 64 9174 222 1
5826 1 0005 1101 196
8720 3687
BONNY GLEN BOYNTON BRAMWELL BRANNIGHAN BRIDGE CREEK BROMLEY CALOOLA
5603 707 2307 21 1 362
3380 1573
COEN RIVER I 14984 DARNUM 370 DENMAN 1 8534 DIGGERS CREEK 85 DRUMDUFF I 12604 OUNBAR 36 173 ESCORT CREEK
I
--- - - 3771 GEIKIE 4986 GRESLEY 6580 HARKNESS 1 HELMSLEY HIGHBURY HOLROYO RIVER IMOOYA INGLEBY INGLELEY SOUTH JACK LAKES KALPOWAR KENDALL RIVER KIMBA KING JUNCTION KING RIVER KOOLBURRA KULATA LECONSFIELD - LILY VALE LOCHlNVAR LOVEL -- LYTHE - MAITLAND DOWNS MlNKA
4909 2303 1
272 11717 1205 3532 681 6 5658 8761
- 10247 -- - - 1690
4699 2758 8566
23805 -
-- 4057 - - - - - - - - 2454 -
- 2702 -- 4284
774 1 - - - - _ _ _ _ _ _ 606
6926

MOREHEAD MOUNT GIBSON MOUNT JACK MOUNT MULGRAVE OLIVE VALE
2529 - - 121 2 1854 3547 1 1560
PALMERVILLE PEAK HILL PERINGA
-.
PlCKERSGlLL PINNACLES PORMPURAAW
3548 134
8847 1623 1170
33462 PRYDE 1 110 RICHARDSON RUTLAND PLAINS SEFTON SHELBURNE SILVER PLAINS
289 1 44590 1982 834
1 6808 SOUTHWELL SPRINGVALE STAUNTON STRATHBURN STRATHLEVEN SUDLEY
9086 7377 279
10598 2774 7605
TUNGIN I 1982 VIOLETVALE WATSON RIVER WIPELLA WOLVERTON WULPAN
6986 3393 4858 6069 14347
Y A M 0 0 f 6724 YORK DOWNS 22795
TOTAL 1 53981 3

Appendix 7.1
Statistical Divisions


Appendix 7.2 PROPERTY MANAGEMENT PLANNING
Objectives
To develop a PMP program that:
(a) actively encourages the voluntary adoption of PMP by Queensland landholders as an ongoing management practice
(b) provides a coordinated government service that is both relevant to local needs and focuses on improving landholders management skills
(c) involves the wider community including industry groups, agribusiness and the landcare movement in its development, marketing and delivery.
Strategies
Achieving the objectives of the PMP program requires four key actions:
(a) Continuing development of a PMP process that utilises up-to-date, effective methods of adult education and skills development.
(b) Coordinating the efforts of PMP service providers. (c) Increasing adherences and acceptance of the program within the agricultural sector and
government agencies. (d) Evaluating how priority actions contribute to improved management skills and a
sustainable agricultural sector.
1 Process developmerlt
The PMP implementation strategy outlines the process being used to progress PMP in Queensland. The Queensland government supports the use of the workshop approach utilising a relaxed learning environment where technical content is tailored to participants' needs. It is recognised however that the workshop approach is not appropriate for all producers, particularly in the more northern and western parts of the State. In these situations the Queensland government accepts that greater use will need to be made of specific home study materials and in some cases one on one PMP will be accepted as the only effective approach.
The workshop approach focuses on.building on the managerial skills producers already possess, provides the forum to expose participants to new methods of gathering knowledge and skills and facilities and the sharing of information and knowledge between participants.
The Queensland government favours the use of a module approach delivered through workshops (Appendix ... provides a listing of possible modules which could be delivered through the PMP process) and supports producers entering the planning process iltilising any topic area although an assessment of physical resources is seen as an important starting point.

Module development and training
Central to the success of PMP is the availability of structured modules based on the provision of learning outcomes for workshop and individual participants.
Both written and audio-visual materials are required to assist workshop facilitators develop an effective semics. Written materials can, however be prepared and presented in any format, : however to foster the process the Queensland government:
s supports the DPI preparing guidelines to assist module development and the preparation of a range of draft PMP modules covering industry area specific issues that can be easily adapted for local use
will continue to provide staff skilled in various aspects of property management to participants in the delivery of PMP
,-.
s will, through the use of the DPI's Rural Extension centre, Regional extension specialists and Regional PMP coordinators, together with other Departments and private training institutes ensure that relevant training is provided to deliverers of PMP services
s supports the maintenance of an adequately finded Rural Adjustment Scheme to allow landholder access to training grants and professional advice as part of an overall strategy for achieving self reliance.
Participation in PMP only provides the introduction to the learning process in most instames. Experience in adult learning indicates that people become motivated to undertake &;her skilling once they have been introduced to learning in adult life. It is expected that participation in PMP will encourage individual producers to undertake fbrther skills development through other formal training and education avenues, many of which will be providing training on a commercial or cost recovery basis.
Many existing government services are compatible with the government's requirements for PMP modules. Appendix ... outlines other forms of business plaining and development assistance offered by the government. The challenge is to ensure PMP participants are made aware of other forms of business planning assistance and provided with access to them.
A list of courses and consultants is being developed for each PMP Centre to help landholders plan their own learning activities.
2 Coordinating of services
The Department of Primary Industries is the lead government agency for PMP in Queensland. However, while the delivery of PMP involves other government agencies, educational institutes, landcare group and other community groups it would be enhanced by greater . involvement of private consultants. The DPI has established 12 PMP Centres around the State. These centres are located in Mareeba, Charters Towers, Bowen, Cloncuny, Mackay, Rockhampton, Emerald, Longreach, Bundaberg, Charleville, Roma and Toowoomba. The centres provide a focal point for producer contact to access PMP services and for State

government staff and consultants to liaise with to ensure a coordinated PMP service is provided.
The Queensland government actively encourages the use of the adult learning processes being adopted as part of the delivery of Ph4P to facilitate greater involvement and provision of PMP services by non-government individuals and organisations with an interest in PMP.
Community input, ownership and commitment to the PMP program is essential for its success. . '
In order for this to occur community input to PMP program management and policy making '
will be necessary. The Queensland government endorses this input and the following mechanisms for their involvement at the districtPMP Centre, Regional and State level:
Establishment of DistrictRMP Centrelindustry working groups to work together on workshop delivery, module development and PMP promotion at the local level.
Establishment of Regional coordinatiodadvisory committees to provide input to Regional ,-.
policy and program management.
~ ~ ~ o i n t r n e n t of Regional PMP coordinators to work across regions and business groups to provide support and leadership to extension staff and undertake Regional management duties such as collection of monitoring information and staff training.
The QLC establishing a PMP subcommittee to provide ongoing input to State Policies and Program Management for PMP.
, .?. Resourcing of PMP services
PMP as it is currently delivered in Queensland is primarily supported by a combination of State revenue, Special Treasury allocations and Commonwealth (National Landcare Program W P ] ) fUnds. Individuals and landcare group members participating in PMP workshops contribute significant personal resources to the process and in some instances other PMP providers fiom the private sector and educational institutions provide input at minimal or subsidised costs.
Resourcing of the PMP program as currently delivered by Government has been significantly enhanced by the NLP hnded PMP Campaign and special treasury allocations currently projected until June 1996. While it is expected that Ph4P will eventually become part of the core business of a large percentage of rural sector service providers, the Queensland government will in the short to medium term:
ensure that adequate resources are available for continued delivery of an effective PMP .
service monitor the provision of Ph4P services by both government and private sector providers maintain an ongoing evaluation of the need for State and Commonwealth fbnding for h 4 l ' delivery and if appropriate seek continued support fiom Commonwealth programs in the provision of PMP services transfer delivery of all or specific elements of the PMP service to private sector or other providers of services as demands for service and appropriate providers emerge.

User Charging
At present government operates on a beneficiary pays basis for a range of products and services including some elements of PMP. Different locations and providers vary in the products and services attracting a charge and the manner in which these charges are . determined. It is recognised that there needs to be a standard set of principles adopted for any '
situations where the beneficiary pays principle operates or may be considered for the hture. -.
The general philosophy of user charging or beneficiary pays as held by the Queensland government is that users of govenunent products or services should directly contribute to the costs of providing these services at levels which are economically efficient andlor acceptable to government.
The Queensland government supports the DPI developing a user chargingfbeneficiary pays policy for PMP that will:
encourage efficiency in development and delivery of products and services by Government Departments discourage wasteful use of these products and senices ensure that rural producers continue to access the PMP process, value the services provided and utilise the services in moving toward self-reliance result in the equitable sharing of the cost of providing these products and services among specific uses and, where appropriate, the community provide opportunity for private sector or other providers to deliver PMP services as demands and opportunities arise. - .. .
3 Awareness
Current understanding and awareness of the PMP process within government, industry and the community is generally not good.
PMP should be recognised as an approach to management and should not be confused with plans or maps such as Tree Management Plans or Soil Conservation Runoff Coordination Plans. These plans may be derivatives of the PMP process, or they may be prepared in isolation fiom the PMP process to serve particuiar needs. They present information on one element of the property such as tree clearing or runoff control. They differ fiom the complex, dynamic, PMP process which remains voluntary.
However, landholders who participate in PMP should be well placed to satisfy any leasehold land administrative requirements for Tree or Land Management Plans. Some examples of these other planning requirements are included in Appendix ...
If the Decade of Landcare goal of 50% of producers involved in PMP is to be met by the end of the decade, producers will need to be aware of the benefits of participating in PMP. They . will also need to show where and how to access more information and assistance. Word of mouth provides an important communication network in rural areas. A quality PMP product will sell itself. Conversely, if producers do not receive a tangible benefit fiom attending a workshop, PMP will struggle for acceptance.

The Property Management Planning Implementation Strategy released by the Queensland government in early 1994 clearly sets out the actions necessary to achieve the successfUl development and an option of PMP as a planning process by landholders.
The Queensland government affirms support for this implementation strategy and will:
continue to work with industry bodies, landcare groups and the Queensland Landcare '
Council to promote a greater awareness and adoption of PMP ensure that PMP is directed towards learning outcomes so that producers recognise tangible benefits through participation continue to encourage the use of the implementation strategy with the accompanying . brochure, poster and video at all available opportunities to promote PMP publicise the role of DPI PMP centres located throughout the State.
4 Evaluation
The delivery of P W involves considerable expenditure by government agencies, and participation in it requires considerable time commitment and expenditure by landholders. Continuing monitoring and evaluation is therefore warranted to ensure the program is achieving the desired goals.
The Queensland government aims for a PMP process resulting in landholders acquiring better planning and management skills, and making improved decisions about the management of their properties. The success of the PMP program must therefore be evaluated on these criteria rather than the inputs such as the number of PMP centres established or landholaers who have attended PMP workshops. Ultimately government wishes to be able to demonstrate that the adoption of PMP will result in producers being more viable and self-reliant in the long run. In order to be able to do this the Queensland government will develop an effective monitoring and evaluation system that focuses on outcomes.


Mareeba Saleyard Averages for February 1989 to June 1994 (Centslkg and Numbers Sold Monthly)
:/ Feb. Apr, J u n , Aug, Oct, Dec, Feb, Apr, Jun, Aug, Oct, Dec, Feb, Apr, Jun, Aug, Oct, Dec, Feb, Apr, Jun, Aug, Oct, Dec, Feb, Apr, Jun, Aug, Oct, Dec, Feb, Apr, Jun, -. - 1989 1989 1989 1989 1989 1989 1990 19901990 1990 1990 199019911991 1991 19911991 1991 199219921992 19921992 1992 1993 1993 1993 1993 1993 1993 1994 1994 1994 - -
Month
~heried 147.21 1 cattle averaged 9045 centslkcj 1 ---.
~a Number Recorded
-+-Average Cents lkg

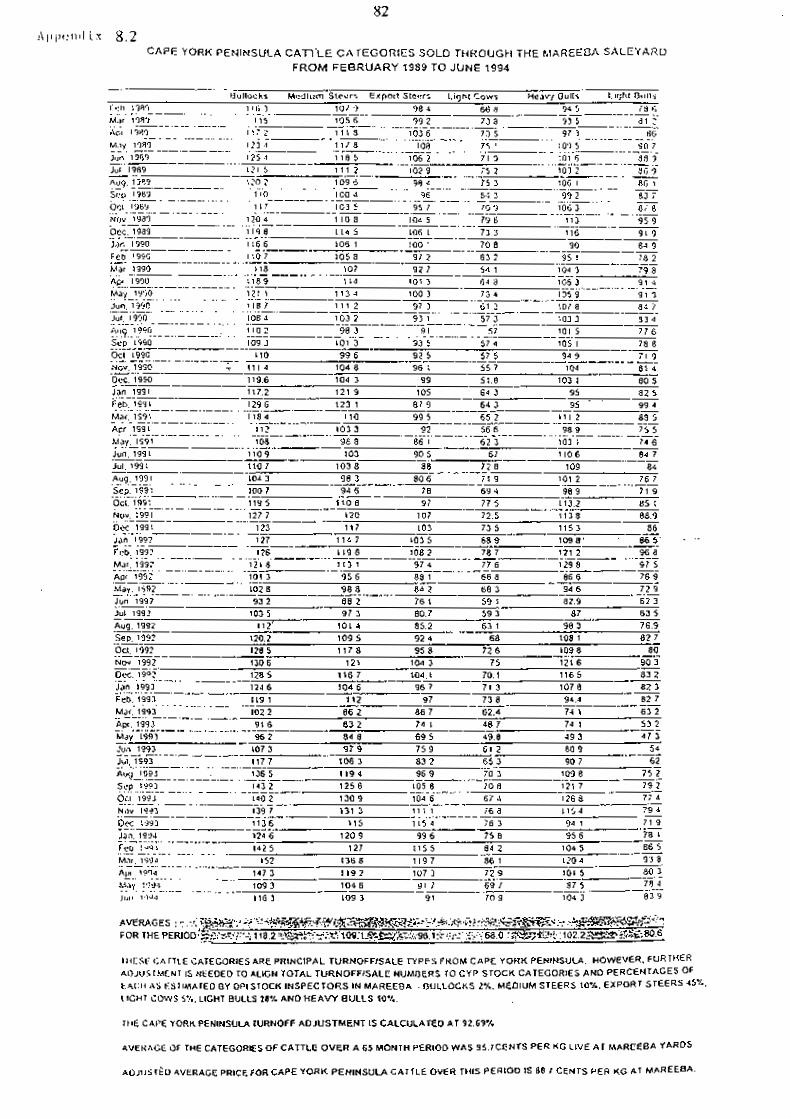
[\111)(:1i(l ix 8 .2 CAPE YORK PENINSULA C A n - L E CATEGORIES SOLD THROUGH THE MAREEBA SALE'fARD
FROM FEBRUARY 1989 TO JUNE 1994
IHESF CATTLE CATEGORIES ARE PRlNClPAL TURNOFFISALE TYPES FROM CAPE YORK PENINSULA. HOWEVER. FURTHER AOJUSIMENT IS NEEDED TO ALIGN TOTAL TURNOFFISALE NUMOERS TO CYP STOCK CATEGORIES AND PERCENTAGES OF t.A(:H AS ESTIMATED OY OPI STOCK INSPECTORS IN MAREEBA . BULLOCKS 2%. MEDIUM STEERS 10%. EXPORT STEERS 45%. L m r COWS 511.. LIGHT BULLS 28.1. AND HEAVY BULLS 10.1..
1tfE CAPE YORK PENINSUU TURNOFF ADJUSTMENT IS CALCULATED AT 92.69%
AVERAGE OF THE CATEGORIES OF CATTLE OVER A 65 MONTH PERIOD WAS 95.7CENTS PER KG LIVE AT MAREEBA YARDS
AOJIJST~D AVERAGE PRICE FOR CAPE YORK PENINSULA CATTLE OVER THIS PERIOD 1s 88 7 CENTS PER KG AT MAREEBA


Appendix 10.1
QUESTION 2
O\Yf.IER
2 3
QUESTION ,5
IvlANAGER
2
< I year
1
,
HOME ONLY
1-
6 - 1 0 years
4
Otner Included: Vac2nt;unused (1). Gra ing and fd~nina and Grazing (;) ant( :: .:...3.: ;-:k s~rvice statisn (i).
PLACE OF WORK
I
71
1 - 2 years
none recorded
1 U-5m
0UESTIOt.I 7 & 8 C ~ l t l e numbers sre cnly approx:mates 2 - 3 I;;::;. . - . - .- . 2:::3!r,ec: iror?? - ,- LL completed qvezi~c~naires.
None recorded
OTHER
3 - 5 years
5
: I - 2 0 i z 2 0 y e e r s years j
8
500- 5.000
5.003- 20.000
Grazing r
I
'i .I I 1
7
None recarded I None ,,
rscorded
20,000- 50.030
none
Cropping
i 1
I
4 1 - i 3
-.
>50 009
t 1
L recorded
Mixed farming onb' 1 only
;
Nc' aasweied
'.
(Crops and Graing)
1 21
Residence
none recorded
<:lei only
none recorded
2 -+I

QUESTION 10
QUESTION 11
Not answered] incorrect
14
Yes
8
OUESTION 12
L
No
14
*
. C '
OUESTION 13.
More intensive grazing
12
Yes
\ 21
I Pasture I Selective I Strategic Phosphate increased Other
I m p r o m t land clearing fencing - improvement use of - licks / ;' 21 ,) 13 (16 13 : .( 14 ) 1G i
2 -.4 d.
Other Included:
less intensive grazing
none recorded
No
2
- Not answered]
incorrect
2
QUESTION 15
More dryland cropping
3
Increased water- ,' \
( 8 ,,
Other Included: .
Expansion of p-erty
none recorded
.!I
Tourism a d agriculture
1
Lack of finance
18 '
Time, Native litle land claims (2)
Introduction of duppber&ztjvities
3
feed supplements
2
a- . I I . - . -
Restrictive lease cond~iions
6
.
2
I
Fertilizer
2
Size of property
2
reforestation 11 - II !I
1 !I
Access to saleyards1 ~ r t s (distance S. road condit~on]
9
-- -- I
Ott~er 1 .:I . I . : . ..?: e ~ : i 1 . : I . - .
il - I
;

QUESTION 16
QUESTION 20
- Not answered/incor:ecl
QUESTION 22
Getting worse Stable
r
QUESTION 22a
,i Improving
Other
0
Leasehold
18
QUESTION 22b
Freehold
7
, t. ' -
ii Generate capital ~as ier management lifestyle Amalgamation of for more property of Property adjoining property ( incorrect
development boundaries
j 1 15 I /
I I Yes
5
8 1 !
. .- No
9
---- 1
: . . .. . ... . . I . .. ered.;incorrect -. -
2 - - - 1

86
Where appropriate please circle desired answer:
1. Please provide the name and address of the property:
................................................................................................. Name: .............
............................................................................................... Address: ...... ,.. .......
2. What is your interest in the property?
1. Owner 2. Manager 3.. Home only
4. Place of work 5. Other (please spece@)
3. How long have you lived/worked/owned this property3
I . Less than I year 2. 1 - 2 years 3. 3 - 5 years
4. 6 - 10 years 5. 11 - 20 years 6. More than 20 years
" .
4. What is the size of the property?
4. 5,000 - 20,000ha 5. 20,000 - 50,000ha 6. Greater than 50,000ha
5. . What is the current land use of this property?
I. Grazing only 2. Cropping only . Mixed Farming (grazing and cropping)
4. Residence only 5. Other (please specify)
6. Is the use nominated above associated with any other business activity? I f so, please
specify: ......................................................................................................................

7. I f grazing, what is the size of your cattle herd?
............................................................................................................ Please specify:
8. How many cattle do you presently turn off a year on average?
Please specify the numbers, age and destination as indicated below:
9. What are the approximate major costs involved in running your propert)/! I
Cows
Steers
Heifers
Bulls
Weaners
Per Head Estimate
Mustering
Transportation
Number
Supplements ..................................................................................................
Others (please specify):
.....................................................................................................................................
10. Do you expect to change the land use nf this prc~erty in the future?
1. YES 2. N O
Age Destination

88
I I. If yes, what is the proposed change?
1. More intensive grazing 2. Less iri!c?nsive grazing 3. More dryland cropping
4. Expansion of property 5. Introduction of 6. Other (please size supplementary specify)
business activities
12. Do you expect to further develop the property by the Year 2000?
1. YES
13. If yes, what development options are you considering?
I. Pasture improvement 2. Selective land clearing 3. Strategic fencing
4. Phosphate 5. increased use of licks 6. Other (please improvement specify)
14. How many cattle do you think the property is capable of turning off i f i t were further developed as intended by the Year 2000? Please specify projected numbers and ages as indicated below:
Others (please specify):
Cows
Steers
Heifers
Bulls
Weaners
Number 7
Age
t
.
1 i
I i I

15. What factors are restricting the property from being further developed?
- 1. Lack of finafice- - - ' 2. Restrictive leases 3. Size of property conditions
4. Access to saleyards/ 5. Other (please specify) ports
16. How would you describe the present condition of the land on the property?
I . Stable 2. Improving 3. Getting worse
-i7. Is the property affected by any of the following degradation problems? Please specify approximate per cent.
Weeds .............. .% . -
Pasture decline ............... %
Erosion ............... %
Others (please specify):
18a. What percentage of the property has paddocks that are fenced? .......... %
0 1 18b. What percentage of the property has paddocks which are not fenced? .......... /O
19a. What percentage of the property is cleared and used for grazing? .......... 01 /o
19b. What percentage of the property is treed and used for grazing? .......... o/ 10
19c. What percentage of the property is not used for grazing?

90
20. What Is tho tenure of the propert)/?
1. Leasehold 2. Freehold 3. Otkw (please specify)
21. I f leasehold, please specify type of lease, and lease number:
22. Can you subdivide the property under its present tenure?
1. YES
22a. If no, would you subdivide the property if allowed?
1. YES
22b. If yes, what would be the reasons for subdivision?
1. Generate capital for more property development. ;
2. Easier management of the property.
3. Lifestyle,
4. Amalgamation of adjoining property boundaries.
5. Other (please specify):

What changes to property management would you like to introduce? Please specify below:
24. What are your views on the future of the pastoral industry on Cape York? Please specify below:
.....................................................................................................................................
.....................................................................................................................................
.....................................................................................................................................
25. What improvements to the Cape's existing infrastructure and communications would assist the operation of the property? Please list in order of priority (highest to lowest):

26. What are the major problems you face in running the pastoral business? Please list In order of magnitude:
27. Are their any other comments you wish to make rel'ating io the Cape's pzstoral indust@ Please outline below. Attach additional sheets if space is insufficient.

Appendix 12.1 CARRYING CAPACITY AND POTENTIAL OF PENINSULA LANDS
Country Type Carrying Capacity Beast to Hectares
Natural Potential
1 Tetrodonta (Stringybark, Messmate) Associations
(a) Stringybark, bloodwood, ironwood on a range of soils including sand, bauxite and ironstone. 1-401 100 Nil
(b) Stringybark, carbeen, swamp mahogany moist lowland areas and creek edges. 1-15/30 Nil
(c) Stringybark, bloo$wood sandstone ranges. 1-401250 N,il
2 Chlorophylla (Box) Associations
(a) Undulating box country, sometimes with ghost and cabbage gum on a range of soils, often with undergrowth. 1-15/30 1-417
(b) Open melonholey dark soil box, yellow-wood 1-10115 1-5
3 E. Culleni (Ironbark Associations
. 5 ' Ironbark, bloodwood and sometimes generally mixed eucalypt on shallow skeletal soils, hill slopes and plateau edges. 1-20150 1-518
4 E. Leptophleba (Molloy Box) Associations
(a) Rolling downs and drainage lines of molloy box, poplar gum and broad leaved carbeen. 1 - 10120 1-518
(b) Dark soiled open molloy box, poplar gum, ghost gum, ti tree river frontages. 1 - 10120 1-5
5 E. Clarksonia (Bloodwood) Associations
(a) Open bloodwood, molloy box. ironwood, stringybark, undulating hills and lower slopes. 1-3 0160 Nil
(b) Bloodwood dominated river flood plains. 1-15/30 1-518
6 Ti Tree Association
(a) Ti tree soaks and depressions, swamps and lagoons. 1-10130 1-5 (b) Low open ti tree and bloodwood, range of soils - usually
silt clay and sandy clam loams. 1-20140 1-7/10 (c) Poor sandy soiled undulating ti tree, ironwood, stringybark,
grass tree. 1-40180 Nil

Country Type Carrying Capacity Beast to Hectares Natural Potential
7 Rainforest Associations
(a) Rainforest and closed scrubs including beach dune scrubs. 1-3 0/5 0 Nil (b) River gallery forest and more open riverine forst. 1-15/25 Nil (c) Deciduous vine thickets. 1-20140
8 Grasslands
(a) Marine couch coastal plains. 1 - 10/20 Ni I (b) Generally level coastal plains. 1-7/12 1 -3/5 (c) Undulating black sdl plains, odd terminalia. 1-7/12 1-3/5 (d) Alluvial creek flats. 1-711 5 1 -511 0
I 9 Heath Communities I I Includes windswept headlands, Cape Flattery type dunes
and mixed scrublands. 1-1001250 Nil I 10 Mangroves 1-1001250 Nil
I 1 1 Wet Eucalypt and Wattle Communities
(a) Level to undulating carbeen, bloodwood forest often with a dense shrubby understorey in the wetter coastal areas. 1-15/25 1-5
(b) Level to steep very mixed eucalypt and wattle forest communities found mostly between the Annan and Bloomfield Rivers. 1-15/25 113-5
Red basaltic soils, generally undulating with considerable stone, timbered with box and gum. 1-15/25 1-315
( 13 Unavailable I I Country unavailable to cattle including steep broken I - I mountains, rock outcrops, bare sand areas, urban centres. 1-250 Nil I

Appendix 12.2 PROPOSED LAND MANAGEMENT UNITS
(Morton et al., 1994)
Table 1: A summary of the suggested criteria by which land in arid Australia would be allocated to national parks, excised management units (EMUS), restricted use units (RUUs), and .. sustainable use and living areas (SULAs).
Primary spatial scales of land allocation and management
National and regional
Regional
Regional
Local
and local
Units of Land Criteria for.allocation
National parks . representation of biodiversity in reserve network
. large size and efficiency of management by park staff
. major aggregations of resource- rich patches
RUUs
. representation of biodiversity through complementarity with parks
. emphasis upon resource-rich patches that cannot efficiently be incorporated into the park
C '
network - . moderate size . connectivity
. representation in the reserve network of areas of land that are temporarily significant for persistence of biodiversity
. emphasis upon resource-rich patches
. either small size or intermittent significance
. connectivity
SULAs . remainder of the land


Appendix 12.3
COSTING OF PROPOSED LAND MANAGEMENT UNITS (Morton e t a l . 1994)
l anked lists Estimated Adjusted Financial & Final l ists ) f land uses potential costs estimates social factors & costs
r k s Totai cost = Adjust for: analysis for Parks acquisition stewardship sustainable
+ fencing salaries entei'prises + salaries different mixes involvement + running costs of Parks, EMUS of ail stake-
, + foregone and R U U s holders production balanced co-operative
- tourism geographic resolution of income spread of land-use
- ecological reserves options & non-use optimal spatial values network of
reserves
' Iterate * A
R U U s
. C ' -
SL I --
I


Appendix 14.1 SUSTAINABLE PASTORALISM I N ~ O R T H E ~ AUSTRALIA-
Strategies for Sustainability
There are several strategies for ensuring long-term use and sustainability; many of these aie interacting.
1 Establishing guidelines for safe stocking strategies
With a sufficient understanding of pasture responses to season, grazing pressure and fire, indicators could be developed to guide tactical management of grazing. These indicators would provide for timely adjustments to stocking rate and so avocd damage to grazing resources.
Information to support both tactical and strategic stocking rate decisions is required, such as:
improved pasture husbandry practices relating to the maintenance of desirable or improved composition, production capability, utilisation and the management of natural or enhanced floristic diversity
paddock design and the management of watering points
a better understanding of livestock husbandry and nutritional requirements in. rel&ion to feed quality and quantity
feral animal control and wildlife management.
Producers must have sufficient knowledge to be able to compare alternative strategies, rather than just being told what to do. This requires developing close or interactive links between producer and researcher; field station research should be linked with on-property research so that it can relate research to property management information.
2 Establishing a better understanding of the management of resouice diversity
Understanding management of a diverse resource is particularly important for large properties where the pasture units are highly variable and the climate is unpredictable during the year: these conditions are found in Central Australia and in the smaller scale diversity of the highly dissected parts of the Top End of the Northern Territory and the Kimberley region.
Another case is large scale diversity within a region, rather than within a property, as found in the Maranoa and central regions of Queensland. In these regions, lands of high and low pastoral and agricultural potential are interspersed - Queensland bluegrass, brigalow, eastern gidgee and eastern mitchell grass are intermixed with Arislida-Bolhriochh pasture communities. Here the management of resource diversity must be more at the interproperty, or catchment level, rather than within properties.
Over the who& of northern Australia, there. is a problem in the management of-frontage country; this has resulted fiom overuse of land which has higher soil fertility and is adjacent to water.
This strategy (2) overlaps substantially with Strategies 1, 3, 4, 6 and 8, but it is listed separately because, like Strategy 1, it addresses a complex problem. The individual issues need to be understood as well as the complex interactions.
3 Establishing guidelines and techniques for monitoring the pasture resources
The pasture resource must be monitored to determine whether its condition is stable, improving or declining. This will involve:
monitoring of all aspects of the production system to develop the necessary understanding of the resilience, sustainability, degradation and recuperative process of the system. Land managers must be involved in all phases of the monitoring process to encourage participation, awareness and education (see Strategy 2)
. regular periodic monitoring of the production resources of leaseholds. In all three States making up the northern Australia region, new Land Acts are in various stages of adoption. All will embrace new concepts of leaseholding designed to provide better incentives for responsible, long-term land management, and for regular monitoring (see Strategy 11)
0 primary producers are increasingly interested in how they can monitor their own properties. With increasing availability of computerised decision - support syst&s, property managers are likely to start using such information. Appropriate monitored statistics will need to be considered within the scope of property management (see Strategy 8)
monitoring is an important element of managing drought and understanding drought processes (see Strategy 6).
4 Reconsideration of fire as a strategic management tool
Fire can play a strategic role in grazing management, by helping to maintain pasture composition, and particularly in controlling woody weeds. It has particular relevance to Strategies 1, 7 and 9. In recent years, fire has been down-played as being environmentally unfriendly, however reduced use of fire (Roberts, 1991) has more likely come about because of the shortage of fbel due to dry years, increased stocking rates, and more efficient utilisation of pasture biomass through the use of feed and mineral supplements (see Strategies 2, 7 and 9).
5 Greater use of on-farm research and acquisition of farm-related data
The wealth of farm information has to be tapped as a means of verifying and making the large amount of available research information relevant to the f m . This process requires a close liaison between researcher and client, ie. the farm manager, particularly for the development of decision support systems as an aid to management (McKeon et al., 1986; Gillard and

... + . Moneypenny, 199Q). This is already taking place in the form of the QDPI decision support- packages - GRASSMAN and STOCKMAN (see Strategies 1,2,8 and 12).
6 Strategies for handling drought
Given that droughts are likely to recur and that some degradation in the pasture and soil resources is likely to follow, the recuperative processes after drought must be understood to .: development property management options.
The knowledge base required to support Strategy 1 is also relevant to drought management. However, the contingency planning for drought and the actions taken during drought can have a substantial effect on what those options are after drought. At present drought is invariably
.
dealt with as it occurs, without forward planning. There is, theref~re, a- need for better predictive capability and interpretation of past events so that drought preparedness and management strategies are in place and degradation effects on the production resources are minimised (CSIRO, 1990).
Although still in their early development, such prediction systems as RAINMAN (Clarkson and Owens, 1991) are paving the way to better understanding and reliability. They require more feedback fiom the producer level to improve their local usefUlness (see Strategies 3, 5 and 8).
7 Addressing the serious weed problems and threats of weed invasion
Serious incursions of exotic woody and herbaceous weeds have developed in n&h Queensland over the last 10 years and are outlined in Appendix 3. In many situations, land has been made almost totally unproductive by invasion of weeds, while, in other areas, a formidable threat exists in the form of reservoirs of infection. In addition to these exotic species, and also some native ones, there is a widespread and endemic problem of woody regrowth from eucalypt and acacia species, particularly in southern Queensland (see Strategy 9). This is specitically important in such systems as the mulga and other acacia species in south-west Queensland and Central Australia, where finding the right balance between top- feed and ground-feed is not always easy.
Other areas of northern Australia may not have serious problems now, except for mimosa in the north-west of the Northern Temtory, but there is always the threat of the exotic weeds colonising from north Queensland. Understanding fire ecology could be essential to the development of management strategies to address this problem (see Strategy 4).
8 Enhanced educational programs for producers
Such educational programs should be participatory and of a 'grass-roots' nature, with a strong emphasis on producer-derived information. This could come through a broadening"of Landcare activities or such producer-based organisations as the Victorian River District or Centralia Land Management Associations.
Producers are requiring greater access to technology, and there is need for better channels of feed-back to researchers about their changing situations and requirements. However, there is need for support and channels to facilitate and empower producer groups so that 'user-pays-

user-says' messages are representative of the producers and receive an effective hearing. Agricultural advisers need to play a responsive role rather than a command one. Landholders need to be able to access the new technologies, particularly in the use of computerised decision support systems, as this will be one of the most potent ways of advancing both management expertise and the technical base on which tailored systems will operate (see Strategies 1, 2, 3 and 5).
9 Tree management
Tree management issues arise largely in southern Queensland and in Central Australia. As mentioned under Strategy 7, woody species regrowth is an endemic problem and is likely to remain so where pasture lands exist on cleared or partially cleared eucalypt woodlands.
Fire is an important factor in control of regrowth. In the acacia wo6dlands, suckeridg from old rootstocks can be a serious problem, especially in the brigalow lands, but now only on lands that cannot be cultivated for crop production. In other areas, acacia regeneration by seedlings can be a problem, particularly after fire. This may be the case in the rnulga and other top-feed acacia systems of south-west Queensland and Central Australia where a balance is needed between the tree density desirable for top-feed and that for pasture growth.
Another aspect of tree management that is of increasing concern is the effect of clearing on salinisation. Where solodic or texture contrast soils are widespread - as in the Aristida- Bothriochloa pasture community, considerable parts of the black speargrass, and some brigalow communities - salinisation could occur between 20 and 100 years after clearing. The Murray Darling Basin Ministerial Council is addressing this issue over a large part of .eastern Australia, but little activity is being undertaken in Queensland except by the Queensland Department of Primary Industries (see Strategies 4 and 7).
. . .
In many areas where there has been excessive or unnecessary clearing, guidelines should show how to re-establish trees for shade, windbreaks, soil and water conservation, wildlife habitat and landscape aesthetics. For other areas where there is a case for tree reduction, guidelines must show how this should be done, ie. the degree and pattern of the removal (see Burrows et al., 1988).
10 Feral animals and wildlife ,.
Uncontrolled populations of feral buffalo, pigs, donkeys, camels, horses and rabbits, and of native herbivores such as kangaroos .and wallabies, all contribute to difficulties of management, particularly in the implementation of Strategy 1. For feral animals, there is a need to broaden the approach to their control. There are few examples anywhere of the successfUl eradication of feral animals, and most programs have eventually opted for control rather than elimination.
In terms of wildlife, while much work has been done in feed resource competition and dietary . complementarity, there is a need for better monitoring of numbers, and for setting levels of populatrion control which will balance competition with survival (see Strategies 1 and 2).

1 1 Improved conditions of leasehold
There are several cases where uneconomic sized leases are leading to over-use of the land resource to provide a livelihood for the landholder. Such situations exist in the Northern Temtory Gulf region (Holmes, 1990), and in the mulga lands in south-west Queensland, especially in the Maranoa district (Clark et al., 1992). While this is not a problem for research, it must be viewed as an environmental constraint to good land management.
There should be interaction between landholders, researchers, agricultural advisers and land administrators in setting and reviewing adequate living areas, and in helping to establish acceptable methodologies for monitoring the land resource and its management. At present, all three States comprising the region are developing a new generation of Land Acts (see - '
Strategies 3 and 9, which should address these problems.
12 Better definitions of markets and formulation of production objectives 3-.
Where there are ill-defined market objectives, management options are decreased and resource-use planning is difficult. If the industry is to be made more efficient by emphasising sustainable improved production on a per-head basis rather than on a per-hectare basis, market objectiives for the necessary investments need to be defined.
A recent example of this is the beef meat and live animal market in Indonesia, which has given producers in the Northern Temtory new market objectives, just at the time (following the BTEC program) when they were most needed. Now there is a strong demand for decision support s e ~ c e s to help with property planning (see Strategy 5) . - r '

Pasture communities at risk At risk - from overgrazing:
with the use of feed supplements, pasture legumes, hardier breeds of livestock; and bj feral animals:
black speargrass ribbongrass
on calcareous soils carrying sweet feed: shortgrass annual pastures (Central Australia and Victoria River District)
on systems carrying top-feed of edible acacias: mulga pastures
from weed invasion and regrowth: exotic woody weeds:
- parkinsonia, mesquitre, prickly acacia: mitchell grass (mostly Queensland) - rubbervine, chinee apple: frontage country (Queensland Gulf and Peninsula) - mimosa: ricegrass-Hymenachne (Darwin, north-west coastal)
native w ~ o d y weeds: - eucalypt regrowth: southern black speargrass (central and southern
Queensland) - eucalypt regrowth, shrubs and cypress pine regeneration:
Aristida-Bothriochloa (central and southern Queensland) - acacia regeneration with other shrubs: mulga, other acacia (Queensland,
Central Australia and Pilbara) - acacia sucker regrowth: brigalow (Queensland)
r ' - acacia regeneration: gidgee (Queensland, Central Australia) - exotic herbaceous weeds:
- parthenium: central Queensland bluegrass (Queensland), northern brigalow (Queensland), central eastern mitchell grass (Queensland)
native herbaceous weeds - pimelea: southern aIluvials (Queensland), southern brigalow (Queensland)
exotic grass weeds: - giant rat's tail grass (coastal south and central Queensland)
from soil deterioration: soil fertility decline:
- nutrient depletion: derived rainforest pastures (~ueensladd), blady grass pastures (Queensland), heathland pastures (Queensland), other sown pastures.
- nutrient tie-up: brigalow pastures (Queensland), Queensland bluegrass soil structural degradation:
- surface scalding on red earth soils: mulga (Queensland, Central Australia, Western Australia)
- surface scalding on fine-textured duplex soils: some black speargrass (Queensland), some Aristida-Bothriochloa (Queensland)
soil profile degradation: - salinisation due to tree clearing on duplex soils with saline sub-soil: some
Aristida-Bothriochloa (Queensland), some black speargrass (Queensland), some brigalow pastures (Queensland)

Problems and priorities
In ranking the problems in Table 4, we have chosen to group them into three levels of priority. When we asked people to allocate priorities to this list of 12, we found much diversity in view fiom individuals between regions as well as within regions. However, there was reasonable consensus when we grouped the responses into three levels. A hrther difficulty in this ' exercise is that not all problems are equally important over the four regions.
The listing is an approximate overall order of importance for all of northern Australia. In this ranking, Western Australia places low priority on fbrther research into monitoring, not because it is not considered important but because that State has satisfactory monitoring systems in place. The main problem is in processing the information acquired.
Western Australia places a high priority on fire research as they see fire as ah invaluable tool in pasture management. This is apparent in the condition scores and land capability estimates in Table 3, because a much higher use is made of the poor quality pasture land than elsewhere.
Queensland places a high priority on on-farm research and data collection. This probably reflects the higher level of importance that decision support technology is given. It might also reflect more intensive land use in Queensland and more exposure of producers to extension personnel. The State is also strengthening its research on the problems of drought, and on property management strategies for drought.
Table 4. Overall ranking of problems and ratings for each region1 (rating of 1 indicates highest priority) . - .? ,
Priority Item Qld NNT CA WA
Stocking strategy Managing resource diversity Resource monitoring Fire research On-farm researchldata Drought Weeds Education Tree Management Feral animals/wildlife Leasehold sizedcovenants Market research
l ~ l d = Queensland, NNT = northern Northern Territory; CA = Central Australia; WA = Western Australia


Appendix 21.1 AN OVERVIEW OF ABORIGINAL LAND RESOURCE USE IN CAPE YORK
(Extract from: A Dale (1991), Aboriginal Access to Land Management Funding and Services. Griffith University: 143 pp)
With a total population of around 61,000 Aborigines and Torres Strait Islanders, Queensland has the highest indigenous population of any Australian State or Territory. Aborigines and Islanders represent 2.3% of the Queensland population and the land controlled by these groups represents an equivalent percentage of the total area of the State.
While most of the land originally held by Islanders remains under Islander control, most Aborigines now have little or no access to their traditional or anckstral lands. Mbst of the State's 48,980 Aborigines reside in major urban centres and rural towns. However, some 18,870 Aborigines also reside in discrete Aboriginal communities established during the long period of colonial dispossession, concentration and re-location (ie. from the 1830s to the late 1960s). Many Aborigines in these communities have been removed far from their traditional country.
It is not colnmonly recognised that most Aborigines live within the mainstream Queensland community. Many of these people have their own private freehold and leasehold lands, though these lands are not officially recognised as being 'Aboriginal land'.
Land Access . - $. ,
The Aboriginal Land Bill was enacted on the 3 1st of May 1991 amid strong Aboriginal concerns about the inappropriate consultation processes leading to its formulation. It will enable Aboriginal people to lodge claims on the basis of their traditional, cultural or econornic interests in land.
Under the Act, there may also be an additional 2 million hectares of vacant crown land (1.16% of the State) available for traditional or historical claim. This land will not be claimable until it has been gazetted by an Executive Council Minute. Once granted, this claimable land will not carry timber or quarry rights, but the grantee will obtain an estate in fee simple. Claims granted on the basis of need will only be awarded in leasehold and subject to conditions. National Parks can also be gazetted as being available for historical and traditional claim, potentially making a further 3.84 million hectares (or 2.2% of the State) claimable.
In the case of claims over National Parks, the DAIA Land Branch will first identi& those parks in which Aborigines have an interest. Once the Tribunal makes its recommendations, both agencies (the DAIA and the Department of Environment and Heritage) will form a working party which will also include representatives of the agencies, a conservation group '.and a consultant working on behalf of the claimant group. The working group will determine a broad management plan for the National Park under claim. The emphasis of these plans is likely to be on broad management strategies rather than specific day-to-day management issues. The relevant clauses of the leaseback arrangement will also be determined. No grant will be made unless the grantees have already agreed to lease the National Park back to the Government in perpetuity and on to conditions set out within the management plan. At the

end of the implementation process, granted Aboriginal land cannot be sold. Mineral and-- - - petrolebm rights will remain the property of the crown, and there is no-Aght 'of ~ b o > ~ i n d veto.
While there is no absolute veto over the granting of Exploration Permits for mining on Aboriginal land, Aborigines can withhold consent for access. This denial of access can only be overturned by the Governor in Council. If exploration identifies exploitable mineral resources -,
on Aboriginal land, then the Mining Warden's Hearing will now always call for an : Environmental Impact Statement (which will include a strong social impact assessment component). This information will help to determine the terms of approval for mining on Aboriginal land. Where mining is approved by the Minister of Resource Industries on Aboriginal land, the percentage of the royalty that grantees and the chief executive are each . entitled to receive will be based on a sliding scale. -
The actual distribution of Aboriginal lands in Queensland is largely a function of the natural resources they contain. Those traditional Aboriginal lands with commercially exploitable natural resources were occupied by Europeans throughout the initial colonisation period. Much of the remaining land which proved difficult to exploit was left as Aboriginal reserve or it was later designated as National Park. As a result of the poor natural resources on most Aboriginal lands, low intensity pastoralism remains the most common resource development. In most cases, pastoralism provides the 'lowest rent' land use option. In Queensland, pastoralism conducted on Aboriginal land has been largely marginal from an economic viewpoint.
In recent years, with increased mineral exploitation and the transformation of the Australian tourist industry into a major revenue earner, commercial developers have become increasGgly interested in mining and tourism developments on Queensland Aboriginal lands. Substantial mineral deposits have been identified on existing Aboriginal lands and other non-Aboriginal areas where traditional associations to land remain strong. Mining companies, for example, have expressed interests in hrther bauxite and oil exploration at Aurukun and Napranurn, gold at Lockhart River and Coen, ongoing silica mining at Cape Flattery and the development of fresh silica deposits on the west coast of Cape York Peninsula and Shelburne Bay. A number of tourism developments have also been proposed on or adjacent to Aboriginal lands. Prime tourism opportunities exist on both the east and west coasts of Cape York Peninsula, including the cultural experience associated with Aboriginal communities, scenic settings, wilderness qualities, and the potential for low impact and safari type adventure recreation. The common European perception of Cape York Peninsula as a 'wilderness' area of immense international significance is dependent on the non-development of Aboriginal lands for commercial purposes. Thus, from the rural viewpoint, the value of Aboriginal land is generally limited, but from the viewpoint of the tourism and mineral industries, many lands hold considerable natural resources. However, these lands also provide an important subsistence resource base for Aboriginal communities. Nearly all Cape York Peninsula communities have substantial land and maritime subsistence resources
While traditional affiliations to land have been diminished in much of the southern and eastern parts of the State, Aborigines in northern and western Queensland retain direct and clear traditional links to country, despite many having been removed within the lifespan of the older living generations. Cape York Peninsula is increasingly being recognised as an Aboriginal domain, with most land areas still being of real significance to existing traditional owners. The

use of land and marine resources for economic subsistence is closely linked to Aboriginal spiritual affiliations to land.
- .,'-.. -..
Aboriginal control and input into the management of maritime and land subsistence resources is an issue of utmost importance to many communities.
Little public recognition has been awarded to the notion of Aboriginal maritime resource use - rights. Queensland Aborigines do not have sole ownership and management rights over . '
maritime resources adjacent to their lands or in other parts of the State that are of traditional ' significance. Limited rights to the use of certain protected species (turtle,and dugong) do exist under the Community Service Act, though these will be transferred to the new Nature Conservation Act being devised by the State Department of Environment and Heritage.
Aborigines have similar concerns in regard to their access to subsistence resources on non- Aboriginal land and in National Parks. Queensland's Legislative Review Committee (199 1 :46) recently called for traditional hunting and gathering rights of all Aborigines in Queensland to be guaranteed on Aboriginal and non-Aboriginal land by legislation arising fiom its reiiew of the Community Services Legislation. Aboriginal access to subsistence resources in National Parks, for example, is currently prohibited. However, in some areas, unofficial agreements between local Queensland National Parks and Widlie Service (QNPWS) rangers and Aboriginal groups have been in operation. The management plans developed under the Aboriginal Land Act for National Parks claimed by Aboriginal groups will have to seriously address this issue.
Most Queensland communities have also engaged in some form of commercial economic development of their land resources, though to date, the commercial viability of host development projects has been limited. On most DOGIT lands, pastoral enterprises have, until recently, remained under the control of the State government. Market garden projects have been largely hnded by the Federal Community Employment Development Programme (CDEP) though they have rarely achieved any degree of commercial viability. Some communities are currently venturing into large scale tourism development projects (eg. the Injinoo Aboriginal Community has recently purchased the Cape York Wilderness Lodge). Within commercial development projects, communities often place greater emphasis on the achievement of employment, training, educational and other social objectives. Where the government hnds projects to be commercially profitable, this conflict in objectives often limits commercial viability. However, government fbnding agencies are becoming increasingly aware of the legitimacy of the use of land and resource projects for social and vocational purposes.
Conservation groups see many Aboriginal lands as being of high conservation value as most remain relatively unexploited. When viewed in the context of Aboriginal control of these lands . and the continuation of Aboriginal resource management practices, nature conservation is compatible with the aspirations of many Aborigines. However, viewed in the context of declining Aboriginal control, increasing external intervention and the imposition of restricted Aboriginal access, the use of Aboriginal lands for nature conservation purposes seriously threatens Aboriginal aspirations.
It must be also remembered that Aboriginal people hold aspirations for traditional land and resources beyond the boundaries imposed by European land tenure systems. Of particular

significance to Aborigines is their desire to gain greater access to traditional sites and subsistence resources in National Parks and in other conservation areas. - ----- - -
Land and Resource Degradation
Until recently, government and public concern about land and resource degradation in Queensland centred on those forms of degradation that affected the short-term profitability of -,
primary resource development. Through the recent evolution of greater public environmental -
awareness and the growing dependence of the State economy on tourism, land and resource degradation is now being viewed as an issue that affects the basic quality of life in Queensland. Queensland Aboriginal lands have suffered from degradation to a lesser degree than most lands because of a number of factors. First, the majority of Aboriginal lands in the State are in those areas that were left behind by European colonial expansion. Second, Aboriginal lands have not been used extensively by Aboriginal people to conduct intensbe f o h s of commercial resource development. In Cape York Peninsula, pastoral operations have always been conducted on an extensive scale. Low stocking rates and the low probability of ,serious drought have helped to avoid extensive degradation problems. Equally, continued Aboriginal access to land has ensured the continuation of appropriate indigenous burning practices, preventing the development of potentially devastating wildfire conditions. There are, however, a number of degradation issues of concern to Queensland Aboriginal communities:
(i) Soil erosion. The majority of Aboriginal lands retain their original vegetative cover. The amount of Aboriginal land developed for cropping purposes is very small and most communities only have small market garden ventures. Soil erosion in these ventures is minimal as most are out of production during the wet season. In general, scalding, salinity, acidity and structural soil problems are not extensive in Queensland Aboriginal lands because of the extensive land use patterns. Nonetheless, the potential for salinity problems certainly exists.
The vast majority of Aboriginal land is used for pastoral purposes. Native pasture resources have rarely been improved, and by and large, these pastures have not been significantly degraded. However, the i&astructure of these pastoral operations has been rapidly deteriorating in recent years. This is a general characteristic of Cape York Peninsula properties, though managerial neglect prior to the handover of DOGIT on.some ex-Aboriginal reserves has exacerbated the situation.
(ii) Coastal, marine and water resource degradation. Aboriginal lands in Queensland face no major beach erosion problems due t o the general absence of structural development in the vicinity of coastlines. In recent years though, increasing pressure from external tourism development has threatened Aboriginal access to coastlines adjacent to existing communities. Also of great concern is the depletion of a variety of maritime resources, generally by legal and .
illegal fonns of non-Aboriginal over-use. Fish stocks in most river systems in the Gulf of Carpentaria have decreased in recent years, leading Aboriginal people to demand greater control over fisheries resources.
Aboriginal communities realise that the quality and quantity of their estuarine resources depend on land use in other parts of the catchment. Both the Aurukun and Kowanyama Councils have taken initiatives to protect upper catchments beyond their administrative boundaries.
(iii) Introduced animals and plants*. The explosion of feral animal populations on Aboriginal land has been met with mixed responses in Aboriginal communities. Feral pigs have become a serious environmental risk in Cape York Peninsula, particularly with the decline of feral cattle numbers following the implementation of the Brucellosis and Tuberculosis Eradication Campaign (BTEC). Feral pigs are particularly destructive in wetland environments, including the expansive floodplains on the west coast of the Peninsula. They have seriously reduced once staple vegetable subsistence resources (yams and lilies) and they '. have possibly led to reductions in the number of waterfowl, crocodiles and green turtles. - However, pigs themselves have replaced lost subsistence staples as a major source of protein, and many Aboriginal people fear that their eradication may result in the declining availability of 'bush tucker'. At Aurukun, this concern is paramount following the BTEC removal of feral cattle 'killers' (cattle used for domestic consumption) as a major source of protein.
Feral horses are seen as important social resources for Aboriginals who continue to relate strongly to their historical involvement in the cattle industry in Queensland. On some communities, residents own horses that roam uncontrolled. These horses use pastoral resources, cause problems for stock management and contribute to soil erosion problems. In most Cape York Peninsula communities, feral horse numbers are not particularly high and many clan or other kinship-based groups claim ownership of 'Yarraman' stocks through their past involvement in mission-based cattle operations.
A number of Aboriginal properties now face woody shrub invasion. The Moor Moor holding has faced serious problems with rubber vine and the Daintree property (Waudimbi) has been forced to use the ADC's Maintenance of Properties program to maintain weed control within government regulations. The majority of Cape York Peninsula properties potentially fhce other serious weed infestation threats.
(iv) Other Aboriginal views on land degradation. Traditional Aboriginal notions of 'healthy' land are intricately connected with the responsibility that traditional owners have for land management. From a traditional perspective, effective land management includes the protection and maintenance of sacred sites and the maintenance of traditional subsistence resources. At Aurukun, for example, land is considered to be degraded or to have 'gone wild' if traditional burning regimes are neglected. Aboriginal pathways may also become degraded if they are not regularly maintained. Thus, with the removal of most Aborigines from their traditional lands, in the view of those with traditional knowledge of countq, much Aboriginal land in Queensland has become 'degraded' [in this context].
* Blainey, in his Triumph of the Nomads (1982) refers to the fbndamentally importance of Aboriginal food production as follows: 'There is a touch of drama about the way in which the world wide advances of herds and gardens halted within sight of the northern ~ustralian'coast. .
Two different ways of making a living stood side by side [gardening flourished throughout Asia and the islands of Torres Strait] ... they co-existed for perhaps as long as several thousand years. Why the domestication of plants and animals did not affect Australia is one of . the baffling questions in prehistory ...'


ATTACHMENT
The following attachment incorporates responses from community and other groups associated
with the CYPLUS process in regards to this project. These comments were circulated to the
author (where possible) to assist in the revision of the draft report.
From these responses, issues of fact were amended within the final report. Sections of the
following comments also portray the views of the respondent and their 'constituen&' (if
available) in regards to the information presented by the report.
The Cape York Peninsula Land Use Strategy recognises that various and contrasting opinions
exist within the wider community. The inclusion of all responses made in relation towards
the information within this report, indicates that the CYPLUS process has been, and continues
to be, inclusive of all points of view presented by the community.


PASTORAL INDUSTRY REVIEW
- by Landcare Management Services - C.YIP.P.A.G. REVIEW OF SECOND DRAFT
1. Compliance with Terms of Reference The extensive section on the National Industry appears to be included as padding to add bulk.
The Flow Chart of activities to be undertaken, notably Task 8, Community Consultation and testing of proposals and propositions: against anecdotal and informed opinion, has not occurred.
Many of the comments and corrections of fact of the First Draft of the report have been ignored and have re-appeared. The writer is not prepared to correct his mistakes. Community consultation, Pastoral Community at least, has only occurred by these written submissions.
A great deal of time was spent reviewing the material at no cost to the consultant. Of necessity the reviews were completed within a short time span to speed the production of the report. All to no avail. It has taken four months to produce this amended copy.
The time frame for completion has been exceeded by six months. Is it completed yet? How many more times are we going to be asked to review the material? Does it really matter? Are our views going to be considered . 2. Standard of Writing
The report is largely extracts from previous reports. Sumrnari,zing of the information has not, in many cases been attempted, in oth'er cases it has not been successful. 3. Standard of Maps, Diagrams & Tables
The black and white copies of colour maps are impossible.to decipher. Some of the Tables are inaccurate and misleading.
4. Adequacy of Research Methodology
Research appears to be comprehensive, however on closer inspection it is a rehash of other reports of various ages and reliability-
.I
5. Depth of Research
Reliance has been placed on previous reports that have not been subjected to peer review. '
6. Accuracy of Reliability of the Data and Information
The transcript of some data is often downright inaccurate and is therefore unreliable. Much of the information is not relative to Cape York.
7. Summary
While these comments are of a negative nature, the document contains a great deal of useful information. In our view it will require substantial rewriting to produce the required product.

In its present form it includes much contradictory and demonstrably incorrect information. It fails to interpret data in the context of local needs and conditions.
I t is unnecessarily repetitive, which makes it extremely difficult to assimilate. Review of the paper has been difficult due to the many issues touched on in passing, then returned to in other sections of the report.
We would like to suggest that further pastoral industry consultation-; will be necessary before the draft of this document is finalized. A detailed list of our comments is attached.
EXECUTIVE SUMMARY
Generally reads OK. Needs to be rewritten after correction of the entire report.
SECTION A: PROJECT OUTLINE AND METHODOLOGY
Page 1. The.consultation with landholders produced a one page report. This, plus the survey paper is the total consultation with land holders. No consultation other than written comments has occurred since the production of the Draft Copy of the report. See Fig. 11 Task Interrelationships. ,
Seven pages of repeated information that should be condensed..
SECTION B : CATTJIE INDUSTRY OVERVIEW
Page 9 to 18.
Unduly lengthy descriptions, have marked irrelevant sections.. The three pages of irrelevant graphs are not necessary. Feedlots operations are not relevant to the Peninsula. Industry strategies - unduly lengthy with a lot of patronising and gratuous advice.
SECTION C : TENURE AND LAND USE
Page 19 to 28 is a direct copy of the DoL Tenure Report which . written from a DoL perspective. While it acknowledges that security of tenure is fundamental to confidence in investment in property development it does not question the DoL policy which has restricted Cape York Peninsula to Pastoral Holdings classified as Pioneer Tenure, instead of allowing conversion to Grazing Homestead Perpetual Lease which is the basis of the "family farm" policy, the objective of which'is to establish stability in rural communities. Their words (DoL).
The DoL requirement to invest millions in pastoral Holdings before up grading the lease to Perpetual Lease is unique to the Cape York Peninsula region.
The so called analysis of the leases also comes from the DoL report. Our comment of that report pointed out that less than 10% of the leases in the Peninsula fell within the DoL specification of the

"family operated property". Hardly an effective attempt at achieving their stated objectives. - . -. - -
Page 2 9 . Amazing that the History of the Pastoral Industry ends in 1969 and does not include reference to the compulsory destocking of over 225,000 head of cattle by B.T.E.C. in the 1980's. This had a devastating effect on the industry. Many of these properties have not yet been brought back in production. The comment on legume pastures and fodder cropping is pointless. : What does it mean?
SECTION D: DES PTION THE CURRENT INDUSTRY Mention of BTECCyi the C::rent state of the industry is hardly appropriate. Surely it is history.
8.3 National Park Involvement in the Pastoral Industry
This section is good except for a few incorrect conclusions made by the writer.
Page 3 4 . The writer is definitely confused about the BTEC effects. Analysis'of these figures without knowledge of the BTEC process is impossible. Dot point 1. OK. Cow and heifer deaths were BTEC destroyed. Dot point 2. The decline in numbers was mainly due to destocks and
destruction of all classes of stock. Dot point 3. The comment re market forces is utter nonsense!
BTEC was compulsory destock, regardless of market values.
Dot point 4. Increased sales of females instead of destruction on property was due to the BTEC freight subsidy.. '
Dot point 5. OK.
The two pages of graphs covering the BTEC period are pointless as market forces were hopelessly distorted.
Page 37. Current Production (iii) The statement re carrying capacity is out of context and is actually referring to carrying rate (actual stock no's) in Table 5.4.
Page 3 9 . Stock categories. The descriptions used are not t.hose used by industry. Export steers could mean anything. The term usually used is store steers. All store steers are not export.
5 . 3 ~roduction for Mareeba Saleyard D ~ S D O S ~ ~
Discussion on Mareeba Saleyards trends does little more than reinforce what is already known. i.e. Saleyards are losing market share to direct sales and paddock sales. Detailed investigation - would have revealed the extent of cattle by-passing the Mareeba Saleyards. . ..
The writer acknowledges that the numbers are significant and includes numbers.
The numbers provided simply do not add up. Why the pages of graphs and projections made with erroneous figures. Analysis of the figures provided in this report show an average of 25,188 cattle pea. through the Saleyard for the five year period. Direct Sales (by passing the Saleyards) are shown as 17,480 p.a.

A total turn off of 42,668 cattle p.a. (10,000 more than quoted elsewhere). Clearly the percentage of - Peninsula cattl-e-through the Saleyards is .
mis represented.
6 MANAGEMENT SYSTEMS AND TECHNOLOGY
Page 45 to Page 59 is a copy of DPI publications which are accepted. Page 50. Partridge and Miller (1991) figures quoted are wrong. Check the Partridge and Miller Table 6.2, Page 51.
7 ECONOMIC PERFORMANCE
A review of CAERA information.
The DPI modelling exercises presented are accepted by most Cape Ybrk graziers as representing achievable outcomes.
8 MARKETING 1
Much of this has been said elsewhere, particularly Mareeba"Sa1eyards and Live,Export. Turn off quoted as 33,500 here.
Page 83. Confused understanding for lack of direct to works sales. It is not market forces - it is the shocking road conditions, and long time spent on transport which cause dehydration and bruising which mitigate against direct sales..
9 INFRASTRUCTURE
Again, mostly a lengthy repeat of information presented e1,seyhere. -
Page 92. Cost of maintaining existing roads $1,00Okm/hr?
Page 95. More misinformation on Mareeba Saleyards. It has all been said elsewhere.
SECTION E: ISSUES AND ASPIRATIONS
Good although often priorities are confused due to the writers lack of familarity with the subject and the lack of consultation.
e.g. Paae 100. * lack of infrastructure - poor access, lack of roads or railways not mentioned as barriers to development.
O~~ortunities and Constraints
Pase 105. Table 10.1
We suggested a summary of these comparisons in Table Form 'in our- comment on the Draft Report. It should be noted that most of the constraints are imposed by government policies. The identification of constraints and opportunities should be decided by Pastoralists, not the writer. Pastoralists have not had the '
opportunity to comment on this table.
Constraints outnumber opportunities. Proposed improvement to the roads are 50 years away and is hardly an opportunity.

Aboriginal Land Fund is probably more of an opportunity than a constraint.
---
Apart from these the Table looks OK.
1 1 NON PASTORAL INDUSTRY ISSUES AND ASPIRATIONS
As noted this section ik extracted from Professor Holmes 1995 report.
The findings are not sufficiently detailed to form any conclusiohs. The second stage of the report which was to ask s,ome contentious questions relating to land use has not been completed. SECTION F: ENVIRONMENTAL AND SOCIO-ECONOMIC ANALYSIS
1 2 ENVIRONMENTAL ANALYSIS
Close investigation of the survey material reveals that much of it does not relate specifically to the Peninsula. Outdated reports of a much larger area cannot be expected to produce reliable inCformation.
The calculation of area by estimating riverine frontages as being 10 kilometres wide should alert the reader to the fact that the Peninsula is not being discussed.
Pase 113. Attention was drawn by us to the alleged statement attributed to Peter Stanton in the Draft Report. It is still here and our comment still applies. "The removal of cattle from Lakefield N.P. has led to a total dominance of Digitaria decumbens (Pangola grass ) . ,. . - We have no doubt that this statement was never made, at least not in this context. The area of Lakefield is over 500,000 ha. The areas of Pangola would perhaps total several ha. The Pangola is being monitored by N.P. staff to assess its potential rate of increase.
Statements, and out of context misquotes such as this, serve to demonstrate the authors lack of local knowledge.
Pase 114. The comment on feral pigs and a ready supply of food in bogged cattle at the end of winter is nonsense. What do they live on for the rest of the year?
Rubber vine will not be burnt out of actual river systems by a build up of grass debris as it is washed away each season.
12.5 Potential Im~acts of Pastoralism
Pase 118. Why is it necessary to rehash information presented in the Tenure Section.
Artesian Bores are common through most of the Peninsula. Agsin old information is used. a
The next paragraph. While much has been written on pastures, it has not been understood by the writer of this report. Comment re fertilised pastures is not what is recommended by D.P.I. advisers.

~ l l of this from here to Page 123, rightly belongs in the Current Industry or a Production section. It has mostly been said elsewhere within the report. .-
Paqe 119. A lengthy discussion on management options which are not likely to be used. This is acknowledged, why include it?
This is a repeat interpretation of the conflicting statements in the DoL report on The Cape York Pastoral Industry. The DoL estimates+.on carrying capacities vary widely. Attempting to assess viable , '
property sizes by this method of categorizing 26 major land types into natural carrying capacities is complex and impractical.
This method does not apply in other regions, DoL acknowledge that the system is under review as it is considered unrealistic.
We have commented on this. Appendix 14.3. i.e., The notion that Tetrodonta country has nil potential for pasture development is nonsense and contrary to D .P. I. advice. Who provides pasture advice to the DoL?
The difficulty of interpreting DoL carrying capacities is also experienced by the DoL. At this time it has not been fully explained to pastoralists. It isknot clear how it fits with the CYPLUS NRAP soil mapping project.
13 SOCIO-ECONOMIC ANALYSIS
Another rehash of the basic details of the Industry. Paqe 124. Neqative Im~acts. Would be more appropriately headed "perceived negative impacts". , - r f
Most of this section OK. Needs to be sumrnarised.
SECTION G: PROPOSED MANAGEMENT GUIDELINES FOR THE PASTORAL INDUSTRY
14 PRINCIPLES. POLICY AND STRATEGIES
Paae 131 15.1 Government Role
Lists a multitude of Government Agencies with a say in land management in the Peninsula. None of the mentioned bodies have set foot in the Peninsula to ask for local input.
Paue 134. 16 GOVERNMENT ROLE . The suggestion to establish even more government agencies to administer Cape York Peninsula is ridiculous.
Buck passing, indecision, and lack of policy direction between Government Departments is one of the chief handicaps to development.
Suggestions on changes which result in a reduction of overlap between departments and clear policies with accountability for achieving results/milestones in providing services would be more welcome.
The establishment of CYPGAG, CYPRPAG, and ROSS is hardly likely to achieve more than another several layers of bureaucratic handicaps.

Pase 136.
OR. Except that improved leases should be available-before investment is made in property development as applies elsewhere.
18 LAND ALLOCATION CRITERIA
Pase 137. More on the DoL classification of carrying capacities. Enough said. DoL admit they are not currently workable. Appears .to have some fairytale expectation of lease resumptions funding property development.
Pase 139. Inclusion of data which is acknowledged as being "difficult to interpret in the context of the Peninsula alonett is pointless as it only further confuses the issues. If relative information is not available why use unrelated data.
Relative baseline data will need to be established before ~ n - ~ o i n g assessment of environmental change can be monitored. Note this Table uses 13 Pasture types not compatible with the 26 used by DoL.
Today 2 8 1 0 6 the Premier announced the C a ~ e York Wilderness Zone. This r e ~ o r t would now aDDear to be immaterial. MY comments from here on will be very brief.
19 ECONOMIC EFFICIENCY OF ALTERNATIVE LAND USES AND POSSIBLE BOUNDARY CHANGES
This section which considers "other uses of land which may be equitably converted from pastoral holdingstt is nothing more than fantasy. Uses for land other than Pastoral cannot be decided'on by carrying capacity.
Location of sites, scenic values, coastline access etc, wi.11 be the chief deciding factors. Aboriginal, conservation, tourism, cultural, hobby farms, remote area rural lifestyle and particular industry requirements coupled with the aspirations of particular tenants will be deciding factors.
These purposes have an endless range. The examples shown are nonsense.
Page 142 Boundary reconfiguration. An impractical academic approach.
Page 145 to 150 . Seems OK. It would now appear that all of these considerations will be overridden by political decisions.
APPENDIX
A great deal of paper, often unrelated to the Peninsula. Close inspection of them will often reveal their genesis and their age. Many are out dated and simply poorly researched rehashes of previous reports.
Page 87. Professor Holmes Report - Written from a Conservation Perspective for the Conservation Movement. Professor Holmes spent about a week in the Peninsula and arrived with pre-conceived ideas. It is pro conservation.

This Report should be balanced by a pro grazing report, or a least a commentary by Peninsula based Grazing representatives. John Boormans - d iscarssion on the poteritia-1 is dismissed as "un-likely".
The report is supposed to deal with the Peninsula as a whole. Aboriginal Lands and their use is often remarked upon.
Page 116. The vast majority of Aboriginal Land is used fox Pastoral purposes.
In the tables and discussion on carrying capacity and potential :
carrying capacities DOGIT land is not included.
A quick review of Pormpyraaw, Aurukun, Lockhart River, Weipa. Old Mapoon, Kowanyama, Hopevale, the Northern Aboriginal Reserve areas will show that they TOTAL 2,436,910 hectares and have an unimproved carrying capacity of 70,495 cattle.
One would think that a resource of this size would deserve more mention.
+ ? d J d . R. Wincen Liaison Officer 30/06/1995

DEPARTMENT OF PRIMARY INDUSTRZES L OFEICEMERlO
Abbott Stmet, Oonooaba PO Box 1085, Townsville Q 48 10
Your Ret: Our Ref: Author: David Croder Telephonc:'(077) 222 633 Fawimik (0 783 634
DATE. 22 June 1995
FROM: David Crowtfier, Technical Support officer (Agricultural 1P;roduction)
TO: Stewart Wood, Regional Director, North Region Chris O'Brien, Regional Manager, Agricultural Production
SUBJECT: CWLUS mA.L RIEPORT - PASTORAL INDUSTRY PROJECT
I discussed the draft final report of the CYPLUS Pastoral Industry Project w&h john Boorman while in Mareeba recently. John was unable to find the time to prepare a written reply, and provided the following comments for me to write up. He has read this rnernomndum and approved it.
John expressed general satisfaction with the final version of the Report on the Pastoral Industry. He was pleased to see many of his suggestions on the draft mport included in the final report. He feels that minor errors in the Final Repoft do not justify any re-write. He also commented on the strengths of the report, such as the proposals relating to land tenure, whicb suggest that CYPLUS has got the right feel of the situation, e.g.:
r ' , - consider National Park boundary changes to remove sections not of high conservation value,
return this valuable grazing land to the grazing industry, and
exchange land of high environmental value for land of law environmental value.
John provided the following additional comments:
1. Page 24, Section 3.7, Sues of Pastoral Lease: 90 000 ha is the upper limit of area workable by a traditional family unit. The PDS site at *Pinnaclem showed trapping can cut mustering time and increase capture rates considerably, allowing a considerably larger area to be managed: by a family unit. This should be taken on board by CYPLUS to indicate that 90 OM) ha is conservative.
2. Page 30, Section 4.2, Aboriginal and Torres Strait Islander Involvement in the Pastoral Industry: Aboriginal people lack property management experience. It could take one generation to change the culture and teach aboriginal people.,.to manage

grazing properties and efficiently by "western" standards The question is whether "western' values are appropriate to aboriginal people. If not. then land tenure must be -
changed to reflect Aboriginal needs for land ownership. This will affect the d c a l mass of the pastoral industry in the Peninsula.
Page 45, Section 6.1, Climatic Factors: The reliable rainfall of the Peninsula is one of its greatest assets.
Page 45, Section 6.2, Management practice; Pasture buming is more selective than the report would imply in relation to end of year fires. Most graziers realise end of year fires are valuable for sucker control and that to obtain a-sufficient body of material to support a hot fire, buming is best carried out only once in every 3 or 4 years.
Page 47, Section 6.2, Supplementation: When the term 'supplementary feedingn is used, does it apply to supplementation per se or protein supplementation only? If the latter, then protein supplementation is economic only if used in conjunction with wet season phosphorus supplementation and early weaning.
Page 56, Section 6.8, Carrying Capacities: The Department of Lands (DOL) suggests the potential total herd of the Peninsula is in the order of 500 000 head. This is four times the current level of 120 000 and may still be conservative. Therefore it is credible. As 10% of the properties in the Peninsula are currently destocked, restocking them alone will increase the herd significantly. The rest of the increase will come from improved management and husbandry using existing technology, for example trapping, culling, early weaning, supplementation, improved watering and fencing.
Page 58, Section 6.8, Carrying Capacities: Con8enrationists8 concern (paragraph 2) over canying capacity is not supported by DPI and DoL. There is a qvegt, however. Any increase in herd site must be done carefully, be well planned and oukr slowly to avoid overstocking of controlled areas in the initlal stages of the process.
Page 58, Section 6.9, Constraints and Opportunities: Produdion levels of traditionally managed properties are not capable of significant increase only if they are wrrently fully stocked. Due to BTEC, many are not.
Page 59, Section 6.9, Constraints and Opportunities: John fully endoms the sentiments expressed in the last paragraph on this page.
Page 69, Section 7.6. Improved husbandry management. Negative cash flow can be avoided by selling surplus breeders in the fitst 3 years. By years 5 to 7, cash R o w will be positive. This can be achieved without reducing turnoff through fewer deaths and higher branding rates due to improved herd management and herd quality.
Page 71, Section 7.7, Pasture Systems: Bank lending rates of 20% to 24% seem overestimated.
Page 72, Table 7.14: Check for calculation errors in the Intensive and Medium-input totals.
Page 84, Lack of Infrastructure I transport Costs: Deaths of cattle due to dusty road- condiions a& more likely on feeder roads than on th5l%hinsula eve lop mental Road.
Page 86, Section 8.4 Marketing Potential and Industry Background: Industry in the Northern Territory and Kimberiey owes its recent good fortune in part only to the live cattle export trade. A major factor in their favour has been the network of excellent bitumen mads supplied by public funds- These have not been provided to near the same extent in Cape York Peninsula and at cumnt rwtes, will not eventuate for many years yet.
Page 89, Live cattle export support from the Northern Territory government: This is an important point for Queensiand's policy makers to take on board. Lower Peninsula data indicate that live exports could increase gross margins by 50% to TOO%. However, the government must foster Live Cattle Exports by putting facilities in Cape York Peninsula - roads and terminals - and recoup its. investment through the flow-on effects of taxes, fuel excise, etc. CYPLUS must support the point that the Peninsula Developmental Road is the main factor inhibiting the development of the area. Live cattle exports through Karumba are not practical because them is no direct road access between the Peninsula and Katumba, except via Mareeba.
Page 94, Technical Services: DPI services to Cape York Peninsula have been affected by the retirements of Peter McKeague and Rob Webber and the need for new officers, especially Jim Tumour (Landcare) and Rod O'Connor (Financial Adviser), to gain experience.
Page 94, N and Rucfio: Listeners in the Peninsula are better able to &we the ABC stations in Longreach, Mt Isa and Emerald than Cairns. However, news and Country Breakfast Session items broadcast from Longreach, Mt Isa and Ernerafd are not targeted towards Peninsula listeners, and are less relevant. This could get worse as AM stations are progressively replaced by FM stations with smaller broadcast radii, leaving Peninsula listeners outside the immediate area of Weipa and Coen more isolated than ever.
Page 101, Pastoral Lease Use: Pastoral leases not being used for pastoral purposes, for example Bertiehaugh, Bromley, Blue Mountain and Aboriginal holdings are a big problem for the Peninsula as they affect the critical mass of the grazing industry and lower the economic activity required to foster improved sewices and inhstructure.
John also points out that there are 150 000 ha on Hdroyd River, Meripah and ~endafl Rier on which peanuts, maize and sorghum could be grown under inigation from the artesian aquifer. The main unknown at this point in time is the suitability of the artesian water of the area for inigation of crops. mere is also a substantial area east of Weipa which is suitable for cropping. Reliable rainfall and artesian water should be a factor encouraging the assesament of these areas for cropping, to follow on from the pioneering beef industry, and looking to Asia for export of produce. The Atherton Tableland is only 170 000 ha in total, of which only 40% (approx. 70 000 ha) is suitable for cropping peanuts, maize, etc.
. ..

19. Page 118, Section 12.5, Potential Impacb of PasWallsm: The estimate of the - - ! - z . poteidial canying capacity in the-hst paragraph is'wnservative (1 beast to 5 ha is
conservative). Given the fad of higher, more reliable rainfall, a stocking rate of 1 to 3.5 fi
ha should not put excessive pressure on the environment and should be considered I
practical.
20. Appendices: Due to pressure of time, John did not go through the Appendices in detail. As they are regularly cited throughout the report and no errors were pick'& up there, John feels confident that they are accurate.
ID E Cmwther TECHNICAL SU]P]PORT OPEICER (AGRICULLTURAL PRODUCTXON) NORTH REGION

p o b o x 3 2 3
n o r t h c a i r n s
q - l d 4 8 7 0
c o m i n o s h o u s e
2 7 - 2 9 g r e e n s l o p e s s t
t e l : 0 7 0 3 2 1 7 4 6 P.U. Box 7440 Cairns Qld 4870 f a x : 0 7 0 533- '779
ernai1:pagasus:cafnec
have received a copy of t h e d r a f t repor t on the pastoral industry and have set out below comments. In geneml, t h i s paper jo ins a long list of publications which ef fec t ive ly
sp i ra t ions i n to broadly appealling policy positions t ha t mask real i s s u e s assoc ia ted wi th suggested courses of action. The paper does nothing t o
ognise t h e asp i ra t ions of any sec to r of soc ie ty o the r than the pas towl industry and its
he paper s u f f e r s badly from an o v e r emphas is on " uncertainty " a s t h e m a j o r f a c t o r t h a t a s hampered t h e development of the pastoral ind~stry,~p:~&~@@~$~$$.~&&$:~,ustry i s s u b j e c t
t o many f a c t o r s which have re ta rded i t s d e v e l o p q : . ~ ~ ~ @ # ;$$;$;>, in tens i f ica t ion of t he Cape York pastoral indu&&# *:vk.:;:.:, $$!!$$&J~~ the leas t amounost t he se i s unf wourab)@
4
a t t empt to e i t he r ide more land f o r
paper a l so gives a to ra l i sm t o da te .
I onal parks o r reconfi gum boun ly r e s i s t e d by conservat ion grdups.
of the land condition and the impac t s f m m
pe York Peninsula's biophysiacal a t t r i b u t e s and i
kirstralia working in rar _ lduced a number of posi' npleted the CYPLUS
gs been
T h e paper f a i l s t o c r ea t e an a e potential damage t o these'? ul t iple land use s imply does nl
gically dubious at c t ion in t he real '
.:.= .:::::::.
~~~~g ,..x. ;< ........ .Pi 3atural and cultural values: ......*.. ............. " 5; =:;, ........ *?<. ;z;.
fie paper proceeds from the s t a r t i n g point t h i i i x '"y<:<*y~xtttt. '.,,X>~~<. ,>>:...x.:&IA<\xU .. 1-1--11)p
@Yand then sugges t s changes t ha t need t o be made t o en'urty$&~s;$$&@. ?&~:$g?: changes are :

* modlf lcat-lon to lease condi t i ons * tenure changes * part ial subdivision * improved cattle control systems * l ive catt le export * upgrades-to- the road system * higher input systems * development of domestic and export marketing strategies * grazing on Aboriginal and national park lands including the excision of from many parks.
grazing land
The links between these changes and the principles o f ESD, which the paper spends some time,: talking about, are very nebulous.
The paper fai ls to recognise the reality and impact that such measures wi l l have on CYP's ecology. Australia's past i s l i t tered w i th examples that provide evidence of these substantial impacts and while the paper attempts to suggest and just i fy a system of co-operati ve environmental management to ameloriate these impacts, the reader is l e f t w i th a sense that the path suggested i s unworkable, damaging and not properly appreciative of the impacts that such a path w i l l produce.
It short it w i l l represent a disaster f o r the rangelands of CW.
The Arid ~ a n d s Coalition has a fourfold approach i n sequential order that i s applicable to CYP:
Firstly, the establishment of a representative reserve system throughout CVP supported by o f f reserve conservation management; second1 y, where pastoralism i s either ecologically unsustainable or ecornmically unvi able alternative ecologically sustainable land uses must be developed and implemented; - thirdly, where any pastoral land use can be ecologically sustainable, emure that all activit ies are within the principles of ESD and fourthly, appropriate resourcing and support provided to facil i tate the realsisation of the aspirations of traditional Aboriginal owners for ecologically sustainable land management.
Managing land fo r conservation i s not the same as managing land for intensified cat t le production and the paper implies that these two are i n fact very compatible. With the charges suggested i n the paper and l is ted above, this intensification is significant and it i s not enough to say that they are designed to pmtect the values of CYP. They are in fact designed to intensify the cattle industry i n anarea of autstanding natural value.
The paper places a lot of emphasis on the claim that CYP's natural condition i s s t i l l good and that t h i s condition has been maintained af ter 100 years of pastoralism. Unfortunately .
nowhere near enough emphasis i s placed on the environmental effects of the paper's suggested changes l isted above. Extensive rather than intensive use has given us what we have today, a change to intensive wi l l not give future generations what we have tuday and there i s ample evidence to support this proposition .
In our view th is glowing report on the Cape's condition i s over stated and optimistic.
It i s no longer good enough to say that we cannot prove this riverine degradation, weed invasion, erosion o r loss of biodiversity i s because of " this cow " or ' these cattle." As has been stated by a member of the Arid Lands Coal i t ion : " it i s a b i t l ike the tobacco industry continuing to claim that smoking does not cause cancer. "
Unfortunately i n this country we have a long l i s t of agricultural consultants and Govemen t off icers who am reluctant to offend the farming lobby by telling i t l ike i t really is. The environmental problems over vast areas of Australia that have been the result of the very path suggested by this paper are now so serious that i t I s t ime to say that the users must be able to prove they can manage land i n a sustainable manner rather than the community having to prove that they cannot.

Changes In land use allocation i s the fundamental f irst Step In such a process. This papW'S version of changes in land use allocation place an emphasis on ' .... the excision of quality grazingland from many ( nut ional 1 parks ....." This i s absurd and has no basis given the ecological und wilderness values of CYP.
The paper provides inadequate discussion on the value of CYFrs"range1ands other then for cattle raising and subsequent intensification of this use. Sections on conservation and biodiversity values are very weak and do not do justice to these values. There i s a very weak recognition of the proven impacts from pastoralism.
The comments below refer to specific sections i n the report.
Section A : Project Outline and Hethodoloqq
This section provides detail of the methodology adopted and this includes a number o f references to " community consultation w i th stakeholders. ' In the case of the environment sector this consisted of representations made through two working group meetings and attendance by one of the consultants at a meeting of conservation groups in Cairns. It i s our view that while the consultation took place, we find it dimppointing'that very l i t t l e of the views put forward at these forums have been incorporated into the report, particularly the four point position of the Arid Lands Coalition set out above.
Section C : Aspirations and Attitudes
4.1 Questionnaire analysis
* the property development techniques are the very activit ies which have wrecked much of Australia's grazinglands,
* a major impediment t o property development for catt le production on CYP i s the environment i.e. low nutrit ion pastures and poor soils. This factor i s not recognised by,, landholders i n the responses given. It needs to be accepted that CYP i s not naturally' sur'ted to high catt le production and anty attempts to carry i t out w i l l therefore be continuing the modus operandi i n other areas of the country i.e. pound the land into submission
Section 4.2
*There is no mention of a recognition by industry of the ecological and natural importance of CYP. Conversion to national park tenure i s presented as merely taking away " .... significant areas of pastoral properties ...: without one iota of acceptance that national parks have a v i ta l ecological function in a largely destructive society.
* the reference to Lakeland Downs on page 19 i s incorrect and presumably should be Lakef ield.
Section 4.2.2
The discussion on uncerta'inty states that : " the industry considers that better decision making based on effective consul tation and factual information inputs i s required." The environment sector agrees w i th this, i t i s a shame that the pastoral industry representatives involved i n CYPLUS have chosen not to put these words i n practice.
Section 4.2.3
The last statement fa i ls t o recognise that an overwhelming reason that CYP i s i n i t s f~resent condition i s because the pastoral industry has been contained for a variety of reasons. It i s not i n I t s present condition through m y deliberate decision of the industry. The result has come about because of factors outside their control and i n fat contray to their a~pimti0n.S as evidenced by the questionnaire.
Section 4.2.5 i n reading the industry view that : ' Cape York needs to accomodate the widest

possible range of business activlty and land use "one automatically has to ask : Why ? This statement is made in a vacuum divorced from the reality of the importance of CYP's environment. This attitude has resulted in vast areas of Australia being degraded ir-reversi bl y.
Section 4.3 Future Industry Aspirations-. -
4.3.1 The view that Cape York offers comparative advantages for the pastoral industry from a national perspective i s utter nonsense. On any criteria amoungst many, Cape York falls short In i t s national comparative ab/antage.
The view that somehow intensifying production on Cape York wi l l assist in the rehabilitation of areas of western Queensland i s laughable. Where do we intensify next af ter we have wrecked Cape Vork i n order to give i t a chance to recover ? That i s the reality of the situation.
Section 4.3.6 The industry .".....-. considers that the beef industry can develop i n harmony wi th other land use requirements ...." When this claim i s combined with the changes that the - - industry seeks, the statement must be challenged when i t comes to : the protection of wilderness, biodiversity and the ecological systems of CVP.
Section 4.4 Page 25. The sentence at the job of the page sounds very noble indeed. The only pmblem i s that all outcomes sought within the guidelines suggested later by the concultants and the aspirations of the industry, we impossible to achieve together and the paper suffers greatly frorn a failure to recognise this fact.
At the end of the day, decisions about the direction we want to go in and the outcomes we are seeking must be made and acted upon. It i s a fallacy that " attempting to be all things to all people " w i l l result i n pmper recognition and protection of the significant natural values of C YP.
Section 5 Community Aspirations , 6.
5.1 Present Community Attitudes
It must be stated that this section does not reflect the views of the wider community outside CVP, who increasingly have shown that they place great store on maintaining our wi ld and natural lands in their present condition. The l i s t under 5.1 reflects this and does not include any recognition of the natural and cultural value of CW.
5.2 Community aspirations for the Pastoral Industry
This discussion i s a serious oversimplification of the results of this land tenure pmject results. Particulalrly the second and third last paragraphs. We suggest that the fu l l land tenure project report be included i n the appendix to this pastoral report.
Section 0 : Tenure and Land Use Analusis
Section 6 : Once again the " uncertainty " factor i s emphasised - refer to comments above.
Section 6.3 There i s an underlying tone to the statement i n this section. One has to ask what criteria has been applied to present the view that : " National Parks constitute a substantial component of the study area ..." ?
On the basis of the percentage of land i n conservation tenure compared to the percentage of land not in conservation tenure but worthy of such, the statement made in the report i s unjustifiable.
Page 32 : the last table and sentence continues the trend of attempting to build a picture in the readers minds that is a picture the industry wants to hear. There are a number of issues raised by this comment, that are probably best not stated here.

Sect ion 7 Pastoral Tenure
Section 7 1 The f l rst sentence must surely be chmged to . ' Grazing i s the most extensive use of land on Cape York Peninsula." It cannot be the most important on any criteria ... ecommic return or envlromnenatl protection. If this sentence remains as stated i n the final report, i t w i l l seriously erode the .claim to independence by the consultants.
Section 8 Pastoral Land Use
Section 8.3 National park Involvement in the Pastoral Industry
The predominant reason that Queensland has a long history of grazing in national Parks has +: nothing whatsoever to do wi th a recognition of the benefits of doing soor the outcomes which i t produces; i t has everything to do with a State whose successive Governments have pandered t o an industry and been reluctant to do anything which might mildly concern them.
Section 8.4 Constraints and Opportunities
The comments on page 42 : " The total land area available to the industy must be considered a prime constraint to the future of pastoralism ............... H o w e r , the opportunities which are offered by s new approach to the sharing of resources are wide-ranging .........." seeks to just i fy the concept of mu1 tlple use which i s effectively 8 front far making more l%ntnb available f w past oralism.
Section E : Economic Analusis
This section from page 44 to 68 is cumbersome and would benefit f rum a table of conclusions and a summary.
Major conclusions are : " . * that the industry is not vlable in i t s present form -
* that to change i t requires the implementat1 on of environmentally damaging practices and technologies and * thwe i s no clear indication of where investment finance w i l l come f rum.
9.5 Carrying Capacities
The potential carrying capacity and resultant herd size w i l l be an environmental disaster for Cape York Peninsula.
Page 70 :The DPI suitability assessments must be challenged and even a cursory glance at the accompanying map w i l l reveal that the criteria applied are drastically flawed.
9.6 Constraints and Opportunities for Economic Growth
Page 71 The discussion centres around intensification and says : " This pmcess should take into 8 C C O W t mvironmental and cultural considerations." but does not provide any guidance or. recognition that the very measures being proposed cannot properly incorporate the e n ~ i ~ n m e n t % l and cultural considemtions that the writers aspire to.
Section F : Environmental and Social imuact Analusis
A reading of this section shows clearly that pastoralism has had a negative impact on the etwir~fment of Cape York Peninsula mainly through erosion, the introduction of weed SPeCieS and changas in f i r e regimes.
Section 13.2 The statement at the bottom of this page in the last paragraph regrading the precautionary principle i s very confusing to say the least and cannot be justif fed.

I- ~ e c t ion 13.3 This section is very weak and does not support local anecdotal information. In addition, the results of Moss et al. are inadequately explained away.
Section 14.2 We agree w i th Friedel's inference i n the f last sentence of the f i f t h paragraph.
Sectlon 14.4 Page 1 12 a major reason for the claim i n the f i rs t sentence can be put down to the nature of the grazing industry on the Cape i n the past. Because i t hasn't reached the levels of intensi ficatlon elsewhere the country has been spared the enormous degradation that has ravaged so much of our rangelands.
To rscommend intensification is to recommend the degradation of the Cape's fragile soils, ., vegetation and ecosystems.
Section 14.5 : Potential Impact of Pastoralism - High versus Low Input Systems
This section does not do justice to i t s t i t l e . I t i s a description of the different methods and a geneml discussion where it i s di f f icul t to sequentially follow on from other sections.
Section 15.1 References should be provided f o r the statement on page 1 18 i n the thlrd paragraph, last sentence. It i s not clear what these condition surveys are.
Section 17 Page 122 : This section demonsrates a poor understanding of native t i tl& It i s not just a right, i t i s also ownership, that may o r may not have been taken away i n white society's v i iw by the granting of pastoral leases. In Aboriginal society the land i s s t i l l owned.
Section 18 page 124 to 126. This provides a good analysis and conclusiun
Section 19 page 127 to 126. Criteria assessment must include consideration of the- conservation value of land and the loss of those values elsewhere both an a national and international basis.
* , 1 ..
Section 20The second and third paragmph are based on the premise that use and development of country are good. We believe there must be places l e f t i n the World where th is does not apply.
We agree w i th the discussion on financial incentives etc i n the large second last paragraph.
Page 130 the th i rd paragraph commencing " In the case of grazing of ........" we find th is paragraph contains underlying value judgements, ideologies, poor understanding of national park philosophy and need and i s consequently blinkered i n i t s view. It contains ridiculous justifications.
Page 13 1 the discussion here fa i ls to suggest that where conservation values are protected in the national interest--and where this results in a loss of rates for the local authority , i n this case Cook Shire, then it fol lows that under funding and grant allocations that Shire must be compensated by Federal and State Governments because of this national interest.
We trust these comments are useful and state clearly our position on a number of issues raised by the pastoral paper. .
Yours faithfully, dhLL7 Jim Down

CAPE YORK L 38 Grafton Street, P.O.
Phone: (070) 51
/ RESPONSE TO PASTORAL INDUSTR I
I I
nsiderable reservations about many aspects
I i- However, due to the lateness of our response we will con ntrate on the main section th$ is of great concern to the Land Council.
122-123) SOCIAL JUSTICE AND EQUITY F RESOURCE would like to see totally removed from the
omplete lack of understanding of the principl Native Tile ('free allocated land', 'one reason to grant Native
that are not accepted by Aboriginal eople and it shows an t r . that many Aboriginal people wish to establish a secure '
on p. 122 and first on p 123 are pate patronking of current Aboriginal culture and
I The sectiok needs so heavily rewriting that it would be sibpler to drop this whole I
section.
Joan St2 8 February
ples 1995