PASSIVE VIBRATION CONTROL OF AIRBORNE EQUIPMENT … · general ring vibration properties were...
33
PASSIVE VIBRATION CONTROL OF AIRBORNE EQUIPMENT USING A CIRCULAR STEEL RING // / /" Joseph Ellison _, Goodarz Ahmadi i and Mike Kehoe 2 ,i, S,_ // Abstract , /., Vibration isolation is needed to protect avionics equipment from adverse aircraft vibration environments. Passive isolation is the simplest means to achieve this goal. The system used here consists of a circular steel ring with a lump mass on top and exposed to base excitation. Sinusoidal and filtered zero-mean Gaussian white noise are used to excite the structure and the acceleration response spectra at the top of the ring are computed. An experiment is performed to identify the natural frequencies and modal damping of the circular ring. Comparison is made between the analytical and experimental results and good agreement is observed. The ring response is also evaluated with a concentrated mass attached to the top of the ring. The effectiveness of the ring in isolating the equipment from base excitation is studied. The acceleration response spectra of a single degree of freedom system attached to the top of the ring are evaluated and the results are compared with those exposed directly to the base excitation. It is shown that a properly designed ring could effectively protect the avionics from possible damaging excitation levels. I Department of Mechanical and Aeronautical Engineering, Clarkson University, Potsdam, NY 13699-5725 2 NASA Dryden Flight Research Facility, Edwards, CA 93523 https://ntrs.nasa.gov/search.jsp?R=19970037698 2018-06-17T07:37:38+00:00Z
Transcript of PASSIVE VIBRATION CONTROL OF AIRBORNE EQUIPMENT … · general ring vibration properties were...

PASSIVE VIBRATION CONTROL OF AIRBORNE EQUIPMENT
USING A CIRCULAR STEEL RING// / /"
Joseph Ellison _, Goodarz Ahmadi i and Mike Kehoe 2 ,i,
S,_ //
Abstract, /.,
Vibration isolation is needed to protect avionics equipment from adverse aircraft vibration
environments. Passive isolation is the simplest means to achieve this goal. The system used here
consists of a circular steel ring with a lump mass on top and exposed to base excitation.Sinusoidal and filtered zero-mean Gaussian white noise are used to excite the structure and the
acceleration response spectra at the top of the ring are computed. An experiment is performed to
identify the natural frequencies and modal damping of the circular ring. Comparison is made
between the analytical and experimental results and good agreement is observed. The ring
response is also evaluated with a concentrated mass attached to the top of the ring. The
effectiveness of the ring in isolating the equipment from base excitation is studied. The
acceleration response spectra of a single degree of freedom system attached to the top of the ring
are evaluated and the results are compared with those exposed directly to the base excitation. It
is shown that a properly designed ring could effectively protect the avionics from possible
damaging excitation levels.
I Department of Mechanical and Aeronautical Engineering, Clarkson University, Potsdam, NY
13699-5725
2 NASA Dryden Flight Research Facility, Edwards, CA 93523
https://ntrs.nasa.gov/search.jsp?R=19970037698 2018-06-17T07:37:38+00:00Z

Introduction
Vibration control technology is used in many applications in order to protect equipment,
structures or mechanisms from undesirable vibration environments. The isolator design is
normally based on the degree of isolation desired and the frequency range of the disturbance.
Munjal t has organized vibration isolators into groups according to their functions and Snowdon 2
described the use and function of various isolators. Vibration isolation technology has been used
in automobiles, aircraft, spacecraft and even buildings. Applications in the automobile are
geared primarily toward improving ride quality. Aircraft design uses range from power plant,
frictional damping of gas turbine blades 3 and active engine mounts 4, to flutter suppression 5.
Agnes et al. 6 described the vibration problems and solutions typical of fighter aircraft. Space
applications vary in scope from structural control such as demonstrated by the INFLEX
experiment 7 to microgravity isolation s. Recently, application of vibration isolation to the Space
Shuttle was studied by Lee-Glauser, et al.9 and the Space Station vibration control was discussed
by Ellison, et al._o. In the area of earthquake engineering, frictional base isolation systems have
been developed to protect large buildings (Mostaghel, et al. Is, Su, et al. 12 and Fan, et al. 13).
Equipment mounted in aircraft are exposed to a varied vibration environment depending on thelocation of the installation and flight condition as illustrated by Dreher _4. A survey of
environmental data measured in flight such as vibration, acoustic, shock, thermal, flutter and
loads was compiled by Hain et al. Is to define a "real-world" aircraft environment. One particular
example is detailed in the vibration and acoustic measurements report on the F-1 11A aircraft 16.
The vibration environment directly influences the operation, performance and life expectancy of
airborne equipment. To that end, test techniques were developed to evaluate the avionics
equipment endurance based on the source of vibration, installation and response of the blackbox 17.
In order to reduce the environment at the equipment, use of vibration isolation has been
suggested. A number of passive and active vibration control techniques are available and the
choice depends on the degree of isolation that is desired or necessary _s-2_. Typical passive
isolators consist of a resilient element contained in a metallic supporting frame. Generally, the
resilient element is either an elastomer, air, steel spring, wire rope or metal mesh 22. Wire rope
isolators are highly effective in controlling both shock and vibration 23. Passive isolators are
usually capable of up to 80 percent isolation if the isolator natural frequency is less than one-
fourth of the lowest excitation frequency. Tuning of the isolator may be necessary to achieve
such high levels of isolation 24. Active control is used when additional protection is needed.
In this work, a passive isolation system is studied as a prelude to a combined active/passive
system for protecting an avionics box subjected to base excitation. The base isolation system is
composed of stainless steel circular rings placed on the base corners of the avionics box. This
system has the capability of isolating the equipment in various directions. In this initial study,
the avionics box is modeled as a lumped mass and only a single ring isolation system is
considered. The earliest work performed on the free vibration of a circular ring was reported by
Hoppe 25. Further work expanding the scope of the ring vibration problem considered centedine
extension 26 and shear deformation and rotary inertia 273°. In most of the earlier works, the
2

general ring vibration properties were analyzed but no particular vibration isolation applications
were studied. Here, the ring is treated as a component of a passive isolation system and its
performance in protecting the equipment against the adverse vibration environment is evaluated.
An experiment is also conducted to evaluate the vibration characteristics of a typical circular
steel ring for comparison with the analysis. The experiment consisted of a circular steel ring
mounted on top of a small electrodynamic shaker with the response measured by an
accelerometer. The test is performed with and without an attached mass on top of the ring. This
data is then used to verify the computational model.
Sinusoidal and random base excitations are considered and the peak responses of the ring and
attached single degree of freedom systems are evaluated. It is shown that the ring could
effectively reduce the peak acceleration transmitted to the avionics equipment.
Model Formulation
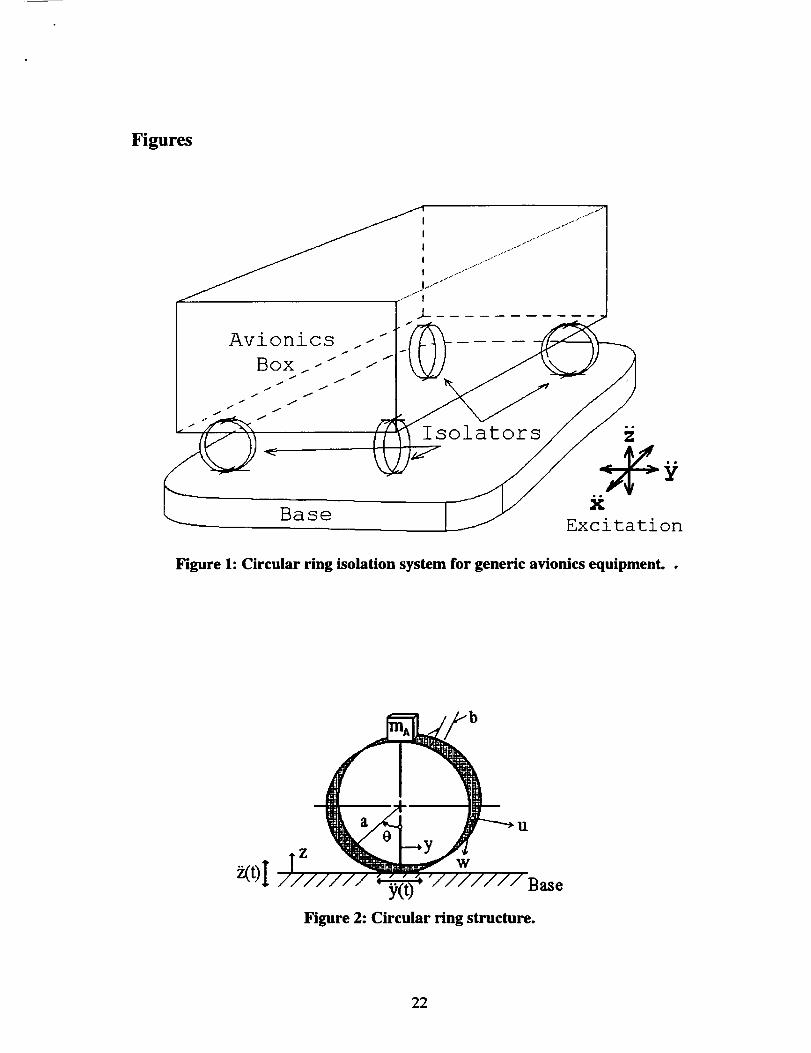
Passive base isolation of an avionics box with the use of circular, stainless steel ring supports
attached to each comer of the equipment is shown schematically in Figure 1. Here, we assume
that the avionics box is a rigid mass and consider the dynamics of a single ring. The basic
configuration of this model, which consists of a thin stainless steel ring rigidly attached to a base
structure and a concentrated mass located at the top, is shown in Figure 2.
Details of the derivation of Love's equation governing the vibration of a circular ring with a
concentrated mass is outlined in Appendix A. Accordingly, the governing equations of motion
for the tangential and the normal components of the ring displacement are given as
0_6 0_4 (O't)+ °92 a4 t_I °_3 I0_0 6 Wa(O't)+ 2-'_ wa -_-_ wa(O't)+ E1 c98 Mp -_-_w, (O,t)
Mpa' d 2 a'( a_q.)E1 -_Two(0, t) = "_- -qw- o_-'---_ , (1)
,9-ff-_-wo(0, t)= -uo(O,t), (2)
where wo is the tangential deflection, Uo is the radial deflection, 0 is the angle measured from
the vertical, t is time, E1 represents the bending stiffness, a is the ring radius, qw is an external
tangential force per unit length and q, is an external normal force per unit length. The mass
distribution of the ring (including the concentrated mass located at the top of the ring) per unit
length is given as 31

= pA + _a t_(0 - 7z), (3)Mp
where p is the mass density of the ring, A is the cross sectional area, m a is the mass of the
avionics box represented by a concentrated mass located at 0 = n and 8 ( ) denotes the Dirac
delta function.
Free Vibration of a Ring
The natural frequencies of the ring are obtained by solving the homogenous form of Eq. (1) (inthe absence of the concentrated mass at the top of the ring). Assuming a solution of the form 28
Wa(O,t)= W(O)e last,
the resulting equation may be restated as
(4)
where
d6W d4W d2W" -- _'_2
d0-----V-+ 2 --_-_- + d--_- ( 1 )+fl2W=0, (5)
f_ 2 092 E1- and 07 02_ . (6)07o2 pAa 4
The appropriate boundary conditions are
w(0)=o t
dW(0) =0-V(0)- dO
d2W(O)dO-----T- -0
at 0=0 andat 0=2_.
The solution to Eq. (5) is given by
6
w(e)= Cse a'°j=l
where the Cs's are found using the boundary conditions given by Eq. (7) and the A
roots of the dispersion equation given as
26 +22 '+A 2(1-.Qz)+D.2 =0.
(7)
(8)
s's are the
(9)
4

When the boundaryconditions are applied to the solution given by Eq. (8), a group of sixsimultaneousequationsareobtained.In matrix form, theseequationsareexpressedas
m
1 1 1 1 1 1
21 3.2 23 3-4 /1"5 3-6
3-12 3.2 z 2_ 2 3-4z 3-s 2 3-6z
e 2,tdt e 2 2z_ e 2 2_n e 2 24n e 2 ,tsn e 2 26x
3.1e2_t, " /],2 e2a2x 3-3e2't, • 3- 4e2'1, x 3-se2a, _ 3.6 e2a'n
3.12e2a, " 3.z2e2a2" 3.32e2_, " 3.42e2,14 x 3.s2e2a, " 3.62e2a,"
B m
CI
Ca
Cs
= 0. (10)
A nontrivial solution for the Cs's exist only if the determinant of the coefficient matrix in (1 O) is
zero.
An iterative procedure is used to find the natural frequencies and the corresponding modal
coefficients. An initial guess for the frequency (fa) is made and then the 3.s's are computed from
Eq. (9). Using these/], s 's, the determinant of the coefficient matrix (10) is evaluated. If the
determinant does not become zero, then the initial frequency guess is adjusted and the process is
repeated until the determinant approaches zero. The mode shape coefficients, Ci, are then
evaluated for each natural frequency using Eq. (10) and choosing C6= 1. The modal coefficientsare then normalized for each mode such that
(11)
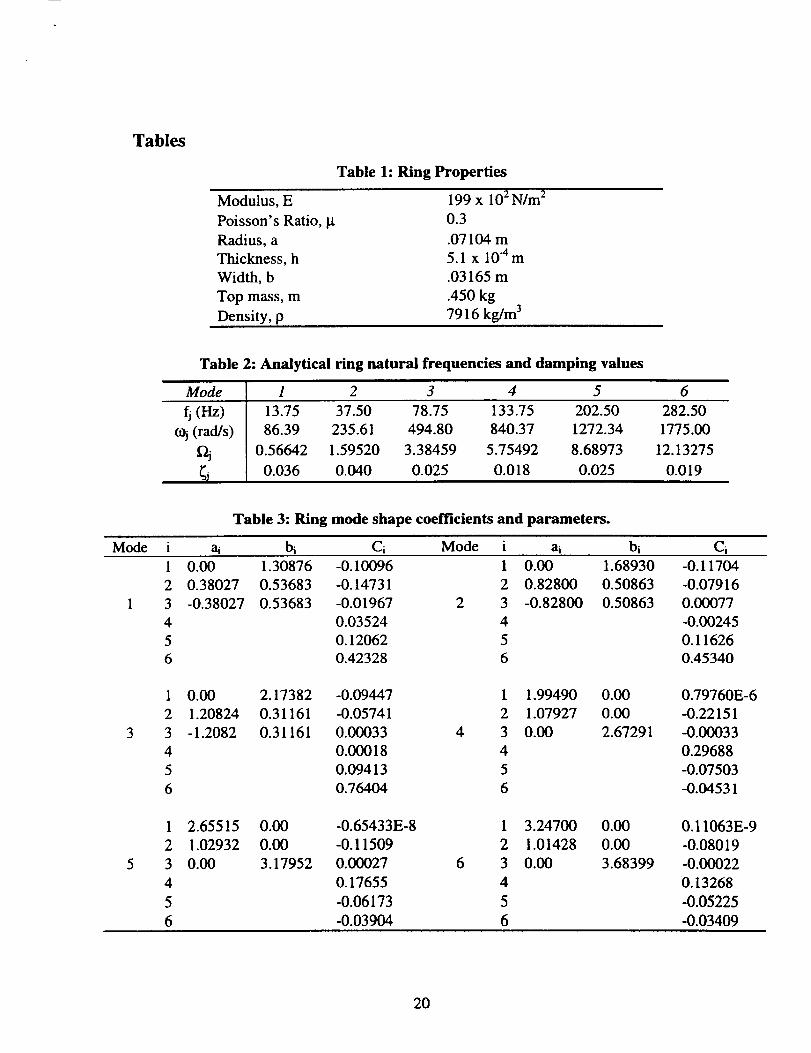
Using the dimensions and physical properties for the circular ring given in Table 1, Eqs. (9) and
(10) are evaluated for £'2, o_j and _. The modal frequencies and corresponding _j's are listed in
Table 2. Due to the complex form of the _ 's obtained, Eq. (8) may be stated as
f 3
[,.,.._ a,lO _ ai.O • bi.kO) for k= 1,2,3,___lt.2i_,.ke cosb_.k0+ t.2_.ke -sm
___Z_lt.2,_l.ke +t.z,.ke )+c.5.kcosb3.,0+C6.,sinb3.,0 for k=4,5,6
(12)
The mode shape coefficients and parameters for Eq. (12) that were found using the frequencies
and _ 's from Eqs. (9) and (10) are listed in Table 3 and the corresponding mode shapes are
shown in Figure 3. The mode shapes are categorized according to their motion at the top of the
ring (0 = _ ), either lateral or vertical. The odd numbered modes exhibit predominantly side to
side motion and are thereby called lateral modes. Whereas the even numbered modes have
5

mostly an up and down responseand thereforeare labeledvertical modes. Only the first sixmodesareshownandusedin thecalculations.
Ring Response Due to Base Excitation
In this section, the response of a circular ring, shown in Figure 2, subjected to base excitation is
analyzed. The absolute motion of the ring is assumed to be given as
Wa(O,t): w(O,t)- y(t)cos0 + z(t)sin0 (13)
and
ua (0,t) = u(O,t)- y(t)sin 0- z(t)cos0 (14)
where u and w are relative, normal and tangential, ring displacements and y and z are basedisplacements.
The motion of the ring relative to the base is assumed to be given by
w(O,t)= _ rlk (t)W k (O) (15)k
and
u(0,t) = _ rlk (t)U k(0) (16)
Substituting Eqs. (3), Eqs. (13) and (15) into Eq. (1) yields
6 4 2
B 2 d d
k dO k dO k
a 4 m. _'(e-g flk(t)--_--+_(t)sine+_(t)cosO+El 2ga
mo "" d2_ "" 2_(t)sine)
,/
a'[ _Oq.)E1 dO ) (17)
Using the relation given by Eq. (5) in Eq. (17) and simplifying yields
d02 _- - _)--d-6-_ (0-: znpAa --d-6r) (
6

= q.,+_ + l+2xpAa _i(0- x))(2_(t)cos0- 2_(t)sin 0)
-_ ma _5'(o-_X_(t)sinO+_(t)cosO). (18)2xpAa
Multiplying Eq. (18) by a normal mode, Wp, integrate around the ring and apply
orthogonality condition given by
the
f (WpW t d2Wk_O=Odo2 k:_ p, (19)
we find
fl_, + 2;pco .flt, +cOeZrip + Kp = Fp + Bp, _(t)+ Bp _.(t) (20)
where
_p = T (21)2pAcOp
is the modal damping coefficient. T is an equivalent viscous damping factor introduced into Eq.
(20), rip is the modal participation factor, cop is the pt, natural frequency, _(t)is the vertical base
excitation and _(t)is the lateral base excitation. The external pressure field is given by
- mag tS(O--rt) (22)q., = 0 and q" 2_a
where mAg is the static weight at the top of the ring.
The coefficients in Eq. (20) are then defined as follows
mA (Kp 21r'pAaN, _fqk Wk(rOW_(x)'_ dWk(l_)dW_(lt)]= _ _-_ ) (23)
F = mAg dWp(_) (24)
t, 2_pAaN p dO
Bp, =_l(2/vpk, SoWp(0)c°s0d0 21r,oaamAWt,(x)) (25)
=-Z_--1(-2 Wp(0)sin0d0-t mA dWp(Tt)lB,, /v,\ _o 2_"Aa dO )
(26)

where
SI "2w'(e)N,= w/(0) do wp(e) e (27)
is the norm of the pm modal amplitude.
The equations given in Eq. (20) are coupled since Kp depends on _k i_, (t). Here, a Gaussian
reduction scheme is used to solve the equations simultaneously for the modal participation
factors in the numerical simulation.
Excitations
Both sinusoidal and random base excitations are used to evaluate the performance of the passive
vibration isolation system. Sinusoidal base accelerations applied are given by
_(t)= Yo sin(co,t) and _(t)= Zo sin(o,t) (28)
where Y,, and Za are the amplitudes, o_ is the excitation frequency and t is time. The base
accelerations, j_(t) and _(t), are used in the following analyses.
The random excitation being used is modeled after NASA Ames/Dryden Flight Research Facility
(ADFRF) process specification No. 21-2 for environmental testing of electronic and
electromechanical equipment 32, as shown in Figure 4. The random excitation model uses the
frequency sampling method to design a nonrecursive finite impulse response (FIR) filter. As
illustrated in Figure 5, zero-mean Gaussian white noise, e(t), is input to the filter (with impulse
response h(t)), and the output being the random excitation, j_(t) or _(t). That is
_(t)= Io h ( t - "c) l_, ('c )d'c and _(t)= _oh(t-x)E_(x)dx. (29)
The mean and autocorrelation of the stationary, Gaussian white noise processes, I_y(t) and t_z(t),
used as the input are given as:
<E,(t))= O, (¢,(tt_,(t2)> = 2_0 ,_(t,-t2)
=0,
(30)
8
wherethe angularbrackets,'(.) ', representensembleaveragingand So, and Soz are the constant
power spectral intensities. The spectral intensity of the white noise excitations for the y and z
directions are assumed to be given as
So, = .0043 g2sec So_ = .0218 gesec. (31)
The value for Sot was estimated so that the spectral density of the vertical random excitation
would fit that of the NASA ADFRF process specification. The lateral value was taken to be one-
fifth the vertical value since the lateral excitation intensity is usually much lower than that of the
vertical excitation in aircraft. The impulse response, h(t), is obtained by inverse Fourier
transform given as
h(t)= _3-1[H(k)] (32)
where H(k) is the system function. The system function is a function of the acceleration power
spectral density function represented in Figure 4 and given by
IU(k)l= 312-- (33)
where N is the number of samples, At is the spacing between time samples and (_(k) is the
power spectral density function.
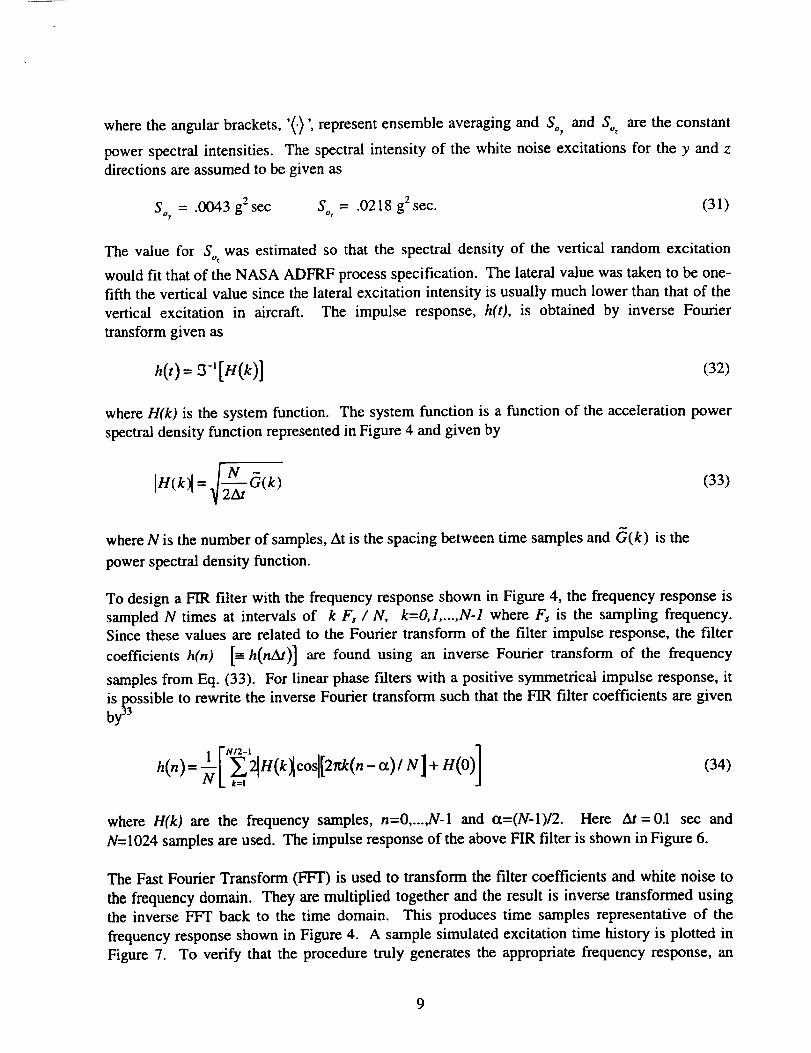
To design a FIR filter with the frequency response shown in Figure 4, the frequency response is
sampled N times at intervals of k F_ / N, k=0,1 ..... N-1 where Fs is the sampling frequency.Since these values are related to the Fourier transform of the filter impulse response, the filter
coefficients h(n) [=-h(nAt)] are found using an inverse Fourier transform of the frequency
samples from Eq. (33). For linear phase filters with a positive symmetrical impulse response, it
is possible to rewrite the inverse Fourier transform such that the FIR filter coefficients are given
by"
I-_v/2-1 ]±/E +n(0)NL k--l
(34)
where H(k) are the frequency samples, n=0 .... ,N-1 and ct=(N-1)/2. Here At =0.1 sec and
N=1024 samples are used. The impulse response of the above FIR filter is shown in Figure 6.
The Fast Fourier Transform (FFT) is used to transform the filter coefficients and white noise to
the frequency domain. They are multiplied together and the result is inverse transformed using
the inverse FFT back to the time domain. This produces time samples representative of the
frequency response shown in Figure 4. A sample simulated excitation time history is plotted in
Figure 7. To verify that the procedure truly generates the appropriate frequency response, an
9
ensembleof 1000sampletime historieswere generated,transformedto the frequencydomainandthe averagedspectrum,-_1_(03_2, wasevaluated.The resultingfrequencyresponseis shownin Figure 8. ComparingFigure 4 and Figure 8, it is observedthat the filter producestimesamplesrepresentativeof thedesiredexcitationspectrum.
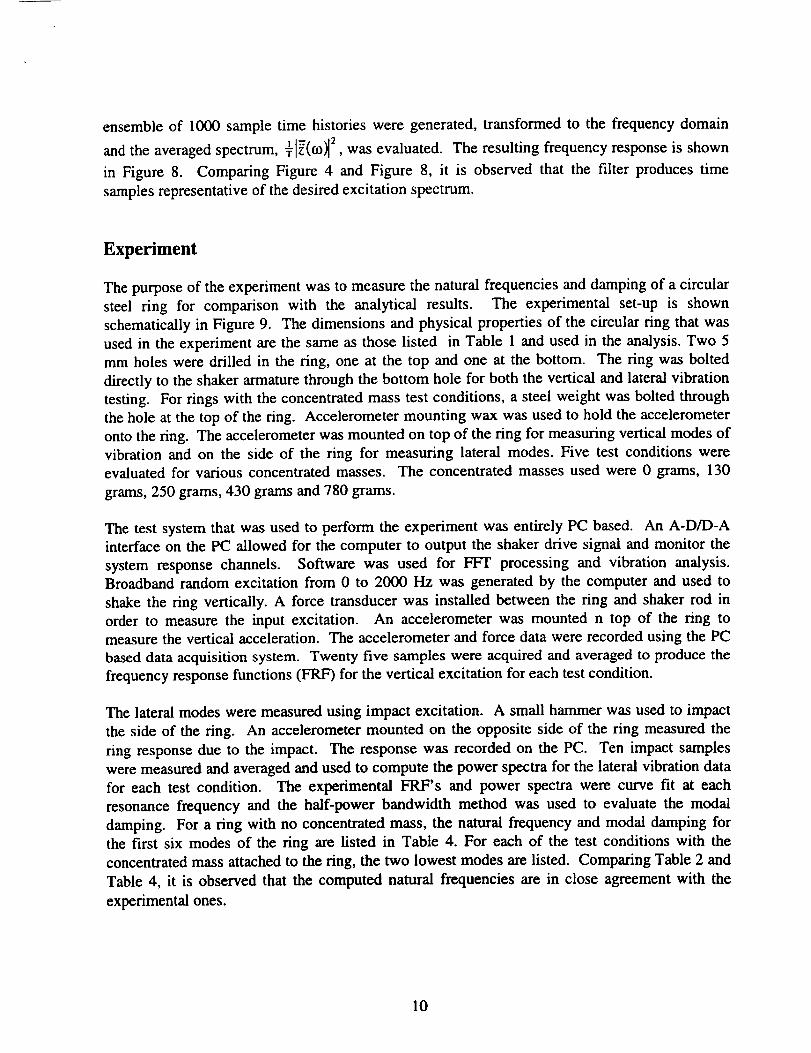
Experiment
The purpose of the experiment was to measure the natural frequencies and damping of a circular
steel ring for comparison with the analytical results. The experimental set-up is shown
schematically in Figure 9. The dimensions and physical properties of the circular ring that was
used in the experiment are the same as those listed in Table 1 and used in the analysis. Two 5
mm holes were drilled in the ring, one at the top and one at the bottom. The ring was bolted
directly to the shaker armature through the bottom hole for both the vertical and lateral vibration
testing. For rings with the concentrated mass test conditions, a steel weight was bolted through
the hole at the top of the ring. Accelerometer mounting wax was used to hold the accelerometer
onto the ring. The accelerometer was mounted on top of the ring for measuring vertical modes of
vibration and on the side of the ring for measuring lateral modes. Five test conditions were
evaluated for various concentrated masses. The concentrated masses used were 0 grams, 130
grams, 250 grams, 430 grams and 780 grams.
The test system that was used to perform the experiment was entirely PC based. An A-D/D-A
interface on the PC allowed for the computer to output the shaker drive signal and monitor the
system response channels. Software was used for FFI" processing and vibration analysis.
Broadband random excitation from 0 to 2000 Hz was generated by the computer and used to
shake the ring vertically. A force transducer was installed between the ring and shaker rod in
order to measure the input excitation. An accelerometer was mounted n top of the ring to
measure the vertical acceleration. The accelerometer and force data were recorded using the PC
based data acquisition system. Twenty five samples were acquired and averaged to produce the
frequency response functions (FRF) for the vertical excitation for each test condition.
The lateral modes were measured using impact excitation. A small hammer was used to impact
the side of the ring. An accelerometer mounted on the opposite side of the ring measured the
ring response due to the impact. The response was recorded on the PC. Ten impact samples
were measured and averaged and used to compute the power spectra for the lateral vibration data
for each test condition. The experimental FRF's and power spectra were curve fit at each
resonance frequency and the half-power bandwidth method was used to evaluate the modal
damping. For a ring with no concentrated mass, the natural frequency and modal damping for
the first six modes of the ring are listed in Table 4. For each of the test conditions with the
concentrated mass attached to the ring, the two lowest modes are listed. Comparing Table 2 and
Table 4, it is observed that the computed natural frequencies are in close agreement with the
experimental ones.
10

Results
Computer simulation of the ring response is performed by solving Eqs. (13)-(16) and Eq. (20)
subjected to random base excitations. A typical circular ring with the dimensions and physical
properties given in Table l is analyzed. The ring fundamental frequency is 13.75 Hz with a
damping ratio of 0.036. Two ring configurations, one without any concentrated mass and one
with a 0.45 kg mass added on top of the ring, are examined. The ring deflection is given by
u = u 5 + u e , (35)
where u, is the static deflection under the weight and ue is the deflection relative to the static
equilibrium. In this section, the vibration of the ring about the static equilibrium is studied. The
static deflection, us, results from the gravitational force term given by Eq. (24). To achieve this
in the numerical simulation, Eq. (20) is evaluated in the absence of base excitation, i.e.,
Frip P (36)2 "
top
This equation is evaluated and the modal participation factors are recorded. These values then
establish the static equilibrium position of the ring due to the concentrated mass and can be
calculated using Eqs. (2), (12), (16) and
.5(0.0-- (37)
Subsequent analyses are then conducted using this static equilibrium position as a starting point.
The stored values are used as initial conditions for solving Eq. (20) under base excitation.
Using both sinusoidal and random excitations, the acceleration at the top of the ring and the
response of a single degree of freedom (SDOF) system attached to the top of the ring are
evaluated. The peak responses of the ring are computed for a range of ring frequencies. To
assess the effectiveness of the base isolation at the point on the ring where the equipment is
attached, acceleration response spectra are evaluated. The lateral and vertical acceleration
response spectra are respectively defined as
s.(,,,..;.)-rnax ,,,. (38)
and
So (o}., ;o) = mtax_/i. (re, t_}. (39)
For random excitation, the mean, the standard deviation, the absolute maximum and the absolute
minimum acceleration are defined, respectively, as:
11

;(,,,°,;.)=(so(,,,°,;o)),/ _ 2_1/2
) ,a,,_ (o),, ,_,,) = max{So(m,,,;,,) } ,
¢.)=min{So(o,o,
(4o)
(41)
(42)
(43)
It should be noted that the absolute maximum and minimum accelerations, which represent upper
and lower bounds on the simulation results, are sample dependent.
Comparison of Numerical and Experimental Results
Ring without concentrated mass
In order to verify the validity of the numerical model, the analytical ring response is computed in
the same manner as was done in the experiment. Random excitation given by Eq. (29) is used to
excite the ring in both lateral and vertical directions. The response at the top of the ring is
computed and used with the input base excitation to generate vertical and lateral frequency
response functions as shown in Figure 10 and Figure 11, respectively. The experimental
frequency response functions are also plotted in these figures for comparison. The peaks in each
frequency response function correspond to the natural frequencies of the ring as listed in Table 2.
The damping values that were calculated from the experimental data as listed in Table 4 were
used in the analytical model.
Figure 10 and Figure 11 show reasonable general agreement between the experimental and
numerical frequency response functions. However, the amplitude of the peak values at each
resonant frequency are not in agreement between experiment and analysis. Part of the difference
in peak amplitude may be due to the frequency response of the accelerometer used. The
accelerometer is rated for an operating range of 10-10000 Hz. The accelerometer frequency
response is level down to about 100 Hz. However, the response starts to roll off below 100 Hz
and the accelerometer is unusable below about 10 Hz. Therefore the amplitude of the
experimental resonant frequencies below 100 Hz are attenuated for both the vertical and lateral
results. The peak response amplitudes of the lateral results can not be compared directly since
the experimental results were acquired with impact excitation producing power spectra density
functions and the numerical results were generated with random excitation giving frequency
response functions.
Ring With Rigid Avionics
Next, the circular ring with a 0.45 kilogram rigid avionics mass attached to its top is analyzed.
The ring response is computed in the same manner as outlined above for Figure 10 and Figure
11. Random excitation given by Eq. (29) is used to excite the ring in both the lateral and vertical
directions. Vertical and lateral frequency response functions are plotted in Figure 12 and 13.
12

Experimentalfrequencyresponsefunctionsarealsoshownin thesefiguresfor comparison.Thering geometryis the same as that used earlier with the exceptionof the additional mass.ComparingFigure 10and 11with Figure 12and 13,it is noticedthatthering naturalfrequenciesarelowerwith theadditionalmasson top asexpected. Both experimentalandnumericalresultsindicatea decreasein the naturalfrequencieswith fairly closeagreementbetweenthe two. Theobservedvariations in the resonant frequency peak amplitudes are due to accelerometerfrequencyresponsecharacteristicsandfor the lateralcase,arealsodueto the differentmethodsof excitationused. Numerical resultsfor the lateralcaseareproducedwith randomexcitationwhereasimpactexcitationis usedin theexperiment. Figure 12and 13showcloseagreementinoveralltrendsbetweentheexperimentalandnumericaldata.
Avionics Box Under Sinusoidal Excitation
In this section, responses of a SDOF avionics box subject to horizontal-vertical sinusoidal base
excitation with and without a ring isolation system are studied. Figure 14 illustrates the system
configurations considered. Sinusoidal base excitation, as given by Eq. (28), is used. The
amplitude, A, of the input excitation is 0.01 g's in the vertical direction and 0.002 g's in the
lateral direction. The excitation frequency, fe, is 400 Hz. The peak responses of the system are
computed for a range of avionics equipment system frequencies from 50 to 500 Hz. Table 1 lists
the physical properties of the ring used in the analysis with the natural frequencies that appear in
Table 2. The interaction of the avionics system and the ring is neglected in the following
analyses since it is assumed that the avionics system is rigidly attached to the ring.
The vertical and lateral acceleration response spectra of the avionics system are plotted in Figure
15 and Figure 16. The cases of unprotected avionics and avionics with the ring are shown. For
the avionics with the ring, two different responses are shown. No interaction implies that there
was no coupling between the avionics and ring degrees of freedom. The response at the top of
the ring was computed and used as excitation to the SDOF avionics box. The rigid mass
response implies that the avionics box is treated as a rigid mass of 0.45 kg. Both figures show a
peak at the excitation frequency of 400 Hz due to the resonance of the SDOF system with the
excitation frequency. The ring natural frequencies given in Table 2 are not excited by the
sinusoidal excitation as shown by the plots. For the vertical direction, there is a 50% decrease in
the transmitted acceleration to the avionics system on top of the ring with no interaction mass
and an order of magnitude decrease for the rigid mass case as compared to the avionics system
exposed directly to the sinusoidal excitation, unprotected avionics. Similar decreases are seen for
the transmitted acceleration in the lateral direction. There is an order of magnitude decrease for
the avionics system on the ring with no interaction mass and a one and a half order of magnitude
decrease when the avionics on top of the ring is treated as a rigid mass. Clearly, the ring
provides significant passive isolation for the avionics box.
Ring Response to Random Excitation
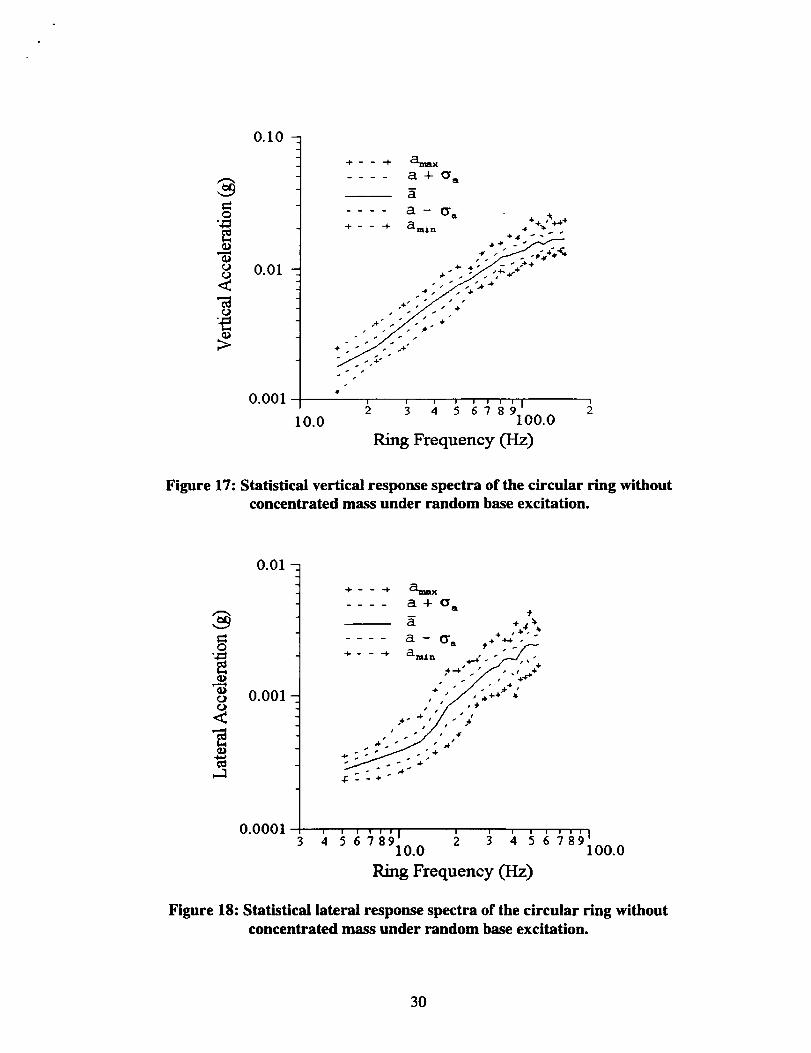
For the case of a single ring (in the absence of a concentrated attached mass), the vertical ring
response spectra for the top of the ring are plotted versus ring frequency in Figure 17 and the
lateral response spectra are plotted in Figure 18. The peak responses for an ensemble of 100
13
samples are computed using the random excitation given by Eq. (29) and the results are compiled
and the statistical response spectra are evaluated from Eqs. (38)-(43). The input power spectra
density level is 0.04 g2/Hz up to 150 Hz and then increases at 4 DB/Oct to 0.10 g2/Hz at 300 Hz
as shown in Figure 4 and Figure 8. Six modes are included in the numerical ring model. The
mean vertical acceleration spectrum starts at about 0.002g for a ring frequency of 15 Hz and
increases over the frequency range plotted leveling off to about 0.025g at a frequency of about
150 Hz. The mean lateral vibration starts off at about 0.0003g at the lower frequencies (about 5
Hz) and steadily increases to about 0.003g at a frequency of 60 Hz. This increase in acceleration
is a result of the higher frequency modes responding to the increasing excitation levels The
maximum and minimum acceleration levels are an extreme upper and lower bound, respectively,
for the computed vibration spectrum.
To evaluate the effects of damping on ring performance, the vertical ring acceleration response
spectra as a function of structural damping are calculated and plotted in Figure 19. The other
ring parameters are as given in Table I. The results are as expected, indicating a decrease in
transmitted vibration with an increase in structural damping. It is observed from the graph that a
damping value of about six percent provides satisfactory isolation. For a passive ring system
having six percent damping as compared to that with a two percent damping, there is a 36%
decrease in transmitted excitation. Whereas another four percent increase in damping above six
percent only provides an additional 14% decrease in the transmitted vibration. Increasing the
damping in the ring system above ten percent provides little if any improvement in the vibration
environment at the top of the ring.
Avionics Under Random Excitation
For the random base excitation, comparison is made between the acceleration responses of the
avionics system mounted on top of the ring (treated as a rigid 0.45 kg concentrated mass) and the
unprotected avionics system. The system response is computed for a range of avionics system
frequencies from 50 to 500 Hz. The sensitivity to variations in the ring damping ratio on the
response spectra is also examined. The resulting response spectra are plotted versus the avionics
system frequency. As was noted before, the avionics system is treated as a rigid concentrated
mass attached to the ring and the interaction between the avionics system and the ring isneglected.
The vertical and lateral avionics system acceleration response spectra with and without the ring
are plotted in Figure 20 and Figure 21. Comparing the response of the isolated avionics to that of
the unprotected avionics, the transmitted vibration to the avionics system is cut in half using the
ring as a passive isolator. When the avionics system is rigidly mounted on top of the ring, the
acceleration levels are magnified at the ring natural frequencies as compared to the rest of the
acceleration response. However, these levels are still considerably lower than the acceleration
levels for the unprotected system. Even the maximum calculated acceleration levels of the
isolated system are less than half the unprotected avionics minimum response. In the lateral
direction, the ring isolates the avionics system by at least an order of magnitude over the entire
frequency range. The isolated avionics response again is greater at the ring resonant frequencies
14

ascomparedto therest of thespectrum.The ring performsbetterin the lateraldirectionby nottransmittingthelateralexcitationinto theavionicssystemasreadilyastheverticalexcitation.
Thepeakaccelerationresponseof the avionicssystemrigidly mountedto thering is calculatedfor severaldampingratios and plotted as a function of avionics frequencyin Figure 22 andFigure23. Thesecurvesarecomparedto theresponseof the unprotectedavionicssystem.Thedefaultdampingvaluesreferredto in thefiguresare thoselisted in Table 2 with the 100%valuebeingtwice what is listed and-50% beinghalf the listed value. As shownin both figures, thepeak accelerationdecreaseswith increasing structural damping. Again, the results are asexpected.Increasingthe ring dampingincreasesthe isolation effectivenessof the passiveringelementandthepeak accelerationlevels for all dampingvaluesare lessthan thelevels for theunprotectedsystem.
Conclusions
An analytical model of a stainless steel circular ring for the purpose of base isolation of avionics
equipment is formulated. This model is used to evaluate the circular ring response characteristics
subject to base excitation. Filtered zero-mean Gaussian white noise was tuned to match the
NASA process specification No. 21-2 and is used for the random excitation. Peak acceleration
response spectra are evaluated as a function of avionics frequency and ring structural damping.
The ring is evaluated as an passive isolator for a rigidly mounted avionics system. This system is
compared to the response of the unprotected system. An experiment was performed to measure
the modal response of the thin circular steel ring mounted on top of an electrodynamic shaker.
The analytical ring responses closely match the experimental results. The peak avionics system
acceleration spectra indicate that the ring is an effective isolator in both the vertical and lateral
directions.. .... ;. ", _ _:_
The sensitivity of the ring response and avionics system response to variations in ring parameters
and additional mass on top of the ring is examined. With no added mass at the top of the ring,
the peak ring acceleration increases with increasing excitation. Changes in structural damping
produce expected results in peak ring acceleration; decreasing transmitted acceleration with
increasing damping factor. Overall, the ring and avionics system response were insensitive to
small variations in ring properties.
Acknowledgments
This work is supported by the NASA Dryden Flight Research Facility, Edwards, CA under the
Grant No. NGT-51314.
15

References
1 Munjal, M.L., A Rational Synthesis of Vibration Isolators, Journal of Sound and Vibration,
Vol. 39, pp. 247-263, 1975.2 Snowden, J.C., Vibration Isolation Use and Characterization, Journal of the Acoustical Society
of America, Vol. 66, pp. 1245-1279, 1979.
3 Plunkett, R., Damping Applications for Vibration Control, Friction Damping, ASME Booklet,
AMD-38, 1980.
4 Sumali, H. and Cudney, H.H., An Active Engine Mount- with a Piezoelectric Stacked Actuator,
35th Structures, Structural Dynamics, and Materials Conference, AIAA-94-1466-CP, April 1994.
5 Triplett, W.E., Kappus, H.F. and Landy, R.J., Active Flutter Suppression Systems for Military
Aircraft: A Feasibility Study, Air Force Flight Dynamics Laboratory, AFFDL-TR-72-116, 1973.
6 Agnes, G.S., Whitehouse, S.R. and Mackaman J.R., Vibration Attenuation of Aircraft
Structures Utilizing Active Materials, Proceedings of the Smart Structures and Materials
Conference, Vol. 1917(1), pp. 368-379, Feb. 1993.
7 Gogan, R.E., INFLEX Final Report, Harris Corporation, Melbourne, FL, Dec. 1992.
s Knospe, C.R., Hampton, R.D. and Allaire, P.E., Control Issues of Microgravity Vibration
Isolation, Acta Astronautica, Vol. 25(11), pp. 687-697, Nov. 1991.
9 Lee-Glauser, G. and Ahmadi, G., Dynamic Response Spectra for an Aerospace Payload and Its
Attachment, Clarkson Report No. MIE-232, 1991.
10Ellison, J., Ahmadi, G. and Grodsinsky, C., Evaluation of Passive and Active Vibration
Control Mechanisms in a Microgravity Environment, J. of Spacecraft and Rockets, Vol. 32, No.
2, pp. 375-376, March 1995.
I I Mostaghel, N. and Tanbakuchi, J., Response of Sliding Structures to Earthquake Support
Motion, Earthquake Engng. Struct. Dyn., Vol. 11, pp. 729-748, 1983.
12 Su, L., Ahmadi, G. and Tadjbakhsh, I.G., A Comparative Study of Base Isolation Systems, J.
of the Engng. Mechanics Division, ASCE, Vol. 115, pp. 1976-1992, 1989.t3 Fan, F. and Ahmadi, G., A, J., 19xx.
,4 Dreher, J.F., Aircraft Equipment Random Vibration Test Criteria Based on Vibrations Induced
By Turbulent Airflow Across Aircraft External Surfaces, Shock and Vibration Bulletin, Bulletin
43, Part 3, pp. 127-139, June 1973.
15Hain, R.F., Coronado, A.R. and Dillard, M., Bibliography of Environmental Data Measured in
Flight, Air Force Flight Dynamics Laboratory, AFFDL-TR-93-XXX, 1993.16Fisher, C.P. and Price, R.G., Vibration and Acoustic Measurements on F-111A Number 75,
Clean Airplane in Level Flight, General Dynamics Corporation, FZS-12-321, March 1971.
17Wafford, J.H., Application of MIL-STD-810C Dynamic Requirements to USAF Avionics
Procurements, AGARD Report No. 682, pp. 1-1 -- 1-11, Nov. 1979.
is Geng, Z. and Haynes, L.S., 6-Degree-of-Freedom Active Vibration Isolation Using a Stewart
Platform Mechanism, Journal of Robotic Systems, Vol. 10(5), pp. 725-744, 1993.
19 Huba, A., Vibration Isolation of Hpt-Equipment, Mechatronics, Vol. 37(2), pp. 204-205, 1991.
2o Chen, H.M. and Lewis, P., Adaptive Control for a Vibration Isolation Mount, Trans. of the
ASME, Noise, Control and Acoustics, Vol. 8, pp. 121-124, 1990.
21 Nelson, P.G., An Active Vibration Isolation System for Inertial Reference and Precision
Measurement, Review of Scientific Instruments, Vol. 62(9), pp. 2069-2075, 1991.
16

22Gilbert,C. andLeKuch,H., IsolatingShockandVibration, MechanicalEngineeringJournal,pp.58-63,Oct. 1982.23Tinker, M.L. andCutchins,M.A., DampingPhenomenain a Wire RopeVibration IsolationSystem,Journalof SoundandVibration,Vol. 157(1),pp.7-18, 1992.24Stech,D.J.,$H_{2}$ Approachfor Optimally TuningPassiveVibration Absorbersto FlexibleStructures,J.Guidance,Vol. 17(3),pp. 636-638,1993.25Hoppe,R.,TheBendingVibrationsof aCircular Ring, CrelleJournalof Mathematics,Vol.73,pp. 158,1871.26Philipson,L.L., On theRoleof Extensionin theFlexuralVibrationsof Rings,JournalofAppliedMechanics,Vol. 23,pp.364-366,1956.27Seidel,S.andErdely,E.A.,On theVibration of aThick Ring in its Own Plane,JournalofEngineeringfor Industry,Vol. 86,pp.240,1964.2sRat, S.S.andSundararajan,V., In-planeFlexuralVibrationsof Circular Rings,JournalofAppliedMechanics,Vol. 9 l, pp.620-625,Sept.1969.29Rat, S.S.,Effectsof TransverseShearandRotatoryInertiaon theCoupledTwist-BendingVibrationsof Circular Rings,Journalof SoundandVibration, Vol. 16,pp. 551-566,1971.30Kirkhope,J.,SimpleFrequencyExpressionfor theIn-planeVibration of Thick CircularRings,Journalof theAcousticalSocietyof America,Vol. 59,pp.86-89, 1976.31Ahmadi,G. andSatter,M.A., On theRandomVibration of aDampedSimply SupportedBeamCarryingConcentratedMasses,IndustrialMathematics,Vol. 24(1),pp. 19-27,1974.32NASA Ames-DrydenFlight ResearchFacility, EnvironmentalTesting:ElectronicandElectromechanicalEquipment,ProcessSpecificationNo. 21-2.33Ifeachor,E.C.andJervis,B.W., Digital SignalProcessing:A PracticalApproach,Addison-WesleyPublishingCo.,NY, 1993.
Soedel,Werner,Vibrationsof ShellsandPlates,2nded.,MarcelDekker,Inc., NY, 1993.
17
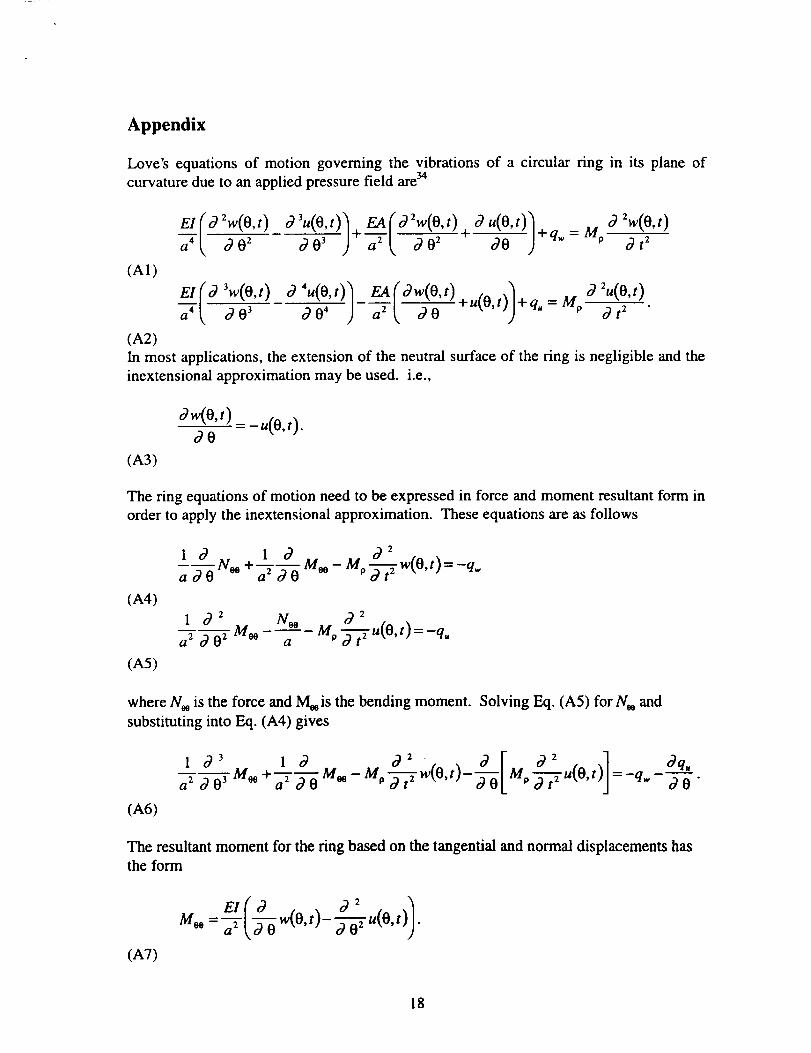
Appendix
Love's equations of motion governing the vibrations of a circular ring in its plane of
curvature due to an applied pressure field are 34
(A1)
7 J-Tt --Mpo3 Zu(0't)
(A2)
In most applications, the extension of the neutral surface of the ring is negligible and the
inextensional approximation may be used. i.e.,
aw(o,,)_d0
u(O,t).
(A3)
The ring equations of motion need to be expressed in force and moment resultant form in
order to apply the inextensional approximation. These equations are as follows
(A4)
(A5)
f0 'f01 Noo "_ Moo- Mp-_w(O,t)=-qwa a 2
1 d z Noo O32a 200 z Moo a Mp ff_- u(0,t) = -q.
where Noo is the force and Moois the bending moment. Solving Eq. (A5) for N0o and
substituting into Eq. (A4) gives
1 O3 O32 . d [" 02 . ] o3q.a z o3 0 Moo - M, _ w(0,,)- _'--_LMP _2t2 u{.O,, ) =-q_, ---ff-_.
(A6)
The resultant moment for the ring based on the tangential and normal displacements has
the form
EIo3 o32
Moo=--_-(-_w(O,t)--_u(O,t)).
(A7)
18

Using the inextensional approximation, Eq. (A7) can be expressed in terms of the
tangential displacement as
d3 /Moo = a 2 t 030 w( O, t ) + -ff-_ w( O, t )
(A8)
or in terms of the normal displacement as
(A9)
032
Substituting Eqs. (A3) and (A8) into Eq. (A6) gives the equation for the tangential
component of the ring motion as follows
60_ 4 0_2 a4 [0_ o_ 3 ]
,9w_(O,t)+ 2 (0, t)+-ff-_wo(O,t)+ wo(O,t)d 0 6 -ff-_ wa E1 o_ 0 Mp o_ Oo_t 2
a' a'( /M p 03 2 03q.E] 03/.2 wo(0, t)= -_- -qw 030 '
The normal component of the ring motion is obtained from Eqs. (A3) and (A10).
19
Tables
Table 1: Ring Properties
Modulus, E 199 x l02 N/m 2
Poisson's Ratio, Ix 0.3
Radius, a .07104 m
Thickness, h 5.1 x 10⁴m
Width, b .03165 m
Top mass, m .450 kg
Density, p 7916 kg/m 3
Table 2: Analytical ring natural frequencies and damping values
Mode 1 2 3 4 5 6
fj (Hz)
(rad/s)
;9
13.75 37.50 78.75 133.75 202.50 282.50
86.39 235.61 494.80 840.37 1272.34 1775.00
0.56642 1.59520 3.38459 5.75492 8.68973 12.13275
0.036 0.040 0.025 0.018 0.025 0.019
Table 3: Ring mode shape coefficients and parameters.
Mode i ai bi Ci Mode i ai bi Ci
1
2
3 3
4
5
6
1
2
5 3
4
5
6
1 0.00 1.30876 -0.10096 1 0.00 1.68930 -0.11704
2 0.38027 0.53683 -0.14731 2 0.82800 0.50863 -0.07916
3 -0.38027 0.53683 -0.01967 2 3 -0.82800 0.50863 0.00077
4 0.03524 4 -0.00245
5 0.12062 5 0.11626
6 0.42328 6 0.45340
0.00 2.17382 -0.09447 1 1.99490 0.00 0.79760E-6
1.20824 0.31161 -0.05741 2 1.07927 0.00 -0.22151
-1.2082 0.31161 0.00033 4 3 0.00 2.67291 -0.00033
0.00018 4 0.29688
0.09413 5 -0.07503
0.76404 6 -0.04531
2.65515 0.00 -0.65433E-8 1 3.24700 0.00 0.11063E-9
1.02932 0.00 -0.11509 2 1.01428 0.00 -0.08019
0.00 3.17952 0.00027 6 3 0.00 3.68399 -0.00022
0.17655 4 0.13268
-0.06173 5 -0.05225
-0.03904 6 -0.03409
20
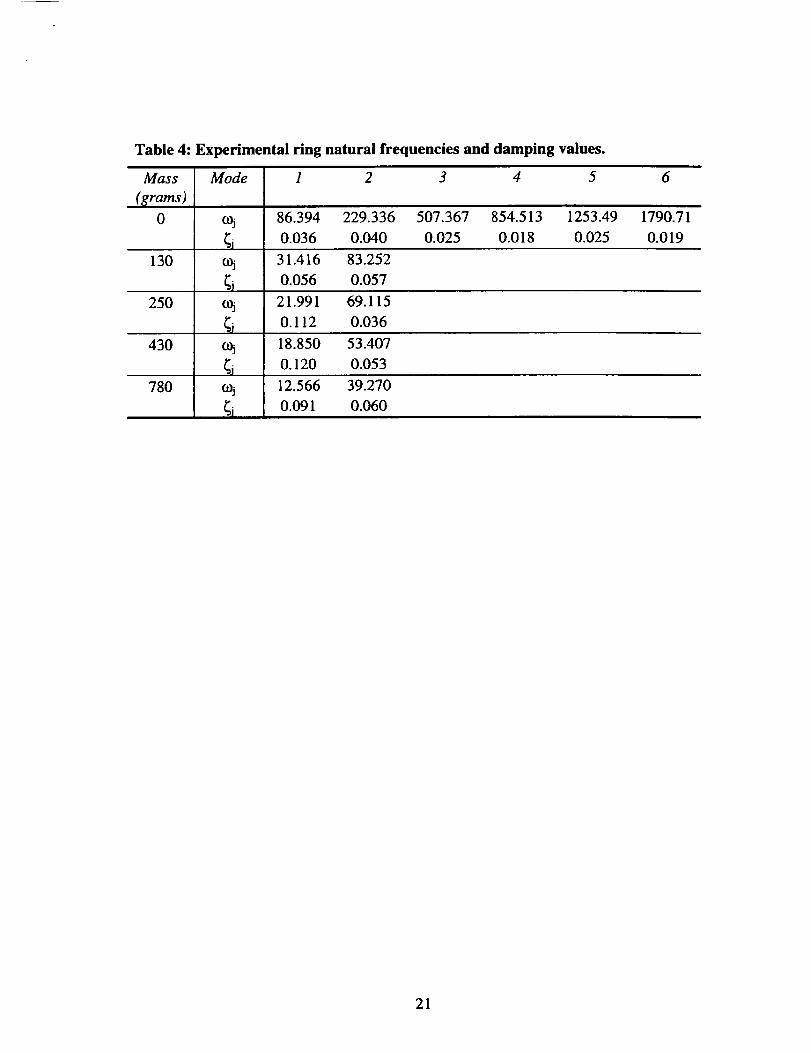
Table 4: Experimental ring natural frequencies and damping values.
Mass
($rams)
0
130
250
430
780
Mode
;jo_
o_
o_
1 2 3 4 5 6
86.394 229.336 507.367 854.513 1253.49 1790.71
0.036 0.040 0.025 0.018 0.025 0.019
31.416 83.252
0.056 0.057
21.991 69.115
O. 112 0.036
18.850 53.407
O. 120 0.053
12.566 39.270
0.091 0.060
21
Figures
Figure 1: Circular ring isolation system for generic avionics equipment. .
--¢ 11
Figure 2: Circular ring structure.
22

/ .
/ / \ _.,
ii" \11i I)
_,\, J J/'\,, I //
II111t11111/tfltl/Mode i
//
Mode 2
l\k It\,. \ ... _/...l i/i/
II/II/IIIIII////II
Mode 3
tr -_-
f
////i/
1 ,
////////
\\
t,,]
_7/P-/IIIIIMode 4
f1 - f
////////////////I/
Mode 5
f-sJ--__f/ J
t
{/,/i\
,<Ix
/////7_//,
\$
t
I{,>,
i'/
"/7///////
Mode 6
Figure 3: Circular ring mode shapes.
23

el.u_
O
0.10
0.04
0.01
+4 DB/OCT. //12.2 OR-MS
0.005 . ' ' ' ' ' ' "1 ' _ I ,150 300
10 100
Fr_m_ (Hz)
I I | | n
D O T.
2OO01000
Figure 4: NASA ADFRF process specification No. 21-2.
Gmmsian Random
White Noise Filter Excitation
h (co)n(t) [ H(k)] _(t)
Figure 5: Random excitation model.
003
0.02
i 0.01
0.00
-o.oi I
0.000 Q002 0.004 0.006Time (sac)
' I0 .ooe
I
0.010
Figure 6: Impulse response function.
24

0.08
c_
0.04
0.00
-0.04
-0.08
-0.12 I I I I
0.00 0.02 0.04 0.06 0.08
Time (sec)
Figure 7: Sample excitation time history.
I
0.10
_-" 0.10
'_ 0.04lID
0.01
0.005
10.00°'''1 ' ' ' _ _ '''1
100.00 1000.00
Frequency (Hz)
I I
Figure 8: Frequency response of an ensemble average of 1000 time samples.
25

accelerometer _ Pr_amp
mass_ ....
ring_b°slte & "_-9 In_____l
Shaker _D_AC Out
////////F_////// Power Supply
Lap-top
PC
Controller
Figure 9: Experiment set-up for circular ring vibration.
20.00 --
10.00 --
o.oo ' I000 100.00
20.00 --
Exp©_czJ_ Results
' I ' I ' I20000 300.00 400.00
Frequency (Hz)
10.00
0.00
i
J
0.00
Numa_cM Results
I
' I ' I ' I ' I100.00 200.00 300.00 400,00
Frequency (I'I.z)
Figure 10: Comparison of analytical and experimental frequency response functionsfor the circular steel ring for vertical excitation.
26

e_
o
20 00 m
10.00
ooo0.00
20. O0 --
i I 'I (:X).(:X3 20000
Frequency (l[-Iz)
Exp _n'_-nUd Rc_u_i_
I ' 6
30000 400.00
o
t0.00
OC_' I ' I '
0.OO 100.O0 2OO.00
_v_, _z)
1,4"t_L_i c LI R_ suD--
I ' I
300.00 400.00
Figure 11: Comparison of analytical and experimental results for the circular steel
ring for lateral excitation.
40.00 --
o
20 O0
000
40.00 --
Exp_menud Results
I ? f
' I ' I ' I '1
o.oo _o_.oo 2oo.oo 3o0.00 40o.00Frequency (Hz)
i20. O0
O.OO!
0.00
Nun_cal R_sults
[ ' I I ' I
100.00 200.00 300.00 400.00
Figure 12: Comparison of analytical and experimental frequency response functions
for the circular steel ring with a 0.45 kg concentrated mass under vertical random
base excitation.
27

o
10.00 1
5.00--
0.00
0.00
10.00 --
F_xpmmm_ Results
,J
100.00 200.00 300.00 400.00
Frequency_L_)
u
o
5.00
Num_cal Results
000I ' I ' I ' I ' I
0.00 100.00 200.00 300.00 400.00
Frequene,(Hz)
Figure 13: Comparison of analytical and experimental results for the circular steel
ring with a 0.45 kg concentrated mass under lateral random base excitation.
(a) Co)
"" D
Figure 14: Single degree of freedom system configurations: (a) SDOF system
exposed to random excitation without ring, (b) SDOF system exposed to transmitted
vibration at top of ring.
28

O
i-4O
oo
O
O
1.000 --:
0.100 -
0.01O
0.001
10.00
-- Unprotected Avionics
Avionics with Ring (No Interaction)
-- -- Avionics with Ring (Rigid Mass)
//,/1 \
\
2 3 4 J 6 3' 8 9 2 3 4 _ 6 ? 8 9
1O0.O0 1000.00
Avionic Frequency (Hz)
Figure 15: Comparison of vertical response spectra of an avionics system with and
without the circular ring under sinusoidal base excitation.
I.OOE-I --
._ I.OOE-2 -
_ I.OOE-3,-.1
Unprotected AvionicsAvionics with Ring (No Interaction)
Avionics with Ring (Rigid Mass)
Zi t
• i
!
/ \
10.00 .00 .00
Avionic Frcqu©ncy (Hz)
Figure 16: Comparison of lateral response spectra of an avionics system with andwithout the circular ring under sinusoidal base excitation.
29
O
tD,----4
(D
O
<
O
(I'D;>
0.10
0.01
0.001
10.0
.... a+o.
.... a- (3"a+ -_ a,atn 4.4-,_4-_4-
4.4 _"
4.4,
s • • •
_ p_ r
4,
9100.0
Ring Frequency (Hz)
Figure 17: Statistical vertical response spectra of the circular ring withoutconcentrated mass under random base excitation.
o
0_v-..-q
<DO¢2
0.01 -
0.001
0.0001
+ - - "4"
.... a+o a
a- 4-,"v.\
....a2o .-4- - - ..4-
• t 4.14--=@ • . # 4.
st4." " " _ " 4. s
_- s s • I
I3 4 5 6 78"910.0 _ 3 4 5 6 789100.0
Ring Frequency (Hz)
Figure 18: Statistical lateral response spectra of the circular ring withoutconcentrated mass under random base excitation.
30

o
"4(.bt.)
<
¢.)
>
0.04--
0.03
0.02
0.01
4--- -- -b _X
_ _ . a+o a
\i .... a - (_,
\\ x-- - -x a,,un
_'Q. -. +
-w".,_._ ,2_ ,7__¢
0.00 ' I ' I ' I0.00 0.04 0.08 0.12
Structural Damping
Figure 19: Statistical vertical response spectra of the circular ring as a function of
damping under random base excitation.
o
¢.t
¢.J
>
I.OOE- 1
1.00E-2 -
1.00E-3
a4-o.
..... a - Or.
.._ _ _. am.in
Unl_tected Avionics
/'.44 4
Isolated Avionics 'k__
%..P_
' ' ' ' ' ' ' ' I , , , , I , , i l
I0.00 I00.00 lO00.O0
Avionics Frequency (Hz)
Figure 20: Comparison of vertical response spectra of avionics system with and
without the circular ring under random base excitation - rigid mass avionics model.
31

o
¢j
I.OOE-I --
1.00E-2
1.00E-3
a+a.
a
..... a- (_
- _ _. a,_t=
Unprotected Avionics
1.OOE-4 , ' ' ' ' ' I
10.00 IO00.00
Isolated Avionics ._ ;
! I I I I I I I ! I I
100.00
AvionicsFrequency(Hz)
Figure 21: Comparison of lateral response spectra of avionics system with and
without the circular ring under random base excitation - rigid mass avionics model.
1.OOE-I --
¢_
ej
>
0
1.00E-2
1.00E-3
Unprotected AvionicsDefault Dsmpi_
f
IsolatedAvionics
..... 50% .,
Default Damping '" 'i"
+100% ', _. .",/"_.
• l /_'. . I _1"
_-'/ \, ".,I/
%
I I I I I I I I I I I I I I I I I I
1o.o0 ,0o0o t0oo 0oAvionicsFrequency (Hz)
Figure 22: Vertical response spectra of an isolated avionics system with circular ring
damping ratio variations as compared to unprotected avionics under random base
excitation.
32

1.00E-2 --
0
0
'_ 1.00E-3ej
0
,-1
0
1.00E-4
Unprotected Avionics
DcfmJlt Damping
IsolatedAvionics..... 50/.
- - - D©fault Dampinl+I00%
• i.
' ' ' ' ' '"I ' ' ' ' ''"I
I0.00 100.00 1000.00
AvionicsFrequency(Hz)
Figure 23: Lateral response spectra of an isolated avionics system with circular ring
damping ratio variations as compared to unprotected avionics under random baseexcitation.
33