Passive Infrared Systems for Remote Chemical Detection ...Passive Infrared Systems for Remote...
27
Approved for public release, distribution is unlimited. System Assessment and Validation for Emergency Responders (SAVER) Passive Infrared Systems for Remote Chemical Detection Market Survey Report July 2016 Prepared by National Security Technologies, LLC
Transcript of Passive Infrared Systems for Remote Chemical Detection ...Passive Infrared Systems for Remote...
Approved for public release, distribution is unlimited.
System Assessment and Validation for Emergency Responders (SAVER)
Passive Infrared Systems for Remote Chemical Detection Market Survey Report July 2016
Prepared by National Security Technologies, LLC
The Passive Infrared Systems for Remote Chemical Detection Market Survey Report was funded under Interagency Agreement No. DE-AC52-06NA25946 from the U.S. Department of Homeland Security, Science and Technology Directorate.
The views and opinions of authors expressed herein do not necessarily reflect those of the U.S. Government.
Reference herein to any specific commercial products, processes, or services by trade name, trademark, manufacturer, or otherwise does not necessarily constitute or imply its endorsement, recommendation, or favoring by the U.S. Government.
The information and statements contained herein shall not be used for the purposes of advertising, nor to imply the endorsement or recommendation of the U.S. Government.
With respect to documentation contained herein, neither the U.S. Government nor any of its employees make any warranty, express or implied, including but not limited to the warranties of merchantability and fitness for a particular purpose. Further, neither the U.S. Government nor any of its employees assume any legal liability or responsibility for the accuracy, completeness, or usefulness of any information, apparatus, product, or process disclosed; nor do they represent that its use would not infringe privately owned rights.
The cover photo and images included herein were provided by National Security Technologies, LLC. Product images are courtesy of the respective vendor.
i
FOREWORD
The U.S. Department of Homeland Security (DHS) established the System Assessment and Validation for Emergency Responders (SAVER) Program to assist emergency responders making procurement decisions. Located within the Science and Technology Directorate (S&T) of DHS, the SAVER Program conducts objective assessments and validations on commercially available equipment and systems, and develops knowledge products that provide relevant equipment information to the emergency responder community. The SAVER Program mission includes:
• Conducting impartial, practitioner-relevant, operationally oriented assessments and validations of emergency response equipment
• Providing information, in the form of knowledge products, that enables decision-makers and responders to better select, procure, use, and maintain emergency response equipment.
SAVER Program knowledge products provide information on equipment that falls under the categories listed in the DHS Authorized Equipment List (AEL), focusing primarily on two main questions for the responder community: “What equipment is available?” and “How does it perform?” These knowledge products are shared nationally with the responder community, providing a life- and cost-saving asset to DHS, as well as to Federal, state, and local responders. The SAVER Program is supported by a network of Technical Agents who perform assessment and validation activities. As a SAVER Program Technical Agent, National Security Technologies, LLC (NSTec), has been tasked to provide expertise and analysis on key subject areas, including chemical, biological, radiological, nuclear, and explosives (CBRNE) detection, countermeasures, and test and evaluation, among others. In support of this tasking NSTec developed this report to provide emergency responders with information gathered during a market survey of commercially available Passive Infrared Systems for Remote Chemical Detection, which fall under AEL reference number 07CD-04-DCSO Title: Detector, Stand-Off, Chemical. For more information on the SAVER Program or to view additional reports on Infrared Analysis Devices for Standoff Chemical Detection or other technologies, visit www.dhs.gov/science-and-technology/saver.
ii
POINTS OF CONTACT
SAVER Program National Urban Security Technology Laboratory U.S. Department of Homeland Security Science and Technology Directorate 201 Varick Street New York, NY 10014-7447 E-mail: [email protected] Web site: www.dhs.gov/science-and-technology/saver
U.S. Department of Energy National Nuclear Security Administration Nevada Field Office P.O. Box 98521 Las Vegas, NV 89193-8521
National Security Technologies, LLC P.O. Box 98521 Mailstop NLV042 Las Vegas, NV 89193-8521 E-mail: [email protected]

Passive Infrared Systems for Remote Chemical Detection Market Survey Report
iii
TABLE OF CONTENTS
Foreword .......................................................................................................................................... i
Points of Contact ............................................................................................................................. ii1. Introduction ............................................................................................................................... 12. IR-RCD Overview .................................................................................................................... 1
2.1 Current Technologies ........................................................................................................ 52.2 Applications ...................................................................................................................... 7
3. Product Information .................................................................................................................. 83.1 Bertin Technologies ........................................................................................................ 10
3.1.1 Second Sight® MS ............................................................................................... 103.1.2 Second Sight® TC ................................................................................................ 10
3.2 Block Engineering .......................................................................................................... 113.2.1 PORTHOS™ ....................................................................................................... 11
3.3 Bruker ............................................................................................................................. 113.3.1 HI 90 .................................................................................................................... 113.3.2 Rapid Plus ............................................................................................................ 123.3.3 Sigis-II ................................................................................................................. 12
3.4 Chemring ......................................................................................................................... 133.4.1 I-SCAD® .............................................................................................................. 133.4.2 LightGuard™ ....................................................................................................... 13
3.5 FLIR ................................................................................................................................ 143.5.1 GF300/GF304/GF306/GF320/GF343/GF346 ..................................................... 14
3.6 Mesh, Inc. ........................................................................................................................ 143.6.1 FireFly.................................................................................................................. 143.6.2 iMCAD ................................................................................................................ 15
3.7 Telops .............................................................................................................................. 153.7.1 Hyper-Cam LW/LW-NB/MW/MWE .................................................................. 15
4. Vendor Contact Information ................................................................................................... 165. Summary ................................................................................................................................. 16Appendix A – Glossary and Descriptions ................................................................................... A-1
Passive Infrared Systems for Remote Chemical Detection Market Survey Report
iv
LIST OF TABLES
Table 3-1 IR-RCD Specifications ................................................................................................... 8
Table 4-1. Vendor Contact Information........................................................................................ 16
LIST OF FIGURES
Figure 2-1. Atmospheric transmittance........................................................................................... 2
Figure 2-2. Active IR sensors in bistatic (top) and monostatic (bottom) configurations. .............. 2Figure 2-3 Passive IR sensor using a temperature difference between the plume
and background........................................................................................................................ 2Figure 2-4. Propane and Ammonia Spectra .................................................................................... 3
Passive Infrared Systems for Remote Chemical Detection Market Survey Report
1
1. INTRODUCTION
Infrared (IR) analysis devices for remote chemical detection rely on spectral signatures to remotely detect, identify, and characterize chemicals in the gas or vapor phase. Chemicals absorb light in different narrow spectral bands in a unique manner creating a spectrum that can be used to indicate the presence of one or many chemicals, uniquely identify the chemical(s), and quantify concentrations. An IR sensor may uniquely identify a chemical and provide an accurate measurement of concentration, or may only identify a chemical family and relative concentration. The degree to which a chemical can be identified and quantified depends on the resolution of the instrument, the region of the spectrum measured, and other factors. Some chemicals do not have strong signatures in the IR region, but most toxic industrial chemicals (TICs), chemical warfare agents (CWA), and other hazardous chemicals commonly encountered in the field are detectable in the IR region. IR sensors can be either “active” or “passive.” Active sensors provide their own IR light source while passive sensors rely on temperature differences between the gas and background in the target area. This report will focus on standoff Passive IR Systems for Remote Chemical Detection (IR-RCD) though active systems will also be briefly discussed. To provide emergency responders with information on IR-RCDs for Remote Chemical Detection, the System Assessment and Validation for Emergency Responders (SAVER) Program conducted a market survey. This market survey report is based on information gathered from November 2015 through January 2016 from vendors, internet research, industry publications, an emergency responder focus group, and a government issued Request for Information (RFI) that was posted on the Federal Business Opportunities website. For inclusion in this report, the IR-RCDs had to meet the following criteria:
• Use a passive design
• Work in the IR region
• Capable of uniquely detecting chemicals or identifying classes of chemicals
• Detect compounds remotely (>25m). Appendix A contains a glossary and brief descriptions of terms and concepts related to remote detection of chemicals using passive IR systems. Due diligence was performed to develop a report that is representative of current products in the marketplace.
2. IR-RCD OVERVIEW
IR-RCDs measure IR light from objects in the sensor field of view. Wavelengths are usually reported as microns or micrometers (µm) which is one-millionth of a meter. The IR region is traditionally divided in the mid-wave IR from 2.5 to 8 µm and the long-wave IR from 8 to 15 µm. IR light is outside the visible region and cannot be seen by humans. Objects with temperatures above absolute zero emit energy (e.g., light) in the IR region in patterns based on their chemical composition. Different chemicals emit or absorb light at specific wavelengths creating a unique spectrum or fingerprint that can be used to identify the chemical. These
Passive Infrared Systems for Remote Chemical Detection Market Survey Report
2
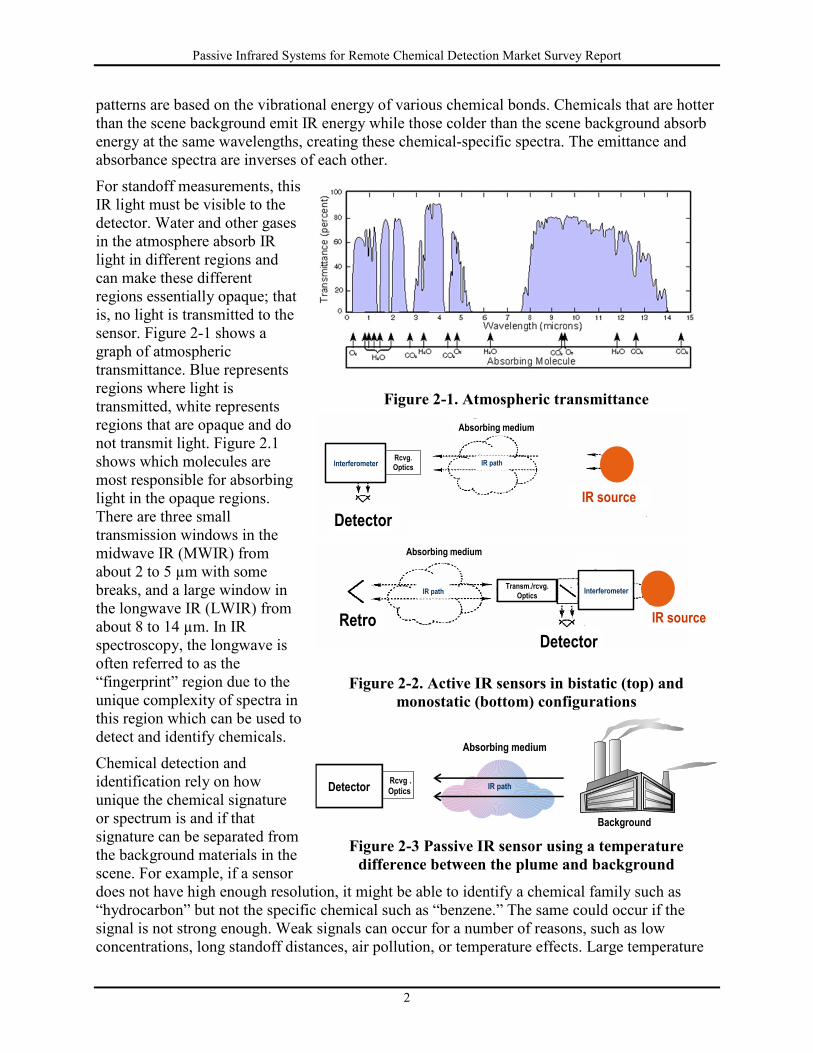
patterns are based on the vibrational energy of various chemical bonds. Chemicals that are hotter than the scene background emit IR energy while those colder than the scene background absorb energy at the same wavelengths, creating these chemical-specific spectra. The emittance and absorbance spectra are inverses of each other. For standoff measurements, this IR light must be visible to the detector. Water and other gases in the atmosphere absorb IR light in different regions and can make these different regions essentially opaque; that is, no light is transmitted to the sensor. Figure 2-1 shows a graph of atmospheric transmittance. Blue represents regions where light is transmitted, white represents regions that are opaque and do not transmit light. Figure 2.1 shows which molecules are most responsible for absorbing light in the opaque regions. There are three small transmission windows in the midwave IR (MWIR) from about 2 to 5 µm with some breaks, and a large window in the longwave IR (LWIR) from about 8 to 14 µm. In IR spectroscopy, the longwave is often referred to as the “fingerprint” region due to the unique complexity of spectra in this region which can be used to detect and identify chemicals. Chemical detection and identification rely on how unique the chemical signature or spectrum is and if that signature can be separated from the background materials in the scene. For example, if a sensor does not have high enough resolution, it might be able to identify a chemical family such as “hydrocarbon” but not the specific chemical such as “benzene.” The same could occur if the signal is not strong enough. Weak signals can occur for a number of reasons, such as low concentrations, long standoff distances, air pollution, or temperature effects. Large temperature
Figure 2-1. Atmospheric transmittance
Figure 2-2. Active IR sensors in bistatic (top) and monostatic (bottom) configurations
Figure 2-3 Passive IR sensor using a temperature
difference between the plume and background
IR source
Detector
Absorbing medium
Rcvg. OpticsInterferometer IR path
Retro IR source
Absorbing medium
Detector
Transm./rcvg. Optics
Interferometer
IR path
Passive Infrared Systems for Remote Chemical Detection Market Survey Report
3
differences between the target chemical and the scene background provide a much stronger signal than smaller temperature differences. If the target chemical and scene background are the same temperature, it is not possible to detect the chemical. This is rare, as earth, buildings, sky (e.g., deep space), or other scene backgrounds are generally different temperatures than the local atmosphere and the target chemical gas. Solid chemicals are much more difficult to detect and identify because of lower or non-existent temperature differences. To overcome weak signals from low temperature differences, some sensors are “active” detectors. Active detectors provide their own IR source rather than relying on the scene background as shown in Figure 2-2. The light source is usually configured either as “bistatic” where the light source is across the gas plume from the sensor and shines back toward the sensor, and “monostatic” where the light source is located with the sensor and bounces off a retro-reflector behind the plume. Both these arrangements require placement of equipment on both sides of the gas plume, though in special cases a strong light source can be bounced off the existing reflective backgrounds such as building walls. Figure 2-3 shows a passive IR detector. In the IR region, natural temperature differences provide the method for measuring spectra. If the plume (absorbing medium in Figure 2-3) is either warmer or colder than the background, then the plume will either absorb or emit light characteristic of the chemical(s) in the plume, resulting in a unique spectrum. Chemicals are detected and identified by comparing the spectra measured by the sensor with library spectra of potential chemicals. Since a typical scene contains many chemical gases along with background clutter, this library comparison is based on statistical algorithms. Most commercial sensors have automated this process. Standoff infrared detectors measure chemical concentrations as the integrated concentration of gas along the path length through the plume (i.e., the line-of-sight of the detector). This measurement is a multiple of the chemical concentration, and the path length through the plume. For example, a chemical plume with a concentration of 10 parts per million (ppm) and 1-meter in
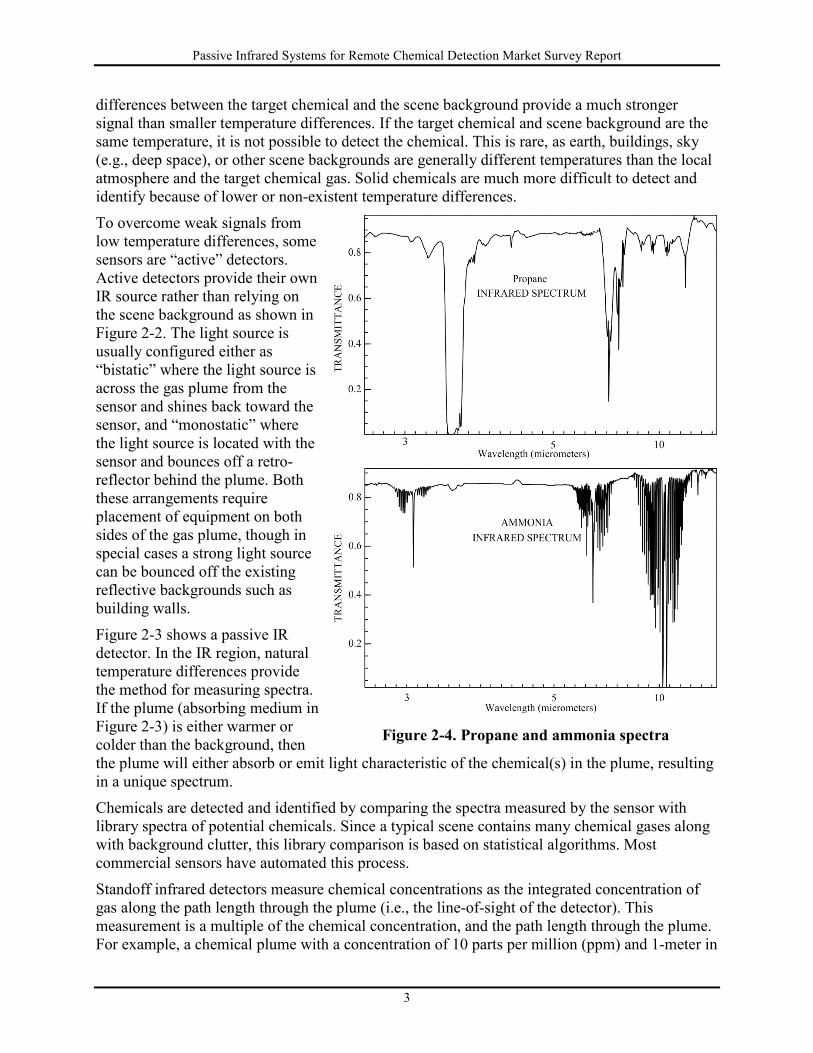
Figure 2-4. Propane and ammonia spectra
Passive Infrared Systems for Remote Chemical Detection Market Survey Report
4
size where the measurement was made would be characterized with a concentration of 10 ppm-meter (1 m x 10 ppm). A second plume 10-meters in size where the measurement was made with a concentration of 1 ppm would also be characterized at 10 ppm-meters (10 m x 1 ppm). Higher concentrations as measured in ppm-meters are more easily detected and identified than lower concentrations. Chemicals that have spectra with stronger absorption or emission variations or “peaks” can be detected at lower concentrations. For example, Figure 2-4 shows the IR spectra of propane (top panel) and ammonia (bottom panel) both at the same concentration. They both have features in the MWIR region between 2 and 4 µm which is in an optical window in the MWIR region shown in Figure 2-1. Propane has a large feature both deep and broad while ammonia has a much narrower and shallower feature. This figure shows why propane can be detected at much lower concentrations than ammonia. Most IR-RCDs operate in either the MWIR or the LWIR, but not both. While both gases have features in the LWIR, in this case the ammonia features are larger than the propane features, and it would be easier to detect in this region. In Figure 2-4, zero indicates no light transmission (opaque) while 1 indicates full light transmission (transparency). The large “dip” in the propane spectra at 3.5 µm indicates a nearly opaque feature that can be used for detection. The spectra shown in Figure 2-4 is the transmittance spectra of propane and shows strongly absorbing regions as “dips.” Spectra can also be plotted as emission spectra, the light that would be emitted if the gas were hot enough to glow. Emission values are calculated as 1 – T (where T is the transmittance value). When plotted this way, the strongly absorbing areas are “peaks.” When speaking of spectra, most people use the term “peaks” to describe these features, even though when plotted as transmittance they look like “dips.” Variables that define standoff IR sensors are listed below. Appendix A contains a glossary of these terms.
• Standoff distance o For active systems this is the distance from the sensor to the reflector or light source.
These range from half a kilometer to up to 2 kilometers for available commercial systems o Passive systems can have ranges up to 5 or 6 kilometers or more, though detection is
dependent on the background, concentration, and the specific chemical, as some chemicals have larger spectral variations and chemicals with stronger peaks are easier to detect at lower concentrations
• Gas Plume o Path length – this is the length through the chemical plume as determined by the detector
position relative to the plume. That is the line-of-sight of the detector through the plume. o Chemical concentration
Typical sensitivities are in the ppm-meter to ppb-meter range • Collection Time – typically scans of a spectral band are in the sub-second to second range for gas
identifications. Detection or alarm can take up to 10 seconds due to the need to scan a number of bands, and time required for processing. Collection times are longer for imaging systems.
• Spectral Libraries o Vendor supplied o Usually have a broad range of relevant chemicals o Some are user expandable or have add-on modules
Passive Infrared Systems for Remote Chemical Detection Market Survey Report
5
o Some systems can identify mixtures of chemicals • Detection limits and accuracy are affected by:
o Difference between background and chemical temperatures for Passive systems o Strength of light source for active systems o Standoff distance o Spectral bandwidth and resolution
Bandwidth (defined by the range of wavelengths (or frequencies) collected in a given spectral region (band or “bin”))
Number of data points in that region/band – resolution o Obscurants in the atmosphere such as smoke, dust, or other chemicals.
• Field of View (FOV) and data presentation o Spatially - what size area can be scanned (if scanning system) or field of view (if imaging
system) o Are results overlaid on scene images or video
• Unattended Operation – many systems are capable of unattended continuous operation and can be integrated into wired or wireless networks.
• Operational Considerations o Battery capabilities o Weight and dimensions o Operating temperature range o Setup time o Operating complexity/training requirements o Maintenance.
2.1 Current Technologies Since this market survey is evaluating standoff technologies, this discussion is limited to passive, “open path” systems. “Closed path” systems take a sample into a chamber for analysis and range in size from handheld to bench-top laboratory systems with multi-pass, gas cells. The closed path approach provides very good sensitivities and chemical discrimination. However, it requires a sample be extracted from the gas plume. This survey does not further discuss closed path systems. IR-RCD detectors use a number of different methods to acquire the spectra required to detect, identify, and characterize chemicals. The Fourier-transform IR (FTIR) instruments use a moving mirror, such as a Michelson interferometer, or other methods, to measure a signal and create an interferogram. The interferogram is then transformed to a usable spectrum with a mathematical Fourier transform. The calculations are automated. Dispersive systems use a grating to directly separate incoming light into spectral bands. IR-RCDs differ in their spectral resolution and the number of spectral “bins” that are filled. The number of bins can range from a single-band called a filter detector in this report, to multiple bands called a multispectral detector, to hundreds or even thousands of bands, called a hyperspectral detector. Each band is also defined by it its spectral resolution. Spectral resolution is measured as either wavelength or wave number. The wavelength is the period or length over which the wave repeats, usually reported in µm, the wave number is the number of repetitions of a wave in a specified distance, usually reported in cm-1 or “per centimeters.” By convention
Passive Infrared Systems for Remote Chemical Detection Market Survey Report
6
multi- and hyperspectral detector resolutions are usually reported in wave numbers, with a small number indicating a narrower band, while filter detectors are usually report as a range of wavelengths, such as from 10.5 to 10.7 µm. Both FTIR and dispersive sensors can be used in either imaging or scanning systems. Scanning sensors measure at a single point but can create images by measuring a single point then pivoting to a new point in the scene, and repeating, thereby building up the image. Hyperspectral Imager (HIS) sensors create an image where each image pixel represents a spectrum and the image represents a spatial area that is measured at the same time, similar to a digital camera. Most HIS instruments measure a horizontal line across the imaging chip with spectral bands measured on the other dimension. The image is created by measuring successive horizontal bands across the scene. HIS refers to the fact that each spectrum has a very large number of spectral values with a fine wavelength resolution. HSIs typically generate images where each image pixel contains 500 to thousands of spectral measurements. The additional spectral resolution in HIS provides additional information that can be used to more accurately identify chemicals or identify them at lower concentrations. While more expensive, the data product contains a vast amount of spectral information. Hyperspectral data allow in-depth analysis that provides detection of a large number of chemicals with the ability to detect multiple simultaneous chemicals at the cost of more complex data analysis. The extremely high available spectral resolution provides increased capabilities such as the ability to differentiate compounds with similar spectra. Spectral resolution can be adjusted – higher resolutions result in longer scan times. Multispectral and narrow filter detectors operate by collecting spectral bands at specific wavelengths, which can be quite narrow (and selected to detect specific chemicals or chemical families), or somewhat broad (and less specific in chemical discrimination). Even with narrow filters, these detectors are usually only able to identify families of chemicals; specificity increases with more and narrower bands and algorithms which emphasize differences. These simpler designs are less expensive than HIS systems, but are useful if the first responder has prior knowledge of the chemicals that may be present, such as methane and propane. They can be handheld or tripod mounted and can provide instantaneous plume tracking in a video-like image. This market survey is limited to the passive systems. Commercially available passive standoff systems are divided into four categories: 1) Single-band imagers, 2) Multispectral imagers (multiple bands), 3) Hyperspectral single pixel scanners (hundreds of bands), and 4) hyperspectral imagers (hundreds of bands). The single-pixel scanning systems take a measurement at a single point and build up an image of a scene by scanning across the scene. The hyperspectral imaging and hyperspectral scanning systems generate very high resolution spectra (at the expense of scanning time) and have long standoff distances. They have good detection, identification, and characterization capability but as with all these systems this is limited by the scene background and temperature differential. These systems are complex and can be expensive. In addition, the computations required to match the measured signal to the library spectra can be complex and may require a few more seconds for each determination.
Passive Infrared Systems for Remote Chemical Detection Market Survey Report
7
Processing for these systems can be done on-board or on a separate attached computer which is the more common methods. The single-band and multispectral instruments are filter-based systems. These systems are generally simpler to setup and operate and more rugged. In general, these systems also provide rapid results. However, because their spectral range and resolution is limited, they may only detect general chemical families and may be limited even in that aspect. Multiple filters and more complex algorithms may be used to help improve chemical discrimination. Filter systems are relatively inexpensive compared to hyperspectral systems, though a hyperspectral single pixel system may be comparable to a multispectral imaging system, as single pixel systems are generally less expensive than imagers. Single-band imagers are the least expensive and also have short scan times.
2.2 Applications IR-RCDs are suitable and designed for outdoor use and are used to detect, identify, and characterize organic and inorganic gases and vapors from a distance. IR-RCDs are suitable for a number of first response applications where chemical releases need to be monitored from a distance. This could include situations where it is not safe to enter the release area or situations where monitoring of a large area is required. Depending on the technology and sensor, the number of unique chemicals that can be potentially identified and characterized is large. Identification and characterization are based on spectral libraries provided by the vendors. Depending on the technology and sensor, IR-RCDs can monitor chemicals up to 6 kilometers away. While generally more expensive than point detectors such as photo-ionization detectors or handheld IR systems, IR-RCDs can provide wide area surveillance that would not be practical with multiple point detectors and allow the area to be monitored remotely. In addition IR-RCD can document plume evolution and transport providing visual references to predict movement and areas that may be impacted. The following list includes possible scenarios that could benefit from IR-RCD monitoring and use:
• Verify use of an improvised chemical device (ICD) • Survey area to find bodies • Provide event security – perimeter monitoring • Arson investigation – find accelerants • Identify chemical threats before entering area
o Fire fighting o Industrial release o Transportation accident o Tank car derailment
• Compliance monitoring (Department of Environmental Quality) o Industrial monitoring o Agricultural chemical monitoring and characterization o Leak detection or location
• Vapor intrusion into buildings • Odor investigation • Post-disaster surveys
Passive Infrared Systems for Remote Chemical Detection Market Survey Report
8
• Plume tracking • Oil spill or other large releases • Detect or characterize chemical suicide sites • Covert drug production lab detection • Natural gas leaks from fracking • Detect and identify CWA releases • Provide CWA and TIC decontamination surveillance.
IR-RCDs can either have high (specific chemical) or low (general chemical family) specificity. Minimal detectable concentrations ranges vary from the parts-per-billion-meter (ppb-m) to hundreds of part-per-million-meter (ppm-m) range, with the time-to-alarm in the 10’s of seconds range. Some provide instantaneous plume tracking, while others provide frames of images that are updated in 10’s of seconds.
3. PRODUCT INFORMATION
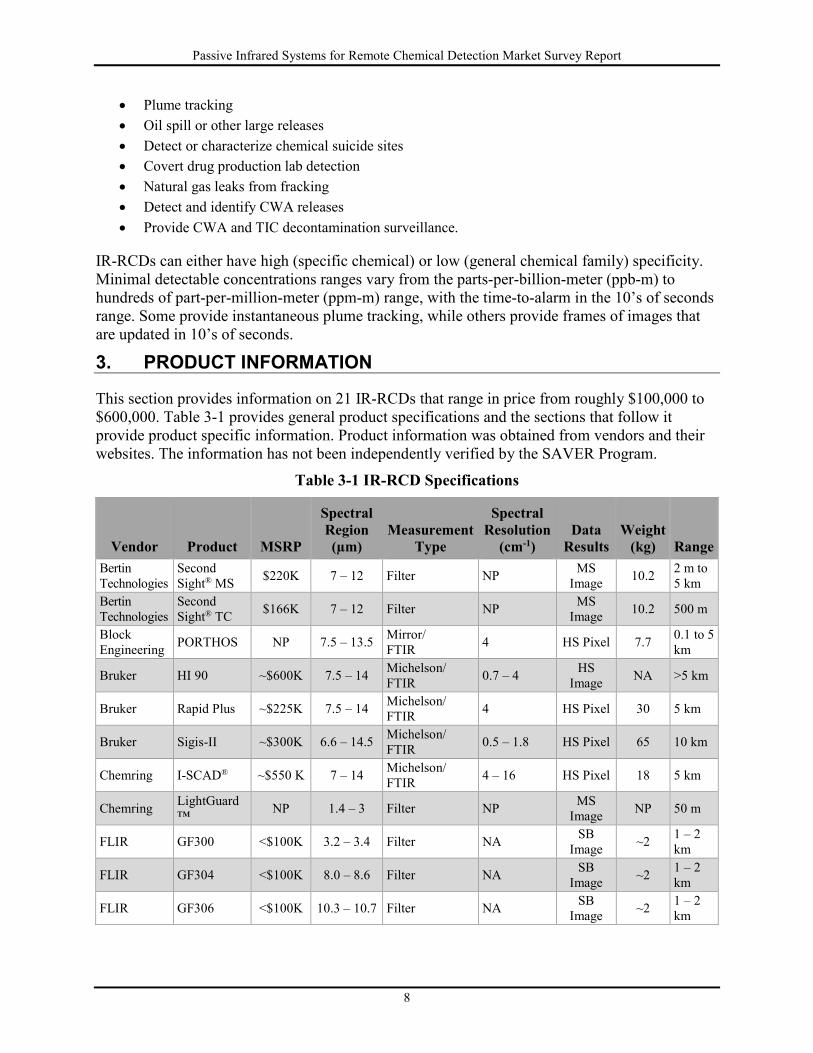
This section provides information on 21 IR-RCDs that range in price from roughly $100,000 to $600,000. Table 3-1 provides general product specifications and the sections that follow it provide product specific information. Product information was obtained from vendors and their websites. The information has not been independently verified by the SAVER Program.
Table 3-1 IR-RCD Specifications
Vendor Product MSRP
Spectral Region (µm)
Measurement Type
Spectral Resolution
(cm-1) Data
Results Weight
(kg) Range Bertin Technologies
Second Sight® MS $220K 7 – 12 Filter NP MS
Image 10.2 2 m to 5 km
Bertin Technologies
Second Sight® TC $166K 7 – 12 Filter NP MS
Image 10.2 500 m
Block Engineering PORTHOS NP 7.5 – 13.5 Mirror/
FTIR 4 HS Pixel 7.7 0.1 to 5 km
Bruker HI 90 ~$600K 7.5 – 14 Michelson/ FTIR 0.7 – 4 HS
Image NA >5 km
Bruker Rapid Plus ~$225K 7.5 – 14 Michelson/ FTIR 4 HS Pixel 30 5 km
Bruker Sigis-II ~$300K 6.6 – 14.5 Michelson/ FTIR 0.5 – 1.8 HS Pixel 65 10 km
Chemring I-SCAD® ~$550 K 7 – 14 Michelson/ FTIR 4 – 16 HS Pixel 18 5 km
Chemring LightGuard™ NP 1.4 – 3 Filter NP MS
Image NP 50 m
FLIR GF300 <$100K 3.2 – 3.4 Filter NA SB Image ~2 1 – 2
km
FLIR GF304 <$100K 8.0 – 8.6 Filter NA SB Image ~2 1 – 2
km
FLIR GF306 <$100K 10.3 – 10.7 Filter NA SB Image ~2 1 – 2
km
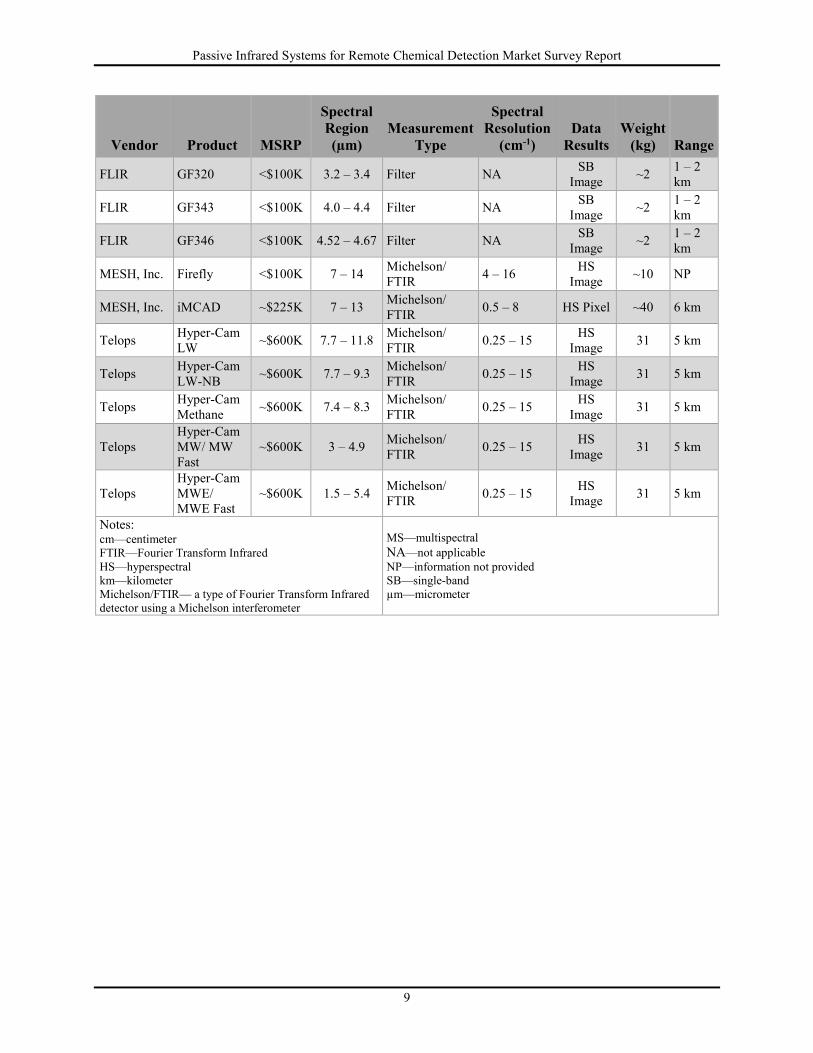
Passive Infrared Systems for Remote Chemical Detection Market Survey Report
9
Vendor Product MSRP
Spectral Region (µm)
Measurement Type
Spectral Resolution
(cm-1) Data
Results Weight
(kg) Range
FLIR GF320 <$100K 3.2 – 3.4 Filter NA SB Image ~2 1 – 2
km
FLIR GF343 <$100K 4.0 – 4.4 Filter NA SB Image ~2 1 – 2
km
FLIR GF346 <$100K 4.52 – 4.67 Filter NA SB Image ~2 1 – 2
km
MESH, Inc. Firefly <$100K 7 – 14 Michelson/ FTIR 4 – 16 HS
Image ~10 NP
MESH, Inc. iMCAD ~$225K 7 – 13 Michelson/ FTIR 0.5 – 8 HS Pixel ~40 6 km
Telops Hyper-Cam LW ~$600K 7.7 – 11.8 Michelson/
FTIR 0.25 – 15 HS Image 31 5 km
Telops Hyper-Cam LW-NB ~$600K 7.7 – 9.3 Michelson/
FTIR 0.25 – 15 HS Image 31 5 km
Telops Hyper-Cam Methane ~$600K 7.4 – 8.3 Michelson/
FTIR 0.25 – 15 HS Image 31 5 km
Telops Hyper-Cam MW/ MW Fast
~$600K 3 – 4.9 Michelson/ FTIR 0.25 – 15 HS
Image 31 5 km
Telops Hyper-Cam MWE/ MWE Fast
~$600K 1.5 – 5.4 Michelson/ FTIR 0.25 – 15 HS
Image 31 5 km
Notes: cm—centimeter FTIR—Fourier Transform Infrared HS—hyperspectral km—kilometer Michelson/FTIR— a type of Fourier Transform Infrared detector using a Michelson interferometer
MS—multispectral NA—not applicable NP—information not provided SB—single-band µm—micrometer
Passive Infrared Systems for Remote Chemical Detection Market Survey Report
10
3.1 Bertin Technologies
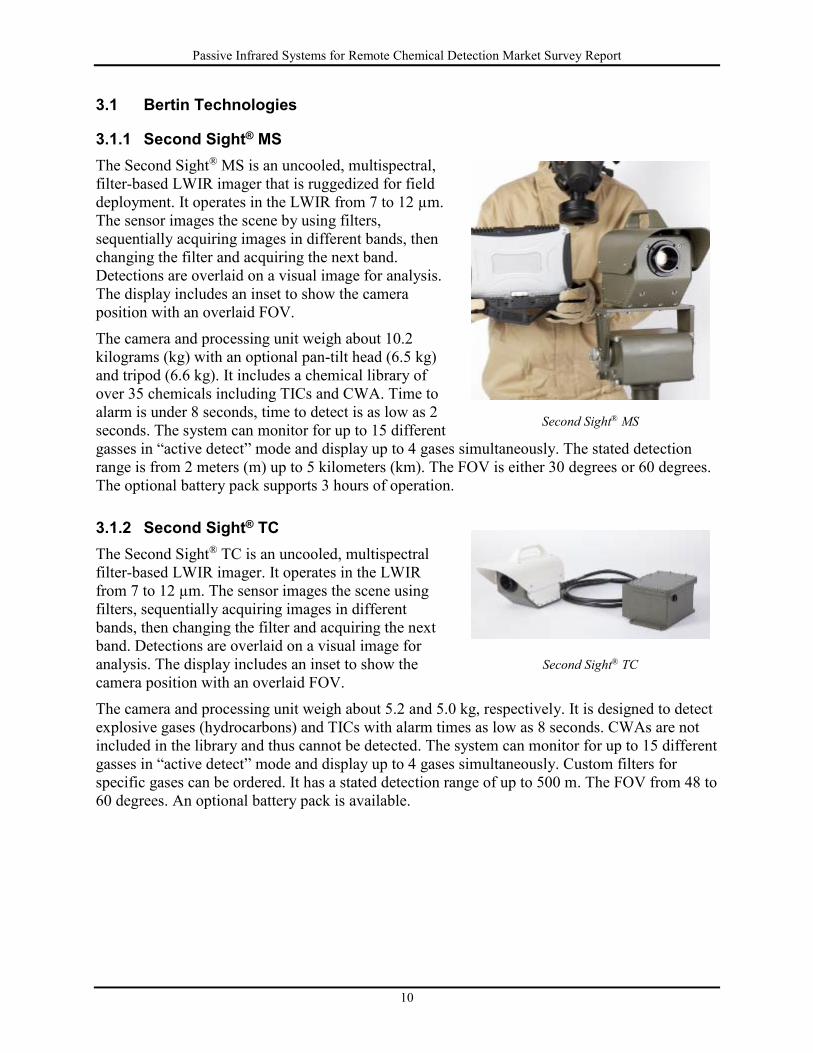
3.1.1 Second Sight® MS The Second Sight® MS is an uncooled, multispectral, filter-based LWIR imager that is ruggedized for field deployment. It operates in the LWIR from 7 to 12 µm. The sensor images the scene by using filters, sequentially acquiring images in different bands, then changing the filter and acquiring the next band. Detections are overlaid on a visual image for analysis. The display includes an inset to show the camera position with an overlaid FOV. The camera and processing unit weigh about 10.2 kilograms (kg) with an optional pan-tilt head (6.5 kg) and tripod (6.6 kg). It includes a chemical library of over 35 chemicals including TICs and CWA. Time to alarm is under 8 seconds, time to detect is as low as 2 seconds. The system can monitor for up to 15 different gasses in “active detect” mode and display up to 4 gases simultaneously. The stated detection range is from 2 meters (m) up to 5 kilometers (km). The FOV is either 30 degrees or 60 degrees. The optional battery pack supports 3 hours of operation.
3.1.2 Second Sight® TC The Second Sight® TC is an uncooled, multispectral filter-based LWIR imager. It operates in the LWIR from 7 to 12 µm. The sensor images the scene using filters, sequentially acquiring images in different bands, then changing the filter and acquiring the next band. Detections are overlaid on a visual image for analysis. The display includes an inset to show the camera position with an overlaid FOV. The camera and processing unit weigh about 5.2 and 5.0 kg, respectively. It is designed to detect explosive gases (hydrocarbons) and TICs with alarm times as low as 8 seconds. CWAs are not included in the library and thus cannot be detected. The system can monitor for up to 15 different gasses in “active detect” mode and display up to 4 gases simultaneously. Custom filters for specific gases can be ordered. It has a stated detection range of up to 500 m. The FOV from 48 to 60 degrees. An optional battery pack is available.
Second Sight® MS
Second Sight® TC
Passive Infrared Systems for Remote Chemical Detection Market Survey Report
11
3.2 Block Engineering
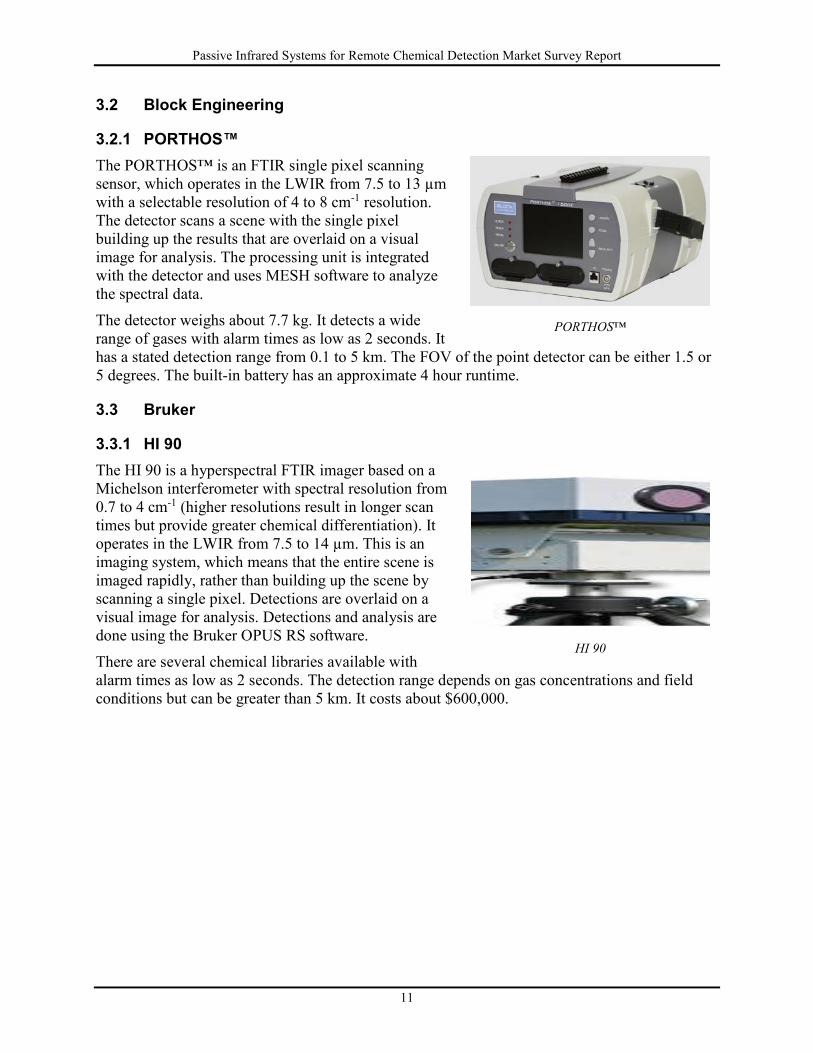
3.2.1 PORTHOS™ The PORTHOS™ is an FTIR single pixel scanning sensor, which operates in the LWIR from 7.5 to 13 µm with a selectable resolution of 4 to 8 cm-1 resolution. The detector scans a scene with the single pixel building up the results that are overlaid on a visual image for analysis. The processing unit is integrated with the detector and uses MESH software to analyze the spectral data. The detector weighs about 7.7 kg. It detects a wide range of gases with alarm times as low as 2 seconds. It has a stated detection range from 0.1 to 5 km. The FOV of the point detector can be either 1.5 or 5 degrees. The built-in battery has an approximate 4 hour runtime.
3.3 Bruker
3.3.1 HI 90 The HI 90 is a hyperspectral FTIR imager based on a Michelson interferometer with spectral resolution from 0.7 to 4 cm-1 (higher resolutions result in longer scan times but provide greater chemical differentiation). It operates in the LWIR from 7.5 to 14 µm. This is an imaging system, which means that the entire scene is imaged rapidly, rather than building up the scene by scanning a single pixel. Detections are overlaid on a visual image for analysis. Detections and analysis are done using the Bruker OPUS RS software. There are several chemical libraries available with alarm times as low as 2 seconds. The detection range depends on gas concentrations and field conditions but can be greater than 5 km. It costs about $600,000.
PORTHOS™
HI 90
Passive Infrared Systems for Remote Chemical Detection Market Survey Report
12
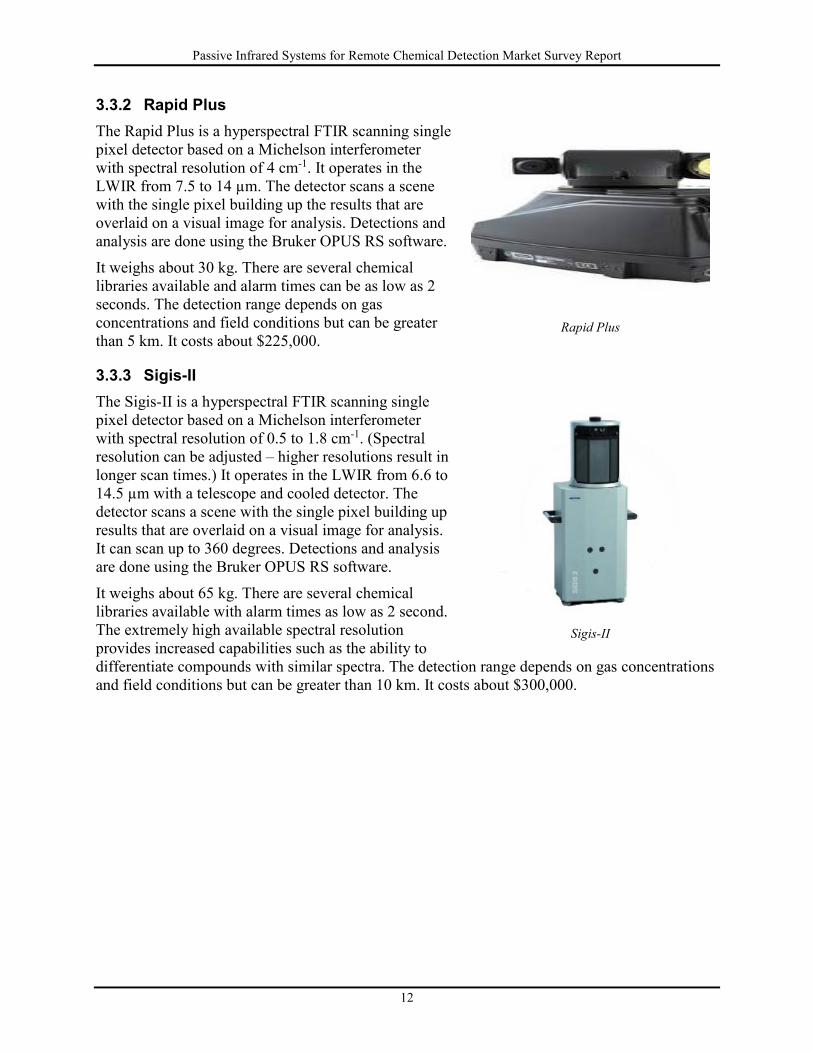
3.3.2 Rapid Plus The Rapid Plus is a hyperspectral FTIR scanning single pixel detector based on a Michelson interferometer with spectral resolution of 4 cm-1. It operates in the LWIR from 7.5 to 14 µm. The detector scans a scene with the single pixel building up the results that are overlaid on a visual image for analysis. Detections and analysis are done using the Bruker OPUS RS software. It weighs about 30 kg. There are several chemical libraries available and alarm times can be as low as 2 seconds. The detection range depends on gas concentrations and field conditions but can be greater than 5 km. It costs about $225,000.
3.3.3 Sigis-II The Sigis-II is a hyperspectral FTIR scanning single pixel detector based on a Michelson interferometer with spectral resolution of 0.5 to 1.8 cm-1. (Spectral resolution can be adjusted – higher resolutions result in longer scan times.) It operates in the LWIR from 6.6 to 14.5 µm with a telescope and cooled detector. The detector scans a scene with the single pixel building up results that are overlaid on a visual image for analysis. It can scan up to 360 degrees. Detections and analysis are done using the Bruker OPUS RS software. It weighs about 65 kg. There are several chemical libraries available with alarm times as low as 2 second. The extremely high available spectral resolution provides increased capabilities such as the ability to differentiate compounds with similar spectra. The detection range depends on gas concentrations and field conditions but can be greater than 10 km. It costs about $300,000.
Rapid Plus
Sigis-II
Passive Infrared Systems for Remote Chemical Detection Market Survey Report
13
3.4 Chemring
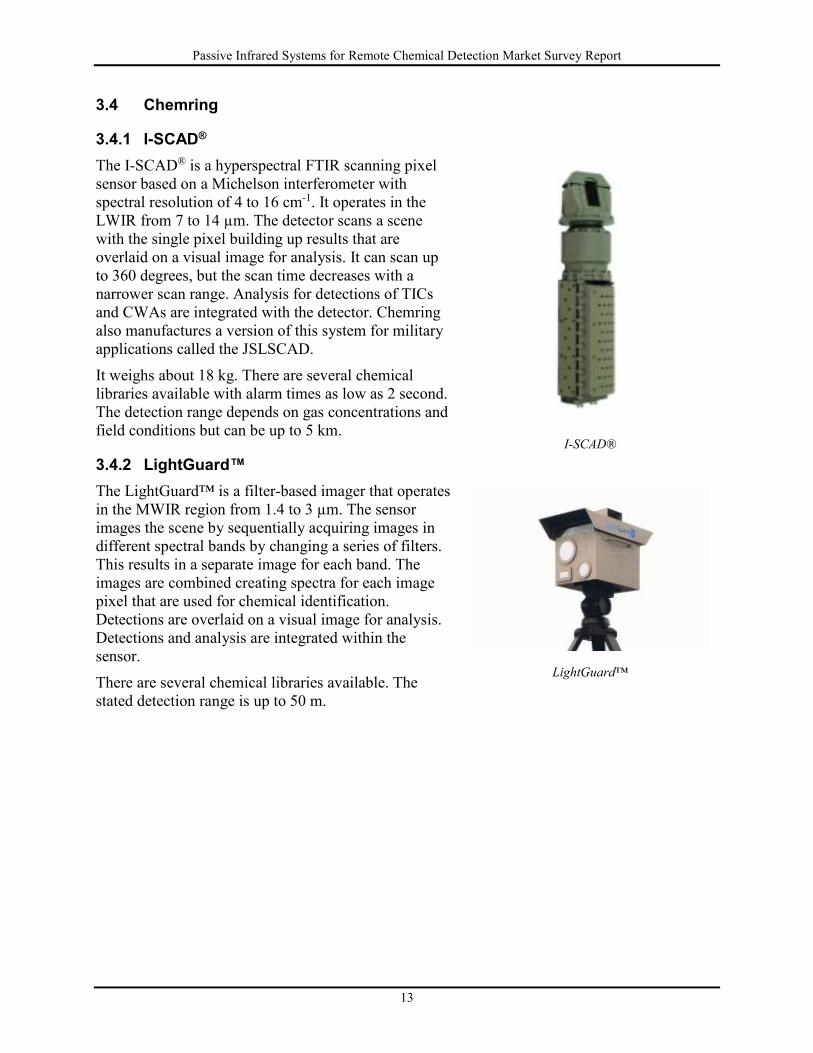
3.4.1 I-SCAD® The I-SCAD® is a hyperspectral FTIR scanning pixel sensor based on a Michelson interferometer with spectral resolution of 4 to 16 cm-1. It operates in the LWIR from 7 to 14 µm. The detector scans a scene with the single pixel building up results that are overlaid on a visual image for analysis. It can scan up to 360 degrees, but the scan time decreases with a narrower scan range. Analysis for detections of TICs and CWAs are integrated with the detector. Chemring also manufactures a version of this system for military applications called the JSLSCAD. It weighs about 18 kg. There are several chemical libraries available with alarm times as low as 2 second. The detection range depends on gas concentrations and field conditions but can be up to 5 km.
3.4.2 LightGuard™ The LightGuard™ is a filter-based imager that operates in the MWIR region from 1.4 to 3 µm. The sensor images the scene by sequentially acquiring images in different spectral bands by changing a series of filters. This results in a separate image for each band. The images are combined creating spectra for each image pixel that are used for chemical identification. Detections are overlaid on a visual image for analysis. Detections and analysis are integrated within the sensor. There are several chemical libraries available. The stated detection range is up to 50 m.
I-SCAD®
LightGuard™
Passive Infrared Systems for Remote Chemical Detection Market Survey Report
14
3.5 FLIR
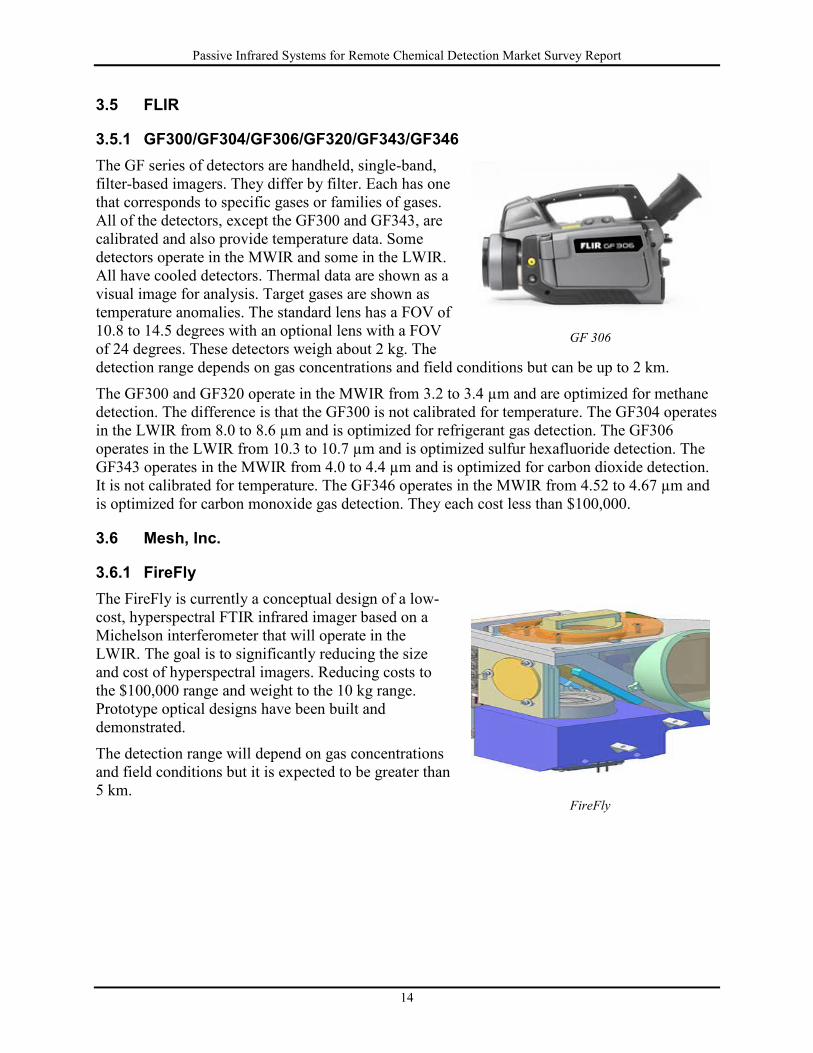
3.5.1 GF300/GF304/GF306/GF320/GF343/GF346 The GF series of detectors are handheld, single-band, filter-based imagers. They differ by filter. Each has one that corresponds to specific gases or families of gases. All of the detectors, except the GF300 and GF343, are calibrated and also provide temperature data. Some detectors operate in the MWIR and some in the LWIR. All have cooled detectors. Thermal data are shown as a visual image for analysis. Target gases are shown as temperature anomalies. The standard lens has a FOV of 10.8 to 14.5 degrees with an optional lens with a FOV of 24 degrees. These detectors weigh about 2 kg. The detection range depends on gas concentrations and field conditions but can be up to 2 km. The GF300 and GF320 operate in the MWIR from 3.2 to 3.4 µm and are optimized for methane detection. The difference is that the GF300 is not calibrated for temperature. The GF304 operates in the LWIR from 8.0 to 8.6 µm and is optimized for refrigerant gas detection. The GF306 operates in the LWIR from 10.3 to 10.7 µm and is optimized sulfur hexafluoride detection. The GF343 operates in the MWIR from 4.0 to 4.4 µm and is optimized for carbon dioxide detection. It is not calibrated for temperature. The GF346 operates in the MWIR from 4.52 to 4.67 µm and is optimized for carbon monoxide gas detection. They each cost less than $100,000.
3.6 Mesh, Inc.
3.6.1 FireFly The FireFly is currently a conceptual design of a low-cost, hyperspectral FTIR infrared imager based on a Michelson interferometer that will operate in the LWIR. The goal is to significantly reducing the size and cost of hyperspectral imagers. Reducing costs to the $100,000 range and weight to the 10 kg range. Prototype optical designs have been built and demonstrated. The detection range will depend on gas concentrations and field conditions but it is expected to be greater than 5 km.
GF 306
FireFly
Passive Infrared Systems for Remote Chemical Detection Market Survey Report
15
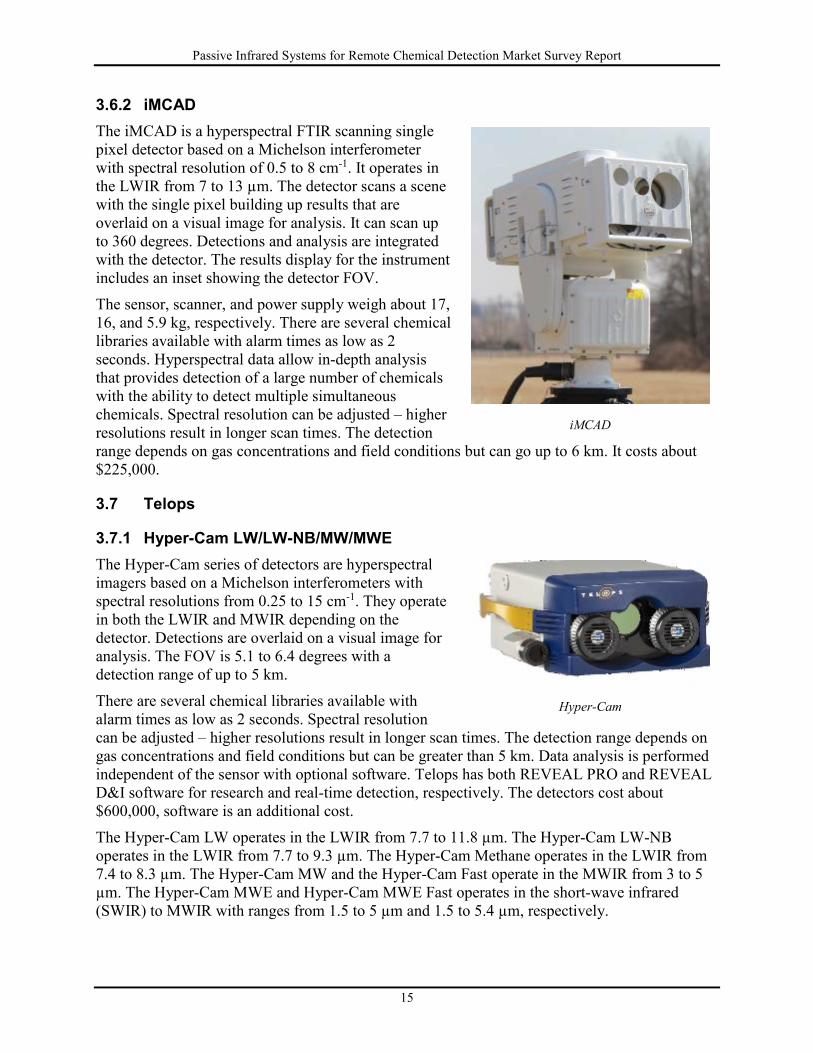
3.6.2 iMCAD The iMCAD is a hyperspectral FTIR scanning single pixel detector based on a Michelson interferometer with spectral resolution of 0.5 to 8 cm-1. It operates in the LWIR from 7 to 13 µm. The detector scans a scene with the single pixel building up results that are overlaid on a visual image for analysis. It can scan up to 360 degrees. Detections and analysis are integrated with the detector. The results display for the instrument includes an inset showing the detector FOV. The sensor, scanner, and power supply weigh about 17, 16, and 5.9 kg, respectively. There are several chemical libraries available with alarm times as low as 2 seconds. Hyperspectral data allow in-depth analysis that provides detection of a large number of chemicals with the ability to detect multiple simultaneous chemicals. Spectral resolution can be adjusted – higher resolutions result in longer scan times. The detection range depends on gas concentrations and field conditions but can go up to 6 km. It costs about $225,000.
3.7 Telops
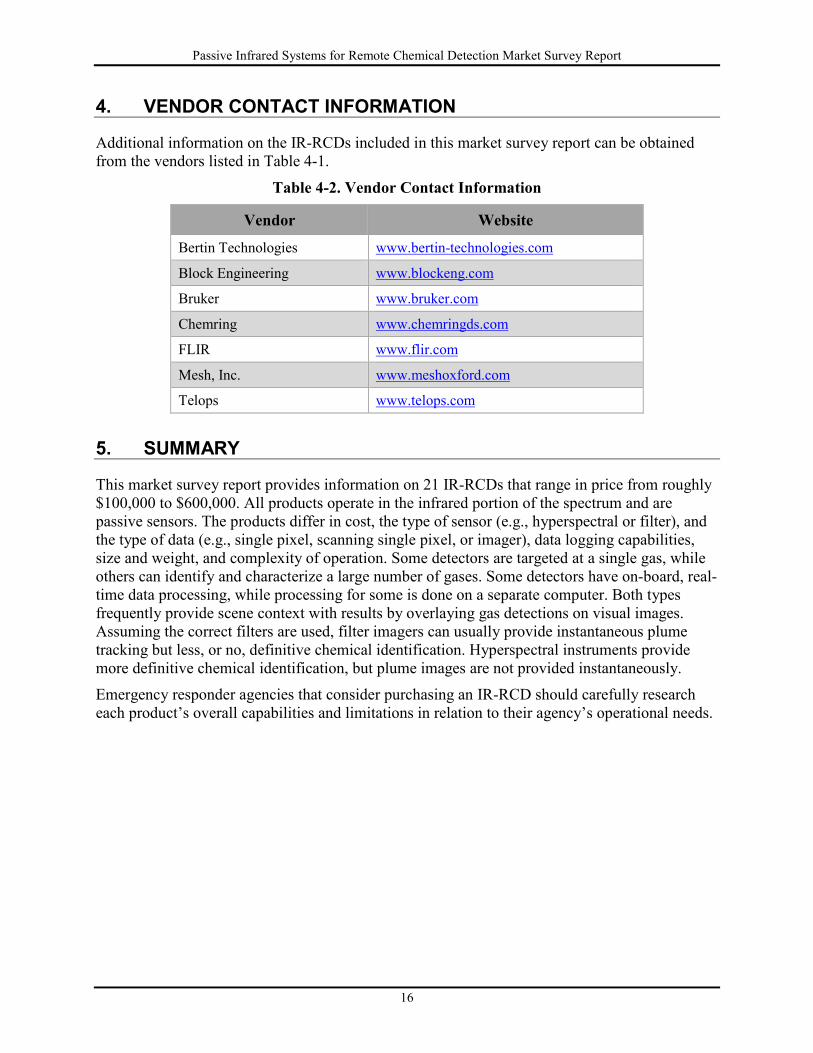
3.7.1 Hyper-Cam LW/LW-NB/MW/MWE The Hyper-Cam series of detectors are hyperspectral imagers based on a Michelson interferometers with spectral resolutions from 0.25 to 15 cm-1. They operate in both the LWIR and MWIR depending on the detector. Detections are overlaid on a visual image for analysis. The FOV is 5.1 to 6.4 degrees with a detection range of up to 5 km. There are several chemical libraries available with alarm times as low as 2 seconds. Spectral resolution can be adjusted – higher resolutions result in longer scan times. The detection range depends on gas concentrations and field conditions but can be greater than 5 km. Data analysis is performed independent of the sensor with optional software. Telops has both REVEAL PRO and REVEAL D&I software for research and real-time detection, respectively. The detectors cost about $600,000, software is an additional cost. The Hyper-Cam LW operates in the LWIR from 7.7 to 11.8 µm. The Hyper-Cam LW-NB operates in the LWIR from 7.7 to 9.3 µm. The Hyper-Cam Methane operates in the LWIR from 7.4 to 8.3 µm. The Hyper-Cam MW and the Hyper-Cam Fast operate in the MWIR from 3 to 5 µm. The Hyper-Cam MWE and Hyper-Cam MWE Fast operates in the short-wave infrared (SWIR) to MWIR with ranges from 1.5 to 5 µm and 1.5 to 5.4 µm, respectively.
iMCAD
Hyper-Cam
Passive Infrared Systems for Remote Chemical Detection Market Survey Report
16
4. VENDOR CONTACT INFORMATION
Additional information on the IR-RCDs included in this market survey report can be obtained from the vendors listed in Table 4-1.
Table 4-2. Vendor Contact Information
Vendor Website
Bertin Technologies www.bertin-technologies.com
Block Engineering www.blockeng.com
Bruker www.bruker.com
Chemring www.chemringds.com
FLIR www.flir.com
Mesh, Inc. www.meshoxford.com
Telops www.telops.com
5. SUMMARY
This market survey report provides information on 21 IR-RCDs that range in price from roughly $100,000 to $600,000. All products operate in the infrared portion of the spectrum and are passive sensors. The products differ in cost, the type of sensor (e.g., hyperspectral or filter), and the type of data (e.g., single pixel, scanning single pixel, or imager), data logging capabilities, size and weight, and complexity of operation. Some detectors are targeted at a single gas, while others can identify and characterize a large number of gases. Some detectors have on-board, real-time data processing, while processing for some is done on a separate computer. Both types frequently provide scene context with results by overlaying gas detections on visual images. Assuming the correct filters are used, filter imagers can usually provide instantaneous plume tracking but less, or no, definitive chemical identification. Hyperspectral instruments provide more definitive chemical identification, but plume images are not provided instantaneously. Emergency responder agencies that consider purchasing an IR-RCD should carefully research each product’s overall capabilities and limitations in relation to their agency’s operational needs.
Passive Infrared Systems for Remote Chemical Detection Market Survey Report
A-1
APPENDIX A – GLOSSARY AND DESCRIPTIONS
These definitions and descriptions are not precise technical definitions, but are meant as a guide to help readers understand the technical language used in this report. Active – A sensor that provides a light source as part of the measurement. Often these sources
are lasers at specific wavelengths, but other sources such as heated black bodies, or lamps with filters to provide light in the selected spectral regions may be used instead. See Passive.
Band – The region of the spectrum that is sampled in a measurement in that spectral range. A single filter instrument has just one band, multispectral has multiple bands, (to 10’s of bands) and a hyperspectral detector might measure spectra in hundreds to thousands of bands. Bands can have different spectral widths. See Bandwidth/Resolution.
Bandwidth – The width of a single spectral measurement. This can be reported in wavelengths or wave numbers. The bandwidth and spectral resolution are often used interchangeably. See Spectral Resolution, Wave Length, and Wave Number.
Cooled Detector – A sensor where the focal plane that measures the spectra is cooled (usually mechanically). Since these measurements are in the IR region and are essentially measuring the temperature of the scene, cooled focal planes provide much better signal-to-noise measurements. Cooling the focal plane adds cost and complexity to the system.
Concentration – See ppm-meter Delta (T) Temperature – The difference in temperature between the gas or chemical being
measured and the scene background (sky, buildings, trees etc.). The larger the delta T, the easier it is to detect chemicals. See Detection Limit.
Dispersive System - A method or type of system for measurement of IR spectra that use a grating to directly separate incoming light into spectral bands similar to a prism. See FTIR.
Detection Limit – The lowest concentration that can be detected by the sensor. For passive systems, it is a function of the difference between background and chemical temperatures (delta T), standoff distance, spectral bandwidth and resolution of the instrument, chemical spectral signature, and obscurants in the atmosphere such as smoke, dust, or other chemicals.
Detector Types – Detectors types differ in the spectral range, resolution and number of spectral measurements that are made. The number of measurements can range from a single band called a filter detector in this report, to multiple bands called a multispectral detector, to hundreds or even thousands of bands, called a Hyperspectral (HS) detector. Each band is also defined by it its spectral resolution. See Spectral Resolution, Wave Length, and Wave Number. Spectral resolution is measured as either wavelength or wave number. The wave length is the period or length over which the wave repeats, usually reported in µm, the wave number is the number of repetitions of a wave in a specified distance, usually reported in cm-1 or “per centimeters.” Detector types can be either imaging or scanning systems. Scanning sensors measure at a single point but can create images by measuring a single
Passive Infrared Systems for Remote Chemical Detection Market Survey Report
A-2
point then moving to a new point in the scene, and repeating, thereby building up the image. HSI sensors create an image where each image pixel represents a spectrum and a spatial area is measured at the same time, similar to a digital camera. Most HSI instruments measure a horizontal line across the imaging chip with spectral bands measured on the other dimension. The image is created by measuring successive horizontal bands across the scene. HSI refers to the fact that each spectrum has a very large number of spectral values with a fine wavelength resolution. HSIs typically generate images where each image pixel contains hundreds to thousands of spectral bands.
Field of View – The area that can be measured or scanned by a detector usually reported in degrees. For imaging detectors this is determined by the lens used, while for scanning systems this can often be configured.
Filter Detector – See Detector Types. FTIR – A method or type of system for measurement of IR spectra that uses a moving mirror,
such as a Michelson interferometer, or other methods to measure a signal and create an interferogram. The interferogram is then transformed to a usable spectrum with a mathematical Fourier transform. Fourier transform spectrometers offer advantages over dispersive spectrometers. (1) The interferometer's detector in effect monitors all wavelengths simultaneously throughout the entire measurement; this offers an increase in signal to noise ratio while using only a single detector element; (2) the interferometer does not require a limited aperture as do grating or prism spectrometers, that require the incoming light to pass through a narrow slit in order to achieve high spectral resolution. This is an advantage when the incoming light is not of a single spatial mode. The other common method or system for measuring IR spectra are dispersive systems use a grating to directly separate incoming light into spectral bands similar to a prism. See Dispersive System.
Fourier-transform IR – See FTIR. Hyperspectral Imaging/HSI – HSI sensors create an image where each image pixel represents a
spectrum while the image covers a spatial area that is measured at the same time, similar to a digital camera. Most HSI instruments measure a horizontal line across the imaging chip with spectral bands measured on the other dimension. The image is built up by mosaicking successive horizontal bands across the scene. Hyperspectral refers to the fact that each spectrum has a very large number of spectral values with a fine wavelength resolution. HSIs typically generate images where each image pixel contains hundreds to thousands of spectral measurements. See Detector Types.
Hyperspectral – A detector that measures a large number, hundreds to thousands of spectral bands. See Detector Types.
Imaging System – See Detector Types. Infrared/IR – IR light is outside the visible region and cannot be seen by humans. The IR region
spans the electromagnetic spectrum from 0.7-1000 µm. For convenience this is typically separated into different regions such as near-IR, MWIR, and LWIR. This report is mainly concerned with MWIR and LWIR regions. Objects with temperatures above absolute zero emit energy (e.g., light) in the IR region in patterns based on their chemical
Passive Infrared Systems for Remote Chemical Detection Market Survey Report
A-3
composition. Different chemicals emit or absorb light at specific wavelengths creating a unique spectrum or fingerprint that can be used to identify the chemical. These patterns are based on the vibrational energy of various chemical bonds. Chemicals that are hotter than the scene background emit IR energy while those colder than the scene background absorb energy at the same wavelengths, creating these chemical-specific spectra. The emittance and absorbance spectra are inverses of each other.
Longwave IR – See LWIR. LWIR – The region of the spectra from about 8 to 14 µm. See IR Regions. Midwave IR/MWIR – The region of the spectra from about 2 to 5 µm. See IR Regions. Multispectral – A detector that measures several to tens of spectral bands. See Detector Types. Passive – A sensor or detector system that measures light (electromagnetic radiation) emitted or
reflected by an object or gas. It does not provide a light or energy source to assist the measurement. Active systems provide their own IR light source while passive systems rely on temperature differences between the gas and background in the target area. See Active.
Peaks – Areas of a chemical spectra that look like peaks or valleys when the spectra is plotted as a line and correspond to a chemical’s (or family of chemicals’) absorbance or emission signatures at particular wavelengths. A chemical with strong (or high) narrow peaks can usually be detected at lower concentrations than a chemical with weak (or lower) broader peaks. Figure 2-4 shows an example of a chemical with a broad, strong peak (propane) and one with a narrow, weak peak (ammonia). In the figure the spectra are plotted as transmittance so the peaks look like valleys. See Spectra and Spectral Signature.
Passive IR for Systems Remote Chemical Detection/IR-RCD – A passive IR analysis device. These are detectors that measure spectra in the IR range and are used for standoff chemical detection. For purposes of this report, standoff means several meters or more.
ppm-meter – Units for concentration measurements for standoff IR sensors. This measurement is a multiple of the chemical concentration, and the path length through the plume being measured. For example, a chemical plume 1-meter in size with a concentration of 10 parts per million (ppm) would be characterized as 10 ppm-meter in concentration. A second plume 10-meters in size with a concentration of 1 ppm would also be characterized at 10 ppm-meters.
Resolution – For this report, this generally refers to the spectral resolution of the system, though can also refer to the spatial resolution. Spectral resolution is generally reported in wave number, though it can also be reported as the width of a measured band in wavelength. Higher resolution provides more information allowing more accurate matching of a chemical’s spectra. Higher resolutions usually also mean higher costs and longer scanning times. Resolution can also refer to spatial resolution. The spatial resolution is the physical size of a single pixel being measured.
Scanning System – See Detector Types. Spectra – a measurement of light intensity at different wave lengths. This is often used to refer
to a measurement made by an IR detector that consists of light intensity measurements in
Passive Infrared Systems for Remote Chemical Detection Market Survey Report
A-4
different infrared bands. Different chemicals absorb or emit light over specific wavelengths and this pattern or spectra can be used to identify the chemical.
Spectral Library – A database of different measured chemical spectral signatures or spectra. Software compares measured spectra to these libraries to determine if a chemical is present. Most spectral libraries are supplied by the detector vendor. There are third party libraries. Some libraries can be extended by the user.
Spectral Signature – Chemicals absorb light in different narrow spectral bands in a unique manner creating a spectrum that can be used to indicate the presence of a chemical(s), uniquely identify the chemical(s), and quantify their concentration(s). Chemical spectra can have large, easily identified features or peaks, or may have smaller, less easily identified features or peaks. Spectral features that are unique to an individual chemical, or to a class of chemicals are called spectral signatures. The spectrum of a chemical affects the concentration and distance over which it can be successfully detected.
Spectral Region – the portion of the electromagnetic spectra where the instrument collects light. It is often defined based on detector capabilities, chemical spectral features and in windows where there are no strong atmospheric interferents. Water and other gases in the atmosphere absorb IR light in different regions and make these regions opaque; that is, no light is transmitted. Figure 2-1 shows a graph of atmospheric transmittance along with the molecules most responsible for absorbing light in the opaque regions that are white in the figure. There are three windows from about 2 to 5 µm with some breaks called the midwave IR (MWIR). There is a large window from about 8 to 14 µm called the longwave IR (LWIR). In FTIR spectroscopy, the longwave is often referred to as the “fingerprint” region due to the unique complexity of spectra in this region which can be used to detect and identify chemicals. See MWIR and LWIR.
Spectral Resolution – The width of a single spectral measurement. This can be reported in wavelengths or wave numbers. The bandwidth and spectral resolution are often used interchangeably. However, spectral resolution is also sometimes used to state how many spectral measurements are made in a region. Higher spectral resolution (smaller number) often comes at the cost of slower scan speed, but gives greater accuracy and thus a higher likelihood of chemical identification. See Bandwidth, Wavelength, and Wave Number.
Spectrum (plural: Spectra) – See Spectral Signature. Standoff Distance – The distance between the sensor and the chemical plume. It is often used to
state the maximum range that a chemical can be detected. Passive systems can have ranges up to 5 or 6 kilometers or more, though detection is dependent on the background, concentration, and the specific chemical as some chemicals have larger spectral variations or signatures making them easier to detect.
Wavelength - The period or length over which the wave repeats, usually reported in microns or micrometers (µm) or nanometers (nm). Wavelength is usually used when talking about a region of the spectra, but can be used in talking about spectral resolution. A range of wavelengths is used to decribe a system or region such as from 10.5 to 10.7 µm. By convention, multi- and HS detector resolutions are usually reported in wavenumbers, (See Wavenumber) with a small number indicating a narrower band, while filter detectors are usually report as a range of wavelengths.

Passive Infrared Systems for Remote Chemical Detection Market Survey Report
A-5
Wavenumber – The number of repetitions of a wave in a specified distance, usually reported in cm-1 or “per centimeters.” Wavenumber is usually used when talking about spectral resolution or a specfic point in the spectra, but is also used when defining spectral regions. See Wavelength.