passive infrared detector for security systems design, algorithm of ...
14
M. Kastek et al., Int. J. of Safety and Security Eng., Vol. 3, No. 1 (2013) 10–23 © 2013 WIT Press, www.witpress.com ISSN: 2041-9031 (paper format), ISSN: 2041-904X (online), http://journals.witpress.com DOI: 10.2495/SAFE-V3-N1-10-23 PASSIVE INFRARED DETECTOR FOR SECURITY SYSTEMS DESIGN, ALGORITHM OF PEOPLE DETECTION AND FIELD TESTS RESULT M. KASTEK, H. MADURA & T. SOSNOWSKI INSTITUTE OF OPTOELECTRONICS, MILITARY UNIVERSITY OF TECHNOLOGY, WARSAW, POLAND. ABSTRACT The article presents passive infrared (PIR) detectors used for the protection of large objects (buildings, airports, and border) or large areas having larger detection ranges and complex algorithms of signal analysis, upon which the efficiency of detectors’ operation is significantly dependent. The construction and principle of operation of PIR detectors of a large detection range is presented. The article also pres- ents the design and principle of operation of a PIR detector of a large detection range. The significant virtue of the described PIR detector is a highly efficient detection of very slowly moving or crawling people. Keywords: passive infrared detector, probability of detection, security systems. 1 INTRODUCTION Passive infrared (PIR) detectors operating in far infrared range (8–14 μm) are frequently used in security systems for people detection. Because of their passive operation, it is difficult to detect them and due to suitably chosen spectral range of operation they are low sensitive to disturbances caused by sun radiation. For PIR detectors used in security systems, the pyroe- lectric sensors of high sensitivity are often used [1, 2]. Passive infrared detectors used for the protection of large objects (buildings and airports) or large areas have larger detection ranges and complex algorithms of signal analysis, upon which the efficiency of detectors’ operation is significantly dependent. The essential drawback of the currently available PIR detectors is their low efficiency of detection of slowly moving or crawling people. The efficiency of slowly moving objects is low because the changes in thermal radiation from these objects are close to thermal fluctua- tions of a background [3]. Moreover, to detect slowly moving (or crawling) people, the lower frequency limit of a transmission band of a PIR detector has to be close to zero. When this condition is fulfilled, an increase in low frequency noises is observed. Thus, detection algo- rithms must be different from those used for a typical PIR detector. To detect crawling people, a higher number of sensors should be applied (more detection zones), which increases a signal-to-noise ratio, because each of the sensors can ‘see’ a smaller observation area. Multitude of factors influencing the signal received from a pyroelectric sensor often causes false alarms generated by PIR detectors. Therefore in order to reduce the number of false alarms caused by, e.g. air turbulences or changes in thebackground temperature resulting from sun radiation, the sensors with two active elements are used (two sensors) and an alarm signal is determined by the analysis of a difference of their output signals [4]. Distinguishing a useful signal (coming from an object) from a noise signal (arising as a result of disturbing factors) is a serious recognition problem. Thus, the important task of a PIR detector, espe- cially in an elongated detection zone, is such conversion and analysis of the signal to achieve a relatively high probability of object detection with simultaneous low probability of a false alarm detection [3].
Transcript of passive infrared detector for security systems design, algorithm of ...
M. Kastek et al., Int. J. of Safety and Security Eng., Vol. 3, No. 1 (2013) 10–23
© 2013 WIT Press, www.witpress.comISSN: 2041-9031 (paper format), ISSN: 2041-904X (online), http://journals.witpress.comDOI: 10.2495/SAFE-V3-N1-10-23
PASSIVE INFRARED DETECTOR FOR SECURITY SYSTEMS DESIGN, ALGORITHM OF PEOPLE DETECTION
AND FIELD TESTS RESULT
M. KASTEK, H. MADURA & T. SOSNOWSKIINSTITUTE OF OPTOELECTRONICS,
MILITARY UNIVERSITY OF TECHNOLOGY, WARSAW, POLAND.
ABSTRACTThe article presents passive infrared (PIR) detectors used for the protection of large objects (buildings, airports, and border) or large areas having larger detection ranges and complex algorithms of signal analysis, upon which the effi ciency of detectors’ operation is signifi cantly dependent. The construction and principle of operation of PIR detectors of a large detection range is presented. The article also pres-ents the design and principle of operation of a PIR detector of a large detection range. The signifi cant virtue of the described PIR detector is a highly effi cient detection of very slowly moving or crawling people.Keywords: passive infrared detector, probability of detection, security systems.
1 INTRODUCTIONPassive infrared (PIR) detectors operating in far infrared range (8–14 μm) are frequently used in security systems for people detection. Because of their passive operation, it is diffi cult to detect them and due to suitably chosen spectral range of operation they are low sensitive to disturbances caused by sun radiation. For PIR detectors used in security systems, the pyroe-lectric sensors of high sensitivity are often used [1, 2]. Passive infrared detectors used for the protection of large objects (buildings and airports) or large areas have larger detection ranges and complex algorithms of signal analysis, upon which the effi ciency of detectors’ operation is signifi cantly dependent.
The essential drawback of the currently available PIR detectors is their low effi ciency of detection of slowly moving or crawling people. The effi ciency of slowly moving objects is low because the changes in thermal radiation from these objects are close to thermal fl uctua-tions of a background [3]. Moreover, to detect slowly moving (or crawling) people, the lower frequency limit of a transmission band of a PIR detector has to be close to zero. When this condition is fulfi lled, an increase in low frequency noises is observed. Thus, detection algo-rithms must be different from those used for a typical PIR detector. To detect crawling people, a higher number of sensors should be applied (more detection zones), which increases a signal-to-noise ratio, because each of the sensors can ‘see’ a smaller observation area.
Multitude of factors infl uencing the signal received from a pyroelectric sensor often causes false alarms generated by PIR detectors. Therefore in order to reduce the number of false alarms caused by, e.g. air turbulences or changes in thebackground temperature resulting from sun radiation, the sensors with two active elements are used (two sensors) and an alarm signal is determined by the analysis of a difference of their output signals [4]. Distinguishing a useful signal (coming from an object) from a noise signal (arising as a result of disturbing factors) is a serious recognition problem. Thus, the important task of a PIR detector, espe-cially in an elongated detection zone, is such conversion and analysis of the signal to achieve a relatively high probability of object detection with simultaneous low probability of a false alarm detection [3].
M. Kastek et al., Int. J. of Safety and Security Eng., Vol. 3, No. 1 (2013) 11
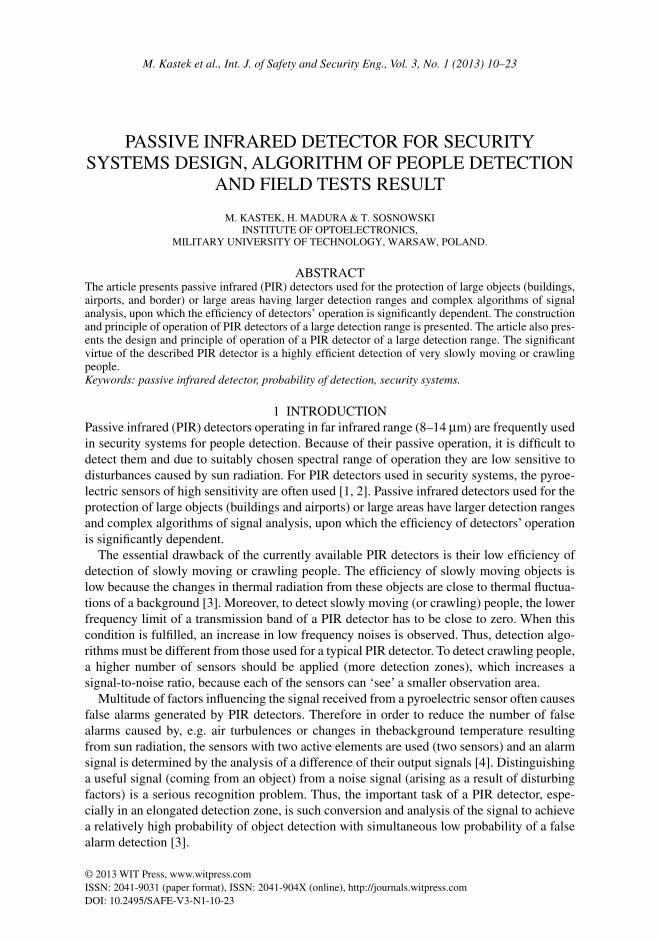
2 CONSTRUCTION AND PRINCIPLE OF OPERATION OF A PIR DETECTORThe main elements of a PIR detector are the objective (mirror or refraction one), a set of pyroelectric sensors, and electronic systems (Fig. 1). The sensors convert an optical signal, emitted from the ‘being observed’ surface, into an electrical signal. This signal is processed in the electronic systems (it is amplifi ed, fi ltered, and sampled) and next analyzed in a micro-processor system.
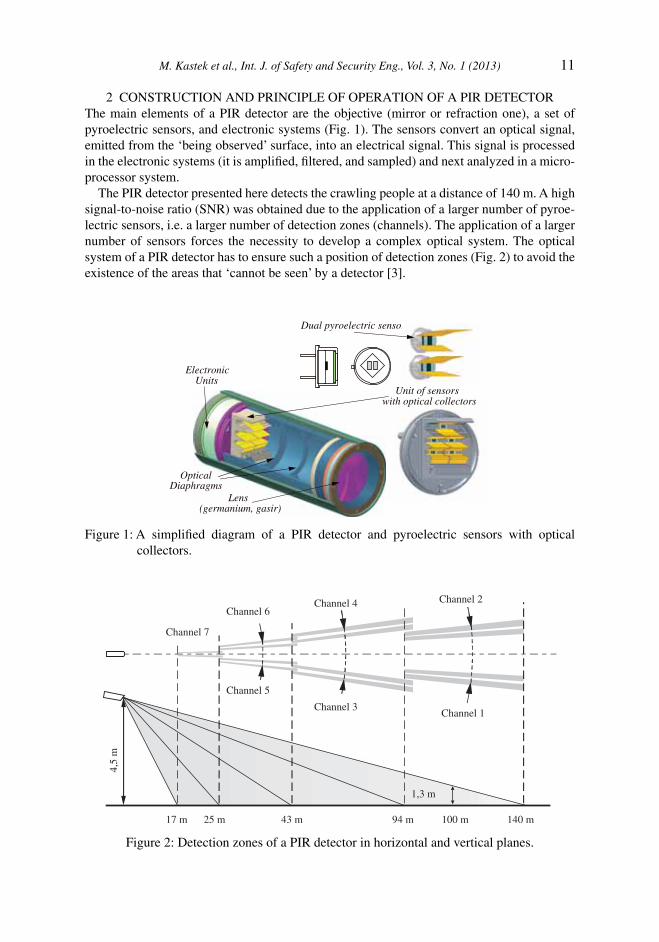
The PIR detector presented here detects the crawling people at a distance of 140 m. A high signal-to-noise ratio (SNR) was obtained due to the application of a larger number of pyroe-lectric sensors, i.e. a larger number of detection zones (channels). The application of a larger number of sensors forces the necessity to develop a complex optical system. The optical system of a PIR detector has to ensure such a position of detection zones (Fig. 2) to avoid the existence of the areas that ‘cannot be seen’ by a detector [3].
ElectronicUnits
Lens(germanium, gasir)
OpticalDiaphragms
Dual pyroelectric sensor
Unit of sensorswith optical collectors
Figure 1: A simplifi ed diagram of a PIR detector and pyroelectric sensors with optical collectors.
17 m 25 m 94 m
4,5
m
140 m43 m 100 m
1,3 m
Channel 4Channel 6
Channel 7
Channel 2
Channel 1Channel 3
Channel 5
Figure 2: Detection zones of a PIR detector in horizontal and vertical planes.

12 M. Kastek et al., Int. J. of Safety and Security Eng., Vol. 3, No. 1 (2013)
Thermal radiations generated by slowly moving and (especially) crawling people are char-acterized by similar amplitudes of luminance, and the velocities of this luminance change in time, such as fl uctuation change of background radiation. The amplitude of a signal from pyroelectric sensors is directly proportional to the velocity of a change in a radiation signal in time (i.e. to the velocity of a moving object). The disadvantageous property of pyroelectric sensors is a voltage drift owing to the changes in ambient temperature (pyroelectric sensor is equipped with a fi eld transistor playing a role of a voltage follower). Thus, to have a sensor effi ciently detecting slowly moving people, it is necessary to develop an algorithm eliminat-ing the changes in a signal from a sensor caused by background noise as well as the changes in a signal caused by temperature drift of a pyroelectric sensor.
A simplifi ed diagram of an electronic circuit of a PIR detector is shown in Fig. 3. At ‘+’ input of the amplifying stage, a reference voltage is applied, which is obtained from a resistance divider and a digital potentiometer included between the supply voltage and the system’s ground.
A system of DC amplifi er with regulation (by means of digital electronic potentiometers) of a level of a constant component consists of three operation amplifi ers. The fi rst U1A ampli-fi er, because of a signifi cant output resistance of a pyroelectric sensor operates in a follower system and two consecutive ones in the systems reversing a signal phase. The fi rst stage of amplifi cation is realized by the operation amplifi er U3A. It is characterized with the signal amplifi cation K1= – R4 /R3. At its ‘+’ input, a reference voltage is applied, which is obtained from the resistance divider R5, R6, U2A (digital potentiometer) included between the supply voltage and the system ground [5].
The reference voltage (regulated by means of a digital electronic potentiometer) is used for elimination of a constant component of a signal obtained from a pyroelectric sensor. This component is signifi cantly changed together with temperature changes occurring near a
Figure 3: A simplifi ed functional scheme of an electronic system of a PIR detector.

M. Kastek et al., Int. J. of Safety and Security Eng., Vol. 3, No. 1 (2013) 13
pyroelectric sensor (because of a change in the output current change of a fi eld transistor dependent on temperature). Next, the signal is delivered to the second amplifying stage of the U3B operation amplifi er, the amplifi cation of which being K = – R8/R7. At its ‘+’ input, the reference voltage is obtained from the R9, R10, U2B resistance divider (digital potentiometer). This voltage (regulated by means of a digital electronic potentiometer) protects the amplifi er against the saturation state. The output signal is fi ltered in the fi lter made from R11 and C6 elements. The electronic potentiometers, used in a preamplifi er, are connected through the SPI series bus with a controlling processor, which on the basis of the output signal values makes the current adequate regulations (change in the value of potentiometer resistances) of the values of reference voltages of particular amplifying stages.
Knowing the NA and NB settings (the number of a selected level) of particular digital potenti-ometers, their total resistances RA and RB, and the values of amplifi cations of particular K1, K2 preamplifi er stages, the signal value VOUT at the amplifi er output can be calculated as follows:
V V K K U K K U KOUT IN pA pB= − −1 2 1 2 2 , (1)
where VIN is the input voltage of the fi rst amplifying stage, UpA is the reference voltage of the fi rst amplifying stage, and UpB is the reference voltage of the second amplifying stage.
The values of reference voltages of particular amplifying stages for 8-bit resolution of digital potentiometers settings can be calculated using the following relationship:
⎟⎠⎞⎜
⎝⎛
+++
= AA
A
ccpA R
NR
RRR
VU
2565
56, (2)
⎟⎠⎞⎜
⎝⎛ +
++= B
B
B
ccpB R
NR
RRRV
U256
9910
, (3)
where Vcc is the supply voltage.The UpA and UpB values are currently matched by a microprocessor such that ensuring
adequate dynamics of the amplifi er and preventing the saturation state of particular amplify-ing stages. If the output voltage of the amplifi er was measured and analyzed by a microprocessor, which in its operation algorithm considers the shift in levels (potentiometer settings), it can be shown that the voltage calculated (by a microprocessor) can be signifi -cantly higher than the supply voltage. It is an important virtue of this system.
In the PIR’s electronic system, the system for the measurement of sun radiation intensity was used. The information from this system is taken into account in an intruder detection algorithm [3]. Moreover, a temperature sensor was used in the system. The data from a temperature-measuring system can be applied to switch-on a miniature heater, mounted inside a PIR detector housing. A small increase in the temperature of the PIR detector’s inside (in relation to ambient temperature) protects the deposition of water vapor on optical elements (lens, concentrator mirrors, and optical windows of sensors).
Passive IR sensors have specially formed angular characteristics of detection, achieved by the application of appropriate optical elements, placement of PIR detectors on the focal plane (Fig.1), and the use of additional mirrors acting as beam concentrators. Figure 4 shows mod-ule pyroelectric detectors with concentrators and electronics board.
On the one hand, the angle of view of a detector can be enlarged by increasing its size or by using several types of optical elements, such as cylindrical fi eld lenses, aplanatic lenses, and fl at mirrors. Flat mirrors are the cheapest and easiest to implement, although the resulting increase in angle of view is smaller than that for other solutions. The optical concentrator

14 M. Kastek et al., Int. J. of Safety and Security Eng., Vol. 3, No. 1 (2013)
consists of fl at mirrors mounted at a certain angle with respect to the detector’s optical axis. It is a simple, cost-effective solution that does not introduce additional losses and the result-ing angle of view is independent on the wavelength. On the other hand, the resulting increase in the angle of view is limited to several degrees for a single detector.
Optimization of mirrors’ placement is a bit complicated task due to a large number of param-eters that affect the fi nal effi ciency of focusing the radiation on the detectors. These parameters are linear dimensions of a mirror, coordinates of its center, and mirror tilt angle. The angular relations are different for each mirror, depending on a particular observation zone of each detec-tor. The optimization of mirror and detector locations was performed using ZEMAX software. The quality of optical design was verifi ed by examining the relative irradiance of detectors by refl ected radiation as a function of angle between the mirror and detector surfaces.
According to numerical calculations, at an angle smaller than 40 degrees all the radiation misses the detector completely. The irradiance increases with the angle, reaching a maximum value at an angle of approximately 70 degrees (Fig. 4).
ZEMAX software makes it possible to calculate the relative irradiance of seven detectors paired up with optical concentrators as a function of target movement in particular detection zones. The results were then verifi ed against real measurement results performed on a labo-ratory test bed, in order to compare the expected values of parameters with those measured for a real device for all its detection zones [6].
Detection of a person in a detection zone of a PIR detector occurs when a signal level at the output of a detection system, caused by infrared radiation emitted by a person, exceeds a con-ventional detection threshold. To minimize the probability of false alarms, an adaptation detection threshold ‘following’ the changing atmospheric conditions should be determined [7].
3 ANALYSIS OF CHANNEL DETECTION OF A PIR DETECTORThe object moving in a detection area, determined by an angle of view of a pyroelectric sen-sor, produces an electrical signal in it. The spectral distribution (spectral density) of luminance causing the output electric signal can be described as follows:
( ) ( ) ( ) ( ) ( )ltltp
lel ll oaTMTL ⋅⋅⋅=, , (4)
where e(l) is the spectral distribution of the emissivity coeffi cient, Ml(T) is the exitance spec-tral distribution, ta(l) is the spectral coeffi cient of atmosphere transmission, and to(l)is the spectral coeffi cient of optical systems transmission.
Figure 4: The module pyroelectric detectors with concentrators and electronics board of a PIR detector.

M. Kastek et al., Int. J. of Safety and Security Eng., Vol. 3, No. 1 (2013) 15
To simplify the calculations, one can take a constant (independent of wavelength) emissiv-ity coeffi cient for both the object eo and background et. An error in calculations caused by using this assumption will be smaller than 1%. A spectral characteristic of transmission of an optical system (germanium lens with a fi lter and a detector fi lter) can be described using the following relation:
( ) ( ) ( )ltltlt dso ⋅=
where ts(l) is the spectral coeffi cient of a germanium lens with antirefl ection layers and td(l) is the spectral coeffi cient of transmission of a piezoelectric sensor fi lter.
Figure 5 shows the spectral characteristics of the transmission coeffi cient td(l) of the fi lter of a few pyroelectric sensors.
Integrating eqn (4) for the signal coming from a person of the same, averaged (equivalent) temperature TO and for the signal from a background of the average temperature TB , the fol-lowing expression for energetic luminances can be obtained:
for a person ( ) [ ]2/,2
1
cmWdTLTL Oo
O ∫=l
l
lll
p
e ( ) , (5)
for a background ( ) [ ]2/,2
1
cmWdTLTL Bt
B ∫=l
l
lll
p
e ( ) . (6)
Analyzing the case of a detected person, when the sensor ‘fi eld of view’ is equal to a person surface, the signal at the pyroelectric sensor output is dependent on the difference of temper-atures between a person and a background and it is determined as
2 12 140
10
20
30
40
50
60
70
80
90
100
λ [µm]
Tra
nsm
issi
on [
%]
6 8 104 16 18
Eltec 4192-25
Nicera SDA 02-52
Kube C172
Figure 5: Spectral characteristics of the transmission coeffi cient td(l) of an optical fi lter of various pyroelectric sensors.

16 M. Kastek et al., Int. J. of Safety and Security Eng., Vol. 3, No. 1 (2013)
( ) ( )[ ]∫ −=2
1
,,l
l
ll lll dTLTLkS BOO , (7)
where k is the coeffi cient dependent on the parameters of pyroelectric sensor, diameter and focal length of the objective, and on emissivity [8–10].
If in the detector a pyroelectric sensor is used, then as the noise signal SB, the signal caused by thermal fl uctuation of a background can be taken (the change in the background tempera-ture between TBmax and TBmin). The own detector noise and the amplifi er noise is low in comparison with the noise resulting from thermal fl uctuation of a background and it can be neglected. Such a noise signal can be described as
( ) ( )[ ]∫ −=2
1
,, minmax
l
l
ll lll dTLTLkS BBB . (8)
The SNR results from a quotient of the signals given in eqns (7) and (8) and it also depends on the object surface within a fi eld of view of a pyroelectric sensor and it can be calculated using the following relation:
( )( ) ( )[ ]
( ) ( )[ ] lll
lll
l
l
ll
l
l
ll
dTLTLk
dTLTLkRZSNR
BB
BO
∫
∫
−
−=
2
1
2
1
,,
,,
minmax
, (9)
where Z(R) is the covering coeffi cient and is defi ned as
( ))()(
sensor's FOVobject surface in a sensor's FOV
RARARZ
w
o== ,
( ) ( )
⎪⎪⎩
⎪⎪⎨
⎧
>=
≤
= ow2
2
22
ow
AAdla
AAdla1
)(d
o
d
o
ARRAf
fA
R
RARZ , (10)
where Ao is the object surface in a fi eld of view of the sensor, Aw is the fi eld of view of the sensor, Ad is the sensor surface, R is the distance between the object and the PIR detector, and f is the focal length of an objective.
For short distances, the fi eld of view of a pyroelectric sensor is smaller than the surface of the being observed object and the whole object is contained only for a certain distance in the fi eld of view of a pyroelectric sensor. For larger distances, the value Z(R) decreases faster because the object surface is still constant and the sensors’ fi eld of view increases. The change in SNR as a function of a distance between a person and a PIR detector was determined tak-ing into account the difference between the person and background temperatures BO TTT −=D and the results are shown in Fig. 6.
4 METHOD OF ANALYSIS OF A PIR DETECTOR SIGNALDetection of a person in a detection zone of a PIR detector occurs when a signal level at the output of a detection system, caused by infrared radiation emitted by a person, exceeds a

M. Kastek et al., Int. J. of Safety and Security Eng., Vol. 3, No. 1 (2013) 17
conventional detection threshold. To minimize the probability of false alarms, an adaptation detection threshold ‘following’ the changing atmospheric conditions should be determined [5, 7, 9].
An analysis of the signal, caused by a moving person and background existing in the fi eld of view of a detector, is made in a microprocessor system [11]. The signal from a detection system is sampled and the voltages of the subsequent signal samples SD are added. Then, a value of such a signal determines eqn (11)
( ) ( )∑−−
==
1sNi
ijDraw jSiS , (11)
where Sraw(i) is the ith sample of the total signal and Ns is the number of added samples.This signal is a numerical value determined by a microprocessor on the basis of the readout
from analog-digital converter and the set value of a digital potentiometer (Fig. 3), which was averaged for 20-ms period.
An average value of a signal for N samples (Fig. 7) is determined according to the follow-ing equation:
( ) ( )∑+−=
=j
Njirawraw iS
NjS
1
1, (12)
where N is the number of samples required for the determination of the level of a constant component and ( )raw iS is the average value determined for the ith moment (the ith sample).
Figure 6: Ca lculated change in signal-to-noise ratio as a function of a distance between a person and a PIR detector.

18 M. Kastek et al., Int. J. of Safety and Security Eng., Vol. 3, No. 1 (2013)
Instantaneous deviation from an average value (being an instantaneous level of a constant component) is determined as follows:
( ) ( ) ( )iSiSiR rawraw −= , (13)
A central moment of the fi rst row for a set of the parameters {Sraw(i)} can be determined as an instantaneous average value of deviations from the average using the following relation:
( ) ( ) ( ) ( )[ ]∑∑+−=+−=
−==i
Cijrawraw
i
CijjSjS
CjR
CiR
11
11, (14)
where C is the number of signal samples for which a correction is determined.Next, a signal component is determined using the following equation:
( ) ( ) ( ) ( )∑+−=
−−=m
Mmirawraw iRiSiS
MmS
1
1, (15)
where M is the number of samples in the process of averaging for the kth set of algorithm parameters, the average value rawS is the local reference level and R is the correction resulting from the long-lasting tendency of a signal change.
Finally, the equation allowing for the determination of a signal component takes the fol-lowing form:
( ) ( ) ( ) ( ) ( )[ ]∑ ∑∑+−= +−=+−=
−−−=m
Mmi
i
Cijrawraw
i
Nijrawraw jSjS
CjS
NiS
MmS
1 11
111. (16)
For a particular case, when N = C, the above equation becomes
( ) ( ) ( ) ( )∑ ∑∑+−= +−=+−=
+−=m
Mmi
i
Nijraw
i
Nijrawraw jSjS
NiS
MmS
1 121
121N 2 . (17)
A signal for further analysis constitutes the weighted sum of signals calculated for each set of parameters according to the following relation:
( ) ( )∑=
=K
kkk mSwmS
1, (18)
where wk is the coeffi cient of a signal component.
Figure 7: Notations used in a signal analysis method.

M. Kastek et al., Int. J. of Safety and Security Eng., Vol. 3, No. 1 (2013) 19
A signal, subjected to the analysis referred to objects (intruders) detection, is determined using the following relation:
( ) ( )mSGmS 2* ⋅= , (19)
where G is the amplifi cation (constant value) defi ned for each PIR detector.A value of an alarm threshold is adaptively determined as
( ) CpfBSK
AT S
kK
kiik +⋅+⋅= ∑
−+
=
11, (20)
where A is a constant value, determining the intensity of infl uence of previous samples of a signal on the value of a detection threshold, K is the number of samples used for averaging process, C is a parameter (constant), the value of which is dependent on the parameters that are set by a user, B is a constant value determining the intensity of infl uence of sun lighting on the detection threshold value, and f(pS) is the function dependent on the level of the sun lighting pS.
PIR detector generates the alarm signal when the amplitude of the signal read form a detec-tor of the given detection zone (channel) is higher than the adaptively determined alarm threshold. It means that an alarm signal is generated by a PIR detector in the case when the following inequality is fulfi lled:
*kk ST > . (21)
One the most serious problems of a PIR detector operation is to keep high detection prob-ability at low probability of a false alarm detection. At night, the level of thermal noises of a background is signifi cantly lower than that during the day. Thus, in an IR sensor, switching the IR sensor in day and night modes was used by applying the data from a sensor of a sun lighting level [3, 9].
Passive PIR sensor was made as an element of security system of special, valuable object. It has seven detection zones without blind spots and sophisticated method of intruder detec-tion, capable of fi nding slowly moving or even crawling people. In order to test its operation and to assess the effi ciency of the implemented signal processing method, the measurements of various parameters were performed, both under laboratory conditions and during fi eld tests.
5 RESULT OF INVESTIGATIONS OF THE METHOD USED IN A PIR DETECTORDuring the measurements, carried out under various metrological conditions, the data were registered allowing for checking the correctness of algorithm operation, i.e. of a detection threshold determination made in a microprocessor system. The results of signals registration and the calculated values of detection thresholds were registered using the software devel-oped for communication between a PIR detector and a computer. This software provides registration of signals from particular detection zones (channels) and registration of signals from particular stages of signal analysis. Figure 8 shows the test fi eld of a PIR detector.
Figure 9 presents selected records of signals from a PIR detector, which were produced due to a crawling person in an inspection zone. The presented results illustrate a change in the signal in the detector channels caused by a crawling person and adaptive change in the detec-tion threshold resulting from the change in the analyzed signal.
The investigation results presented in the above fi gures confi rmed proper operation of a detector, especially correctness and high effi ciency of signal analysis method. Figure 9 shows

20 M. Kastek et al., Int. J. of Safety and Security Eng., Vol. 3, No. 1 (2013)
a detection threshold following thermal changes in the background, which, for this measuring case, were caused by sun radiation.
Figure 10 presents the recorded changes in the signal in detection channel 1 of a PIR detec-tor caused by a person walking with a velocity of 1 m/s, which proves the universality of the used algorithm of a signal analysis allowing for the detection of very slowly or very quickly moving people.
Figure 8: The test fi eld and PIR detector during the tests.
Figure 9: Signal in detection channel 2 of a PIR detector (ambient temperature 26ºC, velocity of a crawling person 0.1 m/s, distance 140 m).
100 150 200 250 300 350 400 450 5000
50
100
150
200
250
300
350
400
t [s]
Sign
al
Channel 2
Signal
Treshold detection

M. Kastek et al., Int. J. of Safety and Security Eng., Vol. 3, No. 1 (2013) 21
The effi ciency of a signal analysis method, the aim of which is to determine a threshold value of a signal allowing for object detection, can be confi rmed by adequately high proba-bility of object detection and a low probability of a false alarm.
6 DETERMINATION OF A PERSON DETECTION PROBABILITYA signal coming from an object is disturbed with the noise generated by a background and electronic systems of a PIR detector. It can be assumed that the noise at the detector output is a white noise, while instantaneous values of voltages can be described with a normal distri-bution with the expected value Nx equal to zero and the standard deviation Ns .
For a signal with Gaussian distribution of probability density of instantaneous values of voltages, the detection probability is described using the following relation:
dxx
PDSD xx NN
∫∞
−⎟⎟⎠
⎞⎜⎜⎝
⎛ −−= 2
2
2exp
211
sps, (22)
where xD is the value of a detection threshold and Sx is the average value of the signal.Under the same conditions, the probability of a false alarm is expressed as
dxxPFADx NN∫∞
⎟⎟⎠
⎞⎜⎜⎝
⎛ −= 2
2
2exp
21
sps. (23)
For low probability of false alarms and high probability of object detection when it is ful-fi lled, eqns (22) and (23) can be transformed into the following form:
( )( )
⎟⎟⎠
⎞⎜⎜⎝
⎛ −−−
−= 2
2
2exp
21
N
DS
DS
N xxxx
PDsp
s, (24)
50 100 1100
50
100
150
200
250
300
350
400
450
500
t [s]
Sign
al
Channel 1
70 80 9060 120 130
Signal
Treshold detection
Figure 10: Signal in detection channel 2 of a PIR detector registered at night (ambient temperature 25°C, velocity of a moving person 1 m/s, distance 140 m).
22 M. Kastek et al., Int. J. of Safety and Security Eng., Vol. 3, No. 1 (2013)
⎟⎟⎠
⎞⎜⎜⎝
⎛ −= 2
2
2exp
2 N
D
D
N xx
PFAsp
s. (25)
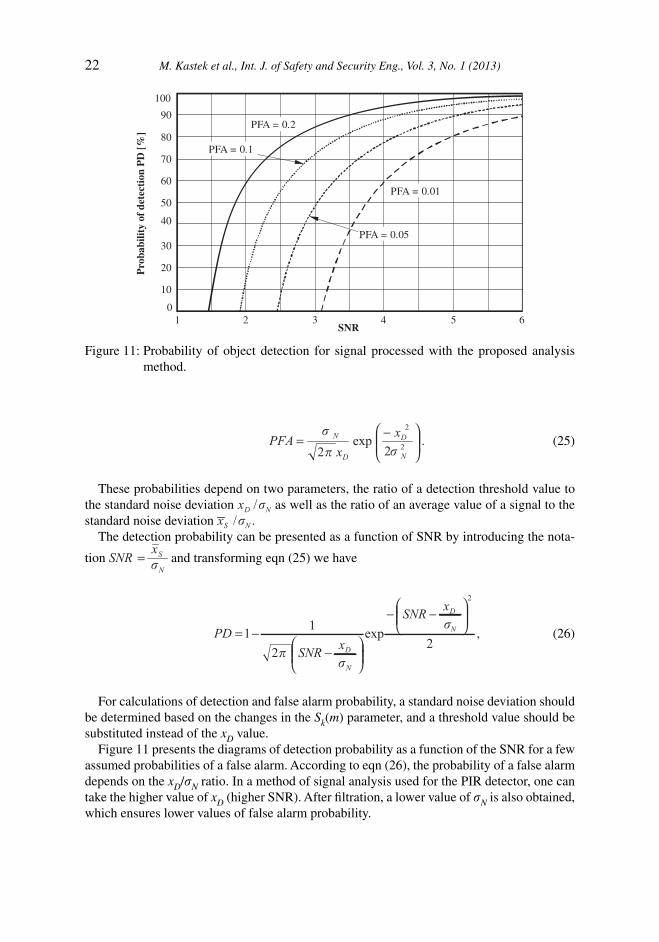
These probabilities depend on two parameters, the ratio of a detection threshold value to the standard noise deviation NDx s/ as well as the ratio of an average value of a signal to the standard noise deviation NSx s/ .
The detection probability can be presented as a function of SNR by introducing the nota-
tion N
SxSNRs
= and transforming eqn (25) we have
2
exp2
11
2
⎟⎟⎠
⎞⎜⎜⎝
⎛−−
⎟⎟⎠
⎞⎜⎜⎝
⎛−
−= N
D
N
D
xSNR
xSNRPD
s
sp
, (26)
For calculations of detection and false alarm probability, a standard noise deviation should be determined based on the changes in the Sk(m) parameter, and a threshold value should be substituted instead of the xD value.
Figure 11 presents the diagrams of detection probability as a function of the SNR for a few assumed probabilities of a false alarm. According to eqn (26), the probability of a false alarm depends on the xD/sN ratio. In a method of signal analysis used for the PIR detector, one can take the higher value of xD (higher SNR). After fi ltration, a lower value of sN is also obtained, which ensures lower values of false alarm probability.
Figure 11: Probability of object detection for signal processed with the proposed analysis method.
0
10
20
30
40
50
60
70
80
90
100
Pro
babi
lity
of d
etec
tion
PD
[%]
SNR1 2 3 4 5 6
PFA = 0.2
PFA = 0.1
PFA = 0.05
PFA = 0.01

M. Kastek et al., Int. J. of Safety and Security Eng., Vol. 3, No. 1 (2013) 23
7 CONCLUSIONTo recapitulate, it should be stated that the developed PIR detector detecting slowly moving and crawling people has the parameters allowing for its application in security systems. Sat-isfactory results of laboratory and fi eld investigations of the developed and performed model of a PIR detector have confi rmed that the developed detector detects the objects moving with the velocities from 5 cm/s to 5 m/s. A detection range of crawling people (for the performed model) is of the order of 140–150 m. The method of signal analysis used for the PIR detector gives lower values of false alarm probability. The new method of signal processing gives a higher detection probability than PIR with normal signal processing.
REFERENCES [1] Feng C. & Xu P., The detection mechanism of LiTaO3 type II pyroelectric detectors. III.
The total pyroelectric effects. Infrared Physics & Technology, 40, pp. 79–82, 1999. doi: http://dx.doi.org/10.1016/S1350-4495(98)00044-9
[2] Yoshiike N., Morinaka K., Hashimoto K., Kawaguri M. & Tanaka S., 360° direction type human information sensor. Sensor and Actuators, 77, pp. 199208, 1999. doi: http://dx.doi.org/10.1016/S0924-4247(98)00367-7
[3] Kastek, M., Sosnowski, T., Polakowski, H., D browski, M. & Or anowski, T., Long-range PIR detector used for detection of crawling people. Proceedings of SPIE, 7113, pp. 71131F, 2008.
[4] ELTEC Instruments Inc., Catalogue of Firm Products, P.O. Box 9610, Central Business Park, Daytona Beach, Florida 32120-9610, USA, 1996.
[5] Kastek M., Sosnowski T. & Pi tkowski T., Passive infrared detector used for detection of very slowly moving of crawling people. Opto-Electronics Review, 16(3), pp. 328–335, 2008. doi: http://dx.doi.org/10.2478/s11772-008-0022-3
[6] Kastek, M., Madura, H., Morawski M., Pi tkowski T., Powiada E. & Polakowski H., Test bed for measurement of angular parameters of passive infrared sensors. Infrared Physics Technology, 49(3 SPEC. ISS.), pp. 198–201, 2007.
[7] Madura H., Method of signal processing in passive infrared detectors for security systems. WIT Transactions on Modeling and Simulation, 46, pp. 757–768, 2007. doi: http://dx.doi.org/10.2495/CMEM070741
[8] Madura H., Kastek M. & Piatkowski T., Automatic compensation of emissivity in three-wavelength pyrometers, Infrared Physics and Technology, 51(1), pp.1–8, 2007. doi: http://dx.doi.org/10.1016/j.infrared.2006.11.001
[9] Madura H. & Kołodziejczyk M., Infl uence of sun radiation on results of non-contact temperature measurements in far infrared range. Opto-Electronics Review, 13(3), pp. 253–257, 2005.
[10] Madura H., Pi tkowski T. & Powiada E., Multispectral precise pyrometer for measure-ment of seawater surface temperature. Infrared Physics & Technology, 46 pp. 69–73, 2004. doi: http://dx.doi.org/10.1016/j.infrared.2004.03.010
[11] Sosnowski, T., Madura, H., Kastek, M., Pi tkowski T. & Powiada E., Method of objects detection employing passive IR detectors for security systems. Proceedings of SPIE, 7113, pp. 71131G, 2008. doi: http://dx.doi.org/10.1117/12.800147
This paper has been selected for this special issue but fi rst appeared in WIT Transactions on the Built Environment, Vol 108, © 2009 WIT Press, www.witpress.com, ISSN 1743-3509 (on-line), doi:10.2495/SAFE090071.