Passive Acoustics: An Effective Monitoring Technique for ... · PDF filePassive Acoustics: An...
15
Passive Acoustics: An Effective Monitoring Technique for the Harbor Porpoise (Phocoena phocoena) Pacific Biodiversity Institute
Transcript of Passive Acoustics: An Effective Monitoring Technique for ... · PDF filePassive Acoustics: An...

Passive Acoustics: An Effective Monitoring Technique for the Harbor Porpoise (Phocoena phocoena)
Pacific Biodiversity Institute
2
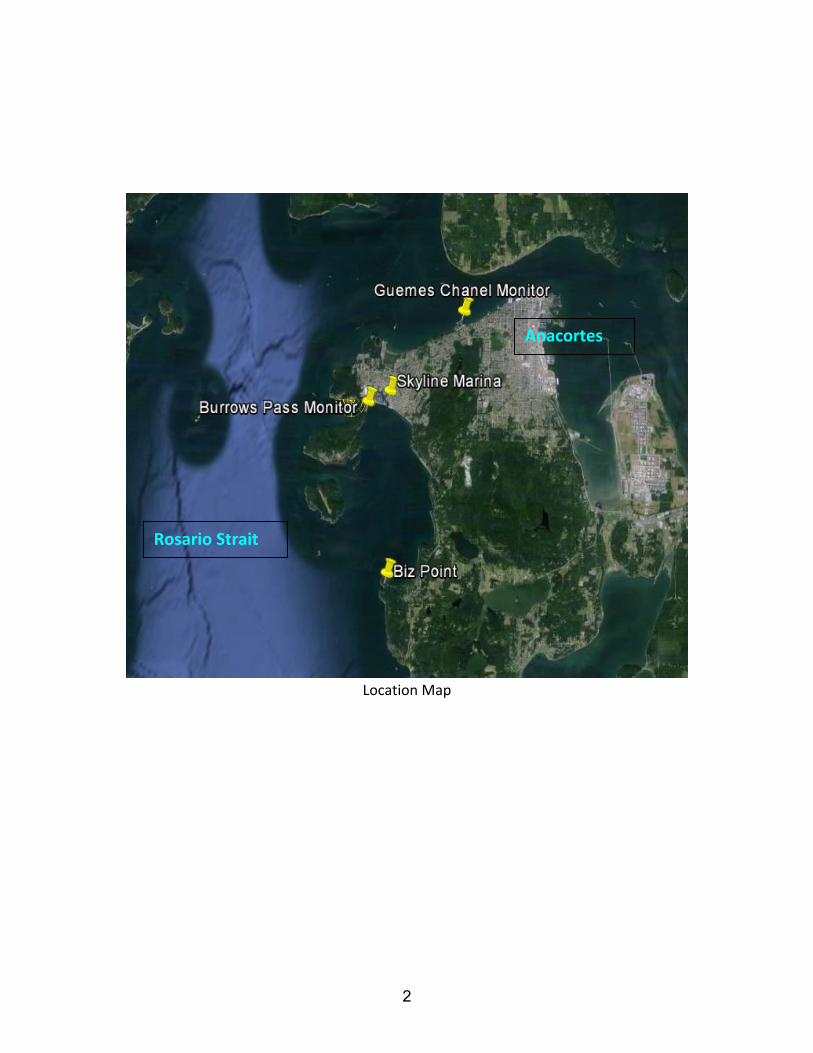
Location Map
Rosario Strait
Anacortes

3
Passive Acoustics: An Effective Monitoring Technique for the Harbor Porpoise (Phocoena phocoena)
Aileen Jeffries [email protected]
December 2012
Pacific Biodiversity Institute P.O. Box 298
Winthrop, Washington 98862 509‐996‐2490
RECOMMENDED CITATION Jeffries, A. 2012. Passive Acoustics: An effective monitoring technique for the harbor porpoise, Pacific Biodiversity Institute, Winthrop, Washington. 15 p. ACKNOWLEDGEMENTS My sincere appreciation to Dr. Craig Olson, Pacific Biodiversity Institute board, for his help with the presentation of the data in this report. Cover photograph by Steven Gnam http://www.stevengnamphotography.com/ PROJECT FUNDING The work described in this report was funded by two anonymous donors to Pacific Biodiversity Institute.

4
Table of Contents
Executive Summary..................................................................................................................... 6
Project Description ..................................................................................................................... 7
Instrument .................................................................................................................................. 8
Results......................................................................................................................................... 9
Discussion.................................................................................................................................. 13
Literature Cited ......................................................................................................................... 14

5
List of Figures Figure1. Porpoises Present in Burrows Pass from September 19 to October 16, 2011............... 10
Figure 2. The average number of detection positive minutes per hour over 26 days from
September 19 to October 16, 2011 shows a strong diurnal cycle................................................ 10
Figure 3. The number of minutes porpoises were present for each hour of the 26 days the
instrument was deployed. Each maximum occurs during nighttime hours between 1600 and
0600 and each minimum occurs during daylight hours. .............................................................. 11
Figure 4. Autocorrelation shows a clear diurnal cycle is dominant for the October 16, 2011 data.
....................................................................................................................................................... 11
Figure 5. The click rates of 400–600 clicks/sec indicate the porpoises were echolocating to
capture prey.................................................................................................................................. 12
Figure 6. Porpoises in Guemes Channel from June 28 to August 7, 2012................................... 12
Figure 7. Porpoises in Guemes Channel from November 6 to December 12, 2012. ................... 13

6
Passive Acoustics: An Effective Monitoring Technique for the Harbor Porpoise (Phocoena phocoena) ‐ 2011 to 2012
Executive Summary
The harbor porpoise (Phocoena phocoena) has not received an adequate level of protection or recognition because it is small, furtive, and difficult to monitor. Pacific Biodiversity Institute (PBI) conducted this study to test passive acoustic monitoring as a technique for studying this species. C‐POD, a passive acoustic monitor, was deployed in 2011 and the data analyzed to determine its effectiveness. This report documents that the instrument recorded the presence of porpoises continuously and effectively over extended periods of time. Further, through the use of this monitor we were able to compare porpoise presence in different locations, locate a hot spot for the porpoise, demonstrate a diurnal cycle for its presence, and discover that it was much more abundant at night than during the day. Background The harbor porpoise is a small, shy cetacean that was abundant in the Puget Sound in the 1950s. Its population dropped so dramatically that by 1990 it was no longer seen in the southern Puget Sound and rarely seen in other areas. Very little is known about the harbor porpoise because it is extremely difficult to monitor. This report is a preliminary test and assessment of the use of passive acoustic monitors to study the species and track its population trends. NOAA has a mandate to conduct harbor porpoise stock assessments every 3 to 5 years under the Marine Mammal Protection Act, 1972, but the most recent aerial surveys are over 10 years old. The Washington Department of Fish and Wildlife has identified the harbor porpoise as a Candidate Species of Concern but has not had the funding or information to complete the listing with a status review. The expense of monitoring every component of a complex ecosystem is clearly out of the range of public agencies that are struggling to cope with extensive budget cuts. Compared to other methods, PBI’s use of passive acoustic monitors, C‐PODs, is inexpensive and provides continuous records. Moreover, this new technology allows a species that has been too difficult to study to become an easily monitored indicator for the ecosystem. Ongoing population assessments of this species would first help to fill a critical information gap, and then provide a significant complement to NOAA’s aerial stock assessment surveys once those are conducted again. The ability to establish an accurate baseline population and then to monitor population changes in a timely, cost‐effective manner will prove invaluable to all of the agencies involved in the recovery of this species. Acoustic instruments have been used in the Baltic and North Sea to assess displacement of harbor porpoises from construction activities (Carstensen et al. 2006, Evans 2008, Scheidat et

7
al. 2011). Generally in other areas, acoustic monitoring has been used to sample and look for changes in the abundance of these porpoises in the vicinity of new marine power‐generation facilities. The bottom disturbance, construction noise, and generator's operational noise of such projects significantly affect the porpoise habitat, and this monitoring has been used to demonstrate displacement and changes in abundance (Fisher and Tregenza 2003, Tougaard 2009).
Project Description
Passive acoustic monitoring of harbor porpoise echolocations is being tested as a method for studying the location, distribution, and behavior of this species in the Puget Sound. For the past year, we have maintained an acoustic monitor attached to a buoy in Burrows Pass, south of Fidalgo Island in the Puget Sound of Washington State. During this interval we have also placed a second monitor in various locations in the area to compare detections for the presence of the porpoise. Visual observations have been conducted to complement the information provided by the acoustic monitor. Our primary study site is the Burrows Pass area next to Fidalgo Island. Here a C‐POD was used to record harbor porpoise presence in the Burrows Pass for much of the interval from the summer of 2011 through 2012. The C‐POD was deployed by tethering it to a buoy, which was anchored to the seabed at a depth of 20 meters. The instrument was attached 5 meters below the surface. A large 0.60‐meter buoy marked the location. In the fall of 2011, the monitor was deployed for 26 consecutive days, including a nearly complete lunar and tidal cycle, from September 19, 2011 to October 16, 2011. Data from this deployment is reported here. To first verify that we could understand our data, the C‐POD had been tested using comparisons between recordings from the C‐POD and a Reson 4034 hydrophone (Jeffries 2009). Using the time stamp on recorded echolocations, we were able to confirm that we could identify recordings on one instrument and relate the recordings to the other instrument. We are also conducting land‐based observations at this site and testing ways to correlate visual and acoustic data (Jeffries 2011). Our visual observations have provided a base of data identifying which cetaceans use the Burrows Pass area and how often they use it. We have had 8 to 16 volunteers recording visual observations for more than 400 hours at this site. One of the obstacles to using acoustic monitoring in the Puget Sound is the presence of two porpoise species, harbor and Dall’s, that have not yet been differentiated acoustically. In our two years of land‐based observations, Dall's porpoise were not sighted in Burrows Pass by our observer team. We are confident that our acoustic recordings are exclusively harbor porpoise. During this same time interval, orca were never sighted in the pass. Acoustic monitoring has significant advantages over boat or aerial surveys. The C‐POD records data 24 hours a day, 7 days a week. This means that we can obtain a continuous record of porpoise presence day and night, in inclement weather and during intervals of fog or a rough sea state. The monitor records data of the underwater presence of the porpoise whenever the

8
porpoises are not visible from air, boat, or land. The monitor can be deployed for 3 to 4 month intervals without maintenance or attention. Therefore, it can record data for a full year at a relatively low cost.
Instrument
The instrument we are using is the C‐POD, an acoustic monitor developed by Dr. Nick Tregenza, Chelonia Limited, Cornwall, UK. We have one of the first ones, #0164, built in 2008. This instrument has a 20 kHz to 160 kHz omni‐directional hydrophone in a polypropylene housing. The nominal maximum detection range in the specifications is 300 meters. The literature reports that the range is sensitive to detection threshold and the detection threshold may increase with time, causing the range to decrease. This is thought to be due to aging and a decrease in hydrophone sensitivity due to impacts received during deployment (Kyhn et al. 2008). The detection algorithm uses digital time domain waveform analysis, with duration (5μs resolution), intensity, bandwidth, frequency and envelope criteria to select possible cetacean clicks in the range 20–160 kHz. The detection parameters are: centre frequency, frequency trend, duration, intensity (8 bit), bandwidth, and envelope slope, which are logged for each click. The data is compacted such that 3 to 5 months of data can be recorded on a removable, high‐density, 4‐GB Secure Digital (SD) memory card (Chelonia 2012). The analysis software has automatic train recognition and can distinguish between porpoises and dolphins. It cannot distinguish between dolphin species or between porpoise species at this time (Chelonia 2012). The false positive identification rate has been found to be close to zero (Kyhn et al. 2012). A low probability of detecting more than one animal at a time has been found because of the narrow echolocation beam, 16.6 degrees, and the species behavior characteristics (Starkhammar et al. 2011, Kyhn et al. 2012). Sets of similar T‐PODs instruments have been compared and a variation of the individual sensitivity was within a range of 123–132 dB re 1mPa (pp) (Kyhn et al. 2008). The T‐POD also has been shown to have a negligible false detection rate (Kyhn et al. 2012). I tested for false positive detections on the C‐POD at the Burrows Pass site by identifying intervals of daylight hours in which porpoises were not sighted. There were no detections from the CPOD during these intervals of time. Data is collected from the monitor by retrieving it from the water and opening it, and then swapping the SD card with a new one. The data from the SD card is then downloaded to a computer using Chelonia's software, C‐POD.exe, v2.026, October 8, 2011 (Chelonia 2012). This program uses proprietary algorithms to automatically detect and classify click trains by species. These identified click trains may be viewed with the raw data in graphic form at as fine a resolution as 10 microseconds. The program also reports summary data including total and average number of clicks detected and will output tabular sums of clicks by time interval. With this program the raw data may be examined and exported to spreadsheet files.

9
Results
The monitor at Burrows Pass collected data from September 2011 through December 2012. There were several intervals in which data was not collected, but in general the instrument operated continuously. The monitor operated for 273 days and detected porpoise presence each day it was deployed. Generally, porpoises were present for over 20 hours each day. A strong diurnal cycle has been observed, demonstrating a significantly greater presence at night than during the day. The second monitor has been placed in two positions in Skyline marina, in the Lovric marina, at the edge of Guemes Channel, at Biz Point and off a dive boat in Rosario Strait and San Juan Channel. One of these placements, close to the center of the Skyline marina, recorded several minutes of presence in a period of 2 days. The infrequent visits of porpoises that were recorded were at night. A second location in the Skyline marina, near the entrance, was left in place for 15 days and also demonstrated infrequent visits of up to 10 minutes several times. This is a low presence but a greater presence than seen interior to the marina. Almost all of the presence was at night. Nothing was recorded in the few hours a hydrophone was deployed from a dive boat in Rosario or San Juan Channel. The Biz Point location recorded 2 hours presence in the early morning of the one day it was deployed. Data from the Burrows Pass site shows that there is a large porpoise presence at that location. The summary C‐POD.exe analysis showed an average of over 1.2 million clicks per day, which is equivalent to 889 clicks per minute. This represents a high‐density area similar to the southern North Sea.1 Porpoise were generally present all day and often for over 20 hours of the day (Figure 1). One of the unexpected findings was that the porpoises were present in a strong diurnal cycle, as shown in Figure 2, and that they were present much more often at night than during the day. This diurnal cycle persisted and was consistently greater at night (Figure 3). An autocorrelation analysis was applied to determine if the cycle was diurnal or tidal and demonstrated that the cycle was diurnal (Figure 4). Further analysis of click rates showed that the click rates were frequently in the range of 400–500 c/s which indicates they were foraging and attempting to capture prey (Figure 5).
1 Personal communication with Nick Tregenza, Chelonia Limited, Beach Cottage, 5 Beach Terrace, Long Rock, Cornwall, TR20 8JE, UK.

10
Porpoise Present - Burrows PassSeptember 19 to October 16, 2011
0
6
12
18
24
20 21 22 23 24 25 26 27 28 29 30 1 2 3 4 5 6 7 8 9 10 11 12 13 14 15 16
Day
Ho
urs
Pre
sen
tp
er D
ay
September October
Figure1. Porpoises Present in Burrows Pass from September 19 to October 16, 2011.
Figure 2. The average number of detection positive minutes per hour over 26 days from September 19 to October 16, 2011 shows a strong diurnal cycle.

11
Porpoise Presence - 2011 Diurnal Cycle from Sept 19 to Oct 16
010203040506070
1 169 337 505
Hours
Mii
nu
tes
Pre
sen
t p
er
Ho
ur
1st week 2nd week 3rd week 4th week
Figure 3. The number of minutes porpoises were present for each hour of the 26 days the instrument was deployed. Each maximum occurs during nighttime hours between 1600 and 0600 and each minimum occurs during daylight hours.
Figure 4. Autocorrelation shows a clear diurnal cycle is dominant for the October 16, 2011 data.

12
Figure 5. The click rates of 400–600 clicks/sec indicate the porpoises were echolocating to capture prey. The Guemes Channel placements were for 40 and 37 days and recorded a regular presence of the porpoise, but many fewer porpoises than Burrows Pass. The porpoises that did come by this deployment were present primarily between2300 and 0500. They were there for intervals of only a few minutes of presence at these times. There were generally some porpoises present 2 to 4 hours out of a day. The echolocations when they were present appeared to be at a high click rate, which indicates they were capturing fish. We put a monitor at this location in both the summer and fall seasons to compare the porpoises' use of this area and found similar presence. See Figures 6 and 7. The depth was about 30 feet and the bottom was mud. This is quite different from Burrows Pass where the bottom is rock, the depth 60 feet, and the area monitored is next to an underwater rock cliff where there might be prey fish.
Porpoise Present - Guemes Channel6/282012 to 8/7/2012
0
2
4
6
8
10
12
6/28 7/5 7/12 7/19 7/26 8/2
Day
Hours
Pre
sent per
Day
Figure 6. Porpoises in Guemes Channel from June 28 to August 7, 2012.

13
Porpoise Present Guemes Channel11/6 to 12/12
0
2
4
6
8
10
12
6 8 10 12 14 16 18 20 22 24 26 28 30 2 4 6 8 10 12
Day
Hours
Pre
sent Per
Day
Figure 7. Porpoises in Guemes Channel from November 6 to December 12, 2012.
Discussion
The value of the monitor is demonstrated by the amount and type of information that we have collected from our initial deployments. The monitor record shows that there were porpoises present every day of the deployment. Many more porpoises were recorded as present in this area than we had expected because of the unexpected diurnal use cycle peaking at night. This demonstrates the C‐POD’s advantage over visual observations, since visual observations cannot be easily made at night. It also demonstrates that one cannot extrapolate porpoise usage of an area during daylight hours to infer nighttime usage. This research demonstrates that acoustic monitoring is an excellent way of determining the timing and amount of use and hence the importance of an area for foraging, travel, and lifecycle events. Information obtained from acoustic monitoring can be used to evaluate the suitability of protecting an area through reserve designation or seasonal use restrictions (Goodwin 2008, Li et al. 2010, Booth 2010). Acoustic monitoring complemented by visual observations can be used to meet criteria such as those identified by the European Union’s Habitats Directive as necessary for protecting species. This directive declares that for species or habitats listed, Special Areas of Conservation must be established under the criteria to “identify areas representing crucial factors for the lifecycle of this species.” Visual observations can be used to identify the type of use for each site. Sets of annual acoustic data can be used to show population trends and to record changes in abundance and behavior due to human activities and other factors (e.g. forage fish, predators). All of this information will be valuable in selecting areas to designate for reserves or seasonally restricted human use.

14
Literature Cited
Booth, C. G. 2010. Variation in habitat preferences and distribution of harbour porpoises west of Scotland. PhD thesis. University Saint Andrews, Scotland. 265 p. Carstensen, J., O. D. Henriksen, and J. Teilmann. 2006. Impacts of offshore wind farm construction on harbour porpoises: acoustic monitoring of echolocation activity using porpoise detectors (T‐PODs). Marine Ecology Progress Series 321:295‐308. Chelonia Limited, Beach Cottage, 5 Beach Terrace, Long Rock, Cornwall, TR20 8JE, UK. http://www.chelonia.co.uk/cpod_specification.htm (accessed March 15, 2012). Evans, P. G. H. 2008. Offshore wind farms and marine mammals: Impacts & methodologies for assessing impacts. Proceedings of the Asconbans/ECS Workshop. 68 p. Fisher, P., and N. Tregenza. 2003. An assessment of the effect of a tidal power generator on porpoise habitat use and an evaluation of the acoustic methods employed, August–October 2003. A report to the Highlands and Islands Enterprise, Shetland Islands Council, The Crown Estate & The Engineering Business Ltd. 43. Goodwin, L, 2008. Diurnal and tidal variations in habitat use of the harbor porpoise. Aquatic Mammals 34:44‐53. Jeffries, A. 2009. Comparison of recordings of a rescued harbor porpoise using a passive acoustic monitor and a high frequency hydrophone. Pacific Biodiversity Institute. Winthrop, Washington. 11 p. Jeffries, A. 2011. Harbor Porpoise Observations in Burrows Pass December 2009 through December 2010. Pacific Biodiversity Institute. Winthrop, Washington. 15 p. Kyhn, L. A., J. Tougaard, J. Teilmann, M. Wahlberg, P. B. Jorgensen, and N. I. Bech. 2008. Harbour porpoise (Phocoena phocoena) static acoustic monitoring: laboratory detection thresholds of T‐PODs are reflected in field sensitivity. Journal of the Marine Biological Association of the United Kingdom 88:1085–1091. Kyhn, L. A. 2010. Passive acoustic monitoring of toothed whales, with implications for mitigation, management and biology. PhD thesis. Department of Arctic Environment, National Environmental Research Institute, Aarhus University, Denmark. 166 p. Kyhn, L. A., J. Tougaard, L. Thomas, L. R. Duve, J. Stenback, M. Amundin, G. Desportes, and J. Teilmann. 2012. From echolocation clicks to animal density—Acoustic sampling of harbor porpoises with static dataloggers. The Journal of the Acoustical Society of America 131:550‐560. LI, S., T. Akamatsu, L. Dong, K. Wang. D. Wang, and S. Kimura, 2010. Widespread passive acoustic detection of Yangtze finless porpoise using miniature stereo acoustic data‐loggers: A review. The Journal of the Acoustical Society of America 128:1476‐1482. Scheidat, M., J. Tougaard, S. Brasseur, J. Carstensen, T. van P. Petel, J. Teilmann, and P. Reijnders. 2011. Harbour porpoises (Phocoena phocoena) and wind farms: a case study in the Dutch North Sea. Environmental Research Letters 6:1‐10. Starkhammar, J., J. Nilsson, M. Amundin, S. A. Kuczaj II, M. Almqvist, and H. W, Persson. 2011. Separating overlapping click trains originating from multiple individuals in echolocation recordings. The Journal of the Acoustical Society of America 129:458‐466.

15
Tougaard, J., J. Carstensen, J. Teilmann, H. Skov, and P. Rasmussen. 2009. Pile driving zone of responsiveness extends beyond 20 km for harbor porpoises (Phocoena phocoena (L.)) (L). The Journal of the Acoustical Society of America 126:11‐14.