Passenger Rail Usage 2017-18 Q1 - Office of Rail and...
14
Responsible Statistician: Peter Moran (Tel: 020 7282 2074) Author: Nisha Nair Public Enquiries: Email: [email protected] Media Enquiries: Tel: 020 7282 2094 Website: http://orr.gov.uk/statistics/published-stats/statistical-releases Contents Passenger journeys – p2 Passenger kilometres – p4 Passenger revenue – p6 Passenger train kilometres – p9 Annexes – p10 REVISED: 06 October 2017 Rail passenger journeys in Great Britain fell by 2.7% in 2017-18 Q1 as passenger journeys fell to 416m, the lowest number of journeys since 2015-16 Q1. Passenger journeys by ticket type, percentage change (2017-18 Q1 to 2016-17 Q1) The number of journeys made using season tickets fell to its lowest level since 2012-13 Q2, with 19m fewer journeys made compared to this time last year. Advance, Off-Peak and Anytime tickets all experienced an increase on last year, which suggests a change in behaviour with people moving towards a more flexible ticket. This is further evidenced by a 4.5% increase in revenue per journey, with people switching from season tickets to tickets that offer a higher price per journey. Background This release contains statistics on passenger rail usage in Great Britain with the latest quarterly data referring to April, May and June (2017-18 Q1). Passenger journeys, kilometres and revenue are sourced from the rail industry’s ticketing and revenue database (LENNON) and train operating companies (TOCs). These measures are published by TOC, sector and ticket type. Passenger train kilometres are sourced from Network Rail’s Track Access Billing System (TABS) and published for each TOC. This has replaced timetabled train kilometres in this statistical release. Passenger Rail Usage 2017-18 Q1 Statistical Release Publication date: 05 October 2017 Next Publication date: 14 December 2017
Transcript of Passenger Rail Usage 2017-18 Q1 - Office of Rail and...

Responsible Statistician: Peter Moran (Tel: 020 7282 2074) Author: Nisha Nair Public Enquiries: Email: [email protected] Media Enquiries: Tel: 020 7282 2094 Website: http://orr.gov.uk/statistics/published-stats/statistical-releases
Contents Passenger journeys – p2 Passenger kilometres – p4 Passenger revenue – p6 Passenger train kilometres – p9 Annexes – p10
REVISED: 06 October 2017
Rail passenger journeys in Great Britain fell by 2.7% in 2017-18 Q1
as passenger journeys fell to 416m, the lowest number of journeys
since 2015-16 Q1.
Passenger journeys by ticket type, percentage change (2017-18 Q1 to 2016-17 Q1)
The number of journeys made using season tickets fell to its lowest
level since 2012-13 Q2, with 19m fewer journeys made compared to
this time last year. Advance, Off-Peak and Anytime tickets all
experienced an increase on last year, which suggests a change in
behaviour with people moving towards a more flexible ticket.
This is further evidenced by a 4.5% increase in revenue per journey,
with people switching from season tickets to tickets that offer a higher
price per journey.
Background This release contains statistics on
passenger rail usage in Great
Britain with the latest quarterly
data referring to April, May and
June (2017-18 Q1).
Passenger journeys, kilometres and revenue are
sourced from the rail industry’s
ticketing and revenue database
(LENNON) and train operating
companies (TOCs). These
measures are published by TOC,
sector and ticket type.
Passenger train kilometres are
sourced from Network Rail’s
Track Access Billing System
(TABS) and published for each
TOC. This has replaced
timetabled train kilometres in this
statistical release.
Passenger Rail Usage 2017-18 Q1 Statistical Release Publication date: 05 October 2017 Next Publication date: 14 December 2017
Office of Rail and Road 5 October 2017 2017-18 Q1 Statistical Release – Passenger Rail Usage 2
1. Passenger journeys
2017-18 Q1 Passenger journeys fall by 2.7% compared to 2016-17 Q1
The four largest operators’ journey numbers decrease between 5.3% and 8.8%
Season ticket journeys fall by 11.0% with growth experienced on all other ticket types.
Passenger journeys in Great Britain fell by 2.7% in 2017-18 Q1 compared to the same quarter last
year, driven by a 4.5% fall in journeys in the London and South East sector. This reduction was offset
by increases in the Long Distance (1.5%) and Regional sectors (1.8%).
Passenger journeys by operator, 2017-18 Q1 and percentage change to 2016-17 Q1
Of the four largest passenger operators, all of whom operate within the London and South East sector
and account for just over 50% of all journeys, only London Overground saw an increase in journey
numbers.
Passenger journeys are calculated based on travel from an origin station to a destination station. A train
journey may include one or more changes of train, and one journey is generated for each train used.
Quarterly and annual data by sector are available from 1994-95 onwards in Table12.6
Quarterly data by ticket type are available from 1994-95 Q1 and annual data are available from 1986-87
onwards in Table 12.7.
Quarterly and annual data by TOC are now available from 2011-12 onwards in Table 12.12.
A time series of aggregate annual data from 1950 are also available in Table 12.5.

Office of Rail and Road 5 October 2017 2017-18 Q1 Statistical Release – Passenger Rail Usage 3
The number of journeys made on season tickets fell to 153m in 2017-18 Q1, the lowest number in any
quarter since 2012-13. Advance, anytime and off-peak tickets all experienced growth over the same
period suggesting that passengers have switched from season tickets to more flexible tickets. The fall
in journeys, and season ticket journeys in particular, may be partly due to the effect of the Easter
weekend, which was in April this year (2017-18 Q1) as opposed to March in 2016 (2015-16 Q4)
Passenger journeys, season tickets (2012-13 Q1 to 2017-18 Q1)

Office of Rail and Road 5 October 2017 2017-18 Q1 Statistical Release – Passenger Rail Usage 4
2. Passenger kilometres
2017-18 Q1 Passenger kilometres increased by 0.3% in 2017-18 Q1
Passenger kilometre growth in the Long-Distance and Regional sector partially offset by 3.1% fall
in London & South East
Passenger kilometres by sector, percentage change (2014-15 Q1 to 2017-18 Q1)
Passenger kilometres are calculated by multiplying the number of passenger journeys on a
particular flow by the number of track kilometres between the two required stations.
Quarterly and annual data by sector is now available from 1994-95 onwards in Table 12.3
Quarterly data by ticket type is now available from 1994-95 Q1 and annual data is available from
1986-87 onwards in Table 12.4
Quarterly and annual data by TOC is now available from 2011-12 onwards in Table 12.11
A time series of aggregate annual data from 1947 is also available in Table 12.2

Office of Rail and Road 5 October 2017 2017-18 Q1 Statistical Release – Passenger Rail Usage 5
Nationally, passenger kilometres increased by 0.3% to 16.3bn in 2017-18 Q1 compared to the same
quarter last year despite the reduction in the number of passenger journeys.
Passenger kilometres in the Long Distance and Regional sector increased by 2.7% and 4.3%. This
exceeded growth seen in passenger journeys, which suggests that passengers may be switching to
other modes for shorter distance travel within those sectors.
Passenger kilometres fell in London and South East for the third quarter in succession, mirroring the
fall in passenger journeys within the sector.
Passenger kilometres by operator, 2017-18 Q1 and percentage change to 2016-17 Q1
The main driver of the fall in London and South East was South West Trains, who experienced a 6.5%
fall in passenger kilometres in 2017-18 Q1. This reduction may be partly due to a change in the
scheduling for Wimbledon fortnight, which took place two weeks later than usual in 2017, thereby
falling into Q2 rather than Q1.
Scotrail passenger kilometres increased by 8.5% compared to 2016-17 Q1. This is primarily due to
Scotrail recovering from disruption suffered last year because of the Glasgow Queen Street tunnel
closure, which took place between March and August 2016 and resulted in diversionary routes.
Chiltern Railways’ passenger kilometres reached a record high of 389m in 2017-18 Q1, assisted by
the completion of the London to Oxford City Centre route which was opened in December 20161.
1 https://www.chilternrailways.co.uk/news/chiltern-railways-announces-oxford-city-centre-london-marylebone-launch-date
Office of Rail and Road 5 October 2017 2017-18 Q1 Statistical Release – Passenger Rail Usage 6
3. Passenger revenue
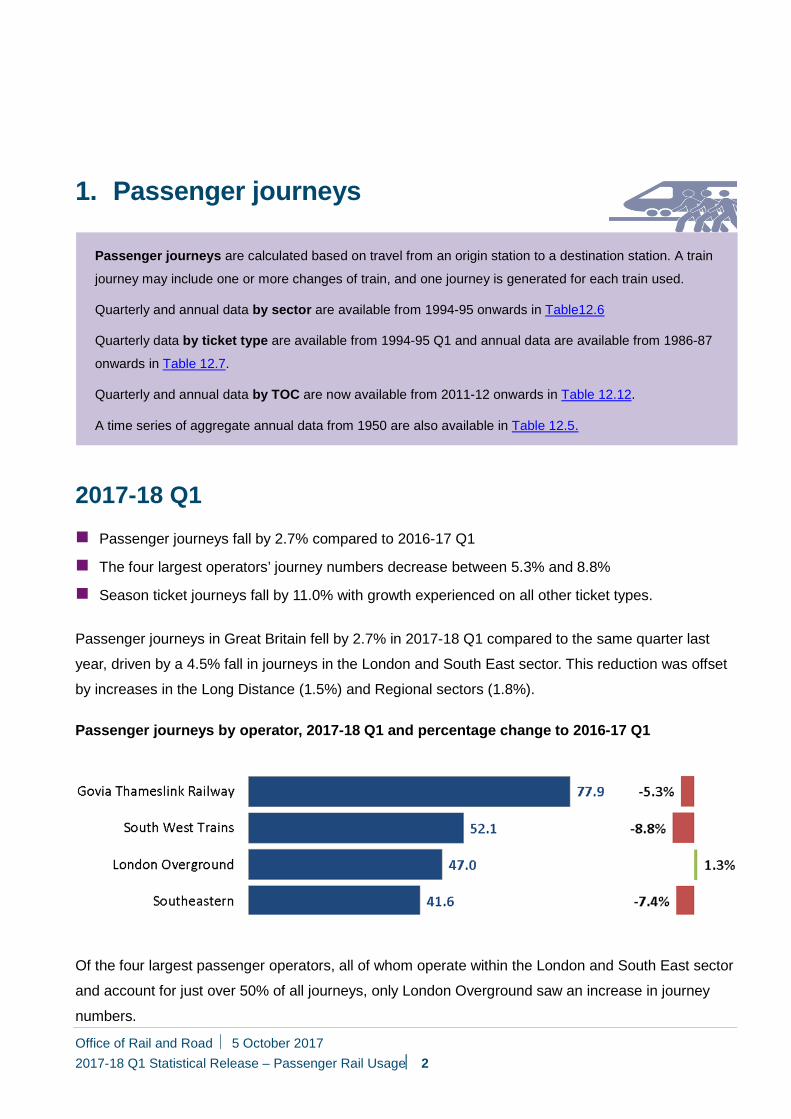
2017-18 Q1 Revenue in the Long Distance sector slowed to 1.6%, the lowest growth rate since 2012-13.
Compared to 2016-17 Q1, growth was strongest in the Regional sector
Season ticket revenue fell for the sixth quarter in a row
Passenger revenue by ticket type, percentage change (2015-16 Q1 to 2017-18 Q1)
6.5% 6.4%
4.6%4.0%
4.9%
2.3% 2.1%
5.8%
3.7%
6.6%
2.9%
1.3%
-0.6% -0.6%
-1.5% -1.7%-2.2%
-4.9%
2015-16 Q1 2016-17 Q1 2017-18 Q1
Season
Ordinary
Passenger revenue statistics show all ticket revenue and miscellaneous charges associated with
passenger travel on national railways, but not including government support or grants.
Quarterly data by sector is now available from 1995-96 Q1 and annual data is available from 1994-
95 onwards in Table 12.8
Quarterly data by ticket type is now available from 1996-97 Q1 and annual data is available from
1986-87 onwards in Table 12.9

Office of Rail and Road 5 October 2017 2017-18 Q1 Statistical Release – Passenger Rail Usage 7
Season ticket revenue fell by 4.9% compared to 2016-17 Q1. This is the sixth quarter in a row that
revenue has fallen for season tickets and the 4.9% represents the largest fall over that period.
Despite reaching a record high of £826m in 2017-18 Q1, revenue growth in the Long Distance sector
fell to its slowest growth rate since 2012-13. The Regional sector continued to demonstrate strong
revenue growth, increasing by 5.3% to £372m. Over the last five years, revenue growth in this sector
has outstripped both the Long Distance and London and South East sectors.
Passenger revenue by sector, percentage change (2012-13 Q1 to 2017-18 Q1)

Office of Rail and Road 5 October 2017 2017-18 Q1 Statistical Release – Passenger Rail Usage 8
Revenue per journey increased to £5.72 in 2017-18 Q1, which is 21p higher than any other quarter on
record. This represented an increase of 4.5% compared to the same quarter last year and was the
largest year on year growth since 2014-15 Q4. This provides further evidence of a shift from season
tickets, which offer the cheapest price per journey, to other ticket types.
Similarly, revenue per passenger kilometre reached a record high of 14.7p, an increase of 1.4% on
2016-17 Q1.

Office of Rail and Road 5 October 2017 2017-18 Q1 Statistical Release – Passenger Rail Usage 9
4. Passenger Train Kilometres
2017-18 Q1 Passenger train kilometres increased by 0.6% in 2017-18 Q1, reversing the falling trend seen
in the last three quarters.
Chiltern Railways (3.1m) and Virgin Trains East Coast (5.7m) had a record number of train
kilometres in 2017-18 Q1.
Non-franchised operators’ train kilometres increased by 1.7%, driven by a 10.1% increase on
Heathrow Connect.
Nationally, passenger train kilometres increased by 0.6% compared to 2016-17 Q1. The largest
contribution to the increase came from Scotrail (4.7%) and Govia Thameslink Railway (3.5%).
Scotrail launched additional weekend services for Glasgow suburban services whilst Govia
Thameslink Railway has recovered since 2016-17 Q1, where ongoing staff issues and
cancellations led to an emergency timetable being introduced in July 2016. The full timetable was
gradually restored throughout 2016-17.
Merseyrail train kilometres fell by 16.2% compared to 2016-17 Q1 due to engineering works
affecting services on the Wirral Line2.
2 https://www.merseyrail.org/news/network-rail-track-renewal-on-the-wirral-loop.aspx
Passenger train kilometres refers to the number of train kilometres (million) travelled by
revenue earning passenger trains. The passenger train kilometres are derived from Network
Rail’s Track Access Billing System (TABS), which Network Rail use to bill train operators.
The passenger train kilometres for Heathrow Express have been excluded from the total figures
for the non-franchised operators. Heathrow Express is not charged through Networks Rail’s
Track Access Billing System.
Quarterly data for Passenger train kilometres is available from 2010-11 Q1 to 2016-17 Q4.
Annual data for Passenger train kilometres is available from 2010-11 to 2016-17
(Table 12.13)

Office of Rail and Road 5 October 2017 2017-18 Q1 Statistical Release – Passenger Rail Usage 10
Annex 1 – List of pre-created reports available on the ORR Data Portal All data tables can be accessed on the data portal free of charge. The ORR data portal provides on
screen data reports, as well as the facility to download data in Excel format and print the report.
We can provide data in csv format on request.
Passenger train kilometres
Passenger train kilometres by operator – Table 12.13
Passenger kilometres
Passenger kilometres – Table 12.2 (franchised only)
Passenger kilometres by sector – Table 12.3
Passenger kilometres by ticket type – Table 12.4
Passenger kilometres by train operating company – Table 12.11
Passenger journeys
Passenger journeys – Table 12.5 (franchised only)
Passenger journeys by sector – Table 12.6
Passenger journeys by ticket type – Table 12.7
Passenger journeys by train operating company – Table 12.12
Passenger revenue
Passenger revenue by sector – Table 12.8
Passenger revenue by ticket type – Table 12.9
Revenue per passenger kilometre and per passenger journey – Table 12.10 (franchised only)

Office of Rail and Road 5 October 2017 2017-18 Q1 Statistical Release – Passenger Rail Usage 11
Timetabled Train Kilometres (TTKM)
Timetabled Train Kilometres by train operating company – Table 12.1 (Includes data until 2015-16 Q2)
Revisions: There have not been any revisions to the previously published tables associated with
this statistical release. Further details can be found at: Revisions Log
For more information on data collection and the methodology used to calculate the statistics in this
release please see the accompanying Quality Report.
Regional passenger journeys showing rail journeys to/from and within each region or country are
published in Regional Rail Usage statistical release and data portal tables. These journeys are
based on the origin and destination named on a ticket and do not take into account any changes of
train. It therefore produces slightly lower estimates than the total journeys published in this
Passenger Rail Usage statistical release.

Office of Rail and Road 5 October 2017 2017-18 Q1 Statistical Release – Passenger Rail Usage 12
Annex 2 Statistical Releases This publication is part of the statistical releases which cover the majority of reports that were
previously released through the Data Portal. The statistical releases consist of four annual and four
quarterly themed releases:
Annual: Rail Finance & Rail Fares Index;
Key Safety Statistics;
Rail Infrastructure, Assets and Environmental;
Regional Rail Usage.
Quarterly: Passenger and Freight Rail Performance;
Freight Rail Usage;
Passenger Rail Usage;
Passenger Rail Service Complaints.
A full list of publication dates for the next twelve months can be found in the release schedule on
the ORR website.
Office of Rail and Road 5 October 2017 2017-18 Q1 Statistical Release – Passenger Rail Usage 13
National Statistics The United Kingdom Statistics Authority designated these statistics as National Statistics, in
accordance with the Statistics and Registration Service Act 2007 and signifying compliance with
the Code of Practice for Official Statistics.
National Statistics status means that official statistics meet the highest standards of
trustworthiness, quality and public value.
All official statistics should comply with all aspects of the Code of Practice for Official Statistics.
They are awarded National Statistics status following an assessment by the Authority’s regulatory
arm. The Authority considers whether the statistics meet the highest standards of Code
compliance, including the value they add to public decisions and debate.
It is ORR’s responsibility to maintain compliance with the standards expected of National Statistics.
If we become concerned about whether these statistics are still meeting the appropriate standards,
we will discuss any concerns with the Authority promptly. National Statistics status can be removed
at any point when the highest standards are not maintained, and reinstated when standards are
restored.
For more details please contact the Statistics Head of Profession Abby Sneade on 020 7282 3978
or contact [email protected].
The Department for Transport (DfT) also publishes a range of rail statistics which can be found at
DfT Rail Statistics.

Office of Rail and Road 5 October 2017 2017-18 Q1 Statistical Release – Passenger Rail Usage 14
© Crown copyright 2017
This publication is licensed under the terms of the Open Government Licence v3.0 except where otherwise stated. To view this licence, visit nationalarchives.gov.uk/doc/open-government-licence/version/3 or write to the Information Policy Team, The National Archives, Kew, London TW9 4DU, or email: [email protected]. Where we have identified any third party copyright information you will need to obtain permission from the copyright holders concerned. This publication is available at orr.gov.uk Any enquiries regarding this publication should be sent to us at orr.gov.uk