
Passenger Fares for Overseas Travel in the 19th and 20th...
47
EHA paper: 8-15-2012 Page | 1 Passenger Fares for Overseas Travel in the 19 th and 20 th Centuries Brandon Dupont, Western Washington University Drew Keeling, University of Zurich Thomas Weiss, University of Kansas and NBER Paper prepared for the Annual Meeting of the Economic History Association Vancouver, BC CANADA September 21-23, 2012
Transcript of Passenger Fares for Overseas Travel in the 19th and 20th...
EHA paper: 8-15-2012
Page | 1
Passenger Fares for Overseas Travel in the 19th
and 20th
Centuries
Brandon Dupont, Western Washington University
Drew Keeling, University of Zurich
Thomas Weiss, University of Kansas and NBER
Paper prepared for the
Annual Meeting of the Economic History Association
Vancouver, BC CANADA
September 21-23, 2012
EHA paper: 8-15-2012
Page | 2
Improvements in transportation have influenced the pace and direction of
American economic growth in a variety of ways. Lower costs of transport meant lower
prices to consumers and possibly higher net prices to the producers. The growth of urban
areas was facilitated by the ability to obtain goods more cheaply, especially farm
products and other inputs into manufacturing, and from more remote sources of supply.
The geographic dispersion of the population across the vast continent was hastened by
improvements in transportation that lowered the cost of relocation. Reduced costs of
transport helped as well to broaden markets internationally.
The 19th century transportation revolution on the North Atlantic resulted
fundamentally from the introduction of and ongoing efficiency improvements in coal-fuel
marine steam engines, allowing the deployment of ever-faster, safer, and above all
bigger, oceanic steamships providing less uncomfortable travel accommodations for
passengers and considerable scale economies to the shipping lines. These steamers
offered specialized transport, particularly of mail, in the 1840s, took over the carriage of
freight and passengers from sailing ships by the 1870s and ‘80s, and facilitated the
continued growth of transatlantic transportation, up to the hiatus of World War I, at rates
equal to or exceeding the significant general economic growth of the North Atlantic
Basin in those decades.
The nominal price of transportation between Europe and North America was an
important component of a process that also involved time savings, risk reduction,
improved communication, and growing transatlantic ties (in business, politics, and
society). Once regular safe ship schedules were assured by the mid-nineteenth century,
competition for trans-oceanic freight cargos was heavily shaped by a significant -though
EHA paper: 8-15-2012
Page | 3
unevenly timed- long term decline in the transport charges. In the emerging long-distance
tourist industry, however, in which crossing the Atlantic in relative luxury eventually
became part of the tour, some portion of the cost reductions arising from energy
efficiencies were applied to upgrading service rather than to reductions in fares. Thus
comparisons over time of changes in passenger fares and freight rates, offer insight on the
extent to which and manner by which this happened.1
“Thirty guineas, wines included,” was the standard price quote for cabin class passage
on 1820s and ‘30s North Atlantic sailing packets. The early steamships of the 1840s
matched, and eventually undercut, such fares, but mainly competed by offering faster
arrival on a more predictable schedule. In 1914, after being in the transatlantic passenger
steamship travel business for nearly three quarters of a century, the pioneering Cunard
line was charging first class passengers 31 and a half pounds (30 guineas), on average,
for travel from Liverpool to New York. The sailing packets, however, were quoting a sort
of standard minimum fare; Cunard’s minimum first class ticket in 1914 must have cost
something less than its 30 guineas average. Overlooking such distinctions is likely to
cloud long term trends and comparisons, but if done with care such comparisons can be
informative.2 In assessing the operation and implications of North Atlantic passenger
fare trends, it is of interest to consider both how the cross-oceanic travel services were
marketed by transport suppliers (the quoted fares) and how travelers responded (the
1 North (1958), Keeling “Transportation Revolution.”
2 Robert Albion used the phrase “thirty guineas, wines included,” as a chapter title in his
pioneering study. Cunard fares from Keeling “Abstracts,” for general history, see Hyde,

EHA paper: 8-15-2012
Page | 4
actual fares paid). In prior analyses we have made use of both types of price information,
and we go further with such data again here. 3
Travel across the North Atlantic is one of the most significant and long lasting
phenomena in world history, and also the most transparent and well-documented. This
sort of travel was not the ubiquitous mass routine that it has become since the 1980s; it
was something special minorities of people did for special purposes and special
occasions. For 99% of potential transatlantic travelers before the 1950s, there was no
feasible way to move between Europe and North America other than on a transatlantic
ship. By the mid 1800s, this occurred mostly through vessel fleets operated by organized
“lines,” by the late 1880s mostly consolidated into an oligopoly of large multinational
passenger steamship corporations, mostly based in Europe but with most of their voyages
to and from New York. Managing and keeping track of passengers was a vital part of this
long-lasting transnational mercantile business, and its huge associated in-port and land-
based infrastructure was a major economic, military and diplomatic concern of
government authorities. Essentially, every traveler’s travel details, including fees paid,
was recorded and reproduced multiple times by steamship lines, with paper copies of the
information going to booking agents, accountants, government authorities, cartel
administrators and the customers. By the late 19th
century, North Atlantic steamships
were among the biggest human-built spectacles of all times. Thousands of people would
3 Most research on the costs of transportation has focused on freight rates and the impact of
declining rates on the volume of freight shipped domestically and abroad. There has been much
less research on changes in passenger fares and their impact on travel. Fishlow and Barger (1951,
1966 and 1967) have presented railroad passenger rates for benchmark dates 1839 to 1910 and
annually from 1890 to 1946. See Haites, Make, and Walton, (1975) and Haites and Mak (1978)
for evidence on internal water transportation and railroads, North (1958 and 1960), Simon (1960)
and Harley (1988) re ocean shipping rates, and G. R, Taylor for general historical background
EHA paper: 8-15-2012
Page | 5
watch their arrivals and departures, newspapers often reported the names of all the elite
“cabin” passengers, while emigrants were generally inspected, managed and tracked by
government authorities at embarkation and debarkation, for health, safety, military,
economic, and demographic statistics-keeping reasons.
Nevertheless, despite the mountains of contemporary information on North
Atlantic steamship travel, generated gathered, and stored, historians have faced a chronic
shortage of surviving, consistent, linked, collated, organized, and analyzed data on
passenger movements and especially on passenger fares.4 Most of the organizations and
entities involved in producing the information have since vanished and their data with
them. What remains has been scattered widely, and largely served to interest and amuse
collectors, hobbyists, and museum curators seeking colorful flotsam for exhibits.
Some important “spade” work on North Atlantic fares has been done over the last
few decades. Migration historians and shipping catalogers such as Hvidt, Brattne and
Kludas have made compilations from pockets of surviving information from the mid to
late 19th
century. Harley and Keeling have tapped Cunard’s systematic and reliable
accounting archives, producing fare time series from 1883 on. Feys has combed through
late 19th
century agency files, while Grubb, Grabbe and Wokeck have found useful
fragments illuminating the economics of colonial era servitude migration. Keeling
computed quarterly westbound Rotterdam fares from 1903 on, and compiled a composite
westbound steerage price index for 1901-13 covering about half of all European to U.S.
4 As regards these limitations, see for instance, Aldcroft, p. 351, Gould, p. 611 and Wyman, pp.
22-36. Nothing like any consistent time series is reported in the Millennium edition of Historical
Statistics of the United States (Carter, et al, 2006); for sporadic observations and anecdotes, see
however Cohn, 1992, Hyde, 1975, Tyler, 1972, Dulles, 1964 and Levenstein, 1998 and 2004.

EHA paper: 8-15-2012
Page | 6
migration in those peak years of relocation. Still longer term time series are also now
coming out, notably the publication earlier this year of data from the analysis of 19th
and
20th
century tourism by Weiss, Dupont and Ghandi. John Killick has meanwhile prepared
for publication a series of over four decades of archival-based fares from the early 19th
century sailing era.5
The chief purpose of this paper is to present extensive evidence on passenger fares for
ocean travel in cabin class for nearly a century of time, from 1826 to 1916. Ocean
passenger fare data used here come mainly from two distinct sources - advertisements in
newspapers, magazines and travel guidebooks; and the archival records of the Cunard
line – and those two sources measure slightly different things. We first describe the
construction of each of these two series and discuss the merits and deficiencies of each as
well as the conceptual and empirical difficulties of constructing each one. We then
compare the behavior of passenger fares and freight rates and argue that the passenger
liners may have reduced fares as a result of efficiency improvements during some parts of
the period, though not after the late 1880s. We also offer some insights into the issues of
the shift from sail to steam power.
Advertised Ocean Passenger Fares
Average annual, or sub-annual fares, derived from company archives can provide
a comprehensive measure of the price passengers paid, but the underlying financial data
5 Keeling, “Transportation Revolution,” “Abstracts,” “Networks,” “Capacity,” Harley (1990).
Delta, Sicotte and Tomczak (2008) have collected unpublished fare data for the period 1899 to
1911. Dupont, Gandhi and Weiss (2012, Tables 3 and 4) have shown that overseas travelers were
sensitive to changes in fares for both sea and air travel, among other factors.
EHA paper: 8-15-2012
Page | 7
are typically fragmentary, if they even exist. In contrast, the New York Times, and other
period newspaper and magazines reported ship movements, printed schedules, and
contained shipping line advertisements of fares, often on a daily or nearly daily basis
across much of the period, thus making it more feasible to construct a consistent long
term series on passenger fares.
Perhaps the chief value of an advertised fare series is that it represents the price
signals which passengers were likely to have considered, even though it does not measure
how much was actually paid. Such series can cover a longer time period than the fares
that might be found for any single company, and reflect the industry as a whole,
providing a broader perspective from which to view the fares of individual lines. And, it
is somewhat easier to compile than by using heterogeneous data excavated from the
archives of multiple firms, although constructing a consistent long term series from
advertised fares is not as simple as it might seem.
A series of advertised fares does have its shortcomings. These reflect the nature of the
evidence revealed in advertisements and the incomplete coverage of the ads available, or
perhaps we should say found, in each year. Shipping lines did not advertise all the fares
available on each ship, did not advertise fares on all their ships, and not all lines
advertised fares in all years, especially late in the period, and the likely reasons for
advertised prices gradually diminishing in frequency suggest further limitations on their
usefulness, as will be seen later below. Using advertised fares is, however, a way to avoid
the distortions arising from average fare measurements which reflect the lumping
together of standard first class cabins with palatial suites of luxury staterooms, and a
range of price categories in between. If for instance, as seems to have been roughly

EHA paper: 8-15-2012
Page | 8
typical, the highest priced first class quarters were rented out for on the order of ten times
the low-end minimum priced cabins, one percent of passengers deciding to splurge and
switch from mimimum to top-end accommodations would raise the overall average first
class fare by ten percent. On almost every ship there was more than one fare and on some
there were many individual fares, and there were other sources of variation as well.
Most North Atlantic passenger shipping lines offered different classes of travel --
first and second (“intermediate”) class (or “cabin”), as well as steerage class, sometimes
known as emigrant class, ’t ‘’’tweendeck, or third class -- differences by vessel, time of
year, and on-board location.6 For example, on two ships of the American Line, the St.
Louis and St. Paul, there were 21 different categories of cabins and fares in first class.
The difference in fare depended on which deck (promenade, upper or main) the cabin
was located, whether it was an outside room or inside room, and whether it had a private
bath or not.7 American’s newspaper ads, however, showed only one fare. Not all ships
had such a wide range, but even when there were fewer fares the ads did not list them all.
Instead, they tended to list the lowest fare in the class or a range of fares. In the former
instance, we do not know how high above the minimum the fares ranged, while in both
cases we do not know the number of cabin spaces available at each fare. Of course, the
number of spaces did not likely change much from year to year, and from the ads it
appears the range did not vary much either. So, the ‘average fare’ that we calculate from
6 When emigrant traffic to the U.S. declined after the passage of the Quota Law of 1921,
shipping companies transformed the former steerage space into tourist third class to appeal to
lower middle income travelers. By the 1930s, some companies had converted their second class
space into third class accommodations. (Lorraine Coons and Alexander Varias, Tourist Third
Cabin, New York: Palgrave MacMillan, 2003, chap.2. 7 Flayhart III, 2000, The American Line, p. 208.

EHA paper: 8-15-2012
Page | 9
advertised quotations may serve a role comparable to ‘the interest rate.’ Just as
movements in ‘the interest rate’ –say the prime lending rate – are meant to suggest how
other rates are behaving, so do changes in the average fare – the lowest one in each class
or the midpoint of the range - serve to indicate how other fares in that class on that ship
are moving.8
Fares also varied according to the size, vintage and quality of ships within each
shipping line. The fares described above for the St. Louis and St. Paul differed from
those on other ships in the American Line, being slightly higher than on the New York
and Paris, which were 5 years older, and considerably higher than on the Berlin and
Chester, which were considered secondary steamers.9 Fares also differed across
shipping companies for ships of the same size and vintage. Because not all shipping lines
advertised every year, composition of the sample of fares changes over time and from
year-to-year and could affect the comparability of the average fare, a point we discuss
further below.
Fares differed for other reasons as well. They differed by season and even by day
of the week.10 The adult fare differed from that of a child. Travel originated from a
number of different ports of embarkation and terminated in different port cities overseas.
Moreover, advertisements may not have always captured changes in fares within a
calendar year, or reflected discounts offered during the year, especially as the time to
8 As will be seen below, this relationship may not have held as regards the behavior of fares in
other classes, especially the steerage class. 9 Flayhart III, 2000, The American Line, p. 208-10.
10 Although the latter may reflect a difference in the ships that sailed on particular days.
EHA paper: 8-15-2012
Page | 10
departure drew nigh.11 Companies would not have advertised a change in fares if that
went against an agreement set by a cartel; those who cheated would not likely advertise
that fact. But even without such cartel behavior, firms may not have advertised every
change in fare. Indeed, a number of them appear to have placed ads for a yearly schedule
and did not bother to change them even when they might actually have altered their
fares.12
Conceptual and measurement issues combined with the time-consuming effort of
retrieving fares for each year make the endeavor of constructing a price series rather
complex, and any such series has to be taken with some margin for error. Nevertheless,
we have compiled several times series on fares for most of the 19th
century up until the
US entry into World War I, and collected sporadic observations on fares for some years
after World War I. Among advertised fares we have found the most information about
first class fares and constructed a series running continuously from 1826 to 1916.13
Our advertised fare series has been compiled from newspapers and magazines,
especially from the New York Times and The Albion. Because New York was by far the
single most important port of arrival for passengers traveling to and from Europe, our
11
Ads would not likely have captured the 25 percent reduction given to those crossing on The
American Line’s ship New York in May 1990. That discount was offered to compensate for the
slower speed of the ship as it would made its way back to Liverpool for repairs after having lost
one of its propellers on the trip westward. Flayhart III, 2000, The American Line, p. 306. 12
A rare exception was when Cunard on June 3, 1854, advertised schedules and fares for
upcoming weekly departures adding that “In consequence of the increased cost of coal, stores and
provisions, the price of Passage will increase.” The Albion, June 3, 1854. 13
As discussed below, we have a continuous series for steerage fares from Liverpool to New
York for the period 1885 to 1914 derived from Cunard’s records.

EHA paper: 8-15-2012
Page | 11
series is based on fares from just this one port in the U.S.14 We used ports in the United
Kingdom (primarily Liverpool and Glasgow, but also Belfast, Dublin, Southampton and a
few others) as the destination ports because a very high percentage of travelers went to
Europe in the period before World War I, and a large fraction of them made Great Britain
their first stop.15 And, our data pertain to one-way fares from New York to Europe. The
ads occasionally indicated some difference between the one-way fare to Europe and the
one-way fare in the westward direction.16 Such differences were found more often for
steerage fares; first- and second-class fares for the westward passage were more often the
same or slightly less.17
Liverpool and Glasgow were the most commonly observed destinations listed in
advertisements. In many cases, the advertisements for travel to Liverpool or Glasgow
also listed another destination or two, such as Cork, Londonderry and Queenstown.
Because these other ports appear to have been substitutes for Liverpool or Glasgow, it
seemed appropriate to include fares advertised for these other places. Moreover, the
14
Although tourists embarked and disembarked at a number of different ports, New York
dominated in terms of numbers of passengers. Statistical Abstract of the United States, 1890,
Table 153, pp. 210-15; 1886-1909, Statistical Abstract, 1909, Table 50; 1909-1919, Statistical
Abstract, 1920, Table 71, p Keeling “The Transportation Revolution,” p. 40. New York
dominated as well in numbers of observations on fares. 15
For much of the nineteenth century the share of American travelers going to Europe ran
between 75 and 90 percent. It declined somewhat after the Civil War, but still remained above
two-thirds up through World War I, and even up through the Great Depression. See Dupont,
Gandhi and Weiss ‘The American invasion of Europe: the long term rise in overseas travel by
Americans, 1820 to 2000’, NBER Working Paper, No. 13977, (2008). Over the period 1900-14,
93% of first class passengers between the U.S. and Europe used the port of New York, and 42%
of them traveled to and from ports in the British Isles (Keeling, Voyage Database, cited in
“Capacity,” pp. 226, 248). 16
We found only a few roundtrip fares which were slightly less expensive than the sum of the
two one-way fares. 17
In most instances where the steerage fare was reported for both directions of travel, the fare
was higher on the trip to the U.S., sometimes noticeably so, reflecting the high demand for
emigrant passage to the U.S.
EHA paper: 8-15-2012
Page | 12
advertisements did not usually specify any difference in fare to alternative ports when
multiple ports in the UK were listed.18
Fares included in our series come from a number of different shipping lines. In
each year, we collected several fares from advertisements for several lines, attempting to
record summer fares. Many ads displayed more than one fare or a range of fares for a
particular class of service which reflected the different locations of the cabin as described
above as well as differences in other amenities within that class. When there was more
than one fare advertised we took the average of those shown for that class and shipping
line on that date; where a range was a shown we took the midpoint. 19 We averaged the
fares from each line for each year in each class of service and then calculated the average
for all lines in each year and class.20 Clearly, this is a crude series of passenger fares, but
the methodology is based on historical precedent, being the same method used by Isserlis
to construct his classic series on freight rates. 21
As can be seen in Figure 1, the advertised fares fluctuated quite a bit from year to
year while the average declined through the end of the 1880s, leveled off for a bit, then
swung upward beginning early in the 20th
century. Nominal fares at the end of the period
were below those that prevailed on early passenger steamships before the Civil War, but
not much different than those in the 1870s by which time the cost, speed and safety
18
Fares to all these other UK ports appear to have moved in tandem with those for Liverpool.
Some advertised travel to London for little or no difference than the fare to Liverpool, although
the trip required a rail journey to London. 19
In a few years a minimum fare was advertised instead of specific fares or a range of fares. In
those years for which we had no other data we used the minimum fare and made no attempt to
estimate how large a range existed above that minimum. 20
One might also argue that the fares for a subset of routes to Europe (i.e. NY to the UK) are not
ideal proxies for all routes, but we think the differences in these cases are less troublesome 21
See Mitchell, British Historical Statistics.
EHA paper: 8-15-2012
Page | 13
advantage of second generation steam ships, with screw propellers and metal hulls, had
enabled them to capture, from sailing ships, all segments of the North Atlantic passenger
traffic.22
We think that most of the variation in fares reflects the ups and downs of the
economy, as well as the reality of entry and exit into the industry. For example, the
Anchor Line began operation in 1856 and left the passenger business in 1956, whereas
the American Line began in 1871 and ceased operations in 1925. But, it also reflects the
fact that we were unable to find ads for a consistent subset of firms in all years, even
when they were still in business. This would not matter much if the fares for all firms
were roughly the same, but they were not.
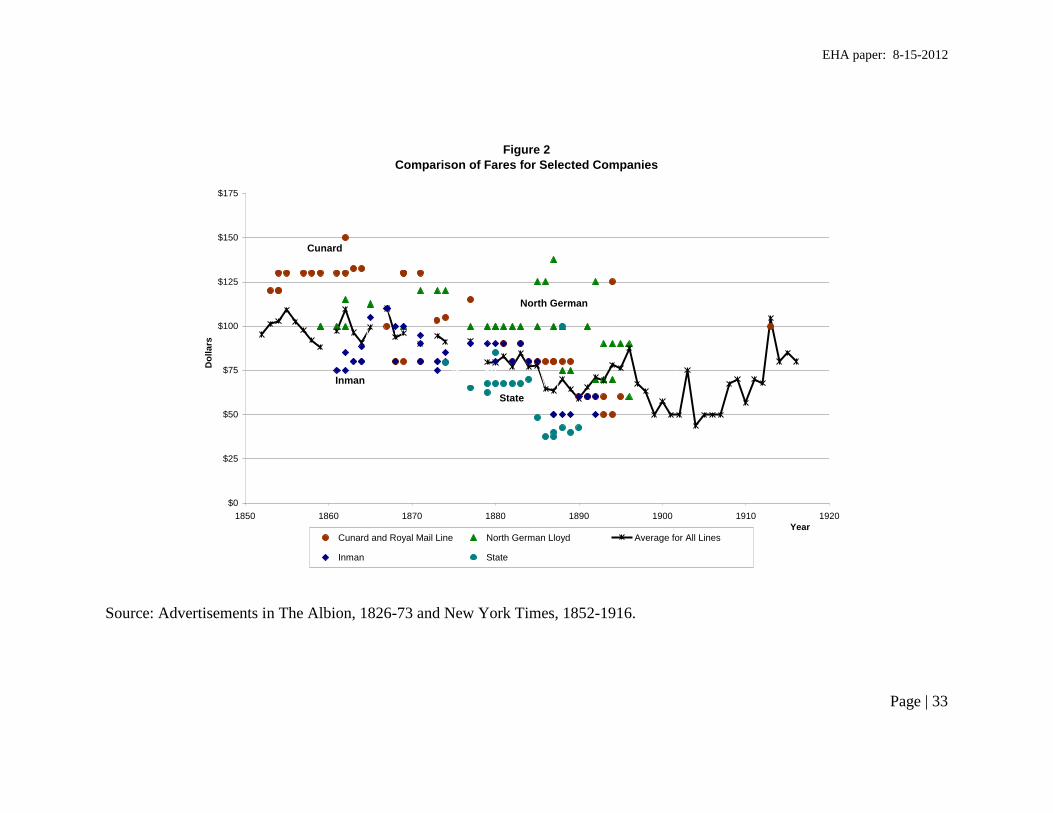
The advertised fares for four firms shown in Figure 2 exemplify this matter. Two
appear to be consistently higher-priced lines, and two lower-priced. Cunard and North
German Lloyd, two of the Big Four carriers, were more likely to advertise fares above the
average for all lines, while Inman and State posted fares that were typically below the
average.23 The upshot is that only some of the variation in fares over time was due to
the decisions of the carriers to change fares, and the economic conditions lying behind
those decisions; some variation reflects the changing composition of the sample. Our
impression is that the latter is not a serious problem up through 1895 because of the
number of companies and ships included in our samples. The sample size ranges from 4
22
Keeling, “Transportation Revolution,” pp. 41-42, Cohn (2009). 23
A similar figure could be shown with a different set of companies; although the differences
would not be as evident as with this set, which was chosen to make the point clearly. The “Big
Four” lines, Cunard, White Star, North Germany Lloyd and Hamburg American, handled well
over half of the first cabin traffic to and from New York between the Civil War and World War I
(Keeling, “Capacity,” pp. 277-78).
EHA paper: 8-15-2012
Page | 14
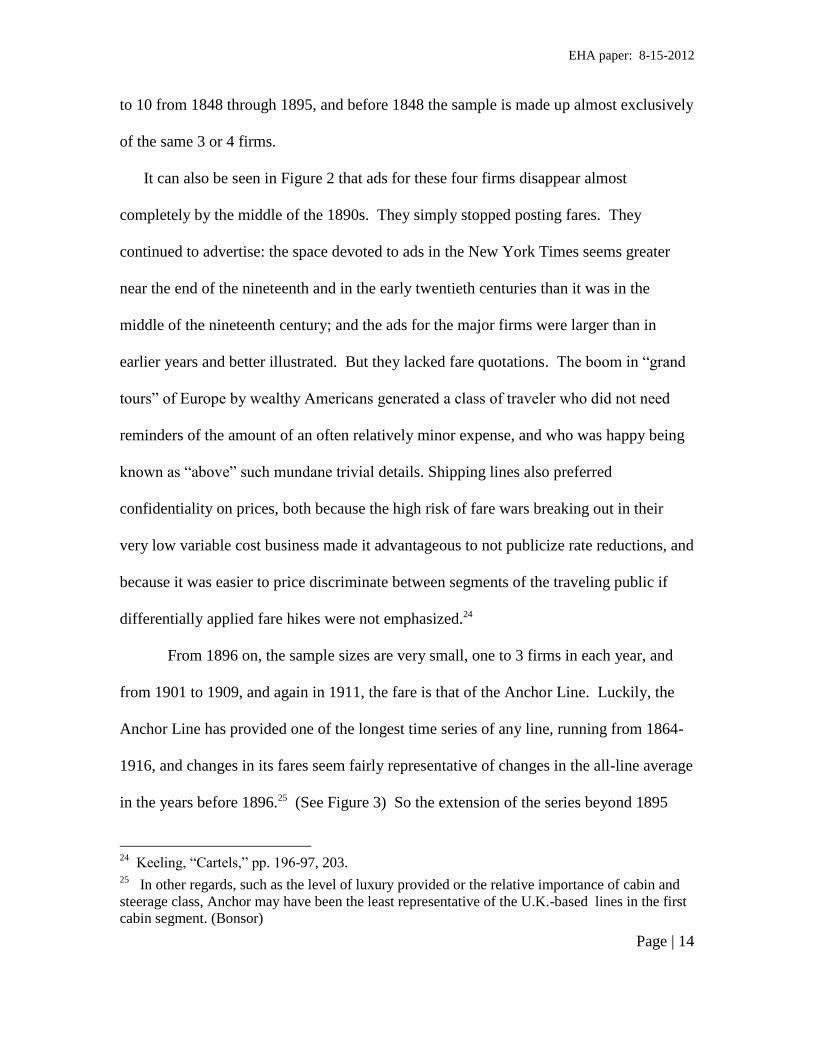
to 10 from 1848 through 1895, and before 1848 the sample is made up almost exclusively
of the same 3 or 4 firms.
It can also be seen in Figure 2 that ads for these four firms disappear almost
completely by the middle of the 1890s. They simply stopped posting fares. They
continued to advertise: the space devoted to ads in the New York Times seems greater
near the end of the nineteenth and in the early twentieth centuries than it was in the
middle of the nineteenth century; and the ads for the major firms were larger than in
earlier years and better illustrated. But they lacked fare quotations. The boom in “grand
tours” of Europe by wealthy Americans generated a class of traveler who did not need
reminders of the amount of an often relatively minor expense, and who was happy being
known as “above” such mundane trivial details. Shipping lines also preferred
confidentiality on prices, both because the high risk of fare wars breaking out in their
very low variable cost business made it advantageous to not publicize rate reductions, and
because it was easier to price discriminate between segments of the traveling public if
differentially applied fare hikes were not emphasized.24
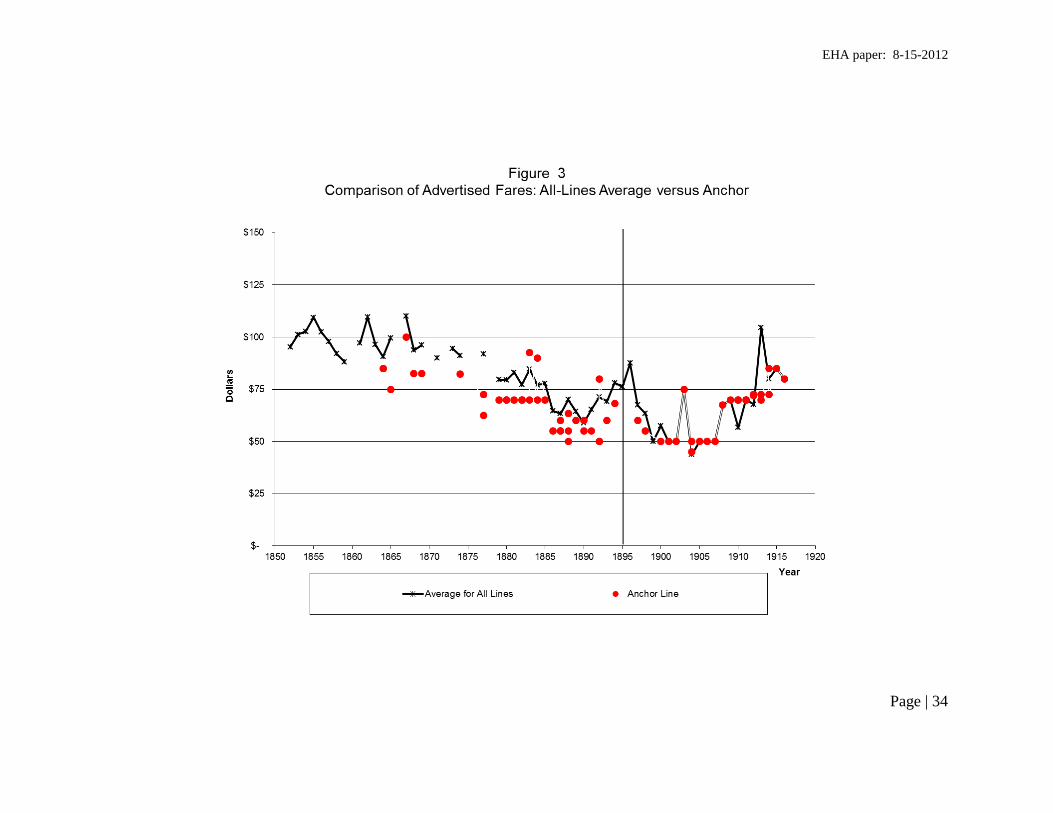
From 1896 on, the sample sizes are very small, one to 3 firms in each year, and
from 1901 to 1909, and again in 1911, the fare is that of the Anchor Line. Luckily, the
Anchor Line has provided one of the longest time series of any line, running from 1864-
1916, and changes in its fares seem fairly representative of changes in the all-line average
in the years before 1896.25 (See Figure 3) So the extension of the series beyond 1895
24
Keeling, “Cartels,” pp. 196-97, 203. 25
In other regards, such as the level of luxury provided or the relative importance of cabin and
steerage class, Anchor may have been the least representative of the U.K.-based lines in the first
cabin segment. (Bonsor)
EHA paper: 8-15-2012
Page | 15
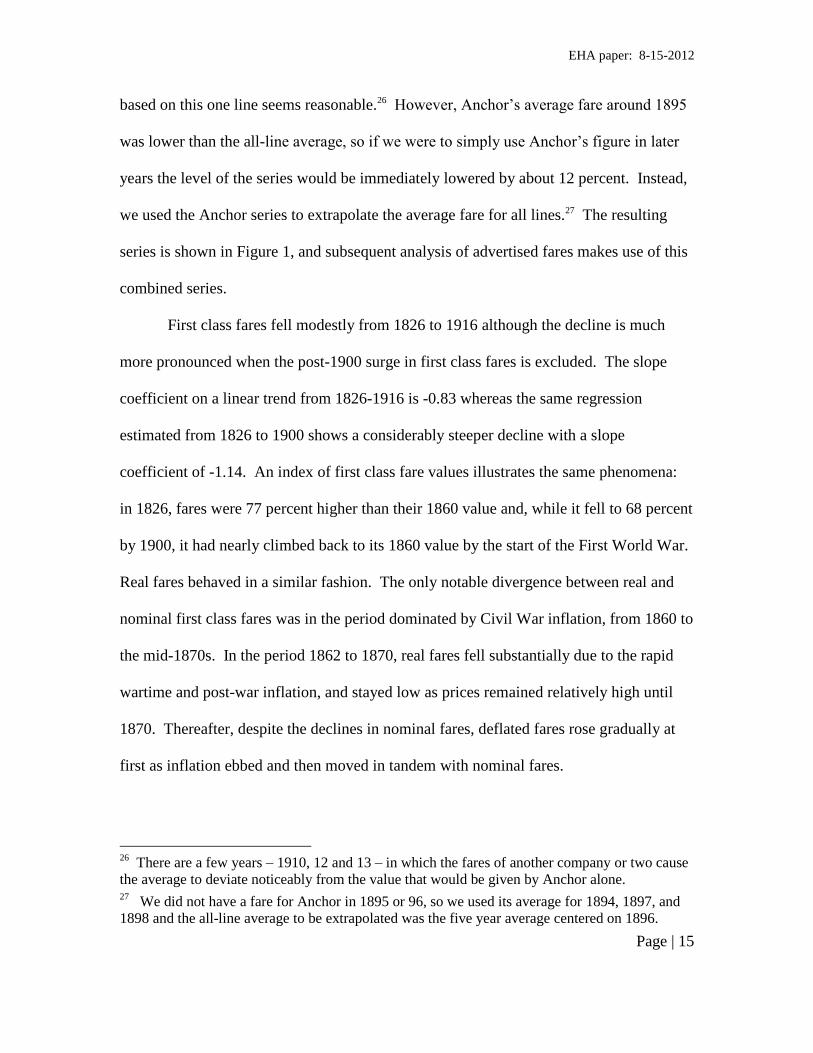
based on this one line seems reasonable.26 However, Anchor’s average fare around 1895
was lower than the all-line average, so if we were to simply use Anchor’s figure in later
years the level of the series would be immediately lowered by about 12 percent. Instead,
we used the Anchor series to extrapolate the average fare for all lines.27 The resulting
series is shown in Figure 1, and subsequent analysis of advertised fares makes use of this
combined series.
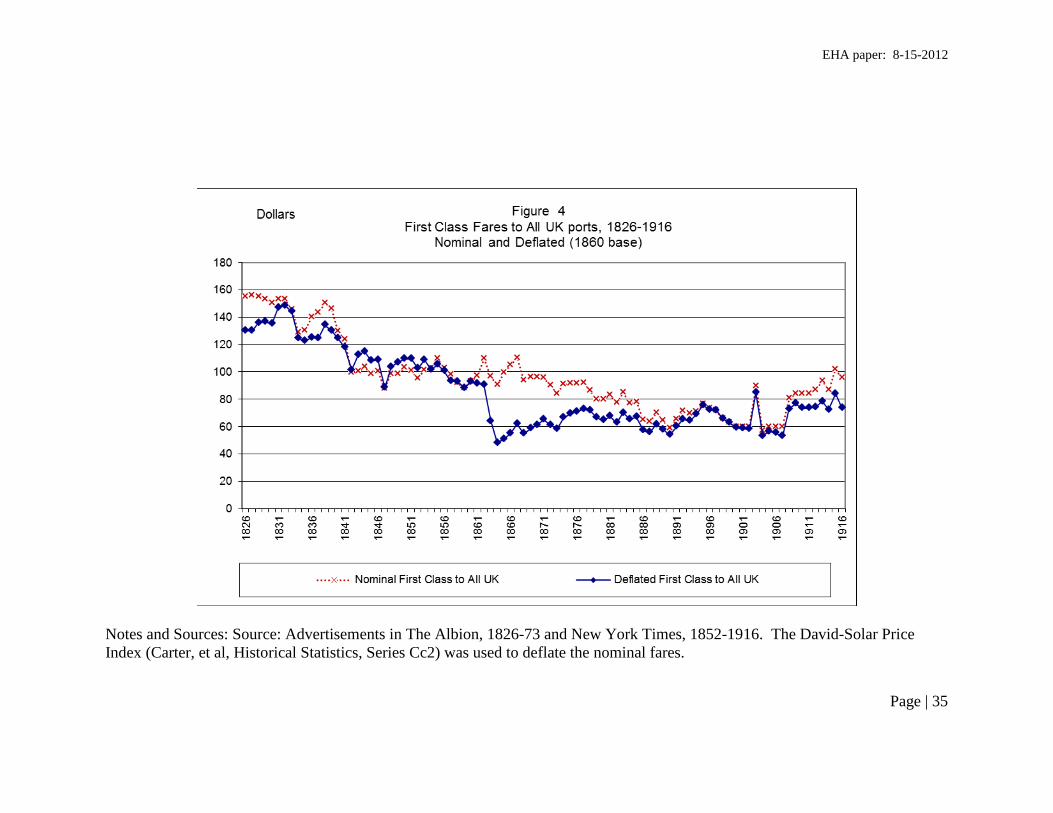
First class fares fell modestly from 1826 to 1916 although the decline is much
more pronounced when the post-1900 surge in first class fares is excluded. The slope
coefficient on a linear trend from 1826-1916 is -0.83 whereas the same regression
estimated from 1826 to 1900 shows a considerably steeper decline with a slope
coefficient of -1.14. An index of first class fare values illustrates the same phenomena:
in 1826, fares were 77 percent higher than their 1860 value and, while it fell to 68 percent
by 1900, it had nearly climbed back to its 1860 value by the start of the First World War.
Real fares behaved in a similar fashion. The only notable divergence between real and
nominal first class fares was in the period dominated by Civil War inflation, from 1860 to
the mid-1870s. In the period 1862 to 1870, real fares fell substantially due to the rapid
wartime and post-war inflation, and stayed low as prices remained relatively high until
1870. Thereafter, despite the declines in nominal fares, deflated fares rose gradually at
first as inflation ebbed and then moved in tandem with nominal fares.
26
There are a few years – 1910, 12 and 13 – in which the fares of another company or two cause
the average to deviate noticeably from the value that would be given by Anchor alone. 27
We did not have a fare for Anchor in 1895 or 96, so we used its average for 1894, 1897, and
1898 and the all-line average to be extrapolated was the five year average centered on 1896.

EHA paper: 8-15-2012
Page | 16
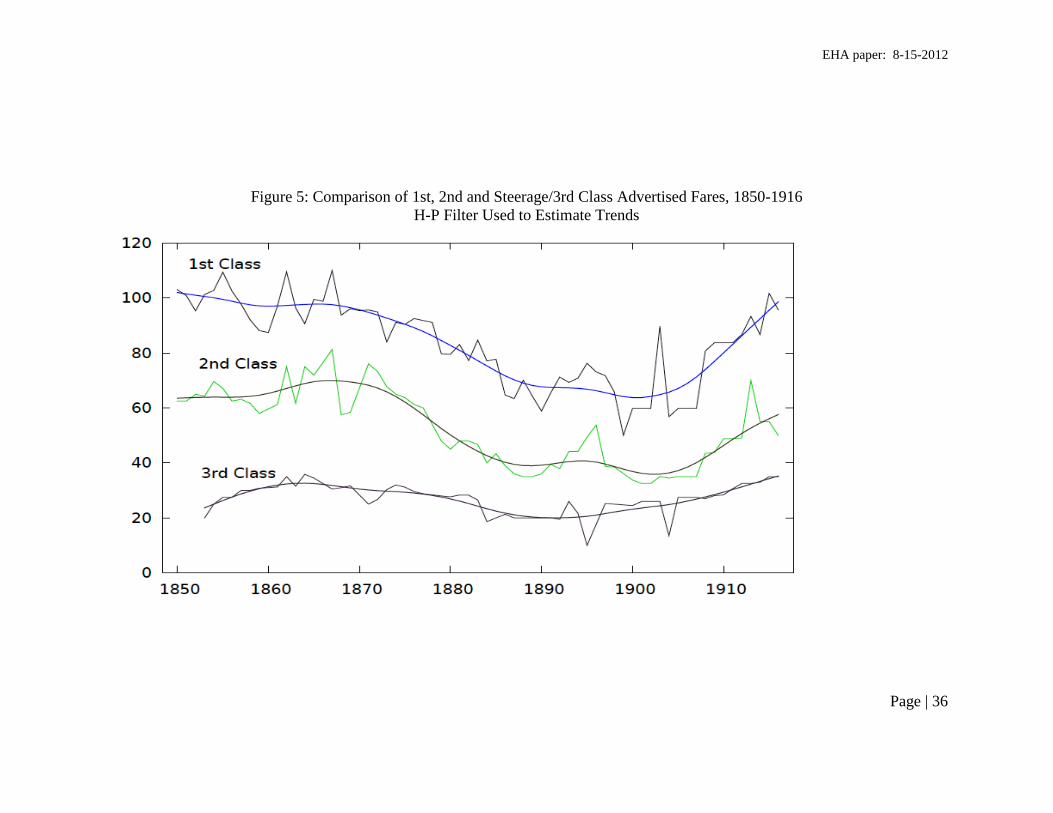
In Figure 5 we have compared the first class series with the evidence for other
classes of travel using a Hodrick-Prescott (HP) filter which more clearly delineates the
trend from the cyclical components and thus provides a better sense of long-term
movements. First and second class fares trended lower throughout the 19th century and
steerage fares show a gradual decline from about 1860 to 1890. That trend reverses
around 1900 for first and second class fares, after which they move steadily higher until
the end of our series in 1916. Trends in steerage fares are less pronounced and are not as
highly correlated with first and second class fares, yet they do exhibit a similar pattern.28
Like 1st and 2nd class fares, steerage fares also moved higher toward the end of our
series, but the trend values began to increase roughly a decade before either the 1st or 2nd
class fares. This upward movement, which was punctuated by two large declines in 1895
and in 1904, was also quite gradual in comparison to the increases in 1st and 2nd class
fares.
Evidence on fares from Cunard and Holland America archival data
A second measure of fares is average revenue per passenger which is calculated
from data available in company archives. This archival- based or revenue-based fare
measures what passengers actually paid and thus does not suffer the same shortcomings
of the advertised fares. That is to say, the average revenue-based fare takes into account
the quality of the cabin passage actually purchased, as well as differences in fares that
28
Steerage fares are not shown in the figures other than Figure 5. Time series data covering
about half of steerage passengers from Europe to the U.S. is shown in Keeling, “Capacity,” pp.
217-74 and elsewhere, but –despite some overlaps- the mechanics of steerage fare determination
and the economics of steerage travel differed considerably from that of first class (Keeling,
“Cartels,” pp. 197, 203).

EHA paper: 8-15-2012
Page | 17
might have arisen from differences in the size or vintage of the ship, the season in which
travel occurred, and so on. The chief shortcoming of revenue-based fares is that they are
hard to come by, requiring long hours of research in company records, and even that can
be done only for those few firms whose records have been preserved.29 We can,
however, make comparisons with revenue-based fares of Cunard for the period 1883-
1914, and Holland America for the period 1900-14.30
The comparison shown in Figure 6 shows what we would expect, the Cunard
series is consistently higher than the advertised fares. Because the quality and prices of
accommodations on every ship ranged well above those for standard first class cabins, the
average revenue-based fares will invariably be higher than advertised fares. The
differences, however, were not uniformly the same, and would not necessarily be so even
if the fares for different quality accommodations remained the same because passengers
may have rented more luxury suites one year and less in another.31 The differences did
not simply vary, however, they widened over time. The two series are close for the first
few years of the period, but from 1886 to 1896 the advertised fares run fairly consistently
between 70 and 80 percent of Cunard’s fares, while from 1897 on the advertised fares
were only 50 to 60 percent of Cunard’s (somewhat higher if the Lusitania and Mauritania
are excluded from the calculation). The differences in average fares from these two
29
Because the ships were not always filled to capacity the average revenue per passenger could
vary depending on the composition of cabins that were filled, so increases or decreases in the
average might not always reflect increases or decreases in cabin-specific fares. 30
Cunard Voyage Abstracts, Liverpool, Holland American Passagegelden, Rotterdam. Research
by John Killick on the Cope Line of sailing packets will allow comparisons with revenue-based
fares for the years 1815 to 1870. See also Killick (2000). 31
Even if the fares for each cabin remained the same from one year to the next, the average
revenue-based fare would remain unchanged only if the ships were fully occupied with the same
adult-child and sex composition of passengers.
EHA paper: 8-15-2012
Page | 18
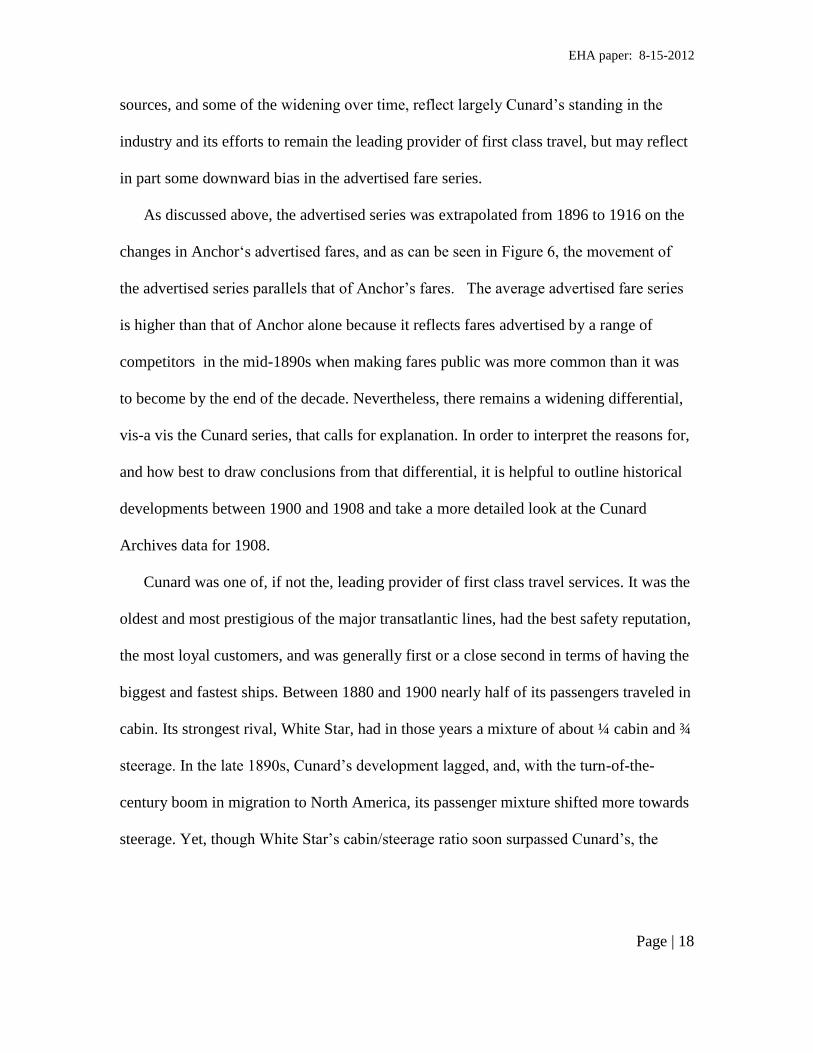
sources, and some of the widening over time, reflect largely Cunard’s standing in the
industry and its efforts to remain the leading provider of first class travel, but may reflect
in part some downward bias in the advertised fare series.
As discussed above, the advertised series was extrapolated from 1896 to 1916 on the
changes in Anchor‘s advertised fares, and as can be seen in Figure 6, the movement of
the advertised series parallels that of Anchor’s fares. The average advertised fare series
is higher than that of Anchor alone because it reflects fares advertised by a range of
competitors in the mid-1890s when making fares public was more common than it was
to become by the end of the decade. Nevertheless, there remains a widening differential,
vis-a vis the Cunard series, that calls for explanation. In order to interpret the reasons for,
and how best to draw conclusions from that differential, it is helpful to outline historical
developments between 1900 and 1908 and take a more detailed look at the Cunard
Archives data for 1908.
Cunard was one of, if not the, leading provider of first class travel services. It was the
oldest and most prestigious of the major transatlantic lines, had the best safety reputation,
the most loyal customers, and was generally first or a close second in terms of having the
biggest and fastest ships. Between 1880 and 1900 nearly half of its passengers traveled in
cabin. Its strongest rival, White Star, had in those years a mixture of about ¼ cabin and ¾
steerage. In the late 1890s, Cunard’s development lagged, and, with the turn-of-the-
century boom in migration to North America, its passenger mixture shifted more towards
steerage. Yet, though White Star’s cabin/steerage ratio soon surpassed Cunard’s, the
EHA paper: 8-15-2012
Page | 19
latter still had a mix that was considerably more cabin than the overall US-Europe
passenger trade. In terms of revenue, it was still nearly 50/50.32
Anchor, on the other hand, was not one of the elite lines for cabin passengers. It
never had more than the industry average portion of cabin passengers. It did a respectable
business in the migrant-dominated second class, but in first class it had the most modest
presence of the major UK lines. Its top ship during 1911-14 was smaller than Cunard’s
“crack vessels” of the 1890s, and slower than Cunard’s 1880s generation. It was the
leading transatlantic carrier based out of Scotland, but was at the low end of the overall
UK market. Perhaps the reason it advertised fares, and others did not, was its lack of any
other basis for competing with the considerably larger competitors in Liverpool and
Southampton.
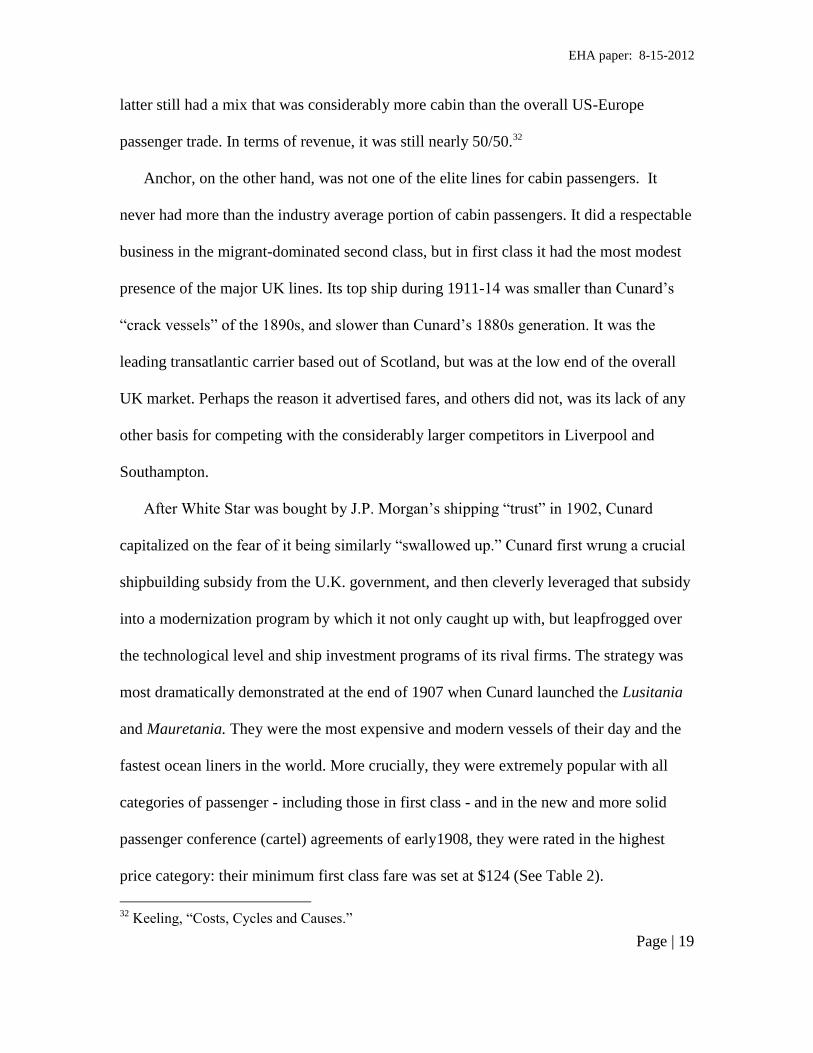
After White Star was bought by J.P. Morgan’s shipping “trust” in 1902, Cunard
capitalized on the fear of it being similarly “swallowed up.” Cunard first wrung a crucial
shipbuilding subsidy from the U.K. government, and then cleverly leveraged that subsidy
into a modernization program by which it not only caught up with, but leapfrogged over
the technological level and ship investment programs of its rival firms. The strategy was
most dramatically demonstrated at the end of 1907 when Cunard launched the Lusitania
and Mauretania. They were the most expensive and modern vessels of their day and the
fastest ocean liners in the world. More crucially, they were extremely popular with all
categories of passenger - including those in first class - and in the new and more solid
passenger conference (cartel) agreements of early1908, they were rated in the highest
price category: their minimum first class fare was set at $124 (See Table 2).
32
Keeling, “Costs, Cycles and Causes.”
EHA paper: 8-15-2012
Page | 20
The new conference deals of 1908 helped instigate, and more crucially enforce, a
general rise in fares including at the low end where Anchor advertised. The effect is
noticeable in the advertised series, and it appears, surprisingly so perhaps, that the
movement of the advertised prices reflects even the effect of the surge of cabin passenger
traffic enjoyed by Cunard, nearly all of it booked on ships with the highest mandated
minimum price on the North Atlantic.33
Cunard was the smallest of the Big Four lines, and in proportion to its size had the
fewest number of ships. Its modernization program was not fully complete until 1914
when the third sister ship, Aquitania, joined Mauretania and Lusitania. In the interim,
White Star and HAPAG built newer ships and drew off some of Cunard’s traffic.
Ironically the biggest gainer in percentage terms between 1908 and 1913 was Anchor, but
its annual increase in first class passenger flow was still less than what Mauretania and
Lusitania took in an average month, and in 1912 Cunard bought ownership of Anchor
anyway.34 The surge in bookings on the newer, more luxurious – and higher priced -
Mauretania and Lusitania reveals itself in the jump in Cunard’s average revenue per
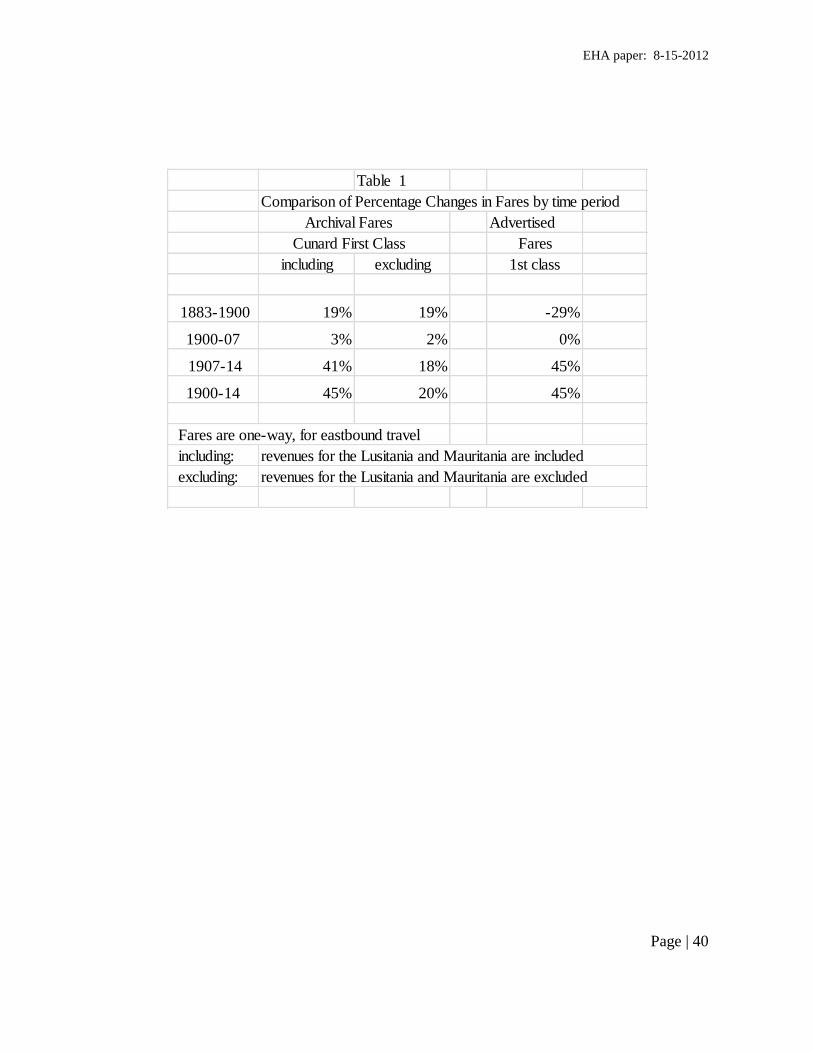
passenger. Between 1907 and 1914, the average fare on all of Cunard’s vessels rose by
41 percent, but when confined to vessels other than the Mauretania and Lusitania the
average rose by only 18 percent (see Table 1). Over this same time period, the average
advertised fare rose by 45 percent. In other words, advertised fares track rather well the
behavior of Cunard’s fares, even when Cunard was making large increases in capacity of
the most luxurious and highest priced cabins. And, the advertised series behaves very
33
Murken, pp 325-60, 671, 34
Bonsor, Keeling, Transportation Revolution.
EHA paper: 8-15-2012
Page | 21
similarly to that for Cunard for the previous 8 years. From 1900 to 1907, Cunard’s fares
rose on average by 3 percent while the advertised fare series rose 2 percent.
The two series diverge, however, in the period 1883 to 1900, and the divergence
reflects largely the relative movements in two instances. The 1886 advertised fare was
17 percent below its value in the preceding year and it remained at that lower level for
several years, whereas Cunard’s average fare did not change in 1886 and declined only
somewhat later. Some of the 17 percent decline reflects the inclusion in the 1886 sample
of two lines (Atlantic Express National) with below average fares that were not in the
1885 sample, and the exclusion of two average-fare lines (Hamburg American and
Inman) that were part of the 1885 sample. Those changes account for about half the
decline in the average; the other half reflects decreases in fares for the firms that were
included in both samples.35 The other noticeable change in the differential occurred ten
years later. The advertised fare hardly changed from 1896 to 1897, but Cunard’s
revenue-based fare jumped by 17 percent. The difference here is a consequence of the
general across-the-board price rise, negotiated by the conferences in 1896 (following the
end of a major fare war during 1893-95) and largely put into effect in 1897. The rise
shows up in the Cunard series, but is not picked up by the ad series.36 Overall, though,
except for these two discrepancies, the advertised series does a rather good job of
tracking the movement of Cunard’s revenue-based fares. The differential seems large –
ranging from 25 to 75 percent - but this likely reflects the position of Cunard in the
35
The advertised fares were reduced by the Anchor (-21%), Guion (-38%) and State (-22 %)
lines. Cunard was part of the sample of advertised fares, listing three first class fares - $60, $80
and $100 – in both years (and through 1889). Our method of calculation used the midpoint,
which was 10 percent below Cunard’s revenue-based average for that year. 36
We have not located any advertised fares for Cunard from 1896 through 1912.

EHA paper: 8-15-2012
Page | 22
hierarchy of transatlantic passenger liners. We would expect the differentials to be much
smaller when compared to other shipping lines, and two pieces of evidence corroborate
this.
Figure 6 presents the revenue-derived average first class fares for the Holland
America, a middle-level line, adjusted downwards by 10% here to reflect the longer
distance from New York to Rotterdam compared to Liverpool. The Holland America and
the advertised series track each other closely.37
Additional evidence, albeit only for the year 1908, is shown in Table 2. In the fixing
of minimum first cabin rates by the 1908 Atlantic Conference, vessels were rated in
different classes, largely based on speed and age. Cunard and Anchor were again
opposites; Cunard had the highest agreed-to minimum fares (CVM=conference vessel
minimum), Anchor the lowest.
The table again shows Cunard’s position at the high priced end of the business. Its
average fare ($127) for this year was 57 percent above the advertised series fare of $81.
Even if Cunard’s average fares are calculated leaving out all voyages by the Lusitania
and Mauretania, the resulting average of $109 is still considerably higher (35 percent)
than the advertised fare of $81, which in turn, however, lies closer to and in between the
revenue-based Holland America fare of $88 and a revenue-based Anchor fare (available
for that year) of $73.38
37
The Holland-America series is for westward travel to New York, not eastward travel from it,
but indications are that the difference was slight (Murken), and that eastward fares, if anything,
were very slightly lower. One minor reason for this was the head tax assessed by U.S. authorities
on arriving (but not departing) foreigners (see Keeling, “Capacity” and Keeling “Abstracts.”). 38
Anchor’s advertised fare that year was $68.

EHA paper: 8-15-2012
Page | 23
Although this evidence pertains to only one year, which was chosen because of the
quantity of data available then, it is probably not unrepresentative of most other years.
There was a serious recession that year, but recovery began already in the fall. The
conference agreement in February helped restore fares that were rather reduced in
January (the below conference minimum fares shown in the table are both from January
voyages). And, a roughly similar picture can be obtained based on conference data for
1913.39
First cabin fares on the pre World War I North Atlantic varied seasonally to a modest
extent, (though more than in steerage), and cyclically as well (less so than in steerage).40
But, more importantly, they also varied by route, line, and, unlike steerage, by vessel and
on-board location on the vessel. The revenue-based fare better captures the net effect of
these various influences, though such data sets are rarer. And they are only representative
of industry-wide trends to the extent that a diverse and representative sample of firms and
vessels were included in the calculations. Gathering such a large amount of data will take
a long time. Thus it is useful to see that while the level of the advertised fare series differs
from a revenue-based series – something that would be true even if the latter were
representative of the entire industry – it seems to be a reasonable indicator of the long
term trend in fares (and, to a lesser extent, of fluctuations in them), and thus provides for
a consistent long term series on changes in this key variable that will be useful in
reexamining a number of issues in the history of transportation.
39
Keeling, “Networks,” pp. 164-65. 40
Keeling, Abstracts, pp. 24-28.
EHA paper: 8-15-2012
Page | 24
Implications For Historical Issues
A widely held view in the history of the maritime trade is that before World War
II, when ocean transportation was the chief means of travel abroad, the ocean liners
benefited from the same, or similar, technological improvements that occurred in cargo
ships, but such technical advances were not necessarily reflected in passenger fares.41
According to what was seen as the definitive study of ocean steamship management at
the time of its publication, “While the economies resulting from increased size of vessels
and efficiency of marine engineering were accompanied by lower freight rates, similar
economies in passenger steamers were largely offset by the additional costs occasioned
by increased speed, comfort, luxury and betterments of passenger service.”42 According
to that same study, passenger fares simply did not change that much: “Ocean fares have
fluctuated less, and have, on the whole, been maintained at a higher level than freights.”43
The argument for these assertions was that passenger travel was apparently less subject to
competition than was freight traffic, in part because fares were subject to passenger
agreements established by the shipping lines, with at least 12 such agreements governing
traffic in the North Atlantic.44 And, perhaps of greater significance, there was no
competition from tramp vessels which might have weakened the cartel arrangements.
Our evidence, however, indicates a more complex picture, at least for the period 1826 to
1910. A comparison of first and second class fares with freight rates indicates that they
41
Johnson and Huebner, Gould. 42
Johnson and Huebner, Principles of Ocean Transportation, p. 337 43
Ibid, pp. 335-37 44
Ibid. Chap. XIX and pp. 335-37. Keeling,” Transportation Revolution,” pp. 41-43, Deltas,
Serfes and Tomczak (1999) and Deltas, Sicotte and Tomczak (2008) have argued otherwise for
the late 19th and early 20
th centuries.
EHA paper: 8-15-2012
Page | 25
moved in surprisingly similar fashion for at least some of the period, a pattern at odds
with the traditional view that passenger fares had not fallen along with freight rates. Is the
traditional story in some fundamental respect in error, and if so why, and what correction
to it might be in order? We can approach these sorts of questions more directly than ever
before by using, and further improving, the comprehensive series of passenger fares that
have been prepared, extended, refined and analyzed here.
We might, for instance, speculate that Johnson and Huebner may have been
influenced by the record for the decade or two just before publication of their work in
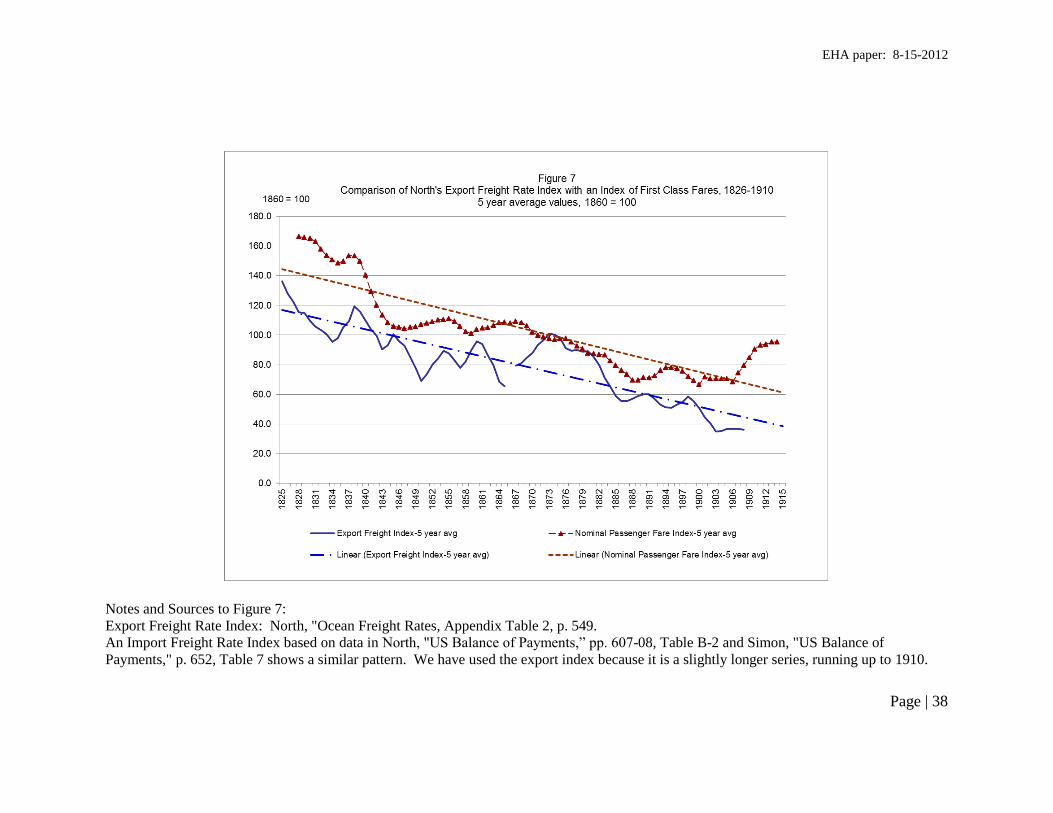
1920 which would have been more readily available to them. As can be seen in Figure 7
freight rates continued to decline after 1900 while passenger fares remained steady for a
time and then turned upwards.
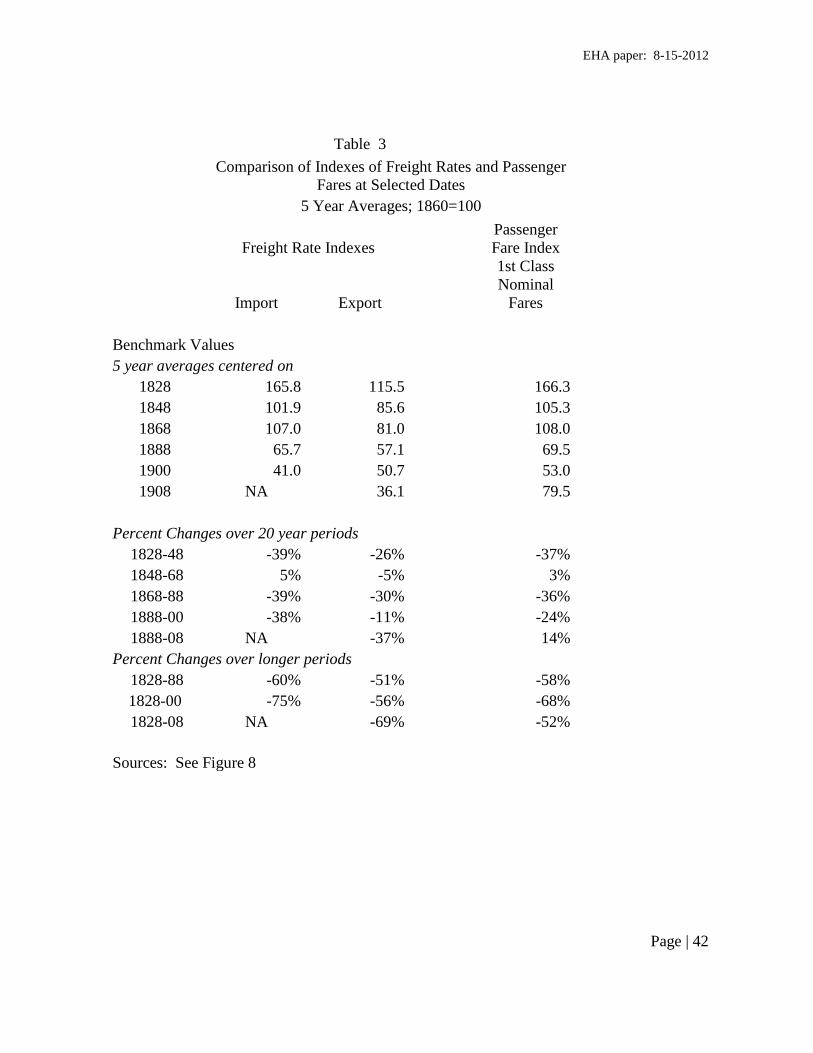
Nevertheless, although they did not decrease as much, first class passenger fares
moved in tandem with freight rates for quite some time (see Figure 7). Trends from a
time series decomposition of both the freight rate index and indices of first class fares
(1860=100) move in the same direction over much of the 19th century, particularly
during the 1870 and ’80s. Around 1900, however, trends in passenger fares and freight
rates began to diverge. From about 1900 to 1916, passenger fares trended higher while
freight rates continued their long-term decline. Overall, this suggests that technological
improvements and greater efficiencies in shipping were being reflected in passenger
fares, but not to the same extent as for freight rates (see Table 3).45 Some of the reduced
costs arising from technical advances were offset by increased costs of providing more
45
The story may be different in the twentieth century, as it appears to have been for the late
nineteenth century and opening decade of the twentieth.
EHA paper: 8-15-2012
Page | 26
luxury and speed. Furthermore, in the period from 1888 to the First World War, during
which freight rates were lowered by 37 percent, passenger lines raised first class fares by
14 percent. Any further analysis of these differentials is complicated by the fact in
passenger shipping that space was allocated and amenities improved to differing extents
in the various classes of travel, and is beyond the scope of this paper.
The shift from sailing ships to steam ships has been another issue of interest with
discussion proceeding largely in the absence of time series evidence on passenger fares.
Intuitively, and from the perspective of economic theory, fares should have played some
role. Raymond Cohn put forth an argument for the shift from sail to steam in passenger
travel analogous to the explanation for the shift in freight transportation: all else equal,
we would expect steam ships to have taken over the industry when the price of passage
was less than that on sailing ships. 46 Conceivably, this shift could have happened in a
short period of time, if steamships had the capacity to accommodate both the market
already being served by sailing ships and growth in overseas travel. If not, the speed of
the transition would be determined by the ability to increase the carrying capacity of the
steamship lines. Even if that were not a constraint, the shift might have been prolonged
because not all travelers, indeed not all those involved in the industry, were convinced
that steamships were a preferred mode of travel. Although they may have made travel
faster, more reliable in terms of travel time, more comfortable and probably safer, not
everyone was convinced at first. This skepticism arose from that fact that the first
steamers were nothing more than sailing ships with a steam engine – not the huge,
46
Cohn, “The Transition from Sail to Steam,’ p. 477, drawing on Harley’s work (1971, “The
Shift,) on freight transportation.
.
EHA paper: 8-15-2012
Page | 27
enormous greyhounds of the sea they were to become. The matter is further complicated
by the fact that there were two different classes of travel – cabin (first and second) and
steerage – and the first steamships did not take steerage passengers. Sailing ships would
have persisted if only to carry steerage passengers. Thus the transition which began with
cabin class travel around 1840 would not be complete until steamships were carrying
both classes of passengers. Raymond Cohn, using the Passenger Lists filed by ship
captains with U.S. port authorities, has documented the share of immigrants arriving by
steam. His evidence shows that the share of immigrants traveling by steam rose from one
percent in the early 1850s to 100 percent by 1876.47
Because the early steamships
catered to the cabin classes, it would seem that the transition to steam for those classes
would have occurred earlier than that for steerage, but as explained below that may not
have been the case.
Most previous accounts of the transition from sail to steam have focused on
steerage travel, and rightly so as that part of the market came to be the more important
source of revenue for the steamships.48
The explanations offered in previous writings
have been based largely on indirect evidence regarding the timing of increases in the
numbers of steamships and steamship lines, as well as improvements made to steamships,
that facilitated the growth of travel, particularly immigrant travel, and the improvements
made by sailing ships in an attempt to forestall the takeover by steamships. Passenger
fares were not at the center of most explanations because reliable time series data were
47
Cohn, 2005, Table 1. In the text (pp. 476 and 482) he puts the final date for sailing ships at
1874. 48
See Keeling, “Capacity,” for a discussion of the relationship between the growth of capacity
and the immigrant trade.
EHA paper: 8-15-2012
Page | 28
not available.49
In Cohn’s view, consistent information on fares by steamship is not
available for years before the 1880s. He used only a dozen fares at various dates between
1846 and 1875 taken from secondary sources, some of which were cabin fares and others
steerage fares, to conclude that ‘steamship fares generally remained above or at the upper
end of fares on sailing ships.” 50
We can shed some further light on the transition, although not as much as we
would have liked. Our advertised series for cabin class begins well before the shift to
steam and allows us to compare fares on sailing ships and steam ships from the time of
the first steamer through 1855.51 We have been unable to locate passenger fares for
sailing ships for any dates thereafter so we cannot say exactly when cabin fares might
have favored steamships, although we speculate below that it may have occurred just
prior to the Civil War.
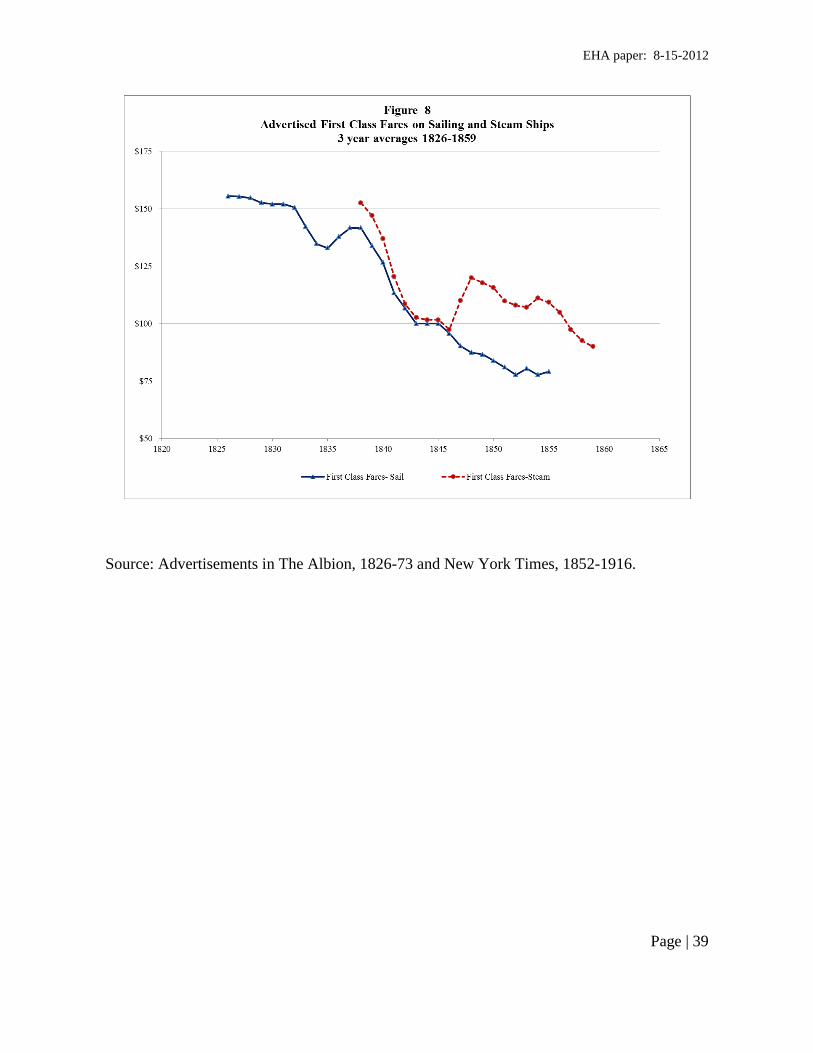
In any case, the evidence for the early years of the transitional period shows that
steam fares were not much above those for sailing ships (Figure 8). The first ads for
steam travel in our data are those of the Great Western Steamship Co. ($152) and the
Transatlantic Steamship Co. ($163) giving an average observation for 1838 of $158. The
following year, Transatlantic reduced its fare to that advertised by Great Western, while a
new entrant, the British and American Steam Navigation Co., advertised an even lower
fare of $140. In 1840, Great Western’s advertised fares for the year averaged $140, while
49
Keeling, “Transportation Revolution,” argues that fares had little influence on the overall
volume of immigration. 50
Cohn, 2008, p. 482 and Table 4, p. 483. 51
Regrettably our series for advertised steerage fares does not begin until 1854, and then
includes only passage on steam ships.

EHA paper: 8-15-2012
Page | 29
British and North American offered an even lower fare of $115.52
Even with
Transatlantic continuing to advertise at $152, the average for 1840 was $136; fifteen
percent below that for 1838 and only thirteen percent above the average advertised by the
New York and Liverpool Packets and New York and London Packets. Indeed, the
average steam fare was below the $140 fare advertised by the New York and Liverpool
Packet Co. The closeness of the steam and sail fares down through 1845 is not too
surprising given that the steamships of this era were as described earlier, sailing ships
with engines.
The average fares on steam ships jumped considerably in 1848 when the British
and North American Royal Mail Steamships (i.e. Cunard) began advertising fares of
$120, which were 10 to 20 percent above the fares advertised by Great Western in nearby
years.53
And although steam fares fell continuously on average down to 1860, they did
not reach the $75-85 range of fares for sailing ships found for 1850-55, the last years for
which we found sailing fares. But, it appears that the fares on sailing ships were leveling
off in the $75-85 range, while steam fares continued to decline. And, in 1859 the average
for 8 steam lines and individual ships was $88, quite close to the last advertised fares for
sailing ships.54
52
The Great Western fare was advertised as $152 at the beginning of the year and reduced to
$130 in July. The Albion, Jan 4 and July 4, 1840 53
The average fare may have jumped earlier because British and North American Royal Mail
steamships had been sailing since 1840, but we did not find an advertised fare until 1848. 54
In 1859 British and North American Royal Mail’s fare was $130 and North German Lloyd
$100, while fares for New York and Glasgow Steamship co. and several individual ships ran
between $65 and $75.
EHA paper: 8-15-2012
Page | 30
As we said above, we would have thought that the transition for cabin class travel
would have been completed earlier than that for steerage. The absence of advertised fares
for sailing ships in both the New York Times and The Albion suggests that the transition to
steam for cabin class passengers may have been over for all practical purposes before the
Civil War. The closeness of the fares by 1859 points the same way.55 In his analysis,
Robert Albion came to the conclusion that even the larger and faster sailing packets had
been eclipsed already some years before, in his description of “the death knell of packet
importance” for first class travel:
“With the establishing of a regular steamship line from New York in
1848, the packets lost the last of the most desirable trade and lapsed
into the role into which they had pushed the regular traders thirty
years before, as carriers of immigrants and heavy freight.”56
Our analysis re-affirms this depiction, but with further improvements to the fare
series during the middle 19th
century sail-to-steam decades, we will be able to better
assess the degree to which price pressure may have compounded the competition on
speed and conditions by which the oceanic transportation revolution affected and
altered long-distance travel for business and leisure.
Conclusions:
Prior studies of nineteenth and early twentieth century travel, though insightful in
many ways, have been limited by a paucity of consistent and continuous data on
55
Of arriving cabin passengers at New York, only 7% came on sailing ships in 1864, a year
before the Civil War ended. A year after, in 1866, the proportion was down to 2% (NY
Commissioners of Emigration reports). 56
Robert Albion, pp. 265-66.

EHA paper: 8-15-2012
Page | 31
passenger fares. Our research shows not only that such data do exist, but that they can be
gathered from various scattered sources and compiled into a reasonably reliable,
representative and informative long term time series. The series of first class fares from
New York to Britain presented and analyzed here indicates a long term decline in the
costs of transatlantic tourist and business travel, between the 1820s and the early 1900s,
that was less dissimilar than previously suggested (in much of the shipping history
literature) from the more well-known reduction of costs for goods shipments that is
generally considered a key result of the transportation revolution. Passenger travel was a
part of that revolution as well, facilitating the transatlantic movement of people and ideas.

EHA paper: 8-15-2012
Page | 32
Source: Advertisements in The Albion, 1826-73 and New York Times, 1852-1916.
EHA paper: 8-15-2012
Page | 33
Figure 2
Comparison of Fares for Selected Companies
$0
$25
$50
$75
$100
$125
$150
$175
1850 1860 1870 1880 1890 1900 1910 1920
Year
Do
lla
rs
Cunard and Royal Mail Line North German Lloyd Average for All Lines
Inman State
Cunard
North German
State
Inman
Source: Advertisements in The Albion, 1826-73 and New York Times, 1852-1916.
EHA paper: 8-15-2012
Page | 34
EHA paper: 8-15-2012
Page | 35
Notes and Sources: Source: Advertisements in The Albion, 1826-73 and New York Times, 1852-1916. The David-Solar Price
Index (Carter, et al, Historical Statistics, Series Cc2) was used to deflate the nominal fares.
EHA paper: 8-15-2012
Page | 36
Figure 5: Comparison of 1st, 2nd and Steerage/3rd Class Advertised Fares, 1850-1916
H-P Filter Used to Estimate Trends
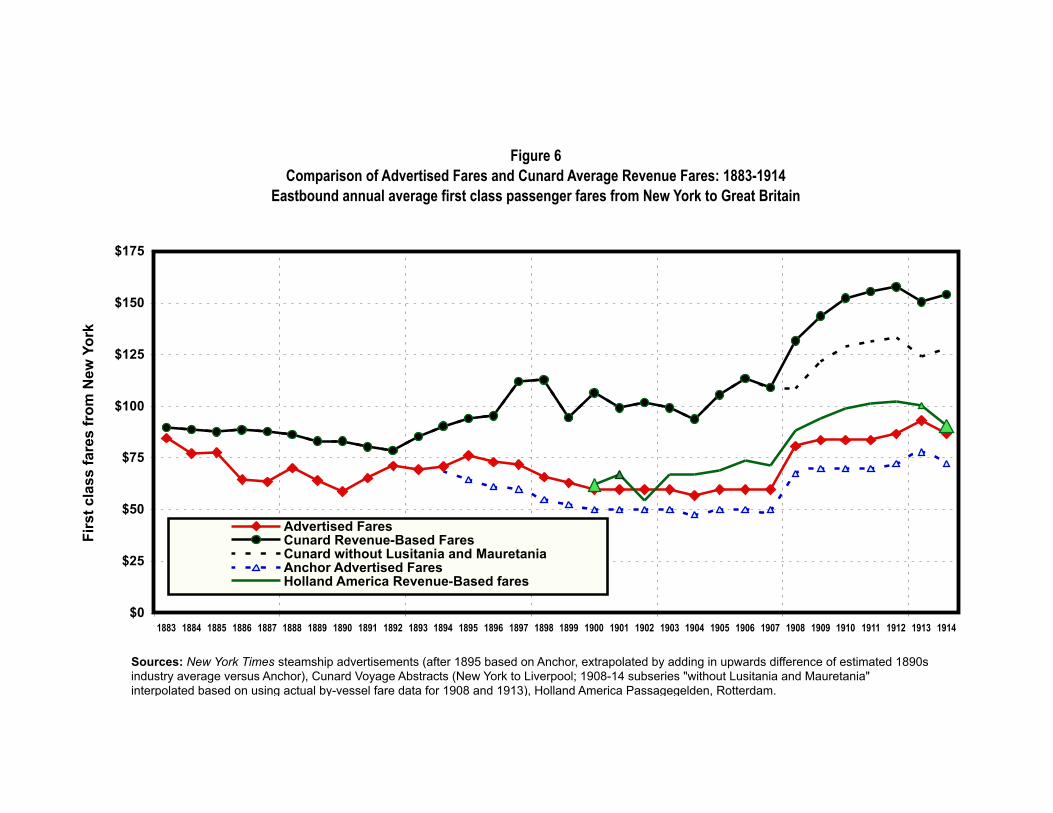
Figure 6Comparison of Advertised Fares and Cunard Average Revenue Fares: 1883-1914
Eastbound annual average first class passenger fares from New York to Great Britain
$0
$25
$50
$75
$100
$125
$150
$175
1883 1884 1885 1886 1887 1888 1889 1890 1891 1892 1893 1894 1895 1896 1897 1898 1899 1900 1901 1902 1903 1904 1905 1906 1907 1908 1909 1910 1911 1912 1913 1914
Firs
t cla
ss fa
res
from
New
Yor
k
Advertised FaresCunard Revenue-Based FaresCunard without Lusitania and MauretaniaAnchor Advertised FaresHolland America Revenue-Based fares
Sources: New York Times steamship advertisements (after 1895 based on Anchor, extrapolated by adding in upwards difference of estimated 1890s industry average versus Anchor), Cunard Voyage Abstracts (New York to Liverpool; 1908-14 subseries "without Lusitania and Mauretania" interpolated based on using actual by-vessel fare data for 1908 and 1913), Holland America Passagegelden, Rotterdam.
EHA paper: 8-15-2012
Page | 38
Notes and Sources to Figure 7:
Export Freight Rate Index: North, "Ocean Freight Rates, Appendix Table 2, p. 549.
An Import Freight Rate Index based on data in North, "US Balance of Payments,” pp. 607-08, Table B-2 and Simon, "US Balance of
Payments," p. 652, Table 7 shows a similar pattern. We have used the export index because it is a slightly longer series, running up to 1910.
EHA paper: 8-15-2012
Page | 39
Source: Advertisements in The Albion, 1826-73 and New York Times, 1852-1916.
EHA paper: 8-15-2012
Page | 40
Table 1
Comparison of Percentage Changes in Fares by time period
Archival Fares Advertised
Cunard First Class Fares
including excluding 1st class
1883-1900 19% 19% -29%
1900-07 3% 2% 0%
1907-14 41% 18% 45%
1900-14 45% 20% 45%
Fares are one-way, for eastbound travel
including: revenues for the Lusitania and Mauritania are included
excluding: revenues for the Lusitania and Mauritania are excluded

EHA paper: 8-15-2012
Page | 41
Table 2
Selected Fare Data for 1908
Fare in $ More
East from Fare adjusted representative
New York for route length Fares ($)
Revenue Based Fares
Highest Single Voyage fares
Avg Mauretania, Lusitania $151
Cunard (except Lusitania &
,Mauritania) $144
Holland American (westward) $141 $128
Averages for all voyages
(except Advertised Fare)
Cunard $127
Cunard without Lusitania & ,Mauritania $109
Holland American (westward) $97 $88 (adj)
Advertised Average Fare $81
Anchor $73
Lowest Single Voyage Fares
Cunard $54
Holland American (westward) $45 $41
Atlantic Conference Fares
Highest CVM Cunard $124 $124
Highest CVM North German Lloyd $119 $103
Highest CVM Holland American $102 $93
Highest CVM Anchor $70 $71
Lowest CVM Cunard $80 $80
Lowest CVM North German Lloyd $80 $70
Lowest CVM Holland American $80 $73
Lowest CVM Anchor $61 $62
Noes and Sources: "CVM" = conference vessel minimums
Cunard Abstracts, Keeling, Networks, NY Times, Murken.
EHA paper: 8-15-2012
Page | 42
Table 3
Comparison of Indexes of Freight Rates and Passenger
Fares at Selected Dates
5 Year Averages; 1860=100
Freight Rate Indexes
Passenger
Fare Index
Import Export
1st Class
Nominal
Fares
Benchmark Values
5 year averages centered on
1828 165.8 115.5 166.3
1848 101.9 85.6 105.3
1868 107.0 81.0 108.0
1888 65.7 57.1 69.5
1900 41.0 50.7 53.0
1908 NA 36.1 79.5
Percent Changes over 20 year periods
1828-48 -39% -26% -37%
1848-68 5% -5% 3%
1868-88 -39% -30% -36%
1888-00 -38% -11% -24%
1888-08 NA -37% 14%
Percent Changes over longer periods
1828-88 -60% -51% -58%
1828-00 -75% -56% -68%
1828-08 NA -69% -52%
Sources: See Figure 8

EHA paper: 8-15-2012
Page | 43
List of Citations
Robert Greenhalgh Albion, Square-Riggers on Schedule: The New York Sailing Packets to
England, France, and the Cotton Ports. Princeton: Princeton University Press, 1938.
D. H. Aldcroft, “The Mercantile Marine.” In The Development of British Industry and
Foreign Competition, 1875-1914, edited by Derek H. Aldcroft, pp. 326-63. London: George
Allen, 1968. [British Industry]
Anchor Line, “Passenger Traffic, Glasgow and New York Trade” (UGD 255/1/2/7). Archives
and Business Records Centre, University of Glasgow.
Harold Barger, (1951), Output in the Transportation Industries, 1889-1946, New York:
National Bureau of Economic Research,
N. R. P. Bonsor, North Atlantic Seaway: An illustrated history of the passenger services
linking the old world with the new (5 volumes). Newton Abbot: David and Charles, 1975-
1980.
Gordon Boyce, Information, Mediation, and Institutional Development: The Rise of Large-
scale Enterprise in British Shipping, 1870-1919. Manchester: Manchester University Press,
1995. [Information]
Berit Brattne and Sune Åkerman, “The Importance of the Transport Sector for Mass
Emigration.” In From Sweden to America: A History of the Migration, edited by Harald
Runblom and Hans Norman, pp. 176-200. Minneapolis: University of Minnesota Press, 1976.
Raymond Cohn, “Transatlantic U.S. Passenger Travel at the Dawn of the Steamship Era,”
International Journal of Maritime History, June 1992.
Raymond Cohn, (2005) “The Transition from Sail to Steam in Immigration to the United
States,” Journal of Economic History.
Cohn, Raymond L. Mass Migration Under Sail: European Immigration to the Antebellum
United States. New York: Cambridge University Press, 2009. [Antebellum]
Lorraine Coons and Alexander Varias, (2003) Tourist Third Cabin, Cambridge: Palgrave
Macmillan
Cunard, annual reports, 1885-1914 (A1/7). Cunard Archives. Special Collections and
Archives, Sydney Jones Library, University of Liverpool.
M. G. De Boer, The Holland-America Line, 1873-1923. Amsterdam: L. Van Leer, 1923.
EHA paper: 8-15-2012
Page | 44
George Deltas, Richard Sicotte, and Peter Tomczak, (2008) “Passenger Shipping Cartels and
Their Effect on Trans-Atlantic Migration,” The Review of Economics and Statistics, Feb. pp.
119-133.
Foster Rhea Dulles, Americans Abroad: Two Centuries of European Travel, Ann Arbor:
University of Michigan Press, 1964.
Brandon Dupont, Alka Gandhi, and Thomas Weiss, (2012), “The Long Term Rise in
Overseas Travel by Americans, 1820-2000,” Economic History Review, 2012.
Torsten Feys, “Where All Passenger Liners Meet: New York as a Nodal Point for the
Transatlantic Migrant Trade, 1885-1895.” International Journal of Maritime History 19(2),
pp. 245-72 (December 2007).
William Henry Flayhart III. (2000) The American Line, New York: W.W. Norton and Co.
Albert Fishlow, (1967), American Railroads and the Transformation of the Ante Bellum
Economy, Harvard University Press.
Albert Fishlow (1966), “p.584 “Productivity and Technological Change in the Railroad
Sector, 1840-1910,” NBER, Studies in Income and Wealth, vol. 30, Columbia U. Press, p.
585.
J. D. Gould, “European Inter-Continental Emigration, 1815-1914: Patterns and Causes.”
Journal of European Economic History 8 (Winter 1979), pp. 593-679.
Hans-Jürgen Grabbe, Vor der großen Flut: Die europäische Migration in die Vereinigten
Staaten von Amerika 1783-1820. Stuttgart: Franz Steiner, 2001.
Grubb, Farley. “The Long-Run Trend in the Value of European Immigrant Servants, 1654-
1831: New Measurements and Interpretations.” Research in Economic History 14 (1992), pp.
167-240.
C. Knick Harley, “Ocean Freight Rates and Productivity, 1740-1913: The Primacy of
Mechanical Invention Reaffirmed.” Journal of Economic History 48(4), pp. 851-876
(December 1988). [“Ocean Freight Rates”]
C. Knick Harley, “North Atlantic Shipping in the Late Nineteenth Century Freight Rates and
the Interrelationship of Cargoes.” In Shipping and Trade, 1750-1950: Essays in International
Maritime Economic History, edited by Lewis R. Fischer and Helge W. Nordvik, pp. 147-171.
Pontefract: Lofthouse, 1990. [“Interrelationship”]
C. Knick Harley, “Steers Afloat: The North Atlantic Meat Trade, Liner Predominance, and
Freight Rates, 1870-1913.” Journal of Economic History 68(4), pp. 1028-1058 (December
2008). [“Steers”]
EHA paper: 8-15-2012
Page | 45
Holland America Line, Passagegelden, 1900-1914. Gemeentearchief Rotterdam.
[Passagegelden]
John Hutchins, American Maritime Industries and Public Policy, 1789-1914. Cambridge:
Harvard University Press, 1941.
Kristian Hvidt, Flugten til Amerika eller Drivkræfter i masseudvandringen fra Danmark
1868-1914. Aarhus: Universitetsforlaget, 1971
Francis E. Hyde, Cunard and the North Atlantic, 1840-1973: A History of Shipping and
Financial Management. London: Macmillan, 1975.
Francis Hyde, (1975) Cunard and the North Atlantic, 1840-1973, Atlantic Highlands, NJ:
Humanities Press, pp. 40, 42, 64, 80, and 97.
E. Johnson, and G.G. Huebner, (1920) Principles of ocean transportation (New York).
Drew Keeling, (1999), ‘The transportation revolution and transatlantic migration, 1850-1914’,
Research in Economic History, 19, pp. 39-74.
David S Jacks and Krishna Pendakur, "Global Trade and the Maritime Transport Revolution,"
Review of Economics and Statistics 92(4), pages 745-755, November, 2010.).
Drew Keeling, “Transatlantic Shipping Cartels and Migration between Europe and America,
1880-1914.” Essays in Economic and Business History 17 (1999), pp. 195-213. [“Cartels”]
Drew Keeling, “The Transportation Revolution and Transatlantic Migration, 1850-1914.”
Research in Economic History 19 (1999), pp. 39-74. [“Transportation Revolution”]
Drew Keeling, “Costs, Risks, and Migration Networks between Europe and the United States,
1900-1914.” In Maritime Transport and Migration: The Connections between Maritime and
Migration Networks, edited by Torsten Feys, Lewis R. Fischer, Stéphane Hoste and Stephan
Vanfraechem, pp. 113-173. Research in Maritime History 33. St. John’s: International
Maritime Economic History Association, 2007. [“Networks”]
Drew Keeling, “Transport Capacity Management and Transatlantic Migration, 1900-1914.”
Research in Economic History 25 (2008), pp. 225-283. [“Capacity”]
Drew Keeling, “The Voyage Abstracts of the Cunard Line as a Source of Transatlantic
Passenger Fares, 1883-1914.” Business Archives Sources and History 96 (2008), pp. 15-36.
[“Abstracts ”]
Drew Keeling, “The Improvement of Travel Conditions for Migrants crossing the North
Atlantic, 1900-1914.” In Points of Passage: Jewish Transmigrants from Eastern Europe in
Germany, Britain and Scandinavia, edited by Tobias Brinkmann. New York: Berghahn,
forthcoming. [“Conditions”]
EHA paper: 8-15-2012
Page | 46
Drew Keeling, “Costs, cycles and causes of migration across the North Atlantic, 1870-1914
Paper presented at the Economic History Society conference, 2011 [“Costs, cycles, causes”]
John Killick, “An Early Nineteenth-Century Shipping Line: The Cope Line of Philadelphia
and Liverpool Packets, 1822-1872,” International Journal of Maritime History 12(1), pp. 61-
87 (June 2000).
Arnold Kludas, Die Geschichte der deutschen Passagierschiffahrt (5 volumes). Berlin: Ernst
Kabel, 1986.
Harvey Levenstein, (1998) Seductive Journey: American Tourists in France From Jefferson
to the Jazz Age, Chicago: University of Chicago Press.
Harvey Levenstein. (2004) We’ll Always Have Paris: American Tourists in France Since
1930, Chicago: University of Chicago Press.
Erich Murken, Die großen transatlantischen Linienreederei-Verbände, Pools und
Interessengemeinschaften bis zum Ausbruch des Weltkrieges: Ihre Entstehung, Organisation,
und Wirksamkeit. Jena: Gustav Fischer, 1922.
John Maxtone-Graham, Crossing and Cruising: From the Golden Era of Ocean Liners to the
Luxury Cruise Ships of Today. New York: Scribner’s, 1992. [Crossing]
Günter Moltmann, “Steamship Transport of Emigrants from Europe to the United States,
1850-1914: Social, Commercial and Legislative Aspects.” In Maritime Aspects of Migration,
edited by Klaus Friedland, pp. 309-320. Cologne: Böhlau, 1989. [“Transport”]
Douglass North, “Ocean Freight Rates and Economic Development 1750-1913.” Journal of
Economic History 42 (December 1958), pp. 537-555.
Douglass North (1960) “The United States Balance of Payments, 1790-1860,” in NBER,
Studies in Income and Wealth, vol. 24, Princeton University Press, p.595
“Reports of the Trans-Atlantic Passenger Movement,” Transatlantic Passenger Conferences,
New York, 1899-1925.
Statistical Abstracts of the United States, 1880-1926
Matthew Simon, (1960) “The United States Balance of Payments, 1861-1900,” in NBER,
Studies in Income and Wealth, vol. 24, Princeton University Press, p.650.
George R. Taylor, The Transportation Revolution, 1815-60. (2nd edition). (Economic History
of the United States, vol. 4.) New York: Harper and Row, 1968 (1st edition, 1951).
EHA paper: 8-15-2012
Page | 47
Philip Taylor, The Distant Magnet: European Migration to the U.S.A. New York: Harper and
Row, 1971.
David D. Tyler, (1939), Steam Conquers the Atlantic, New York: D. Appleton-Century Co.
pp. 64, 165, 267, 288 and 290.
U.S. Commissioner of Navigation, annual reports, 1890-1914. [ARCN]
Marianne S. Wokeck, Trade in Strangers: The Beginnings of Mass Migration to North
America. University Park: Pennsylvania State University Press, 1999.
Wyman, Mark, Round-Trip to America: The Immigrants Return to Europe, 1880-1930.
Ithaca: Cornell University Press, 1993.