Passenger car fuel-efficiency, 2020–2025
16
WWW.THEICCT.ORG © INTERNATIONAL COUNCIL ON CLEAN TRANSPORTATION, 2013 Passenger car fuel-efficiency, 2020–2025 Comparing stringency and technology feasibility of the Chinese and US standards AUTHOR: Hui He, Anup Bandivadekar DATE: August 2013 KEYWORDS: China, technology penetration, fuel-efficiency standards, technology cost-curves WORKING PAPER 2013-3 Top Chinese leaders are determined to ensure that the domestic auto industry is world-class. Technology upgrades were one of the top priorities in China’s auto industrial strategic plan for the upcoming decade 1 . The plan proposes an average fuel consumption target of 5L/100km for new passenger cars by 2020, aiming to accelerate technology advances for fuel efficiency. However, some concerns have been raised about the proposed 2020 target of 5 L/100km. These concerns include feasibility, future technology options, and costs of meeting the proposed target. This paper summarizes technology pathways leading to compliance with the US 2020–2025 light-duty vehicle GHG and fuel economy standards and compares the standard stringency and recent technology trend between US and China. The comparison suggests that the proposed 2020 target in China is less stringent than that of the US. The paper further demonstrates the difference in baseline technology and technology trends between the US and China and illustrates why Chinese regulators need to secure the 5L/100km goal. Although it is not clear what compliance flexibilities will be allowed for the 2020 standard in China, this paper assumes that the 5L/100km to be met purely by improving the efficiency of new gasoline passenger cars, without applying compliance credits such as super credits for electric vehicles, or credits for off-cycle fuel saving etc. 1 State Council (2012). Energy saving and new energy vehicle industry development plan (2012-2020). Available at http://www.gov.cn/ zwgk/2012-07/09/content_2179032.htm; accessed April 2, 2013. A closer look at the standard stringency US and China This section compares the standard stringency between China, US in two ways: the absolute-term efficiency targets and the annual improvement required to meet those targets. Corporate average fuel consumption standards for passenger cars in China from were established in two phases. The first phase of standard aims to achieve a fleet-average target of 6.9 L/100km by 2015, while the second phase aims at 5L/100km by 2020. In August 2012, the US Environmental Protection Agency (EPA) and the National Highway Transportation and Safety Administration (NHTSA) issued a joint final rulemaking of harmonized greenhouse gas and fuel economy standards for model years (MY) 2017 to 2025. The rule specifies vehicle-footprint-based corporate average GHG and fuel economy standards for the man- ufacturers and sets annual fleet-average targets for passenger cars light trucks, and the combined fleet. US manufacturers may take advantage of various flex- ibilities specified in the rules to meet their corporate average targets. If manufacturers do not take advantage of compliance flexibility and meet their targets purely through improving the efficiency of the vehicles, a separate set of estimated fleet-average fuel economy values, also provided by NHTSA in the rule, applies. Since we assume that China’s 2020 regulation does not allow compliance flexibilities, we only compare the US AUTHOR Hui He is a policy analyst with the ICCT, and co-lead for the ICCT’s China region. Anup Bandivadekar directs the ICCT’s Passenger Vehicle Program.
Transcript of Passenger car fuel-efficiency, 2020–2025
www.theicct.org© InternatIonal CounCIl on Clean transportatIon, 2013
Passenger car fuel-efficiency, 2020–2025comparing stringency and technology feasibility of the chinese and US standards
Author: hui he, Anup BandivadekarDAte: August 2013KeyworDs: China, technology penetration, fuel-efficiency standards, technology cost-curves
working PAPer 2013-3
top chinese leaders are determined to ensure that the domestic auto industry is world-class. technology upgrades were one of the top priorities in china’s auto industrial strategic plan for the upcoming decade1. the plan proposes an average fuel consumption target of 5L/100km for new passenger cars by 2020, aiming to accelerate technology advances for fuel efficiency. however, some concerns have been raised about the proposed 2020 target of 5 L/100km. these concerns include feasibility, future technology options, and costs of meeting the proposed target.
this paper summarizes technology pathways leading to compliance with the US 2020–2025 light-duty vehicle ghg and fuel economy standards and compares the standard stringency and recent technology trend between US and china. the comparison suggests that the proposed 2020 target in china is less stringent than that of the US. the paper further demonstrates the difference in baseline technology and technology trends between the US and china and illustrates why chinese regulators need to secure the 5L/100km goal. Although it is not clear what compliance flexibilities will be allowed for the 2020 standard in china, this paper assumes that the 5L/100km to be met purely by improving the efficiency of new gasoline passenger cars, without applying compliance credits such as super credits for electric vehicles, or credits for off-cycle fuel saving etc.
1 State council (2012). energy saving and new energy vehicle industry development plan (2012-2020). Available at http://www.gov.cn/zwgk/2012-07/09/content_2179032.htm; accessed April 2, 2013.
A closer look at the standard stringency US and China
this section compares the standard stringency between china, US in two ways: the absolute-term efficiency targets and the annual improvement required to meet those targets.
corporate average fuel consumption standards for passenger cars in china from were established in two phases. the first phase of standard aims to achieve a fleet-average target of 6.9 L/100km by 2015, while the second phase aims at 5L/100km by 2020.
in August 2012, the US environmental Protection Agency (ePA) and the national highway transportation and Safety Administration (nhtSA) issued a joint final rulemaking of harmonized greenhouse gas and fuel economy standards for model years (MY) 2017 to 2025. the rule specifies vehicle-footprint-based corporate average ghg and fuel economy standards for the man-ufacturers and sets annual fleet-average targets for passenger cars light trucks, and the combined fleet. US manufacturers may take advantage of various flex-ibilities specified in the rules to meet their corporate average targets. if manufacturers do not take advantage of compliance flexibility and meet their targets purely through improving the efficiency of the vehicles, a separate set of estimated fleet-average fuel economy values, also provided by nhtSA in the rule, applies.
Since we assume that china’s 2020 regulation does not allow compliance flexibilities, we only compare the US
AUthor hui he is a policy analyst with the icct, and co-lead for the icct’s china region. Anup Bandivadekar directs the icct’s Passenger Vehicle Program.
Passenger car fuel efficiency, 2020–2025
2 internAtionAL coUnciL on cLeAn trAnSPortAtion working PAPer 2013-3
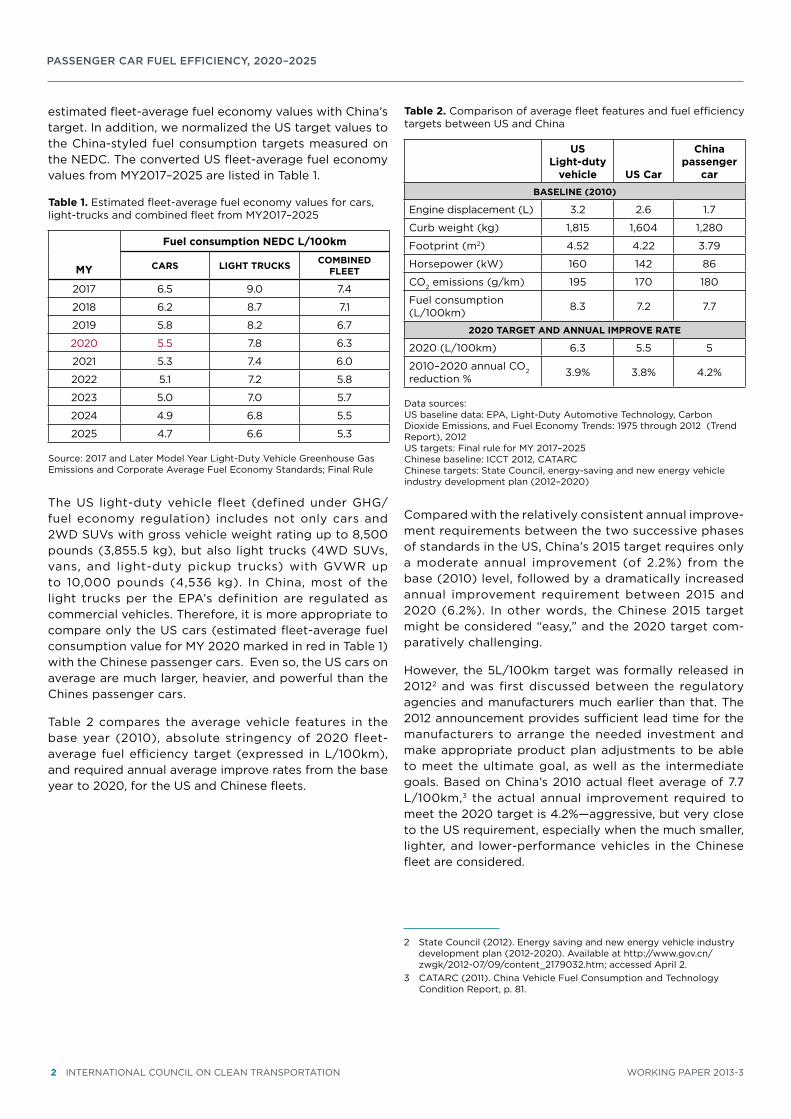
estimated fleet-average fuel economy values with china’s target. in addition, we normalized the US target values to the china-styled fuel consumption targets measured on the neDc. the converted US fleet-average fuel economy values from MY2017–2025 are listed in table 1.
table 1. estimated fleet-average fuel economy values for cars, light-trucks and combined fleet from MY2017–2025
MY
Fuel consumption NEDC L/100km
CArS Light trUCkS CoMbiNED FLEEt
2017 6.5 9.0 7.4
2018 6.2 8.7 7.1
2019 5.8 8.2 6.7
2020 5.5 7.8 6.3
2021 5.3 7.4 6.0
2022 5.1 7.2 5.8
2023 5.0 7.0 5.7
2024 4.9 6.8 5.5
2025 4.7 6.6 5.3
Source: 2017 and Later Model Year Light-Duty Vehicle greenhouse gas emissions and corporate Average Fuel economy Standards; Final rule
the US light-duty vehicle fleet (defined under ghg/fuel economy regulation) includes not only cars and 2wD SUVs with gross vehicle weight rating up to 8,500 pounds (3,855.5 kg), but also light trucks (4wD SUVs, vans, and light-duty pickup trucks) with gVwr up to 10,000 pounds (4,536 kg). in china, most of the light trucks per the ePA’s definition are regulated as commercial vehicles. therefore, it is more appropriate to compare only the US cars (estimated fleet-average fuel consumption value for MY 2020 marked in red in table 1) with the chinese passenger cars. even so, the US cars on average are much larger, heavier, and powerful than the chines passenger cars.
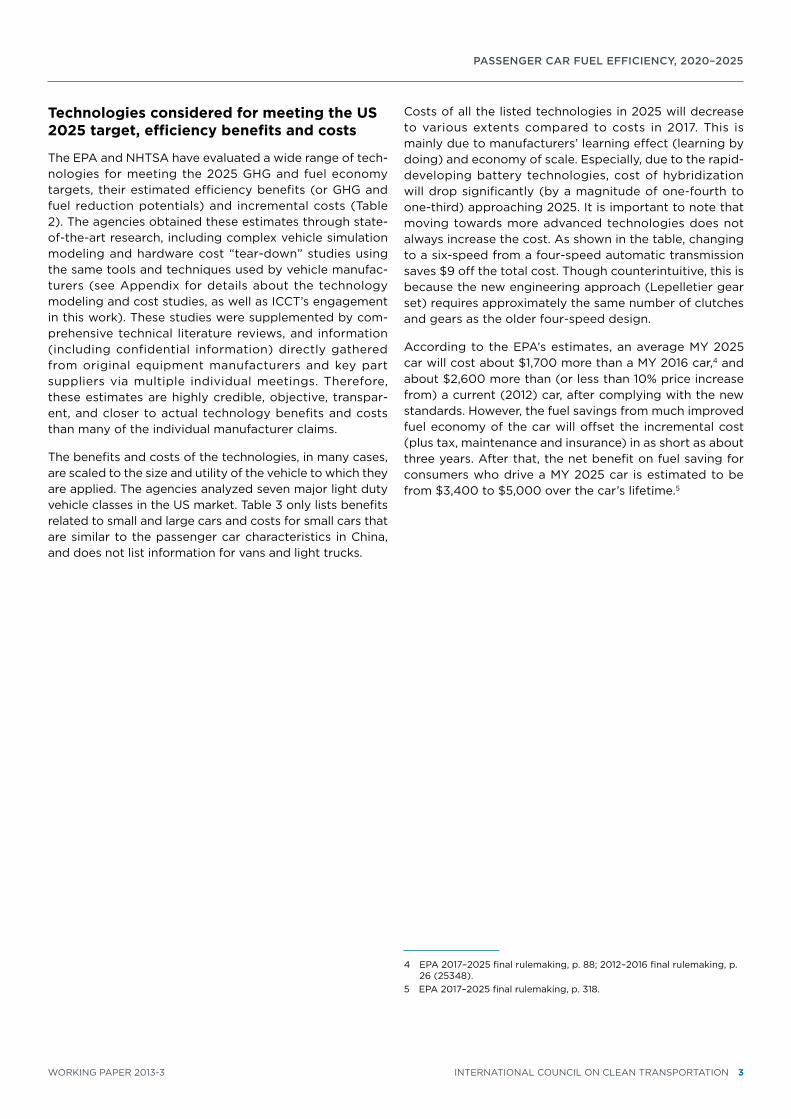
table 2 compares the average vehicle features in the base year (2010), absolute stringency of 2020 fleet-average fuel efficiency target (expressed in L/100km), and required annual average improve rates from the base year to 2020, for the US and chinese fleets.
table 2. comparison of average fleet features and fuel efficiency targets between US and china
US Light-duty
vehicle US Car
China passenger
carbASELiNE (2010)
engine displacement (L) 3.2 2.6 1.7
curb weight (kg) 1,815 1,604 1,280
Footprint (m2) 4.52 4.22 3.79
horsepower (kw) 160 142 86
co2 emissions (g/km) 195 170 180
Fuel consumption (L/100km) 8.3 7.2 7.7
2020 tArgEt AND ANNUAL iMprovE rAtE
2020 (L/100km) 6.3 5.5 5
2010–2020 annual co2 reduction % 3.9% 3.8% 4.2%
Data sources:US baseline data: ePA, Light-Duty Automotive technology, carbon Dioxide emissions, and Fuel economy trends: 1975 through 2012 (trend report), 2012US targets: Final rule for MY 2017–2025chinese baseline: icct 2012, cAtArcchinese targets: State council, energy-saving and new energy vehicle industry development plan (2012–2020)
compared with the relatively consistent annual improve-ment requirements between the two successive phases of standards in the US, china’s 2015 target requires only a moderate annual improvement (of 2.2%) from the base (2010) level, followed by a dramatically increased annual improvement requirement between 2015 and 2020 (6.2%). in other words, the chinese 2015 target might be considered “easy,” and the 2020 target com-paratively challenging.
however, the 5L/100km target was formally released in 20122 and was first discussed between the regulatory agencies and manufacturers much earlier than that. the 2012 announcement provides sufficient lead time for the manufacturers to arrange the needed investment and make appropriate product plan adjustments to be able to meet the ultimate goal, as well as the intermediate goals. Based on china’s 2010 actual fleet average of 7.7 L/100km,3 the actual annual improvement required to meet the 2020 target is 4.2%—aggressive, but very close to the US requirement, especially when the much smaller, lighter, and lower-performance vehicles in the chinese fleet are considered.
2 State council (2012). energy saving and new energy vehicle industry development plan (2012-2020). Available at http://www.gov.cn/zwgk/2012-07/09/content_2179032.htm; accessed April 2.
3 cAtArc (2011). china Vehicle Fuel consumption and technology condition report, p. 81.
Passenger car fuel efficiency, 2020–2025
working PAPer 2013-3 internAtionAL coUnciL on cLeAn trAnSPortAtion 3
technologies considered for meeting the US 2025 target, efficiency benefits and costs
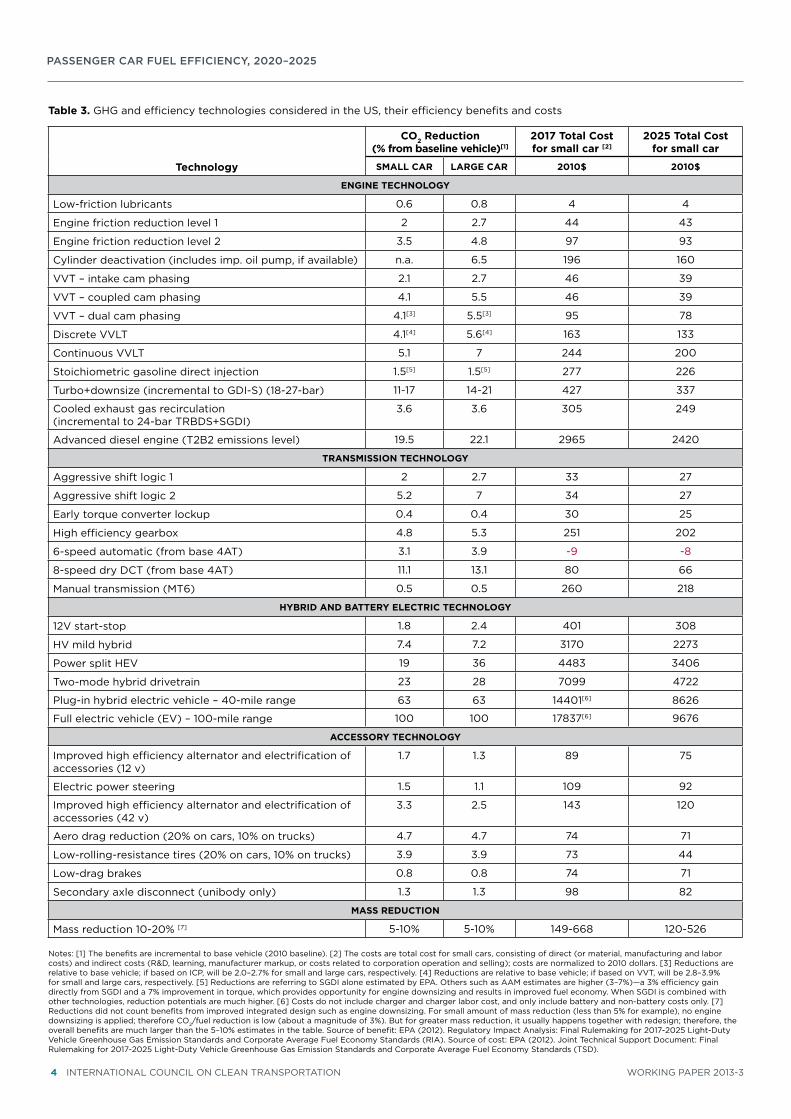
the ePA and nhtSA have evaluated a wide range of tech-nologies for meeting the 2025 ghg and fuel economy targets, their estimated efficiency benefits (or ghg and fuel reduction potentials) and incremental costs (table 2). the agencies obtained these estimates through state-of-the-art research, including complex vehicle simulation modeling and hardware cost “tear-down” studies using the same tools and techniques used by vehicle manufac-turers (see Appendix for details about the technology modeling and cost studies, as well as icct’s engagement in this work). these studies were supplemented by com-prehensive technical literature reviews, and information (including confidential information) directly gathered from original equipment manufacturers and key part suppliers via multiple individual meetings. therefore, these estimates are highly credible, objective, transpar-ent, and closer to actual technology benefits and costs than many of the individual manufacturer claims.
the benefits and costs of the technologies, in many cases, are scaled to the size and utility of the vehicle to which they are applied. the agencies analyzed seven major light duty vehicle classes in the US market. table 3 only lists benefits related to small and large cars and costs for small cars that are similar to the passenger car characteristics in china, and does not list information for vans and light trucks.
costs of all the listed technologies in 2025 will decrease to various extents compared to costs in 2017. this is mainly due to manufacturers’ learning effect (learning by doing) and economy of scale. especially, due to the rapid-developing battery technologies, cost of hybridization will drop significantly (by a magnitude of one-fourth to one-third) approaching 2025. it is important to note that moving towards more advanced technologies does not always increase the cost. As shown in the table, changing to a six-speed from a four-speed automatic transmission saves $9 off the total cost. though counterintuitive, this is because the new engineering approach (Lepelletier gear set) requires approximately the same number of clutches and gears as the older four-speed design.
According to the ePA’s estimates, an average MY 2025 car will cost about $1,700 more than a MY 2016 car,4 and about $2,600 more than (or less than 10% price increase from) a current (2012) car, after complying with the new standards. however, the fuel savings from much improved fuel economy of the car will offset the incremental cost (plus tax, maintenance and insurance) in as short as about three years. After that, the net benefit on fuel saving for consumers who drive a MY 2025 car is estimated to be from $3,400 to $5,000 over the car’s lifetime.5
4 ePA 2017–2025 final rulemaking, p. 88; 2012–2016 final rulemaking, p. 26 (25348).
5 ePA 2017–2025 final rulemaking, p. 318.
Passenger car fuel efficiency, 2020–2025
4 internAtionAL coUnciL on cLeAn trAnSPortAtion working PAPer 2013-3
table 3. ghg and efficiency technologies considered in the US, their efficiency benefits and costs
technology
Co2 reduction (% from baseline vehicle)[1]
2017 total Cost for small car [2]
2025 total Cost for small car
SMALL CAr LArgE CAr 2010$ 2010$
ENgiNE tEChNoLogY
Low-friction lubricants 0.6 0.8 4 4
engine friction reduction level 1 2 2.7 44 43
engine friction reduction level 2 3.5 4.8 97 93
cylinder deactivation (includes imp. oil pump, if available) n.a. 6.5 196 160
VVt – intake cam phasing 2.1 2.7 46 39
VVt – coupled cam phasing 4.1 5.5 46 39
VVt – dual cam phasing 4.1[3] 5.5[3] 95 78
Discrete VVLt 4.1[4] 5.6[4] 163 133
continuous VVLt 5.1 7 244 200
Stoichiometric gasoline direct injection 1.5[5] 1.5[5] 277 226
turbo+downsize (incremental to gDi-S) (18-27-bar) 11-17 14-21 427 337
cooled exhaust gas recirculation (incremental to 24-bar trBDS+SgDi)
3.6 3.6 305 249
Advanced diesel engine (t2B2 emissions level) 19.5 22.1 2965 2420
trANSMiSSioN tEChNoLogY
Aggressive shift logic 1 2 2.7 33 27
Aggressive shift logic 2 5.2 7 34 27
early torque converter lockup 0.4 0.4 30 25
high efficiency gearbox 4.8 5.3 251 202
6-speed automatic (from base 4At) 3.1 3.9 -9 -8
8-speed dry Dct (from base 4At) 11.1 13.1 80 66
Manual transmission (Mt6) 0.5 0.5 260 218
hYbriD AND bAttErY ELECtriC tEChNoLogY
12V start-stop 1.8 2.4 401 308
hV mild hybrid 7.4 7.2 3170 2273
Power split heV 19 36 4483 3406
two-mode hybrid drivetrain 23 28 7099 4722
Plug-in hybrid electric vehicle – 40-mile range 63 63 14401[6] 8626
Full electric vehicle (eV) – 100-mile range 100 100 17837[6] 9676
ACCESSorY tEChNoLogY
improved high efficiency alternator and electrification of accessories (12 v)
1.7 1.3 89 75
electric power steering 1.5 1.1 109 92
improved high efficiency alternator and electrification of accessories (42 v)
3.3 2.5 143 120
Aero drag reduction (20% on cars, 10% on trucks) 4.7 4.7 74 71
Low-rolling-resistance tires (20% on cars, 10% on trucks) 3.9 3.9 73 44
Low-drag brakes 0.8 0.8 74 71
Secondary axle disconnect (unibody only) 1.3 1.3 98 82
MASS rEDUCtioN
Mass reduction 10-20% [7] 5-10% 5-10% 149-668 120-526
notes: [1] the benefits are incremental to base vehicle (2010 baseline). [2] the costs are total cost for small cars, consisting of direct (or material, manufacturing and labor costs) and indirect costs (r&D, learning, manufacturer markup, or costs related to corporation operation and selling); costs are normalized to 2010 dollars. [3] reductions are relative to base vehicle; if based on icP, will be 2.0–2.7% for small and large cars, respectively. [4] reductions are relative to base vehicle; if based on VVt, will be 2.8–3.9% for small and large cars, respectively. [5] reductions are referring to SgDi alone estimated by ePA. others such as AAM estimates are higher (3–7%)—a 3% efficiency gain directly from SgDi and a 7% improvement in torque, which provides opportunity for engine downsizing and results in improved fuel economy. when SgDi is combined with other technologies, reduction potentials are much higher. [6] costs do not include charger and charger labor cost, and only include battery and non-battery costs only. [7] reductions did not count benefits from improved integrated design such as engine downsizing. For small amount of mass reduction (less than 5% for example), no engine downsizing is applied; therefore co2/fuel reduction is low (about a magnitude of 3%). But for greater mass reduction, it usually happens together with redesign; therefore, the overall benefits are much larger than the 5–10% estimates in the table. Source of benefit: ePA (2012). regulatory impact Analysis: Final rulemaking for 2017-2025 Light-Duty Vehicle greenhouse gas emission Standards and corporate Average Fuel economy Standards (riA). Source of cost: ePA (2012). Joint technical Support Document: Final rulemaking for 2017-2025 Light-Duty Vehicle greenhouse gas emission Standards and corporate Average Fuel economy Standards (tSD).
Passenger car fuel efficiency, 2020–2025
working PAPer 2013-3 internAtionAL coUnciL on cLeAn trAnSPortAtion 5
projected compliance pathway in the US
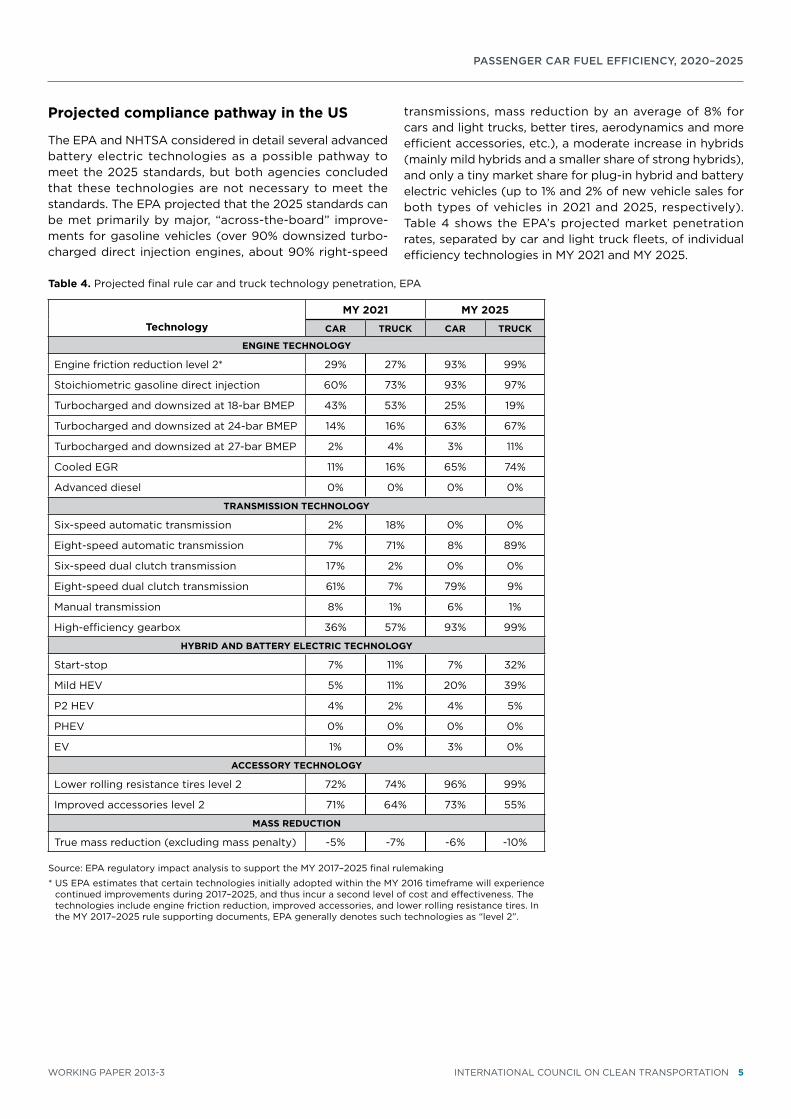
the ePA and nhtSA considered in detail several advanced battery electric technologies as a possible pathway to meet the 2025 standards, but both agencies concluded that these technologies are not necessary to meet the standards. the ePA projected that the 2025 standards can be met primarily by major, “across-the-board” improve-ments for gasoline vehicles (over 90% downsized turbo-charged direct injection engines, about 90% right-speed
transmissions, mass reduction by an average of 8% for cars and light trucks, better tires, aerodynamics and more efficient accessories, etc.), a moderate increase in hybrids (mainly mild hybrids and a smaller share of strong hybrids), and only a tiny market share for plug-in hybrid and battery electric vehicles (up to 1% and 2% of new vehicle sales for both types of vehicles in 2021 and 2025, respectively). table 4 shows the ePA’s projected market penetration rates, separated by car and light truck fleets, of individual efficiency technologies in MY 2021 and MY 2025.
table 4. Projected final rule car and truck technology penetration, ePA
technologyMY 2021 MY 2025
CAr trUCk CAr trUCk
ENgiNE tEChNoLogY
engine friction reduction level 2* 29% 27% 93% 99%
Stoichiometric gasoline direct injection 60% 73% 93% 97%
turbocharged and downsized at 18-bar BMeP 43% 53% 25% 19%
turbocharged and downsized at 24-bar BMeP 14% 16% 63% 67%
turbocharged and downsized at 27-bar BMeP 2% 4% 3% 11%
cooled egr 11% 16% 65% 74%
Advanced diesel 0% 0% 0% 0%
trANSMiSSioN tEChNoLogY
Six-speed automatic transmission 2% 18% 0% 0%
eight-speed automatic transmission 7% 71% 8% 89%
Six-speed dual clutch transmission 17% 2% 0% 0%
eight-speed dual clutch transmission 61% 7% 79% 9%
Manual transmission 8% 1% 6% 1%
high-efficiency gearbox 36% 57% 93% 99%
hYbriD AND bAttErY ELECtriC tEChNoLogY
Start-stop 7% 11% 7% 32%
Mild heV 5% 11% 20% 39%
P2 heV 4% 2% 4% 5%
PheV 0% 0% 0% 0%
eV 1% 0% 3% 0%
ACCESSorY tEChNoLogY
Lower rolling resistance tires level 2 72% 74% 96% 99%
improved accessories level 2 71% 64% 73% 55%
MASS rEDUCtioN
true mass reduction (excluding mass penalty) -5% -7% -6% -10%
Source: ePA regulatory impact analysis to support the MY 2017–2025 final rulemaking
* US ePA estimates that certain technologies initially adopted within the MY 2016 timeframe will experience continued improvements during 2017–2025, and thus incur a second level of cost and effectiveness. the technologies include engine friction reduction, improved accessories, and lower rolling resistance tires. in the MY 2017–2025 rule supporting documents, ePA generally denotes such technologies as “level 2”.
Passenger car fuel efficiency, 2020–2025
6 internAtionAL coUnciL on cLeAn trAnSPortAtion working PAPer 2013-3
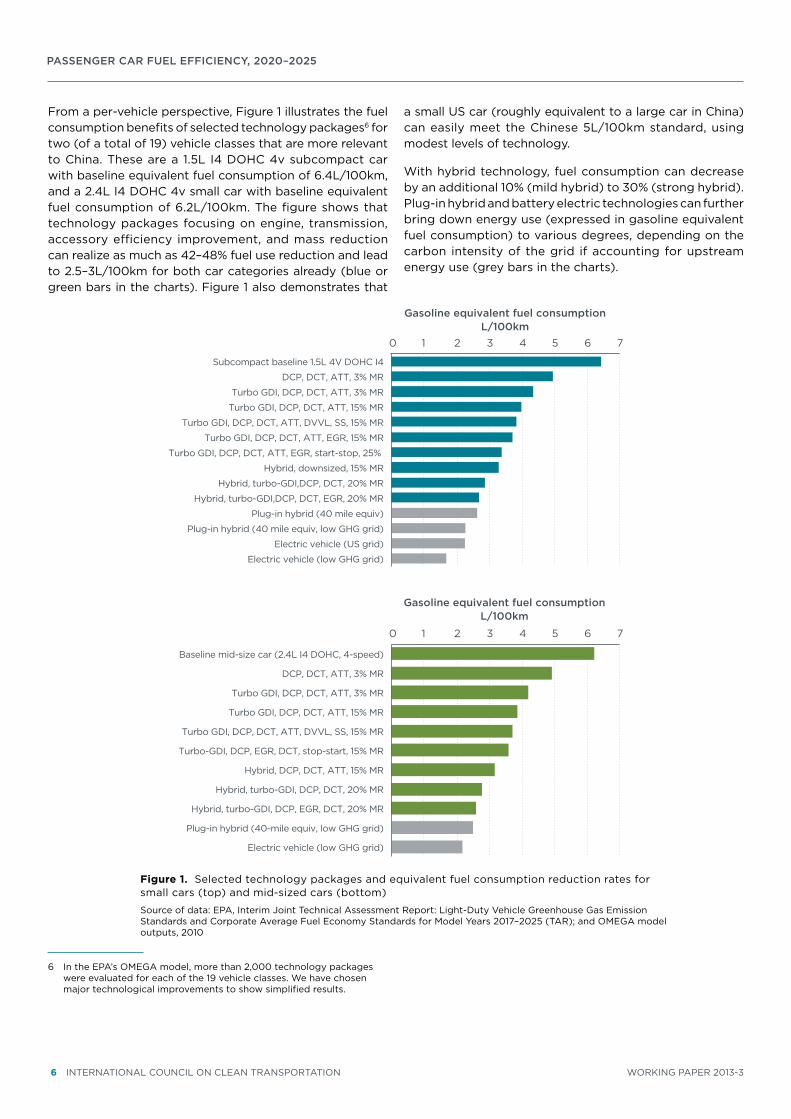
From a per-vehicle perspective, Figure 1 illustrates the fuel consumption benefits of selected technology packages6 for two (of a total of 19) vehicle classes that are more relevant to china. these are a 1.5L i4 Dohc 4v subcompact car with baseline equivalent fuel consumption of 6.4L/100km, and a 2.4L i4 Dohc 4v small car with baseline equivalent fuel consumption of 6.2L/100km. the figure shows that technology packages focusing on engine, transmission, accessory efficiency improvement, and mass reduction can realize as much as 42–48% fuel use reduction and lead to 2.5–3L/100km for both car categories already (blue or green bars in the charts). Figure 1 also demonstrates that
6 in the ePA’s oMegA model, more than 2,000 technology packages were evaluated for each of the 19 vehicle classes. we have chosen major technological improvements to show simplified results.
a small US car (roughly equivalent to a large car in china) can easily meet the chinese 5L/100km standard, using modest levels of technology.
with hybrid technology, fuel consumption can decrease by an additional 10% (mild hybrid) to 30% (strong hybrid). Plug-in hybrid and battery electric technologies can further bring down energy use (expressed in gasoline equivalent fuel consumption) to various degrees, depending on the carbon intensity of the grid if accounting for upstream energy use (grey bars in the charts).
Figure 1. Selected technology packages and equivalent fuel consumption reduction rates for small cars (top) and mid-sized cars (bottom)
Source of data: ePA, interim Joint technical Assessment report: Light-Duty Vehicle greenhouse gas emission Standards and corporate Average Fuel economy Standards for Model Years 2017–2025 (tAr); and oMegA model outputs, 2010
0 1 2 3 4 5 6 7
Baseline mid-size car (2.4L I4 DOHC, 4-speed)
DCP, DCT, ATT, 3% MR
Turbo GDI, DCP, DCT, ATT, 3% MR
Turbo GDI, DCP, DCT, ATT, 15% MR
Turbo GDI, DCP, DCT, ATT, DVVL, SS, 15% MR
Turbo-GDI, DCP, EGR, DCT, stop-start, 15% MR
Hybrid, DCP, DCT, ATT, 15% MR
Hybrid, turbo-GDI, DCP, DCT, 20% MR
Hybrid, turbo-GDI, DCP, EGR, DCT, 20% MR
Plug-in hybrid (40-mile equiv, low GHG grid)
Electric vehicle (low GHG grid)
Gasoline equivalent fuel consumptionL/100km
0 1 2 3 4 5 6 7
Subcompact baseline 1.5L 4V DOHC I4
DCP, DCT, ATT, 3% MR
Turbo GDI, DCP, DCT, ATT, 3% MR
Turbo GDI, DCP, DCT, ATT, 15% MR
Turbo GDI, DCP, DCT, ATT, DVVL, SS, 15% MR
Turbo GDI, DCP, DCT, ATT, EGR, 15% MR
Turbo GDI, DCP, DCT, ATT, EGR, start-stop, 25%
Hybrid, downsized, 15% MR
Hybrid, turbo-GDI,DCP, DCT, 20% MR
Hybrid, turbo-GDI,DCP, DCT, EGR, 20% MR
Plug-in hybrid (40 mile equiv)
Plug-in hybrid (40 mile equiv, low GHG grid)
Electric vehicle (US grid)
Electric vehicle (low GHG grid)
Gasoline equivalent fuel consumptionL/100km
Passenger car fuel efficiency, 2020–2025
working PAPer 2013-3 internAtionAL coUnciL on cLeAn trAnSPortAtion 7
recent technology trends in US and China
the latest data in the US shows that the rate of technology adoption is increasing. even without policy interventions, automakers never stop innovating new technologies, rede-signing vehicles, and retooling their manufacturing facilities to remain competitive.7 US data from the past two decades show that once applied for the first time, new technologies can be deployed to a large fraction of the fleet relatively quickly due to platform sharing and improved manufactur-ing flexibility in modern auto industry.8
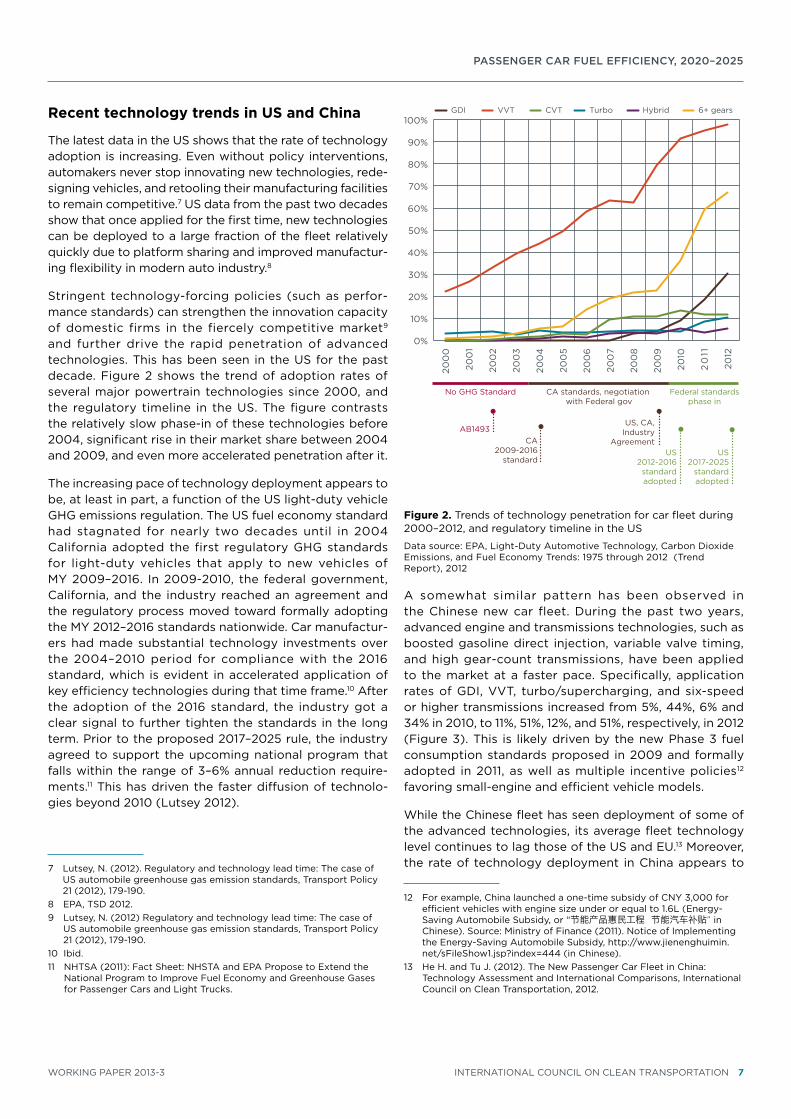
Stringent technology-forcing policies (such as perfor-mance standards) can strengthen the innovation capacity of domestic firms in the fiercely competitive market9 and further drive the rapid penetration of advanced technologies. this has been seen in the US for the past decade. Figure 2 shows the trend of adoption rates of several major powertrain technologies since 2000, and the regulatory timeline in the US. the figure contrasts the relatively slow phase-in of these technologies before 2004, significant rise in their market share between 2004 and 2009, and even more accelerated penetration after it.
the increasing pace of technology deployment appears to be, at least in part, a function of the US light-duty vehicle ghg emissions regulation. the US fuel economy standard had stagnated for nearly two decades until in 2004 california adopted the first regulatory ghg standards for light-duty vehicles that apply to new vehicles of MY 2009–2016. in 2009-2010, the federal government, california, and the industry reached an agreement and the regulatory process moved toward formally adopting the MY 2012–2016 standards nationwide. car manufactur-ers had made substantial technology investments over the 2004–2010 period for compliance with the 2016 standard, which is evident in accelerated application of key efficiency technologies during that time frame.10 After the adoption of the 2016 standard, the industry got a clear signal to further tighten the standards in the long term. Prior to the proposed 2017–2025 rule, the industry agreed to support the upcoming national program that falls within the range of 3–6% annual reduction require-ments.11 this has driven the faster diffusion of technolo-gies beyond 2010 (Lutsey 2012).
7 Lutsey, n. (2012). regulatory and technology lead time: the case of US automobile greenhouse gas emission standards, transport Policy 21 (2012), 179-190.
8 ePA, tSD 2012.9 Lutsey, n. (2012) regulatory and technology lead time: the case of
US automobile greenhouse gas emission standards, transport Policy 21 (2012), 179-190.
10 ibid.11 nhtSA (2011): Fact Sheet: nhStA and ePA Propose to extend the
national Program to improve Fuel economy and greenhouse gases for Passenger cars and Light trucks.
0%
10%
20%
30%
40%
50%
60%
70%
80%
90%
100%
200
0
200
1
200
2
200
3
200
4
200
5
200
6
200
7
200
8
200
9
2010
20
11
2012
GDI TurboVVT HybridCVT 6+ gears
No GHG Standard CA standards, negotiation with Federal gov
Federal standardsphase in
AB1493CA
2009-2016 standard
US, CA,Industry
AgreementUS
2012-2016standardadopted
US2017-2025
standardadopted
Figure 2. trends of technology penetration for car fleet during 2000–2012, and regulatory timeline in the US
Data source: ePA, Light-Duty Automotive technology, carbon Dioxide emissions, and Fuel economy trends: 1975 through 2012 (trend report), 2012
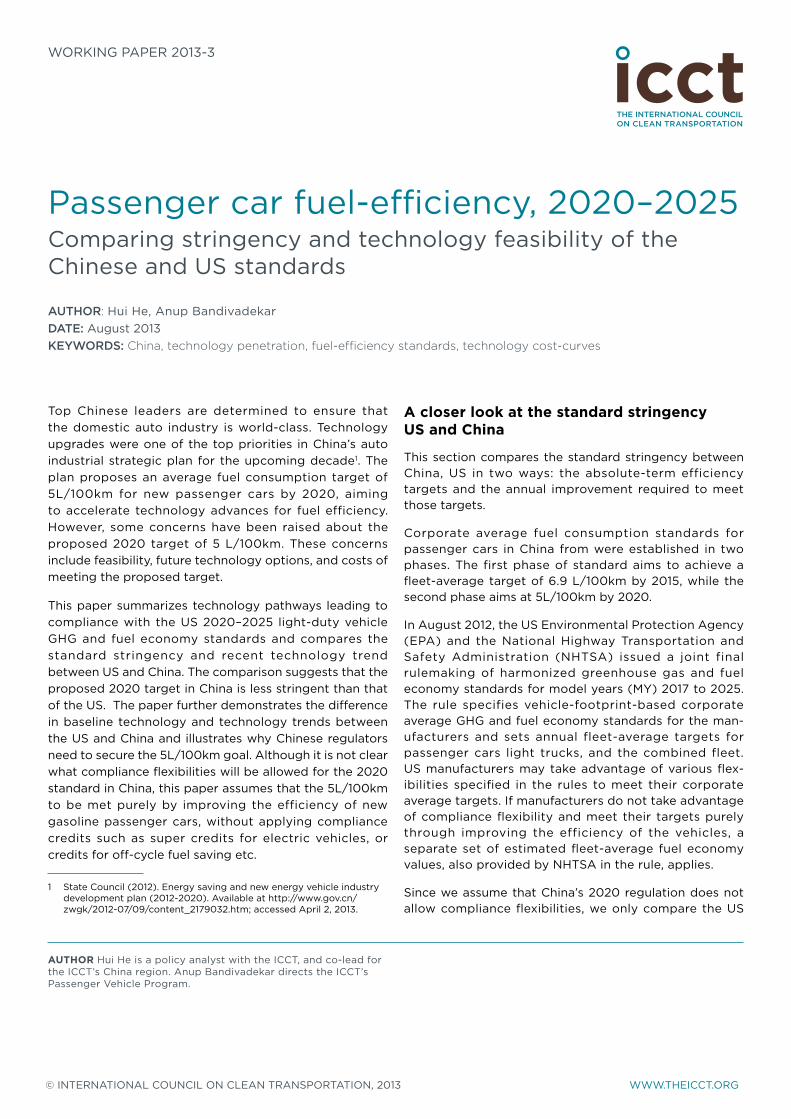
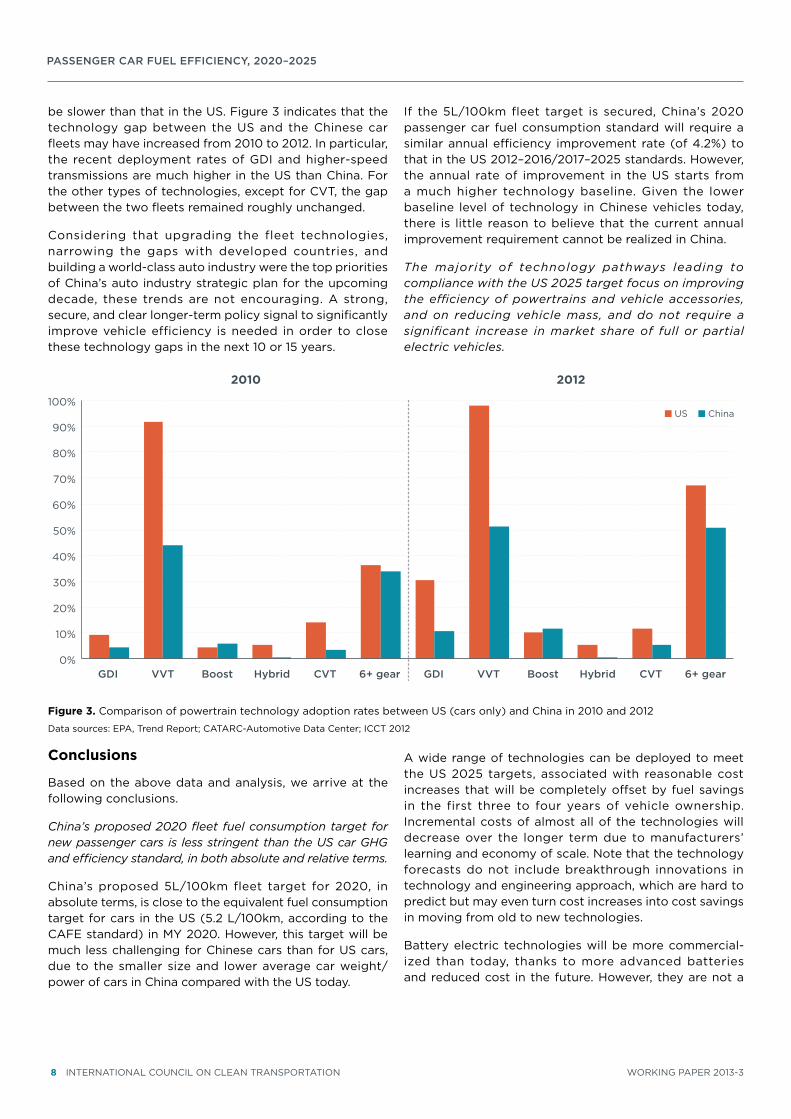
A somewhat similar pattern has been observed in the chinese new car fleet. During the past two years, advanced engine and transmissions technologies, such as boosted gasoline direct injection, variable valve timing, and high gear-count transmissions, have been applied to the market at a faster pace. Specifically, application rates of gDi, VVt, turbo/supercharging, and six-speed or higher transmissions increased from 5%, 44%, 6% and 34% in 2010, to 11%, 51%, 12%, and 51%, respectively, in 2012 (Figure 3). this is likely driven by the new Phase 3 fuel consumption standards proposed in 2009 and formally adopted in 2011, as well as multiple incentive policies12 favoring small-engine and efficient vehicle models.
while the chinese fleet has seen deployment of some of the advanced technologies, its average fleet technology level continues to lag those of the US and eU.13 Moreover, the rate of technology deployment in china appears to
12 For example, china launched a one-time subsidy of cnY 3,000 for efficient vehicles with engine size under or equal to 1.6L (energy-Saving Automobile Subsidy, or “节能产品惠民工程 节能汽车补贴” in chinese). Source: Ministry of Finance (2011). notice of implementing the energy-Saving Automobile Subsidy, http://www.jienenghuimin.net/sFileShow1.jsp?index=444 (in chinese).
13 he h. and tu J. (2012). the new Passenger car Fleet in china: technology Assessment and international comparisons, international council on clean transportation, 2012.
Passenger car fuel efficiency, 2020–2025
8 internAtionAL coUnciL on cLeAn trAnSPortAtion working PAPer 2013-3
be slower than that in the US. Figure 3 indicates that the technology gap between the US and the chinese car fleets may have increased from 2010 to 2012. in particular, the recent deployment rates of gDi and higher-speed transmissions are much higher in the US than china. For the other types of technologies, except for cVt, the gap between the two fleets remained roughly unchanged.
considering that upgrading the fleet technologies, narrowing the gaps with developed countries, and building a world-class auto industry were the top priorities of china’s auto industry strategic plan for the upcoming decade, these trends are not encouraging. A strong, secure, and clear longer-term policy signal to significantly improve vehicle efficiency is needed in order to close these technology gaps in the next 10 or 15 years.
0%
10%
20%
30%
40%
50%
60%
70%
80%
90%
100%
GDI VVT Boost Hybrid CVT 6+ gear GDI VVT Boost Hybrid CVT 6+ gear
2010 2012
US China
Conclusions
Based on the above data and analysis, we arrive at the following conclusions.
China’s proposed 2020 fleet fuel consumption target for new passenger cars is less stringent than the US car GHG and efficiency standard, in both absolute and relative terms.
china’s proposed 5L/100km fleet target for 2020, in absolute terms, is close to the equivalent fuel consumption target for cars in the US (5.2 L/100km, according to the cAFe standard) in MY 2020. however, this target will be much less challenging for chinese cars than for US cars, due to the smaller size and lower average car weight/power of cars in china compared with the US today.
if the 5L/100km fleet target is secured, china’s 2020 passenger car fuel consumption standard will require a similar annual efficiency improvement rate (of 4.2%) to that in the US 2012–2016/2017–2025 standards. however, the annual rate of improvement in the US starts from a much higher technology baseline. given the lower baseline level of technology in chinese vehicles today, there is little reason to believe that the current annual improvement requirement cannot be realized in china.
The majority of technology pathways leading to compliance with the US 2025 target focus on improving the efficiency of powertrains and vehicle accessories, and on reducing vehicle mass, and do not require a significant increase in market share of full or partial electric vehicles.
A wide range of technologies can be deployed to meet the US 2025 targets, associated with reasonable cost increases that will be completely offset by fuel savings in the first three to four years of vehicle ownership. incremental costs of almost all of the technologies will decrease over the longer term due to manufacturers’ learning and economy of scale. note that the technology forecasts do not include breakthrough innovations in technology and engineering approach, which are hard to predict but may even turn cost increases into cost savings in moving from old to new technologies.
Battery electric technologies will be more commercial-ized than today, thanks to more advanced batteries and reduced cost in the future. however, they are not a
Figure 3. comparison of powertrain technology adoption rates between US (cars only) and china in 2010 and 2012
Data sources: ePA, trend report; cAtArc-Automotive Data center; icct 2012
Passenger car fuel efficiency, 2020–2025
working PAPer 2013-3 internAtionAL coUnciL on cLeAn trAnSPortAtion 9
significant contributor to the compliance of the US 2025 light-duty vehicle ghg/fuel efficiency targets. the ePA projects that the market penetration of PheV/eVs will be 1–2% of the entire light-duty vehicle fleet, or 1–3% of the passenger car fleet between 2021 and 2025. in fact, engine, transmission, and whole vehicle improvements, along with hybridization and mass reduction, altogether will reduce fuel consumption by about 42–48% for smaller car categories.
Stringent regulatory standards can give a strong push for technology innovation and deployment. Without clear, secured, stringent longer-term efficiency goals, China’s auto industry will lag even further behind that of the US.
the US data show rapid technology diffusion in recent years. this is primarily a result of the technology devel-opment and investments of the US manufacturers in response to the stringent US 2016 and 2025 standards. the long lead time offered by both regulations allows automakers time to redesign their vehicles and to gear up their manufacturing capacity, which helps reduce their long-term costs.
in china, advanced powertrain technologies are applied more widely in the market nowadays than before, but at a slower pace than that in the US. officials must signal the chinese automakers with clear, secured and stringent longer-term vehicle efficiency targets (including the 2020 target of 5L/100km) to allow them to invest in technology deployment and production adjustments as early as possible. without such a clear policy signal, technology development and deployment in china will likely continue to lag the US and eU manufacturers.
recommendations
What’s missing in China to secure stringent long-term fuel efficiency goals?
the rational behind the chinese car fuel efficiency standards is as much a matter of industrial policy as it is of energy and environmental policy. hoping to catch up with developed countries as early as possible, chinese political leaders tend to set their targets in line with those of europe, US, or Japan in absolute terms. to evaluate the feasibility and associated costs of these targets, regulators and research institutes usually take a “traditional” approach—consulting with the industry. only in recent years has china begun to systematically collect and analyze data of vehicle fleet features and technolo-gies. china has yet to establish sophisticated modeling tools similar to what the ePA developed for the US ghg/fuel economy standard rulemaking.
relying on manufacturers’ information alone for determin-ing the feasibility and cost of fuel consumption standards can lead to biased results (inconsistent and often under-estimated benefits of technologies, higher cost estimates, etc.). this in turn tends to dilute the stringency of the standards to a level that does not provide meaningful motivation for the chinese domestic industry to catch up with the global best practices.
Fortunately, most of the information from europe and the US, with appropriate modification of assumptions, can be applied to china (the last section of the Appendix lays out icct’s ongoing work for the european technology and cost assessment that can be adapted to china). it is recommended that china develop its own scientific approaches and researches to support its future regulation and policymaking.
Passenger car fuel efficiency, 2020–2025
10 internAtionAL coUnciL on cLeAn trAnSPortAtion working PAPer 2013-3
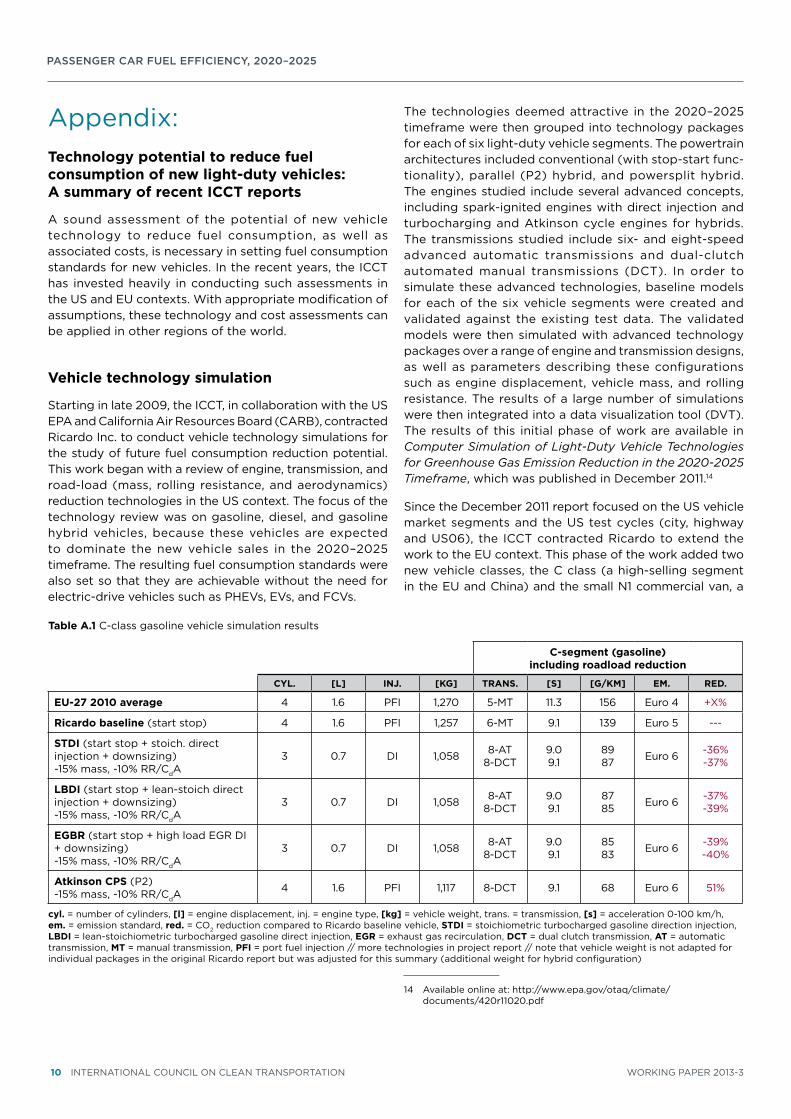
Appendix: technology potential to reduce fuel consumption of new light-duty vehicles: A summary of recent iCCt reports
A sound assessment of the potential of new vehicle technology to reduce fuel consumption, as well as associated costs, is necessary in setting fuel consumption standards for new vehicles. in the recent years, the icct has invested heavily in conducting such assessments in the US and eU contexts. with appropriate modification of assumptions, these technology and cost assessments can be applied in other regions of the world.
vehicle technology simulation
Starting in late 2009, the icct, in collaboration with the US ePA and california Air resources Board (cArB), contracted ricardo inc. to conduct vehicle technology simulations for the study of future fuel consumption reduction potential. this work began with a review of engine, transmission, and road-load (mass, rolling resistance, and aerodynamics) reduction technologies in the US context. the focus of the technology review was on gasoline, diesel, and gasoline hybrid vehicles, because these vehicles are expected to dominate the new vehicle sales in the 2020–2025 timeframe. the resulting fuel consumption standards were also set so that they are achievable without the need for electric-drive vehicles such as PheVs, eVs, and FcVs.
the technologies deemed attractive in the 2020–2025 timeframe were then grouped into technology packages for each of six light-duty vehicle segments. the powertrain architectures included conventional (with stop-start func-tionality), parallel (P2) hybrid, and powersplit hybrid. the engines studied include several advanced concepts, including spark-ignited engines with direct injection and turbocharging and Atkinson cycle engines for hybrids. the transmissions studied include six- and eight-speed advanced automatic transmissions and dual-clutch automated manual transmissions (Dct). in order to simulate these advanced technologies, baseline models for each of the six vehicle segments were created and validated against the existing test data. the validated models were then simulated with advanced technology packages over a range of engine and transmission designs, as well as parameters describing these configurations such as engine displacement, vehicle mass, and rolling resistance. the results of a large number of simulations were then integrated into a data visualization tool (DVt). the results of this initial phase of work are available in Computer Simulation of Light-Duty Vehicle Technologies for Greenhouse Gas Emission Reduction in the 2020-2025 Timeframe, which was published in December 2011.14
Since the December 2011 report focused on the US vehicle market segments and the US test cycles (city, highway and US06), the icct contracted ricardo to extend the work to the eU context. this phase of the work added two new vehicle classes, the c class (a high-selling segment in the eU and china) and the small n1 commercial van, a
14 Available online at: http://www.epa.gov/otaq/climate/documents/420r11020.pdf
table A.1 c-class gasoline vehicle simulation results
C-segment (gasoline) including roadload reduction
CYL. [L] iNj. [kg] trANS. [S] [g/kM] EM. rED.
EU-27 2010 average 4 1.6 PFi 1,270 5-Mt 11.3 156 euro 4 +X%
ricardo baseline (start stop) 4 1.6 PFi 1,257 6-Mt 9.1 139 euro 5 ---
StDi (start stop + stoich. direct injection + downsizing) -15% mass, -10% rr/cdA
3 0.7 Di 1,058 8-At 8-Dct
9.09.1
8987 euro 6 -36%
-37%
LbDi (start stop + lean-stoich direct injection + downsizing) -15% mass, -10% rr/cdA
3 0.7 Di 1,058 8-At 8-Dct
9.09.1
8785 euro 6 -37%
-39%
Egbr (start stop + high load egr Di + downsizing) -15% mass, -10% rr/cdA
3 0.7 Di 1,058 8-At 8-Dct
9.09.1
8583 euro 6 -39%
-40%
Atkinson CpS (P2) -15% mass, -10% rr/cdA
4 1.6 PFi 1,117 8-Dct 9.1 68 euro 6 51%
cyl. = number of cylinders, [l] = engine displacement, inj. = engine type, [kg] = vehicle weight, trans. = transmission, [s] = acceleration 0-100 km/h, em. = emission standard, red. = co2 reduction compared to ricardo baseline vehicle, StDi = stoichiometric turbocharged gasoline direction injection, LbDi = lean-stoichiometric turbocharged gasoline direct injection, Egr = exhaust gas recirculation, DCt = dual clutch transmission, At = automatic transmission, Mt = manual transmission, pFi = port fuel injection // more technologies in project report // note that vehicle weight is not adapted for individual packages in the original ricardo report but was adjusted for this summary (additional weight for hybrid configuration)
Passenger car fuel efficiency, 2020–2025
working PAPer 2013-3 internAtionAL coUnciL on cLeAn trAnSPortAtion 11
new advanced european diesel engine model, as well as a manual transmission for all vehicle classes. in addition, this study built on the previous study by evaluating fuel consumption for all vehicles in both the US and eU studies over the new european Driving cycle (neDc) and a similar mixed cycle for Japan, the Jc08. the results of this work are available in a separate report, Analysis of Greenhouse Gas Emission Reduction Potential of Light Duty Vehicle Technologies in the European Union for 2020–2025.15
15 the report and the DVt are available online at: http://www.theicct.org/ghg-emission-reduction-potential-ldv-technologies-eu-2020-2025.
representative results from the technology assessment are shown in table A.1. the table shows data extracted from the DVt as applicable to the eU c-class gasoline vehicle. note that the ricardo baseline vehicle uses an improved alternator and engine idle-off technologies, which are not yet commonplace, although they are expected to be available on nearly all vehicles by 2020. Downsizing the engine by using a turbocharger while switching to direct injection of gasoline, moving towards eight-speed dual
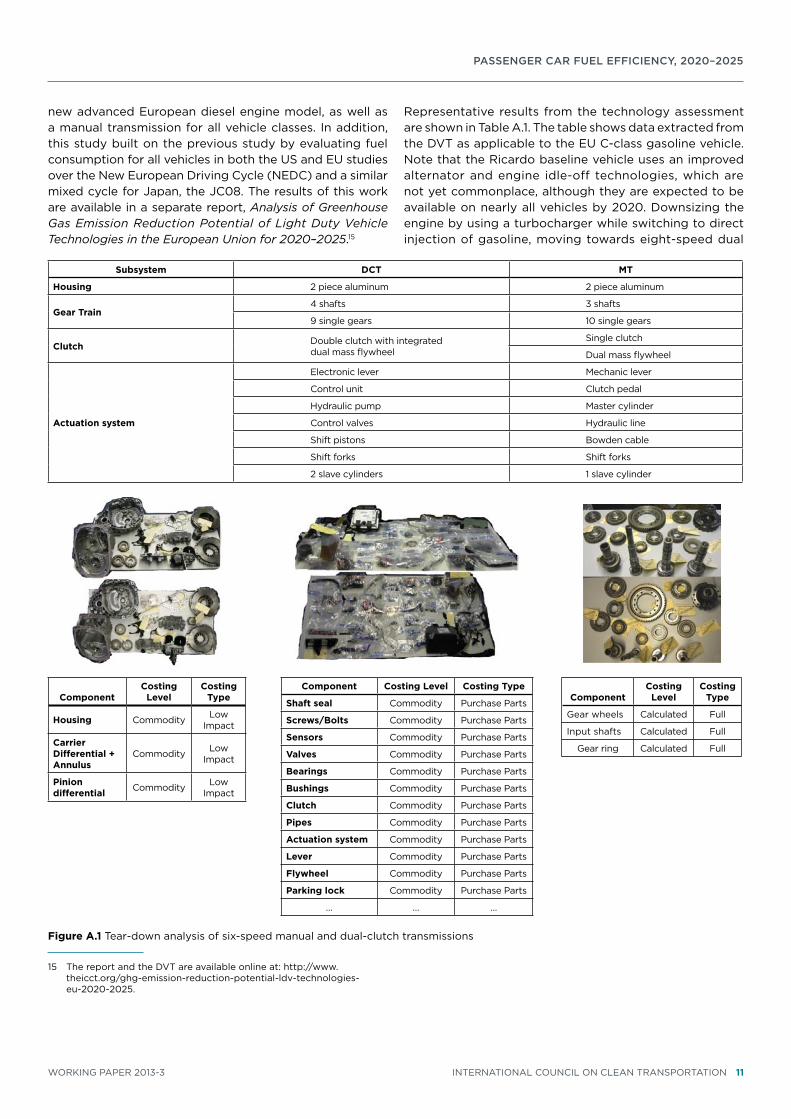
Figure A.1 tear-down analysis of six-speed manual and dual-clutch transmissions
Subsystem DCt Mt
housing 2 piece aluminum 2 piece aluminum
gear train4 shafts 3 shafts
9 single gears 10 single gears
Clutch Double clutch with integrated dual mass flywheel
Single clutch
Dual mass flywheel
Actuation system
electronic lever Mechanic lever
control unit clutch pedal
hydraulic pump Master cylinder
control valves hydraulic line
Shift pistons Bowden cable
Shift forks Shift forks
2 slave cylinders 1 slave cylinder
ComponentCosting
LevelCosting
type
gear wheels calculated Full
input shafts calculated Full
gear ring calculated Full
ComponentCosting
LevelCosting
type
housing commodity Low impact
Carrier Differential + Annulus
commodity Low impact
pinion differential commodity Low
impact
Component Costing Level Costing type
Shaft seal commodity Purchase Parts
Screws/bolts commodity Purchase Parts
Sensors commodity Purchase Parts
valves commodity Purchase Parts
bearings commodity Purchase Parts
bushings commodity Purchase Parts
Clutch commodity Purchase Parts
pipes commodity Purchase Parts
Actuation system commodity Purchase Parts
Lever commodity Purchase Parts
Flywheel commodity Purchase Parts
parking lock commodity Purchase Parts
… … …
Passenger car fuel efficiency, 2020–2025
12 internAtionAL coUnciL on cLeAn trAnSPortAtion working PAPer 2013-3
clutch transmissions, and reducing the road load (mass by 15%, rolling resistance and aerodynamics by 10% each) will further reduce the fuel consumption of an average c-class vehicle by 37%—well above the reduction required by the 2020 eU standard even as the emission standards move from euro 5 at present to euro 6 in 2014.
tear-down cost assessments
in order to assess the cost of transitioning to the advanced technologies, a tear-down approach was used. the tear-down approach is fundamentally different than the traditional approach of surveying manufacturers and suppliers for the costs of current (potentially low-volume) technologies and projecting these costs into the future. instead, the tear-down approach accurately estimates the costs of a mass-production technology in the future, using detailed assessments of materials and processes required to make each particular component.
Figure A.1 shows an example of how the tear-down approach evaluates the cost difference between a six-speed manual transmission and a six-speed dual clutch transmission. the two transmissions are taken apart into their subcomponents so that differences between key components can be easily identified. Depending upon component complexity, differences in part shape, size, manufacturing process, and materials, the costs are evaluated at different levels of detail.
the detailed tear-down analysis work was performed by FeV inc. for the icct in two phases. the Phase 1 report focused on the transfer and conversion into the european market of information and results from existing advance vehicle powertrain cost analysis studies on US vehicles and manufacturing cost structure, which FeV performed for the ePA.16 Advance powertrain technologies studied in the Phase 1 analysis work included downsized, turbo-charged, gasoline direct injection engine, six-speed vs. eight-speed automatic and dual clutch transmissions, and power-split and P2 hybrid electric vehicles.
16 the peer-reviewed US reports are available at: http://www.epa.gov/otaq/climate/420r09020.pdf and http://www.epa.gov/otaq/climate/420r10010.pdf. the icct Phase 1 and 2 reports are available at: http://www.theicct.org/light-duty-vehicle-technology-cost-analysis-european-vehicle-market.
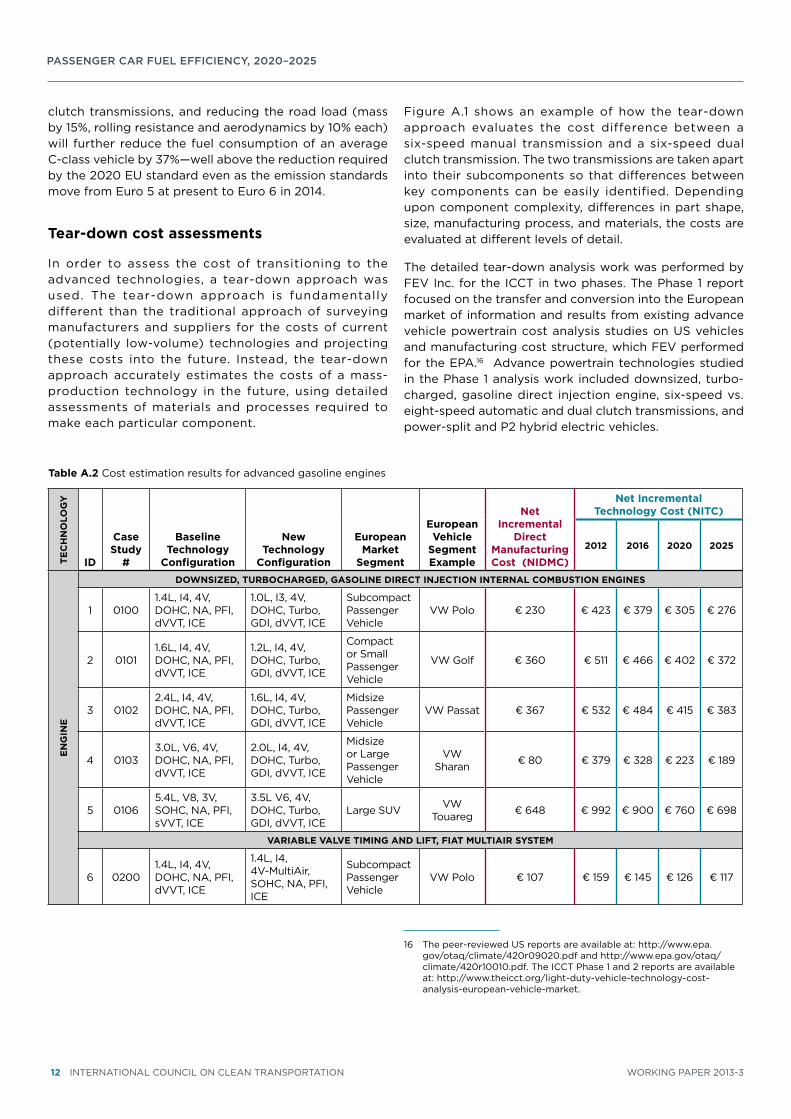
table A.2 cost estimation results for advanced gasoline engines
tEC
hN
oLo
gY
iD
Case Study
#
baseline technology
Configuration
New technology
Configuration
European Market
Segment
European vehicle
Segment Example
Net incremental
Direct Manufacturing Cost (NiDMC)
Net incremental technology Cost (NitC)
2012 2016 2020 2025
EN
giN
E
DowNSizED, tUrboChArgED, gASoLiNE DirECt iNjECtioN iNtErNAL CoMbUStioN ENgiNES
1 01001.4L, i4, 4V, Dohc, nA, PFi, dVVt, ice
1.0L, i3, 4V, Dohc, turbo, gDi, dVVt, ice
Subcompact Passenger Vehicle
Vw Polo € 230 € 423 € 379 € 305 € 276
2 01011.6L, i4, 4V, Dohc, nA, PFi, dVVt, ice
1.2L, i4, 4V, Dohc, turbo, gDi, dVVt, ice
compact or Small Passenger Vehicle
Vw golf € 360 € 511 € 466 € 402 € 372
3 01022.4L, i4, 4V, Dohc, nA, PFi, dVVt, ice
1.6L, i4, 4V, Dohc, turbo, gDi, dVVt, ice
Midsize Passenger Vehicle
Vw Passat € 367 € 532 € 484 € 415 € 383
4 01033.0L, V6, 4V, Dohc, nA, PFi, dVVt, ice
2.0L, i4, 4V, Dohc, turbo, gDi, dVVt, ice
Midsize or Large Passenger Vehicle
Vw Sharan € 80 € 379 € 328 € 223 € 189
5 01065.4L, V8, 3V, Sohc, nA, PFi, sVVt, ice
3.5L V6, 4V, Dohc, turbo, gDi, dVVt, ice
Large SUV Vw touareg € 648 € 992 € 900 € 760 € 698
vAriAbLE vALvE tiMiNg AND LiFt, FiAt MULtiAir SYStEM
6 02001.4L, i4, 4V, Dohc, nA, PFi, dVVt, ice
1.4L, i4, 4V-MultiAir, Sohc, nA, PFi, ice
Subcompact Passenger Vehicle
Vw Polo € 107 € 159 € 145 € 126 € 117
Passenger car fuel efficiency, 2020–2025
working PAPer 2013-3 internAtionAL coUnciL on cLeAn trAnSPortAtion 13
the icct contracted with FeV for additional analyses of the net incremental costs for additional advanced light-duty vehicle technologies for the european vehicle market. Advanced powertrain technologies studied in the Phase 2 work included diesel high-pressure injection, diesel variable valve timing and lift systems, diesel high- and low-pressure cooled exhaust gas recirculation (egr), gasoline low-pressure cooled egr, comparison of six-speed dry dual clutch transmission to 6-speed manual transmission, and belt-driven starter-generator (BSg) stop-start system. the Phase 2 work also encom-passes an overview of market applications of start-stop systems for automobiles in europe.
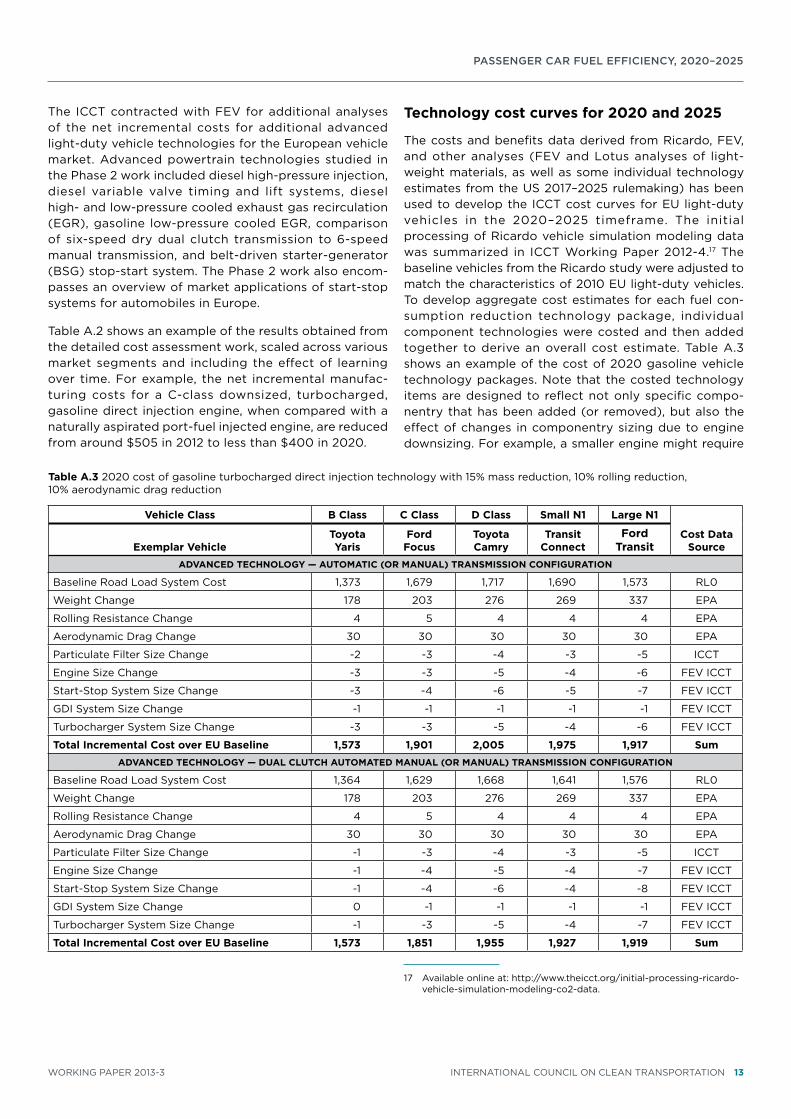
table A.2 shows an example of the results obtained from the detailed cost assessment work, scaled across various market segments and including the effect of learning over time. For example, the net incremental manufac-turing costs for a c-class downsized, turbocharged, gasoline direct injection engine, when compared with a naturally aspirated port-fuel injected engine, are reduced from around $505 in 2012 to less than $400 in 2020.
technology cost curves for 2020 and 2025
the costs and benefits data derived from ricardo, FeV, and other analyses (FeV and Lotus analyses of light-weight materials, as well as some individual technology estimates from the US 2017–2025 rulemaking) has been used to develop the icct cost curves for eU light-duty vehicles in the 2020–2025 timeframe. the initial processing of ricardo vehicle simulation modeling data was summarized in icct working Paper 2012-4.17 the baseline vehicles from the ricardo study were adjusted to match the characteristics of 2010 eU light-duty vehicles. to develop aggregate cost estimates for each fuel con-sumption reduction technology package, individual component technologies were costed and then added together to derive an overall cost estimate. table A.3 shows an example of the cost of 2020 gasoline vehicle technology packages. note that the costed technology items are designed to reflect not only specific compo-nentry that has been added (or removed), but also the effect of changes in componentry sizing due to engine downsizing. For example, a smaller engine might require
17 Available online at: http://www.theicct.org/initial-processing-ricardo-vehicle-simulation-modeling-co2-data.
table A.3 2020 cost of gasoline turbocharged direct injection technology with 15% mass reduction, 10% rolling reduction, 10% aerodynamic drag reduction
vehicle Class b Class C Class D Class Small N1 Large N1
Cost Data SourceExemplar vehicle
toyota Yaris
Ford Focus
toyota Camry
transit Connect
Ford transit
ADvANCED tEChNoLogY — AUtoMAtiC (or MANUAL) trANSMiSSioN CoNFigUrAtioN
Baseline road Load System cost 1,373 1,679 1,717 1,690 1,573 rL0
weight change 178 203 276 269 337 ePA
rolling resistance change 4 5 4 4 4 ePA
Aerodynamic Drag change 30 30 30 30 30 ePA
Particulate Filter Size change -2 -3 -4 -3 -5 icct
engine Size change -3 -3 -5 -4 -6 FeV icct
Start-Stop System Size change -3 -4 -6 -5 -7 FeV icct
gDi System Size change -1 -1 -1 -1 -1 FeV icct
turbocharger System Size change -3 -3 -5 -4 -6 FeV icct
total incremental Cost over EU baseline 1,573 1,901 2,005 1,975 1,917 SumADvANCED tEChNoLogY — DUAL CLUtCh AUtoMAtED MANUAL (or MANUAL) trANSMiSSioN CoNFigUrAtioN
Baseline road Load System cost 1,364 1,629 1,668 1,641 1,576 rL0
weight change 178 203 276 269 337 ePA
rolling resistance change 4 5 4 4 4 ePA
Aerodynamic Drag change 30 30 30 30 30 ePA
Particulate Filter Size change -1 -3 -4 -3 -5 icct
engine Size change -1 -4 -5 -4 -7 FeV icct
Start-Stop System Size change -1 -4 -6 -4 -8 FeV icct
gDi System Size change 0 -1 -1 -1 -1 FeV icct
turbocharger System Size change -1 -3 -5 -4 -7 FeV icct
total incremental Cost over EU baseline 1,573 1,851 1,955 1,927 1,919 Sum
Passenger car fuel efficiency, 2020–2025
14 internAtionAL coUnciL on cLeAn trAnSPortAtion working PAPer 2013-3
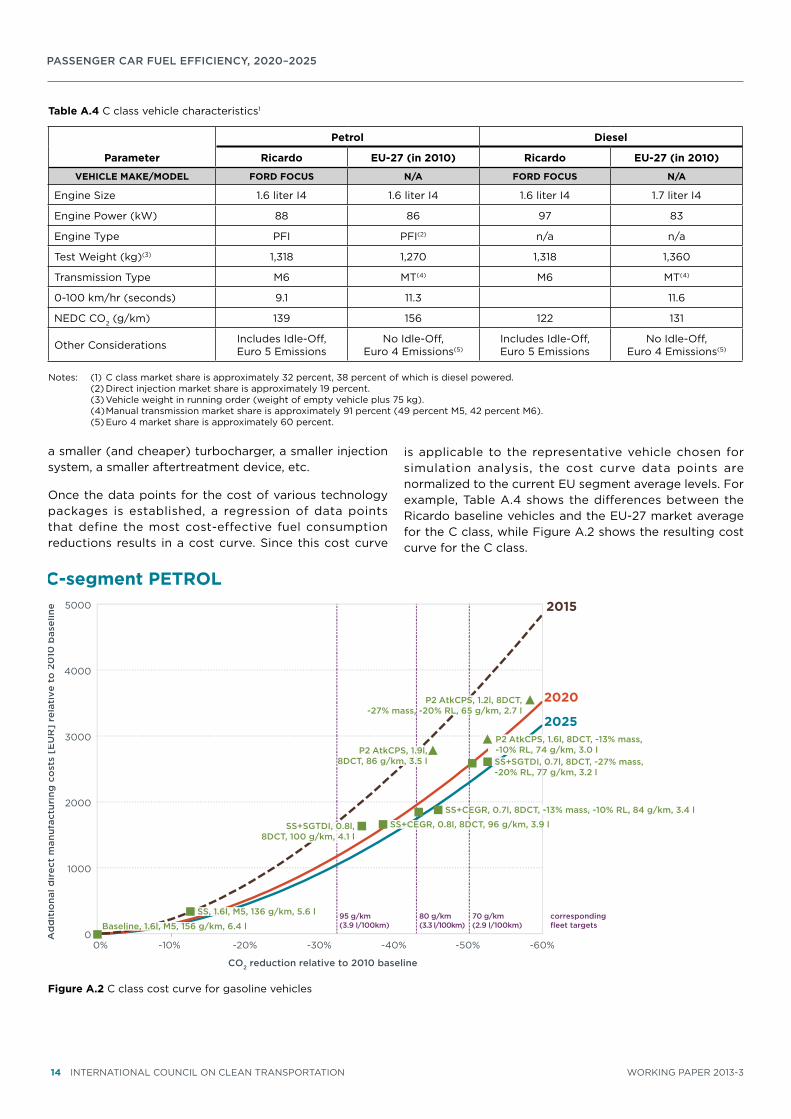
a smaller (and cheaper) turbocharger, a smaller injection system, a smaller aftertreatment device, etc.
once the data points for the cost of various technology packages is established, a regression of data points that define the most cost-effective fuel consumption reductions results in a cost curve. Since this cost curve
is applicable to the representative vehicle chosen for simulation analysis, the cost curve data points are normalized to the current eU segment average levels. For example, table A.4 shows the differences between the ricardo baseline vehicles and the eU-27 market average for the c class, while Figure A.2 shows the resulting cost curve for the c class.
table A.4 c class vehicle characteristics1
parameter
petrol Diesel
ricardo EU-27 (in 2010) ricardo EU-27 (in 2010)
vEhiCLE MAkE/MoDEL ForD FoCUS N/A ForD FoCUS N/A
engine Size 1.6 liter i4 1.6 liter i4 1.6 liter i4 1.7 liter i4
engine Power (kw) 88 86 97 83
engine type PFi PFi(2) n/a n/a
test weight (kg)(3) 1,318 1,270 1,318 1,360
transmission type M6 Mt(4) M6 Mt(4)
0-100 km/hr (seconds) 9.1 11.3 11.6
neDc co2 (g/km) 139 156 122 131
other considerations includes idle-off, euro 5 emissions
no idle-off, euro 4 emissions(5)
includes idle-off, euro 5 emissions
no idle-off, euro 4 emissions(5)
notes: (1) c class market share is approximately 32 percent, 38 percent of which is diesel powered. (2) Direct injection market share is approximately 19 percent. (3) Vehicle weight in running order (weight of empty vehicle plus 75 kg). (4) Manual transmission market share is approximately 91 percent (49 percent M5, 42 percent M6). (5) euro 4 market share is approximately 60 percent.
0
1000
2000
3000
4000
5000
-60% -50% -40% -30% -20% -10% 0%
Ad
dit
iona
l dir
ect
man
ufac
turi
ng c
ost
s [E
UR
] re
lati
ve t
o 2
010
bas
elin
e
CO2 reduction relative to 2010 baseline
C-segment PETROL
80 g/km(3.3 l/100km)
70 g/km(2.9 l/100km)
95 g/km(3.9 l/100km)
Baseline, 1.6l, M5, 156 g/km, 6.4 l
SS, 1.6l, M5, 136 g/km, 5.6 l
SS+SGTDI, 0.8l, 8DCT, 100 g/km, 4.1 l
P2 AtkCPS, 1.2l, 8DCT, -27% mass, -20% RL, 65 g/km, 2.7 l
P2 AtkCPS, 1.9l, 8DCT, 86 g/km, 3.5 l
2015
2020
2025
SS+CEGR, 0.8l, 8DCT, 96 g/km, 3.9 l
P2 AtkCPS, 1.6l, 8DCT, -13% mass, -10% RL, 74 g/km, 3.0 l SS+SGTDI, 0.7l, 8DCT, -27% mass, -20% RL, 77 g/km, 3.2 l
SS+CEGR, 0.7l, 8DCT, -13% mass, -10% RL, 84 g/km, 3.4 l
corresponding fleet targets
Figure A.2 c class cost curve for gasoline vehicles
Passenger car fuel efficiency, 2020–2025
working PAPer 2013-3 internAtionAL coUnciL on cLeAn trAnSPortAtion 15
0
500
1000
1500
2000
2500
3000
-60% -50% -40% -30% -20% -10% 0%
corresponding fleet targets
CO2 / fuel consumption relative to 2010 baseline
Ad
dit
iona
l dir
ect
man
ufac
turi
ng c
ost
s [E
UR
] re
lati
ve t
o 2
010
bas
elin
e
95g /km in 2020:Investment in technology: <1000 € / vehicle
[ICCT, 2013]
Fuel cost savings: ≈350-450 € / year [BEUC, 2012]
Avoided oil imports: ≈160 million tons 2020-2030 [EC, 2012]
Reduction in CO2: ≈420 million tons 2020-2030 [EC, 2012]
excl. mass reduction
min.
max.
2012109 g/km
2010159 g/km
2010164 g/km
201279 g/km
(Hybrid)
-31%
-52%
Toyota Yaris
Ford Focus
95
g/k
m
90
g/k
m
80
g/k
m
70 g
/km
60
g/k
m
excl. mass reduction
mas
min.
max.
2020
incl. mass reduction
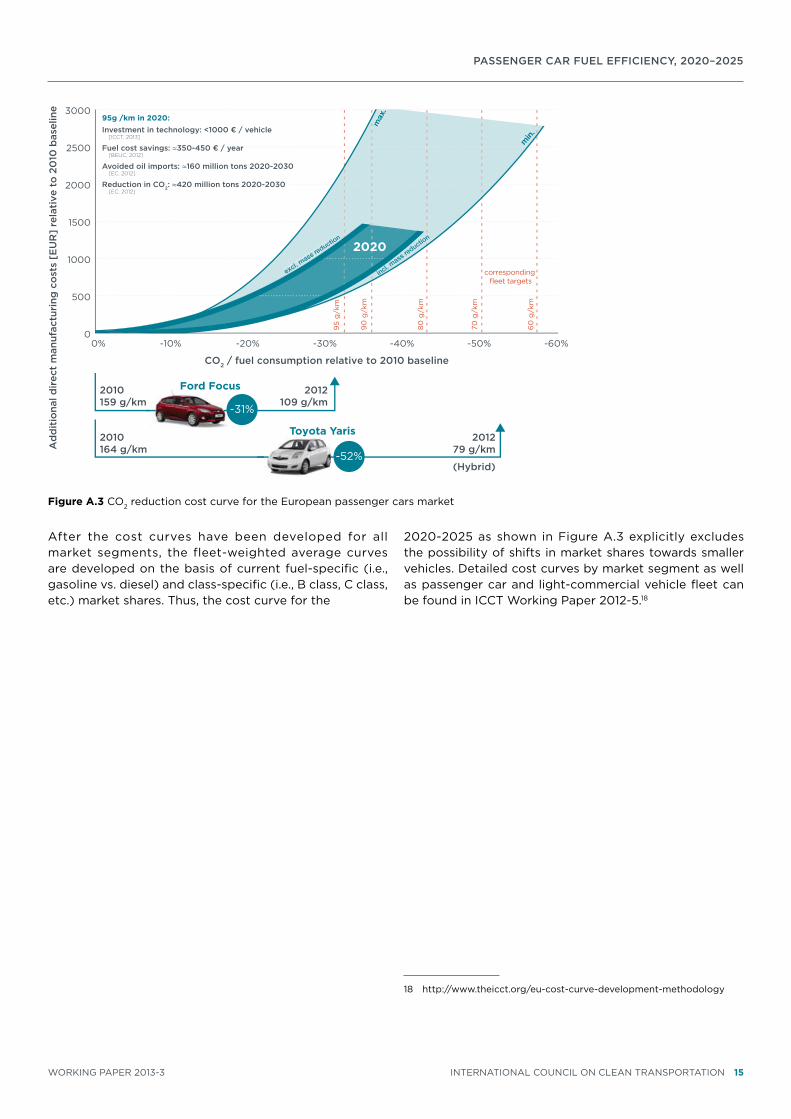
Figure A.3 co2 reduction cost curve for the european passenger cars market
After the cost curves have been developed for all market segments, the fleet-weighted average curves are developed on the basis of current fuel-specific (i.e., gasoline vs. diesel) and class-specific (i.e., B class, c class, etc.) market shares. thus, the cost curve for the
2020-2025 as shown in Figure A.3 explicitly excludes the possibility of shifts in market shares towards smaller vehicles. Detailed cost curves by market segment as well as passenger car and light-commercial vehicle fleet can be found in icct working Paper 2012-5.18
18 http://www.theicct.org/eu-cost-curve-development-methodology
Passenger car fuel efficiency, 2020–2025
16 internAtionAL coUnciL on cLeAn trAnSPortAtion working PAPer 2013-3
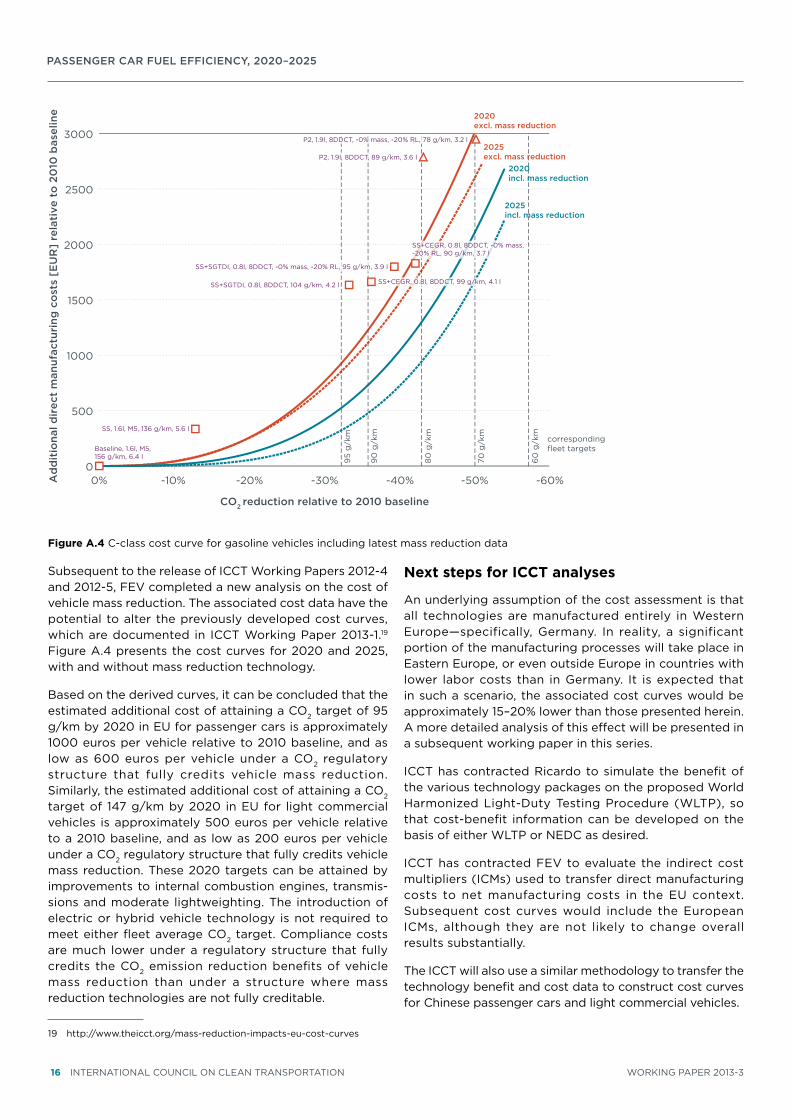
Subsequent to the release of icct working Papers 2012-4 and 2012-5, FeV completed a new analysis on the cost of vehicle mass reduction. the associated cost data have the potential to alter the previously developed cost curves, which are documented in icct working Paper 2013-1.19 Figure A.4 presents the cost curves for 2020 and 2025, with and without mass reduction technology.
Based on the derived curves, it can be concluded that the estimated additional cost of attaining a co2 target of 95 g/km by 2020 in eU for passenger cars is approximately 1000 euros per vehicle relative to 2010 baseline, and as low as 600 euros per vehicle under a co2 regulatory structure that fully credits vehicle mass reduction. Similarly, the estimated additional cost of attaining a co2 target of 147 g/km by 2020 in eU for light commercial vehicles is approximately 500 euros per vehicle relative to a 2010 baseline, and as low as 200 euros per vehicle under a co2 regulatory structure that fully credits vehicle mass reduction. these 2020 targets can be attained by improvements to internal combustion engines, transmis-sions and moderate lightweighting. the introduction of electric or hybrid vehicle technology is not required to meet either fleet average co2 target. compliance costs are much lower under a regulatory structure that fully credits the co2 emission reduction benefits of vehicle mass reduction than under a structure where mass reduction technologies are not fully creditable.
19 http://www.theicct.org/mass-reduction-impacts-eu-cost-curves
Next steps for iCCt analyses
An underlying assumption of the cost assessment is that all technologies are manufactured entirely in western europe—specifically, germany. in reality, a significant portion of the manufacturing processes will take place in eastern europe, or even outside europe in countries with lower labor costs than in germany. it is expected that in such a scenario, the associated cost curves would be approximately 15–20% lower than those presented herein. A more detailed analysis of this effect will be presented in a subsequent working paper in this series.
icct has contracted ricardo to simulate the benefit of the various technology packages on the proposed world harmonized Light-Duty testing Procedure (wLtP), so that cost-benefit information can be developed on the basis of either wLtP or neDc as desired.
icct has contracted FeV to evaluate the indirect cost multipliers (icMs) used to transfer direct manufacturing costs to net manufacturing costs in the eU context. Subsequent cost curves would include the european icMs, although they are not likely to change overall results substantially.
the icct will also use a similar methodology to transfer the technology benefit and cost data to construct cost curves for chinese passenger cars and light commercial vehicles.
0
500
1000
1500
2000
2500
3000
-60% -50% -40% -30% -20% -10% 0% Ad
dit
iona
l dir
ect
man
ufac
turi
ng c
ost
s [E
UR
] re
lati
ve t
o 2
010
bas
elin
e
CO2 reduction relative to 2010 baseline
95
g/k
m
corresponding fleet targets
2025excl. mass reduction
2020excl. mass reduction
2020incl. mass reduction
2025incl. mass reduction
90
g/k
m
80
g/k
m
70 g
/km
60
g/k
m
Baseline, 1.6l, M5, 156 g/km, 6.4 l
SS, 1.6l, M5, 136 g/km, 5.6 l
SS+SGTDI, 0.8l, 8DDCT, 104 g/km, 4.2 l SS+CEGR, 0.8l, 8DDCT, 99 g/km, 4.1 l
P2, 1.9l, 8DDCT, 89 g/km, 3.6 l
SS+SGTDI, 0.8l, 8DDCT, -0% mass, -20% RL, 95 g/km, 3.9 l
SS+CEGR, 0.8l, 8DDCT, -0% mass,-20% RL, 90 g/km, 3.7 l
P2, 1.9l, 8DDCT, -0% mass, -20% RL, 78 g/km, 3.2 l
Figure A.4 c-class cost curve for gasoline vehicles including latest mass reduction data