PARTNERING FOR PROSPERITY
68
PARTNERING FOR PROSPERITY An Economic Growth Action Agenda for Cook County April 2013
Transcript of PARTNERING FOR PROSPERITY

PARTNERING FOR PROSPERITYAn Economic Growth Action Agenda for Cook County
April 2013


To the Residents of Cook County:
Cook County is at the heart of a great metropolitan region, where we make up more than half of its population, jobs, and businesses. Although our assets are plentiful, our economy has been slipping. This is impacting millions of decisions made each day by families, businesses, and inves-tors in this region. Governments, including Cook County government, don’t control this activity, but we do have a role to play. I’m convinced that we can create an environment where the economy can thrive.
When we provide first-class public services and infrastructure, we help the economy grow. When we create accountable, transparent and responsive government, we help the economy grow. These are roles that County government can—and should—play. We have an obligation to ensure that our programs, policies and investments support a thriving private sector.
We also have a responsibility to find ways we can partner with other governments and civic institutions to align our efforts. We are one region. Together, we can compete on a global stage. Separately, we are at risk of competing with each other in a short-sighted, zero-sum game.
To help County government address our role in the region’s economy, I appointed a Council of Economic Advisors, chaired by Bill Osborn and John Rogers. I gave the Council a difficult but critical task: to find practi-cal, effective ways that County government can support economic growth.
“Partnering for Prosperity” is the Council’s response to that challenge. Building on a strong foundation of research and analysis, it offers nine strategies for improving the business environment, encouraging produc-tivity, and supporting the people, places, and actions that can help the economy grow.
This document is a starting point for things to come. With the continued advice and assistance of the Council of Economic Advisors, initiatives will be developed to implement these strategies.
We cannot do it alone. But other regional and local partners already have thoughtful plans and our strategies are designed to align with them. We are working closely to support the Chicago Metropolitan Agency for Planning “GO TO 2040” plan, the World Business Chicago “Plan for Economic Growth and Jobs,” and the Chicagoland Chamber of Commerce’s new Tri-State Alliance for Regional Development. I look forward to the future opportunities this document will foster, creating prosperity for the residents of Cook County and the entire region.
Sincerely,
Toni Preckwinkle, President

COOK COUNTY COUNCIL OF ECONOMIC ADVISORS
John Rogers Chairman, CEO & CIO, Ariel Investments
Bill Osborn Chairman of the Board, Northwestern University Chairman, Northern Trust Corporation (Retired)
Paula Allen-Meares Chancellor, UIC
Robert Beavers Chairman & CEO, Beavers Holdings
Frank Clark Chairman & CEO, ComEd (Retired)
Sue Ling Gin Chairman & CEO, Flying Food Group President & Founder, New Management Ltd
Roberto Herencia President & CEO, BXM Holdings
Julie Howard CEO, Navigant Consulting
Stacy Janiak Managing Partner (Chicago Office), Deloitte
Aylwin Lewis President & CEO, Potbelly Sandwich Works
James H. Lowry Senior Advisor, Boston Consulting Group
Michael MoskowVice-Chairman and Senior Fellow on the Global
Economy, Chicago Council on Global AffairsPresident & CEO, Federal Reserve Bank of
Chicago (Retired)
Sheila O'Grady Consultant, Spencer Stuart Former President, Illinois Restaurant Association
Richard Price Chairman & CEO, Mesirow Financial
Jorge Ramirez President, Chicago Federation of Labor (AFL-CIO)
Michael Sacks CEO, Grosvenor Capital Management
Sam ScottChairman, President & CEO, Corn Products
International (Retired)
Alejandro Silva Chairman & CEO, Evans Food Group
James Skogsbergh President & CEO, Advocate Health Care
Kurt Summers Senior Vice-President, Grosvenor Capital Management
Scott SwansonPresident, Charter One and RBS Citizens, Illinois
and Michigan
Michael Tang Vice-Chairman, Tang Industries CEO, National Material
Kevin WillerPresident & CEO, Chicagoland Entrepreneurial Center
Co-Chairs

Dear President Preckwinkle:
The Cook County Council of Economic Advisors is pleased to present for your consideration the following Economic Growth Action Agenda for Cook County.
For the last decade, our metropolitan economy has grown more slowly than the nation’s and those in other metropolitan areas. Cook County plays a large role in this slipping economy. We have some of its greatest assets, including robust industries, a national transportation hub, world-class universities, and a high percentage of college-educated residents.
But we also face some of its biggest challenges—a declining number of middle-skill production jobs and a greater percentage of people with low educational attainment. Cook County has multiple communities where residents are isolated by poverty, and its government is constrained by fiscal problems.
We face these challenges as the global economy is shifting dramatically. It is now more knowledge-based, more centered in metropolitan regions, and more dynamic. As we look for ways to bolster our region’s economy, we will need to take these changes into account.
In the past, Cook County government has not had a strategic agenda for supporting our economy. It is our hope that this Action Agenda will guide the County as it reshapes its economic role in the region. The Agenda includes nine strategies for economic growth that should shape County policy, and inform its partnerships and actions. Like any good plan, it is intended to be a living document that will be adjusted as initiatives are developed to implement the strategies and as new strategic opportuni-ties arise.
We have called this Action Agenda “Partnering for Prosperity” to reflect the many partnerships Cook County must engage in to support economic growth. Our intent is to avoid duplication, promote cooperation, and ensure that the County’s assets are well-deployed to support growth in the region’s economy. All this should be done in alignment with other regional plans and initiatives.
We want to thank Metropolis Strategies and RW Ventures for their work in research, analysis, and document development. Thanks also go to the staff of the President’s Office and the Bureau of Economic Development, to the members of the Council of Economic Advisors, and to the Chicago Community Trust, which provided financial support for part of this effort.
Most of all, thank you for this opportunity to support your leadership in making Cook County an effective partner in regional economic growth. We look forward to continuing to work with you.
John Rogers
Co-Chair, Council of Economic Advisors
Chairman, CEO & CIO, Ariel Investments
Bill Osborn
Co-Chair, Council of Economic Advisors
Chairman of the Board, Northwestern University Chairman, Northern Trust Corporation (Retired)

TABLE OF CONTENTS
EXECUTIVE SUMMARY 1
1. Cook County in the global economy 9
Principles for promoting economic growth 12
2. Identifying opportunities for Cook County 13
Regional opportunities 13
County-specific assets and challenges 14
County government capacities 16
3. Cook County market analysis 19
Performance of regional clusters 21
Manufacturing 22
Transportation and logistics 27
Health 30
Suppliers to anchor institutions 32
Development and deployment of human capital 33
Support for innovation and entrepreneurship 35
Spatial efficiency 36
Effective and efficient institutional environment 39
Summary 41
4. Cook County’s economic growth strategies 43
5. Cook County’s next steps 53
ENDNOTES 55

PARTNERING FOR PROSPERITY: AN ECONOMIC GROWTH ACTION AGENDA FOR COOK COUNTY 1
GROWTH IN A NEW GLOBAL ECONOMY
EXECUTIVE SUMMARY
Over the past 18 months, several well- regarded plans for the region have been developed.* These reveal troubling trends in the metropolitan economy—which, despite strong economic assets, has un-derperformed the nation and its peers in terms of output, employment, and productivity.
The region’s underperformance re- flects in part its failure to understand and respond to a changing global economy. Cook County’s Economic Growth Action Agenda has been crafted to respond to these new conditions.
KNOWLEDGE FUELS THE WORLD’S ECONOMIES Knowledge-based products and process-es are proliferating across all industries, and entirely new sectors are emerging. Continuous innovation, assisted by flex-ible, responsive networks, has become the hallmark of economic growth in the new global economy.
METROPOLITAN REGIONS ARE KEYMetropolitan regions concentrate assets, including human, business, real-estate, and institutional assets, and allow them to interact continually to create eco-nomic value. As a result, metropolitan regions are now the global economy’s primary competitive units.
* See Chicago Metropolitan Agency for Planning, “GO TO 2040” (October 2011); World Business Chicago, “A Plan for Economic Growth and Jobs” (March 2012); and Organization for Economic Cooperation and Development, “OECD Territorial Review: The Chicago Tri-State Metropolitan Area” (September 2012).
There are no “one-size-fits-all” solutions for helping regional economies grow. Each region has unique assets and will require specially tailored strategies. Growth strategies need to be integrated, not fragmented—a regional economy’s whole is greater than the sum of its parts, and each piece (such as workforce train- ing, infrastructure, and business devel-opment) succeeds or fails in context of the others.
INCLUSIVENESS IS GOOD FOR GROWTHAll parts of the region’s economy are in-extricably linked. Regions that develop and deploy more of their human, real estate, and business assets do better in the long run because they create greater efficiency and productivity, and reduce the costs of poverty.
REGIONAL STRATEGIES PAY OFFIn the past, underperforming regions tended to “catch up” with their higher- performing peers over time. This dynamic has changed. High-performing regions tend to continue pulling ahead of their competitors. In this context, small changes in strategy can make a big difference.

PARTNERING FOR PROSPERITY: AN ECONOMIC GROWTH ACTION AGENDA FOR COOK COUNTY2
#
1720
A KEY PART OF THE CHICAGO REGION
EXECUTIVE SUMMARY
Cook County is the core of the region’s population, jobs, businesses, and pro-ductivity. These assets exert outsized influence on the regional economy and, as global economic trends continue to favor dense, connected areas, they are likely to become an even more signif-icant driver of the regional economy over time. Cook County also has a dis-proportionate share of certain economic challenges. Its unemployment rate, for
example, is one point higher than the rest of the region’s18 and its poverty rate is nearly double that of its neighbors.
Both its assets and its challenges are closely linked to the region’s economy. Its workers, for example, flow across county borders (see map below). Like the region, Cook County has underper-formed economically, and needs to re-pond with fact-based strategic economic growth planning.
#
#
#
Lake
Number (in thousands) of people who both live and work in Cook County
Number (in thousands) of workers commuting between Cook County and the collar counties
COMMUTER MAP: CHICAGO METRO REGION
PARTNERING FOR PROSPERITY: AN ECONOMIC GROWTH ACTION AGENDA FOR COOK COUNTY 3
A PROCESS FOR FINDING OPPORTUNITIES
EXECUTIVE SUMMARY
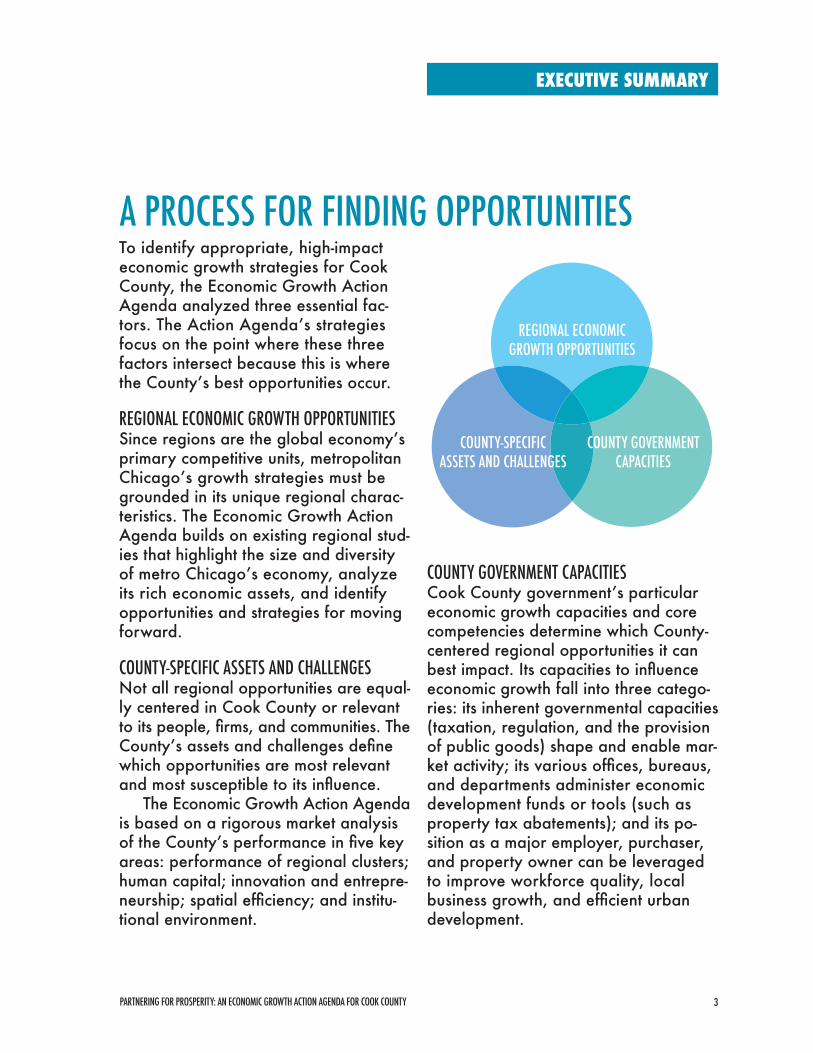
To identify appropriate, high-impact economic growth strategies for Cook County, the Economic Growth Action Agenda analyzed three essential fac-tors. The Action Agenda’s strategies focus on the point where these three factors intersect because this is where the County’s best opportunities occur.
REGIONAL ECONOMIC GROWTH OPPORTUNITIESSince regions are the global economy’s primary competitive units, metropolitan Chicago’s growth strategies must be grounded in its unique regional charac-teristics. The Economic Growth Action Agenda builds on existing regional stud-ies that highlight the size and diversity of metro Chicago’s economy, analyze its rich economic assets, and identify opportunities and strategies for moving forward.
COUNTY-SPECIFIC ASSETS AND CHALLENGESNot all regional opportunities are equal- ly centered in Cook County or relevant to its people, firms, and communities. The County’s assets and challenges define which opportunities are most relevant and most susceptible to its influence.
The Economic Growth Action Agenda is based on a rigorous market analysis of the County’s performance in five key areas: performance of regional clusters; human capital; innovation and entrepre-neurship; spatial efficiency; and institu-tional environment.
COUNTY GOVERNMENT CAPACITIESCook County government’s particular economic growth capacities and core competencies determine which County- centered regional opportunities it can best impact. Its capacities to influence economic growth fall into three catego-ries: its inherent governmental capacities (taxation, regulation, and the provision of public goods) shape and enable mar-ket activity; its various offices, bureaus, and departments administer economic development funds or tools (such as property tax abatements); and its po-sition as a major employer, purchaser, and property owner can be leveraged to improve workforce quality, local business growth, and efficient urban development.
REGIONAL ECONOMIC GROWTH OPPORTUNITIES
COUNTY-SPECIFIC ASSETS AND CHALLENGES
COUNTY GOVERNMENT CAPACITIES

PARTNERING FOR PROSPERITY: AN ECONOMIC GROWTH ACTION AGENDA FOR COOK COUNTY4
EXECUTIVE SUMMARY
STRATEGIES FOR PROMOTING GROWTHFrom the Action Agenda’s detailed market analysis, nine priority growth strategies emerged. These are intended to align with other recently developed regional strategies, and will be imple-mented in partnership with World Busi-ness Chicago, CMAP, the Chicagoland Chamber of Commerce, and others.
Businesses will invest in regions with effective institutions, and regional collaboration is essential to successful economic growth strategies.
GOVERNANCE STRATEGIES
COOK COUNTY GOVERNMENT 3.0Increase Cook County government’s transparency, efficiency, and accountability
Businesses look for a good tax-value proposition, which in part rests on effective, efficient government
Initiatives to implement this strategy should include:Open, transparent flexible, adaptive, efficient government that includes technology-enabled policies and processes.Close engagement with citizens and with the civic and private sectors.Expanded collaboration across the County’s elected offices and with municipalities.
WBC Plan for Economic Growth and Jobs (Strategy 10); CMAP GOTO 2040 (Efficient Governance); OECD Territorial Review (27)
REGIONAL PLAN ALIGNMENTS
The following list of nine is a begin-ning. The work that follows to develop initiatives will be a next step, and other strategies may emerge as the County builds its capacity to support economic growth. The strategies fall into three general categories: governance, pro-duction, and support.
1
WHY
WHAT

PARTNERING FOR PROSPERITY: AN ECONOMIC GROWTH ACTION AGENDA FOR COOK COUNTY 5
EXECUTIVE SUMMARY
INTERGOVERNMENTAL EFFICIENCIESIncrease suburban government efficiency through shared services and centralized capacities
WHY
WHAT
REGIONAL PLAN ALIGNMENTS
Cook County contains 121 municipalities of different sizes, with a wide range of capacities. Duplication of services im-poses costs on businesses and residents.
Initiatives to implement this strategy should include:
Resources to identify and help implement service-sharing opportunities among interested suburbs.
Technical expertise made available to suburbs that have limited government capacities.
WBC Plan for Economic Growth and Jobs (Strategy 10); CMAP GOTO 2040 (Pursue Coordinated Investments); OECD Territorial Review (28)
STRONG STRATEGIC CAPACITYIncrease the region’s capacity for strategic, coor-dinated economic growth initiatives
Local economic development tends to focus on “zero-sum” intra-regional competition for firms, and many suburbs have limited economic development capacities.
Initiatives to implement this strategy should include:
Capacity for detailed economic analyses and business planning that can support new economic growth initiatives.
Shared initiatives across municipalities within Cook County and, ultimately, across County borders.
WBC Plan for Economic Growth and Jobs (Implementation approach); CMAP GO TO 2040 (Pursue Coordinated Invest-ments); OECD Territorial Review (28)
WHY
WHAT
REGIONAL PLAN ALIGNMENTS
2
3

PARTNERING FOR PROSPERITY: AN ECONOMIC GROWTH ACTION AGENDA FOR COOK COUNTY6
MANUFACTURING PRODUCTIVITYIncrease the productivity of Cook County’s manu-facturing clusters
WHY
WHAT
REGIONAL PLAN ALIGNMENTS
PRODUCTION STRATEGIES
WHY
WHAT
REGIONAL PLAN ALIGNMENTS
The production sectors of the regional economy—not retail or real estate—are its primary drivers of growth.
4
5
EXECUTIVE SUMMARY
Manufacturing in Cook County and the region is strong and positioned to grow. In particular, Fabricated Metals and Food Processing employment are 20 percent more concentrated in Cook than in the nation.
Initiatives to implement this strategy should include:
Assistance for manufacturing firms that need cutting-edge tech- nologies and workers to operate them.
WBC Plan for Economic Growth and Jobs (Strategy 1); CMAP GOTO 2040 (Support Economic Innovation); OECD Territorial Review (29)
Cook County spends $1 billion annually on goods and ser- vices. Improving the productivity and competitiveness of its suppliers, especially SWMBEs, would be good for County government and for regional growth
Initiatives to implement this strategy should include:
Small business productivity services tailored for this group.
NOT a “buy local” or set- aside strategy.
WBC Plan for Economic Growth and Jobs (Strategies 2 and 9)
SUPPLIER COMPETITIVENESSIncrease competitiveness of anchor institution suppliers

PARTNERING FOR PROSPERITY: AN ECONOMIC GROWTH ACTION AGENDA FOR COOK COUNTY 7
LOGISTICS PRODUCTIVITYIncrease the productivity and efficiency of the Transportation and Log istics cluster
WHY
WHAT
REGIONAL PLAN ALIGNMENTS
Transportation and logistics employs over 140,000 people in the region, 54 percent of whom work in Cook. Trucking is particularly strong in the the County.
Initiatives to implement this strategy should include:
Support for existing and planned logistics strategies.
Assistance for small trucking companies that need to update their technologies.
WBC Plan for Economic Growth and Jobs (Strategy 3); CMAP GOTO 2040 (Support Economic Innovation)
Certain key areas “support” economic growth and enable markets. Keeping these healthy creates an environment where businesses can thrive.
SUPPORT STRATEGIES
STRONG PHYSICAL INFRASTRUCTUREImprove the quality and efficiency of the region’s transportation infrastructure
Businesses rely on the efficient movement of people, goods, and ideas, but the region is now the nation’s third most con-gested—at a cost of $6.2 billion annually.
Initiatives to implement this strategy should include:Improved regional public transit.
Congestion management.
WBC Plan for Economic Growth and Jobs (Strategies 3 and 8); CMAP GOTO 2040 (Regional Mobility); OECD Territorial Review (27)
WHY
WHAT
REGIONAL PLAN ALIGNMENTS
6
7
EXECUTIVE SUMMARY

PARTNERING FOR PROSPERITY: AN ECONOMIC GROWTH ACTION AGENDA FOR COOK COUNTY8
COMMUNITIES THAT CONNECTSupport the emergence of dense, mixed-use, well- connected communities
WHY
WHAT
REGIONAL PLAN ALIGNMENTS
The region has an acute jobs-housing mismatch, and its poor-est areas—many of them located in Cook County—are isolated from economic opportunity.
Initiatives to implement this strategy should include:
Mixed-use, high-density development.
Affordable housing near job centers and transit.
Broadband expansion.
WBC Plan for Economic Growth and Jobs (Strategy 9); CMAP GO TO 2040 (Achieve greater livability through land use and housing); OECD Territorial Review (18)
DEMAND-DRIVEN WORKFORCEImprove the alignment of Cook County residents’ skills with employer demand
WHY
WHAT
REGIONAL PLAN ALIGNMENTS
In Cook County, higher-skilled occupations are growing much faster than jobs for lower-skilled workers. At the same time, 42 percent of residents have a high school education or less. Cook is home to two-thirds of the region’s immigrants, but immigrants in Cook are less likely to speak fluent English or have a college degree.
Initiatives to implement this strategy should include:
Employer-driven, targeted training aimed at priority sectors.
Tailored workforce training and jobs-matching for the County’s immigrant population.
WBC Plan for Economic Growth and Jobs (Strategy 6); CMAP GO TO 2040 (Improve Education and Workforce Develop-ment); OECD Territorial Review (18)
8
9
EXECUTIVE SUMMARY

PARTNERING FOR PROSPERITY: AN ECONOMIC GROWTH ACTION AGENDA FOR COOK COUNTY 9
Cook County boasts an economy of 2.6 million jobs and $308 billion in annual output.1 It is the second most populous county in the U.S.,2 and anchors the nation’s third-largest metropolitan economy.3
Historically, County government4 has not played a systematic or strategic role in econom-ic growth and development. Now, County gov-ernment is modernizing its operations, remak-ing its culture, and transitioning toward a more professional way of doing business. The time is right to craft an active role for the County in supporting economic growth.
That role requires careful definition. Cook County contains more than 50 percent of the region’s jobs, population, and economic output, but these assets function through labor, business, and housing markets that are regional. Its role, therefore, has to be defined as part of a larger regional economic growth agenda.
At the same time, County government is not the primary general-purpose local government addressing economic development. It has more delineated tools and focus, as it covers geogra-phies already governed by general-purpose municipalities—most notably, the City of Chicago. Cook County’s role must also be defined in relation to numerous other local governments (including 150 municipalities and townships, and over 300 special-purpose governments) within the County borders.5
County government’s role in economic development is located at the intersection of: regional opportunities; the parts of the regional economy concentrated in Cook County; and the specific capacities of County government to influence economic growth. Its role will often be to partner with municipalities within the County and with other counties in the region. Yet its sta-tus as the government of the county containing the largest share of the regional economy, and its particular positioning “between” the City of Chicago and the region, create opportunities for Cook County government to play key lead-ership roles in regional economic growth.
CHAPTER 1
Cook County in the global economy
THE TIME IS RIGHT TO CRAFT AN ACTIVE ROLE FOR THE COUNTY IN SUPPORTING ECONOMIC GROWTH

PARTNERING FOR PROSPERITY: AN ECONOMIC GROWTH ACTION AGENDA FOR COOK COUNTY10
Over the past 18 months, several well-regarded plans for the region have been developed.6 These reveal troubling trends in the metropoli-tan economy—which, despite strong economic assets, has underperformed the nation and its peers in terms of output, employment, and productivity.7 The region’s underperformance reflects in part the failure of the region to un-derstand the dynamics of the changing global economy and to develop the mutually reinforc-ing actions needed to increase productivity.8 For Cook County’s economic growth agenda, the following four aspects of the new global economy are of particular importance.
THE NEW ECONOMY IS KNOWLEDGE-BASED, INNOVATION-DRIVEN, DYNAMIC AND GLOBALEconomic growth increasingly relies on knowl-edge, embedded in people and technologies.9 Knowledge-based service sectors (for example, Scientific and Technical Services, and Finance, Professional and Business Services) now comprise nearly 75 percent of developed economies’ out- put.10 Knowledge-based products and processes are proliferating across all industries, and en-tirely new sectors are emerging.11
This shift to a knowledge-based economy places a premium on innovation. The pace of innovation and adaptation is accelerating, and firms and industries now emerge, develop, and redefine themselves to meet changing market conditions much faster than they did in the past. Deliberate, systematic, continuous innovation, in products, processes, and business models, is now the key to economic growth.12
As a result, a new dynamism characterizes the economy. Flexible, responsive production and institutional networks support an array of customized products and processes. Economies, industries, and firms all redeploy their assets continually to take advantage of new products and markets. Firms operate and compete in a global marketplace, looking to emerging inter-national markets for demand and inputs.
METRO REGIONS DRIVE THE GLOBAL ECONOMY This emphasis on rich, dynamic interactions of knowledge assets favors metropolitan econo-mies. The world’s economic assets and actors are concentrated in its metropolitan regions, where their geographic proximity reduces trans- action costs and increases innovation-producing interactions.13 This makes metropolitan econ-omies disproportionately productive.14 As a result, metropolitan regions are now the global economy’s primary competitive units.15
Regional economies are specialized and complex. Each has its own unique combination of assets, market dynamics, and institutional framework that determines its economic per-formance. Their whole is greater than the sum of the parts: each of the pieces (for example, business development, workforce training, and infrastructure) succeeds or fails in the context of the others. Strategies need to be highly tai-lored to place, and mutually reinforcing (rather than fragmented). There are no “one-size-fits-all” solutions for promoting economic growth.
INCLUSIVENESS IS GOOD FOR GROWTH All parts of the region’s economy are inextri-cably linked. Regions that develop and deploy more of their human, real estate, and business assets do better in the long run, because they experience greater efficiency and productivity, and reduce the cost of poverty.
THE GROWTH TRAJECTORIES OF REGIONAL ECONOMIES ARE DIVERGINGIn the past, underperforming regions tended to “catch up” with their higher-performing peers over time. This dynamic has changed. Concen-trated knowledge assets drive a self-reinforcing growth cycle and, as a result, high-performing regions tend to continue pulling ahead of their competitors, while lagging regions tend to fall further behind. In this economic context, small changes in growth strategy can make a big long-term difference.16
THE NEW GLOBAL ECONOMY...

PARTNERING FOR PROSPERITY: AN ECONOMIC GROWTH ACTION AGENDA FOR COOK COUNTY 11
...REQUIRES A NEW KIND OF ECONOMIC DEVELOPMENT
In the transformed global economy, regions must take a new approach to economic development, moving away from consumption-driven growth (for example, retail and housing) and from deal-by-deal, haphazard firm attraction based on low costs. Instead, their focus should be on creating production-driven economies that com-pete by adding value and by building on their specialized assets and unique opportunities.
To do this, regions must concentrate on increasing the productivity of their people and assets. Successful regions develop comprehen-sive, integrated, inclusive strategies and create new institutional capacity that can work across the public, private, and civic sectors, and across political boundaries. The table below summariz-es this shift in economic development practice.
SUBSIDIZE COMPANIES
REDUCE TAXES
TRAIN THE UNEMPLOYED
MUNICIPAL COMPETITION
GOVERNMENT-LED
SUCCESS = JOBS
LEVERAGE REGIONAL STRENGTHS
ADD VALUE
CONNECT TRAINING TO JOBS
REGIONAL COLLABORATION
PUBLIC-PRIVATE PARTNERSHIP
SUCCESS = DYNAMIC ECONOMIC GROWTH
In this economic context, Cook County is setting a new course for itself, seeking out more effec-tive ways to prosper as part of a vital region. It has developed this Economic Growth Action Agenda as a way to participate in regional growth planning; to expand its strategic part-nerships with other institutions; and to focus its economic development resources by identifying appropriate, high-impact economic strategies.
To help ground itself in the fundamentals of a new kind of economic growth planning, the County is also adopting a set of growth princi-ples (see following page) and promoting them across all its departments and elected offices. The principles will help guide the strategic align- ment of County policies, actions, and programs, creating catalysts for economic growth.
FUTURE STEPSThe Economic Growth Action Agenda is a work in progress—a platform for further engagement, refinement, and exploration of partnerships. The County will adapt and expand its strategies as new information and op-portunities become available. In this sense, this document is not the end of a project but a new beginning.
TRADITIONAL ECONOMIC DEVELOPMENT NEW ECONOMIC GROWTH PLANNING

PARTNERING FOR PROSPERITY: AN ECONOMIC GROWTH ACTION AGENDA FOR COOK COUNTY12
BUILD ON THE COUNTY’S EXISTING STRENGTHSCook has enormous assets in people, businesses, educational and research institutions, infrastructure, and location. These should be the focus of its attention and investments in promoting economic growth.
THINK AND ACT REGIONALLYThe region’s economy is a single system—haphazardly luring a busi-ness from one part of it to another does nothing to expand outputs or increase productivity. The region’s public and private sectors need to align their growth programs in the context of the regional economy. Cook County should be a lead participant in this effort. This focus on regional economic development does not replace a focus on neigh-borhood or subject-area development (for example, human capital development or small business development). Each of these compo-nents needs to be addressed and coordinated in the context of their relevant economic geography—most often the region.
TARGET INDUSTRIES, NOT INDIVIDUAL FIRMSTraditional economic development tries to attract and retain businesses by offering firm-specific incentives and subsidies. The main engine of economic growth, however, is the expansion of existing companies and the birth of new ones. Cook County should support the region’s most promising industries, improving the productivity of every firm in-volved. Targeted firm attraction would then become one tactic in an overarching industrial growth strategy.
PURSUE INCLUSIVE GROWTHThe region’s economy links all of its communities together. Barriers that limit participation within certain areas or populations are equally barriers to overall growth. To enhance the region’s economic health, Cook County should develop its under-employed people and under- utilized places, and connect them to regional economic opportunity.
CREATE 21st-CENTURY GOVERNMENT THAT SUPPORTS GROWTHTo carry out its obligations, Cook County provides public goods, reg-ulates, and collects taxes. All of these activities can support or hinder economic growth. Building an open, efficient, and entrepreneurial government will make the County more attractive to investors.
PRINCIPLES FOR PROMOTING ECONOMIC GROWTH

PARTNERING FOR PROSPERITY: AN ECONOMIC GROWTH ACTION AGENDA FOR COOK COUNTY 13
To identify appropriate, high-impact strategies for Cook County, the Economic Growth Action Agenda focuses on three essential factors, de-scribed below. The County’s best opportunities for influencing economic growth, in its own juris- diction and throughout the region, occur where these three factors intersect.
REGIONAL ECONOMIC GROWTH OPPORTUNITIES Since metropolitan regions are now the glob-al economy’s primary competitive units (see Chapter 1), economic growth strategies must be grounded in the unique characteristics of metropolitan Chicago.
COUNTY-SPECIFIC ASSETS AND CHALLENGES Not all regional opportunities are equally cen-tered in Cook County or relevant to its people, firms, and communities. The County’s specific assets and challenges define which opportuni-ties are most relevant and most susceptible to its influence.
COUNTY GOVERNMENT CAPACITIES Cook County government’s particular econom-ic growth capacities and core competencies determine which County-centered regional opportunities it can best impact.
CHAPTER 2
Identifying opportunities for Cook County
REGIONAL ECONOMIC GROWTH OPPORTUNITIES
COUNTY-SPECIFIC ASSETS AND CHALLENGES
COUNTY GOVERNMENT CAPACITIES
of the regional economy and its rich econom-ic assets. They also acknowledge that it has underperformed in the past decade, and that action must be taken to reverse this trend. Based on detailed market analysis, the reports recommend a range of mutually reinforcing, targeted strategies.
In short, a great deal is already known about regional opportunities in metropolitan Chicago and the best strategies for acting on them. These are discussed throughout the Eco-nomic Growth Action Agenda.
THE COUNTY’S BEST OPPORTUNITIES FOR INFLUENCING ECONOMIC GROWTH OCCUR WHERE THESE THREE FACTORS INTERSECT
REGIONAL OPPORTUNITIESThe Economic Growth Action Agenda draws extensively on three recent examinations17 of the metropolitan Chicago economy and its opportunities for growth: Chicago Metropol-itan Agency for Planning (CMAP)’s GO TO 2040; World Business Chicago (WBC)’s Plan for Economic Growth and Jobs; and the OECD (Organization for Economic Cooperation and Development) Territorial Review of the Chicago Tri-State Metropolitan Area, commissioned by the Chicagoland Chamber of Commerce.These reports highlight the size and diversity

PARTNERING FOR PROSPERITY: AN ECONOMIC GROWTH ACTION AGENDA FOR COOK COUNTY14
The County contains a disproportionate share of the region’s assets (see charts at right), more or less evenly split between the City of Chicago and its surrounding suburbs.
The County is also home to major drivers of the metropolitan economy, including both of the region’s major airports, the bulk of its rail and road infrastructure, and many of its colleges and universities—in addition to a multitude of amenities (for example, cultural, recreational, and entertainment assets) that provide indirect support for economic growth.
The County’s assets currently exert out-sized influence on the regional economy and, as global economic trends continue to favor dense, connected areas, they are likely to become an even more significant driver of the regional economy over time.
Cook County also has a disproportionate share of certain economic challenges. The County’s unemployment rate, for example, is one point higher than the rest of the region’s18 and its poverty rate is nearly double that of its neighbors.19
Further, the County’s economic assets and challenges are not evenly distributed across its sub-geographies. Areas with low income and high unemployment are primarily concen-trated within the City of Chicago and parts of southern Cook, while throughout northern and northwestern Cook, average incomes are higher and unemployment is lower (see maps on facing page).
Like the region, Cook County has under-performed economically. The increase in its average wage between 2001 and 2011, for ex-ample, matched the region’s at 28 percent—but this was 5 percent less than the average gain across the nation. In some cases, the County’s underperformance has been more severe: dur-ing the same period, as national employment held steady and regional employment declined by 5 percent, County employment dropped 10 percent.20
The County’s assets and challenges are examined in greater detail in Chapter 3 of this report, which summarizes the results of a rigor-ous, County-specific market analysis.
COUNTY-SPECIFIC ASSETS AND CHALLENGESCOOK COUNTY’S SHARE OF THE REGION’S LAND AREA
COOK COUNTY’S SHARE OF THE REGION’S POPULATION
COOK COUNTY’S SHARE OF THE REGION’S BUSINESSES
COOK COUNTY’S SHARE OF THE REGION’S AGGREGATE INCOME
COOK COUNTY’S SHARE OF THE REGION’S JOBS
Cook County
12.5%
55%
54%
53.5%
58%Chicago MSA without Cook

PARTNERING FOR PROSPERITY: AN ECONOMIC GROWTH ACTION AGENDA FOR COOK COUNTY 15
0–5.2
%
5.2–7
.9%
7.9–1
0.8%
10.8–
15.8%
15.8–
59.5%
COOK
COUN
TY
UNEM
PLOY
MENT
RATE
CO
OK CO
UNTY
ME
DIAN
HOU
SEHO
LD IN
COME
$0–3
3,818
$33,8
18–4
5,916
$45,9
16–5
6,686
$56,6
86–7
4,296
$74,2
96–2
50,00
1A
mer
ican
Com
mun
ity S
urve
y, 2
006–
2010
5-ye
ar e
stim
ates
PARTNERING FOR PROSPERITY: AN ECONOMIC GROWTH ACTION AGENDA FOR COOK COUNTY16
The County has three types of capacities that influence economic growth within its jurisdiction and throughout the region:
ENABLING MARKET ACTIVITYCook County’s inherent governmental capac-ities shape and enable market activity. These capacities include:
TaxationAs a home rule government, Cook County sets independent sales tax rates, as well as automo-bile, gasoline, cigarette, and amusement taxes. County government also collects property taxes and distributes them to municipal governments and other taxing bodies.21 The County’s ability to tax, in conjunction with its role in providing public goods (see below), impacts the attrac-tiveness of the region’s “tax-value proposition”— the perceived value for or “return” on firms’ and residents’ tax dollars.
RegulationOutside of unincorporated areas, which hold less than 2 percent of Cook’s population, the County’s regulation activities focus primarily on environmental controls, which it monitors and enforces. The relatively narrow scope of Cook County’s regulatory powers limits their ability to enable or shape market activity.
Provision of public goodsThough known for its two largest public services (the healthcare and justice systems), County government also provides public goods that more directly support economic growth, such as highway and broadband infrastructure, and public data.
The County’s Department of Transportation and Highways maintains just over 2,000 lane-miles of mostly non-contiguous pavement and offers technical assistance to municipalities for specific highway projects.
Cook County’s Bureau of Technology has expanded broadband service in Chicago’s South Suburbs and is working with the CTA to expand high-speed Internet to the Stroger Hospital campus. In partnership with the City of Chicago, Cook County also maintains an online data depository where the public can access important data. This increases transparency
COUNTY GOVERNMENT CAPACITIESaround certain aspects of the economic envi-ronment (for example, housing permit trends or land-use patterns), and helps businesses make more informed decisions.
Through its power of appointment to a number of regional Boards of Directors (in-cluding the Regional Transportation Authority, Metra, Pace, CMAP, the Illinois International Port District, and CREATE), County government also participates in the provision of other public goods, primarily transit and other transporta-tion infrastructure.
DELIVERING SPECIFIC ECONOMIC DEVELOPMENT FUNDS AND TOOLSVarious offices, bureaus, and departments of County government administer economic devel-opment funds or tools. These resources include:
Property tax abatementsThe County makes several types of tax abate-ment available to businesses that revitalize va-cant/abandoned property or property in areas “experiencing severe economic stagnation.” Three classifications (6b, 7a/7b, and 8)22 aim to encourage industrial and commercial devel-opment of various sizes. Qualifying properties are taxed at a reduced rate for 12 years, and sterm draws to a close.
Most applications for corporate property tax abatements are reviewed by the County Assessor, though a small number of special cases are also reviewed by the Bureau of Economic Development. Incentives are approved for most businesses that apply and are not currently at- tached to any criteria related to the industry, location, or number or type of jobs to be creat-ed, although a task force has been convened to suggest possible jobs-based criteria.
County government has the capacity to use tax abatements as a tool for targeting high- potential industry clusters and underutilized geographies. It is currently in the process of assessing the use of these abatement programs.
Workforce Investment Act (WIA) fundingCook County receives workforce development funding from the federal government to train adult workers. In 2012, the County’s workforce boards merged with the City of Chicago’s to form an independent 501c(3) organization

PARTNERING FOR PROSPERITY: AN ECONOMIC GROWTH ACTION AGENDA FOR COOK COUNTY 17
called the Chicago Cook Workforce Partner-ship. Cook County WIA funding now goes directly to the Partnership. The Partnership’s 2012 budget for workforceprograms was approximately $30 million.23 It has recently committed to increasing the strategic nature of its investments by focusing on cluster-specific, employer-driven training.
The Cook County Board President and the Mayor of the City of Chicago appoint the 28-member Workforce Investment Board that oversees the Partnership. They also maintain oversight of its budget and performance, pro-viding Cook County with an avenue for influ-encing the quality of the region’s workforce.
Other federal grant funding: CDBG, NSP and HOMEIn addition to WIA funding, the County admin-isters several other federal programs related to economic growth, including Community Development Block Grants (CDBG), Neighbor-hood Stabilization Program grants (NSP), and HOME Investment Partnership Program grants.
CDBG funds are relatively flexible, designed to support quality affordable housing, services for vulnerable communities, and job creation through the expansion and retention of busi-nesses. In 2011, Cook County used $9.4 million in CDBG funding to support 97 different initia-tives, ranging from facilities and infrastructure improvements to neighborhood planning to blight removal.
NSP funds (a subset of CDBG) allow for the purchase and redevelopment of foreclosed and abandoned residential properties. The HOME program is designed to create afford-able housing for low-income households by building, buying, or rehabilitating housing, or by providing direct rental assistance.
Section 108 Loan FundWith recent approval from the U.S. Department of Housing and Urban Development (HUD), Cook County intends to create a new Section 108 Loan Fund. The Fund will provide $30 mil-lion in financing for job-creating economic development proposals, with an emphasis on: transit-oriented development; cargo-oriented development; advanced or green manufactur-ing; hospitality or service-sector projects; and/or business start-up or expansion deals.
Once established, the loan program will allow the County to finance developments on

PARTNERING FOR PROSPERITY: AN ECONOMIC GROWTH ACTION AGENDA FOR COOK COUNTY18
a scale that its annual CDBG entitlement is too small to handle, and permit it to finance multi-ple projects at once.
Cook County Land BankIn January 2013, Cook County passed an ord- inance to create the “Cook County Land Bank Authority.” Based on the recommendations of an earlier advisory committee, the new ordi-nance gives the County the capacity to acquire, hold, and sell land for development purposes.24
The Land Bank is designed to address Cook County’s accumulation of vacant, abandoned, foreclosed, or tax-delinquent properties. The Authority will focus on properties whose attrac- tiveness can be increased by clearing title or by removing back taxes. As the Land Bank matures and its portfolio expands, the County can use it as a tool to target high-potential industry clus-ters and underutilized geographies.
OPERATING “LINES OF BUSINESS”Cook County government is effectively one of the largest “businesses” in the region, hiring employees, purchasing goods and services, and owning and managing real estate.
The County is the fourth-largest employer in the Chicago metropolitan area,25 with 23,000 employees. Approximately 90 percent of these work in the healthcare and hospital or public safety and justice systems. Cook County spends approximately $1 billion annually (not count-ing payroll), with much of this used to purchase medical supplies and equipment, food services, building management services, energy, and many other goods and services from vendors within and outside the region. The County also owns approximately 17 million square feet of real estate, managed through the Bureau of Eco- nomic Development’s Capital Planning Office.
The County has the capacity to leverage its status as an employer, purchaser, and property owner to improve the quality of the region’s workforce, support the growth of local busi-nesses, and shape efficient urban development.
REGIONAL LEADERSHIPAs a major regional institution with in- creasing competencies and credibility,Cook County government is equipped to be a leader in advocating, organiz-ing, and partnering across the region to promote economic growth. It has the positioning and the intergovernmental relationships needed to foster collabo-rative economic growth initiatives with leaders of municipalities within the County and of other counties.

PARTNERING FOR PROSPERITY: AN ECONOMIC GROWTH ACTION AGENDA FOR COOK COUNTY 19
Developing an economic growth agenda that is tailored to a particular region requires an understanding of its current stage of (and path toward) economic restructuring. This in turn re-quires a market analysis focused on the chang-ing drivers of economic prosperity.
Organized around the five market levers that drive economic growth (outlined below), this chapter focuses on Cook County’s econom-ic performance in the context of the regional economy. It provides a summary analysis only; much further detail is available upon request.
By analyzing the local assets and dynamics related to each of these market levers, as well as their interactions with one another, Cook County government can begin to identify the strategies that will best transform the regional economy and help the County to lead growth in the new global economy.
CHAPTER 3
Cook County market analysis
The five market levers driving economic growth
Five “market levers” account for the efficiency and productivity of regional economies, and so provide the framework for understanding economic challenges and opportunities.26 Each lever is described briefly below and in more detail later in this chapter.
PERFORMANCE OF REGIONAL CLUSTERSFirms are more productive when interacting in “clusters” with related firms, functions, and institutions.
DEVELOPMENT AND DEPLOYMENT OF HUMAN CAPITALThe knowledge economy places a premium on higher levels of human capital. It also favors labor markets with continuous, targeted, and efficient training, retraining, and deployment of human capital, well-aligned with changing job requirements.
SUPPORT FOR INNOVATION AND ENTREPRENEURSHIPDeliberate, continuous innovation across all sectors is the core driver of increased economic productivity.
SPATIAL EFFICIENCYThe economic benefits of concentrating assets in regions—reduced transportation costs for goods, people, and ideas; shared labor pools; and knowledge spillovers—flow from creating dense, mixed-use, well-connected nodes of businesses, suppliers, workers, and consumers.
EFFECTIVE, EFFICIENT INSTITUTIONAL ENVIRONMENTGovernment shapes and enables market activ-ity; provides critical public goods that enhance firms’ productivity and efficiency; and, along with civic, private-sector, and cross-sector institu-tions, creates the networks and environment that support dynamic, flexible economies.

PARTNERING FOR PROSPERITY: AN ECONOMIC GROWTH ACTION AGENDA FOR COOK COUNTY20
ECONOMIC SECTORS IN THE CHICAGO REGION30
TION QUOTIENT (LQ•••
••
• •••• •••• •••• • ••• ••• •••••• ••••• •••• •• •• ••••••• • ••• •••• •• ••• •• ••• ••• ••• ••• •• ••• •••• ••• •••• •••Retail
Accommodation/Food
Information
Construction
Real Estate
Healthcare
Manufacturing
Arts &Finance &
Education
Wholesale
Transportation & WarehousingProfessional
Management
Administration, Support, Waste
Services
InsuranceEntertainment
•CoCo
•CoCo
•Co
420-2
0.80.9
1.01.1
1.21.3
GRP
$65 BILLION
$24 BILLION
LOCA)
% GROWTH RATE(CAGR 2010–2020)
1.01.1
1.21.3
0.80.9
Location quotient (LQ) is an indicator of how
concentrated the industry is in the location. A
n LQ of 1.0 m
atches the average level of specialization for the nation, and an LQ
of greater than 1.1 is considered a significant concentration.

PARTNERING FOR PROSPERITY: AN ECONOMIC GROWTH ACTION AGENDA FOR COOK COUNTY 21
WHAT IS A CLUSTER?A “cluster” is a group of firms and related economic actors and institutions that are locat-ed near each other,27 and “draw productive advantage from their mutual proximity and connections.”28
Clusters drive regional economic growth by enhancing firm productivity, which they do by: reducing transportation and infrastructure costs due to firms’ close proximity to one another; enabling the development and sharing of spe-cialized labor pools and other inputs common across the cluster firms; providing cluster firms more efficient access to customers, who may also be geographically concentrated (either as a cause or an effect of firm clustering); and facilitating innovation through “knowledge spillovers”—the informal learning and knowl-edge exchange that results from in-person interactions among employees of cluster firms and the movement of employees from one firm to another.
In addition to making existing firms more productive, clusters grow the local economy by attracting firms and workers from outside the region. These firms and workers seek the great-er productivity (reflected in profits and wages)
PERFORMANCE OF REGIONAL CLUSTERSthat flows from being part of a cluster. Clusters also foster the creation of new firms through spin-offs and enhanced entrepreneurship.
The Chicago metropolitan region’s econ-omy is very diverse, with strengths in sectors29 ranging from manufacturing to transportation to finance and business services. The bubble chart on Page 20 shows the size, concentra-tion, and growth projections of 15 high-level economic sectors in the region.
ANALYZING COOK COUNTY’S CLUSTERSThe Economic Growth Action Agenda builds on the analysis of regional opportunities con-tained in WBC’s “Plan for Economic Growth and Jobs.” Specifically, it undertakes further analysis to identify opportunities that are con- centrated in Cook County or well-matched to its assets, and also suited to the capacities of County government.
This analysis reveals priority economic growth opportunities in two manufacturing clus-ters (Fabricated Metals, and Food Processing and Packaging); in aspects of the Transporta-tion and Logistics cluster; and in Health (includ-ing health services, health manufacturing, and health supply and support services).

PARTNERING FOR PROSPERITY: AN ECONOMIC GROWTH ACTION AGENDA FOR COOK COUNTY22
Each of the recent reports examining the re-gional economy31 has highlighted manufactur-ing as one of its vital components. In particular, WBC’s “Plan for Economic Growth and Jobs” includes “become a leading hub of advanced manufacturing” among its ten strategies. An as-sessment of the region’s manufacturing subsec-tors, and their relative strength in Cook County, helps define where County government should focus in promoting manufacturing growth.
The table on Page 23 contains information on manufacturing subsectors within the Chicago Metropolitan Statistical Area (MSA) and within Cook County. For each subsector, it provides three measures for evaluating its strength. The first two are establishments and employment, calculated for the region, for the County, and for the County as a percentage of the region. The second is location quotient (LQ), an indica-tor of how concentrated the industry is in the location. An LQ of 1.0 matches the average level of specialization for the nation, and an LQ of greater than 1.1 is considered a signifi-cant concentration.
Based on Cook’s high employment, lo-cation quotient, and share of regional em-ployment, two clusters emerge as particularly promising manufacturing growth prospects for the County: Fabricated Metals, and Food Processing and Packaging (made up of two related subsectors).32
ManufacturingFabricated Metals ManufacturingFabricated Metals manufacturing is a cluster in which the core firms are small and medium- sized manufacturers that transform metal into intermediate (or occasionally end) products, and join separate parts together.33
Major suppliers within the cluster are firms selling primary metals;34 electrical and other components;35 metalworking technology and equipment;36 and metal services (for example, coating, heat treating, or plating).37 Fabricated Metals firms serve a wide variety of industries,38
and primarily sell to other higher-level suppli-ers rather than directly to original equipment manufacturers (OEMs) or retailers. (These busi- ness models exist but are less common.) The metropolitan region, and Cook County in par-ticular, has a higher proportion than the nation of office functions related to Fabricated Metals manufacturing.39
Cook County should consider focusing on the Fabricated Metals cluster, not only because of its large size and strong concentration in the County, but because of its positive future outlook. Though Fabricated Metals, like most manufacturing industries, declined in the first decade of this century (in terms of both em-ployment and gross product), the cluster is projected to perform considerably better over the next decade.41
Interviews with local Fabricated Metals firms revealed positive revenue growth over the last several years, and most firms expect to see a continued upward revenue trajectory.
FABRICATED METALS CLUSTER MAP
Supporting services: Consulting, Financing & Investment, R&D, Training, IT, Transportation & LogisticsSuppliersCore firmsCustomers
COMPONENTS
METAL SERVICES (may be in-house)
PRIMARY METALS
EQUIPMENT TECHNOLOGY
FABRICATED METAL
MANUFACTURERS
TIER 1 INTEGRATORS
RETAIL / WHOLESALE
OEMs: Auto, Defense,
Energy, Telecom, Aerospace, etc.

PARTNERING FOR PROSPERITY: AN ECONOMIC GROWTH ACTION AGENDA FOR COOK COUNTY 23
Vehi
cle
Food
Pro
cess
ing
Pack
aged
Foo
ds
Prim
ary
Food
s
Misc
. Mfg
.
Food
Pac
kage
s
Rubb
er
Elec
trica
l
Fabr
icate
d M
etal
Com
pute
r/El
ectro
nic
Che
mic
als
Plas
tics
Non
met
allic
Mac
hine
ry
Prim
ary
Met
al
MANU
FACT
URIN
G SE
GMEN
T
278
824
653
171
280
168 50 299
2,36
5
395
472
505
383
1214
226
133
557
445
112
174 83 22 139
1,15
8
161
220
182
152
488
115
47.8
%
67.6
%
68.1
%
65.5
%
62.1
%
49.4
%
44.0
%
46.5
%
49.0
%
40.8
%
46.6
%
36.0
%
39.7
%
40.2
%
50.9
%
18,7
56
47,0
78
30,2
09
16,8
69
10,9
30
14,4
84
1,63
1
14,6
28
62,8
18
23,8
59
20,2
63
29,6
11
8,52
9
40,2
96
27,1
74
12,2
95
30,8
22
22,0
48
8,77
4
6,85
3
8,27
4
890
7,94
5
32,3
58
11,7
19
8,76
6
11,9
00
3,20
8
12,9
67
6,91
9
65.6
%
65.5
%
73.0
%
51.8
%
62.7
%
57.1
%
54.6
%
54.3
%
51.5
%
49.1
%
43.3
%
40.2
%
37.6
%
32.2
%
25.5
%
0.4
1.0
1.5
0.6
1.7
1.9
0.9
1.2
1.3
1.0
0.7
0.4
1.5
1.2
2.1
0.5
1.2
1.9
0.6
1.9
1.9
0.8
1.1
1.2
0.8
0.4
0.4
1.1
0.7
1.0
MSA (
2010
)CO
OK (2
010)
COOK
AS %
OF
MSA
MSA (
2009
)CO
OKCO
OK (2
009)
COOK
AS %
OF
MSA
MSA
ESTA
BLISH
MENT
SLO
CATIO
N QU
OTIEN
T
SUBS
ECTO
RS IN
COOK
COUN
TY M
ANUF
ACTU
RING
EMPL
OYME
NT

PARTNERING FOR PROSPERITY: AN ECONOMIC GROWTH ACTION AGENDA FOR COOK COUNTY24
TRENDS IN FABRICATED METALSSeveral trends support this positive outlook for the Fabricated Metals cluster, presenting growth opportunities and challenges for Cook County and the region.
Global market demandManufacturers recognize that major customer bases are growing in developing countries, and are fostering relationships around the world to capture business in these markets.
While some manufacturers are shifting pro- duction designed for foreign customers abroad, most of the firms interviewed indicated that they will be operating sales offices abroad, either in partnership with foreign firms or on their own, and they expect their domestic production to grow to meet these expanding global markets.
ReshoringThe recent resurgence of Fabricated Metals in the Chicago region is part of a broader national trend toward “reshoring,” in which manufac-turers who moved facilities abroad in recent decades are now bringing production back to the U.S. and looking for domestic suppliers.
The U.S. has reemerged as an attractive location for manufacturing, in part because of a changing cost equation in developing coun-tries. While manufacturing in the U.S. may still cost slightly more, the difference is less substan-tial than it used to be,42 and firms are finding other benefits from re-establishing closer con-nections between R&D and production. Domes-tic production is also typically able to support
higher-quality products, and to produce and deliver them more quickly.
FlexibilityOEMs and other customers of Fabricated Met-als manufacturers are managing their invento-ries more tightly and counting on their suppliers to deliver inventory on much shorter lead times than in the past. For example, the once-typical six- to eight-week advance notice period has shortened to just one to three weeks. Custom-ers increasingly demand product customization, as well, and are willing to pay more for it.
In order to be flexible enough to provide both standard and customized products on short notice, manufacturers are relying on more sophisticated technology and processes. These ensure reliably higher quality and increased productivity (particularly through the latest auto- mation technologies).
In short, Fabricated Metals manufacturers need the most cutting-edge equipment in order to be competitive. Having the staff capacity to operate the machinery is also imperative and requires an increasingly skilled labor force.
INNOVATION IN FABRICATED METALSOver half of Cook County’s Fabricated Metals firms have fewer than ten employees, and 30 percent have fewer than five. Such small staffs make it difficult for firms to do the level of strategic and business planning required to keep up with—let alone be on the cutting edge of—industry trends like those described above. Even among slightly larger firms, the “leaning” of manufacturing over the past two decades has often left firms with limited R&D, engineer-ing, and product development capacity, making it difficult for them to take advantage of new opportunities at home and in foreign markets.
In addition, uncertainty arising from Illinois’ political environment (for example, pensions, health care costs, and workers’ compensation) makes the region’s Fabricated Metals firms hes-itant to invest capital in new technologies, R&D, and greater workforce capacity. Chicago-area Fabricated Metals firms recognize the impor-tance of continuously adopting more advanced technologies and processes, but have been con- strained in doing so. Opportunities to grow the cluster may emerge if these constraints can be addressed.
Some firms that are confident in their own ability to adapt and innovate raise concerns about their suppliers’ inferior productivity. This
PARTNERING FOR PROSPERITY: AN ECONOMIC GROWTH ACTION AGENDA FOR COOK COUNTY 25
is particularly true of metal services suppliers, a significant part of the cluster. Productivity analysis confirms that, while core Fabricated Metals firms in the region outperform national firms in output per worker, metal services firms underperform.43 Further engagement with firms in the Fabricated Metals cluster, particularly with those in metal services, is likely to reveal pro- mising opportunities for supporting technology upgrades that enhance performance and growth.
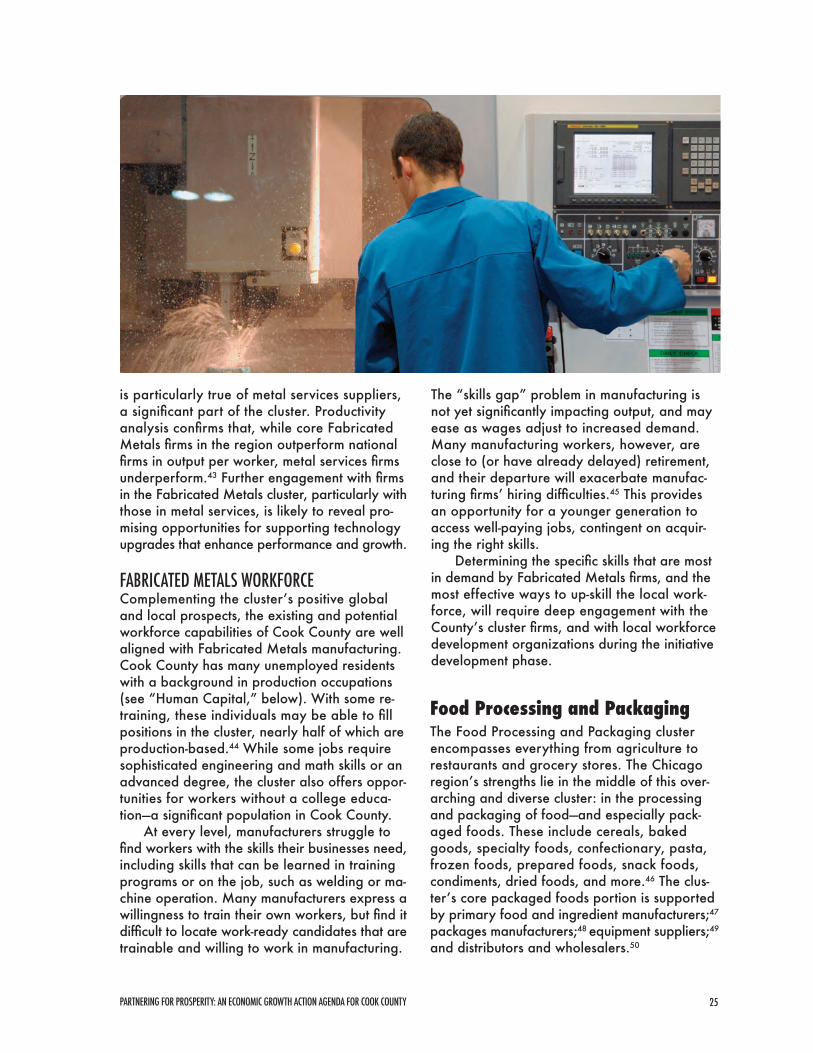
FABRICATED METALS WORKFORCEComplementing the cluster’s positive global and local prospects, the existing and potential workforce capabilities of Cook County are well aligned with Fabricated Metals manufacturing. Cook County has many unemployed residents with a background in production occupations (see “Human Capital,” below). With some re- training, these individuals may be able to fill positions in the cluster, nearly half of which are production-based.44 While some jobs require sophisticated engineering and math skills or an advanced degree, the cluster also offers oppor-tunities for workers without a college educa-tion—a significant population in Cook County.
At every level, manufacturers struggle to find workers with the skills their businesses need, including skills that can be learned in training programs or on the job, such as welding or ma-chine operation. Many manufacturers express a willingness to train their own workers, but find it difficult to locate work-ready candidates that are trainable and willing to work in manufacturing.
The “skills gap” problem in manufacturing is not yet significantly impacting output, and may ease as wages adjust to increased demand. Many manufacturing workers, however, are close to (or have already delayed) retirement, and their departure will exacerbate manufac-turing firms’ hiring difficulties.45 This provides an opportunity for a younger generation to access well-paying jobs, contingent on acquir-ing the right skills.
Determining the specific skills that are most in demand by Fabricated Metals firms, and the most effective ways to up-skill the local work-force, will require deep engagement with the County’s cluster firms, and with local workforce development organizations during the initiative development phase.
Food Processing and PackagingThe Food Processing and Packaging cluster encompasses everything from agriculture to restaurants and grocery stores. The Chicago region’s strengths lie in the middle of this over- arching and diverse cluster: in the processing and packaging of food—and especially pack-aged foods. These include cereals, baked goods, specialty foods, confectionary, pasta, frozen foods, prepared foods, snack foods, condiments, dried foods, and more.46 The clus-ter’s core packaged foods portion is supported by primary food and ingredient manufacturers;47 packages manufacturers;48 equipment suppliers;49
and distributors and wholesalers.50

PARTNERING FOR PROSPERITY: AN ECONOMIC GROWTH ACTION AGENDA FOR COOK COUNTY26
FOOD PROCESSING AND PACKAGING CLUSTER MAP
TRENDS IN FOOD PROCESSING AND PACKAGINGOnce known as a world center for meatpacking and candy-making, the metropolitan area has a rich legacy in food processing. The cluster still has over 100,000 employees, over three-fifths of whom work in Cook County.51 Packaged Foods is especially concentrated in Cook County, with an LQ of 1.9.52
While recent growth trends for Packaged Foods as a whole are negative, several seg-ments in which Cook County specializes are ex-pected to grow. For example, frozen foods and perishable prepared foods make up 25 percent of Cook County’s Packaged Foods employment and are growing53 as a result of consumer trends favoring convenience products.54
INNOVATION IN FOOD PROCESSING AND PACKAGINGDemand for convenience is also a major driver of innovation in the portion of the cluster that makes food packages out of paper, plastic, and to a lesser extent, glass. The food pack-ages subcluster accounts for over 14,000 jobs region-wide, and 57 percent of these are in Cook County.55
Innovations include advanced packaging that can replicate a grilled or broiled taste in the microwave; cans that can heat or cool them-
selves at the touch of a button; and smart pack- aging that can indicate when food is ripe, when it is fully cooked, or when it has spoiled.
Despite obvious opportunities for innova-tion through collaboration between manufactur-ers of packaged foods and food packages, on convenience and other issues, the two groups reportedly do not yet work together closely on these issues.56
The increasing popularity of healthy foods also offers promising opportunities. In partic-ular, the emerging field of Functional Foods offers great potential in the region. “Function-al” foods have been manipulated to provide additional health benefits when consumed (for example, yogurt with added probiotics, or vi-tamin-enhanced waters).57 Though a Functional Foods cluster has not yet visibly emerged in the region, the combined assets of Lake County’s pharmaceutical industry and Cook Coun-ty’s abundant food processing firms give it a natural advantage as a competitive center for developing and producing functional foods.
FOOD PROCESSING AND PACKAGING WORKFORCEFood Processing and Packaging, like Fabricat-ed Metals, offers employment opportunities for workers without a college education. The
RAW AGRICULTURAL
PRODUCTS
Supporting services: Consulting, Investment, Food Safety Research, Transportation and Logistics
Non-food product suppliersIngredient manufacturersDistributors & wholesalersCore firms
GENERAL GROCERY
WHOLESALERS
PRODUCE WHOLESALERS
FROZEN FOOD WHOLESALERS
MEAT AND FISH WHOLESALERS
DAIRY PRODUCT WHOLESALERS
PACKAGED FOODS
PRIMARY FOOD
PROCESSINGFRUIT AND VEGETABLE
PROCESSING
MEAT AND SEAFOOD
DAIRY PRODUCTS
EQUIPMENT AND MACHINES
PACKAGE MANUFACTURERS
RAW AGRICULTURAL
PRODUCTS

PARTNERING FOR PROSPERITY: AN ECONOMIC GROWTH ACTION AGENDA FOR COOK COUNTY 27
most common occupations in the cluster are those related to production and transporta-tion, which require primarily low- to mid-range levels of skill.58
However, interviews and industry research suggest that, as technology advances, Food Processing and Packaging jobs increasingly require higher skills. Most critically, food pro-cessors are seeking employees with the ability to operate and maintain machines.
For this reason, employers in Food Process-ing value experience in other manufacturing industries, and worker training programs for Food Processing may overlap with those for other manufacturing industries.
Transportation and Logistics is a critical cluster in the region’s economy because of its large size and outsized impact on other industries. Several organizations have recently highlighted Trans- portation and Logistics as part of their regional plans. In particular, one of the ten strategies in World Business Chicago’s “Plan for Economic Growth and Jobs” is to “become more competi-tive as a leading transportation and logistics hub.”
The Transportation and Logistics cluster is made up of several subparts that interact with each other in different ways. The largest sub-part includes freight carriers—the trains, planes, trucks, and boats that physically move goods from one place to another, and the companies that manage them.59 Freight carriers account for one-third of the cluster’s employment.
Logistics management is the next largest segment, and is made up of firms that work with shippers, receivers, carriers, and other in-termediaries to coordinate and assure efficient, prompt transport of goods.60
Suppliers are a less sizable segment of the cluster, but they play an important role as its supporting “backbone.” They include firms that make packing materials and other inputs (for ex- ample, IT systems, tractors, trailers, and industrial equipment), as well as standalone warehouses and packing/labeling firms. The segment also includes support firms, which provide services
Transportation and logistics

PARTNERING FOR PROSPERITY: AN ECONOMIC GROWTH ACTION AGENDA FOR COOK COUNTY28
such as the management of terminals, air and seaport operations, and the inspection and maintenance of equipment.
TRENDS IN TRANSPORTATION AND LOGISTICSCook County accounts for over half of all Trans- portation and Logistics employment within the region. While growth in the cluster has been mixed over the last ten years, high growth is expected in the coming decade through at least 2020. Logistics, rail, and trucking are especially important parts of the cluster in the County (see table on Page 29), while air and water are smaller in terms of both employment and ship-ping volume.
“Just in time” deliveryA global trend is changing delivery and ware- housing methods and presenting a critical challenge to the region’s Transportation and Logistics cluster. Uncertain about the economy and demand for their products, companies are keeping inventories low and ordering products only shortly before they need them (see Page 24). This puts pressure on logistics managers and freight carriers to make sure they can de-liver products quickly—or “just in time.” To do so, they are relying more heavily on sophisti-cated technology.
Congestion presents significant obstacles to just-in-time delivery, and the region is considered the third-most congested in the nation. Rail and road congestion are heaviest in Cook County, the densest part of the region.
Mitigating congestion is partially an infra-structure issue, but it can also be approached by making trucking firms more efficient, and by implementing policies for both road and rail that allow easier traffic flow. New York, for example, is creating incentives for off-peak delivery by trucking companies.
Trucking firmsTrucking tonnage is expected to increase by 70 percent by 2040, heightening pressure on road systems and firms to become more efficient. This offers an opportunity for trucking companies, but in order to benefit from it, these firms need the kinds of efficiencies that can be realized by adopting new technologies and inno- vative business practices and policies.
INNOVATION IN TRANSPORTATION AND LOGISTICSCook County’s trucking companies—like those in the region and nation—consist primarily of small firms. In fact, 88 percent of Cook Coun-ty’s more than 2,600 trucking firms have fewer than ten employees, and 81 percent have fewer
TRANSPORTATION AND LOGISTICS CLUSTER MAP
WAREHOUSING, PACKING AND
STORAGE
SUPPORT ACTIVITIES
RAIL
AIR
TRUCKING
WATER
SHIPPERS
RECEIVERSINDUSTRIAL
PACKINGIT
COURIERS
LOGISTICS CONSULTANTS
FREIGHT TRANSPORT
ARRANGEMENT
Support and supplyLogistics managersCustomersCarriers
Supporting services: Consulting, Financing & Investment, R&D, Training

PARTNERING FOR PROSPERITY: AN ECONOMIC GROWTH ACTION AGENDA FOR COOK COUNTY 29
ESTA
BLISH
MENT
SLO
CATIO
N QU
OTIEN
TEM
PLOY
MENT
Frei
ght C
arrie
rs
Rail61
Truc
king
Air
Wat
er
Logi
stic
s M
anag
emen
t
Frei
ght T
rans
port
a-tio
n A
rran
gem
ent
Cou
riers
Logi
stic
s C
onsu
ltant
s
Frei
ght S
uppl
iers
Frei
ght S
uppo
rt
Tota
l
TRAN
SPOR
TATIO
N AN
D LO
GIST
ICS
SEGM
ENT
5,51
1 8
5,25
9 36 24
1,59
6
1,10
1
195
300
900
216
8,32
3
2,79
3 8
2,63
1 34 9
757
507 99 151
398
170
4,11
8
53,4
41
9,80
9
41,4
85 351
508
38,9
95
18,1
13
18,1
95
2,68
7
39,2
82
8,30
9
140,
027
29,1
56
6,63
2
21,0
35 322
459
23,3
89
8,33
4
13,5
39
1,51
6
16,0
22
6,45
4
75,0
21
54.6
%
67.6
%
50.7
%
91.7
%
90.2
%
60.0
%
46.0
%
74.4
%
56.4
%
40.8
%
77.7
%
53.6
%
1.1
1.6
0.9
0.6
0.3
1.4
2.3
1.0
1.1
1.2
0.8
1.2
1.1
1.7
0.8
1.0
0.5
1.5
1.9
1.4
1.1
0.9
1.1
1.1
MSA (
2010
)CO
OK (2
010)
MSA (
2009
)CO
OK (2
009)
COOK
(200
9)CO
OK AS
%
OF M
SAMS
A (20
09)
SUBS
ECTO
RS IN
COOK
COUN
TY TR
ANSP
ORTA
TION
AND
LOGI
STICS

PARTNERING FOR PROSPERITY: AN ECONOMIC GROWTH ACTION AGENDA FOR COOK COUNTY30
than five. Lack of capital and limited access to information make it hard for these smaller firms to adopt the technologies that are simultane-ously advancing firm growth and mitigating congestion nationally.
For example, empty trucks returning from a delivery waste a significant amount of energy, money, and time. Larger trucking companies and third-party logistics firms (3PLs) are reduc-ing the number of these empty backhauls, max-imizing carrying capacity by combining multi-ple less-than-truckload deliveries into one and optimizing truck routes using on-board GPS systems. Smaller trucking and logistics firms are often unable to invest in the technologies that make these efficiencies possible.
LogisticsIn the logistics portion of the Transportation and Logistics cluster, Cook County is mirror-ing the national trend toward the use of 3PLs. Due in part to the rising importance and cost of technology, firms that once handled their logistics operations internally are now more likely to outsource that work to larger, special-ized logistics firms. In order to be more attrac-tive to shippers, 3PLs are offering integrated services (such as warehouse management) and advanced analytics that can identify problems and their effects on the supply chain.
Logistics firms are able to assist both man-ufacturers and trucking companies to be more efficient. By creating connections between its smaller trucking firms and its 3PLs, Cook Coun-ty may create new opportunities to promote efficiency and firm growth.
Health
Intermodal transportationGrowth in intermodal transportation is a major national and regional trend, and can be ob-served in Cook County, as well. But while other parts of the region have successfully expanded their intermodal capacities, Cook typically does not have land available at the scale required for major new facilities.
Business organizations in the South Suburbs are looking to a new Cook County Land Bank, and other tools for remediating and assembling land, as possible opportunities to support inter- modal growth. The County has provided funding assistance for improving Center Street, a critical road for access to a potential “Logistics Park Calumet” proposed by the Chicago Southland Economic Development Corporation.
The Illinois Port District, which is well-sup-ported by water, rail, and roads, is in the pro-cess of developing a new strategic plan which may address new opportunities for intermodal growth in Chicago and Cook County around the port.
TRANSPORTATION AND LOGISTICS WORKFORCEAcross all of the cluster’s sub-parts, firms in Transportation and Logistics—like those in manu-facturing—report that they have difficulty filling vacant positions. Employee retirement, both in rail and trucking, is expected to create many more job openings.
At lower skill levels, reported workforce issues include English proficiency, timeliness, and ability to follow instructions. Technical skills are also an issue in all parts of the spectrum, in- cluding the availability of high-skilled individuals who can help logistics firms innovate.62
The Health cluster encompasses several distinct sub-clusters, ranging from patient services to medical manufacturing to health supply and support services. The three regional plans for Chicago each acknowledge the importance of the Health cluster (or one of its subparts) to the regional economy, but none have identified it as a key area of focus.
Health services is one of the region’s largest clusters, with nearly 500,000 employees, but it is no bigger than would be expected given the

PARTNERING FOR PROSPERITY: AN ECONOMIC GROWTH ACTION AGENDA FOR COOK COUNTY 31
region’s population.63 It is primarily a local- serving cluster and, while medical tourism and telemedicine64 present some opportunity for exports, the region is unlikely to be a major beneficiary of these trends.65
Still, as the manager of a hospital and other health services, Cook County is an active player in the patient services subcluster. Moreover, this subcluster is naturally growing (with the popula- tion as it ages) and creating good jobs, including many for workers without college degrees.66
Medical manufacturing (including phar-maceuticals, medical devices, and bio-tech/life sciences)67 has considerably more export potential and is somewhat concentrated (partic-ularly pharmaceuticals) within the region. This concentration, however, primarily lies outside Cook County.68 Furthermore, despite promising research by local universities, life sciences and biotech are challenging and competitive indus-tries in which Cook County has limited assets.
In specific specializations within the health services subcluster, a combination of promising research with demand conditions and patient population may offer opportunities for com-mercialization and industry development. The production base, however, is not yet sufficiently developed or understood in Cook County. More exploration is required to determine whether such high-potential specializations exist, and if so, what their specific development opportuni-ties and challenges might be.
Health supply and support firms range from laundry services to IT providers to cleaning product manufacturers and distributors. Despite
wide differences in types of firm, there may be common needs among some subset of these busi- nesses, and opportunities for customer-driven innovation and productivity improvements. These opportunities are particularly relevant in light of Cook County’s role as a sizable healthcare services provider in the region and the fact that many of these firms are located within it.
HEALTH CLUSTER MAP Health supply & support
Health manufacturing
Health servicesPHARMACEUTICALS
R&D / BIOTECH
MEDICAL DEVICE MANUFACTURERS
BASIC SUPPLIES
MEDICAL EQUIPMENT
MANUFACTURERS FOOD SERVICES
IT
FACILITIES SERVICES
BUSINESS SERVICES
PROVIDERS
HOSPITALS
OTHER HEALTH SERVICES

PARTNERING FOR PROSPERITY: AN ECONOMIC GROWTH ACTION AGENDA FOR COOK COUNTY32
Suppliers to anchor institutions and headquarters
A set of firms69 that supply goods and services to business headquarters, governments, univer-sities, hospitals, and other anchor institutions is also concentrated in the region. Distinct from a “cluster” in the traditional sense of the word, what defines this set of firms is not their industry, but common customers and their place in the “procurement supply chain.”
The extent to which different suppliers over-lap across different types of institution varies. For example, all institutions use messengers and building services, but only some require laundry and food services.69 Further analysis of suppliers will allow for a better understanding of these overlaps, both at the level of the types of busi-nesses and the specific companies that serve the anchor institutions.
As one of the region’s largest institutions, the County has an added incentive to pay part- icular attention to these firms, since improving their capacity would benefit County government as a major customer. Moreover, the procurement
supply chain offers opportunities for minority- and women-owned firms, which account for a relatively large percentage of County business-es in “Other Services” (including drycleaning and laundry services, equipment and machinery repairs, administrative and support services, and accommodation and food services).70
The different industries serving headquarters and anchor institutions each have high employ-ment in the region and in Cook County. Their concentration in the County equals or exceeds the national average,71 and often includes under- invested neighborhoods. Each of the sectors is projected to grow through 2020.72 However, many of the firms within the procurement supply chain—particularly the small and medium-sized firms—tend to be locally serving rather than export-oriented.
Like all businesses, those in the procurement supply chain face many challenges, from work- force to cash-flow to capital investments. Business consulting, specialized financing, shared business services, and (for some subsets) technology and product development assistance could help a cross-section of these firms to increase their pro- ductivity, making them and the institutions they serve more competitive.
More research is required concerning the specific barriers and needs of companies in pro- curement supply chains, and how these vary across different types of suppliers.
Other clustersExisting regional economic plans73 identify several emerging clusters that have promise for the region and the County. These include clean tech—growing due to global trends favoring sustainability—and digital tech, among others.
These clusters are already receiving strong institutional support from local organizations and initiatives such as 1871, TechNexus, the Clean Energy Trust, and others. These emerging clusters deserve further attention in order to identify specific opportunities for Cook County.

PARTNERING FOR PROSPERITY: AN ECONOMIC GROWTH ACTION AGENDA FOR COOK COUNTY 33
DEVELOPMENT AND DEPLOYMENT OF HUMAN CAPITAL
of immigrants who face language barriers and do not have college degrees (see table above).
FIRM-WORKER MATCHINGThe County’s most common occupations are those in the following occupational categories: Profes-sional and Related; Service; and Management,
Foreign-born population, age 25 and over
Foreign-born population, Bachelor's or higher
Speaks English less than very well
947,887
26.2%
58.8%
487,579
31.5%
50.4%
33,625,525
27.0%
51.6%
COOK COUNTY’S IMMIGRANT POPULATIONCOOK
COUNTYREGION (COOK
EXCLUDED)UNITED STATES
Professional and Related
Service
Management, Business, and Financial
Office and Administrative Support
Sales and Related Occupations
Transportation and Material Moving
Production
Construction and Extraction
Installation, Maintenance and Repair
22.1
18.6
15.2
14.1
10.7
6.9
6.2
3.9
2.4
6.0
9.4
5.4
10.9
7.7
12.4
13.8
24.3
7.1
29.6
12.1
6.0
0.2
0.9
1.5
–5.4
1.72
3.89
4.09
2.11
3.87
2.35
2.61
2.12
2.12
2.04
2.62
COOK COUNTY’S OCCUPATIONAL MIX
OCCUPATION % OF TOTAL OCCUPA-TIONS (COOK 2011)76
% UNEMPLOY- MENT (2011)77
% EMPLOYMENT CHANGE (COOK 2008–2018)78
MEAN SKILL LEVEL: 1 = LOWEST
5 = HIGHEST79
“Human capital” refers to the knowledge and skills embedded in the labor force. It is often measured by educational attainment, but also encompasses skills and experience obtained through less formal means. Human capital plays a large role in economic growth and includes: production, attraction, and retention of highly skilled labor; effective deployment of workers’ skills into jobs that make full use of their capabil-ities; and provision of ample workforce opportu-nities for entrance and upward mobility, across all segments of the region’s population.
LEVELS OF HUMAN CAPITALThe region has a bifurcated supply of human capital. Though a higher than average propor-tion of the population has at least a Bachelor’s degree (compared to the nation), a significant proportion—particularly within Cook County—lack any education beyond high school.74 This is especially troubling because individuals with a high school diploma or less are nearly twice as likely to experience unemployment.75 Cook County also has a higher share of the region’s immigrant population, and higher proportions

PARTNERING FOR PROSPERITY: AN ECONOMIC GROWTH ACTION AGENDA FOR COOK COUNTY34
Business and Financial (see table on Page 32). These occupations are also projected to be the County’s fastest-growing, suggesting that they will continue to dominate Cook’s occupational mix in the future.
Compared to slow-growing or shrinking occupations like production, construction and extraction, and transportation and material moving, the fastest-growing occupations cur- rently have lower rates of unemployment. This suggests a mismatch in worker supply and demand: demand for workers is expected to expand in occupational categories where there is already a labor shortage, and it is expected to shrink or grow slowly where there is already a labor surplus.
Two of the County’s largest and fastest- growing occupational categories (Professional and Related, and Management, Business and Financial) require higher skill levels than many of the smaller and slower-growth occupations. Even among occupations traditionally consid-ered low- to mid-skill, like production, employ-ers increasingly seek workers with the addi-tional education, experience, and certifications needed to succeed in a more technologically advanced environment. In short, it is becoming increasingly important to upgrade skills in the labor force significantly, preparing new and existing workers for careers in faster-growing, higher-skilled occupations.
INCLUSIVENESSIn general, African-American and Latino res-idents of Cook County have lower levels of edu-cation than their White and Asian peers, and
COOK COUNTY UNEMPLOYMENT AND EDUCATION BY RACE (2011)
higher unemployment rates.80 A contributing factor to the under-inclusiveness of the region’s economy for African-Americans and Latinos in Cook County is segregation and concentrated poverty, which make it more difficult for these populations to access jobs and quality educa-tion (see Page 36).

PARTNERING FOR PROSPERITY: AN ECONOMIC GROWTH ACTION AGENDA FOR COOK COUNTY 35
Innovation is ultimately the source of all long-term economic growth.81 The term “innovation” is used here very broadly, encompassing new ideas, technologies, products, processes, mar-kets, and business models. This definition also spans all stages of the often-iterative innovation spectrum, from basic research through concept testing, to business creation (i.e., entrepreneur- ship) and growth.82 The new knowledge-based economy, heightened competition in globalized markets, and the quickening pace of change make continuous innovation imperative.
Innovation broadly occurs through three overlapping mechanisms: commercialization of R&D; cluster- and firm-based innovation; and entrepreneurship. Levels of innovation through these routes, in turn, depend upon having: an innovative culture (risk-taking, open, flexible, and adaptive); a strong ecosystem (cross-sec-tor, multi-disciplinary networks that facilitate knowledge exchange and collaborative prob-lem-solving, and connect ideas, entrepreneurs, investors, and support services); and deep grounding in the economic and industrial base (innovative clusters and firms, and strong con-nections between academic R&D and industry).
INNOVATIONThe innovation ecosystem, like the economy itself, is regional in scale. While most of the region’s major innovation assets are located in Cook County—including six major research universities83 and 70 percent of the region’s 66 top R&D centers84—Cook County government’s capacities are not well-suited to influence many aspects of the innovation ecosystem. Given the government’s capacities, cluster-based innova-tion and some aspects of the entrepreneurship environment are the most relevant areas of focus for Cook County.
Innovation in Cook County’s existing firms varies from one cluster to another, and even within clusters. In Fabricated Metals (see Pages 22 and 23), for example, the core of the cluster exhibits above-average productivity levels, suggesting innovative activities, while the productivity of some types of suppliers (for example, metal services) lags national peers.Ample opportunity exists to enhance innovation in Cook County’s highest-potential clusters. Macro trends suggest significant opportunities
SUPPORT FOR INNOVATION AND ENTREPRENEURSHIP
for innovation in the Food Processing and Packaging cluster, though it is not clear (from quantitative and anecdotal evidence) that local firms are currently taking full advantage of these opportunities. In addition, while many medium and large Transportation and Logistics firms already utilize sophisticated new technol-ogies, the small trucking firms that dominate this cluster face barriers to the adoption of new technologies, offering opportunities to expand innovation in this area.
ENTREPRENEURSHIPOne important avenue by which new products and services to enter the marketplace is the cre-ation of new businesses (entrepreneurship). This is a particular area of focus and opportunity in the new global economy; many technology- enabled fields offer low barriers to entry, and the agility of small enterprises makes them more able to adapt and redeploy their assets to keep pace with changing market dynamics.
Cook County fares roughly on par with the region and the nation in terms of business starts and business churn,85 and performs particularly well in its share of women and minority entrepreneurs. Within Cook County, 30 percent of businesses are minority-owned and 32 percent are owned by women, while within the region as a whole, only 16 percent of businesses are minority-owned and 28 per-cent are owned by women.86
While Cook County’s businesses are some- what more inclusive than the rest of the region’s, women and minorities are not yet achieving entrepreneurship levels on par with their repre-sentation in the general population,87 and they are generally over-represented in lower-growth industries. Strengthened support for minority and women entrepreneurs, particularly within industries and clusters with high growth poten-tial, would contribute to a stronger innovation ecosystem both in Cook County and in the region overall.

PARTNERING FOR PROSPERITY: AN ECONOMIC GROWTH ACTION AGENDA FOR COOK COUNTY36
SPATIAL EFFICIENCY“Spatial efficiency” refers to the arrangement of economic activity across the region, includ-ing the spatial arrangement of firms, workers, consumers, and relevant institutions; and the physical and virtual connections among them.
The region’s economy is most likely to grow when its assets can locate near each other, reducing transaction costs and enhancing clus-tering benefits. Connecting assets to each other via strong physical and virtual infrastructure also promotes growth by assisting the efficient movement of goods, people, and ideas.
COMPACT, WELL-CONNECTED URBAN FORMThe new global economy favors compact, well- connected, mixed-use areas that serve as nodes of economic activity. Cook County is denser than the rest of the region, giving it a competitive ad- vantage in this regard.88 The current trend of people and firms moving back toward density, including closer proximity to downtown, also offers the County opportunities to redevelop land and neighborhoods.
Connectivity, however, is a challenge in the region and in Cook County. With 71 annual hours of traffic delay per auto commuter, the region is the third-most congested in the nation (see “Transportation and Logistics,” above).89 Transit access in Cook County is superior to that in the rest of the region, but Cook’s congestion and commute times are worse, particularly with- in the City of Chicago. Suburban Cook and the rest of the region have relatively similar perfor-mance in this respect.90
SEGREGATION AND ISOLATIONPhysical disconnection (geographic isolation and segregation) and social disengagement act as barriers between disadvantaged popula-tions and economic opportunities. Cook County includes several areas of concentrated poverty that are largely disconnected from the region’s job centers. The maps on Page 37 demonstrate that the places with the highest commute times are also those with the highest poverty rates,91 and that the most isolated areas are on the south and west sides of the City of Chicago.
JOBS-HOUSING MISMATCHSegregation and isolation contribute to the re- gion’s jobs-housing mismatch, making it more difficult to find housing near employment and vice versa. Strong connections and ease of ac-cess, on the other hand, boost worker and firm productivity and reduce the costs of turnover. This places a premium on proximity of jobs and housing (achievable through the compact, mixed-use urban form discussed above), but also on good connections between the two when they are more widely separated.
Workers in many parts of the region have trouble accessing job centers due to a lack of affordable housing near employment opportu-nities, combined with insufficient transit. The re-gion’s high levels of congestion increase these challenges. Job access is often most difficult for workers with low or moderate incomes. Between 2002 and 2008, for example, the region add-ed over 110,000 jobs, but the total number of jobs within a half-mile of public transit actually declined, with lower-paying jobs seeing the sharpest drop.92
Affordable housing and transit access also need to be well-aligned with residents’ skill lev-els. Lower-skilled workers, in particular, need better access to the lower-skilled jobs available in the County’s suburban job corridors (for ex- ample, along I-90).93
The Center for Neighborhood Technology (CNT) and others have identified promising transit-oriented development opportunities that could support better job access for the County’s residents. Local and regional policy and fund-ing could be better-aligned to advance these existing projects.94
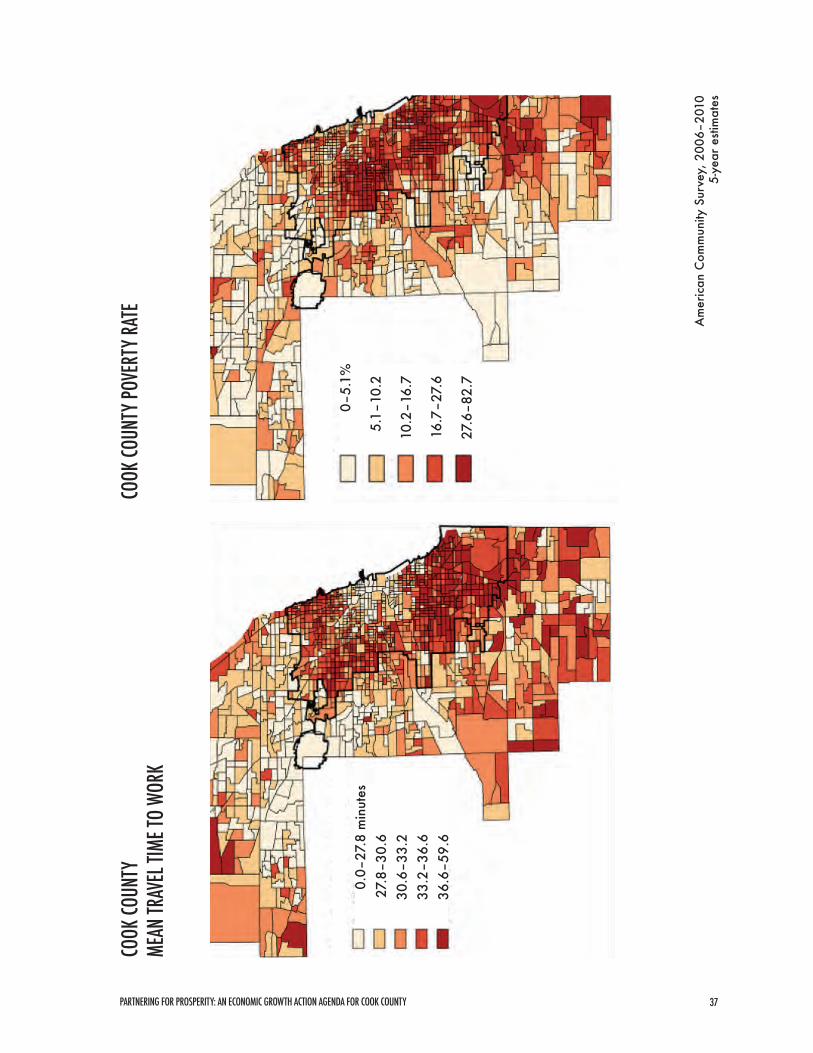
PARTNERING FOR PROSPERITY: AN ECONOMIC GROWTH ACTION AGENDA FOR COOK COUNTY 37
COOK
COUN
TY
MEAN
TRAV
EL TI
ME TO
WOR
KCO
OK CO
UNTY
POVE
RTY R
ATE
0.0–
27.8
min
utes
27.8
–30.
6 m
inut
es30
.6–3
3.2
min
utes
33.2
–36.
6 m
inut
es36
.6–5
9.6
min
utes
0–5.
1%
5.1–
10.2
%
10.2
–16.
7%
16.7
–27.
6%
27.6
–82.
7%
Am
eric
an C
omm
unity
Sur
vey,
200
6–20
105-
year
est
imat
es

PARTNERING FOR PROSPERITY: AN ECONOMIC GROWTH ACTION AGENDA FOR COOK COUNTY38
NEXT-GENERATION INFRASTRUCTURE Investments in transformative infrastructure in-crease the productivity and efficiency of busi- nesses and households. Investments may include: upgraded, technology-enabled transportation networks; high-speed transit; expanded access to high-speed Internet; energy efficiency, gen-eration, and transmission; specialized industrial and innovation parks; and many others. Strong broadband networks for high-speed Internet are an especially critical component for competing in the digital economy and gaining access to global markets.
The metropolitan region and Cook County have a strong foundation of physical and virtu-al infrastructure from which to build. Nearly all of Cook County (and the region) has broad-band access of at least 10 Mbps, with some areas closer to 100 Mbps.95 However, neither Cook County nor the rest of the region have in-frastructure in place for the fastest connections.
Several initiatives are underway in Cook County to improve broadband access, such as its partnership with the CTA, which will provide a connection to Stroger Campus using existing CTA cable, and efforts by South Suburban Mayors and Managers Association (SSMMA), Broadband Illinois, and others. These programs represent critical steps toward creating and maintaining the next-generation infrastructure necessary to foster economic growth.

PARTNERING FOR PROSPERITY: AN ECONOMIC GROWTH ACTION AGENDA FOR COOK COUNTY 39
The new global economy places a premium on coordination and collaboration. For institutions, this means ensuring that programs and policies are designed to maximize flexibility; efficiency and streamlined processes; information shar-ing; and engagement with citizens, businesses, and the civic sector. To promote economic growth in this new environment, institutions also need capacity for developing deliberate, targeted economic growth strategies and for engaging across the public, private, and civic sectors to implement them.
The region is making progress toward these goals, but much work still remains to be done. Illinois has particular challenges due to its cur- rent fiscal crisis, and this puts still more pressure on local governments to demonstrate that the public sector can be efficient and responsive. The following three aspects of governance are particularly important in this regard.
GOVERNMENT FRAGMENTATIONThere are 1,723 units of government in thecChi-cago metro area and 543 within Cook County.96
This results in costly and often duplicative ser- vice provision, imposing bureaucratic costs on businesses. In addition, these governments of-ten engage in zero-sum competition with each other for firms.
The WBC “Plan for Economic Growth and Jobs” includes a strategy to improve gover-nance, and substantial and encouraging steps are underway in the region and in Cook Coun-ty. The County and the City of Chicago formed the City-County Joint Committee on Collabora-tion to identify opportunities for coordinated service provision and procurement, with a focus on cost savings for both entities.
The Joint Committee has since identified 19 opportunities for collaboration, including a merger of three workforce boards (saving $2.2 million annually), an online data sharing portal, and a shared application process for certifying MWBEs. It set a goal of saving as much as $140 million by 2014 and has saved nearly $40 million to date.97 The Metropolitan Mayors’ Caucus and the Chicago Metropolitan Agency for Planning (CMAP) have also taken initial steps to address suburban collaboration opportunities.98
Cook County government faces challenges with internal, as well as external, fragmentation. For example, there are opportunities for greater programmatic alignment within the Offices under the President. In addition, the County faces some unique challenges because, unlike a typical executive branch in which the Chief Executive has authority over the budget and operations of all departments, Cook Coun-ty has several quasi-independent offices run by elected officials, including (for example) the Assessor’s Office, the County Clerk, and the Sheriff’s Office. The Cook County Board approves these offices’ budgets, giving it some leverage, but does not control their operations. Alignment and coordination of strategies and programs across these offices could be substan-tially enhanced.
TAX-VALUE PROPOSITIONResidents and firms are not attracted to a loca- tion based solely on low taxes. They seek sites that offer the highest value (to them) in public goods and services—for example, schools, infra- structure, and public safety—for the amount of taxes paid.
Cook County’s tax-value proposition varies by municipality, but County government does contribute to the equation. For example, unlike other Illinois counties, which assess all properties at a constant rate of 33.33 percent of market value, Cook assesses commercial and industri-al properties at higher rates than residential
EFFECTIVE AND EFFICIENT INSTITUTIONAL ENVIRONMENT

PARTNERING FOR PROSPERITY: AN ECONOMIC GROWTH ACTION AGENDA FOR COOK COUNTY40
properties. This is called “classification,” and it results in a typically lower effective residential property tax rate and a typically higher effec-tive industrial/commercial property tax rate than in other counties. However, the impact varies by municipality.99
Both CMAP and the Civic Federation re- commend abolishing Cook County’s proper-ty tax classification system. Recognizing the imbalance of this tax policy and its negative consequences on economic development, the Cook County Board of Commissioners reduced the assessment rates of non-residential property classes in 2009, but the classification system still remains in force.
On the other hand, Cook County govern-ment provides value in the form of healthcare, safety services, infrastructure assets, and other public goods, as well as through targeted eco- nomic development programs. As Cook County government becomes more strategic and effi-cient, and as it implements this Action Agenda, its tax-value proposition for the businesses and residents it seeks to retain and attract should substantially improve.
CROSS-SECTOR GOVERNANCESince 2011, Cook County has been active in seeking partnerships with the City of Chicago, suburban Cook municipalities, collar counties, and civic-sector groups. The County contains, for example, four housing collaboratives: part-nerships of local governments and non-profit organizations that organize around a joint re- development strategy. The two most developed of these (West Cook County Housing Collab-orative and Chicago Southland Housing and Community Development Collaborative) have succeeded in attracting nearly $35 million in capital to their member communities.100

PARTNERING FOR PROSPERITY: AN ECONOMIC GROWTH ACTION AGENDA FOR COOK COUNTY 41
SUMMARYThe regional economy is large, diverse, and dynamic, spanning more than a dozen counties and encompassing parts of three states. The counties, municipalities, and neighborhoods that comprise the region are highly dependent on each other’s economic resources, including workers, firms, institutions, and infrastructure. For example, workers access job opportunities and firms interact with customers, suppliers, and partners throughout the region, without regard for political boundaries. These linkages inex-tricably tie together the economic fates of the region’s constituent parts.
Cook County is the hub of this large, inte- grated economy, accounting for more than half of the region’s population, jobs, labor force, and output. Like the region, however, Cook County is bifurcated with respect to many economic characteristics: it is home to some of the region’s most valuable economic assets and some of its most significant challenges.
Examined in the context of over-arching regional growth opportunities, Cook County’s assets reveal significant economic potential. In close alignment with regional strengths in advanced manufacturing and transportation and logistics, the County demonstrates growth potential in its sizable concentrations of firms related to Fabricated Metals, Food Processing and Packaging, and trucking, rail, and logistics. Cook County boasts the region’s most substan-tial concentration of transportation infrastruc-ture, and its most plentiful opportunities for creating the dense, well-connected communities that can increase critical interaction and cluster-ing benefits.
The County also houses, however, a dis-proportionate number of the region’s most underutilized assets. These, over time, must be developed and productively deployed in order to produce successful, overall regional econom-ic growth. The County possesses an outsized share of residents without post-high school ed-ucation or training, many of whom will require up-skilling in order to participate fully in the knowledge economy. The region’s minority and low-income populations are also most concen-trated in Cook County, and are often geograph-ically and socially isolated from mainstream economic opportunities, both inside and beyond County borders. Cook’s small businesses and
minority- and women-owned firms offer simi-lar opportunities to drive growth by means of better integration into the economy. The County also holds land ripe for redevelopment and neighborhoods ripe for revitalization, as people and firms move back towards density.
Cook County needs to adopt a new agenda for economic growth in order to build from and fully utilize its plentiful assets, and to mitigate the challenges that threaten regional prosperity. Its agenda needs to address all five of the glob-al economy’s market levers, and the strategies comprising the agenda must be integrated so that, as each one is implemented, it reinforces the others.
Cook County government should take an active leadership role in specifying and advanc- ing this agenda. As it does so, the County should focus on the economic aspects and tools that offer it the greatest scope for influence, and should seek out opportunities to partner with other jurisdictions and organizations, whenever and wherever such collaborations are the best drivers for inclusive regional economic growth.

PARTNERING FOR PROSPERITY: AN ECONOMIC GROWTH ACTION AGENDA FOR COOK COUNTY42
1. Increase County government’s transparency, efficiency, and accountability
2. Increase suburban government efficiency through shared services and centralized capacities
3. Increase the region’s capacity for strategic, coordinated economic growth initiatives
4. Increase the productivity of Cook County’s manufacturing clusters:
(a) Increase productivity in the Fabricated Metals cluster
(b) Increase productivity in Food Processing and Packag-ing cluster and promote the development of a Func-tional Foods cluster
5. Increase competitiveness of anchor institution suppliers
6. Promote productivity and efficiency to grow Cook County’s Transportation and Logistics cluster
7. Improve the quality and efficiency of the region’s trans-portation infrastructure
8. Support the emergence of dense, mixed-use, well-connected communities
9. Improve the alignment of Cook County residents’ skills with employer demand
GOVERNANCE
PRODUCTION
SUPPORT
STRATEGIES FOR PROMOTING ECONOMIC GROWTH

PARTNERING FOR PROSPERITY: AN ECONOMIC GROWTH ACTION AGENDA FOR COOK COUNTY 43
The economic analysis summarized in Chapter 3, considered along with the particular capacities of County government, suggests nine priority strategies as effective, realizable ways that County government can promote growth.
The proposed strategies fall into three general categories. The first is a set of governance strategies premised on the fact that businesses will invest in regions with effective institutions, and that regional collaboration is a necessary ingredient of successful economic growth strategies. The second group focuses on production sectors of the economy, because these—rather than retail or real estate—are the primary drivers of eco-nomic growth. The third group targets key areas that “support” economic growth and enable markets by providing high-quality infrastructure and human capital, and strong communities with efficient connections to job centers. The individual strategies are described in more detail below.
CHAPTER 4
Cook County’s economic growth strategies
Good government is attractive to investors. The State currently faces important fiscal and political challenges, and this puts additional pressure on local governments to demonstrate transparency, efficiency, and accountability.
Cook County government is making great strides in improving both the reality and the perception of its efficiency and effectiveness. Continuing progress on this front will increase trust and create the preconditions for success-fully taking on new economic growth initiatives.
To be a well-run, effective government, the County must be open and transparent, making it possible for businesses and residents to under- stand and influence its decision-making. The County’s collaborative Open Data initiative, for example, is a significant advance in this regard.
Cook County government must also be flex-ible, adapting swiftly to new challenges and opportunities—and efficient, able to process requests, make payments, and execute other tasks quickly and accurately. This is especial-
ly important when the County interacts with businesses. Sustained efforts to improve these dealings (recent County legislation requiring prompt payment for sub-contractors offers a good example) will have a long-term positive impact on Cook County’s economic environment.
Finally, Cook County must engage the pri-vate and civic sectors, drawing on their expertise to create additional capacity. The President’s new Council of Economic Advisors, which brings together business leaders from across the Coun-ty, is an important step in this direction.
1 INCREASE COUNTY GOVERNMENT’S TRANSPARENCY, EFFICIENCY, AND ACCOUNTABILITY
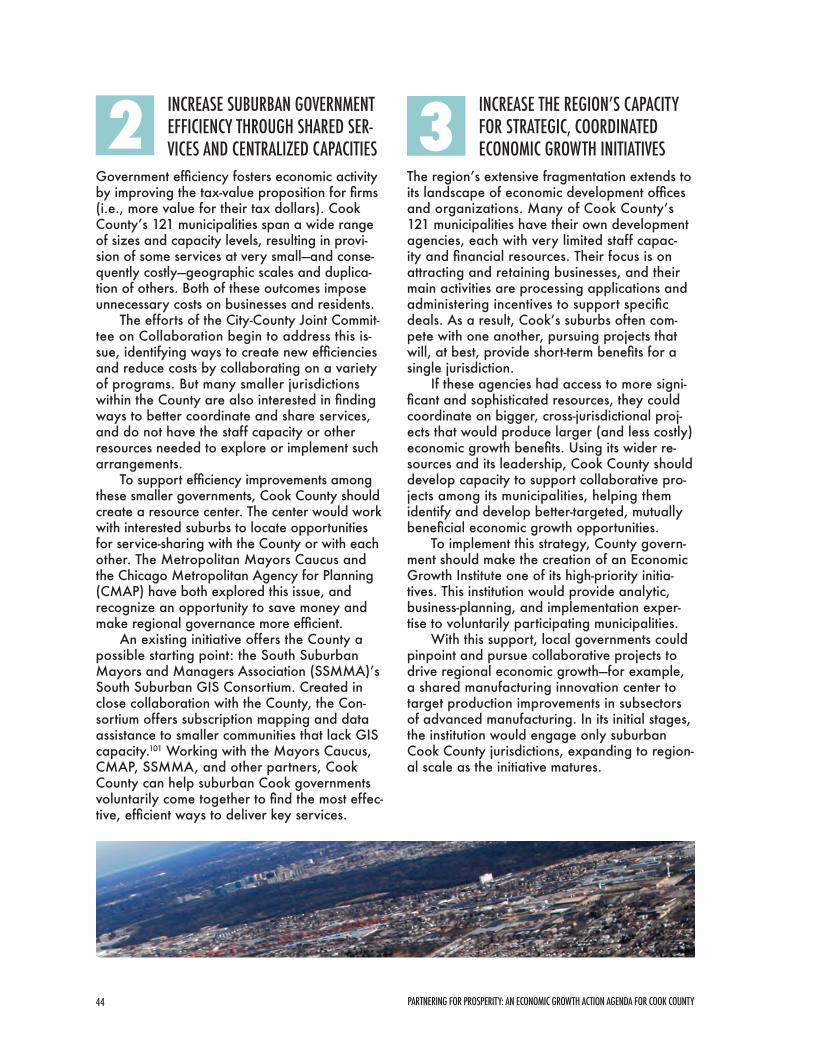
PARTNERING FOR PROSPERITY: AN ECONOMIC GROWTH ACTION AGENDA FOR COOK COUNTY44
INCREASE SUBURBAN GOVERNMENT EFFICIENCY THROUGH SHARED SER-VICES AND CENTRALIZED CAPACITIES
Government efficiency fosters economic activity by improving the tax-value proposition for firms (i.e., more value for their tax dollars). Cook County’s 121 municipalities span a wide range of sizes and capacity levels, resulting in provi-sion of some services at very small—and conse-quently costly—geographic scales and duplica-tion of others. Both of these outcomes impose unnecessary costs on businesses and residents.
The efforts of the City-County Joint Commit-tee on Collaboration begin to address this is-sue, identifying ways to create new efficiencies and reduce costs by collaborating on a variety of programs. But many smaller jurisdictions within the County are also interested in finding ways to better coordinate and share services, and do not have the staff capacity or other resources needed to explore or implement such arrangements.
To support efficiency improvements among these smaller governments, Cook County should create a resource center. The center would work with interested suburbs to locate opportunities for service-sharing with the County or with each other. The Metropolitan Mayors Caucus and the Chicago Metropolitan Agency for Planning (CMAP) have both explored this issue, and recognize an opportunity to save money and make regional governance more efficient.
An existing initiative offers the County a possible starting point: the South Suburban Mayors and Managers Association (SSMMA)’s South Suburban GIS Consortium. Created in close collaboration with the County, the Con-sortium offers subscription mapping and data assistance to smaller communities that lack GIS capacity.101 Working with the Mayors Caucus, CMAP, SSMMA, and other partners, Cook County can help suburban Cook governments voluntarily come together to find the most effec-tive, efficient ways to deliver key services.
INCREASE THE REGION’S CAPACITY FOR STRATEGIC, COORDINATED ECONOMIC GROWTH INITIATIVES
The region’s extensive fragmentation extends to its landscape of economic development offices and organizations. Many of Cook County’s 121 municipalities have their own development agencies, each with very limited staff capac-ity and financial resources. Their focus is on attracting and retaining businesses, and their main activities are processing applications and administering incentives to support specific deals. As a result, Cook’s suburbs often com-pete with one another, pursuing projects that will, at best, provide short-term benefits for a single jurisdiction.
If these agencies had access to more signi- ficant and sophisticated resources, they could coordinate on bigger, cross-jurisdictional proj-ects that would produce larger (and less costly) economic growth benefits. Using its wider re-sources and its leadership, Cook County should develop capacity to support collaborative pro- jects among its municipalities, helping them identify and develop better-targeted, mutually beneficial economic growth opportunities.
To implement this strategy, County govern-ment should make the creation of an Economic Growth Institute one of its high-priority initia-tives. This institution would provide analytic, business-planning, and implementation exper-tise to voluntarily participating municipalities.
With this support, local governments could pinpoint and pursue collaborative projects to drive regional economic growth—for example, a shared manufacturing innovation center to target production improvements in subsectors of advanced manufacturing. In its initial stages, the institution would engage only suburban Cook County jurisdictions, expanding to region- al scale as the initiative matures.
2 3

PARTNERING FOR PROSPERITY: AN ECONOMIC GROWTH ACTION AGENDA FOR COOK COUNTY 45
INCREASE PRODUCTIVITY IN THE COUNTY’S FABRICATED METALS CLUSTER
The region has an important concentration in manufacturing, with an especially promising Fabricated Metals cluster based in Cook Coun-ty. To compete successfully in the new global economy, Fabricated Metals firms need to have access to cutting-edge production technology and to skilled workers who can operate and maintain it. They will also need to be strategic as they attempt to diversify their markets and capture new business.
To meet the cluster’s growth needs in tech-nology, workforce, and planning, the County should partner with World Business Chicago’s Advanced Manufacturing strategy team, col-laborating most actively on initiatives that will benefit Fabricated Metals. Wherever possible, its own initiatives should coordinate with those being developed by the strategy team.
Cook County should also exercise its region- al leadership to convene stakeholders in this high-priority cluster, articulating and promoting the strategy’s goals and the initiatives that will flow from it. Finally, the County should align its existing economic development programs (including tax incentives, grants, and workforce dollars) to assist growth in Fabricated Metals.
INCREASE PRODUCTIVITY IN THE COUNTY’S FOOD PROCESSING AND PACKAGING CLUSTER AND PROMOTE THE DEVELOP-MENT OF A FUNCTIONAL FOODS CLUSTER
The Food Processing and Packaging cluster holds significant promise as an engine for eco-nomic growth in Cook County and the region. Most of the region’s economic development or-ganizations, however, have not demonstrated interest in food-related clusters, in part because their underlying dynamics are not well under-stood. Producing a more nuanced assessment of the opportunities and challenges facing this prominent cluster would be a valuable step to-ward engaging firms and institutional partners in a cluster-targeted initiative.
Given the Food Processing and Packaging cluster’s importance to the County’s economy, County government should encourage its part-ners to consider investing in the cluster more actively. The County could partner with World Business Chicago’s Advanced Manufacturing strategy team, for example, to lay the necessary analytical groundwork for creating cluster-sup-port initiatives. Once these were developed, the County could then align its programmatic resources (including tax incentives, grants, and workforce funding) to support them.
Within this cluster, County government should also investigate opportunities to sup-port the development of a regional Functional Foods subcluster, by positioning Cook County’s Health and Hospitals programs—where appro-priate—as early customers for its products. For example, healthcare providers might benefit from early access to new foods that support nutrition in particular patient populations (such as diabetics or the elderly).
44a
4b
INCREASE THE PRODUCTIVITY OF COOK COUNTY’S MANUFAC-TURING CLUSTERS, ESPECIALLY FABRICATED METALS AND FOOD PROCESSING AND PACKAGING

PARTNERING FOR PROSPERITY: AN ECONOMIC GROWTH ACTION AGENDA FOR COOK COUNTY46
As a government and as the operator of large hospital and jail systems, County government purchases a significant quantity of goods and services from a wide range of companies. Many other large organizations and firms within the County buy similar arrays of goods and ser-vices, and may share common local suppliers.
County government and other County an-chor institutions (including local governments, hospitals, universities, and business headquar-ters) would benefit from increased innovation, efficiency, and productivity among common suppliers. Increasing the competitiveness of these firms and enabling their growth would particularly benefit Cook’s high concentration of SWMBEs, as well as its neighborhoods (where these firms are disproportionately located).
This is not a “buy local” or SWMBE set-aside strategy. It is more akin to a supply-chain enhancement or cluster strategy: its primary purpose is not to reallocate purchasing dollars (except to the extent that local suppliers in fact
become more competitive), but to enhance the competitiveness of Chicago-region firms that have—or could have—County anchor institutions as their customers.
Effectively implemented, this strategy will create economic growth by increasing produc-tivity among the region’s service and supply businesses, in turn improving the performance of, and the competitiveness of the region for, anchor institutions and business headquarters. Similar strategies are already common among large OEMs (such as automakers), who im-prove their own productivity by assisting their suppliers with quality control, process improve-ment, and so forth.
To implement its strategy for assisting anchor- institution and headquarters suppliers, Cook County should work with the Neighborhood Assets strategy team at World Business Chi-cago, which is exploring ways to encourage growth among Chicago-area SWMBEs; and with the University of Chicago, which is design-ing a heavily overlapping strategy among its many suppliers.
With these and other partners, County government should identify subsets of firms that provide goods and services to Cook County and to other anchor institutions. The partners should then investigate the barriers impeding growth among these suppliers—who represent a very diverse set of products and services—to see if there are common opportunities for increased productivity that can be addressed. Based on these findings, Cook County and its partners can then develop specific products and services, ranging from shared back office services to business consulting to finance, to in-crease the competitiveness of the region’s insti-tutional suppliers, especially among SWMBEs.
Other resources in the region could also provide insight and important services related to this strategy. The County should also research relevant national models, such as NextStreet’s related programming.
5 INCREASE THE COMPETITIVENESS OF ANCHOR INSTITUTION SUPPLIERS

PARTNERING FOR PROSPERITY: AN ECONOMIC GROWTH ACTION AGENDA FOR COOK COUNTY 47
The region’s longstanding advantages in Trans-portation and Logistics are being tested. Glob-al trends require more efficient movement of people and goods and, at the same time, the region is increasingly congested. To encourage growth in its Transportation and Logistics clus-ter, Cook County should promote and assist the initiatives being developed by World Business Chicago’s Transportation and Logistics strategy team. Promising initiatives include a Center of Excellence, which would advance the adoption of innovative technologies and processes in the freight sector, and an Urban Logistics Leader-ship Council that would be a regional advocate for the cluster’s growth needs.
Cook County could also partner with the World Business Chicago strategy team and oth-ers to explore whether initiatives to support the efficiency of small trucking companies can have a positive impact. One example to research further as a possible model is Cascade Sierra Solutions, in Oregon. This non-profit provides financing and technical assistance to truckers who want to upgrade their fleets to be more energy-efficient.
County government should also identify further opportunities to improve the cluster’s access to a skilled workforce, through the Chi- cago Cook Workforce Partnership and the agencies it funds, and through partnerships with community colleges and other workforce development providers.
The Partnership’s Business Relations & Eco-nomic Development Unit, for example, aims to provide integrated, innovative business services and targeted workforce development programs for key regional industries, including Transpor-tation, Distribution and Logistics.102 Olive Har-vey College is creating a new Transportation, Distribution and Logistics campus, and several south suburban community colleges are forg-ing a partnership to address the needs of this sector. Cook County should seek out opportu-nities to expand and multiply efforts like these, making strategic use of its existing workforce development resources (including incentives, grants, and workforce dollars).
In addition, Cook County has already start-ed to use its resources to support intermodal development in the south suburbs by devoting transportation funds to improving Center Street. New tools, like its Land Bank and proposed Section 108 Loan Fund, could help with land assembly necessary to make older industrial properties more available for intermodal and/or manufacturing facilities. The proposed cri-teria for the Section 108 loan program can be a model for focusing Cook County economic development tools on key sectors, including Transportation and Logistics.
6 PROMOTE PRODUCTIVITY AND EFFICIENCY TO GROW COOK COUNTY’S TRANSPORTATION AND LOGISTICS CLUSTER

PARTNERING FOR PROSPERITY: AN ECONOMIC GROWTH ACTION AGENDA FOR COOK COUNTY48
IMPROVE THE QUALITY AND EFFICIENCY OF THE REGION’S TRANSPORTATION INFRASTRUCTURE
The metropolitan region is a transportation hub and its workers and businesses rely heavily on road, rail, air, and water networks as resources for success. Improving the quality and efficien-cy of the region’s transportation infrastructure will bolster the region’s economy by expanding these resources and strengthening one of its key competitive advantages. These improvements should be focused on reducing congestion, im-proving transit access, and promoting efficient, effective management of the Chicago region’s freight system.
Cook County should partner with the Chica-go Metropolitan Agency for Planning (CMAP), which has deep expertise in the region’s trans-portation issues, and should align its economic growth activities with CMAP’s GOTO 2040 regional plan. For example, the County should add its voice to regional support for GOTO 2040’s congestion pricing proposal, which out-lines a cost-effective way to improve traffic flow.
Given Cook County’s significant jobs-hous-ing mismatch and the negative impact this has on underserved residents and neighborhoods, the County should take a leadership role in pro-moting better regional public transit. The County and its partners should cooperate as advocates for more effective transit management, focusing on issues including (but not limited to): improv-ing system integration; replacing rigid funding formulas with strategic planning and resource allocation; and developing permanent capital funding sources for maintaining and expanding the existing system.
Cook County should also become more en-gaged with freight-related infrastructure issues, since these have an impact on Transportation and Logistics and the County’s various manu-facturing clusters. As a first step, the County should appoint a Director of Freight Services to coordinate its freight-related programs. Current-ly, these programs (such as Complete Streets, the Section 108 loan guarantee program, and freight-related infrastructure development pro-grams) are spread among a number of County agencies. Initial projects for the Director should include development and implementation of a County-wide freight mobility and land use plan, and collaborations with municipalities to optimize the County’s truck routes.
SUPPORT THE EMERGENCE OF DENSE, MIXED-USE, WELL-CONNECTED COMMUNITIES
Cook County contains many underutilized human capital, real estate, and business assets, as well as untapped business market opportu-nities, and all of these are essential to long-term, sustainable economic growth. The County should create the conditions that will allow it to take advantage of two natural market tenden-cies in the emerging economy: a trend favoring dense, mixed-use, well-connected environments; and increasing demand for skilled labor and strong local supply chains. This means revital- izing neighborhoods, and developing and deploying their assets into the regional econo-my. It requires addressing concentrated poverty and segregation, particularly Cook County’s jobs-housing mismatch (see Chapter 3). Many job centers are inaccessible to residents who have no access to a car or adequate public transit, or to affordable housing in areas where the region’s jobs are concentrated.
Cook County should work with World Busi-ness Chicago’s Neighborhood Assets strategy team, collaborating on initiatives to revitalize and connect neighborhoods, to create inno-vation districts that combine entrepreneurship and industry cluster development with place-based development, and to enhance compet-itiveness and market share of SMWBEs. The County should also continue its collaboration with other related WBC initiatives, such as the delivery of targeted workforce training.
Cook County should make strategic use of its community development resources (including CDBG, NSP, and HOME funding) to support mixed-use, high-density development. The new global trends mentioned above are generating important opportunities to transform struggling neighborhoods into vibrant, well-connected communities that create local jobs for residents. County government should make the most of this moment’s potential. It should also target its community development resources to the cre-ation of affordable housing near public transit and job centers, making it easier for workers to reach employment opportunities. Its new transit-oriented Section 108 Loan Guarantee, for example, is a step in this direction.
Finally, Cook County should continue its broadband expansion efforts in under-served
7 8

PARTNERING FOR PROSPERITY: AN ECONOMIC GROWTH ACTION AGENDA FOR COOK COUNTY 49
communities, including the pilot project it is car-rying out in partnership with the South Subur-ban Mayors and Managers Association (SSM-MA). Increased access to broadband will make these neighborhoods more attractive places to do business, and will help residents connect virtually to the region’s economic opportunities.
OTHER REGIONAL ECONOMIC GROWTH STRATEGIESThe Economic Growth Action Agenda is a living document, and will need updating as the eco-nomic environment changes over time and new information becomes available. Cook County government should continually update its strat-egies and create new ones, to reflect develop-ments in the region and its economy.
Emerging industriesCook County should monitor emerging indus-tries for new strategic opportunities. The re-gion’s economy shows promise in sectors other than those mentioned in the Economic Growth Action Agenda’s current strategies. These in-clude “clean tech” and energy efficiency; digital technology; and medical manufacturing.
The County should watch the progress of these business clusters, looking for opportuni-ties to promote their growth. As an important purchaser of medical equipment and digital technology, for example, the County could accelerate innovation by making itself an early adopter of new technologies or, as it contin-ues implementing its energy-efficiency retrofit programs, by hosting “green” technology pilot projects. Cook County’s scope for impact will increase as its understanding of the regional economy grows.
Other agencies promoting regional growthAs it sets its economic growth strategies in motion, Cook County will need to collaborate closely with the City of Chicago, suburban municipalities, the collar counties, and numer-ous civic and private partners throughout the region. Cook County should especially keep other, complementary regional strategies in view—these may offer Cook County opportu-nities to align its resources with those of other agencies.
The Economic Growth Action Agenda makes particular mention of three well-designed plans for promoting regional growth: World Business Chicago’s Plan for Economic Growth and Jobs, the Chicago Metropolitan Planning Agency’s GO TO 2040, and the OECD Tri-State Terri-torial Review. The table on Pages 50 and 51 summarizes areas of overlap between Cook County’s Economic Growth Action Agenda and these regional growth plans.
9The mismatch between the skills of Cook County residents and the jobs employers are seeking to fill will worsen in coming years, as its jobs increasingly require higher levels of education and skills. Cook County has already begun the process of making its workforce development programs more employer-driven by creating the combined Chicago-Cook Workforce Partnership, and by working with Skills for Chicagoland’s Fu-ture. To continue along these lines, the County should target its workforce training toward pri-ority clusters (such as Fabricated Metals, Food Processing and Packaging, and Transportation and Logistics) and to other opportunities partic-ularly well-suited to Cook County (for example, healthcare services).
Finally, due to the large presence of immi-grants in Cook County and immigrants’ impor-tance to economic growth, the County should partner with others to better understand the needs of this community. CMAP and the Metro-politan Mayors Caucus, for example, recently received a grant for a regional project involving immigrant integration in suburban communities. The County could align its workforce develop-ment resources to support this effort.
BETTER ALIGN COOK COUNTY RES-IDENTS’ SKILLS WITH EMPLOYER DEMAND

PARTNERING FOR PROSPERITY: AN ECONOMIC GROWTH ACTION AGENDA FOR COOK COUNTY50
The table below uses the following abbreviations:
PEGJ In March 2012, World Business Chicago published its Plan for Economic Growth and Jobs. The Plan has ten strategies, and teams convened around each strategy are developing initia-tives for implementation.
GO TO 2040 In 2010, the Chicago Metropolitan Agency for Planning (CMAP) published its GO TO 2040 Comprehensive Regional Plan. While it is primarily focused on land use and transportation, GO TO 2040 also addresses human capital, innovation, and efficient governance.
OECD In 2012, the OECD published its Territorial Review of the Chicago Tri-State Metropolitan Area in collaboration with the Chicagoland Chamber of Commerce. A new Tri-State Alliance is investigating strategies based on this report.
COOK COUNTY STRATEGY ALIGNMENTS
COUNTY ECONOMIC GROWTH STRATEGY1. Increase County government’s
transparency, efficiency, and accountability
2. Increase suburban government efficiency through shared ser-vices and centralized capacities
3. Increase the region’s capacity for strategic, coordinated eco-nomic growth initiatives
4. Increase the productivity of Cook County’s manufacturing clusters, especially Fabricated Metals, and Food Processing and Packaging
5. Increase competitiveness among anchor institution suppliers
ALIGNMENT WITH REGIONAL PLANSPEGJ Strategy 10: Create an environment and pro-
cesses that allow businesses to flourish
GO TO 2040 Efficient Governance: reform state and local tax policy; improve access to information
OECD “Effective institutional arrangements are required to address the tri-state region’s challenges”
PEGJ Strategy 10: Create an environment and pro-cesses that allow businesses to flourish
GO TO 2040 Pursue Coordinated Investments
PEGJ Implementation approach (next steps, initiatives)
GO TO 2040 Pursue Coordinated Investments
OECD “Advance the region’s functional interests in innovation-driven economic development”
PEGJ Strategy 1: Become a leading advanced manu-facturing hub
GO TO 2040 Support Economic Innovation: strategically organize around existing and emerging clusters of specialization
OECD “Develop and implement cluster-specific strate-gies to support innovation-driven growth”
PEGJ Strategy 2: Increase attractiveness as a center for business services and headquarters
Strategy 9: Develop and deploy neighborhood assets to align with regional economic growth
‑‑

PARTNERING FOR PROSPERITY: AN ECONOMIC GROWTH ACTION AGENDA FOR COOK COUNTY 51
6. Promote innovation to grow Cook County’s Transportation and Logistics cluster
7. Improve the quality and effi-ciency of the region’s transpor-tation infrastructure
8. Support the emergence of dense, mixed use, well connect-ed communities
9. Improve the alignment of Cook County residents’ skills with employer demand
PEGJ Strategy 3: Become more competitive as a leading transportation and logistics hub
GO TO 2040 Support Economic Innovation: strategically organize around existing and emerging clusters of specialization
PEGJ Strategy 3: Become more competitive as a--- leading transportation and logistics hub
Strategy 8: Invest to create next-generation infrastructure
GO TO 2040 Regional Mobility: invest strategically in transportation; increase commitment to public transit; create a more efficient freight network; implement priority capital projects
OECD “Advance the tri-state region’s functional inter-ests in integrated tri-state intermodal transpor-tation planning . . . . The public transit system is key to the metro- region’s attractiveness, but inadequate”
PEGJ Strategy 9: Develop and deploy neighborhood assets to align with regional economic growth
GO TO 2040 Achieve greater livability through land use and housing
OECD “The skills mismatch is exacerbated by sig-nificant underemployment, especially among visible minorities, and made worse by spatial segregation”
PEGJ Strategy 6: Create demand-driven and target-ed workforce development.
GO TO 2040 Improve Education and Workforce Development
OECD “The region’s population is well-educated but there is a serious skills mismatch”

PARTNERING FOR PROSPERITY: AN ECONOMIC GROWTH ACTION AGENDA FOR COOK COUNTY52
PARTNERING FOR PROSPERITY: AN ECONOMIC GROWTH ACTION AGENDA FOR COOK COUNTY 53
CHAPTER 5
Cook County’s next steps
1. FULLY ENGAGE COUNTY GOVERNMENT AND PARTNERS IN IMPLEMENTATION
Acting on these strategies requires the engage-ment of all levels of County government and multiple outside partners. The County must:
Engage people throughout the County’s departments, agencies, and elected offices (as well as municipalities, other govern-ments, and civic groups) by informing them about the Action Agenda and it alignments with other regional economic growth plans.
Align the County’s day-to-day work and programs with the strategies. This will start with detailed review by County department and agency heads to determine how they can adjust guidelines, criteria, regulatory practices, investments, and priorities to sup-port the strategies.
Establish an implementation team with the skills, resources, and time needed to work across departments supporting alignment with the strategies. The team should also be able to measure and monitor progress, and work effectively with other governments and civic institutions leading initiatives that are part of the County’s agenda.
2. IDENTIFY INITIATIVES THAT SUPPORT EACH OF THE STRATEGIES
The nine recommended strategies set a direc-tion for the County. Each must be implemented through the adoption of specific initiatives. The range of possible initiatives is wide: some may be modest and require few resources, and others may be more ambitious and require time, resources, and the development of new partnerships.
A first step in this process is to identify exist-ing initiatives and programs consistent with the recommended strategies, and determine what role the County government and the Council of Economic Advisers might play in supporting them. Where there is no existing initiative, the County and the Council will have to play a leadership role in defining a course of action to move the strategy forward.
3. SET PRIORITIES AND SELECT INITIATIVES FOR ACTION
The County and the Council will evaluate the in-ventory of initiatives and select those that they have the capacity to lead or support. A busi-ness plan will be required for those initiatives that the County will lead. For initiatives that others are leading, the County will develop spe-cific work plans to identify the resources to be devoted to the activity, and the value that will be realized as a result of their commitments.
This Economic Growth Action Agenda sets the stage for new partnerships, policies, actions, and investments for Cook County. Implementation of the agenda will require the following:

PARTNERING FOR PROSPERITY: AN ECONOMIC GROWTH ACTION AGENDA FOR COOK COUNTY54

PARTNERING FOR PROSPERITY: AN ECONOMIC GROWTH ACTION AGENDA FOR COOK COUNTY 55
1. Bureau of Economic Analysis, 2011 (employ-ment); Moody’s Analytics, 2012 (nominal gross product).
2. U.S. Census Bureau, 2011.
3. The Chicago metropolitan area employs over 4.4 million people and has a gross product of $532 billion (Bureau of Economic Analysis, 2010).
4. As discussed in Chapter 2, Cook County gov-ernment is made up of several offices, run by different elected officials. This document focuses primarily on the Offices under the President, al-though it also considers the roles that other offices may play.
5. United States Census Bureau, 2007 Census of Governments.
6. See Chicago Metropolitan Agency for Planning, “GO TO 2040” (October 2011); World Business Chicago, “A Plan for Economic Growth and Jobs” (March 2012); and Organization for Economic Cooperation and Development, “OECD Territorial Review: The Chicago Tri-State Metropolitan Area” (September 2012).
7. See, for example, “A Plan for Economic Growth and Jobs,” 14–17.
8. The discussions of the economics which inform the Economic Growth Action Agenda—both the description of the global economy here and of the market levers later—are very high-level summaries which excerpt and draw heavily from much more extensive reviews of the relevant research and practice. See Mark Muro and Robert Weissbourd, “Metropolitan Business Plans: A New Approach to Economic Growth” (Brookings Institution, 2011); Gretchen Kosarko and Robert Weissbourd, “Eco-nomic Impacts of GO TO 2040” (Chicago Com-munity Trust, 2011); Gretchen Kosarko, Robert Weissbourd, Harold Wolman, Andrea Sarzynski, Alice Levy, and Diana Hincapie, “Implementing Regionalism: Connecting Emerging Theory and Practice to Inform Economic Development” (Surd-na Foundation, November 2011); and “A Plan for Economic Growth and Jobs” (World Business Chicago, 2012).
9. These changes are often collectively referred to as the “knowledge economy,” which encompasses
ENDNOTES
the increasing importance of information and knowledge resources (a) as inputs to production; (b) in the production and market process; and (c) as products and services. See discussion in Robert Weissbourd and Christopher Berry, The Changing Dynamics of Urban America (Chicago: CEOs for Cities, 2004), 254–287; Matthew Drennan, The Information Economy and American Cities (Balti-more: Johns Hopkins University Press, 2002); and John Houghton and Peter Sheehan, A Primer on the Knowledge Economy (Melbourne City: Center for Strategic Economic Studies, Victoria Universi-ty, 2000).
10. McKinsey Global Institute, analysis of Global Insight and Economist data. U.S. GNP quintupled in 50 years, while its physical weight barely in-creased (“Greenspan Weighs Evidence and Finds a Lighter Economy,” Wall Street Journal http://anasazi.umsl.edu/FIN455/NonLinear/Green-spanWeighs.htm).
11. See “Big Data: The Next Frontier for Innovation, Competition, and Productivity” (McKinsey Global Institute, 2011).
12. Consider, for example, the fact that the compa-nies that made up the S&P index in the 1920s would remain on the list for an average of 65 years while, by the late 1990s, the average firm spent only 10 years on the S&P 500. See James Manyika, Susan Lund, and Byron Auguste, “From the Ashes: The Most Dynamic Economies Rely on Creative Destruction to Grow” (Newsweek Au-gust 16, 2010).
13. From an economist’s point of view, the reason for the very existence of cities and their surrounding economic regions is to reduce the transportation costs of goods, people, and ideas. See Edward L. Glaeser, “Are Cities Dying?” (Journal of Economic Perspectives 12.2 (Spring 1998), 139-160), 140. Skilled people and firms located in metropolitan areas have higher productivity and outputs than their non-metro peers. See Christo-pher Wheeler, “Cities and the Growth of Wages Among Young Workers: Evidence from the NLSY” (Working Paper 2005-055A, Federal Reserve Bank of St. Louis, 2005).

PARTNERING FOR PROSPERITY: AN ECONOMIC GROWTH ACTION AGENDA FOR COOK COUNTY56
14. See Alan Berube, “MetroNation: How U.S. Metropolitan Areas Fuel American Prosperity” (Brookings Institution, 2007).
15. In the context of the global economy, regions are large enough to compete in international markets and small enough to provide the agglomeration benefits that flow from geographic proximity of human capital, firms, and related institutions. See Manuel Pastor Jr. et al., Regions That Work: How Cities and Suburbs Can Grow Together (Min-neapolis: University of Minnesota Press, 2000); Pierre-Paul Proulx, “Cities, Regions, and Econom-ic Integration in North America,” in North Amer-ican Linkages: Opportunities and Challenges for Canada, ed. Richard Harris (Calgary: University of Calgary Press, 2003, 211-252); and Peter Calthorpe and William Fulton, The Regional City (Washington, D.C.: Island Press, 2001).
16. New growth theory, in particular, holds that con-centrations of knowledge factors—such as high human capital, information technologies, and information-sector firms—build upon themselves. This process results in increasing rather than diminishing returns, so that the places that get ahead tend to keep getting further ahead. See (generally) Joseph Cortright, “New Growth The-ory, Technology and Learning: A Practitioner’s Guide,” (Reviews of Economic Development Liter-ature and Practice 4 (2001), especially 10–12); and Weissbourd and Berry 2004, op. cit.
17. See Note 6, above.
18. As of September 2012, Cook County’s unemploy-ment rate was 8.5 percent, while unemployment for the rest of the MSA was 7.4 percent (Bureau of Labor Statistics).
19. Cook County’s poverty rate in 2010 was 16.7 percent, compared to 9.8 percent for the rest of the MSA (American Community Survey, 2010 one-year estimates).
20. Bureau of Labor Statistics.
21. Based on an Illinois constitutional mandate, Cook County is the only county in the state in which residential property assessment rates differ from commercial and industrial assessment rates. As a result, residential property tax rates are lower and commercial/industrial rates are higher in Cook County, compared to the rest of the region.
22. Class 6b is the most common abatement and provides corporate property tax relief for indus-trial development. The Class 7a/7b abatement aims to encourage commercial development. The only discernible difference between these two classifications is that the 7a appears to be handled completely by the Assessor, and the 7b is authorized by the Economic Development
Advisory Committee (EDAC) and the Board of Commissioners. The Class 8 abatement applies to commercial or industrial development involving larger areas (no less than ten contiguous acres and no more than one contiguous square mile).
23. The initial funding for the Partnership came entirely from federal WIA grants, although the organization hopes to raise additional funds in order to expand their reach and mission.
24. Maloof, Barbara. “President Preckwinkle lays out vision for Cook County Land Bank.” Cook County. Jun 26, 2012. http://blog.cookcountyil.gov/economicdevelopment/2012/06/26/presi-dent-preckwinkle-lays-out-vision-for-cook-county-land-bank/.
25. Crain’s Chicago Business, http://www.chicago-business.com/section/lists?djoPage=view_htm-l&djoPid=43&djoPY=@pGKJyF3ZKmUM.
26. See Note 8 for sources providing detailed deri-vation and explanation of these market levers.
27. The degree of geographic proximity exhibited by firms in clusters varies widely from one cluster to another, ranging from a few blocks (like Man-hattan’s garment district) to several states (for example, the Great Lakes’ auto industry cluster). For the purposes of this document, the primary unit of geographic reference is the metropolitan area, though the question is an empirical one: any given cluster will have a specific geography of its members, which will often be sub-regional in scale. See Joseph Cortright, “Making Sense of Clusters: Regional Competitiveness and Economic Development” (Brookings Institution, 2006), 6.
28. Cortright, “Making Sense of Clusters” (op. cit.), 1. For further definition and discussion of the literature on clusters, see Edward Bergman and Edward Feser, “Industrial and Regional Clusters: Concepts and Comparative Applications” (Web Book of Regional Science, Regional Research Institute, West Virginia University. www.rri.wvu.edu/WebBook/Bergman-Feser/contents.htm).
29. “Sector” refers to all or part of an industry—gen-erally, as defined by NAICs codes. “Cluster” refers to firms in one or more sectors (along with their related institutions) that are economically connected. The two can empirically coincide, but often do not. “Sector” is more often a categori-zation of firms by what they make or do, whereas cluster is a grouping based on economic co-de-pendency and the benefits of agglomeration.
30. The size of each bubble represents 2010 GRP. The x-axis represents concentration in Chicago as measured by the 2010 location quotient (LQ): industry share of regional employment divided by industry share of national employment. The

PARTNERING FOR PROSPERITY: AN ECONOMIC GROWTH ACTION AGENDA FOR COOK COUNTY 57
y-axis represents projected growth rate (CAGR) of GRP from 2010–2020. All figures are based on underlying data from the Bureau of Labor Statistics and moodyseconomy.com, as reported in World Business Chicago’s “Plan for Economic Growth and Jobs.”
31. See Note 6.
32. All figures in this table are based on ICIC, RW Ventures, and Brookings Institution analysis of U.S Census Bureau ZIP Business Patterns, Bureau of Labor Statistics Employment Projections, and Moody’s Analytics data.
33. Though Miscellaneous Manufacturing also ap-pears very strong in the data, its “miscellaneous” character makes it unlikely to operate as a single cluster. Electrical manufacturing and, to a lesser extent, Machinery and Primary Metals manufac-turing also have relatively high employment and LQs in the region and Cook County. Based on these sectors’ relationship to the larger Fabri-cated Metals cluster, they are considered here in their role as suppliers and customers to that cluster. Firms in these industries face many trends and challenges similar to those facing core Fabri-cated Metal firms.
34. Core fabricated metal firms are represented by all of NAICS code 332, except 3328, which is covered as a supplier under “metal services.”
35. Represented primarily by NAICS code 331.
36. This portion of the cluster includes parts of NA-ICS 335, 326 and 313, among others.
37. Represented by NAICS code 3335.
38. Represented primarily by NAICS code 3328.
39. Not only do different Fabricated Metal firms serve many different industries, but even a single firm may serve several. Industries served by Fabricated Metal firms include auto, small bus and truck, aerospace and defense, telecom and Internet, energy, utilities, and many others.
40. Cook County Fabricated Metal workers and, to a lesser extent, those in the region overall are more likely than their national counterparts to work in office-oriented occupations (for example, management, professional, sales, and administra-tive occupations), suggesting that headquarters functions are especially concentrated locally (ICIC and RW Ventures analysis of ACS Public Use Microdata Sample (PUMS) occupational data).
41. In the MSA and Cook County, 7 percent employ-ment growth and 52 to 53 percent GRP growth are projected through 2020 (ICIC, RW Ventures, and Brookings Institution analysis of U.S. Census
Bureau ZIP Business Patterns, Bureau of Labor Statistics Employment Projections, and Moody’s Analytics data).
42. According to a study by Hacket Group, pro-duction in China was 31 percent cheaper than in advanced nations in 2005, but by 2013, that gap will be down to 16 percent. Moreover, a Boston Consulting Group report estimates that, by 2015, U.S.-based manufacturing will only cost 7 percent more than in China and between 8 and 22 percent less than in the United Kingdom, Germany, France, Japan, and Italy.
43. Machine Shops, Turned Product, and Screw, Nut and Bolt Manufacturing; Other Fabricated Metal Manufacturing; and Forging and Stamping—the three largest segments of the Fabricated Metals cluster core—had productivity levels in Chicago that were 6.9 percent, 2.7 percent, and 2.1 per-cent higher than national averages, respectively. Metal services were 5.2 percent less productive locally than nationally. (Brookings Institution analysis of Moody’s Analytics data, 2010.)
44. ICIC and RW Ventures analysis of ACS Public Use Microdata Sample (PUMS) occupational data, 2010.
45. Boston Consulting Group, “Skills Gap in U.S. Manufacturing is Less Pervasive than Many Believe,” October 15, 2012. http://www.bcg.com/media/PressReleaseDetails.aspx-?id=tcm:12-118945.
46. The packaged foods portion of the food cluster is represented by NAICS codes 311225, 311230, 311320, 311330, 311340, 311412, 311422, 311423, 311811, 311812, 311813, 311821, 311822, 311823, 311830, 311911, 311919, 311920, 311930, 311941,311942, 311991, and 311999.
47. Ingredient manufacturers include: grain and oilseed millers (NAICS 311211, 311212, 311213, 311221, 311222, and 311223); sugar refiners (NAICS 311311, 311312, and 311313); meat and seafood processors (NAICS 311611, 311612, 311613, 311615, 311711, and 311712); dairy product manufacturers (311511, 311512, 311513, 311514, and 311520); and fruit and vegetable product processors (311411 and 311421). Raw agricultural products may also be inputs to packaged foods, but they are not a focus of this report.
48. Food packaging is represented by NAICS codes 322211, 322212, 322215, 322224, 322225, 326111, 326160, and 327213. These NAICS codes are those most associated with food pack-aging, although they also include packaging not associated with food.

PARTNERING FOR PROSPERITY: AN ECONOMIC GROWTH ACTION AGENDA FOR COOK COUNTY58
49. Represented by NAICS codes 332214, 333111, and 333294.
50. Represented by NAICS codes 424410, 424420, 424430, 424440, 424450, 424460, 424470, 424480, 424490, 424510, 424520, 424590, 424810, and 424820.
51. The Food Processing and Packaging cluster is defined more broadly here than it is in the table on Page 21, to reflect the role of agricultural and industrial inputs, and distribution and wholesale in the cluster. (ICIC and RW Ventures analysis of U.S. Census Bureau ZIP Business Patterns.)
52. ICIC and RW Ventures analysis of U.S. Census Bureau ZIP Business Patterns.
53. Perishable prepared foods grew at least 34 per-cent in Cook County and the region and is pro-jected to increase its gross product by another 13 percent through 2020. Frozen foods’ local and national gross product increased 1 percent from 2000 to 2010, but is expected to dip slight-ly (ICIC, RW Ventures, and Brookings Institution analysis of U.S. Census Bureau ZIP Business Pat-terns, Bureau of Labor Statistics Employment Pro-jections, and Moody’s Analytics data). However, other research shows greater promise for frozen foods, such as a 22 percent increase in sales between 2006 and 2010, for a total market size of $56 billion (Caroline Scott-Thomas, “Frozen Food Trend on the Up, Says Packaged Facts,” December 23, 2010, www.foodnavigator-usa.com/Business/Frozen-food-trend-on-the-up-says-Packaged-Facts).
54. Convenience is consistently reported as among the top dynamics driving consumer food pur-chases. See Diane Toops, “2012 Food Industry Outlook: A Taste of Things to Come” (FoodPro-cessing.com, http://www.foodprocessing.com/articles/2012/food-industry-outlook.html); and NPD Group, “A Look into The Future of Eating” (https://www.npd.com/wps/portal/npd/us/news/press-releases/pr_090831/).
55. ICIC and RW Ventures analysis of U.S. Census Bureau ZIP Business Patterns, 2009.
56. Chicago Booth Polsky Center and CEC, “From Farm to Fork,” 2010, http://www.chicagobooth.edu/entrepreneurship/docs/Farm-to-Fork.pdf.
57. The size of the global functional foods market is estimated to be as high as $167 billion annually, though most estimates fall in the $30 to $60 billion range, depending on the definition. See BCC Research, “Nutraceuticals: Global Markets and Processing Technologies” (July 2011, www.bccresearch.com/report/nutraceuticals-mar-kets-processing-technologies-fod013d.html); Me-lissa Williams, Eija Pehu, and Catherine Ragasa,
“Functional Foods: Opportunities and Challenges for Developing Countries” (Worldbank Agricul-tural and Rural Development Notes 19 (Septem-ber 2006), http://siteresources.worldbank.org/INTARD/Resources/Note19_FunctionalFoods_web.pdf); and “Consumer Trends: Functional Foods” (Agriculture and Agri-Food Canada Market Analysis Report, December 2009, www.gov.mb.ca/agriculture/statistics/agri-food/cana-da_functional_foods_en.pdf).
58. Skill levels are based on O*Net data and reflect assumptions at the national and occupational level, without regard to industry. Using data from U.S. Census Bureau Public Use Microdata Sam-ple (PUMS), RW Ventures calculated the percent of employment by occupational category and used O*Net data to attribute skill level.
59. Represented by NAICS codes 481112, 481212, 482111, 482112, 483111, 483113, 483211, 484110, 484121, 484122, 484210, 484220, and 484230.
60. Represented by NAICS codes 492110, 488510, and 541614.
61. Rail data is from CMAP/EMSI; all other data reported in this table is from another source. Additionally, the regional figures for rail repre-sent the 7-county CMAP region rather than the 14-county MSA.
62. “Metropolitan Chicago’s Freight Cluster: A Drill-Down Report on Infrastructure, Innovation, and Workforce” (Chicago Metropolitan Agency for Planning, 2012), 41.
63. The LQ for health services is only 0.9, indicating a concentration below that of the nation (ICIC and RW Ventures analysis of U.S. Census Bureau ZIP Business Patterns data).
64. Telemedicine, also known as telehealth, is the transmission of healthcare services or information via telecommunications technology. It includes doctors seeing patients remotely via telephone or video-conference, remote monitoring of health conditions, and the transmission of medical data and images between medical offices.
65. Medical tourism is primarily taking place interna-tionally, with Americans and others seeking less expensive procedures abroad. To the extent that foreigners are travelling to the U.S. for medical procedures, they are primarily going to institu-tions with existing international partnerships—a group that does not include Chicago medical institutions (“Medical Tourism: Consumers in Search of Value,” Deloitte Center for Health Solutions, 2008. www.deloitte.com/assets/Dcom-unitedStates/Local%20Assets/Documents/

PARTNERING FOR PROSPERITY: AN ECONOMIC GROWTH ACTION AGENDA FOR COOK COUNTY 59
us_chs_MedicalTourismStudy(3).pdf). In terms of telemedicine, while many Chicago area hospi-tals are adopting such technology, the Chicago region has few companies working directly in the creation of telemedicine technologies.
66. Health Services employment grew by 10 percent from 2003 to 2009, and is projected to increase an additional 29 percent through 2020 (ICIC, RW Ventures, and Brookings Institution analysis of U.S. Census Bureau ZIP Business Patterns, Bureau of Labor Statistics Employment Projec-tions, and Moody’s Analytics data). Of the ten health-related occupations projected to have the greatest employment growth in Cook County from 2008 to 2018, half have an O*Net Job Zone of 3 or less, indicating that the education/training required is typically a high school di-ploma, and possibly some vocational training or an associate’s degree (RW Ventures analysis of Illinois Department of Employment Security and O*Net data).
67. The pharmaceuticals portion is defined as NAICS codes 325411 and 325412. The medical de-vices portion consists of NAICS codes 325413, 325414, 334510, 334516, 334517, 339111, 339112, 339113, 339114, 339115, and 339116. The biotech segment includes NAICS codes 541380, 541710, 541711, and 541712.
68. Overall, medical manufacturing has an LQ of 1.1 in the MSA and only 0.6 in Cook County. The high MSA LQ can be attributed primarily to a regional concentration of Pharmaceutical firms (LQ = 2.8), located primarily in Lake County. Cook County’s LQ for Pharmaceuticals is only 0.4. (ICIC, RW Ventures, and Brookings Institu-tion analysis of U.S. Census Bureau ZIP Business Patterns, Bureau of Labor Statistics Employment Projections, and Moody’s Analytics data.)
69. Firms that supply anchor institutions and head-quarters fall within in the following sectors: professional and business services (such as accounting, legal, and design services); commu-nications and information technology; building and equipment rental, management, and mainte-nance; product suppliers (such as manufacturers and distributors of office supplies and toiletries); and food services and training providers.
70. Women and minorities own 53 percent of Cook County firms in the other services sector, 35 per-cent of those in admin and support services, and 32 percent of those in accommodation and food services, compared to 31 percent of all firms
71. ICIC and RW Ventures analysis of U.S. Census Bureau ZIP Business Patterns database, 2009.
72. ICIC and RW Ventures analysis of U.S. Census
Bureau ZIP Business Patterns database, 2009, and Bureau of Labor Statistics Employment Pro-jections 2010-2020.
73. See Note 6, above.
74. 35 percent of all Chicago-area residents aged 25 or older, and 33 percent of Cook County residents aged 25 and older have a Bachelor’s degree or higher, compared with 28 percent nationally. 42 percent of County residents lack any post-secondary education, compared with 38 percent in the rest of the MSA (American Community Survey, 2010 one-year estimates).
75. The 2011 unemployment rate in Cook County among individuals with a high school education or less was 16.1 percent, compared with 8.7 per-cent for those with at least some post-secondary education.
76. American Community Survey, 2010.
77. Bureau of Labor Statistics, Geographic Profile of Employment and Unemployment, “Table 29: Unemployment Rates by Occupation,” 2011.
78. RW Ventures analysis of Illinois Department of Em-ployment Security data, 2008–2018 projections.
79. “Job zone” is a classification by O*Net, a prod-uct of the U.S. Department of Labor’s Employ-ment and Training Administration. It is used to describe the average skills and education levels required for an occupation. Job zones are based on a five-point scale, on which 5 indicates the need for extensive preparation (at least a Bach-elor’s degree, and often an advanced degree or work experience) and 1 indicates the need for little to no preparation (high school degree or less, little work experience). Job zones are reported by O*Net at the 6-digit SOC level. The “Mean Skill Level” reported here is the average job zone across all detailed occupations within the larger occupational categories listed here. Note that job zones are not weighted according to the presence of each occupation in the region.
80. American Community Survey, 2011, 1-year estimates.
81. Note that, in the shorter term, growth can also occur through increasing economic inputs or importing someone else’s innovations. See Paul M. Romer, “Two Strategies for Economic Devel-opment: Using Ideas and Producing Ideas” (Pro-ceedings of the World Bank Annual Conference on Development Economics, 1992). See (gener-ally) Paul M. Romer, “Endogenous Technological Change” (Journal of Political Economy 98.5.2 (1990): S71–S101); Gene L. Grossman and Elhanan Helpman, Innovation and Growth in the Global Economy (Cambridge, MA: MIT Press,

PARTNERING FOR PROSPERITY: AN ECONOMIC GROWTH ACTION AGENDA FOR COOK COUNTY60
1991); and Joseph A. Schumpeter, Capitalism, Socialism, and Democracy, 2d ed. (New York: Harper & Bros., 1947; rpt. New York: Harper & Row, 2010). For a review of empirical studies confirming the relationship between innovation and regional economic growth, see Jeremy Howells, “Innovation and Regional Economic De-velopment: A Matter of Perspective?” (Research Policy 34.8 (2005): 1222-1223).
82. While a linear model of the innovation process offers conceptual clarity, there is evidence that it is more iterative and open in practice. For exam-ple, multiple new product and/or process ideas might be generated during the invention stage, leading to separate innovation paths for each; unsuccessful proof-of-concept testing may send innovators back to the idea-generation stage; or market introduction might bring to light a short-coming of the technology that returns innovators back to the applied R&D stage for additional de-velopment. See, for example, Between Invention and Innovation: An Analysis of Funding for Ear-ly-Stage Technology Development (Gaithersburg, MD: Economic Assessment Office, Advanced Technology Program, National Institute of Stan-dards and Technology, November 2002); and Philip Cook and Olga Memedovic, Strategies for Regional Innovation Systems: Learning Transfer and Applications (Vienna: United Nations Indus-trial Development Organization, 2003).
83. The universities together spend nearly $1.4 bil-lion on R&D. In order of R&D expenditures, these are: Northwestern University; University of Chica-go; University of Illinois-Chicago; Rush University; Loyola University; and Illinois Institute of Technol-ogy (National Science Foundation, FY 2009).
84. For example, Gas Technology Institute in Des Plaines; Silliker, Inc. in Chicago Heights; and Underwriters Laboratories in Northbrook. In this case, the “region” includes Cook, DuPage, DeKalb, Grundy, Kane, Kendall, Lake, McHenry, and Will Counties, centers with more than 50 employees (World Business Chicago).
85. Business churn (births + deaths / total establish-ments) is 21.3 percent in Cook County, 22.3 per-cent in the rest of the region, and 21.2 percent nationwide. Business starts account for 9.3 per-cent of all establishments in the Chicago MSA and the USA, and for 9.4 percent in Cook County (RW Ventures analysis of Statistics of U.S. Businesses 2008–2009 data).
86. U.S. Economic Census, 2007.
87. Minorities (non-whites) make up 43.3 percent of the general population and women make up 51.5 percent (American Community Survey 2011 1-year estimates).
88. 61 percent of Cook County residents live in areas that have six or more households per residential acre, and less than 2 percent live in areas that have 1.8 or fewer households per acre. In the rest of the MSA, only 8 percent live in areas with the highest density residential pattern, and nearly 20 percent live in areas with the lowest (Center for Neighborhood Technology, H+T Affordability Index).
89. Metropolis Strategies analysis of Texas Transpor-tation Institute data.
90. American Community Survey, 2010 1-year esti-mates.
91. ACS 2011 5-year estimates. The correlation between time to work and poverty is 0.36, a statistically significant figure.
92. “Prospering in Place: Linking Jobs, Development, and Transit to Spur Chicago’s Economy” (Center for Neighborhood Technology, 2012), 3.
93. “Jobs and Housing Balance: CMAP Regional Snapshot” (Chicago Metropolitan Agency for Planning, 2008), 11.
94. “Prospering in Place: Linking Jobs, Development, and Transit to Spur Chicago’s Economy” (Center for Neighborhood Technology, 2012), 3–4.
95. Broadband Illinois, as of June 30, 2012.
96. United States Census Bureau, Census of Govern-ments, 2007.
97. “Report of the City-County Joint Committee on Collaboration” (February 2012), and Committee report to the Steering Committee of the Plan for Economic Growth and Jobs (December 6, 2012).
98. See, for example, “Service Delivery Task Force: First Report to the Full Caucus” (Metropolitan Mayors Caucus, 2009).
99. The most recent analysis of the effects of the classification system was conducted for the CMAP Tax Policy Task force, and can be found at http://www.cmap.illinois.gov/c/document_li-brary/get_file?uuid=3551db5f-880e-4822-a5b8-74b0ceeb46ca&groupId=20583.
100.“Interjurisdictional Collaboration Fact Sheet,” Metropolitan Planning Council, 2012.
101. See https://sites.google.com/a/chicagosouth-landedc.org/south-suburban-gis-consortium/.
102. “Business intermediary overview” (Business Intermediary Services WIA Pre-Submittal Conference: Chicago Cook Workforce Part-nership, Chicago, October 11, 2012), www.workforceboard.org/Portals/0/WIARFP2012/Business_Intermediary_10-11-12.pdf.

PARTNERING FOR PROSPERITY: AN ECONOMIC GROWTH ACTION AGENDA FOR COOK COUNTY 61
PHOTO CREDITSFront and back cover, Tim Peartrice; Page 9, induhLoop; Pages 10 and 11, Mark de Souza; Page 12, Nathan Rupert; Page 17, Brian Boyer; Page 18, Mary Anne Enriquez; Page 19, Seth M; Page 21, basicbill; Pages 24 and 25, WorldSkills International; Page 27, Thomas Hawk; Page 30, Pro-Zak; Page 31, HEAC; Page 32, Nathan Hicks; Page 34, Jeremy Wilburn; Page 35, Nick Miller UK; Page 36, Mark DL; Page 38, Argonne National Laboratory; Page 39, Stan Ruecker; Page 40, Mike F; Page 41, Wally Gobetz; Page 43, Brian Boyer; Page 44, fiahless; Page 45, AccidentalHedonist; Page 46, TonytheTiger; Page 47, Toyota Materials Handling EU; Page 49, Bilfinger; Page 52, the.urbanophile.

PARTNERING FOR PROSPERITY: AN ECONOMIC GROWTH ACTION AGENDA FOR COOK COUNTY62
ACKNOWLEDGEMENTS
Cook County wishes to thank its Council of Economic Advisors for their leadership, and Metropolis Strategies and RW Ventures for their work in research, analysis, and document development for “Partnering for Prosperity.” Thanks also go to the staff of the President’s Office and the Bureau of Economic Develop-ment, and to The Chicago Community Trust. PDFs of “Partnering for Prosperity: An Econom-ic Growth Action Agenda” and its accompany-ing Executive Summary can be downloaded at:
http://blog.cookcountyil.gov/economicdevelopment/growth-strategies