Partitioning Sequences Based on Association Measures Deborah Weisser Carnegie Mellon University.
24
Partitioning Sequences Based on Association Measures Deborah Weisser Carnegie Mellon University
-
date post
20-Dec-2015 -
Category
Documents
-
view
217 -
download
0
Transcript of Partitioning Sequences Based on Association Measures Deborah Weisser Carnegie Mellon University.

Partitioning Sequences Based on Association Measures
Deborah WeisserCarnegie Mellon University

Feature boundaries
• Need to know form and function of protein sequences to understand complex biological systems
• Not possible to directly determine features or functions directly– estimate feature positions by indirect
laboratory experiments, e.g. hydrophobicity
• Use statistical measures of association to determine feature boundaries

Feature boundaries
• Proteins are comprised of adjacent, non-overlapping features:– helical, cytoplasmic, periplasmic, extracellular,
intracellular, etc.
• GPCR proteins have a fixed feature pattern, although feature positions are only known for one member of the family, Rhodopsin (opsd_human)

C
N
ec1 ec2ec3
cp1 cp2 cp3
1 2 3 4 5 6 7
Cytoplasmic (cp) Domain
Trans-Membrane(helices)Domain
Extracellular (ec) Domain
A.
B.
Segments contributing to extracellular (ec) domainSegments contributing to transmembrane (helices) domainSegments contributing to cytoplasmic (cp) domain
CN
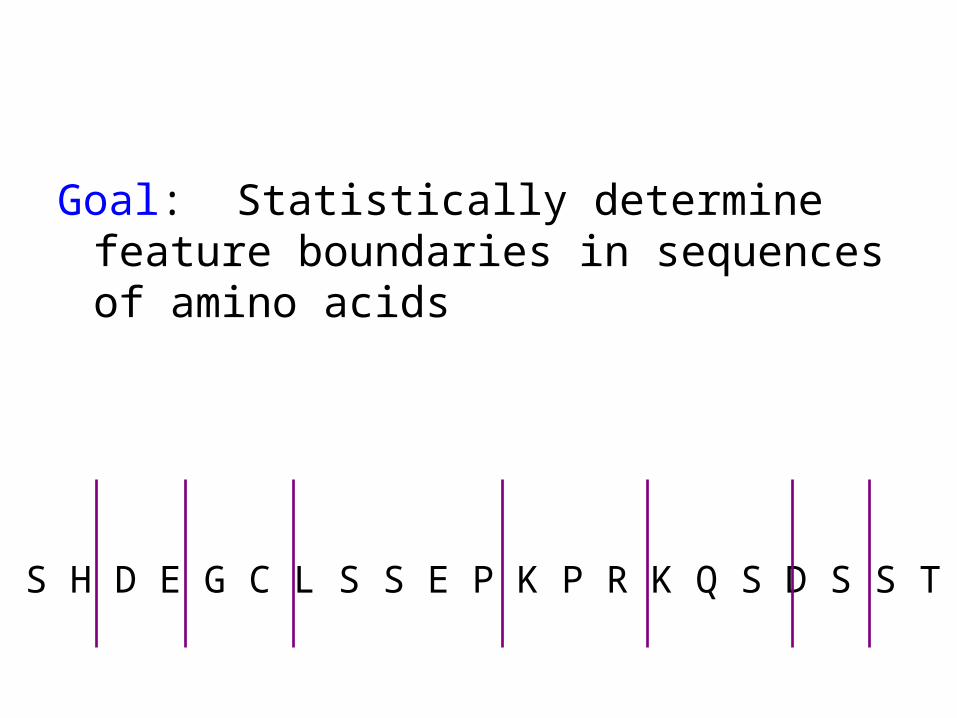
Goal: Statistically determine feature boundaries in sequences of amino acids
S H D E G C L S S E P K P R K Q S D S S T

Association measures
S H D E G C L S S E P K P R K Q S D S S T
2.5
2.5 is a measure of the strength of the association between P and R

Association measures
S H D E G C L S S E P K P R K Q S D S S T
2.34.5
1.10.8 5.51.2 3.70.3 6.21.24.8
4.15.2
2.5 1.80.20.7
1.1 6.23.4 1.1

Association measures
S H D E G C L S S E P K P R K Q S D S S T
2.34.5
1.10.8 5.51.2 3.70.3 6.21.24.8
4.15.2
2.5 1.80.20.7
1.1 6.23.4 1.1
4.2
Adjacent pairs with low association measuresare candidates for partition points.

Association measures are used to quantify correlations between
adjacent amino acids
• Yule’s Q statistic
• Mutual information


EP
MS N
V VV
GFRF
Y
CK
HMI AN
QQ Q
AA
K E A
V F TVQ L
TVRM
SAT TQKA EKE
I I V
E
IM
MY
RG
TT
V QH
KR N
TT
VM
L
C
Cytoplasmic (cp) Domain
T L Y V
N F L I YN LC C
I II III IV V VI VII
LK
P
KN
QF
5575
136 155225 256 306
cp1
cp2cp3
AOOC - PAVQST E T KS V T-
TS AED
DGLP
KN
Cytoplasmic(cp)
Domain
Transmembrane(helices)Domain
Extracellular(ec)
Domain
MI: 39, 63, 76, 94, 115, 136, 155, 176, 205, 233, 255, 279, 287, 301
Hydropathy: 37, 61, 74, 98, 114, 133, 153, 176, 203, 230,253, 276, 285, 309
61309
74
153253
230
133
Hydropathy breaks
301
63
76155255
136 233Cytoplasmic
(cp)Domain
Transmembrane(helices)Domain
Extracellular(ec)
Domain
MI breaks

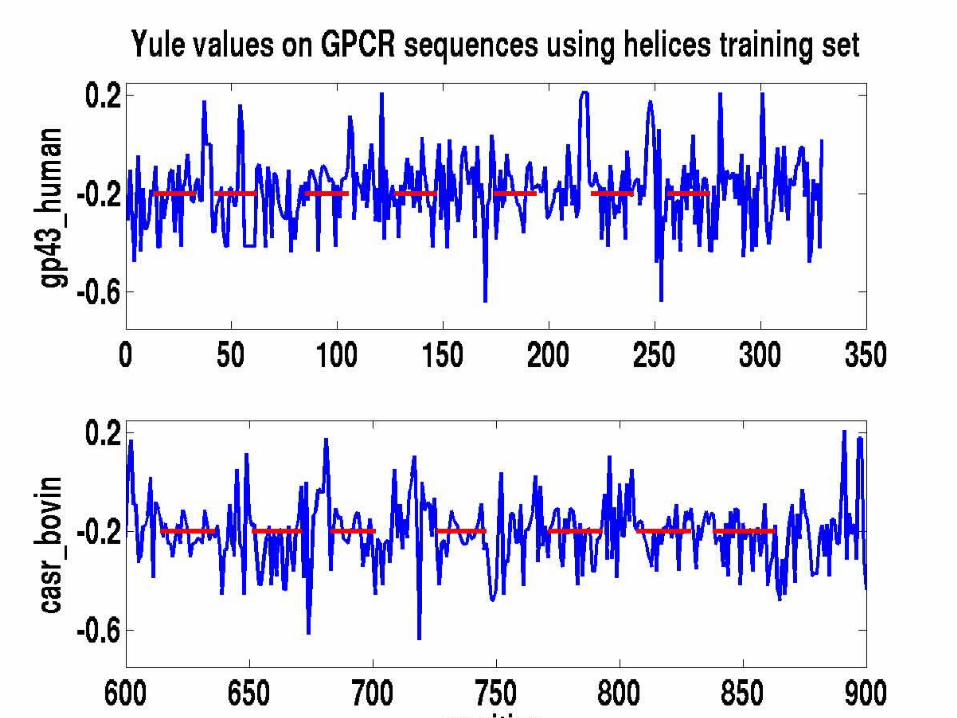
• The changes in association measure values correspond to feature boundaries
• Goal: automatically detect partition points based on association measures
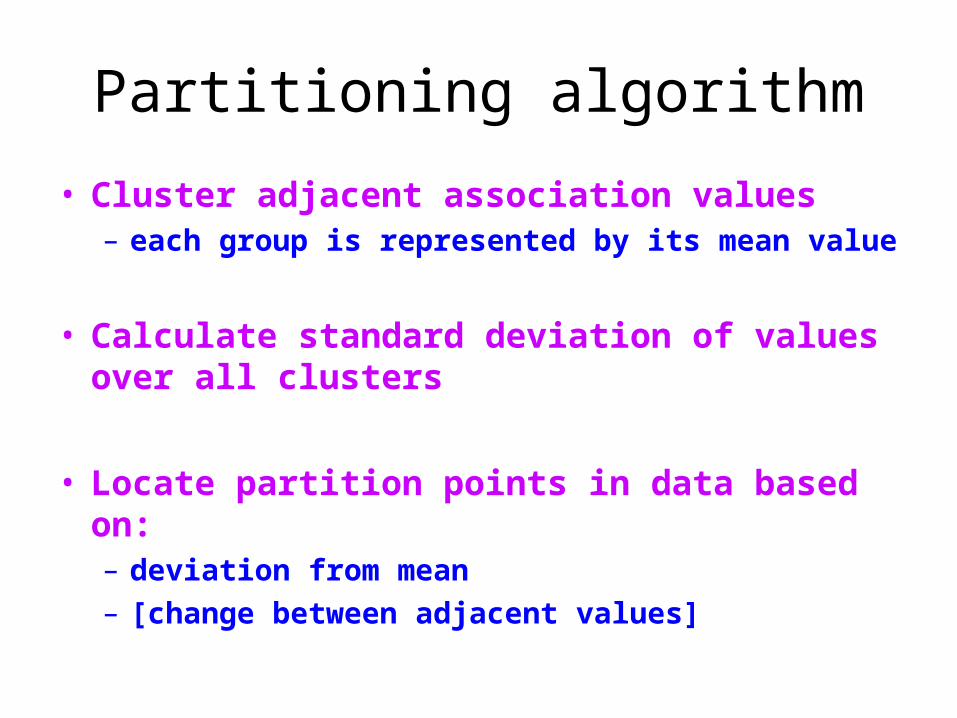
Partitioning algorithm
• Cluster adjacent association values– each group is represented by its mean value
• Calculate standard deviation of values over all clusters
• Locate partition points in data based on:– deviation from mean– [change between adjacent values]

Parameters
• Cluster adjacent association values– each group is represented by its mean value
window size for computing mean
• Calculate standard deviation of values over all clusters
• Locate partition points in data based on:– deviation from mean– [change between adjacent values]
cutoff distance from mean for a value to be
considered “extreme”

Effect of cutoff threshold on partitioning in opsd_human using mutual information

Effect of window size on partitioningin opsd_human using mutual information

Class A Rhodopsin like Amine Peptide Hormone protein (Rhodopsin
Rhodopsin Vertebrate Rhodopsin Vertebrate type 1 Rhodopsin Vertebrate type 2 Rhodopsin Vertebrate type 3 Rhodopsin Vertebrate type 4 Rhodopsin Vertebrate type 5
Rhodopsin Arthropod Rhodopsin Mollusc Rhodopsin Other
Olfactory Prostanoid Nucleotide-like Cannabis Platelet activating factor Gonadotropin-releasing hormone Thyrotropin-releasing hormone & Secretagogue Melatonin Viral Lysosphingolipid & LPA (EDG) Leukotriene B4 receptor Class A Orphan/other
Class B Secretin like Class C Metabotropic glutamate / pheromone Class D Fungal pheromone Class E cAMP receptors (Dictyostelium) Frizzled/Smoothened family
GPCR: different subfamilies

GPCR: different subfamilies
Size: Hierarchy:
717755 GPCR
371134 Class A
48393 Rhodopsin
33543 Vertebrate
20314 Vertebrate 1
348 opsd_human
39724 Class B
20930 Class C


• Structure of curve is preserved even when the dataset is small.


In progress / Future work
• Set parameters of partition algorithm automatically
• Apply to other sources of data, types of features
• Group amino acids into sub-classes
• Quantify the effect of training set information content and training set size.