Partitioning and Transmutation - SKB Introduction The Partitioning and Transmutation (P&T) group at...
51
Svensk Kärnbränslehantering AB Swedish Nuclear Fuel and Waste Management Co Box 5864 SE-102 40 Stockholm Sweden Tel 08-459 84 00 +46 8 459 84 00 Fax 08-661 57 19 +46 8 661 57 19 R-06-45 Partitioning and Transmutation Annual Report 2005 Sofie Andersson, Christian Ekberg, Anna Fermvik, Nadège Hervieux, Jan-Olov Liljenzin, Daniel Magnusson, Yannick Meridiano, Mikael Nilsson, Teodora Retegan, Gunnar Skarnemark Nuclear Chemistry Department of Chemical and Biological Engineering Chalmers University of Technology January 2006
Transcript of Partitioning and Transmutation - SKB Introduction The Partitioning and Transmutation (P&T) group at...

Svensk Kärnbränslehantering ABSwedish Nuclear Fueland Waste Management CoBox 5864SE-102 40 Stockholm Sweden Tel 08-459 84 00 +46 8 459 84 00Fax 08-661 57 19 +46 8 661 57 19
R-06-45
Partitioning and Transmutation
Annual Report 2005
Sofie Andersson, Christian Ekberg, Anna Fermvik,
Nadège Hervieux, Jan-Olov Liljenzin, Daniel Magnusson,
Yannick Meridiano, Mikael Nilsson, Teodora Retegan,
Gunnar Skarnemark
Nuclear Chemistry
Department of Chemical and Biological Engineering
Chalmers University of Technology
January 2006

ISSN 1402-3091
SKB Rapport R-06-45
This report concerns a study which was conducted for SKB. The conclusions and viewpoints presented in the report are those of the authors and do not necessarily coincide with those of the client.
A pdf version of this document can be downloaded from www.skb.se
Partitioning and Transmutation
Annual Report 2005
Sofie Andersson, Christian Ekberg, Anna Fermvik,
Nadège Hervieux, Jan-Olov Liljenzin, Daniel Magnusson,
Yannick Meridiano, Mikael Nilsson, Teodora Retegan,
Gunnar Skarnemark
Nuclear Chemistry
Department of Chemical and Biological Engineering
Chalmers University of Technology
January 2006

�
Abstract
The long-lived elements in the spent nuclear fuels are mostly actinides, some fission products (79Se, 87Rb, 99Tc, 107Pd, 126Sn, 129I, 135Cs) and activation products (14C, 36Cl, 59Ni, 93Zr, 94Nb). To be able to destroy the long-lived elements in a transmutation process they must be separated from the rest of the spent nuclear fuel. The most difficult separations to make are those between trivalent actinides and lanthanides, due to their relatively similar chemical properties, and those between different actinides themselves. These separations are necessary to obtain the desired efficiency of the transmutation process and in order not to create any unnecessary waste thus rendering the process useless. Solvent extraction is an efficient and well-known method that makes it possible to have separation factors that fulfil the highly set demands on purity of the separated phases and on small losses.
Chalmers University of Technology is involved in research regarding the separation of acti-nides and lanthanides and between the actinides themselves as a partner in the EUROPART project within the European Union sixth framework program. This is a continuation of the projects we participated in within the fourth and fifth framework programmes, NEWPART and PARTNEW respectively. The aims of the projects have now shifted from basic under-standing to more applied research with focus on process development. However, since the basic understanding is still needed we have our main focus on the chemical processes and understanding of how they work.

�
Sammanfattning
De långlivade ämnena i det använda kärnbränslet består till största delen av aktinider, en del fissionsprodukter (79Se, 87Rb, 99Tc, 107Pd, 126Sn, 129I, 135Cs) och aktiveringsprodukter (14C, 36Cl, 59Ni, 93Zr, 94Nb). För att kunna förstöra de långlivade ämnena i en transmutations-process måste de separeras från resten av det använda kärnbränslet. De svåraste separa-tionerna att göra är de mellan trevärda aktinider och lantanider, på grund av deras relativt liknande kemi, samt de mellan aktiniderna själva. Dessa separationer är nödvändiga för att uppnå den önskade effektiviteten i transmutationsprocessen samt för att undvika extra avfall som skulle göra hela processen överflödig. Vätskeextraktion är en effektiv och välkänd metod som gör det möjligt att uppnå separationsfaktorer som uppfyller de högt ställda kraven på renhet i de separerade faserna och små förluster.
Chalmers tekniska högskola deltar i forskningen rörande separationen av aktinider och lantanider och mellan aktiniderna själva, genom att vara en partner i EUROPART, ett projekt inom EUs sjätte ramprogram. Detta projekt är en fortsättning på tidigare projekt vi deltagit i inom det fjärde och femte ramprogrammet, nämligen NEWPART och PARTNEW. Målet med arbetet har under denna tid flyttats från grundläggande förståelse till mer tillämpad forskning med processberäkningar och test med riktigt använt kärn-bränsle. Dock behövs fortfarande grundläggande kunskaper varför vårt fokus fortfarande ligger på grundläggande kemiska frågor och förståelse för ingående processer..

�
Contents
1 Introduction 7
2 Research 92.1 Comparison of CyMe4-BTBP and CyMe4-S-BTP 9
2.1.1 Influence of different organic diluents on the extraction 102.1.2 Extraction kinetics 142.1.3 Synergic extraction using different carboxylic acids 152.1.4 Influence of ionic media on the extraction 162.1.5 Conclusions 18
2.2 Bitopic ligands 192.3 Synergic extraction systems 202.4 Nitrogen coordinating absorbents 242.5 Process calculations and validation of the code 26
2.5.1 Experimental validation 282.6 Effect of different side groups on heterocyclic ligands 302.7 Extraction of fission products and corrosion products 33
2.7.1 Extracting capability of CyMe4-BTBP in TBB 342.7.2 Extracting capability of CyMe4-BTBP in 1-octanol 35
2.8 Tests of new diluents 362.8.1 Solubility and initial extraction tests 362.8.2 Kinetics/time dependence 382.8.3 Concentration dependence 402.8.4 Conclusions 40
2.9 Uncertainty analysis of correlated stability constants 412.9.1 Stability constants using solvent extraction 41
2.10 Experiments with CMPO derivatives of calix4-arenes 44
3 Collaborations 47
4 Internationalandnationalscientificexchange 49
5 Articlesandpublications 51
6 Futurework 53
7 References 55

�
1 Introduction
The Partitioning and Transmutation (P&T) group at Nuclear Chemistry, Department of Chemical and Biological Engineering at Chalmers University of Technology, investigates the separation of different chemical elements in the spent nuclear fuel for purification and/or recovery in a future transmutation process.
Solvent extraction is used already today in e.g. France, UK and Russia in the reprocessing of spent nuclear fuel, i.e. the recirculation of uranium and plutonium back into the fuel cycle. This means that a lot of expertise on how to deal with highly active aqueous and organic solutions already exists. It is also a good technique to use considering its high efficiency of separation.
Internationally other processes, such as molten salt electrolysis and chromatographic methods, are also investigated.
The Chalmers group has been involved in the separation and transmutation research throughout three different European Union framework programmes, i.e. NEWPART (1996–1999), PARTNEW (2000–2003) and EUROPART (2004–2007). During this time the focus has changed slightly although the main content is still the same. As time has passed the main effort has been more and more focussed on process development. In the early years there was a search for suitable extracting agents following the CHON principle (only containing Carbon, Hydrogen, Oxygen and Nitrogen). This search has continued but now in more close collaboration with process expertise to make sure that the molecules not only have good separation capabilities but also survive practically and economically in a process. The research can be divided into three different areas:• Co-extractionofactinidesandlanthanidesfromacidichighactiveraffinate−
DIAMEX process.• Separationofactinidesandlanthanides−SANEXprocess.• Separation of Am and Cm.
The EUROPART project also involves the former European Union projects PYROREP and CALIXPART. Their main focus was to deal with pyroprocesses and processes involving extraction with calixarenes mainly for Cs removal from the nuclear waste.
The main experimental work at Chalmers concerns the extraction properties and other basic chemical characteristics of ligands synthesized in Reading, UK. The influence of pH, ionic strength and media, absorbed dose and concentration of the involved species are studied in combination with modelling of the systems using e.g. solubility parameters. However, Chalmers is also involved in process development and flow sheet calculations. Experiments with synthetic waste are in these cases the basis for our understanding. The heavy actinides, represented by berkelium and californium were also studied.

�
2 Research
During 2005 Sofie Andersson and Mikael Nilsson finished their PhD work and defended their theses. S. Andersson made her public defence in April and M. Nilsson in December. Faculty opponents at the dissertations were professor Ken Nash from Washington State University and professor Gregory Choppin from Florida State University, respectively. Teodora Retegan continued her study on the effect of side groups to increase the under-standing why the affinity for some molecules to actinides over lanthanides is higher. Daniel Magnusson is working in Germany (ITU) on process experiments on real high active raffinate from the PUREX process.
The EUROPART meetings have been as scheduled, i.e. in January in Manchester and in July in Prague. Two French diploma workers, Nadège Hervieux and Yannick Meridiano, worked in the P&T group. Meridiano studied and compared new extractants with differ-ent properties to try to increase the understanding of the importance of side groups on the extractant and Hervieux used a mixer-settler battery to verify the process calculation code which is still under development. One new PhD student has started during 2005. Anna Fermvik will, apart from the direct EUROPART related matters, study the radiolysis of the selected extractants and their products.
2.1 ComparisonofCyMe4-BTBPandCyMe4-S-BTPThe investigation of different BTP:s and BTBP:s has been a common task for some time now. Often scanning studies using standard conditions are done in order to determine if the extraction properties are good or not. However, by changing different properties of the molecules interesting chemical understanding may be gained. In this case two molecules, derivatives of the BTP class ligands, have been studied more thoroughly. One is a BTBP molecule and the other a Semi-BTP molecule, see Figure 2-1. According to previous investigations, increasing the number of nitrogen atoms in direct contact with the metal ion (241Am and 152Eu) will increase the distribution ratios (D) and separation factors /1/.
NN
NN
NN
NN
NN
NN
N
CyMe4ˉ BTBP CyMe4ˉ S-BTP
Figure 2-1. Chemical structures of CyMe4-BTBP and CyMe4-S-BTP.

10
The main aim of these investigations is to determine the best extracting system, both for CyMe4-BTBP and CyMe4-S-BTP, by changing different parameters, e.g. diluent, pH, temperature, synergist, counter ion concentration etc. In addition, basic chemical understanding may be gained from the differences that are found. The investigations can be divided into the following experiments: • Influence of different organic diluents on the extraction.• Extraction kinetics.• Synergic extraction using different carboxylic acids.• Influence of ionic media on the extraction.
In most experiments an aqueous phase containing trace amounts of 241Am and 152Eu. The total nitrate ion concentration was 1 M, with HNO3 and NaNO3 in different amounts. The organic phase consisted of the ligand dissolved in an organic diluent, sometimes with addition of various modifiers. The two phases were contacted for 2 minutes up to 1 h, stated at the specific experiment, and after contact the phases were centrifuged for 15 minutes at ~ 2,000 g. After the phases had separated aliquots of each phase were taken for measurements in a HPGe-detector.
2.1.1 Influenceofdifferentorganicdiluentsontheextraction
Different organic diluents with different chemical properties were tested to find the one that will give the best extraction properties, the better dissolution, the better mass transfer between phases, thus better distribution ratios. The diluents are shown in Table 2-1, sorted according to their dipole moment.
Attempts were done to dissolve 0.01 M of the ligand in the different diluents. As can be seen in Table 2-2 not all diluents could completely dissolve CyMe4-BTBP and/or CyMe4-S-BTP.
There seems to be no real difference between the two molecules when it comes to solubility only, at least not within the group of diluents tested here.
Figures 2-2 and 2-3 shows the distribution ratio (D) and the separation factor (SF) for the organic systems. The organic phase contained 0.01 M of ligand (CyMe4-BTBP/CyMe4-S-BTP). The aqueous phase contained 0.01 M HNO3 (+0.99 M NaNO3) and was spiked with trace amounts of 241Am and 152Eu.
For the BTBP ligand, nitrobenzene seems to be the best diluent. It presents several advantages such as easy dissolution, high distribution ratios for 241Am (D: 284) and 152Eu (D: 1.58) and the best SF (179). However, due to its physical and chemical properties, it is not suitable for process applications. Cyclohexanone also presents good distribution ratios for 241Am (D: 16.1) and 152Eu (D: 0.12) and a good SF (130) but the dissolution is difficult. Cyclohexanone is also partly soluble in water, which makes preequilibration necessary. Quite good results are obtained with benzaldehyde, 1-decanol and tetrachloroethane. Anisole shows poor results and no extraction is observed with TPH, hexane and TBB.

11
Table2-1. DiluentsusedforinvestigatingtheinfluenceoforganicdiluentontheextractionusingCyMe4-BTBPandCyMe4-S-BTP,dipolemomentsfoundin/2/and/3/.Thedipolemomentforthreeofthealcoholswasnotreadilyobtainedfromtheliteraturebutwasassumedtobesimilartotheotheralcohols.
Diluent Formula Dipolemoment,µ(D)
TPH Tetrapropyl hydrogene Not found
Hexane 0 /2/
TBB (tert-butyl benzene) 0.83 /2/
1,1,2,2-tetrachloroethane Cl
Cl
Cl
Cl
1.32 ± 0.07 /2/
AnisoleO
1.38 ± 0.07 /2/
1-decanolOH
Not found
1-nonanolOH
Not found
1-octanolOH
1.76 /3/
1-heptanolOH
Not found
1-hexanolOH
1.55 /3/
Benzaldehyde O 3.0 /2/
Cyclohexanone O 3.246 ± 0.006 /2/
Nitrobenzene NO24.22 ± 0.08 /2/

12
Table2-2. ResultsofthedissolutionexperimentsofCyMe4-BTBPandCyMe4-S-BTPindifferentorganicdiluents.TheCyMe4-BTBPwasonlytestedinthreeofthealcoholsandthedissolutionoftheCyMe4-S-BTPinheptanolandnonanolwassimilartotheotheralcohols.
Organicdiluent Dissolution
CyMe4-BTBP CyMe4-S-BTP
TPH No complete dissolution of the ligand Solubilised after 5 minutes shaking
Hexane No complete dissolution of the ligand No complete dissolution of the ligand
TBB Ultrasound bath and heated (~ 40°C) for 2 minutes Ultrasound bath for 45 min
Tetrachloroethane Easy and fast Easy and fast
Anisole 2 minutes shaking 2 minutes shaking
1-decanol Ultrasound bath and heated (~ 40°C) for 10 minutes Ultrasound bath for 30 min
1-octanol Ultrasound bath for 50 min Ultrasound bath for 50 min
1-hexanol Ultrasound bath for 50 min Ultrasound bath for 50 min
Benzaldehyde 2 minutes shaking 2 minutes shaking
Cyclohexanone Ultrasound bath and heated (~ 40°C) for 2 minutes No complete dissolution of the ligand
Nitrobenzene 2 minutes shaking Easy and fast
log
D
−4.5
−3.5
−2.5
−1.5
−0.5
0.5
1.5
1-Decanol 1-Octanol 1-Hexanol
0
5
10
15
20
25
30
SF
Am BTBP Am S-BTBPEu BTBP Eu S-BTBPSF (Am/Eu) BTBP SF (Am/Eu) S-BTBP
Figure 2-2. Extraction properties for CyMe4-BTBP and CyMe4-S-BTP in different organic diluents.

1�
For the semi-BTP, tetrachloroethane presents several advantages as diluent. The dissolution of the extractant is easy and fast and although the distribution ratio for 241Am is quite low the separation factor Am/Eu is good (about 200). It should be noticed that the distribution ratio for 152Eu is uncertain since it is close to the detection limit. However, like nitrobenzene, tetrachloroethane is not suitable for an industrial process. One of the requirements that should be fulfilled for a diluent in industrial application is to follow the CHON principle, i.e. it should consist of only carbon, hydrogen, oxygen and nitrogen. Other requirements are that it should not be poisonous, not mutagenic and not polluting.
Clearly the CyMe4-BTBP is the best choice of these two molecules, both extraction and separation factor are higher than with CyMe4-S-BTP. This is not surprising considering earlier results stating that increasing the number of coordinating nitrogen atoms is advantageous both for extraction and separation /1/.
The influence on extraction of alcohols of different chain lengths was further studied by complementing the results above with extractions with CyMe4-S-BTP in nonanol and heptanol, see Figure 2-4.
The general trend for these results is that the distribution ratios for both 241Am and 152Eu increase when the chain length of the linear alcohols decreases. However, a short length alcohol is not suitable for process applications as the solubility of the alcohol in water increases with shorter chain length. The separation factors are quite similar for all five alcohols.
Figure 2-3. Extraction properties of CyMe4-BTBP and CyMe4-S-BTP when using different alcohols as diluent.
–4.5
–3.5
–2.5
–1.5
–0.5
0.5
1.5
1-Decanol 1-Octanol 1-Hexanol
log
D
0
5
10
15
20
25
30
SF
Am BTBP Am S-BTBPEu BTBP Eu S-BTBPSF (Am/Eu) BTBP SF (Am/Eu) S-BTBP

1�
2.1.2 Extractionkinetics
Kinetics experiments were performed to determine the time of contact necessary to reach the equilibrium. The initial time in the previous experiments was established arbitrary to 5 minutes shaking. For the kinetics experiments an organic solution of 0.01 M of CyMe4-BTBP or CyMe4-S-BTP in nitrobenzene was contacted with an aqueous phase that consisted of 0.01 M HNO3 (+0.99 M NaNO3) and spiked with trace amounts of 241Am and 152Eu. The vials shaken by hand are insulated against the heat of the palm using a special shaking holder, so there should not be an effect of temperature.
For theCyMe4-BTBP, the vials were shaken 5, 10, 20 and 60 minutes by hand and 10 minutes, 1 h and 24 h with a shaking machine at room temperature. The experiments were performed in duplicates and the results are shown in Figure 2-5.
One can note an important difference in the way of shaking. Shaking by hand yields a fast increase of the extraction between 0 and 10 minutes and equilibrium is reached after 10 minutes for 241Am and after 20 minutes for 152Eu. Apparently the shaking device used in this experiment has a much lower efficiency than shaking by hand and it can not be concluded when the equilibrium was reached. The rate-determining step is the phase transfer rather than the actual reaction kinetics.
For theCyMe4-S-BTP, the vials were shaken 2, 5 and 10 minutes by hand and 10 minutes, 1 h and 24 h with the shaking machine at room temperature. The results are shown in Figure 2-6.
These experiments show that shaking by hand during 5 minutes is enough to reach the equilibrium both for 241Am and 152Eu. Even shaking for just 2 minutes is enough to reach the equilibrium. With the shaking machine 10 minutes, or even less, is enough to reach the equilibrium. The kinetics of CyMe4-BTBP and CyMe4-S-BTBP are different, even when using the same diluent, nitrobenzene, and the same conditions regarding concentration, acidity and temperature.
Figure 2-4. Extraction properties of CyMe4-S-BTP in different alcohols.
–4,5
–4
–3,5
–3
−2,5
–2
1-Decanol 1-Nonanol 1-Octanol 1-Heptanol 1-Hexanol
log
D
–1
1
3
5
7
9
11
13
15
SF
AmEuSF (Am/Eu)

1�
2.1.3 Synergicextractionusingdifferentcarboxylicacids
In an attempt to increase the efficiency of the extraction for both 241Am and 152Eu, a syner-gistwasaddedtotheorganicphase.Twocarboxylicacidsweretested:α-bromodecanoicacid and 3,5-diisopropylsalicylic acid. Thus, the organic phase consisted of 0.5 M of the car-boxylic acid and 0.01 M of CyMe4-BTBP or CyMe4-S-BTP in an organic diluent (decanol or TBB) and the aqueous phase consisted of 0.01 M HNO3 (+0.99 M NaNO3) spiked with trace amounts of 241Am and 152Eu. The experiment was carried out in triplicats. Figures 2-7 and 2-8 show the results of the synergic extractions in decanol and TBB, respectively.
Concerning the CyMe4-BTBP in decanol, the bromodecanoic acid only increases the distribution ratio for europium. 3,5-diisopropylsalicylic acid decreases the extraction for both metals.
Figure 2-5. Kinetics for the extraction of 241Am and 152Eu using CyMe4-BTBP in nitrobenzene.
Figure 2-6. Kinetics for the extraction of 241Am and 152Eu using CyMe4-S-BTP in nitrobenzene.
-1
–0.5
0
0,5
1
1,.5
2
2.5
3
3.5
0 0.5 1 1.5 2 2.5 3 3.5
log Time (min)
log
D
Am (hand) Am (machine)Eu (hand) Eu (machine)
–4
–3.5
–3
–2.5
–2
–1.5
–1
–0.5
0
0 0.5 1 1.5 2 2.5 3 3.5
log Time (min)
log
D
0
10
20
30
40
50
60
70
80
SF
Am (hand) Am (machine) Eu (hand)Eu (machine) SF (Am/Eu, hand) SF (Am/Eu, machine)

16
For the CyMe4-S-BTP in decanol it seems that the use of a carboxylic acid as synergist increases the extraction for both 241Am and 152Eu and the best extraction is achieved with 3,5-diisopropylisalicylic acid. With this system the distribution ratios are even higher than the highest for the corresponding BTBP.
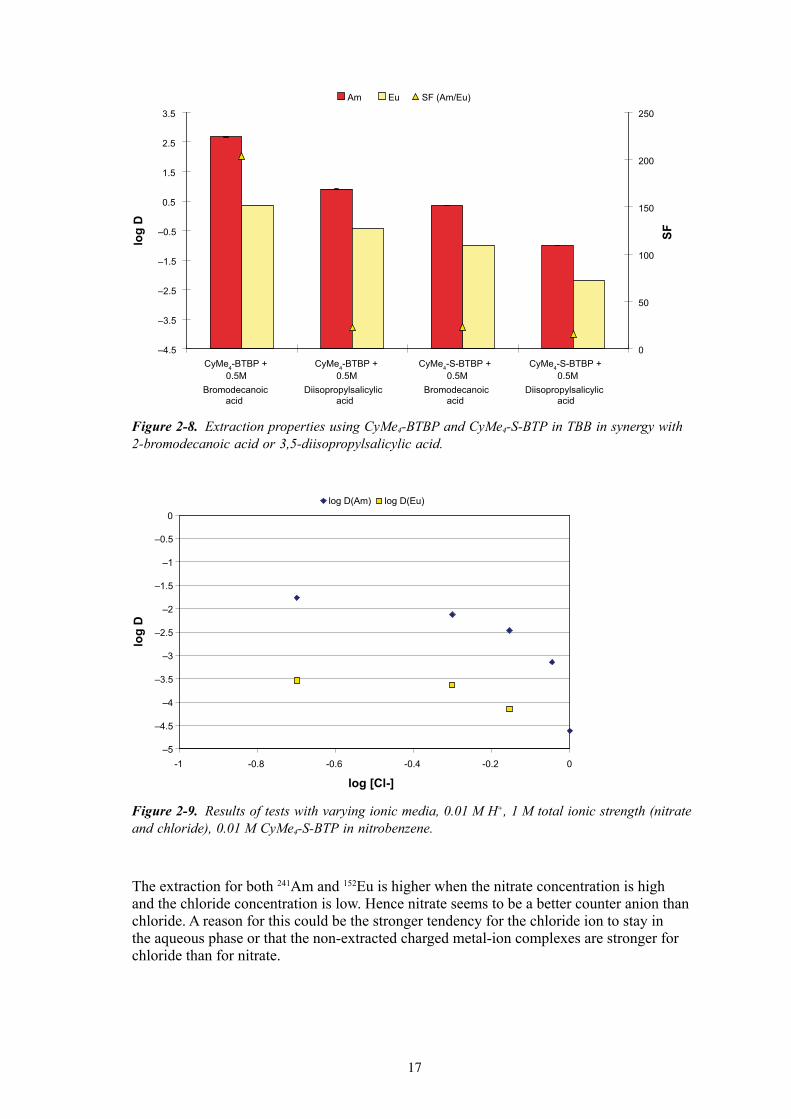
As was shown earlier, using TBB as diluent without any carboxylic acid added to the system results in no extraction for both of the ligands (i.e. CyMe4-BTBP and CyMe4-S-BTP). With a synergist added the extraction is quite high. From Figure 2-8 it is clear that the bromodecanoic acid is more efficient in increasing the extraction than the 3,5-diisopropyl-salicylic acid is. The separation factors are similar except the one for the system containing CyMe4-BTBP and bromodecanoic acid, which is higher.
Considering the organic systems, it can be seen that CyMe4-BTBP and 2-bromodecanoic acid shows higher distribution ratios than the same system containing 3,5-diisopropylsali-cilic acid. CyMe4-S-BTP with added 2-bromodecanoic acid shows higher distribution ratios than when 3,5-diisopropylsalicilic acid is present in decanol. Corresponding system with TBB shows smaller distribution ratios when 3,5-diisopropylsalicilic acid is added than when 2-bromodecanoic acid is added. These systems are worth a more thorough investigation for a better understanding of the system.
2.1.4 Influenceofionicmediaontheextraction
Experiments to study the influence of nitrate concentration were performed with CyMe4-S-BTP (0.01 M) in nitrobenzene as the organic phase and different concentrations of NO3
– and Cl– in the aqueous phase (spiked solutions). In hydrogen ion concentration in the aqueous phase was kept equal to 0.01 M, and the total anion concentration was kept constant by adding chloride ions ([NO3
–]+[Cl–] = 1 M). The nitrate ion concentration (and the chloride ion concentration) varied from 0 to 1 M. The results of the extractions are shown in Figure 2-9.
Figure 2-7. Extraction properties using CyMe4-BTBP and CyMe4-S-BTP in decanol in synergy with 2-bromodecanoic acid (Bromo. acid) or 3,5-diisopropylsalicylic acid (Diiso. acid).
–4.5
–3.5
–2.5
–1.5
–0.5
0.5
1.5
CyMe4-BTBP CyMe4-BTBP+ 0.5M Bromo.
acid
CyMe4-BTBP+ 0.5M Diiso.
acid
CyMe4-S-BTBP
CyMe4-S-BTBP + 0.5MBromo. acid
CyMe4-S-BTBP + 0.5M
Diiso. acid
log
D
0
5
10
15
20
25
30
SFAm Eu SF (Am/Eu)
1�
The extraction for both 241Am and 152Eu is higher when the nitrate concentration is high and the chloride concentration is low. Hence nitrate seems to be a better counter anion than chloride. A reason for this could be the stronger tendency for the chloride ion to stay in the aqueous phase or that the non-extracted charged metal-ion complexes are stronger for chloride than for nitrate.
Figure 2-8. Extraction properties using CyMe4-BTBP and CyMe4-S-BTP in TBB in synergy with 2-bromodecanoic acid or 3,5-diisopropylsalicylic acid.
Figure 2-9. Results of tests with varying ionic media, 0.01 M H+, 1 M total ionic strength (nitrate and chloride), 0.01 M CyMe4-S-BTP in nitrobenzene.
–4.5
–3.5
–2.5
–1.5
–0.5
0.5
1.5
2.5
3.5
CyMe4-BTBP +0.5M
Bromodecanoicacid
CyMe4-BTBP +0.5M
Diisopropylsalicylicacid
CyMe4-S-BTBP +0.5M
Bromodecanoicacid
CyMe4-S-BTBP +0.5M
Diisopropylsalicylicacid
log
D
0
50
100
150
200
250
SF
Am Eu SF (Am/Eu)
–5
–4.5
–4
–3.5
–3
–2.5
–2
–1.5
–1
–0.5
0
-1 -0.8 -0.6 -0.4 -0.2 0
log [Cl-]
log
D
log D(Am) log D(Eu)

18
2.1.5 Conclusions
The use of a carboxylic acid increases the efficiency of the extraction, which is expected. However, CyMe4-BTBP and CyMe4-S-BTP do not show the same synergic behaviour with the bromodecanoic acid as with the diisopropylsalicylic acid. In earlier studies C5-BTBP also showed a large increase in distribution ratios when 2-bromodecanoic acid was added to an organic phase with TBB as diluent /4/. Also, the C5-BTBP had similar dissolution properties in organic diluents as the CyMe4-BTBP. organic diluents with higher dipole moment the addition of a synergic extracting agent such as 2-bromodecanoic acid does not affect the distribution ratio in the same magnitude as in organic diluents with lower dipole moment.
Another result is the somewhat different kinetic behaviour between the two ligands. The CyMe4-BTBP has a fairly slow kinetics while the CyMe4-S-BTP reaches equilibrium relatively fast.
Figure 2-10. tOct-PyPz-diamide and PyPz-C18.
N
N
N
O
N
H
O
O
N
N
N
N
N
N
H
H
tOct-PyPz-diamide
N
NNN
O
H
PyPz-C18

1�
2.2 BitopicligandsTests were performed with a couple of bitopic ligands, see Figure 2-10.
A first step was to determine the solubility of these ligands in different diluents, which were chosen based on their low miscibility with water and with respect to the CHON principle (according to the project demands).
The diluents used for both ligands were: 1. tert-butyl benzene (TBB),2. alifatic kerosene,3. 1-octanol,4. 1-decanol,5. cyclohexanone,6. a mixture of 10% 1-decanol +90% alifatic kerosene,7. a mixture of 10% 1-octanol +90% alifatic kerosene.
The only diluents that managed to dissolve the ligands were 1-octanol and 1-decanol. No other diluents did dissolve them at all, under any conditions tested: room temperature shaking, ultrasound bath or heating. The easiest to dissolve proved to be tOct-PyPz-diamide, which could be dissolved in both 1-octanol and 1-decanol by shaking at room temperature for a relatively short time. PyPz-C18 needed 30 minutes of shaking in the ultrasound bath for both diluents. The bitopic ligands were supposed to separate the actinides from the lanthanides and therefore the extraction of 241Am, 244Cm and 152Eu was investigated.
A number of different experiments were performed:1. 0.005 M tOct-PyPz-diamide dissolved in 1-octanol and 1-decanol, respectively, were
contacted with three different aqueous phases consisting of HNO3 (1 M), (0.1 M+0.9 M NaNO3), (0.01 M+0.99 M NaNO3) and spiked with trace amounts of 241Am and 152Eu, by vigorous shaking by hand for 5 minutes. Then samples were taken from each phase, organic and aqueous, and measured with a HPGe detector. The measuring time was 20 h for the organic phase and 1.3 h for the aqueous phase. No extraction was observed.
2. Extraction tests with PyPz-C18 (0.005 M dissolved in the two diluents) were carried out with the same experimental procedure as above. No extraction was observed.
3. Due to the previous results, the systems used so far were modified as follows: 0.005 M tOct-PyPz-diamide dissolved in 1-octanol and 0.1 M of the synergic extractant 2-bromodecanoic acid was contacted with aqueous phase consisting of 0.1 M HNO3 and 0.9 M NaNO3. The other properties as above. No extraction was observed.
4. Same as point 3 but for 0.005 M PyPz-C18. No extraction was observed.5. The same experiments (point 3 and 4) were performed for the systems having 1-decanol
as diluent. No extraction was observed.6. Due to the fact that 5 minutes may not be the best choice of contact time considering the
kinetics of the reaction in both systems, tOct-PyPz-diamide and PyPz-C18 were tested with similar conditions as above but with 1 h shaking. No extraction was observed.
When the concentration of the ligand was increased an emulsion was formed in all the systems investigated.
It is unlikely that these bitopic ligands, which may be scientifically interesting in organic chemistry, will be used for liquid-liquid extraction.

20
2.3 SynergicextractionsystemsA synergic system with e.g. 2,2’:6’,2’’-terpyridine, terpy, and 2-bromodecanoic acid, HA, shows an extraction maximum for a certain terpy:HA concentration ratio. Figure 2-11 shows the extraction curve obtained when the terpy:HA concentration ratio is varied. The concentration of terpy is kept constant at 0.02 M while the HA concentration is varied between 0.02–3.5 M. This type of extraction maximum will probably also appear for other types of synergic systems, a reason why it is interesting to understand this synergism in more detail.
Another interesting fact regarding this synergic system is that temperature studies show that the extraction mechanism changes from endothermic to exothermic at the extraction maximum /5/.
The possibility of complexes formed between a nitrogen donor ligand, such as terpy, and an adduct formation agent such as 2-bromodecanoic acid may give valid information and explain some of the behaviour of this type of synergic system.
HA and terpy are both affected by changes in H+-concentration. The protonation behaviour of terpy dissolved in tert-butyl benzene (TBB) was investigated previously /6/. It was found that the distribution of terpy (B) between the two phases and subsequent protonation takes place in four steps described by the reactions:
BB⇔ (R1)++ ⇔+ BHHB (R2)
++ ⇔+ 222 BHHB (R3)
++ ⇔+ 333 BHHB (R4)
A bar over the symbol indicates a species in the organic phase. The equilibrium constants for these four reactions are published in /6/.
Figure 2-11. Extraction of europium using a synergic system with terpy and HA, or HA alone. The terpy concentration is kept at 0.02 M while the HA concentration is varied.
–5
–4
–3
–2
–1
0
1
–2 –1.5 –1 –0.5 0 0.5 1
log [HA]
log
D Eu
HA + Terpy HA

21
The behaviour of HA in a two-phase system of TBB as organic phase and an aqueous phase of 1 M (H/Na)NO3 has been investigated and the paper has been accepted by Solvent Extraction and Ion Exchange and will be published later this year /7/. The HA can also be deprotonated, either in the phase boundary of after transport into the aqueous phase. Where the deprotonation takes place is not included in the model. The distribution coefficient for HA between the organic and aqueous phases may be interpreted as the distribution coefficient of HA between the organic bulk and the phase boundary. The behaviour of HA in this two-phase system is described by three reactions:
( )22 HAHA⇔ (R5)
HAHA⇔ (R6)+− +⇔ HAHA (R7)
The equilibrium constants for these three reactions have been found recently, see Table 2-3, and also validated by making AKUFVE experiments in which the distribution of HA was measured using neutron activation of the Br as a function of the [H+]. Then the experimental values were compared to theoretical values calculated with the found constants using equations E1 and E2. A good comparison between experiment and theory was found, see Figure 2-12.
Figure 2-12. Results from the AKUFVE experiments displayed as Exp1 (to find the distribution constant) and Exp2 (to validate the experiments). The distribution ratios found from calculation based on other kinds of experiments are illustrated by the Calc line.
Table2-3. Molarequilibriumconstantsfor2-bromodecanoicacid.
Dimerisation constant, k’2 278 ± 60
Distribution constant, k’d 799 ± 105
Acid dissociation constant, k’a (*10–3) 3.18 ± 0.10
0
1
2
3
4
5
–1 1 3 5
log
D Br
Exp 1 Exp 2 Calc
-log [H ]+

22
[ ] [ ] [ ]
[ ] 11
2
'
'
'2
2'
2''2
+
⋅+⋅⋅⋅
=+
+−+
Hk
HkkAH
kkk
D
a
a
d
a
d
Calc (E1)
where [A–] is calculated according to:
[ ][ ] [ ] [ ] [ ]
[ ] [ ]
+⋅+⋅⋅
+⋅+⋅⋅+
⋅⋅⋅+
⋅⋅⋅−
=++
++++
−
112
11422
''
'
''
'2
2'
2''2
2
2'
2''2
2
Hk
Hkk
Hk
Hkk
k
kkH
k
kkH
A
aa
d
aa
d
a
d
a
d
(E2)
The idea is that by adding HA to the organic phase, the adducts of terpy and HA will prevent terpy from transferring to the aqueous phase and protonate. If this effect can be observed the constants for the adduct formation may be found.
Since there is no information as to how the stoichiometry of the adducts look a number of different scenarios must be tested. Starting with the simplest one assuming that the adduct is formed between one terpy and one or two HA monomers. This is described by the reactions below:
( )HABHAB ⇔+ (R8)
( )22 HABHAB ⇔+ (R9)
For every reaction an equilibrium constant can be calculated. The equilibrium constants are denoted as kx, where x is the number of the reaction.
The distribution of terpy between the two phases is described as:
[ ][ ] totaq
totorgB B
BD
,
,= (E3)
By exchanging the total concentration with the concentrations of all possible species the following equation is found:
[ ] [ ]( )[ ] [ ] [ ] 4
33
22
9
2
81
1
1
kHkHkHkHAkHAkDB
⋅+⋅+⋅+
⋅+⋅+=
+++ (E4)
This is the equation that will be fitted to the experimental data. The two constants k8 and k9 are unknown and the [HA] must be calculated by setting up an expression for the total HA concentration. If the model does not fit the experimental data satisfactory the model may be altered to include such things as dimers or polymers of terpy and HA.
Experiments were done by contacting an aqueous phase containing initially 0.01 M HNO3 and 0.99 M NaNO3 with different organic phases containing 0.02 M terpy and different concentrations of HA.

2�
Contact was made by shaking both phases together vigorously for 5 minutes and after contact centrifuge for 15 minutes at ~ 2,000 g. Samples were taken from both phases and added to an acidic copper(I) solution consisting mainly of ethanol and measured in a UV-VIS spectrophotometer. This method was also used when investigating the protonation behaviour of terpy /6/. The Cu-terpy complexes formed in this mixture give good peaks in the 320 to 350 nm range. The peak at 340 nm was used to calculate the distribution ratio of terpy between the aqueous and organic phases. Results from these experiments are shown in Figure 2-13.
The figure shows a clear trend that terpy is held in the organic phase by the HA. It is also worth mentioning that the [H+] at equilibrium is increased when increasing the HA concentration. Previous studies /6/ show that an increase in [H+] would give a decrease in the distribution ratio of terpy without HA present in the organic phase. This study shows that the complexes formed with the carboxylic acid prevents the decrease in the distribution ratio of terpy even at higher H+-concentrations.
There is an indication that adducts are formed between the carboxylic acid and the nitrogen bearing ligand. These complexes probably play a role in the increased solubility of a nitrogen bearing ligand, such as terpy or a BTP that is observed when adding a carboxylic acid to the system. It has also been observed that, although there is a synergic effect, a too high concentration of HA together with terpy will result in a decrease of metal extraction, see Figure 2-11. This may be due to complex formation between terpy and HA, leaving no free terpy to complex the metal, or the fact that the polarity of the organic phase is altered when the HA concentration is increased. A change to a diluent with different polarity may both increase and deacrease the distribution ratio depending on which mechanisms dominate and how the extracted complex looks.
Figure 2-13. The distribution of terpy as a function of the total HA concentration. Uncertainties are calculated from the standard deviations in the triple samples.
0.4
0.45
0.5
0.55
0.6
0.65
0.7
0.75
–4.5 –4 –3.5 –3 –2.5 –2 –1.5 –1 –0.5 0 0.5
log [HA]
log
D (T
erpy
)

2�
2.4 NitrogencoordinatingabsorbentsA number of nitrogen coordinating absorbents were tested for extraction. The absorbents are presented in Table 2-4 and Figure 2-14.
These absorbents were tested for extraction of 152Eu, 234Th, 239Np, 238Pu and 241Am. The solid supports without any addition of nitrogen coordinating substances were also tested.
All experiments were done by contacting between 1 mg and 20 mg of solid sample with 1 ml of aqueous solution for 1 h in a shaking machine at ambient temperature. The aqueous solutions contained in total 1 M of NO3
– with different ratios of HNO3 and NaNO3. The radioactive elements were present in trace amounts. 241Am and 152Eu were trivalent, 234Th and 239Np were added as Th(IV) and Np(V), respectively, while 238Pu was mainly a mixture of Pu(IV) and Pu(VI) in 6 M HNO3 (no redox control was performed). All experiments with 234Th, 239Np and 238Pu were performed as duplicates and experiments with 241Am and 152Eu as triplicates.
Distribution ratios were calculated as:
M
MMM C
CCD
−= 0,
(E5)
where CM,0 is the concentration of the metal (M) before and CM the concentration after contact with the solid extractant. To take the phase ratio into account these ratios are usually expressed as kD values (ml/g) by multiplication with V/m where V is the volume of the aqueous phase and m the mass of the solid phase.
241Am and 152Eu were measured in a HPGe detector. 234Th, 238Pu, 239Np were measured by liquid scintillation counting.
Figure 2-14. Nitrogen coordinating ligands on solid support.
OSi
O
O
N
OH
NN
N
Lichrosphere Si60
OSi
O
O
N
O
N
NO
NN
NO
NN
N
N
H
SBA-16 surface
NN
NN
N
NN
N
N NN
NN
R2
R1
PyPz-Lichrosphere Si60 PyPz-diamide-SBA-16
C2-BTBP (polymer not shown) Generic Hemi-BTP (polymer not shown)
2�
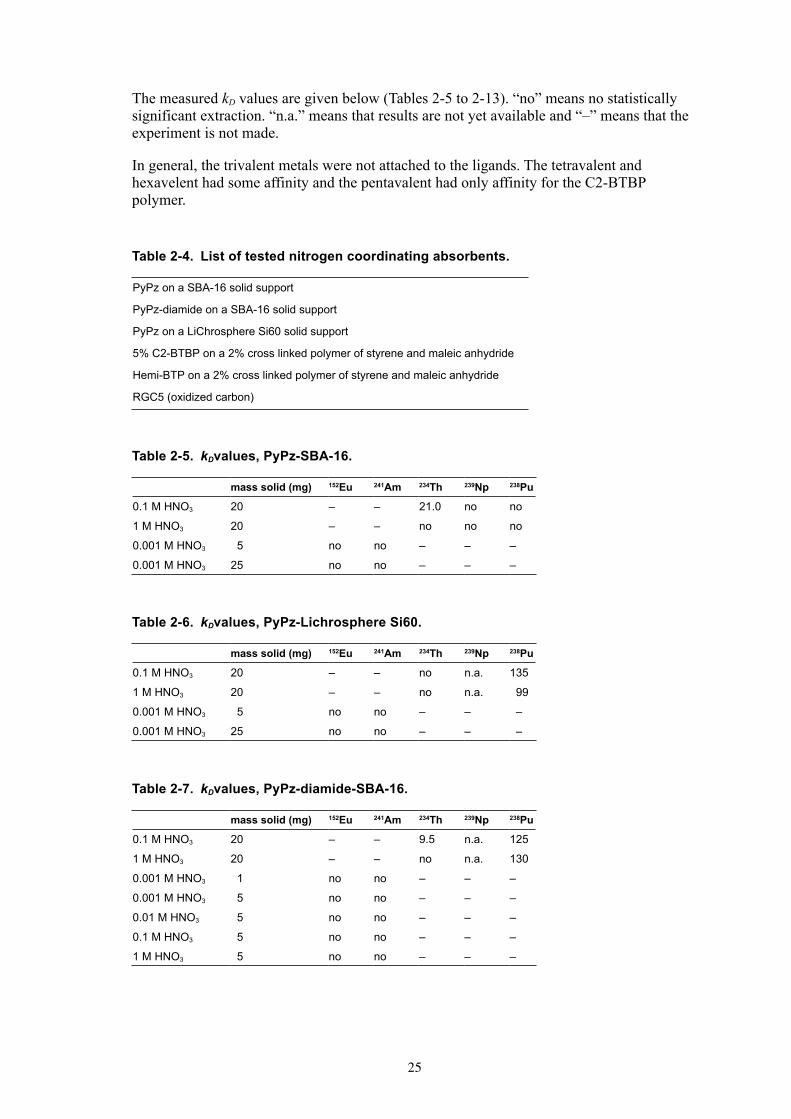
Table2-4. Listoftestednitrogencoordinatingabsorbents.
PyPz on a SBA-16 solid support
PyPz-diamide on a SBA-16 solid support
PyPz on a LiChrosphere Si60 solid support
5% C2-BTBP on a 2% cross linked polymer of styrene and maleic anhydride
Hemi-BTP on a 2% cross linked polymer of styrene and maleic anhydride
RGC5 (oxidized carbon)
Table2-5. kDvalues,PyPz-SBA-16.
masssolid(mg) 152Eu 241Am 234Th 239Np 238Pu
0.1 M HNO3 20 – – 21.0 no no
1 M HNO3 20 – – no no no
0.001 M HNO3 5 no no – – –
0.001 M HNO3 25 no no – – –
Table2-6. kDvalues,PyPz-LichrosphereSi60.
masssolid(mg) 152Eu 241Am 234Th 239Np 238Pu
0.1 M HNO3 20 – – no n.a. 135
1 M HNO3 20 – – no n.a. 99
0.001 M HNO3 5 no no – – –
0.001 M HNO3 25 no no – – –
Table2-7. kDvalues,PyPz-diamide-SBA-16.
masssolid(mg) 152Eu 241Am 234Th 239Np 238Pu
0.1 M HNO3 20 – – 9.5 n.a. 125
1 M HNO3 20 – – no n.a. 130
0.001 M HNO3 1 no no – – –
0.001 M HNO3 5 no no – – –
0.01 M HNO3 5 no no – – –
0.1 M HNO3 5 no no – – –
1 M HNO3 5 no no – – –
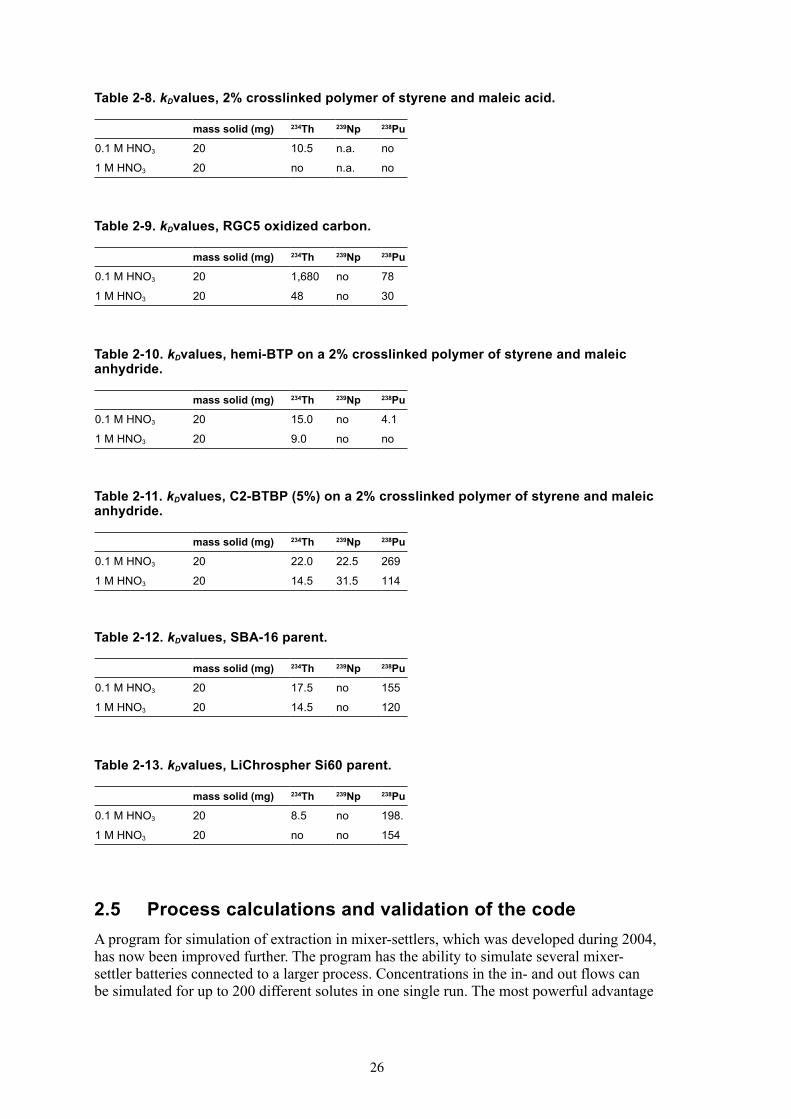
The measured kD values are given below (Tables 2-5 to 2-13). “no” means no statistically significant extraction. “n.a.” means that results are not yet available and “–” means that the experiment is not made.
In general, the trivalent metals were not attached to the ligands. The tetravalent and hexavelent had some affinity and the pentavalent had only affinity for the C2-BTBP polymer.
26
2.5 ProcesscalculationsandvalidationofthecodeA program for simulation of extraction in mixer-settlers, which was developed during 2004, has now been improved further. The program has the ability to simulate several mixer-settler batteries connected to a larger process. Concentrations in the in- and out flows can be simulated for up to 200 different solutes in one single run. The most powerful advantage
Table2-9.kDvalues,RGC5oxidizedcarbon.
masssolid(mg) 234Th 239Np 238Pu
0.1 M HNO3 20 1,680 no 78
1 M HNO3 20 48 no 30
Table2-10.kDvalues,hemi-BTPona2%crosslinkedpolymerofstyreneandmaleicanhydride.
masssolid(mg) 234Th 239Np 238Pu
0.1 M HNO3 20 15.0 no 4.1
1 M HNO3 20 9.0 no no
Table2-11.kDvalues,C2-BTBP(5%)ona2%crosslinkedpolymerofstyreneandmaleicanhydride.
masssolid(mg) 234Th 239Np 238Pu
0.1 M HNO3 20 22.0 22.5 269
1 M HNO3 20 14.5 31.5 114
Table2-12. kDvalues,SBA-16parent.
masssolid(mg) 234Th 239Np 238Pu
0.1 M HNO3 20 17.5 no 155
1 M HNO3 20 14.5 no 120
Table2-13.kDvalues,LiChrospherSi60parent.
masssolid(mg) 234Th 239Np 238Pu
0.1 M HNO3 20 8.5 no 198.
1 M HNO3 20 no no 154
Table2-8.kDvalues,2%crosslinkedpolymerofstyreneandmaleicacid.
masssolid(mg) 234Th 239Np 238Pu
0.1 M HNO3 20 10.5 n.a. no
1 M HNO3 20 no n.a. no

2�
with the program is the possibility to acquire data of the concentrations continuously and not necessarily at equilibrium. This makes it possible to study the kinetics of the system. Changes in flow rates towards equilibrium can also be investigated.
The basic idea of the program is that small volume elements are moved through the system in small time steps. After a volume is moved into a new part of the system, new concentrations and flows are calculated and data collected. This continues until a user decided stop time is reached.
Improvements during 2005:• The maximum number of solutes has been changed from 20 to 200.• The graphical layout for the solutes has been changed to more easily handle more
solutes and in the future make it simple to add more parameters for the solutes (Figure 2-15).
• The program is now able to calculate the acidity (acid extraction), which will be needed later to calculate the changes in the distribution ratios due to the acidity.
• A conditioning step has been added to make it possible for flows, volumes and acidity to reach equilibrium before the real feed is connected.
• Some minor changes have been done to make it possible to simulate centrifuges.• Introduction of an efficiency parameter for the batteries (still under development).• Possibility to make correction for mixture of the aqueous and organic phase out from
a centrifuge or mixer-settler (still under development).
Figure 2-15. Picture of the old layout.

28
2.5.1 Experimentalvalidation
One of the more important steps in model development is to somehow verify the program. Generally this is divided into two steps, verification and validation. In the verification step one makes sure that the theory and the code are correctly implemented into the computer program. Validation is done to ascertain that the program results actually mirror the reality it is supposed to simulate. The verification of this code has been done against analytical solutions at equilibrium and the validation is ongoing with parts of it described below.
In this validation the extraction of thorium by 2-(ethylhexyl) phosphoric acid, HDEHP is investigated. Extraction studies were carried out with an initial nitric acid concentration of 0.1 M and a Th(IV) concentration of 10–4 M meaning that the effect of [H+] release in the extraction is negligible.
The first step of this study was to determine HDEHP concentration in order to get a distribution ratio between 20–50. The analysis technique was ICP-MS. In order to obtain this suitable distribution ratio for the validation experiments, some experiments were run using different concentrations of reagent, HDEHP. The concentrations are given in Table 2-14 with corresponding distribution ratios. 1.5 ml of aqueous phase (0.1 M nitric acid, 10–4 M 232Th) and 1.5 ml of organic phase (HDEHP, kerosene) were contacted in a 3.5 ml glass vial that was shaken vigorously for 5 minutes and then centrifuged for 5 minutes at ~ 2,000 g to achieve settling of the smallest droplets.
The resulting aqueous phase was then sampled, weighed and finally mixed with a mixture of 1 M nitric acid and rhodium, indium and yttrium (at a concentration of 5 ppb) as internal standards.
Based on these results, the following parameters were chosen to set up the mixer-settlers experimental conditions: [HDEHP] = 10–3 M and [Th] = 10–4 M. Previous investigations indicate that 2 ligands are attached to each metal ion, this would keep us free from loading. Please note that the highest distribution ratio is quite uncertain due to the experimental difficulties sampling from such an experiment.
An overall description of the mixer-settler equipment can be found in /8/.
In order to improve separation, a grid is used between the mixing and settling compartments. This grid is able to shield the mixer compartment in the case of strong interface level variations. The inlet flows are going to the system by using pumps with variable flowrate. Process starting is done following these steps:• The mixing and settling chambers are filled respectively with 15 ml and 50 ml
of each phase.• The mixing motor is set up to the chosen velocity.• The pumps are started.
So far, studies have been done with only one mixer-settler.
Table2-14. HDEHPconcentrationsandcorrespondingdistributionratios.
[HDEHP](M) 0.1 0.01 0.001 5·10–4
D 11,558 ± 486 4,315 ± 1,746 67 ± 12 5±1

2�
Pumps used for ingoing organic and aqueous phases have been set up to 100 ml/h and mixer speed to 1,100 rpm.
Once the process started, organic and aqueous phase were sampled every 2 minutes during the first 30 minutes and then every 5 minutes up until 1 h. Samples were collected at the outlet level. Then the organic phase was stripped with 2 M nitric acid with a volume ratio 1:1. This procedure was checked and the strip was complete.
Then10μlofeachsamplewastaken,weighedanddiluted1:500ina1Mnitricacidsolution containing three references (indium, rhodium and yttrium) at a concentration of 5 ppb. These samples were analyzed by ICP-MS. The method used for ICP-MS analysis is described partly in /9/: each phase is analyzed after 2 minutes nebulization. The instrument is then cleaned during two minutes by 1 M suprapure nitric acid in order to reduce memory effect.
The validation of the code is illustrated in Figure 2-16. The experimental data follow the model values. Some uncertainties in the experimental work determined the deviation from the modelled values.
When starting with a 1:1 ratio of the phases (V mixorg = 20 ml, V mix
aq = 20 ml, V settlerorg = 50 ml,
V setlleraq = 50 ml) the settings of the mixer-settler were not optimised so instead the following
relations were used in the simulations; V mixorg = 12.9 ml, V mix
aq = 20.3 ml, V settlerorg = 32.1, V setller
aq = 50.7 ml.
New experiments will be run with a lower distribution ratio, around 10 and a volume ratio of 1/1. Then for a more thorough validation other parameters will be changed, such as:• Flow ratio. • Mixer velocity.• Use of more than one mixer-settler.
Figure 2-16. Validation of the code using 2-(ethylhexyl) phosphoric acid, HDEHP, and a 234Th solution.
0.000000
0.000002
0.000004
0.000006
0.000008
0.000010
0.000012
0.000014
0.000016
0 10 20 30 40 50 60 70 80 90
Time (min)
[HD
EHP]
(M)
Model data Experimental data

�0
2.6 EffectofdifferentsidegroupsonheterocyclicligandsA series of experiments were performed with a number of BTP-like molecules. The experiments try to answer question such as:• Do the side groups on the heterocyclic molecules have any influence on the extraction
and in what way? • Does the organic system influence the extraction behaviour of these molecules and in
what way?
Naturally, the experiments need to be extended, since just two diluents, tert-butyl-benzene (TBB) and hexanol, were investigated. The ligands used in the experiments are illustrated in Figure 2-17.
A closer look at the structure of these molecules indicates that there should be a significant difference in behaviour, due to the large groups bonding to the base molecule. These groups can have a steric influence (steric obstruction) in the organic system. It was previously shown, within the EUROPART project, that among the ligands in Figure 2-17 L-HBTP has the highest extraction for americium and also the highest separation factor between americium and europium. A difference in the extraction behaviour was observed between S-BTP1 and S-BTP2, which have the same side groups, but the last one contains a methoxy group attached to the central pyridine ring. It is likely that the oxygen, which is a donor atom like nitrogen, will change the electron donor capabilities for the S-BTP2 compared to the S-BTP1.
Figure 2-17. Heterocyclic ligands used to investigate side group effects.
N
NN N
NN N
N
NN
N NN
NN
N NN
NN
N NN
NN
O
L-HBTP (CyMe4-S-BTP)
C17H17N5 (BDP) C5-S-BTP (C5-hemi)
S-BTP1
S-BTP2

�1
Extraction experiments were carried out with the four semi-BTP (hemi-BTP) ligands in Figure 2-17 using an organic phase containing 0.01 M ligand in tert-butyl benzene (TBB)with0.5Mα-bromodecanoicacidandanaqueousphasecontaining0.01MHNO3 and 0.99 M NaNO3 spiked with trace amounts of 241Am and 152Eu. The results from the extraction can be seen in Figure 2-18.
Another experiment was carried out, with a similar organic system, but instead of α-bromodecanoicacid,0.025MDMDOHEMAwasused.Onemoreheterocyclicmoleculewas tested (the BDP), so the experiment was carried out with all 5 molecules in Table 2-16 this time. The results for S-BTP1 have however been omitted from Figure 2-19 due to some uncertainties in the experiments. Extraction experiments carried out within the PARTNEW project showed that for this particular system, S-BTP1 or S-BPT2 with DMDOHEMA in TBB, gave similar results for the two molecules, and almost identical with the results for S-BTP2 in Figure 2-19.
In both experiments some differences were observed between the extraction capacities of the ligands in each system, e.g. L-HBTP gave the highest extraction. However, there are large differences in the extraction between the two organic systems used. Both distribution ratios and separation factors are much higher in the case of the organic system containingligandandα-bromodecanoicacidinTBBthanthesystemcontainingligandandDMDOHEMA in TBB. In the last system it seems that DMDOHEMA does not make a good synergic system with the molecules tested.
Another investigation was done with a more polar diluent in order to establish how the polar character of the diluent affects the extraction and the separation factor for the molecules in Figure 2-17. For this, an organic system containing 0.01 M ligand and 0.5 M α-bromodecanoicacidinhexanolwasused.TheresultsareshowninFigure2-20.
Figure 2-18. Extraction results from experiments using 0.01 M of different semi-BTP molecules in synergy with 0.5 M 2-bromodecanoic acid in TBB. The aqueous phase contained 0.01 M HNO3, 0.99 M NaNO3 and trace amounts of 241Am and 152Eu.
–2
–1.5
-1
–0.5
0
0.5
1
S-BTP 1 S-BTP 2 L-HBTP C5-hemi
log
D
0
5
10
15
20
25
30
SF
Am Eu SF (Am/Eu)

�2
Figure 2-19. Extraction results from experiments using 0.01 M of different heterocyclic ligands in synergy with 0.025 M DMDOHEMA dissolved in TBB. Aqueous phase contained 0.01 M HNO3, 0.99 M NaNO3 and trace amounts of 241Am and 152Eu.
–3,2
–3,0
–2,8
–2,6
–2,4
–2,2
–2,0
S-BTP2 L-HBTP C5-hemi C17H17N5
log
D
0.0
0.5
1.0
1.5
2.0
2.5
3.0
SF
Am Eu SF (Am/Eu)
Figure 2-20. Extraction results from experiments using 0.01 M of different semi-BTP molecules in synergy with 0.5 M α-bromodecanoic acid in hexanol. The aqueous phase contained 0.01 M HNO3, 0.99 M NaNO3 and trace amounts of 241Am and 152Eu.
–3,5
–3
–2,5
–2
–1,5
–1
–0,5
0
C5-hemi C17H17N5 L-HBTP S-BTP1 S-BTP2
log
D
0
2
4
6
8
10
12
14
16
18
SF
Log D Am Log D Eu SF (Am/Eu)

��
Comparingthesynergeticextractionwithα-bromodecanoicacidinTBBtohexanolitisclear that the distribution ratios are much lower in hexanol for all ligands tested in both diluents. There is also a decrease in the separation factor between americium and europium, except for S-BTP2, which still have a SF of around 14. L-HBTP still gives the highest separation factor.
Further investigations are needed for these systems, and probably a change in the ligand family would be recommended, since the semi-BTPs need an additive to give extraction. Probably the BTP or BTBP family are more suitable to study the effect of side groups on extraction, since there is no need for other organic species that can interfere in the formation of extractable complexes.
2.7 ExtractionoffissionproductsandcorrosionproductsThe high level liquid waste solutions contain a mixture of fission products, corrosion products and actinides. The extraction ability of CyMe4-BTBP, see Figure 2-21, towards some of these products is interesting to study since it has shown promising results in previous chapters.
For this purpose, two concentrated (inactive) solutions were prepared. The elements included in these solutions were: 1. Se, Sr, Zr, Ru, Ag, In, Sb, La, Pr, Sm and Gd; 2. Rb, Y, Rh, Pd, Cd, Te, Ce, Nd and Eu.
These solutions were prepared with different nitric acid concentration: 0.1, 0.5, 1, 3 and 5 M.
Figure 2-21. Schematic picture of CyMe4-BTBP.
NN
N
N
N
NN
N

��
2.7.1 ExtractingcapabilityofCyMe4-BTBPinTBB
The extracting system used for this experiment was 0.01 M CyMe4-BTBP and 0.5 M 2-bromodecanoic acid dissolved in TBB. Due to the fact that the quantity of CyMe4-BTBP existing in our laboratory at that time was insufficient, only the experiments involving thefirstsolutionwereperformed.Theaqueousphasecontained1μMofeachelementinsolution 1, dissolved in varying concentration of HNO3.
Theextractionexperimentswerecarriedoutintriplicateasfollows:500μlofaqueousphasewascontactedwith500μloforganicphaseduringonehourinashakingmachine.The system did not reach equilibrium. After that, the samples were centrifuged for 15minutesat~2,000g,inordertohaveagoodseparationofthephases.400μlsampleswere taken from the aqueous phase, before and after contact, for measurements using ICP-MS. To this sample 9.6 ml of Internal Standard, consisting of 133Cs, 159Tb, 93Nd and 75As in 1 M ultrapure HNO3, was added. A dilution of 1:20 was achieved. The difference in metal concentration in the aqueous phase before and after contact was prescribed the organic phase and distribution ratios could be calculated. The results of the experiments are shown in Tables 2-15 to 2-16. In the tables, “–” means that the results were either below the detection limit or that something happened in the analysis to make it doubtful.
Care must be taken when interpreting these results since some of them are based on single samples only and thus no real grasp of the uncertainty may be given. The method used to analyse the samples must be optimised with regard to interferences. It would also be very fruitful to couple the ICP-MS measurements with radiotracers to have a correlation.
These results are preliminary since there are still some interferences with internal standards. Therefore, the distribution ratios are mainly an indication and no conclusions about the mechanisms may be drawn at present.
Table2-15. DistributionratiosofthelightlanthanidesatdifferentHNO3concentrationsusing0.01MCyMe4-BTBPand0.5M2-bromodecanoicacidinTBB.
[HNO3](M) La Pr Sm Gd
0.1 0.006 0.034 0.087 0.046
0.5 – – 0.012 0.006
1 – – 0.009 0.005
3 0.001 0.005 0.047 0.037
5 – 0.003 0.035 0.031
Table2-16. DistributionratiosofvariousfissionandcorrosionproductsatdifferentHNO3concentrationsusing0.01MCyMe4-BTBPand0.5M2-bromodecanoicacidinTBB.
[HNO3](M) Se Zr Ru Ag In Sb
0.1 0.05 1.4 0.003 170 91.1 0.101
0.5 0.024 1.28 – 418 3.8 0.017
1 0.004 1.5 – 250 1.4 0.0115
3 0.13 0.65 0.009 – 0.16 0.006
5 – 0.28 0.018 – 0.036 0.009

��
2.7.2 ExtractingcapabilityofCyMe4-BTBPin1-octanol
In these experiments the aqueous phases initially contained 50 µM of each metal and were contacted with equal volumes of organic phase comprising 0.01 M CyMe4-BTBP in 1-octanol. The phases were contacted for 5 minutes vigorous shaking by hand and after phase separation samples were taken from the aqueous phases and analyzed as described in the precious section, but in this latter case the Internal Standard did not contain any 93Nd due to previous interferences. The distribution ratios are shown in Tables 2-17, 2-18 and 2-19.
In the case of the lanthanides and yttrium there is no trend depending on acidity of the aqueous phase. The distribution ratios are generally low for all of the studies elements.
In general, many of the fission and corrosion products investigated here gave low extraction. Some elements such as palladium, silver, cadmium and indium had distribution ratios above 1. However, the contact time in this experiment is quite short so it is possible that equilibrium was not reached for all elements, which may explain the low distribution ratios.
Table2-17. DistributionratiosofthelightlanthanidesandyttriumatdifferentHNO3concentrationsusing0.01MCyMe4-BTBPin1-octanol.
[HNO3](M) La Ce Nd Sm Eu Y
0.1 – 0.028 0.03 – 0.03 0.03
0.5 0.02 0.021 0.03 0.02 0.03 0.03
1 0.03 0.004 – 0.06 0.03 –
3 – 0.002 0.03 0.2 0.05 0.02
5 0.03 – – – – –
Table2-18. DistributionratiosofvariousfissionandcorrosionproductsatdifferentHNO3concentrationsusing0.01MCyMe4-BTBPin1-octanol.Mostoftheseelementsgavelowextraction.
[HNO3](M) Se Rb Sr Zr Nb Ru Rh
0.1 0.1 0.03 – 0.2 – 0.03 0.030.5 0.07 0.03 0.02 – 0.02 0.03 0.031 0.1 – 0.03 0.2 0.06 0.03 –3 0.1 0.01 – 0.3 0.2 0.05 0.025 0.1 – 0.03 0.2 – – –
Table2-19. DistributionratiosofvariousfissionandcorrosionproductsatdifferentHNO3concentrationsusing0.01MCyMe4-BTBPin1-octanol.Someoftheseelementswereamongthebestextractedofthefissionandcorrosionproducts.
[HNO3](M) Pd Ag Cd In Sb Te
0.1 4 450 250 0.2 0.1 0.070.5 11 400 350 1 – 0.051 12 300 400 3 0.06 0.023 10 300 550 10 – 0.0085 10 300 500 17 0.03 –
�6
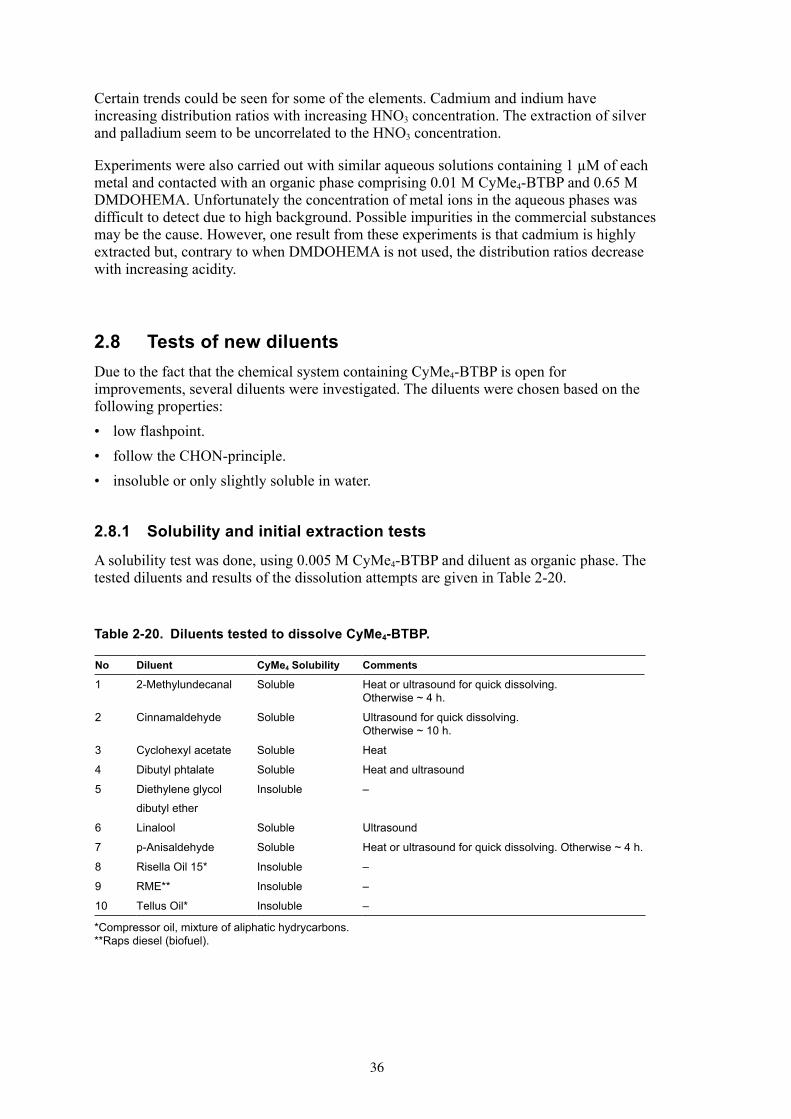
Certain trends could be seen for some of the elements. Cadmium and indium have increasing distribution ratios with increasing HNO3 concentration. The extraction of silver and palladium seem to be uncorrelated to the HNO3 concentration.
Experiments were also carried out with similar aqueous solutions containing 1 µM of each metal and contacted with an organic phase comprising 0.01 M CyMe4-BTBP and 0.65 M DMDOHEMA. Unfortunately the concentration of metal ions in the aqueous phases was difficult to detect due to high background. Possible impurities in the commercial substances may be the cause. However, one result from these experiments is that cadmium is highly extracted but, contrary to when DMDOHEMA is not used, the distribution ratios decrease with increasing acidity.
2.8 TestsofnewdiluentsDue to the fact that the chemical system containing CyMe4-BTBP is open for improvements, several diluents were investigated. The diluents were chosen based on the following properties:• low flashpoint.• follow the CHON-principle.• insoluble or only slightly soluble in water.
2.8.1 Solubilityandinitialextractiontests
A solubility test was done, using 0.005 M CyMe4-BTBP and diluent as organic phase. The tested diluents and results of the dissolution attempts are given in Table 2-20.
Table2-20. DiluentstestedtodissolveCyMe4-BTBP.
No Diluent CyMe4Solubility Comments
1 2-Methylundecanal Soluble Heat or ultrasound for quick dissolving. Otherwise ~ 4 h.
2 Cinnamaldehyde Soluble Ultrasound for quick dissolving. Otherwise ~ 10 h.
3 Cyclohexyl acetate Soluble Heat
4 Dibutyl phtalate Soluble Heat and ultrasound
5 Diethylene glycol
dibutyl ether
Insoluble –
6 Linalool Soluble Ultrasound
7 p-Anisaldehyde Soluble Heat or ultrasound for quick dissolving. Otherwise ~ 4 h.
8 Risella Oil 15* Insoluble –
9 RME** Insoluble –
10 Tellus Oil* Insoluble –
*Compressor oil, mixture of aliphatic hydrycarbons.**Raps diesel (biofuel).

��
The solutions from the dissolution tests, in which CyMe4-BTBP was dissolved properly, were used for general screening experiments. Two aqueous solutions were used containing 0.1 M H+ and 1 M NO3
– and trace amounts of 241Am or 152Eu, respectively. 300 µl of each phase was contacted for 5 minutes (shaking by hand). Samples of 100 µl were taken from each phase and measured in NaI(Tl) detector. For the experiments with organic solutions containing cyclohexyl acetate an aqueous solution containing 0.01 M HNO3, 0.99 M NaNO3 and trace amounts of 241Am and 152Eu was used. In this case, a HPGe was used for detection.
The experiments were performed in triplicates and the results of these extraction tests are shown in Figure 2-22.
Unfortunately most of the results were not good enough for further experiments, due to low values of distribution ratios and separation factors. Only two diluents were chosen for further experiments: cinnamaldehyde and p-anisaldehyde, see Figure 2-23.
The reason these two diluents were chosen was that they showed the highest distribution ratios after 5 minutes shaking, even though the separation factors were low. Other reasons for choosing these diluents were the aromatic rings, which may protect the ligand molecule against radiolysis and the very low solubility (or total insolubility) in water. Both diluents are used in perfumery and food industry today.
An extraction experiment was done with the pure diluents, without any addition of CyMe4-BTBP, using the same aqueous phase as before. 500 µl of each phase, aqueous and organic, were contacted for 5 minutes, 100 µl were taken as samples and measured with a NaI detector. Results showed that the diluents are not extracting by themselves.
Figure 2-22. Extraction using 0.005 M CyMe4-BTBP in different organic diluents. Aqueous phase contained 0.1 M H+ (or 0.01 M H+ in case of cyclohexyl acetate) and 1 M NO3
– and trace amounts of 241Am or 152Eu. 5 minutes contact time shaking by hand.
–5
–4
–3
–2
–1
0
1
2
2-Meth
ylund
ecan
al
Cinnam
aldeh
yde
Cycloh
exyl
aceta
te
Dibutyl
phtal
ate
Linalo
ol
p-Anis
aldeh
yde
log
D
1
10
100
1000
SF
Am Eu SF (Am/Eu)

�8
2.8.2 Kinetics/timedependence
The first experiments done after choosing the diluents were the kinetics of the two systems as this would give an answer to required contact time in order to reach equilibrium. The experiments were carried out in triplicates. The organic phase consisted of 0.01 M CyMe4-BTBP in cinnamaldehyde or p-anisaldehyde. The dissolution of CyMe4-BTBP was helped by ultrasound bath; the dissolution was particularly slow in cinnamaldehyde. Two aqueous phases were used which contained 0.1 M H+, 1 M NO3
– and trace amounts of 241Am or 152Eu, respectively. 500 µl of each phase was contacted by manual shaking for 1, 3, 10, 20 and 30 minutes. After shaking, the samples were centrifuged and sample volumes of 100 µl were taken from each phase and measured in a NaI detector. The results are shown in Figures 2-24 and 2-25.
For cinnamaldehyde it is clear that after 30 minutes 241Am is highly extracted and may not yet have reached equilibrium while the 152Eu extraction seems to have reached equilibrium. The separation factor shows a clear trend, increasing with increasing time of contact. Unfortunately, even if the extraction of 241Am is high, the kinetics is too slow, compared to some other systems.
In the case of p-anisaldehyde, see Figure 2-25, 152Eu is extracted more than when using cinnamaldehyde, but 241Am still has higher distribution ratios. The separation factors are smaller than the ones obtained with cinnamaldehyde, even if the distribution ratios are comparable. The kinetics of this reaction is also quite slow and after 30 minutes the system is not yet at equilibrium.
Figure 2-23. Diluents chosen for further extraction studies with CyMe4-BTBP.
cinnamaldehyde (3-phenyl-2-propenal)
p-anisaldehyde (4-methoxy-benzaldehyde)

��
Figure 2-24. Kinetic experiments using 0.01 M CyMe4-BTBP in cinnamaldehyde. The aqueous phase contained 0.1 M HNO3, 0.9 M NaNO3 and trace amounts of 241Am or 152Eu.
Figure 2-25. Kinetic experiments using 0.01 M CyMe4-BTBP in p-anisaldehyde. The aqueous phase contained 0.1 M HNO3, 0.9 M NaNO3 and trace amounts of 241Am or 152Eu.
-1
–0.5
0
0.5
1
1.5
2
2.5
0 5 10 15 20 25 30 35
Time (min)
log
D
0
20
40
60
80
100
120
140
160
180
SF
Am Eu SF (Am/Eu)
–1.5
-1
–0.5
0
0.5
1
1.5
2
2.5
0 5 10 15 20 25 30 35
Time (min)
log
D
0
10
20
30
40
50
60
70
SF
Am Eu SF (Am/Eu)

�0
2.8.3 Concentrationdependence
These experiments were carried out in triplicates. The concentration of CyMe4-BTBP was varied between 0.0025 M, 0.005 M and 0.01 M and the diluent used was p-anisaldehyde. The contact time for the screening test was 5 minutes, shaking by hand. 500 µl of each phase was contacted and 100 µl was taken from each phase and measured in a NaI detector. The results are shown in Figure 2-26.
With increasing concentration of CyMe4-BTBP, an increase in extraction of americium and europium can be observed. The separation factor is between 4 and 6 for all concentrations of CyMe4-BTBP. Unfortunately, this experiment was not carried out at the equilibrium, which would have given a much higher SF, see Figure 2-25.
A concentration experiment with the cinnamaldehyde was not performed, due to the fact that a higher concentration of the ligand (0.01 M) was very difficult to achieve, fine grains could be observed even after more than 15 h.
2.8.4 Conclusions
From the performed experiments, it is possible to say that 241Am seem to be favoured in the extraction with organic systems containing p-anisaldehyde and cinnamaldehyde as diluents, but the kinetics of the reaction is slow. On the other hand, no synergist is needed for obtaining high SF and quite reasonable distribution ratios. The log-log slope in the concentration experiments, see Figure 2-26, was around 0.7 for both metals which seems low compared to previous results using BTBP-ligands where the slope is between 1 and 2. This low result, however, may be due to the fact that equilibrium was not reached. As any other aldehyde, it is possible that those used here are instable in air in a long-term perspective. This was not yet seen.
Figure 2-26. Concentration dependence on the extraction of americium and europium using CyMe4-BTBP in p-anisaldehyde. The aqueous phases contained 0.1 M HNO3, 0.9 M NaNO3 and trace amounts of 241Am or 152Eu.
–1.0
–0.8
–0.6
–0.4
–0.2
0.0
0.2
0.4
–2.7 –2.5 –2.3 –2.1 –1.9 –1.7
log [CyMe4-BTBP]
log
D
0
1
2
3
4
5
6
7
SFAm Eu SF (Am/Eu)
�1
One conclusion from these experiments is that a more thorough criterion should be estab-lished for the selection of new possible diluents for the CyMe4-BTBP organic system. Beside the CHON principle, insolubility in water and high flash point, criterions like high boiling point, non-pollutant, harmless for humans and environment, low viscosity and low freezing point should also be taken into account.
2.9 UncertaintyanalysisofcorrelatedstabilityconstantsDuring the evaluation of experimental data it is advisable to also include uncertainties /10/. However, these uncertainties usually do not include the fact that the obtained stability constants are strongly correlated. To obtain these correlations may be more or less difficult, not using numerical methods.
2.9.1 Stabilityconstantsusingsolventextraction
The theory described in our original paper /11/ is applied to the results on nitrate complex formation constants for americium to investigate the influence of correlation in stability constants on the uncertainty. The variance for each stability constant remains the same, but given one of the constants the possible interval in which the other can vary is significantly reduced.
The distribution ratio of a metal ion (DM) can be expressed using Equation 6, assuming complexes with one, two and three nitrate ions.
[ ][ ] [ ]∑
=
−
== N
n
nn
totaq
totorg
M
NO
D
M
MD
03
0
β (E6)
In Equation 6 one should note that β0 = 1 by definition. Making the following definitions, Equation 7, it is possible to make a linearization of the problem, see Equation 8.
000
1D
AD
A ii
β== (E7)
∑=
=N
n
nn NOA
D 03 ][1 (E8)
where βi are the stability constants and D0 the distribution ratio at low nitrate ion concentration. The A elements were already identified in Equation 7.
The nitrate complex formation constants for, among other elements, americium have been determined /3/. A diluent extraction system consisting of 2-bromodecanoic acid and 2,6-bis-(benzoxazolyl)-4-dodecyloxylpyridine in TBB was used. In the aqueous phase the nitrate ion concentration was varied, but the ionic strength was kept constant with sodium perchlorate as counter species. The extraction was measured and the decrease in extraction when the nitrate complex formation starts to compete with the extraction of the metal ions into the organic phase was used to model the nitrate complex formation constants, described by Equation 6.
The system is solved using a computer program /13/ that eliminates one equation at a time using the largest possible pivot element. As a by-product the inverse matrix M–1 is also calculated. The inverse matrix now contains the variances and covariances for the different

�2
An, and is shown in Table 2-21 for americium nitrate complex formation. This matrix can be converted from A to β, see /14/, and the result is given in Table 2-22. The experiment and corresponding data are taken from /12/, see Table 2-23.
Different approaches are used to describe uncertainty intervals when plotting two variables. One method is to use the standard deviation and draw error bars for both of the parameters, which will give a rectangle in which the “true” value will be within a specified confidence level. If the uncertainties in the two parameters are normally distributed, the rectangle will be replaced by an ellipse (or a circle if the variances of the two parameters are equal), taking into account that the most probable value of the variables is at the mean value. If the two variables are correlated, the ellipse will no longer have it main axis parallel to the coordinate axis of the system. This will decrease the total uncertainty in one variable if the other is given, according to the results shown here.
The confidence ellipses in Figures 2-27 to 2-29 were made using a computer program /15/ in which the values of the variances and covariances in Table 2-22 were used as variables. The ellipses give 95% confidence regions based on a Fisher value of 2.84 (4 parameters, 21 data points), see Equation 6.
The black circles describe the possible variation in stability constants when a non-correlated relationship is assumed between the stability constants. As can clearly be seen the total range for the variables are the same but the range for the dependent variables decrease significantly when the variables are correlated, thus in reality generating smaller uncertainties in the speciation. Since most stability constants are derived in a way that makes them actually correlated the resulting speciation diagrams will be more precise than if they were assumed to be independent. Unfortunately even uncorrelated speciation diagrams are uncommon in the literature despite the fact that deterministic speciation can yield wrong species domination for any given case.
Table2-21. Var(An)andcov(An).
3.83E–05 –1.27E–04 8.59E–05 –1.47E–05
–1.27E–04 1.30E–03 –1.12E–03 2.14E–04
8.59E–05 –1.12E–03 1.16E–03 –2.40E–04
–1.47E–05 2.14E–04 –2.40E–04 5.22E–05
Table 2-22. Var(βi) and cov(βi).
9.47E–04 –7.89E–04 1.52E–04
–7.89E–04 8.28E–04 –1.70E–04
1.52E–04 –1.70E–04 3.70E–05
Table2-23. Stabilityconstantsandtheirstandarddeviationsfor241Amnitratecomplexes.
β1 1.02E+00 3.08E–02
β2 2.95E–01 2.88E–02
β3 2.42E–02 6.09E–03

��
Figure 2-28. Confidence ellipses (95%) for the americium nitrate complex formation β1–β3 (grey), without correlation in black.
Figure 2-27. Confidence ellipses (95%) for the americium nitrate complex formation β1–β2 (grey), without correlation in black.
0.2
0.22
0.24
0.26
0.28
0.3
0.32
0.34
0.36
0.38
0.94 0.98 1.02 1.06 1.1
beta1
beta
2
–0.06
–0.04
–0.02
0
0.02
0.04
0.06
0.08
0.1
1 1.02 1.04
beta1
beta
3

��
The theoretical expression for the contours of the confidence ellipses are given by /16/:
( ) ( ) (p,ν,c)FpsAAXXAA TT ˆˆ 2=−− (E9)
 is the estimation of A, s2 is the mean square error, p the number of parameters determined for the number of data points, ν, and c is the confidence level. XTX is identified to be the inverse variance/covariance matrix (M–1). The fisher value (F) depends on p, ν, and c, and can be found in literature. Convenient use of this equations deals only with two dimensions. The simplified expression can then be expressed as:
02)())((2)( 12112221211 =−−+−−+− −−− FMXMXYMY jjii ββββ (E10)
with the analytical solutions:
12
1
12
1
1
1
1
1111
22
11
12
11
12 2)()()()( −−
−
−
−
−
−
+−−
−±−−=−
MFX
MM
XMM
XMM
Y jjji ββββ (E11)
2.10 ExperimentswithCMPOderivativesofcalix4-arenesExtraction and radiolysis experiments were performed with the two ligands (JMA4 and JMB3) in Figure 2-30.
An initial extraction experiment was carried out with 0.005 M of each calixarene dissolved in 1,1,2,2-tetrachloroethane and contacted with an aqueous phase containing 1 M or 4.5 M HNO3 and trace amounts of 241Am and 152Eu. The phases were contacted for 5 minutes. The results (single sample) from these experiments are presented in Figure 2-31.
The initial extraction experiments showed that an increase in HNO3 concentration gave higher distribution ratios. The ligand JMA4 gave a separation factor of ~ 7 between americium and europium at both concentrations. JMB3 does not show any significant difference in affinity for any of the studies metal ions.
Figure 2-29. Confidence ellipses (95%) for the americium nitrate complex formation β2–β3 (grey), without correlation in black.
–0.06
–0.04
–0.02
0
0.02
0.04
0.06
0.08
0.1
0.27 0.29 0.31
beta2
beta
3

��
Figure 2-30. Tested CMPO derivates of calix4-arenes.
Figure 2-31. Extraction of americium and europium at two different HNO3 concentrations. The organic phases contained 0.005 M calixarene in 1,1,2,2-tetrachloroethane.
OC5 H
NH
4
O
PO
O
4
NH
OP
O
JMA4 JMB3
11
0.0
0.5
1.0
1.5
2.0
2.5
3.0
1
log
D
0
1
2
3
4
5
6
7
8
SF
Am, JMA4 Eu, JMA4 Am, JMB3Eu, JMB3 SF (Am/Eu), JMA4 SF (Am/Eu), JMB3
[HNO3]
4.5
Experiments were conducted to find another diluent that could dissolve these calixarenes. Diluents tested were TPH, 1-octanol, cyclohexanone and p-anisaldehyde. Unfortunately none of these organic diluents could dissolve any of the calixarenes in high enough concentration.
0.005 M calixarene dissolved in 1,1,2,2-tetrachloroethane was exposed to radiolysis. The two samples were placed in a gamma-irradiating cobalt source (Gamma cell 220 from Atomic Energy of Canada ltd) with an estimated dose rate to water of ~ 20 Gy/h. Two other samples were placed outside the gamma source to serve as references and take possible aging of the molecule into account. Samples were taken during a time period of ~ 800 h.

�6
At each sampling samples were taken both from the flasks inside the gamma source as well as from the reference flasks. 0.5 ml of organic phase was contacted with 0.5 ml of aqueous phase containing 4.5 M HNO3 spiked with 241Am, 152Eu and 244Cm. The contact time was 5 min, shaking vigorously by hand. After contact the phases were separated by centrifugation for 15 minutes at 600 g. Aliquots were taken from each phase for gamma measurements (241Am and 152Eu) in a HPGe detector. The extracting capability after various doses is illustrated in Figure 2-32 and Figure 2-33.
The distribution ratios (D) decrease with increasing dose, especially for the JMA4 ligand. The decrease seems to be similar for both americium and europium. JMB3 shows less effect of radiolysis, but on the other hand there is hardly any separation between the two elements. During irradiation a pressure was built up within the flasks. Also, the color of the samples changed after irradiation while the color of the reference samples stayed the same.
Figure 2-32. Extraction of americium and europium by JMA4 after different dose exposures. The organic phase contained 0.005 M calixarene in 1,1,2,2-tetrachloroethane.
Figure 2-33. Extraction of americium and europium by JMB3 after different dose exposures. The organic phase contained 0.005 M calixarene in 1,1,2,2-tetrachloroethane.
–0.5
0
0.5
1
1.5
2
2.5
3
0 2000 4000 6000 8000 10000 12000 14000 16000
Dose (Gy)
log
D
Am Eu Ref Am Ref Eu
–0.5
0
0.5
1
1.5
2
2.5
3
0 2000 4000 6000 8000 10000 12000 14000 16000
Dose (Gy)
log
D
Am Eu Ref Am Ref Eu

��
3 Collaborations
The following laboratories are involved in EUROPART:• Commissariat à l’énergie atomique (France)• British Nuclear Fuels (United Kingdom)• Chalmers University of Technology (Sweden)• Centro de Investigaciones Energeticas MedioAmbientales y Tecnologicas (Spain)• Czech Technical University in Prague (Czech Republic)• Centre National de la Recherche Scientifique (France)• Electricité de France (France)• Ente per le Nuove Tecnologie, l’Energia, l’Ambiente (Italy)• Forschungszentrum Jülich (Germany)• Consejo Superior de Investigaciones Cientificas (Spain)• Institute of Inorganic Chemistry, Academy of Sciences of the Czech Republic
(Czech Republic)• Forschungszentrum Karlsruhe (Germany)• European Commission, Joint Research Centre, Institute of Transuranium Elements
(Germany)• Johannes Gutenberg-Universität (Germany)• Katchem spol. S.r.o. (Czech Republic)• Nuclear Research Insitute Rez plc (Czech Republic)• Politecnico di Milano (Italy)• Universidad Autonoma de Madrid (Spain)• Université de Liège (Belgium)• Université Louis Pasteur I (France)• Università degli studi de Parma (Italy)• University of Reading (United Kingdom)• University of Twente (The Netherlands)• Instytut Chemii I Techniki Jadrowej (Poland)
A more intense collaboration with Chalmers exists with:• Lawrence Berkeley National Laboratory, USA• Forschungszentrum Jülich, Germany• University of Reading, UK• Institut fur Michroteknik Mainz, Germany• Kernkemie, Johannes Gutenberg-Universität, Germany• BNFL, UK• National Institute of Cryogenics and Isotopic Separation, Romania

��
4 Internationalandnationalscientificexchange
EUROPART 2nd half year meeting in Manchester, January 2005. S. Andersson, C. Ekberg, M. Nilsson and T. Retegan.
EUROPART 3rd half year meeting in Prague, June 2005. C. Ekberg, M. Nilsson and T. Retegan.
Every year a study tour for the students taking our basic Nuclear Chemistry course is arranged. This year they visited e.g. Max-Planck-Institut für Fusionsforschung in Greifswald, Hahn-Meitner-Institut in Berlin, Forchungszentrum Rossendorf, the uranium mine of Königstein and Nuclear Chemistry Mainz and their facilities dealing with the separation of the elements in the spent nuclear fuel. G. Skarnemark and M. Nilsson went along.
Institut für Kernchemie, Johannes Gutenberg-Universität Mainz. Activation analysis of bromine as a part of the study of bromodecanoic acid. M. Nilsson
March 2005 a special meeting was organised at Forchungszentrum Karlsruhe on behalf of EUROPART project, concerning a work package decision. C. Ekberg, T. Retegan, M. Nilsson and G. Skarnemark participated.
June 2005, scientific visit at “Laboratoire de Chimie des Systèmes Extractants”, CEA Marcoule DEN/DRCP/SCPS/LCSE, France, under the supervision of Dr. Clément HILL. T. Retegan
ISEC “International Solvent extraction Conference” Beijing, 19–23 of September 2005. C. Ekberg, M. Nilsson, T. Retegan and G. Skarnemark participated.
Christian Ekberg was invited speaker and chairman at the 12th International Conference on Cryogenics and Isotopic Separation, Oct. 12–14 2005, Rm-Valcea, Romania. T. Retegan participated with a poster.
October 2005. A visit was organised at OKG nuclear power plant, where the majority of the Ph.D students and diploma workers from the department participated.
November 2005 C. Ekberg participated in a meeting organised in UK regarding future collaboration for the next European Union Framework Programme (FP7).
November 2005. M. Nilsson was invited speaker at the SKB-day, arranged at Chalmers University of Technology.

�1
5 Articlesandpublications
During the past year several reports and articles have been published, submitted for publication or are still in preparation.
Published
P-E. Ahlström (edt.), S. Andersson, C. Ekberg, J-O. Liljenzin, M. Nilsson, G. Skarnemark, J. Blomgren, M. Eriksson, P. Seltborg, B. R. Sehgal, 2004. Partitioning and Transmutation Current Development – 2004. A Report from the Swedish Reference Group on P&T-research, SKB TR-04-15, Svensk kärnbränslehantering AB.
S. Andersson, K. Eberhardt, C. Ekberg, D. Magnusson,M. Nilsson, H. Nitsche, G. Skarnemark, R. Sudowe, 2005. Synergic Extraction of Lanthanides and Selected Actinides Using 2,6-bis-(benzoxazolyl)-4-dodecyloxylpyridine and 2-bromodecanoic Acid”, Proceedings from the International Solvent Extraction Conference ISEC-05, Beijing, 177–181.
C. Ekberg, G. Skarnemark, 2005. Uncertainty Evaluation for One-atom-at-a-time Studies of Transactinide Elements, Journal of Radioanalytical and Nuclear Chemistry 263(1), 71–74.
C. Ekberg, H. Persson, A. Ödegaard-Jensen, Y. Albinsson, S. Andersson, 2006. Redox control in solvent extraction studies using a PEEK AKUFVE unit, Solvent Extraction and Ion Exchange 24, 1–7.
M. Nilsson, S. Andersson, C. Ekberg, J-O. Liljenzin, G. Skarnemark, The Chemical Properties of 2-bromodecanoic Acid, accepted for publication in Solvent Extraction and Ion Exchange 2005.
G. Skarnemark, S. Andersson, K. Eberhardt, C. Ekberg, V. Hessel, B. Horn, J. V. Kratz, P. Löb, A. Müller, M. Nilsson, A. Ödegaard-Jensen, 2005. Micro Reactor for Continuous Multistage Solvent Extraction, Proceeding of the International Solvent Extraction Conference ISEC-05, Beijing, 1,109–1,114.
M. Nilsson, S. Andersson, C. Ekberg, M. R. S Foreman, M. J. Hudson, G. Skarnemark, 2006. Inhibiting Radiolysis of BTP Molecules by Addition of Nitrobenzene, Radiochimica Acta 94, 103–106.
M. Nilsson, S. Andersson, F. Drouet, C. Ekberg, M. Foreman, M. Hudson, J-O. Liljenzin, D. Magnusson, G. Skarnemark, Extraction Properties of 6,6’-bis-(5,6-dipentyl-[1,2,4]triazin-3-yl)-[2,2’]bipyridinyl (C5-BTBP), Accepted for publication in Solvent Extraction and Ion Exchange 2006.
S. Andersson, H. Nitsche, R. Sudowe, Bk nitrate complex formation using a solvent extraction technique, Radiochimica Acta 94, 59–61 (2006).
Submitted
S. Andersson, C. Ekberg, J-O. Liljenzin, Uncertainty Analysis of Correlated Stability Constants, submitted to Radiochemica Acta, 2005.

�2
M. Nilsson, C. Ekberg, M. R. S. Foreman, M. Hudson, J-O. Liljenzin, G. Modolo, G. Skarnemark, Separation of Actinides(III) from Lanthanides(III) (in Nuclear Waste Streams) using 6,6’-bis-(5,6-dipentyl-[1,2,4]triazin-3-yl)-[2,2’]bipyridinyl (C5-BTBP) in cyclohexanone, submitted to Solvent Extraction and Ion Exchange 2005.
We have also written half-yearly reports to the EUROPART project.
The diploma works by N. Hervieux and Y. Meridiano are available at Chalmers University of Technology.

��
6 Futurework
The future work will continue along the suggested path of the EUROPART project.• Partitioning of actinides (Am to Cf) from High Active Raffinates and High Active
Concentrates issued from the reprocessing of UOX and MOX spent fuels using extracting agents belonging to the families of polyamides and polydendate N or S-bearing molecules and cosan
• Partitioning of actinides (different oxidation states, Th-Cm) for advanced dedicated future fuel cycles, like for example ADS nuclear systems. The co-extraction of actinides of different oxidation states will be studied. Mixtures of ligands, bitopic extractants and chromatographic techniques will be used.
• The effect of correlated data will be investigated further and included in a computer program for speciation calculations.
• Hopefully we will be able to get a new irradiation source for basic stability testing of ligands.
Sofie Andersson is now working for OKG AB but will join our group part time as a co-project leader.
Daniel Magnusson will continue his work on process development and verify the theoretical calculations with some experiments on real high active raffinate in Karlsruhe in Germany
Teodora Retegan will continue the existing work on basic chemical understanding of nitrogen donor ligands both for the DIAMEX and SANEX processes. The main focus will be on ligand-diluent interaction for understanding of the selectivity of the ligands.
Our new PhD student, Anna Fermvik, will study the effect of radiation on the extractant molecules used and what effect the products of radiolysis will have on the extraction.
Hopefully the participation within the 7th framework programme will be finalized during the year and we can then find a replacement for M. Nilsson.
We will also have two new French diploma workers in our group, Luic Mougeolle and Isabelle Dubois. They will mainly work on EUROPART related screening investigation of new ligands.

��
7 References
/1/ EnarssonÅ,SpjuthL,LiljenzinJ-O,KällveniusG,HudsonMJ,IvesonPB,RusellML,MadicC,CordierPY,1999. Separation of trivalent americium and europium with some substituted oligopyridines and triazines in synergy with 2-bromodecanoic acid, Proceedings of ISEC´99, Barcelona, Spain.
/2/ LideDR,2001–2002. Handbook of Chemistry and Physics, 82nd edition, CRC Press.
/3/ RydbergJ,CoxM,MusikasC,ChoppinGR,2004. Diluent extraction Principles and practices, 2nd edition, 2004, Marcel Dekker.
/4/ AnderssonS,DrouetF,EkbergC,LiljenzinJ-O,MagnussonD,NilssonM,ReteganT,SkarnemarkG,2005. Partitioning and Transmutation, Annual Report 2004, SKB R-05-13, Svensk Kärnbränslehantering AB.
/5/ SezginH,2003. Separation of 93Mo from saline groundwater: study of the synergistic extraction of 152Eu in the system {2-bromodecanoic acid/2,2:6,2-terpyridine}, Diploma Work, Chalmers University of Technology.
/6/ AnderssonS,EkbergC,LiljenzinJ-O,SkarnemarkG,2002. Determination of protonation constants of 2,2’:6’,2’’-terpyridine from liquid-liquid distribution data, Proceedings of ISEC’02, Cape Town, South Africa 549–554.
/7/ NilssonM,AnderssonS,EkbergC,LiljenzinJO,SkarnemarkG,2005. The Chemical Properties of 2-bromodecanoic Acid, accepted to Solvent Extr. Ion Exc.
/8/ LiljenzinJ-O,PerssonG,SvantessonI,WingeforsS,1981. Experience from cold tests of the CTH Actinide Separation Process, Transplutonium Elements – Production and Recovery, QCS Symposium Series No 61, J. D. Navratil, W. W. Schulz (Eds), American Chemical Society, Washington D.C., 202–221.
/9/ EkbergC,BrownPL,Ödegaard-JensenA,HillDM,ZawadzkiQZ,2002. Detection of Zirconium in organic and aqueous phases using an inductively coupled plasma-mass spectrometer and the same aqueous standards, Analytical and Bio Chemistry 374, 1,330–1,334.
/10/ MeinrathG,EkbergC,LandgrenA,LiljenzinJ-O,2000. Assessment of Uncertainty in Parameter Evaluation and Prediction, Talanta 51(2), 231.
/11/ AnderssonS,EkbergC,LiljenzinJO,2005. Uncertainty Analysis of Correlated Stability Constants, submitted to Radiochimica Acta.
/12/ AnderssonS,EkbergC,LiljenzinJ-O,NilssonM,SkarnemarkG,2004. Study of Nitrate Complex Formation with Pm, Eu, Am and Cm Using a Diluent Extraction Technique, Radiochimica Acta 92, 863.
/13/ LiljenzinJ-O,1971. Program for Multiple Regression Analysis, modified 1995-04-09.
/14/ AnderssonS,2005. Extraction Properties of some Nitrogen-Containing Extractants and Determination of Nitrate Complex Formation for Lanthanides and Selected Actinides Using Diluent Extraction, PhD Thesis, Chalmers University of Technology, Department of Chemical and Biological Engineering.

�6
/15/ PersonalcommunicationwithDrGMeinrath,2004. Advice on the BASIC programme to draw confidence ellipses from variance/covariance data.
/16/ DraperNR,SmithH,1998. Applied Regression Analysis, Third edition, John Wiley & Sons, Inc., New York.