Particle Distributions and Correlations in ATLAS · On behalf of the ATLAS Collaboration Particle...
27
Cristina Oropeza Barrera, University of Glasgow On behalf of the ATLAS Collaboration Particle Distributions and Correlations in ATLAS 1 DIS Conference - 13.April.2011
Transcript of Particle Distributions and Correlations in ATLAS · On behalf of the ATLAS Collaboration Particle...

Cristina Oropeza Barrera, University of GlasgowOn behalf of the ATLAS Collaboration
Particle Distributions and Correlations in ATLAS
1DIS Conference - 13.April.2011
Outline
2
• Motivation
• Data Samples and Event Selection
• Correlations in ATLAS:
• Δϕ Correlations https://atlas.web.cern.ch/Atlas/GROUPS/PHYSICS/CONFNOTES/ATLAS-CONF-2010-082/
• Inclusive Two-Particle Angular Correlations
• Summary
DIS Conference - 13.April.2011
Not discussed here

Motivation
3
• Models to describe dynamics of multi-particle production are incomplete: limited explanation of emission of soft radiation.
• Study of correlations between final state particles allows us to investigate the underlying mechanisms of particle production at LHC energies.
• Identify important dynamical information that can be incorporated in models to gain a better and more global picture (tuning).
final-state particles
incoming partons
?
DIS Conference - 13.April.2011

Data Samples and Event Selection
4
The data samples used in this analysis:
๏ ATLAS Inner Detector fully operational and solenoid at 2T,๏ triggered by a single-arm, level 1 Minimum Bias Trigger Scintillator,๏ at least one primary vertex,๏ if there is a second vertex it should not be associated to more than four tracks (to remove
events with more than one interaction per bunch crossing),๏ to contain at least two tracks in the phase-space:
๏ pT > 100 MeV ๏ |η| < 2.5
Event Requirements
Same as minimum bias analysis - H. Schulz talk
Energy Integrated Luminosity
900 GeV 7 μb-1
7 TeV 190 μb-1
Limited dataset, low luminosity, low pile-up
DIS Conference - 13.April.2011
Pixel Detector
SCT TRT
Inclusive Two-Particle Angular Correlations
5
ATLAS Note: “Measurement of Inclusive Two-Particle Angular Correlations in Proton-Proton Collisions at √s = 900 GeV and 7 TeV” https://atlas.web.cern.ch/Atlas/GROUPS/PHYSICS/CONFNOTES/ATLAS-CONF-2011-055/
DIS Conference - 13.April.2011

Analysis Overview
6
The inclusive two-particle angular correlation function is given by:
where〈...〉ch indicates an average over contributions from all particle multiplicities.
Correlations between emissions in a single event.Normalised by the total number of events.
Distribution of uncorrelated pairs. Particles pairs made from independent events. Normalised by its integral.
Nch is the average particle multiplicity.
DIS Conference - 13.April.2011

Correction Procedure
7
An event weight:To account for inefficiencies in the vertex and trigger selection, the foreground and multiplicity distributions were weighted event-by-event with:
The effect of tracking inefficiencies is corrected for using a data-driven method.
Find all good tracks
Calculate the observable:
R(Δη,Δϕ) or R(Δη) or R(Δϕ)
Determine the tracking efficiency E(pT,η) for each track.
Generate a random number r and compare it to E(pT,η).
If r > E(pT,η), remove the track.
DIS Conference - 13.April.2011

Correction Procedure
8
Each iteration corresponds to an additional application of the detector effect on the data.The -1 iteration corresponds to the observable when no detector effects are present.
DIS Conference - 13.April.2011
-5 -4 -3 -2 -1 0 1 2 3 4 5
)R
(
-2
-1.5
-1
-0.5
0
0.5
1
1.5
2
2.5all selected tracks
1st iteration
2nd iteration
3rd iteration4th iteration
5th iteration
6th iteration
ATLAS Preliminary900 GeV Data
-5 -4 -3 -2 -1 0 1 2 3 4 5
)R
(
-2
-1.5
-1
-0.5
0
0.5
1
1.5
2
2.5
all selected tracks1st iteration2nd iteration3rd iteration4th iteration5th iteration6th iteration
ATLAS Preliminary7 TeV Data

DIS Conference - 13.April.2011
Correction Procedure
9
The value of (each bin of) the observable is plotted as a function of the iteration number (0, 1, ..., N) and fitted using a third-degree polynomial. By extrapolating this fit to -1, an estimate of the true value can be made.
Testing method in Monte Carlo:
Number of Iterations-1 0 1 2 3 4 5 6
< 0
.2)
Valu
e of
bin
26
(0.0
<
0.5
1
1.5
2
2.5
3
ATLAS Preliminary
Iterations
Extrapolation
7 TeV Data
Number of Iterations-1 0 1 2 3 4 5 6
< 4
.8)
Valu
e of
bin
49
(4.6
<
-1.6
-1.4
-1.2
-1
-0.8
-0.6
-0.4
-0.2
0
ATLAS Preliminary
Iterations
Extrapolation
7 TeV Data
)R
(
-1.5
-1
-0.5
0
0.5
1
1.5
2
2.5
Truth MC
Corrected MC
ATLAS Preliminary7 TeV Monte Carlo (MC09)
-4 -2 0 2 4
corr
) -
R(
truth
)R
(
-0.2
-0.15
-0.1
-0.05
0
0.05
0.1
0.15
0.2
Truth MCCorrected MC

Statistical and Systematic Uncertainties
10
I. Extrapolation to N=-1The statistical error in the corrected value will be the result of propagating the statistical uncertainties in the parameters of the fit.
II. Uncertainties on the EfficienciesDetermined by varying the efficiencies up or down and propagating through the analysis.
III. Non-closure in Monte Carlo
MC studies on the absolute difference between truth and corrected MC as a function of Rcorr in different models.
An absolute uncertainty of 0.05 is assigned to all bins of R in data.
DIS Conference - 13.April.2011
corr)R(
-1.5 -1 -0.5 0 0.5 1 1.5 2 2.5
corr
) -
R(
truth
)R
(
-0.3
-0.2
-0.1
0
0.1
0.2
0.3
0.4
MC09 TuneDW TunePerugia0 TunePhojet TunePythia8 Tune
ATLAS Preliminary7 TeV Monte Carlo

Results
11
Corrected inclusive two-particle correlation functions in Δη and Δϕ. Same complex structure is seen in Monte Carlo, MC09 Tune, however the strength of the correlation seen in data is not reproduced.DIS Conference - 13.April.2011
R(Δη,Δϕ)
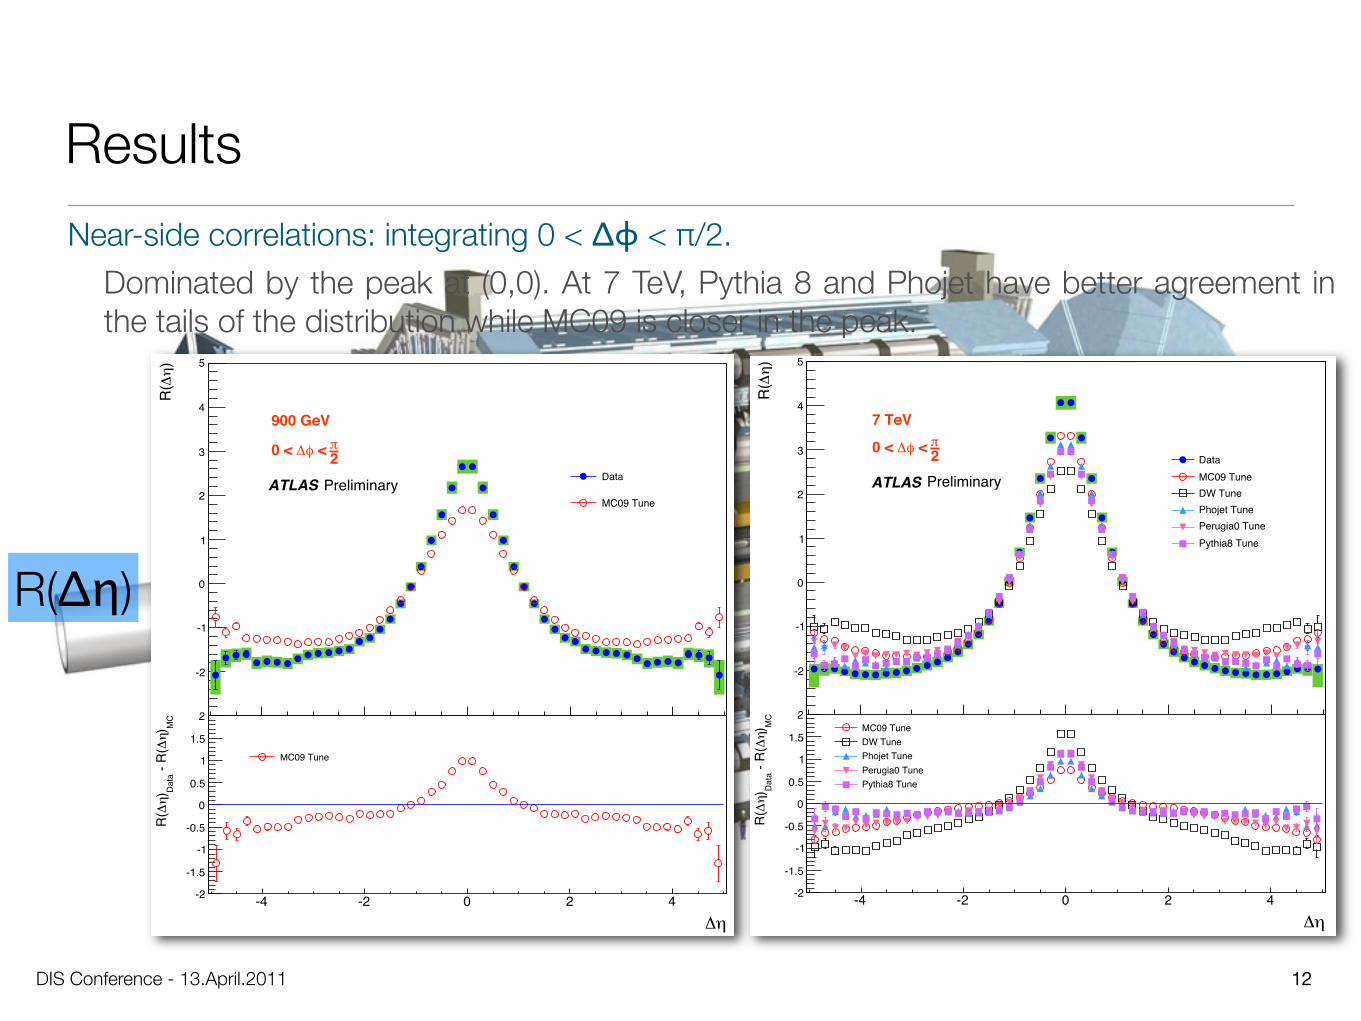
Results
12
Near-side correlations: integrating 0 < Δϕ < π/2.
DIS Conference - 13.April.2011
)R
(
3
-2
-1
0
1
2
3
4
5
Data
MC09 TuneATLAS Preliminary
900 GeV
2 < 0 <
-4 -2 0 2 4
MC
) -
R(
Dat
a)
R(
-2
-1.5
-1
-0.5
0
0.5
1
1.5
2
MC09 Tune)
R(
3
-2
-1
0
1
2
3
4
5
DataMC09 TuneDW TunePhojet TunePerugia0 TunePythia8 Tune
ATLAS Preliminary
7 TeV
2 < 0 <
-4 -2 0 2 4
MC
) -
R(
Dat
a)
R(
-2
-1.5
-1
-0.5
0
0.5
1
1.5
2MC09 TuneDW TunePhojet TunePerugia0 TunePythia8 Tune
R(Δη)
Dominated by the peak at (0,0). At 7 TeV, Pythia 8 and Phojet have better agreement in the tails of the distribution while MC09 is closer in the peak.

Results
13
Away-side correlations: integrating π/2 < Δϕ < π.
DIS Conference - 13.April.2011
R(Δη)
Dominated by the ridge structure around Δϕ=π. With the exception of DW, the tunes seem to perform better in these distributions.
)R
(
3
-2
-1
0
1
2
3
4
5
Data
MC09 TuneATLAS Preliminary
900 GeV
< < 2
-4 -2 0 2 4
MC
) -
R(
Dat
a)
R(
-2
-1.5
-1
-0.5
0
0.5
1
1.5
2
MC09 Tune)
R(
3
-2
-1
0
1
2
3
4
5
Data
MC09 Tune
DW TunePhojet Tune
Perugia0 Tune
Pythia8 Tune
ATLAS Preliminary
7 TeV
< < 2
-4 -2 0 2 4
MC
) -
R(
Dat
a)
R(
-2
-1.5
-1
-0.5
0
0.5
1
1.5
2MC09 TuneDW TunePhojet TunePerugia0 TunePythia8 Tune

Results
14
Short-range correlations: integrating 0 < Δη < 2.
DIS Conference - 13.April.2011
R(Δϕ)
Two-peak structure. Similar to underlying event distributions. Back-to-back recoil. Most of the tunes agree well with data in a small region around Δϕ=π.
)R
(
0 5
0
0.5
1
1.5
2
2.5
3
Data
MC09 TuneATLAS Preliminary
900 GeV
< 20 <
-1 0 1 2 3 4
MC
) -
R(
Dat
a)
R(
-2
-1.5
-1
-0.5
0
0.5
1
1.5
2
MC09 Tune
)R
(
0 5
0
0.5
1
1.5
2
2.5
3
DataMC09 TuneDW TunePerugia0 TunePhojet TunePythia8 Tune
ATLAS Preliminary
7 TeV
< 20 <
-1 0 1 2 3 4
MC
) -
R(
Dat
a)
R(
-2
-1.5
-1
-0.5
0
0.5
1
1.5
2
MC09 TuneDW TunePhojet TunePerugia0 TunePythia8 Tune

Results
15
Long-range correlations: integrating 2 < Δη < 5.
DIS Conference - 13.April.2011
R(Δϕ)
Underlying structure away from the peak at (0,0). The absolute difference between data and the different models is flat across Δϕ. Pythia 8 is closest and DW (old tune) is worst.
)R
(
2 5
-2
-1.5
-1
-0.5
0
0.5
1
Data
MC09 Tune
ATLAS Preliminary
900 GeV
< 52 <
-1 0 1 2 3 4
MC
) -
R(
Dat
a)
R(
-2
-1.5
-1
-0.5
0
0.5
1
1.5
2
MC09 Tune)
R(
2 5
-2
-1.5
-1
-0.5
0
0.5
1
DataMC09 TuneDW TunePerugia0 TunePhojet TunePythia8 Tune
ATLAS Preliminary
7 TeV
< 52 <
-1 0 1 2 3 4
MC
) -
R(
Dat
a)
R(
-2
-1.5
-1
-0.5
0
0.5
1
1.5
2MC09 TuneDW TunePhojet TunePerugia0 TunePythia8 Tune

Summary
16
Exciting times! Many more measurements to come!
DIS Conference - 13.April.2011
• The two-particle angular correlation function in Δη and Δϕ has been measured for pT inclusive minimum bias events in pp collisions at 900 GeV and 7 TeV.
• A complex structure was observed at both energies. It was explored in more detail by projecting the two-dimensional distribution into both Δη and Δϕ.
• The results have been compared to different Monte Carlo tunes: MC09, Phojet, DW, Perugia0 and Pythia 8 (further information on these tunes in Extra Slides).
• None of the models reproduce the strength of the correlations seen in data. The Pythia 8 tune at 7 TeV is the closest in all distributions.
Extra Slides
17DIS Conference - 13.April.2011

Monte Carlo Models - 2PC analysis
18NPPD Conference - 04.April.2011
• Pythia 6.4.21 tunes:
• MC09: produced by the ATLAS Collaboration to describe a range of minimum bias and underlying event data from the Tevatron; uses MRST LO* PDF.
• DW: older tune to CDF underlying event and Drell-Yan data; uses the older virtuality-ordered shower and non-interleaved MPI model.
• Perugia0: tuned to Tevatron; uses CTEQ 5L PDF and the new pT ordered shower and the MPI is interleaved with the initial state radiation.
• Phojet 1.12.1.35: separate hard and soft diffractive contributions; not yet tuned to recent experimental data.
• Pythia 8.130: adds to the MPI model of Pythia 6 by also interleaving the final state radiation; includes an updated model for diffraction that allows harder colour singlet exchange; uses CTEQ 5L PDF.

Total Uncertainties for 2D distributions - 2PC
19
900 GeV

Total Uncertainties for 2D distributions - 2PC
20
7 TeV

Δϕ Correlations
21
ATLAS Note: “Angular correlations between charged particles from proton-proton collisions at √s = 900 GeV and √s = 7 TeV measured with ATLAS detector” https://atlas.web.cern.ch/Atlas/GROUPS/PHYSICS/CONFNOTES/ATLAS-CONF-2010-082/
DIS Conference - 13.April.2011

Analysis Overview
22
Some definitions:leading particle - charged particle with highest transverse momentum (pT).Δϕ - azimuthal angle difference. Unsigned angle in the transverse plane (x-y) between the leading particle and any non-leading particle.
one of the other selected tracks
ΔΦ crest shape observable
Δϕ for all non-leading particles in an event.
The minimum of the distribution is extracted from a 2nd degree-polynomial fit.
Subtract the minimum from each bin and normalise to unit area.
0 0.5 1 1.5 2 2.5 3
/50)
/ (
T N
0200400600800
100012001400160018002000
310×
|<2.5>500 MeV, |T
p=7 TeVsData,
PreliminaryATLAS
uncorrected
0 0.5 1 1.5 2 2.5 3/5
0)) /
( m
in T
- N
T(N
)/ m
in T
-N T
(N0
0.01
0.02
0.03
0.04
0.05|<2.5>500 MeV, |
Tp
=7 TeVsData,
PreliminaryATLAS
uncorrected
DIS Conference - 13.April.2011

Analysis Overview
23
ΔΦ “same minus opposite” observable
- Divide each event into two η regions according to the η of the leading particle.- Plot Δϕ for particles with η of the same/opposite sign as the leading particle.- Subtract the “opposite region” from the “same region” and normalise.
Event-by-event, assign tracks to one of
location of leading track
0 0.5 1 1.5 2 2.5 3
/50)
/ (
T N
0
200
400
600
800
1000
1200
310×
Same region
Opposite region
|<2.5>500 MeV, |T
p=7 TeVsData,
PreliminaryATLAS
uncorrected
0 0.5 1 1.5 2 2.5 3
/50)
) / (
opp
T -
N s
ame
T(N
)/ o
pp T
- N
sam
e T
(N
0.01
0.02
0.03
0.04
0.05
0.06
0.07
0.08
|<2.5>500 MeV, |T
p=7 TeVsData, preliminaryATLAS
uncorrected
DIS Conference - 13.April.2011

Correction Procedure
24
Tracking Efficiency in pT and η
• Loss of non-leading tracks: corrected for using a weight per entry.
• Loss of leading tracks: bin-by-bin shape correction based on how the shape of the distribution changes when more leading tracks are removed.
0 0.5 1 1.5 2 2.5 3
/50)
/ (
T N
0
500
1000
1500
2000
2500
310×
Corrected others, corrected leadCorrected othersCorrected others, -20% lead tracksCorrected others, -40% lead tracksCorrected others, -60% lead tracksCorrected others, -80% lead tracksCorrected others, -100% lead tracks
PreliminaryATLAS
Percentage of true leading tracks0 20 40 60 80 100
Num
ber o
f tra
cks
in 7
th b
in
2000
2050
2100
2150
2200
2250
310×
PreliminaryATLAS
DIS Conference - 13.April.2011
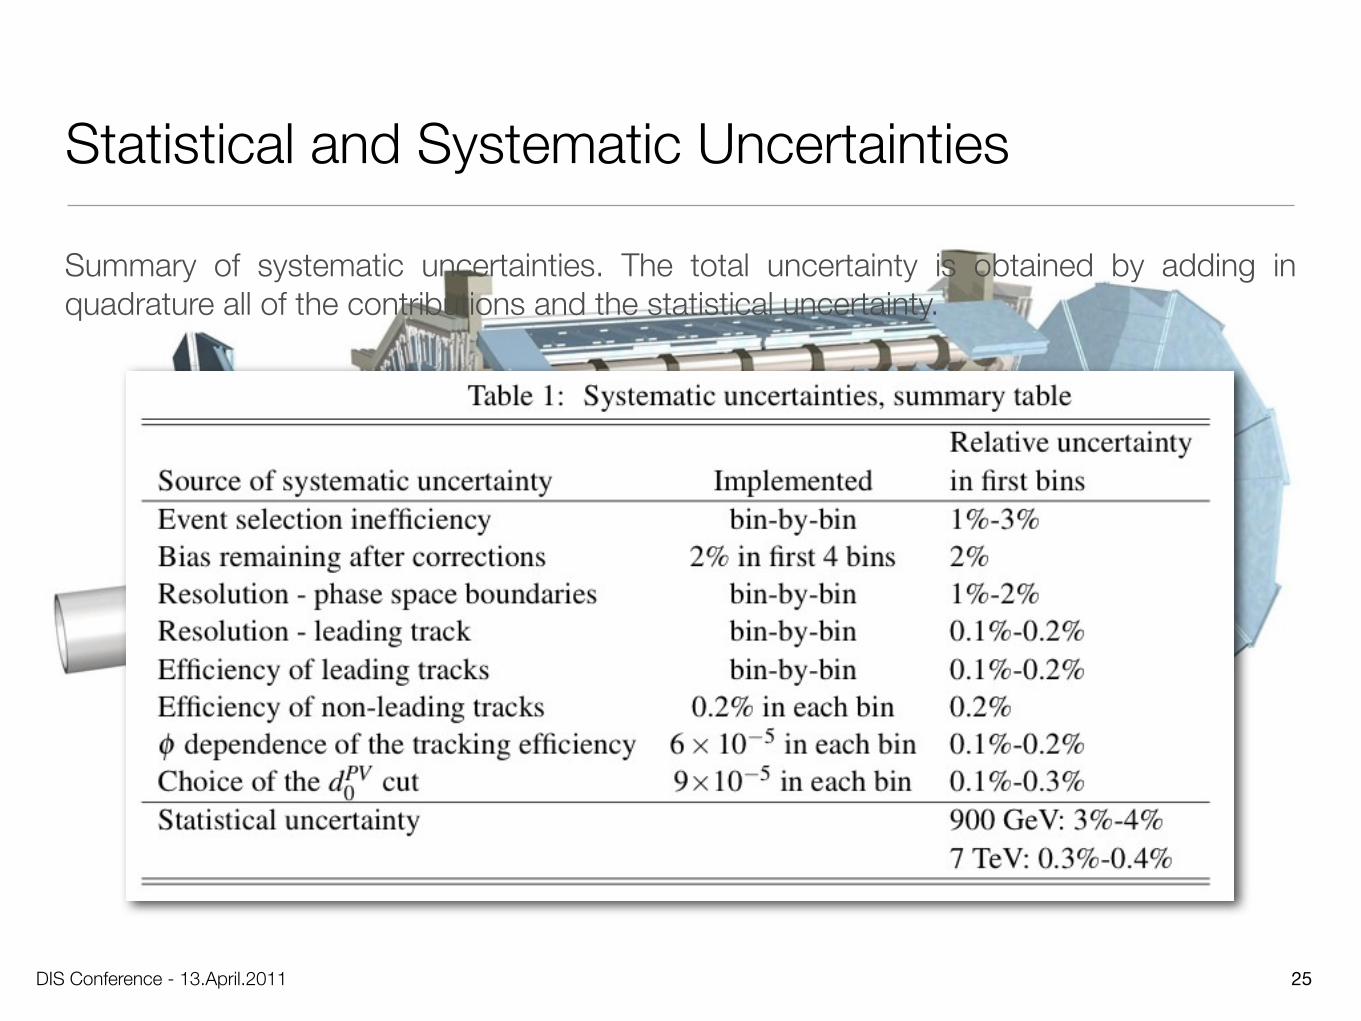
Statistical and Systematic Uncertainties
25
Summary of systematic uncertainties. The total uncertainty is obtained by adding in quadrature all of the contributions and the statistical uncertainty.
DIS Conference - 13.April.2011

DIS Conference - 13.April.2011
Results
26
0 0.5 1 1.5 2 2.5 3
/50)
) / (
min
T -
N T
(N)/
min
T -
N T
(N0
0.01
0.02
0.03
0.04
0.05
0.06|<2.5>500 MeV, |
Tp
=900 GeVsData,
Pythia Tune A
Pythia Tune P0
Pythia GAL
PreliminaryATLAS
0 0.5 1 1.5 2 2.5 3
/50)
) / (
opp
T -
N s
ame
T(N
)/ o
pp T
- N
sam
e T
(N -0.02
0
0.02
0.04
0.06
0.08
0.1
0.12
0.14
|<2.5>500 MeV, |T
p=900 GeVsData,
Pythia Tune A
Pythia Tune P0
Pythia GAL
PreliminaryATLAS
0 0.5 1 1.5 2 2.5 3
/50)
) / (
min
T -
N T
(N)/
min
T -
N T
(N
0
0.01
0.02
0.03
0.04
0.05
0.06|<2.5>500 MeV, |
Tp
=7 TeVsData,
Pythia Tune A
Pythia Tune P0
Pythia GAL
PreliminaryATLAS
0 0.5 1 1.5 2 2.5 3/5
0)) /
( o
pp T
- N
sam
e T
(N)/
opp
T -
N s
ame
T(N -0.02
0
0.02
0.04
0.06
0.08
0.1
0.12
0.14
|<2.5>500 MeV, |T
p=7 TeVsData,
Pythia Tune A
Pythia Tune P0
Pythia GAL
PreliminaryATLAS
pT > 500 MeV |η| < 2.5
Even though the MC models used in this comparison cover a large range of possible behaviours, none of them match the data well.

Results
27
pT > 500 MeV|η| < 1.0
Better agreement in the region |η| < 1.0. Not surprising as most of the tunes use CDF data as input.
0 0.5 1 1.5 2 2.5 3
/50)
) / (
min
T -
N T
(N)/
min
T -
N T
(N0
0.01
0.02
0.03
0.04
0.05
0.06
0.07|<1>500 MeV, |
Tp
=900 GeVsData,
Pythia Tune A
Pythia Tune P0
Pythia GAL PreliminaryATLAS
0 0.5 1 1.5 2 2.5 3
/50)
) / (
opp
T -
N s
ame
T(N
)/ o
pp T
- N
sam
e T
(N -0.02
0
0.02
0.04
0.06
0.08
0.1
0.12
0.14
|<1>500 MeV, |T
p=900 GeVsData,
Pythia Tune A
Pythia Tune P0
Pythia GAL
PreliminaryATLAS
0 0.5 1 1.5 2 2.5 3
/50)
) / (
min
T -
N T
(N)/
min
T -
N T
(N
0
0.02
0.04
0.06
0.08
0.1
|<1>500 MeV, |T
p=7 TeVsData,
Pythia Tune A
Pythia Tune P0
Pythia GAL
PreliminaryATLAS
0 0.5 1 1.5 2 2.5 3/5
0)) /
( o
pp T
- N
sam
e T
(N)/
opp
T -
N s
ame
T(N
-0.02
0
0.02
0.04
0.06
0.08
0.1
0.12
0.14
|<1>500 MeV, |T
p=7 TeVsData,
Pythia Tune A
Pythia Tune P0
Pythia GAL
PreliminaryATLAS
DIS Conference - 13.April.2011