Particle Agglomeration Mechanisms in CMP Slurries Particle Agglomeration Mechanisms in CMP Slurries...
35
CMP Users Conference 2006 CMPUC 2006.ppt Slide 1 Particle Agglomeration Mechanisms in CMP Slurries Mark Litchy and Don Grant CT Associates, Inc. CMP Users Conference 2006 February 16, 2006
Transcript of Particle Agglomeration Mechanisms in CMP Slurries Particle Agglomeration Mechanisms in CMP Slurries...

CMP Users Conference 2006CMPUC 2006.ppt
Slide 1
Particle Agglomeration Mechanisms in CMP Slurries
Mark Litchy and Don GrantCT Associates, Inc.
CMP Users Conference 2006February 16, 2006

CMP Users Conference 2006CMPUC 2006.ppt
Slide 2
Introduction• Some CMP slurries are said to be “shear-sensitive”, implying that if
the slurries are exposed to excessive shear stresses, the particles in the slurries will agglomerate and the slurry will be “damaged.”
• Traditionally, bellows and diaphragm positive displacement pumpsand vacuum-pressure systems have been widely accepted means of bulk slurry delivery. Positive displacement pumps are generallyaccepted as low shear devices due to their relatively low speeds of operation, while centrifugal pumps, which typically operate at higher speeds, are usually perceived as high shear devices.
• Centrifugal pumps have been thought to impart high shear on the slurry causing it to form gels.
• However, the fluid dynamic conditions that lead to high shear stresses often also increase the probability of fluid cavitation. This test work was performed to try to separate the effects of shear and cavitation by holding shear stresses nearly constant while changing the probability of cavitation. The results suggest that cavitation may play a more significant role in agglomeration of slurry particles than shear.

CMP Users Conference 2006CMPUC 2006.ppt
Slide 3
Shear?• High velocity gradients may enable agglomeration by imparting
enough energy to overcome the particle repulsive forces thereby enabling particle collisions.
• However, shear forces from too high a velocity gradient can break up loosely bonded agglomerates.
• Many industrial processes use shear to break up agglomerates.– The velocity differential results in shear stresses being imposed on an
agglomerate, causing it to break apart.• Thus, there may exist a shear threshold beyond which some
agglomerates are broken up.• Competition between coagulation and fragmentation during shear may
result in a self-preserving size distribution as has been observed during shear-induced flocculation of PSL particles. (Spicer et al., Wat. Res. 30(5) 1996)

CMP Users Conference 2006CMPUC 2006.ppt
Slide 4
Cavitation?• The fluid dynamic conditions that lead to high shear stresses also
increase the probability of cavitation. • The forces in collapsing bubbles formed by cavitation are much larger
and may be more likely to cause agglomeration.• High fluid velocities over surfaces result in reduced pressures in the
liquid. – If the pressure in the liquid is reduced below that of the liquid vapor
pressure, vaporous cavitation can occur in which bubbles of the liquid are formed.
– If the pressure is reduced below the equilibrium vapor pressure of dissolved gases in the liquid, gaseous cavitation can occur in which bubbles of the dissolved gas are formed.
• If the pressure in the liquid is subsequently increased, the bubbles will collapse violently.

CMP Users Conference 2006CMPUC 2006.ppt
Slide 5
Effect of charge• The chemical composition of CMP slurries is such that the
particles in the slurries carry a high surface charge in order to minimize agglomeration.
• Substantial forces are required to “push” particles in the slurries close enough together to overcome repulsive electrostatic forces and cause the particles to agglomerate.

CMP Users Conference 2006CMPUC 2006.ppt
Slide 6
Nernst Potential
Zeta Potential
Stern Layer
Diffuse Layer
Electronegative Particle
Electric PotentialSurroundingthe Particle
Ion ConcentrationProfile
Double LayerSchematic

CMP Users Conference 2006CMPUC 2006.ppt
Slide 7
DVLO Theory
Relative separation distance
0 1 2 3 4 5
Rel
ativ
e in
tera
ctio
n en
ergy
-3
-2
-1
0
1
2
3
Electrostatic repulsive forces
Combined forces
Vander Waals forces
Primary minimum

CMP Users Conference 2006CMPUC 2006.ppt
Slide 8
DVLO Theory
Relative separation distance
0 1 2 3 4 5
Rel
ativ
e in
tera
ctio
n en
ergy
-3
-2
-1
0
1
2
3
Electrostatic repulsive forces
Combined forces
Vander Waals forces
Primary minimum
Relative separation distance
0 5 10 15 20
Rel
ativ
e in
tera
ctio
n en
ergy
-0.010
-0.005
0.000
0.005
0.010
Electrostatic repulsive forces
Combined forces
Vander Waals forces
Secondary minimum

CMP Users Conference 2006CMPUC 2006.ppt
Slide 9
Hamaker constant 10-13 ergs, surface charge 50 mv, 50 nm particles
Distance from surface (µm)0.00 0.01 0.02 0.03 0.04 0.05 0.06 0.07 0.08 0.09 0.10
Inte
ract
ion
ener
gy (e
rgs)
Attra
ctio
n
R
epul
sion
-1.5e-14
-1.0e-14
-5.0e-15
0.0
5.0e-15
1.0e-14
1.5e-14
10-7 molar
10-6 molar10-5 molar
10-4 molar
10-3 molar
Effect of ionic strength on interaction energy
CMP Users Conference 2006CMPUC 2006.ppt
Slide 10
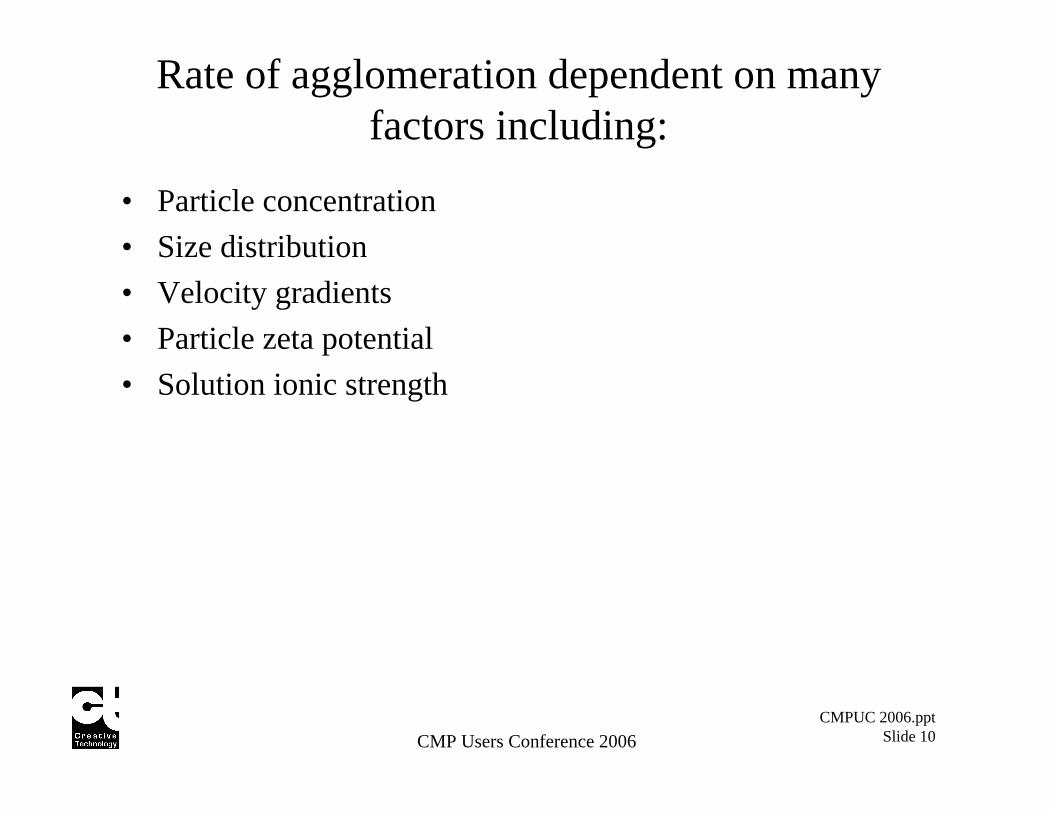
Rate of agglomeration dependent on many factors including:
• Particle concentration• Size distribution• Velocity gradients• Particle zeta potential• Solution ionic strength

CMP Users Conference 2006CMPUC 2006.ppt
Slide 11
Other factors affecting particle agglomeration in slurries
• Lack of humidification• Absorption of CO2
• pH shock due to improper dilution• Entrainment of air during mixing

CMP Users Conference 2006CMPUC 2006.ppt
Slide 12
Particle agglomeration caused by bellows and diaphragm pumps
Particle Diameter (µm)
1 10
Cum
ulat
ive
Con
cent
ratio
n (#
/mL)
102
103
104
105
106
107
108
0 turnovers30 turnovers101 turnovers314 turnovers574 turnovers1105 turnovers
Bellows pump Diaphragm pump
Particle Diameter (µm)
1 10
Cum
ulat
ive
Con
cent
ratio
n (#
/mL)
102
103
104
105
106
107
108
0 turnovers26 turnovers86 turnovers260 turnovers512 turnovers823 turnovers
Litchy MR and Schoeb R. Semiconductor International, 27(12) 2004.

CMP Users Conference 2006CMPUC 2006.ppt
Slide 13
No agglomeration observed with BPS-3 pump
Particle Diameter (µm)
1 10
Cum
ulat
ive
Con
cent
ratio
n (#
/mL)
102
103
104
105
106
107
108
0 turnovers30 turnovers96 turnovers316 turnovers757 turnovers1218 turnovers
Centrifugal pumpLitchy MR and Schoeb R. Semiconductor International, 27(12) 2004.

CMP Users Conference 2006CMPUC 2006.ppt
Slide 14
Comparison of particle agglomeration from the pumps
Turnovers
1 10 100 1000 10000
Rat
io o
f Mea
sure
d Pa
rticl
e C
once
ntra
tion
to
Initi
al P
artic
le C
once
ntra
tion
0.1
1.0
10.0
100.0
Bellows pumpDiaphragm pumpLevitronix pump
As-received slurry plotted at 1.1 turnovers
> 0.56 µm

CMP Users Conference 2006CMPUC 2006.ppt
Slide 15
Centrifugal pumps used as artificial blood pumps
• Shear-optimized centrifugal pumps were found to cause significantly less hemolysis (destruction of blood-cells) than peristaltic pumps.
• Blood damage caused by shear forces, is remarkably low as long as the shear level stays below a threshold of approximately 400 Pa. If this threshold is exceeded, the hemolysis rate increases abruptly.
• In a shear-optimized centrifugal blood pump the shear level always stays below this hemolysis threshold. In a peristaltic pump however, the blood in the occlusion area is exposed to forces which massively exceed the critical level and rupture the blood cells.
Paul et al., Artificial Organs 27(6) June 2003.

CMP Users Conference 2006CMPUC 2006.ppt
Slide 16
• The same problem occurs in the valves of diaphragm and bellows pumps. Most of the fluid, which is pumped by traditional CMP “dispense engines”, is exposed to very low shear-force levels.
• However, a very small fluid portion, which is trapped in the valves during closure, sees tremendously high pressures of up to 106 Pa.
• In addition, the operation of check valves within the pumps are also areas where cavitation may occur.
• In a centrifugal pump, the whole fluid volume is exposed to moderate shear levels of 102-103 Pa generated by the rotating pump vanes.

CMP Users Conference 2006CMPUC 2006.ppt
Slide 17
Cavitation• Cavitation is the process of bubble formation resulting
from a reduction in pressure on a liquid.• Vapor cavities form when the ambient pressure at a point
in a liquid falls below the liquid’s vapor pressure.• The vapor cavities collapse when they reach regions of
high pressure. The shock waves that are created when the cavities collapse causing damage to components near the collapse.
• Cavitation can be identified by following characteristics:– Noise– Vibration– Loss in performance– Material failure

CMP Users Conference 2006CMPUC 2006.ppt
Slide 18
Bernoulli’s Equation
• Where: – P = pressure– ρ = density– u = velocity– g = gravitational acceleration– h = height
• Assumptions:– Steady, inviscid, incompressible flow along a streamline
constant2222
121
212
11 =++=++ ghρuPghρuP ρρ

CMP Users Conference 2006CMPUC 2006.ppt
Slide 19
D1 < D0
u1 > u0
P1 < P0
Young FR (1999). “Hydrodynamic Cavitation,” in Cavitation, Imperial College Press, pp 187-317.
CMP Users Conference 2006CMPUC 2006.ppt
Slide 20
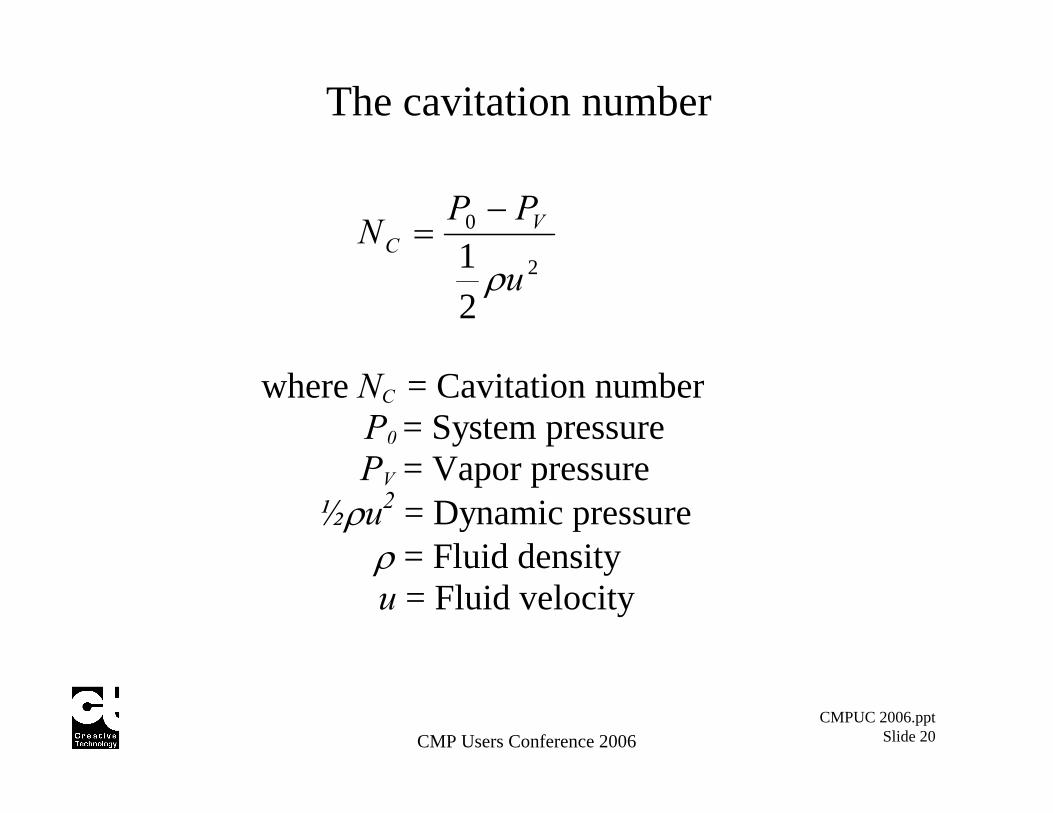
The cavitation number
2
0
21 u
PPN V
C
ρ
−=
where NC = Cavitation number P0 = System pressure PV = Vapor pressure ½ρu2 = Dynamic pressure ρ = Fluid density u = Fluid velocity
CMP Users Conference 2006CMPUC 2006.ppt
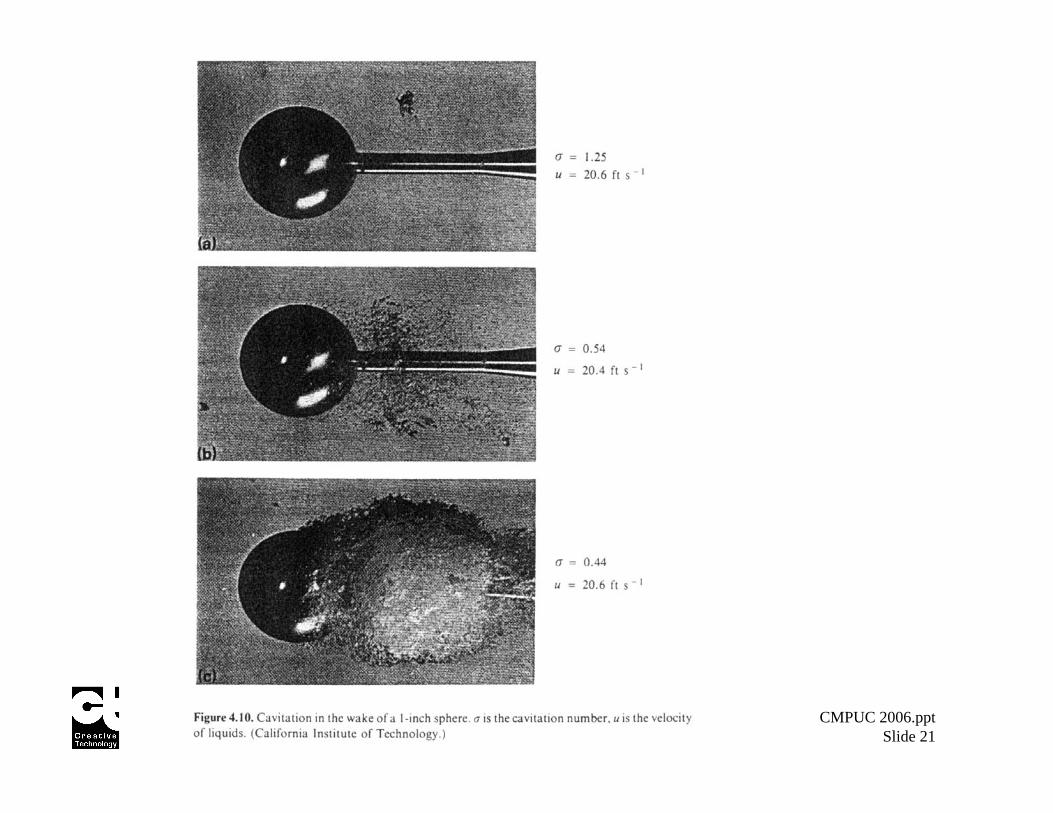
Slide 21

CMP Users Conference 2006CMPUC 2006.ppt
Slide 22

CMP Users Conference 2006CMPUC 2006.ppt
Slide 23
Places where cavitation can occur• Pumps• Venturies• Flow around fixed objects• Orifices• Valves• Pipe bends

CMP Users Conference 2006CMPUC 2006.ppt
Slide 24
Cavitation in valves
Young FR (1999). “Hydrodynamic Cavitation,” in Cavitation, Imperial College Press, pp 187-317.

CMP Users Conference 2006CMPUC 2006.ppt
Slide 25
Experimental
• Objective: Vary probability of cavitation while maintaining a constant shear stress
• Method: The BPS-3 inlet pressure was varied while maintaining a constant pump speed. This allowed the probability of cavitation on the pump inlet to be varied while having a minimal effect on shear stress.
• This was accomplished by changing the length and diameter of the tubing between the feed tank and the pump.

CMP Users Conference 2006CMPUC 2006.ppt
Slide 26
Test conditions investigated• The following parameters were varied in water to define
the range of operating conditions to be investigated in slurry.– Pump speed (3000-8000 rpm)– Restrictor between feed tank and pump: length (1.5 inches to 15
feet) and diameter (3/8” to ¾”) of tubing
• The BPS-3 was operated briefly at each combination of above parameters to characterize their effect on:– Pump inlet pressure– Pump outlet pressure – Flow rate– Cavitation

CMP Users Conference 2006CMPUC 2006.ppt
Slide 27
System schematic
P
HumidifiedNitrogen
Chiller
Flowmeter
SampleValve
RestrictorSlurryTank
P

CMP Users Conference 2006CMPUC 2006.ppt
Slide 28
Operating Conditions• Two extreme conditions are presented:
1. Low probability of cavitation: • No restrictor on inlet of pump, inlet pressure slightly positive (0-1 psig)
2. High probability of cavitation: • 15 foot length of ½” tubing used as restrictor on inlet of pump (-24 in Hg or –
12 psig)• Slurry used: Cabot SS-12
– Slurry from the same drum was used in each test.• Levitronix BPS-3 pump was operated at 7000 rpm. • Flow rate varied from 15 to 20 lpm over this range of conditions.• The restriction on the pump outlet was such that the pump discharge
pressure was 15 psig with no restriction on pump inlet. • The slurry particle size distribution (PSD) was monitored over time for
each inlet pressure tested. Samples were analyzed for mean particle size using a PSS NiComp ZLS380 and for large particle concentrations (> 0.56 µm) using a PSS AccuSizer 780.
• Each test was continued until the slurry had passed through the pump about 6,000 times.

CMP Users Conference 2006CMPUC 2006.ppt
Slide 29
PSDs: Low probability of cavitation
Test conditions:Pump inlet pressure: 0 in HgPump outlet pressure: 27 psigPump speed: 7000 rpmFlow rate: 20 lpm
Particle Diameter (µm)
1 10
Nor
mal
ized
Cum
ulat
ive
Con
cent
ratio
n
1032721052861580226038107000
Turnovers

CMP Users Conference 2006CMPUC 2006.ppt
Slide 30
PSDs: High probability of cavitation
Test conditions:Pump inlet pressure: -24 in HgPump outlet pressure: 15 psigPump speed: 7000 rpmFlow rate: 15 lpm
Particle Diameter (µm)
1 10
Nor
mal
ized
Cum
ulat
ive
Con
cent
ratio
n
103010636013901930300062309275
Turnovers

CMP Users Conference 2006CMPUC 2006.ppt
Slide 31
Change in concentration with time: Low probability of cavitation
Test conditions:Pump inlet pressure: 0 in HgPump outlet pressure: 27 psigPump speed: 7000 rpmFlow rate: 20 lpm
Turnovers
100 101 102 103 104 105
Nor
mal
ized
Cum
ulat
ive
Con
cent
ratio
n
> 0.56 um> 0.70 um> 1.0 um> 2.0 um> 5.0 um

CMP Users Conference 2006CMPUC 2006.ppt
Slide 32
Change in concentration with time:High probability of cavitation
Test conditions:Pump inlet pressure: -24 in HgPump outlet pressure: 15 psigPump speed: 7000 rpmFlow rate: 15 lpm
Turnovers
100 101 102 103 104 105
Nor
mal
ized
Cum
ulat
ive
Con
cent
ratio
n
> 0.56 um> 0.70 um> 1.0 um> 2.0 um> 5.0 um

CMP Users Conference 2006CMPUC 2006.ppt
Slide 33
Low probability of cavitation repeatability
Particle Diameter (µm)
1 10
Nor
mal
ized
Cum
ulat
ive
Con
cent
ratio
n
Test 3: InitialTest 3: FinalTest 5: InitialTest 5: Final
Test conditions:Pump inlet pressure: 0 in HgPump outlet pressure: 27 psigPump speed: 7000 rpmFlow rate: 20 lpm

CMP Users Conference 2006CMPUC 2006.ppt
Slide 34
High probability of cavitation repeatability
Particle Diameter (µm)
1 10
Nor
mal
ized
Cum
ulat
ive
Con
cent
ratio
n
Test 1: InitialTest 1: FinalTest 4: InitialTest 4: FinalTest 6: InitialTest 6: Final
Test conditions:Pump inlet pressure: -24 in HgPump outlet pressure: 15 psigPump speed: 7000 rpmFlow rate: 15 lpm

CMP Users Conference 2006CMPUC 2006.ppt
Slide 35
Summary• Minimal increases in the large particle tail were observed
during 2 tests conducted at higher inlet pressure (low probability of cavitation).
• Significant increases (factor of 5-10x) in the large particle tail were observed for supermicron size particles at a very low pump inlet pressure (high probability of cavitation).
• No significant difference was observed in the working PSD during tests performed at low and high probability of cavitation.
• These results suggest that cavitation may play a more significant role in agglomeration of slurry particles than shear.