Participatory research to support sustainable land ...
37
Participatory research to support sustainable land management on the Mahafaly Plateau in south-western Madagascar Characteristics of rural markets in the Mahafaly Plateau region Analysis of market monitoring data from 2013 and 2014
Transcript of Participatory research to support sustainable land ...
Participatory research to support sustainable land management on the Mahafaly Plateau in south-western Madagascar
Characteristics of rural marketsin the Mahafaly Plateau regionAnalysis of market monitoringdata from 2013 and 2014

This report was compiled by Regina Neudert, David Bautze and Leopold Andrianjohary, Work
package Socio-economics, Brandenburg Technical University Cottbus.
Correspondence address: [email protected]
BTU Cottbus, December 2015
1
Content
List of tables ........................................................................................................................................ 2
List of figures ....................................................................................................................................... 2
Electronic appendix ............................................................................................................................. 2
Introduction ................................................................................................................................. 3
Methods ...................................................................................................................................... 3
Results ......................................................................................................................................... 5
Market network analysis ..................................................................................................................... 5
Crops .................................................................................................................................................... 6
Availability ....................................................................................................................................... 6
Price seasonality ............................................................................................................................ 11
Price differences between markets ............................................................................................... 12
Price shocks ................................................................................................................................... 18
Appraisal of results for 2013 by market monitors ........................................................................ 18
Livestock products ............................................................................................................................. 18
Availability ..................................................................................................................................... 18
Price according to age class ........................................................................................................... 22
Price seasonality ............................................................................................................................ 23
Price differences between the markets ........................................................................................ 24
Appraisal of results of 2013 by market monitors .......................................................................... 25
Prices for milk and meat ................................................................................................................ 25
Alimentary plants .............................................................................................................................. 27
Availability ..................................................................................................................................... 27
Price seasonality ............................................................................................................................ 29
Price differences between markets ............................................................................................... 29
Discussion .................................................................................................................................. 29
Methods ............................................................................................................................................ 29
Crops .................................................................................................................................................. 30
Livestock products ............................................................................................................................. 30
Alimentary plants .............................................................................................................................. 31
Determinants of availability and prices ............................................................................................. 32
Findings in a nutshell .................................................................................................................. 32

2
List of tables Table 1 Harvesting and lean seasons for different crops (calendar weeks) ............................................ 4
Table 2 Availability and prices for agricultural crops on the different markets in 2014 based on
moving 4-weekly means .......................................................................................................................... 7
Table 3 Seasonal price differences for agricultural crops in harvest and lean seasons in 2013 [in
MGA/standard unit] .............................................................................................................................. 12
Table 4 Seasonal price differences for agricultural crops in harvest and lean seasons in 2014 [in
MGA/standard unit] .............................................................................................................................. 13
Table 5 Availability and prices for agricultural crops based on weekly data in 2013 and 2014 ........... 14
Table 6 Availability of goats and sheep categories separated by gender ............................................. 20
Table 7 Availability of zebu categories in 2014 separated by gender ................................................... 21
Table 8 Availability and prices for milk and meat on the monitored markets in 2014 ......................... 26
Table 9 Availability and prices of alimentary plants on the monitored markets .................................. 27
List of figures Figure 1 Network of markets in the Mahafaly region ............................................................................. 6
Figure 2 Seasonal price development for 1 kp of lojy beans ................................................................ 11
Figure 3 Annual mean prices for male sheep in 2014 according to age categories (youngest age
categories at the right side)................................................................................................................... 22
Figure 4 Annual mean prices for female sheep in 2014 according to age categories (youngest age
categories at the right side)................................................................................................................... 23
Figure 5 Seasonal price development for female sheep (Vibine) in 2014 ............................................ 24
Figure 6 Seasonal price development for female zebu (Tamana) in 2014 ............................................ 24
Electronic appendix The electronic appendix to this report contains three Microsoft Excel files with the following content:
Summary statistics: tables depicting statistics on raw data and four-week averages for all
crops, livestock products and alimentary plants surveyed as well as supplementary tables on
unit conversions for crops and livestock category definitions
Crop diagrams: diagrams of seasonal price fluctuations for all crops surveyed
Livestock diagrams: diagrams of seasonal price fluctuations as well as diagrams with prices
according to age class for all livestock types surveyed

3
Introduction For villagers on the Mahafaly Plateau local markets are the most important channels for marketing
their agricultural products and purchasing goods for consumption. Thus, a market analysis provides
information on the constraints and opportunities faced by the rural households.
We monitored market prices for crops, alimentary plants and fruits as well as livestock products on
five markets in the Mahafaly Plateau region over a period of 2 years (2013 & 2014) in at least 2-
weekly intervals. We analyse the data to answer the following questions:
1. Which livestock, crop and alimentary plants products are available on the markets?
2. Which factors influence the availability and prices of these products on the different
markets?
Among the factors influencing product availability and prices, we pay particular attention to
seasonality, differences between markets and price shocks. Verification interviews with the market
monitors or other key persons helped us to validate results on causes of price developments on a
qualitative basis. This is the second report showing results from the monitoring in 2013 and 2014
(see report Characteristics of rural markets in the Mahafaly Plateau region - Analysis of market
monitoring data from 2013). The monitoring continued in 2015 and 2016 with the same
methodology.
Methods We monitored prices from mid-January 2013 to mid-January 2015 on five markets in the Mahafaly
Plateau region. The five markets were identified as central for different regions for the northern
transect of the SuLaMa study area through a network analysis of Village Baseline Survey data. The
network analysis was carried out with information on markets visited by people from different
villages and using the software Ucinet. We selected in the littoral region the neighbouring markets of
Efoetse and Marofijery, and on the plateau the markets of Andremba and Itomboina. In 2014 the
market in Marofijery was replaced by the neighbouring market in Ankilibory, since the market in
Marofijery was partly given up. In addition to those markets of local importance, we selected
Ambatry as one market of regional importance since people from the littoral, the plateau as well as
from Masiaboay and Beantake mentioned to visit this place.
The currency of all recordings is Madagascar Ariary (MGA; 1 € = 3,250 MGA: 4th September 2014, 1 €
= 3,564 MGA: 17th July 2015, www.oanda.com). For each market place, we engaged a local inhabitant
of the village as a market monitor, who received the local half day salary for assistance for each
monitored data set (3,000-4,000 MGA). He visited the market days at least in intervals of 2 weeks (in
many cases even in weekly intervals) and recorded prices of available products. We predefined a list
of products, but the market monitor could add other crops, livestock categories or local fruits if they
occurred on the market. In order to keep the disturbance on the market and transaction costs for the
monitors low, he recorded always the first price given by the seller of the product. There might be
deviations from the actual selling price since bargaining is possible on the market. The market
monitors usually started recording prices around 8.00am to 8.30am. At this time, the market for
crops and other products is fully opened, while transactions especially on the livestock market may
take place earlier (as early as 4.00am).

4
The monitored data was checked from the market monitors’ notebooks at monthly intervals and
then entered into excel files. The full data set was organized in weekly intervals. For each product, a
standard unit was defined and conversions of sold units were carried out based on weighings of local
crops. For some products, e.g. melons and pumpkins, a price range was recorded by the monitor due
to the different sizes of pieces. Here, we worked with the mean price calculated from the price
range. In order to carry out comparative analyses of prices, we calculated the mean price in moving 4
weeks intervals for the whole time period.
We recorded market data for 27 different crops grown in the Mahafaly Plateau region. The range of
crops comprises manioc (dried and fresh), sweet potatoes, maize, tomatoes, as well as different
kinds of beans, bulb vegetables, melons, and pumpkins. We used standard statistical methods in R to
test for differences between markets and seasons in the crop data. Differences were tested using
Kruskal-Wallis test and a post-hoc Dunnett´s multiple comparison test since for the majority of
analysed data the homogeneity of variances required for the standard ANOVA was not given
according to the Levene test of variances. For testing differences between seasons in crop price data,
we defined the harvest season and the lean season according to the cropping calendar (Agriculture
fact sheet from WP 2) for the study region. Table 1 depicts the harvest and lean seasons for the
different crops. The lean season takes place at the end and the beginning of the monitored years.
Thus, we used four different datasets with an equal number of weeks, one representing the lean
season 2012/2013, two for 2013/2014 and one for the lean season 2014/2015. As many crops were
traded only seasonally, a meaningful statistical analysis was only possible for the most frequently
occurring crops.
Table 1 Harvesting and lean seasons for different crops (calendar weeks)
2013/2014 2014/2015
Crop Lean
season 1
Harvest
season
Lean
season 2
Lean
season 1
Harvest
season
Lean
season 2
Maize 3-9 12-20 49-3 2 - 8 12 - 20 48 - 2
Manioc 3-9 27-35 49-3 2 - 8 27 - 35 48 - 2
Lojy and
other
3-9 14-22 49-3 2 - 8 14 - 22 48 - 2
We recorded price information for livestock and livestock products for zebu, sheep and goats on five
markets in the Mahafaly Plateau region. Among the recorded items are milk and meat, as well as live
animals in 72 categories for zebu and 44 categories for sheep and goats respectively. The categories
of live animals are based on age and body condition, and for females also on reproductive
performance. For adult sheep and goats, animals are classified according mainly to their life age (2 to
8 years), while younger animals are classified finer in age categories of 6 months or less. The same
applies to bulls and castrated zebu as well as charrette zebu (konda). Older zebu females are
classified according to the number of their parturitions. Please see the electronic appendix for the
detailed classification.
During the data analysis for 2013, the market monitors were asked to give feedback to the diagrams
showing the crop and livestock data they recorded. Questions were posed on phenomena visible in
the diagrams (e.g. periods of especially high prices, comparisons between different market places).

5
This exercise allowed us to cross-check findings from the data with personal experiences of the
monitors, and we collected information on possible sources of price differences and fluctuations. The
information from these exercises is reported in separate sections in the results. Most respondents
understood the logic of the diagrams and were able to make comparisons between seasonal prices
and different markets. Most of them also understood the market logic, i.e. the influence of number
of sellers (supply) and number of buyers (demand) on prices.
Results
Market network analysis The result of the network analysis of data on visited markets from the Village Baseline Survey (figure
1) clearly distinguishes markets according to the village of origin of their visitors and the relative
importance of the market. Without any information on the geographic location of villages, the
network reproduced more or less a regional map, indicating the littoral region as distinct from the
plateau region with the most important regional centres to the right side of the network, i.e. eastern
side of the Mahafaly Plateau region.
In the littoral region, the network depicts four markets (Efoetse, Marofijery, Ankilibory, and
Beheloke) of similar importance, while Ankilimivony is mentioned less often. In the Plateau region,
Itomboina is the most important market, which is visited by inhabitants from nearly all villages
nearby as well as from some littoral villages and villages from Beantake and Masiaboay. Surprisingly,
the market in Beroy is visited by inhabitants from littoral and plateau villages equally. In Beantake
and Masiaboay communes, the most important markets are Masiaboay centre, Ampasindava and
Beahitse. However, as the markets of Betioky and Ambatry with larger importance are situated
nearby, inhabitants from the single villages visit these markets as well.
Based on this information and needs of the project, we chose to monitor the markets of Efoetse and
Marofijery in the littoral region, Itomboina and Andremba in the plateau region, as well as Ambatry
as a market with greater centrality and regional importance. Although the network does not depict
trade relations (i.e. transport and resale of goods and services), we can assume that traders travel
between the littoral region and Itomboina, between Itomboina and Andremba, as well as between
the regional centers Betioky/Ambatry and Itomboina.

6
Figure 1 Network of markets in the Mahafaly region
Note: Villages are shown in red, markets in blue, the size of the square indicates the relative importance of the market (i.e.
relative number of records from villages)
Crops We recorded market data for 19 different crops grown in the Mahafaly Plateau region. The range of
crops comprises manioc (dried and fresh), sweet potatoes, maize, tomatoes, as well as different
kinds of beans, melons, and pumpkins.
Availability
Most observations for crops in the moving 4 week intervals were made for maize, rice, Lojy beans
(cowpea) and peanuts (without shell) which occurred on average in 80 to 100 % of all intervals and
markets (table 2). Dried manioc occurred less on the markets in Efoetse, Itomboina and
Marofijery/Ankilibory (60 – 72 %) in 2014 compared to the year 2013. Antsamby beans (mungbeans),
garlic and onions were also common on the markets. Other products, e.g. pumpkins and melons,
were only seasonally or occasionally available. The availability was lowest for the grains sorghum and
millet, but in 2014 they seem to be present more often compared to 2013. Furthermore, sweet
potatoes were with an overall presence of 46 % nearly equally common in both observation years.
Markets also differ in the availability of crops. The widest and most constant range of products is
offered in Ambatry followed by Efoetse and Marofijery/Ankilibory. Some products were present only
in one market (see Voatavo (pumpkin), Akondro (banana) or fresh Kapiky (peanut).

7
Table 2 Availability and prices for agricultural crops on the different markets in 2013 and 2014 based on moving 4-weekly means
Category Crop Unit Market 2013 2014
Availability (%) Min Max Mean Median Availability (%) Min Max Mean StdDev
Beans Tsaramaso (beans)
MGA/kp1 Efoetse 20 800 900 840 55
Marofijery/Ankilibory 28 600 800 657 98
Ambatry 64 500 800 680 116
Lojy (cowpea)
MGA/kp Efoetse 92 150 600 324 300 92 200 600 351 106
Marofijery/Ankilibory 100 200 500 337 300 80 217 500 330 80
Itomboina 100 213 500 289 267 96 200 475 334 76
Andremba 100 175 575 290 300 100 200 450 305 76
Ambatry 96 200 633 317 308 96 225 750 334 115
Antake (hyacinth-bean)
MGA/kp Efoetse 32 100 300 250 300 16 300 300 300 0
Marofijery/Ankilibory 32 225 300 257 250 40 225 300 264 29
Itomboina 48 143 250 188 184 72 193 270 218 27
Andremba 48 200 250 206 200 52 200 250 222 23
Ambatry 56 250 475 345 338 52 250 450 342 61
Antsamby (mungbean)
MGA/kp Efoetse 72 300 1000 617 700 44 288 800 373 150
Marofijery/Ankilibory 52 267 1250 464 475 76 300 800 516 152
Itomboina 80 257 500 355 338 80 350 800 499 124
Andremba 60 250 1000 358 300 76 300 1000 496 205
Ambatry 96 300 883 450 421 96 325 1000 472 135
Antsabim-bazaha (rice-bean)
MGA/kp Efoetse 24 280 450 366 350 24 400 700 500 155
Marofijery/Ankilibory 0 16 250 400 325 87
Itomboina 36 200 350 256 200 40 400 1000 620 184
Andremba 8 300 300 300 300 16 400 400 400 0
Ambatry 68 250 475 362 350 64 400 600 484 66
Voanjobory (bambara groundnut)
MGA/kp Efoetse 24 400 500 467 500 28 400 800 579 135
Marofijery/Ankilibory 0 8 400 400 400 0
Itomboina 16 250 300 275 275 8 200 200 200 0
Andremba 28 200 350 257 250 4 400 400 400 0
Ambatry 92 88 533 356 367 92 200 500 331 78
Bulb vegetables Tongolo fotsy (garlic)
MGA/kg Efoetse 80 1900 4000 3025 515
MGA/piece Marofijery/Ankilibory 60 100 200 136 39
MGA/piece Itomboina 80 50 150 93 29
MGA/piece Andremba 24 44 100 76 25

8
MGA/kg Ambatry 72 600 2000 1109 438
Tongolo (onion)
MGA/kg Efoetse 92 650 2500 1274 482
MGA/kg Marofijery/Ankilibory 72 800 2000 1279 438
MGA/tas Itomboina 68 100 200 106 24
MGA/tas Andremba 44 100 200 161 44
MGA/kg Ambatry 68 400 717 524 95
Fruits Voasary (orange)
MGA/tas2 Itomboina 16 200 200 200 0
Andremba 36 100 200 124 38
Ambatry 72 150 317 251 56
Akondro (banana)
MGA/tas Ambatry 80 150 300 211 43
Grains Fresh corn MGA/piece Efoetse 16 100 100 100 0
Marofijery/Ankilibory 28 100 200 143 45
Itomboina 16 125 217 179 40
Andremba 12 100 150 125 25
Ambatry 64 75 300 187 84
Bajiry (millet)
MGA/kp Efoetse 44 225 400 281 275 28 200 250 240 19
Marofijery/Ankilibory 24 250 250 250 250 48 200 400 288 60
Itomboina 8 400 400 400 400 8 400 400 400 0
Andremba 0
Ambatry 8 300 300 300 300
Rice MGA/kp Efoetse 96 400 488 432 28
Marofijery/Ankilibory 92 400 450 430 23
Itomboina 96 390 450 417 23
Andremba 100 400 463 423 25
Ambatry 96 350 450 398 43
Ampemba (sorghum)
MGA/kp Efoetse 16 220 223 222 2
Marofijery/Ankilibory 16 200 230 215 17
Ambatry 12 300 1000 533 300 4 1000 1000 1000 0
Tsako (maize)
MGA/kp Efoetse 92 200 500 287 250 96 197 300 247 28
Marofijery/Ankilibory 96 193 467 269 250 92 200 350 243 30
Itomboina 100 177 290 217 210 96 175 342 241 49
Andremba 100 167 350 220 217 100 170 450 238 63
Ambatry 96 200 500 294 250 92 150 475 238 72
Pumpkins & Melons Voatavo (pumpkin)
MGA/piece Itomboina 8 2000 2000 2000 0

9
Ambatry 8 400 400 400 400
Mody (pumpkin)
MGA/piece Efoetse 16 200 225 209 12
Marofijery/Ankilibory 28 100 400 175 114
Andremba 16 25 117 83 40
Ambatry 44 100 475 243 300 80 25 200 135 41
Taboara (pumpkin)
MGA/piece Efoetse 28 525 1600 883 725 48 450 1367 860 312
Marofijery/Ankilibory 32 800 1500 1267 1275 48 383 1000 669 193
Itomboina 52 317 950 463 383 44 500 700 630 59
Andremba 32 200 500 381 425 40 200 450 338 74
Ambatry 80 283 750 449 400 92 250 675 356 124
Voantango (sugar melon)
MGA/piece Efoetse 16 250 300 275 275 36 400 1200 724 268
Marofijery/Ankilibory 20 533 800 647 650 20 300 367 343 28
Itomboina 32 208 583 403 446 32 150 513 321 161
Andremba 20 500 800 625 600 24 233 500 318 104
Ambatry 32 350 533 429 400 24 275 400 328 43
Kiseny (sugar melon)
MGA/tas Efoetse 0 16 200 200 200 0
Marofijery/Ankilibory 16 100 100 100 100 28 100 200 157 45
Itomboina 64 100 100 100 100 40 100 100 100 0
Andremba 36 50 100 92 100 20 100 100 100 0
Ambatry 32 100 200 125 100 56 100 100 100 0
Vamanga/ Voazavo (water melon)
MGA/piece Efoetse 24 383 500 442 446 36 200 1000 487 304
Marofijery/Ankilibory 24 500 650 546 525 28 300 600 445 98
Itomboina 32 167 450 315 333 32 200 250 225 27
Andremba 16 350 400 375 375 24 233 400 314 72
Ambatry 36 475 900 606 550 36 200 700 357 146
Roots Balahazo (manioc dried)
MGA/kg Efoetse 84 500 1000 738 700 72 600 950 838 86
Marofijery/Ankilibory 80 650 900 749 738 72 767 1000 880 55
Itomboina 100 493 1515 904 742 60 200 600 500 156
Andremba 72 325 1515 740 606 80 200 600 315 160
Ambatry 88 475 1515 1011 1009 96 100 600 383 179
Balahazo (manioc fresh )
MGA/tas Efoetse 16 606 700 651 649 8 400 400 400 0
Marofijery/Ankilibory 28 500 1515 1030 1008 8 400 400 400 0
Itomboina 60 500 1212 668 549 36 400 1000 500 212
Andremba 8 303 303 303 303
Ambatry 96 303 1515 675 606 88 300 800 555 157

10
Bele (sweet potatoes)
MGA/tas Efoetse 24 400 1000 775 850 20 850 1000 947 62
Marofijery/Ankilibory 48 400 1000 910 1000 36 400 1000 867 265
Itomboina 64 300 1000 652 700 64 400 1500 840 342
Andremba 64 267 725 426 400 56 300 400 375 38
Ambatry 56 200 417 357 379 56 250 817 492 218
Others Kapiky (peanut dried)
MGA/kp Efoetse 60 183 200 198 200 36 100 200 169 43
Marofijery/Ankilibory 84 150 200 186 200 48 150 200 172 20
Itomboina 88 90 200 136 143 92 100 200 169 27
Andremba 76 87 200 130 133 68 100 200 133 28
Ambatry 64 100 325 219 267
Kapiky (peanut fresh)
MGA/kp Ambatry 64 125 300 213 68
Kapiky (peanut without shell)
MGA/kp Efoetse 96 500 800 669 87
Marofijery/Ankilibory 84 500 700 616 88
Itomboina 80 600 800 752 74
Andremba 88 400 800 658 151
Ambatry 88 300 750 527 152
Fary (sugar cane)
MGA/piece Efoetse 20 200 500 320 130
Marofijery/Ankilibory 20 100 100 100 0
Itomboina 36 100 600 494 170
Andremba 16 200 500 350 173
Ambatry 84 250 725 452 161
Sweet potato leaves MGA/tas Efoetse 8 100 100 100 0
Marofijery/Ankilibory 12 200 200 200 0
Itomboina 16 92 100 96 5
Ambatry 16 100 100 100 0
Voatabia (tomatoes)
MGA/tas Efoetse 28 100 250 167 150 36 100 200 139 49
Marofijery/Ankilibory 32 100 200 150 150 40 100 200 170 48
Itomboina 72 100 150 141 150 16 100 200 138 48
Andremba 48 100 275 196 200 20 100 100 100 0
Ambatry 76 200 333 225 200 92 100 300 186 57
Note: Prices in MGA, 1: kp = kapoaka, a tin cup with content 0.39 l,
2: pile (tas): local unit with weight of approx. 0.66 kg

11
Price seasonality
Figure 2 shows the price development for lojy beans for all markets in the study area. The prices are
lowest during the harvesting season in June/July and highest in the lean season in
December/January. Similar patterns can be observed for other crops as well.
Figure 2 Seasonal price development for 1 kapoaka (0.39 l) of lojy beans in 2013
For a closer analysis, we compared price differences for the harvest and the two lean seasons for all
crops for 2013 (table 3). For crops with a high number of observations, the Mann-Whitney test could
be applied, confirming that there are differences between harvest and lean season prices for maize,
lojy and antsamby beans. However, for maize the difference between harvest and lean season 1 is
not significant, while also the samples for the two lean seasons for lojy beans differed.
For 2014, we compared price differences for the harvest and the two lean seasons for all crops (table
3) using the Kruskal-Wallis test. The results also confirmed that there are differences between
harvest and lean season prices for maize, dried cassava, peanut without shell, bambara groundnut,
cowpea and mungbeans. Prices for all these crops are lower in the harvest season compared to the
lean seasons. However, this trend can also be seen for other crops, but is statistically not significant
or the number of observations is too low.
0
100
200
300
400
500
600
700
3-10
7-14
11-1
8
15-2
2
19-2
6
23-3
0
27-3
4
31-3
8
35-4
2
39-4
6
43-5
0
47-2
51-3
Pri
ce (
in M
GA
/un
it)
8 week interval Efoetse Marofijery Itombiona Andremba Ambatry

12
Table 3 Seasonal price differences for agricultural crops in harvest and lean seasons in 2013 [in MGA/standard unit]
Harvest season Lean season 1 Lean season 2
Category Crop Obs Min Max Mean Obs Min Max Mean Obs Min Max Mean
Main crops Maize 26 150 350 233 (a) 24 150 600 275 (a) 24 200 550 335 (b)
Cassava (dried) 26 300 712 580 27 400 1515 704 19 700 1515 1187
Cassava (fresh) 13 454 1515 879 6 303 606 556 5 1515 1515 1515
Sweet potatoes 23 300 1000 574 0
0
Beans Bambara groundnut (voanjobory)
2 225 225 225 6 88 500 244 9 400 600 500
Cowpea (lojy) 30 150 400 285 (a) 21 180 700 466 (b) 21 300 800 395 (c)
Hyacinth bean (antake) 0
1 300 300 300 15 200 400 273
Mungbean (antsamby) 26 200 400 300 (a) 17 300 1300 659 (b) 11 500 1000 732 (b)
Rice bean (antsambim-bazaha)
6 200 350 272 1 400 400 400 0
Melons & Pumpkins
Voatavo 0
0
0
Mody 0
5 300 600 440 0
Taboara 24 200 1500 613 5 400 600 500 3 700 800 750
Voantango 11 175 900 398 13 300 800 596 0
Kiseny 12 50 100 96 0
0
Vamanga(voazavo) 9 150 500 297 14 300 800 489 5 500 1000 760
Grains Millet (bajiry) 11 200 300 250 1 400 400 400 3 300 300 300
Peanut with shells 28 60 200 135 6 100 200 133 5 150 200 180
Others Sorgum (Ampemba) 0
0
2 1000 1000 1000
Tomatoes 4 100 200 175 5 200 400 280 5 150 200 180
Note: prices in MGA; statistically tested distributions highlighted with fat letters; letters in brackets indicate groups
significantly different at 5 % level, please see table 2 for units
Price differences between markets
As illustrated by figure 2 and table 5 there are price differences between the markets during the
observation period. The visual interpretation of graphs shows that price differences are low between
the two neighbouring markets Efoetse and Marofijery, which take also place on two subsequent
days. Price information seems to penetrate also fairly well between Andremba and Itomboina, where
travel distances are also relatively short, while the price development in Ambatry does not follow
closely the pattern of the four local markets.
As shown in table 5, prices are lowest on the plateau markets Itomboina and Andremba for most
products occurring at intermediate and high frequencies, while prices are especially high in the
littoral region (Efoetse and Marofijery/Ankilibory) at the beginning of the observation period, and in
Ambatry at the end of the observation period. The only exception to this pattern are prices for dried
cassava, which are lowest and most stable throughout the observation period in the littoral region.
With Mann-Whitney tests (for data from 2013) and Kruskal-Wallis tests (for data from 2014), price
differences between markets are found, although the statistically significant group memberships are
influenced by large differences in variances between the price distributions, and the composition of
groups was not stable across analysed crops.

13
Table 4 Seasonal price differences for agricultural crops in harvest and lean seasons in 2014 [in MGA/standard unit]
Harvest season Lean season 1 Lean season 2
Category Crop Obs Min Max Mean Obs Min Max Mean Obs Min Max Mean
Main crops Maize 30 150 300 210 (a) 20 200 550 338 (b) 19 150 350 267 (c)
Cassava (dried) 28 100 1000 434 (a) 20 500 1000 688 (b) 11 600 900 727 (b)
Cassava (fresh) 7 300 550 379 7 400 1000 529 1 750 750 750
Beans Cowpea (lojy) 28 200 400 288 (a) 20 200 800 453 (b) 18 350 700 423 (b)
Mungbean (antsamby) 25 200 500 368 (a) 10 300 1000 660 (b) 13 500 800 680 (b)
Bambara groundnut (voanjobory) 4 200 250 225 (a) 7 300 600 450 (b) 1 350 350 350
Melons &
Pumpkins
Mody 9 50 200 105 2 100 150 125 0
Taboara 19 200 2000 618 5 300 500 400 1 650 650 650
Voantango 16 150 1000 384 5 300 1200 610 0
Kiseny 14 100 200 121 2 100 100 100 0
Vamanga (voazavo) 19 200 500 305 6 250 1000 525 0
Others Kapiky (peanut dried) 22 100 200 138 3 150 200 183 1 150 150 150
Kapiky (peanut without shell) 20 300 800 527 (a) 15 450 800 633 (a) 15 600 800 743 (b)
Tomatoes 6 150 400 225 2 200 250 225 4 200 250 212
Note: prices in MGA; statistically tested distributions highlighted with fat letters; letters in brackets indicate groups
significantly different at 5 % level, please see table 2 for units

14
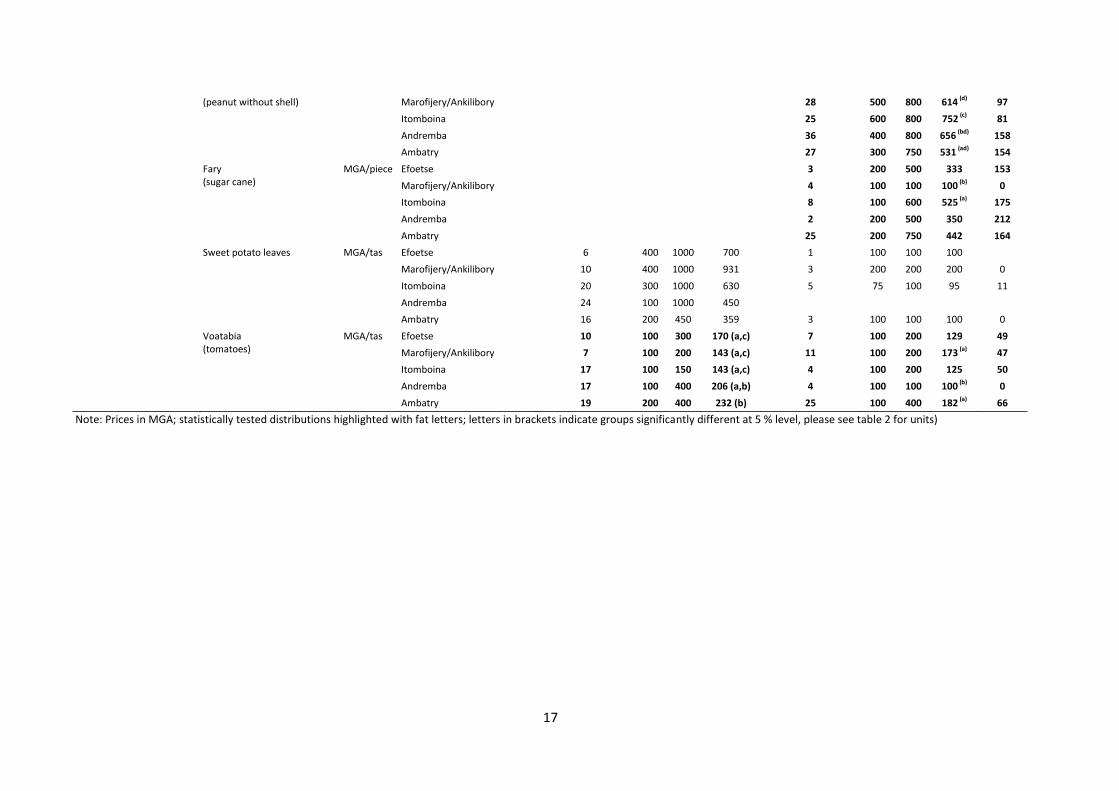
Table 5 Availability and prices for agricultural crops based on weekly data in 2013 and 2014
Category Crop Unit Market 2013 2014
Availability (%) Min Max Mean Availability (%) Min Max Mean StdDev
Beans Tsaramaso (beans)
MGA/kp1 Efoetse 4 800 900 825 50
Marofijery/Ankilibory 4 600 800 650 100
Ambatry 18 500 800 658 129
Lojy (cowpea)
MGA/kp Efoetse 34 100 700 315 (a) 32 200 600 350 105
Marofijery/Ankilibory 33 200 500 341 (b) 29 200 700 341 115
Itomboina 34 175 500 290 (a) 34 200 500 343 78
Andremba 42 150 700 301 (a) 44 200 500 311 87
Ambatry 31 150 800 340 (a,b) 30 200 800 336 136
Antake (hyacinth-bean)
MGA/kp Efoetse 6 100 300 267 2 300 300 300 0
Marofijery/Ankilibory 8 200 300 250 9 200 300 261 33
Itomboina 14 130 250 187 22 180 290 219 29
Andremba 20 200 250 205 18 200 250 228 26
Ambatry 15 200 500 343 14 250 500 354 82
Antsamby (mungbean)
MGA/kp Efoetse 19 300 1000 666 (a) 17 200 800 356 (a) 131
Marofijery/Ankilibory 16 250 1300 491 (b,d) 21 300 800 517 (b) 140
Itomboina 22 220 600 348 (b,c) 21 300 800 520 (b) 146
Andremba 18 200 1000 344 (c) 27 300 1000 476 192
Ambatry 30 300 1000 485 (d) 27 300 1000 469 130
Antsabim-bazaha (rice-bean)
MGA/kp Efoetse 4 280 450 358 4 400 700 550 173
Marofijery/Ankilibory 0 2 250 400 325 106
Itomboina 5 200 350 250 7 400 1000 614 212
Andremba 1 300 300 300 3 400 400 400 0
Ambatry 15 250 500 370 15 400 600 477 62
Fruits Voasary (orange)
MGA/tas2 Itomboina 2 200 200 200 0
Andremba 10 100 200 120 (b) 42
Ambatry 22 150 400 255 (a) 72
Akondro (banana)
MGA/tas Ambatry 21 150 300 207 51
Grains Fresh corn MGA/piece Efoetse 2 100 100 100 0
Marofijery/Ankilibory 5 100 200 140 55
Itomboina 5 100 250 180 57
Andremba 4 100 200 125 50

15
Ambatry 14 75 300 209 86
Bajiry (millet)
MGA/kp Efoetse 11 200 400 277 11 200 250 245 15
Marofijery/Ankilibory 7 250 250 250 11 200 400 277 52
Itomboina 1 400 400 400 1 400 400 400
Andremba 0 0
Ambatry 2 300 300 300 0
Rice MGA/kp Efoetse 38 400 500 433 (b) 31
Marofijery/Ankilibory 32 400 450 431 (b) 25
Itomboina 35 380 450 420 25
Andremba 44 400 500 424 (b) 27
Ambatry 30 350 450 396 (a) 44
Ampemba (sorghum)
MGA/kp Efoetse 4 220 230 223 5
Marofijery/Ankilibory 2 200 230 215 21
Ambatry 4 300 1000 650 1 1000 1000 1000
Tsako (maize)
MGA/kp Efoetse 33 180 500 292 (a) 42 190 300 247 32
Marofijery/Ankilibory 33 180 600 270 (a) 33 200 350 242 31
Itomboina 34 106 300 217 (b) 35 150 350 245 56
Andremba 40 150 500 235 (b,c) 46 150 500 245 79
Ambatry 31 180 600 307 (a) 26 150 550 237 81
Pumpkins & Melons Voatavo (pumpkin)
MGA/piece Itomboina 1 2000 2000 2000
Ambatry 1 400 400 400
Mody (pumpkin)
MGA/piece Efoetse 3 200 225 208 14
Marofijery/Ankilibory 5 100 400 170 129
Andremba 4 25 200 94 77
Ambatry 11 100 600 318 25 25 300 136 68
Taboara (pumpkin)
MGA/piece Efoetse 7 450 1700 907 13 400 2000 908 (b) 450
Marofijery/Ankilibory 9 800 1500 1300 9 350 1000 606 (b) 210
Itomboina 13 200 950 435 11 300 1000 641 (b) 169
Andremba 7 200 500 386 15 200 500 347 (a) 92
Ambatry 22 200 800 457 28 250 700 339 (a) 121
Voantango (sugar melon)
MGA/piece Efoetse 2 250 300 275 10 400 1200 690 331
Marofijery/Ankilibory 5 300 900 620 6 300 400 350 55
Itomboina 11 175 700 416 8 150 600 397 155
Andremba 7 500 800 629 8 200 600 313 136
Ambatry 9 300 600 450 6 250 400 317 52
Kiseny MGA/tas Efoetse 0 3 200 200 200 0

16
(sugar melon) Marofijery/Ankilibory 4 100 100 100 5 100 200 160 55
Itomboina 17 100 100 100 10 100 100 100 0
Andremba 10 50 100 95 6 100 100 100 0
Ambatry 5 100 200 120 17 100 100 100 0
Vamanga/ Voazavo (water melon)
MGA/piece Efoetse 6 350 500 433 8 200 1000 431 249
Marofijery/Ankilibory 7 400 800 550 8 300 600 450 (b) 93
Itomboina 11 150 550 325 6 200 250 225 (a) 27
Andremba 4 200 500 375 7 200 500 300 115
Ambatry 13 400 1000 600 10 200 700 350 151
Root Balahazo (cassava dried)
MGA/kg Efoetse 34 500 1000 753 26 600 1000 858 (b) 103
Marofijery/Ankilibory 27 600 900 754 24 700 1000 871 (b) 62
Itomboina 33 380 1515 886 15 200 600 487 (a) 181
Andremba 32 300 1515 828 31 200 600 348 (a) 186
Ambatry 28 400 1515 929 29 100 600 355 (a) 196
Balahazo (cassava fresh )
MGA/tas Efoetse 5 606 700 644 1 400 400 400
Marofijery/Ankilibory 6 500 1515 1025 1 400 400 400
Itomboina 15 378 1212 670 7 400 1000 486 227
Andremba 1 303 303 303
Ambatry 33 303 1515 711 26 300 1000 552 182
Bele (sweet potatoes)
MGA/tas Efoetse 5 800 1000 940 (b) 89
Marofijery/Ankilibory 7 400 1000 914 (b) 227
Itomboina 16 400 2000 875 (b) 412
Andremba 21 200 400 376 (a) 62
Ambatry 17 250 1000 482 (a) 254
Others Voanjobory (bambara groundnut)
MGA/kp Efoetse 5 400 500 480 7 400 800 557 181
Marofijery/Ankilibory 0 0 0 0 1 400 400 400
Itomboina 2 250 300 275 1 200 200 200
Andremba 7 200 400 293 1 400 400 400
Ambatry 28 88 600 374 27 200 500 333 82
Kapiky (peanut dried)
MGA/kp Efoetse 16 150 200 197 (a) 10 100 200 180 42
Marofijery/Ankilibory 25 150 200 182 (a) 16 150 200 172 26
Itomboina 23 80 200 131 (b,c) 25 100 200 173 29
Andremba 24 60 200 125 (b) 27 100 200 126 29
Kapiky (peanut fresh)
MGA/kp Ambatry 18 100 350 208 (a,c) 18 100 300 208 71
Kapiky MGA/kp Efoetse 30 500 800 653 (bd) 93
17
(peanut without shell) Marofijery/Ankilibory 28 500 800 614 (d) 97
Itomboina 25 600 800 752 (c) 81
Andremba 36 400 800 656 (bd) 158
Ambatry 27 300 750 531 (ad) 154
Fary (sugar cane)
MGA/piece Efoetse 3 200 500 333 153
Marofijery/Ankilibory 4 100 100 100 (b) 0
Itomboina 8 100 600 525 (a) 175
Andremba 2 200 500 350 212
Ambatry 25 200 750 442 164
Sweet potato leaves MGA/tas Efoetse 6 400 1000 700 1 100 100 100
Marofijery/Ankilibory 10 400 1000 931 3 200 200 200 0
Itomboina 20 300 1000 630 5 75 100 95 11
Andremba 24 100 1000 450
Ambatry 16 200 450 359 3 100 100 100 0
Voatabia (tomatoes)
MGA/tas Efoetse 10 100 300 170 (a,c) 7 100 200 129 49
Marofijery/Ankilibory 7 100 200 143 (a,c) 11 100 200 173 (a) 47
Itomboina 17 100 150 143 (a,c) 4 100 200 125 50
Andremba 17 100 400 206 (a,b) 4 100 100 100 (b) 0
Ambatry 19 200 400 232 (b) 25 100 400 182 (a) 66
Note: Prices in MGA; statistically tested distributions highlighted with fat letters; letters in brackets indicate groups significantly different at 5 % level, please see table 2 for units)

18
Price shocks
Strong rises and declines are visible especially in lean season prices for several crops but not
consistently in all markets. For example, there is a strong increase in lojy beans and maize prices in
Efoetse between week 4 and 6, i.e. end of January 2013. Similar increases in maize prices are
observed for Marofijery/Ankilibory, while the prices in Andremba and Itomboina remain relatively
constant at that time. A similar pattern is visible in week 1 (beginning of January 2014) for lojy beans,
maize and sorghum prices in Ambatry and in week 2 (January 2014) for lojy beans and maize prices in
Andremba, while prices for maize and lojy beans remain relatively constant in Efoetse. There is also a
strong increase in cowpea, mungbean and maize prices in Ambatry and for mungbeans and maize on
Andremba market in January 2014. Similar increases are following in Efoetse for cowpea and on
Itomboina market for mungbeans in February.
Thus, we can observe localised shocks for several products, which are most likely associated with
rainfall. When the rain comes, people like to start sowing immediately on their fields, which
increases strongly the demand for seeds. The explanation further substantiated since we observe this
pattern only for crops which are sown as they are sold on the market. We do not observe increases in
prices for cassava or melons and pumpkins, for which the relation between harvested parts and
seeds is not direct.
Appraisal of results for 2013 by market monitors
The respondents confirmed the seasonal variations of availability and prices between harvest and
lean seasons. In addition, differences in climatic conditions (especially occurrence of rainfall) lead to
variations in sowing and harvesting periods and thus in comparative prices between markets. The
respondents also traced seasonal fluctuations of prices to single events, e.g. traders from other
villages visiting the market, or high prices on the central market in Toliara. While some price
differences between markets corresponded to their experience (e.g. for lojy beans), others (e.g. price
differences for cassava between Itomboina vs. Andremba and Itomboina vs.
Efoetse/Marofijery/Ankilibory) were contrary to their personal observations.
Respondents also confirmed the occurrence of price shocks for maize and lojy beans after rainfall
events. In addition, they named the supply of lojy beans and maize by the World Food Programme as
an important cause for decreasing/not further rising prices in April 2013 and December 2013. We
directly asked for the effect of a thunderstorm in April 2013 on prices: While in Efoetse, Marofijery,
Itomboina and Andremba respondents could not remember any effect of this storm on prices, the
respondent in Ambatry stated a strong effect.
Apart from explaining parts of the influences and shocks on prices, respondents confirmed the
different demand and supply chains of the markets they are familiar with: While the markets in
Efoetse and Marofijery/Ankilibory are visited by traders from Toliara and Itampolo, traders and
farmers from Betioky and the Onilahy region frequent the markets on the plateau. The trade
activities between the littoral zone and Itomboina are especially strong, but with apparently loose
intensity in the lean seasons due to security problems (malaso).
Livestock products
Availability
Table 6 depicts the availability of different categories of goats and sheep as sums over the five
markets as moving four week averages. The total number of recordings is slightly lower for sheep

19
than for goats. Recordings are highest among the female categories, however, for them also more
categories were available. When leaving aside male kids, more recordings are available for castrated
goats and sheep in comparison to billy-goats and rams. Among goats, vibine goats are most widely
available, while castrated goats have the most recordings among the 2 year olds. Among sheep, most
recordings occur for vantone sheep (1 year old) and tongaline sheep (4 months to 1 year). The sale
recordings drop very much with higher age of the animals.
Regarding differences between the markets, most recordings were done in Ambatry and
Marofijery/Ankilibory, while least animals are available in Andremba (the total number of recordings
reaches only a quarter of the entries of other markets). Goats are available less frequently on the
plateau, while for the other markets the availability of goats and sheep does not differ much. In
addition, animals in age classes from six to eight years were not recorded on the plateau. For sheep,
even the 5 year age class is completely missing.
Table 7 shows the availability of zebu in the different categories. Males are available as bulls, trained
charrette-zebus (konda) or castrated males. From two year old zebus, most males are available as
bulls, while the differences level out in the higher age categories. Males are recorded up to an age of
13 years, while females recorded in categories with up to 8 calves born. The age of these females can
be up to 16 years. Among all categories of males, most recordings occur in the age class 2 years while
young bulls are slightly more often available as sakany or temboay. Bulls can still be castrated at a
young age and trained as charrette zebus; thus the distinction between categories in the young age
classes is still flexible. Females are most often sold as temboay, sakany and tamana.
There are strong differences between the availability of zebus on the different markets. While
Ambatry offers the most constant availability of zebus in total, only 11 and 2 recordings occurred in
total in Andremba in 2013 and 2014, respectively.

20
Table 6 Availability of goats and sheep categories separated by gender
Category Category description Goats Sheep
2013 2014 2013 2014
Castrated Male Female Castrated Male Female Castrated Male Female Castrated Male Female
Female with kid Female of any age with kid 85 - - 58 73 - - 39
Tohetse Pregnant female 52 - - 56 59 - - 41
Betsiterake Female with no parturition 57 - - 86 47 - - 63
Valoanake 8 years 16 4 4 15 7 28 4 0 0 7 4 23
Fitoanake 7 years 25 20 18 21 11 17 25 26 12 14 14 19
Eneanake 6 years 36 31 22 26 21 28 26 22 22 30 15 24
Limianake 5 years 51 36 39 36 23 37 42 36 29 32 26 30
Efatsanake 4 years 40 43 40 43 34 49 38 41 42 53 30 32
Teloanake 3 years 74 47 56 62 50 54 52 39 38 57 45 46
Roanake 2 years 80 45 51 82 57 56 56 45 53 66 63 44
Raikanake 1-2 years 72 46 51 67 59 46 74 48 54 51 45 44
Tamana Female 1-2 years 69 - - 88 61 - - 77
Vantone 1 year 27 93 91 66 91 36 4 86 95 50 83 44
Antonone 8 months to 1 year and 6 months 30 19 40 33 43 49 28 32 39 25
Vibine 6 months to 1 year and 2 months 100 100 70 91 95 66 84 43 85 92
Tongaline 4 months to 1 year 92 88 58 79 72 69 92 44 59 66
Gorogan 2-6 months 26 17 19 40 35 19 26 13 28 39
Solaloha 3-9 months 58 49 9 42 31 55 55 20 39 27
Malita New born to 3 months 12 5 2 6 4 3 5 0 5 4
Total category 421 683 913 601 637 919 321 604 875 505 576 779
Total animal 2017 2157
1800 1860
Notes: Figures are sums over 5 markets from moving four week averages; 125 recordings would represent full availability on all five markets)

21
Table 7 Availability of zebu categories in 2014 separated by gender
Category Category description 2013 2014
Male (bulls) Konda Castrated Female Male (bulls) Konda Castrated Female
Female with kid Female of any age with kid 30 - - - 17
Tohetse Pregnant female 28 - - - 22
Betsiterake Female with no parturition 57 - - - 44
Renen'aombe valoanake 8 parturitions - - - 3
Renen'aombe fitoanake 7 parturitions 21 - - - 5
Renen'aombe enenake 6 parturitions 19 - - - 9
Renen'aombe limianake 5 parturitions 23 - - - 16
Renen'aombe efatsanake 4 parturitions 37 - - - 20
Renen'aombe teloanake 3 parturitions 29 - - - 18
Renen'aombe roanake 2 parturitions 31 - - - 32
Renen'aombe raikanake 1 parturition 27 - - - 13
Tamana 1-2 years, good body condition 72 - - - 69
Foloteloamby ay 13 years 6 10 7 0 5 0 -
Foloroamby ay 12 years 6 12 9 3 7 8 -
Foloraikamby ay 11 years 8 14 14 5 12 18 -
Foloay 10 years 18 22 18 10 11 13 -
Siviay 9 years 21 13 16 13 10 14 -
Valoay 8 years 18 28 23 12 15 15 -
Fitoay 7 years 21 29 31 15 16 16 -
Enenay 6 years 23 28 24 17 23 18 -
Limiay 5 years 23 36 34 18 25 21 -
Efatsay 4 years 36 37 35 22 32 37 -
Teloay 3 years 62 51 43 32 47 46 45 30
Roay 2 years 70 53 49 52 40 60 36 52
Sakany 1 year and 6-11 months 71 41 21 73 59 38 42 51
Temboay 1year and 0-6 months 79 28 23 78 63 51 52 66
Raiay 1 year 0 2 4 - - 13 -
Drotsy 17 17 10 19
Gorogan 7 months to 1 year and 3 months 51 3 12 42 36 9 16 17
Solaloha 5 months to 1 year 28 1 4 11 20 10 10 4
Malita New born up to 4 months 11 0 0 9 2 1 0 4
Total in category 552 408 367 399 388 384 243
Notes: figures represent sums over 5 markets from moving four weeks averages; 125 recordings would represent full availability on all five markets

22
Price according to age class
The fine recording of age classes for different animals allows a comparison of prices between
different animal categories. Figure 3 shows the price development through the age classes for male
and female sheep for the five different markets. Prices for male sheep range from 10,000 MGA for
small gorogan sheep up to 70,000 MGA for 8 year olds. A nearly linear increase in prices is visible
with increasing age, while there is no drop in price for comparably old sheep. Similar developments
(sometimes with increasing variation of data in the higher age classes) are visible for male goats and
zebu as well. The price for females ranges from 10,000 MGA to 90,000 MGA, whereas older age
classes in Ambatry are responsible for the maximum range. An increase in prices is visible at young
age classes of females up to tamana and stabilizing in older age classes. Similar tendencies are visible
for other female goats and zebu as well.
Figure 3 Annual mean prices for male sheep in 2014 according to age categories (youngest age categories at the right side)
0
10.000
20.000
30.000
40.000
50.000
60.000
70.000
Val
oan
ake
Fito
anak
e
Enea
nak
e
Lim
ian
ake
Efat
san
ake
Telo
anak
e
Ro
anak
e
Rai
kan
ake
Tam
ana
Van
ton
e
An
ton
on
e
Vib
ine
Ton
galin
e
Go
roga
n
Sola
loh
a
Mal
ita
Mea
n a
nn
ual
pri
ce [
in M
GA
]
Age class
Ambatry Andremba Efoetse Itombiona Marofijery/Ankilibory

23
Figure 4 Annual mean prices for female sheep in 2014 according to age categories (youngest age categories at the right side)
Price seasonality
Seasonal price differences for live animals are not as pronounced as for crops. While a slight trend to
higher prices in July/August is visible for goats and sheep, seasonal price differences for zebus are
nearly absent in the graphs. The diagrams in figure 5 and 6 show the development for female sheep
(Vibine) and female zebu (Tamana) in 2014 (see more diagrams in file
'DiaLiveStock_Price_Development_20160214’). Prices tend to be higher between week 30 and 45 for
female sheep, but the trend cannot be seen for other livestock categories. That prices tend to be
higher in the harvest season, which can be explained with increased demand due to the upcoming
festivities and investments of earnings from harvest sales. The tendency is especially visible for
Efoetse, Marofijery/Ankilibory and Itomboina, while the trend is not equally clear for Ambatry. The
development for the female zebu does not show this trend. Low observation numbers further
complicate the analysis for most livestock categories.
0
10.000
20.000
30.000
40.000
50.000
60.000
70.000
80.000
90.000
Fem
ale
wit
h k
id
Toh
etse
Bet
site
rake
Val
oan
ake
Fito
anak
e
Enea
nak
e
Lim
ian
ake
Efat
san
ake
Telo
anak
e
Ro
anak
e
Rai
kan
ake
Tam
ana
Van
ton
e
An
ton
on
e
Vib
ine
Ton
galin
e
Go
roga
n
Sola
loh
a
Mal
ita
Mea
n a
nn
ual
pri
ce [
in M
GA
]
Age class
Ambatry Andremba Efoetse Itombiona Marofijery/Ankilibory

24
Figure 5 Seasonal price development for female sheep (Vibine) in 2014
Figure 6 Seasonal price development for female zebu (Tamana) in 2014
Price differences between the markets
The five monitored markets differ in the availability of live animals, as well as in prices. Most
recordings for nearly all categories of livestock were done in Ambatry, while far least recordings are
available for Andremba. Mean prices for most livestock categories are highest in Ambatry for
castrated, female and konda zebus in the older age categories, although other markets have less
comparable observations. Male zebus are more expensive in Efoetse for older age classes. Younger
livestock categories showed same mean price development. In general, price development for zebu
0
5.000
10.000
15.000
20.000
25.000
30.000
35.000
2-5
4-7
6-9
8-1
1
10
-13
12
-15
14
-17
16
-19
18
-21
20
-23
22
-25
24
-27
26
-29
28
-31
30
-33
32
-35
34
-37
36
-39
38
-41
40
-43
42
-45
44
-47
46
-49
48
-51
50
-1
Pri
ces
[in
MG
A]
Four-Weeks-Interval 2014 Ambatry Andremba Efoetse Itombiona Marofijery/Ankilibory
0
50.000
100.000
150.000
200.000
250.000
300.000
350.000
400.000
450.000
2-5
4-7
6-9
8-1
1
10
-13
12
-15
14
-17
16
-19
18
-21
20
-23
22
-25
24
-27
26
-29
28
-31
30
-33
32
-35
34
-37
36
-39
38
-41
40
-43
42
-45
44
-47
46
-49
48
-51
50
-1
Pri
ces
[in
MG
A]
Four-Weeks-Interval 2014
Ambatry Andremba Efoetse Itombiona Marofijery/Ankilibory

25
seems linear with higher prices for older ages. Goats and sheep show a similar linear trend, but
without a clear distinction between the markets. Castrated goats and sheep as well as female sheep
seem to be more expensive in Ambatry.
We did not apply statistical tests to evaluate differences between markets since values are relatively
close and it is unlikely to find systematic differences over several livestock categories.
Appraisal of results of 2013 by market monitors
As for the crops, market monitors or other key persons in the market villages were asked for their
thoughts on diagrams with monitored data. Besides seasonal developments, we discussed diagrams
displaying the price development over age classes similar to figure 3 and 4.
Regarding seasonality, all respondents confirmed that prices for goats and sheep are higher in the
harvest season as people sell their harvest and invest the cash in small stock. In addition, at that time
animals are slaughtered in social events. Harvest failure (kere) corresponds with very low prices of
animals. For the respondents, it was understandable that zebus do not show the strong fluctuations
since most people do not earn enough cash with their harvest to invest directly in zebus. “Collecting”
zebus for social events is a longer-term project.
Regarding the price developments over age classes, respondents emphasised that body condition
does influence the price more strongly than age. For female animals, they confirmed that tamana
achieve particularly high prices since this animal category is defined by good body condition. The
steady rise of prices over age classes for male animals was not confirmed, but rather body condition
(fatness) said to be the main determinant. Apart from body condition and age, the price for zebus is
positively influenced by colour (particularly red) and big horns. Big horns seem to play a larger role
among the Mahafaly ethnic group around Ambatry.
The respondents saw differences between the markets particularly regarding the availability of
animals. Itomboina is well known in the study region as a livestock market since buyers come from
the Onilahy region. It was confirmed that the livestock market in Andremba is not very lively.
Apparently, livestock resellers (“patrons”) coming from outside the region to the local markets are
potent livestock buyers especially in the lean season period and influence the livestock prices
positively by their presence.
Prices for milk and meat
Besides live animals, milk and meat are sold on the monitored markets. Table 8 depicts summary
statistics of milk and meat prices. For 2013, the price for zebu and goat milk ranges from 100 to 300
MGA, but has a stable mean and median around 200 MGA. For 2014, the price for zebu and goat milk
ranges from 150 to 450 MGA, thus is slightly higher than in 2013. Sheep milk occurred only three
times on the market in Itomboina in 2013, but is otherwise taboo to be consumed among the
Mahafaly and Tanalana ethnic groups.
Sheep, goat and zebu meat are sold by butchers on the markets with goat meat occurring most
frequently. Sheep meat occurred in Ambatry as often as goat meat, but only seldom on the markets
of Itomboina and Andremba, respectively. This can be explained with the less widespread
distribution of sheep on the plateau. In the littoral region, sheep meat occurred less often in
comparison to goat meat. The meat prices are nearly the same for all livestock types and range
between 2,000 and 6,000 MGA per kg for all markets.

26
Table 8 Availability and prices for milk and meat on the monitored markets in 2014
2013 2014
Item Market Unit N Min Max Mean Median N Min Max Mean Std.Dev
Meat of goat Efoetse MGA/kg 34 3,500 4,500 4,000 4,000 20 4,000 4,000 4,000
Marofijery/Ankilibory MGA/kg 29 3,000 4,000 3,793 4,000 28 3,000 4,000 3,832 272
Itomboina MGA/kg 33 2,500 6,000 5,273 5,500 20 4,500 5,000 4,975 112
Andremba MGA/piece1 25 1 19
Ambatry MGA/kg 33 3,000 6,000 4,961 5,000 22 3,000 5,000 4,159 473
Meat of sheep Efoetse MGA/kg 16 4,000 4,000 4,000 4,000 3 4,000 4,000 4,000
Marofijery/Ankilibory MGA/kg 4 3,000 4,000 3,625 3,750 3 2,500 3,500 3,167 577
Itomboina MGA/kg 1 4,000 4,000 4,000 4,000 2 5,000 5,000 5,000
Andremba MGA/piece1 1
Ambatry MGA/kg 31 3,000 6,000 4,952 5,000 22 3,000 5,000 4,023 326
Meat of zebu Efoetse MGA/kg 25 3,000 4,000 3,700 4,000 21 4,000 4,000 4,000
Marofijery/Ankilibory MGA/kg 8 2,800 4,000 3,725 4,000 6 3,500 4,000 3,917 204
Itomboina MGA/kg 22 2,000 4,000 3,177 3,500 14 2,500 3,600 3,050 268
Andremba MGA/piece1 2 2,000 2,000 2,000 2,000 2
Ambatry MGA/kg 31 4,000 6,000 4,468 4,000 20 4,000 4,500 4,100 205
Milk of goats Efoetse MGA/kp 37 200 300 218 200 28 200 300 225 44
Marofijery/Ankilibory MGA/kp 23 100 200 191 200 30 200 300 210 31
Itomboina MGA/kp 18 100 600 228 200 13 200 200 200 0
Andremba MGA/kp 14 100 200 157 200 16 150 200 175 26
Ambatry MGA/kp 4 133 166 158 166 0
Milk of sheep Efoetse MGA/kp 0 0
Marofijery/Ankilibory MGA/kp 0 0
Itomboina MGA/kp 3 150 200 183 200 0
Andremba MGA/kp 0 0
Ambatry MGA/kp 0 0
Milk of zebu Efoetse MGA/kp 10 200 200 200 200 5 200 200 200 0
Marofijery/Ankilibory MGA/kp 6 200 200 200 200 0
Itomboina MGA/kp 10 150 200 160 150 11 150 200 195 15
Andremba MGA/kp 16 100 200 163 150 16 150 200 169 25
Ambatry MGA/kp 15 200 350 257 250 20 150 450 334 88 1 Statistics not calculated as conversion of diverse units not possible

27
Alimentary plants For inhabitants of the Mahafaly Plateau region, alimentary plants are an important supplement of
the diet. While some fruits enhance the daily food supply during their availability, especially tubers
are an inferior substitute for cassava and rice during the lean season.
Availability
A list of 43 alimentary plants derived from the Household Baseline Survey data was proposed for
monitoring of prices. However, only some of them actually occurred on the markets during the
observation period 2013 (21) and again in 2014 (19). Furthermore, many of them are traded
infrequently and only on one or two markets. Thus, for the other alimentary plants, we can assume
that they are not traded regularly on the markets and that nearly no market prices exist. Table 9
depicts availability and prices of alimentary plants on the monitored markets.
Among the most frequently occurring alimentary plants are baboky (yam), kily (tamarind fruits),
lamonty, manga (mangoes), ovy ala (yam) and tsinefo fruits. For 2013, the widest range of products is
offered in Ambatry, followed by Marofijery/Ankilibory, while least alimentary plants are recorded for
the market in Efoetse. For 2014, the widest range of products is offered in Itomboina (14
observations), followed by Ambatry and Andremba (11, respectively), Marofijery/Ankilibory (9), while
least alimentary plants are recorded for the market in Efoetse (5). While some fruits like mangoes,
the fruits of raketa (Opuntia spp.) and tsinefo are clearly available only seasonally, other fruits (e.g.
tamarind fruits) and tubers (e.g. yam species, e.g. baboky, ovy ala) are offered on the markets all
year round.
Table 9 Availability and prices of alimentary plants on the monitored markets
2013 2014
Plant Market Unit Obs. Min Max Mean Median Obs. Min Max Mean Std.Dev.
Angily Itomboina MGA/piece 2 200 200 200 0
Baboky Ambatry MGA/piece 24 100 400 208 200 25 150 300 202 44
Andremba 1 100 100 100 100
Itomboina 25 100 250 158 150 21 100 200 171 46
Marofijery/Ankilibory 1 200 200 200 200
Felempasy Andremba MGA/kp 1 150 150 150 150
Marofijery/Ankilibory 1 150 150 150 150
Giseny Ambatry MGA/piece 3 200 250 217 200
Guava (goavy) Ambatry MGA/tas 20 100 250 160 200 15 100 200 143 37
Katro Andremba MGA/tas 1 100 100 100 0
Kily Ambatry MGA/kg 20 100 400 177 175 13 100 175 125 35
Andremba 3 100 100 100 0
Itomboina 26 50 200 138 150 17 100 200 158 24
Kiseny Ambatry MGA/tas 3 100 100 100 100 12 100 100 100 0
Andremba 8 50 100 94 100 4 100 100 100 0
Itomboina 2 100 100 100 100 9 100 100 100 0
Marofijery/Ankilibory 3 100 200 167 58
Lalangy Marofijery/Ankilibory MGA/kp 4 20 200 130 150
Lamonty Ambatry MGA/kp 16 50 200 116 100 14 50 100 96 13

28
Andremba 3 50 50 50 0
Efoetse 2 100 200 150 71
Itomboina 15 50 100 59 18
Marofijery/Ankilibory 12 100 200 158 42
Langolora Andremba MGA/kp 1 50 50 50 50
Manga Ambatry MGA/tas 11 100 200 136 100 7 100 100 100 0
Andremba 8 100 200 138 52
Efoetse 3 200 200 200 0
Itomboina 13 100 200 138 51
Marofijery/Ankilibory 9 200 200 200 0
Moky Efoetse MGA/piece 2 100 200 150 71
Marofijery/Ankilibory
3 100 100 100 0
Notsoke mena Andremba MGA/tas 3 100 100 100 0
Itomboina
2 100 100 100 0
Ovy ala Andremba MGA/piece 13 200 200 200 200 2 200 200 200 0
Itomboina
30 150 300 197 200 21 100 300 226 56
Paky Itomboina MGA/kp 10 400 400 400 0
Raketa Ambatry MGA/tas 6 50 100 92 100 4 100 100 100 0
Andremba 5 50 100 90 100 1 100 100 100 0
Efoetse 7 100 200 129 100
Itomboina 5 100 100 100 0
Marofijery/Ankilibory 3 100 200 133 100 5 100 100 100 0
Sakoa Ambatry MGA/kp 9 250 400 328 300 21 300 800 483 153
Andremba 2 400 400 400 0
Itomboina 11 400 450 405 400 9 200 400 378 67
Samangy Marofijery/Ankilibory MGA/kp 2 100 100 100 100
Sele Ambatry MGA/kp 10 100 100 100 0
Itomboina 8 100 100 100 100 2 100 100 100 0
Marofijery/Ankilibory 3 200 200 200 0
Selempasy Ambatry MGA/kp 2 150 200 175 175
Andremba 1 100 100 100 100 3 100 100 100 0
Efoetse 1 100 100 100 0
Marofijery/Ankilibory 1 200 200 200 200 8 150 200 175 27
Tsinefo Ambatry MGA/kp 10 100 100 100 100 17 100 100 100 0
Andremba 5 50 100 70 50 3 50 50 50 0
Efoetse 8 100 100 100 100
Itomboina 19 20 50 36 30 11 10 100 42 31
Marofijery/Ankilibory 6 100 200 117 100 19 100 200 118 38
Tsingilo Efoetse MGA/kp 4 100 100 100 100
Marofijery/Ankilibory 2 100 100 100 100
Tsotsoky Ambatry MGA/piece 1 20 20 20 0
Efoetse 1 100 100 100 100 10 40 100 94 19
Itomboina 2 50 100 75 75 4 50 100 88 25
Marofijery/Ankilibory 2 100 100 100 100
Velay Ambatry MGA/piece 2 150 200 175 175
Voatany Marofijery/Ankilibory MGA/piece 2 100 150 125 125 5 100 200 130 45

29
Price seasonality
As noted above, especially fruits are only seasonally available on the markets. For the products
occurring regularly on the market, seasonal differences in prices might be caused by (1) seasonally
changing quality and available quantities of the product or by (2) seasonally changing demands and
willingness to pay for the product from consumers. However, price seasonality is hard to corrobate,
since effects may differ between products and only in few cases data for two or more markets are
available (see diagrams in file ‘Dia_AlimCrops_20160207’). For example, prices for baboky in Ambatry
rose at the beginning of 2013 to 300-400 MGA/piece and at the beginning of 2014 to 250-300
MGA/piece while they were lower (100-150 MGA/piece) in July-October. However, similar data from
Itomboina did not show any systematic price changes. The data for Tsinefo shows high prices before
week 25 (100-200 MGA/kp) and then prices suddenly decreasing on markets in Marofijery/Ankilibory
and Itomboina (25-100 MGA/kp) in 2014. Contrary, prices in Ambatry are not changing over the year.
These patterns mirror more or less the crop price dynamics.
For tamarind fruits (kily), prices in Ambatry are highest in September-December (approx. 200
MGA/kg) compared to 120-150 MGA/kg in February 2013. A similar trend with later peak prices (in
November/December) is visible in the tamarind fruit price recordings for Itomboina. For this product,
the source of price changes is most likely a seasonally changing quality, as fruits become full ripe in
the last quarter of the year.
Price differences between markets
Differences in prices for alimentary plants between the monitored markets are not observable due to
data limitations.
Discussion
Methods We observed market prices for local products on five markets in the Mahafaly Plateau region over
one year. No other price information of similar detail from the same region with which our results
can be compared is available to us.
The recorded data and thus the results may be influenced by the methods of data collection. Prices
are not fixed or officially recorded, thus they are a result of bargaining between buyers and sellers on
the local markets. Consequently, actually achieved prices per unit are likely to vary between different
transactions, according to exchanged amounts as well as during the course of the market day. In
addition, there might be variations according to unobserved characteristics, e.g. for crops according
to quality.
In the monitoring we did not record results of transactions but expected prices by the sellers of
products in a similar time window on each market day. Thus, there might be some deviation between
recorded expected prices and actually achieved prices through transactions. In addition, we recorded
data just for a limited amount of sellers, which does not allow the calculation of an average price per
market day. The price differences are likely to be fairly low for products with relatively stable prices
and frequent transactions, but there might be considerable deviations for products with high price

30
volatility. In general, we can expect actual prices to be somewhat lower than the recorded prices in
our data.
Crops The market data for different crops revealed the seasonality as an important factor influencing the
availability and prices. Regarding availability, only staple food crops were found on nearly every
market in the region, while other crops, e.g. a broad variety of pumpkins and melons as well as some
bean species, were only available seasonally or occasionally. These results can be traced to the
harvesting seasons of the different crops. For staple foods, prices were found to vary strongly
according to the season, with prices being highest in the lean season (planting and growing season)
while prices dropped in the harvest season. Thus, seasonal effects were highly visible in the data.
We observed differences between the markets regarding the availability and prices as well. Ambatry
as a regional market offers a broader and more constant range of crops compared to the four local
markets. Regarding price differences, we found in tendency lower prices on the plateau compared to
the two littoral markets and Ambatry. This may be related to a comparably higher crop production
and lower infrastructural access to plateau villages compared to Ambatry (which is located close to
the RN 10) and the two littoral villages (where transport to the regional centre Tulear is comparably
easier through waterways and the road running parallel to the sea shore).
In a detailed comparison of prices between Andremba vs. Itomboina and Itomboina vs. Ambatry we
observed systematic differences. While in the harvest season the prices in the more remote market
(Andremba or Itomboina, respectively) were lower than in the more central market (Itomboina or
Ambatry), the pattern was reversed in the lean season. Interplay between transport costs and
relative supply and demand is the most likely explanation for this pattern. In the harvest season
there is abundant supply of crops in the remote market as each farmer tries to sell crops to generate
cash. Traders use the relative abundance of crops to negotiate lower prices which also pay off the
transport costs to the more central markets. In contrast, in the lean season, there is a comparably
high demand of staple food crops in the remote village since smallholders whose subsistence stock is
finished try to buy crops on the market. Traders bringing staple food from more central villages or
local villagers having stocked products offer only a scarce supply of products. This leads to
comparably high prices in the remote villages. For beans and maize, prices in the lean season
increase heavily after rainfall events since households looking for seeds are willing to pay very high
prices.
Feedback interviews with the market monitors on price diagrams confirmed these relationships,
especially the effects of seasonality and seed demand. According to these local observations,
interventions of the World Food Programme by food for work schemes caused food prices to fall
during lean times.
Livestock products Prices for live animals were recorded in locally used very fine categories, specifying gender, age, and
reproductive stage of the animal: For example, zebu prices were recorded in 72 categories. However,
we did not observe the body condition of sold animals, which causes unexplained variation in the
data.

31
In contrast to crop prices, the influence of seasonality on prices of live animals is rather low. For
zebus, no influence is visible, while for female sheep and goats somewhat higher prices can be
observed in the harvest season especially on the littoral markets of Efoetse and
Marofijery/Ankilibory. Thus, if any seasonality can be stated, it runs contrary to the pattern of crop
prices, which are lowest during the harvest season. The pattern can be explained with increased
demand for small stock as after the harvest season people invest cash earned from arable farming
activities in livestock and the festivity season in August/September, where livestock is exchanged and
consumed in larger quantities. This pattern was confirmed in the feedback interviews with market
monitors. The “festivity effect” is not visible for zebus, although they are a main status symbol and
highly valued gift. In addition, we found no systematic influence of the seasonally variable body
condition of animals on the price. Although animals tend to be fatter at the end of the rainy season
and thinnest at the end of the dry season, we did not observe price differences which can be related
to that effect.
A well visible influence on the animal price in the data regardless of its body condition is the age of
the animal. It is possible to evaluate this effect in detail due to the many age categories distinguished
in the data. Contrary to common expectations, for most markets (except Ambatry) the price for male
animals increases nearly linearly with higher age of the animal. Feedback interviews could not
confirm this relationship. Part of this effect can be explained with increasing body weight and horn
size with age especially for zebus. For female animals, the price remains in general stable once they
have reached the reproduction age, but, again, we do not observe systematically decreasing prices
with increasing age.
We observed differences between the markets regarding the availability of livestock as well as slight
tendencies regarding price differences. The highest presence of livestock was observed on the
market of Ambatry, while animals were available only occasionally in Andremba. In addition, animals
of higher age categories (more than 7-8 years for zebus and 4-5 years for goats and sheep) were not
available on the plateau markets of Andremba and Itomboina, although the categories were known
to the market monitors. Possible reasons might be a generally lower availability of older animals in
this region, cultural constraints in the sale, or a preference of home slaughter of older animals. Mean
price differences were only observed as tendencies since the overall variation in prices would
override differences in statistical tests. For most animal categories, prices were highest for Ambatry
and partly for Itomboina, while mean prices were lower for most animal categories (except young
goats and sheep) on the littoral markets of Efoetse and Marofijery/Ankilibory.
Alimentary plants Despite the price recording was proposed for more than 40 different alimentary plants, only half of
them actually occurred during the observation period on the markets. Thus, a wide range of
alimentary plants is not traded on the markets although evidence of the household baseline data
suggests that they are consumed. For the traded plants, the majority of them only occur occasionally
or seasonally, which is the case especially for fruits with seasonal harvesting times. Only tamarind
fruits and yam species are found regularly on some markets.
We could not sufficiently corrobate seasonal price variations and price differences between markets
due to insufficient data points, however, seasonal quality and available quantity changes as well as
changes in consumer demand may influence price developments. Nevertheless, the data suggests
that price developments depend on the specific plant concerned, its seasonal dynamics and valuation

32
by the customers. The price dynamics for a seasonally available fruit like mango are certainly
different from the price of yam tubers, which serve as lean season food and are an inferior
replacement for cassava and rice.
In sum, the evidence from the market monitoring for alimentary plants underlines that consumable
forest products are predominantly home consumed and have only a limited importance as traded
goods. If existing, the marketing chains for most of those products are short and largely driven by
local availability and demand.
Determinants of availability and prices The market monitoring data of 2013 and 2014 shows availability and price dynamics which are
typical for rural markets. Although the basic forces of supply and demand are crucial for shaping
prices on the markets, we found for agricultural crops strong seasonal price changes and price
differences between the markets which can be explained by remoteness/centrality of markets in
combination with varying transport costs. The pattern is consistent with an outflow of agricultural
products during the harvest season and an inflow of the same products during the lean season.
According to the data, seed supply is a problem in the study area, since prices for seeds rise
dramatically when it rains. The markets for livestock products exhibit less seasonality and less price
differences between markets. Interestingly, the price for comparably old animals does not drop
significantly. In detail, findings regarding seasonality and price differences between age classes are
consistent with the function of livestock as savings in households.
Viewed together over all three product classes (crops, livestock and alimentary plants), the most
important factors for explaining availability and price fluctuations are (1) seasonality of land use, (2)
infrastructural deficits resulting in a high cost of transport and (3) consumer preferences, resulting
from the logic of farm-households relying partly on subsistence, and from other socio-cultural
factors. An important factor, though not observable in the data, is the influence of precipitation and
thus harvest quantity on the level of prices. According to information from local people, prices for
agricultural products in drought years are generally higher than in years with abundant rain and a
good harvest. As in 2013 and 2014 the harvest was rather moderate or low, the observed prices are
likely to be rather high in a cross-year comparison. However, this point can be only investigated
through a longer term monitoring of market data.
Despite the market monitoring data reveals important patterns of rural markets in the Mahafaly
Plateau region, it cannot provide a full market analysis and the findings remain partly incomplete.
Important questions left out here, which constitute potential for further studies, are (1) marketing
chains resulting from trader activities and their strategic decisions, (2) the question of storage
especially of cassava, which influences significantly seasonal price changes of the most important
crop and is strategically done by traders in the villages, and (3) the influence of the overall
precipitation and the quantity of harvest on yearly prices.
Findings in a nutshell - We observed market data for crops, livestock and alimentary plants on five different markets
in the Mahafaly region.
Main results of crop price monitoring

33
- Basic agricultural products are constantly available on all markets, while other products are
available only seasonally or occasionally. The range of products offered is higher in more
central markets.
- Markets for agricultural crops are strongly seasonal. Prices are low in the harvest season and
high in the lean season, which can be explained by seasonal variations of supply and
demand. The onset of rain is a shock for prices of maize and beans, since a strong increase in
demand for seeds occurs.
- Remoteness/centrality of the market influences prices through transport costs and the forces
of relative supply and demand. Thus, prices for agricultural products in remote villages are
lower than in more central villages in the harvest season, while prices in remote villages are
higher than in more central villages in the lean season.
Main results of livestock prices
- Prices for livestock products were recorded in very fine categories, specifying gender, age
and reproductive stage of the animal. E.g. zebu prices were recorded in 72 categories by the
market monitors.
- The most often sold animals are older calfs (vibine or vantone for sheep and goats, temboay
for zebu) while old animals occur less often on the market. Animals above 3-4 years among
goats and sheep and above 7-8 years for zebu occur less often on the plateau markets, with
especially few animals being available on the market in Andremba.
- Prices for male animals increase with the age of the animal, while for female animals prices
remain constant through their life time period once they reached a productive age.
According to local information body condition is the most important determinant of livestock
prices.
- Seasonality is also present on livestock markets. Prices for small stock are higher in the
harvest season but lower in the lean season. This pattern is caused by increased investment
of cash in livestock and consumption in social events which occur predominantly in this
season.
Main results for prices of alimentary plants
- Although price recording was proposed for more than 40 plants only half of them actually
occurred on the markets during the observation period. This underlines that consumable
forest products are predominantly used for subsistence but have only limited importance as
traded products.
- Among the most frequently occurring products are tamarind fruits and yam species, while
fruits like mangos and fruits of Opuntia spec. are only seasonally available.
- Due to a lack of data, we cannot prove seasonal price differences and price differences
between the markets; however, price dynamics differ most likely according to the nature of
the product and consumer valuations.
Determinants of availability and prices
- Basically, market forces of supply and demand influence price fluctuations in the study area.
Thus, extremely distorted markets for some products are unlikely.
- Other important factors influencing prices are (1) the seasonality of supply, especially for
agricultural crops, (2) high transport costs due to infrastructural deficits, and (3) consumer

34
preferences from rural, partly subsistence farm-households. The high demand for seeds after
rain events in the lean season causes price shocks.
- A factor with significant influence on the price level for products during the year is according
to local information the amount of precipitation and thus the quantity of the harvest.
However, as the observation period covers only one year (2013/beginning of 2014) in which
the harvest was moderate, cross-year comparisons are not possible and the factor remains
unobserved.
- Further potential for studies in market analysis is seen in the analysis of marketing chains,
trader’s strategic behaviour, and storage of agricultural products.

Participatory research to support sustainable land management on the Mahafaly Plateau in south-western Madagascar
Livelihoods of households in theMahafaly Plateau region. Results from socio-economic research of SuLaMa project