Participatory noise mapping
67
Participatory noise mapping Dr. Ellie D’Hondt & Matthias Stevens
Transcript of Participatory noise mapping
Participatory noise mapping
Dr. Ellie D’Hondt & Matthias Stevens
2
computer science ↔ sustainability
• environmental simulations
• distributed resource usage for hard computations
• improve the grain-size and quality of environmental measurement data
• increase awareness of citizens and thus provide support for political action
[Steels08] Luc Steels. Community Memories for Sustainable Societies. Special publication for the 20th Anniversary of Sony CSL, Tokyo spring 2008.
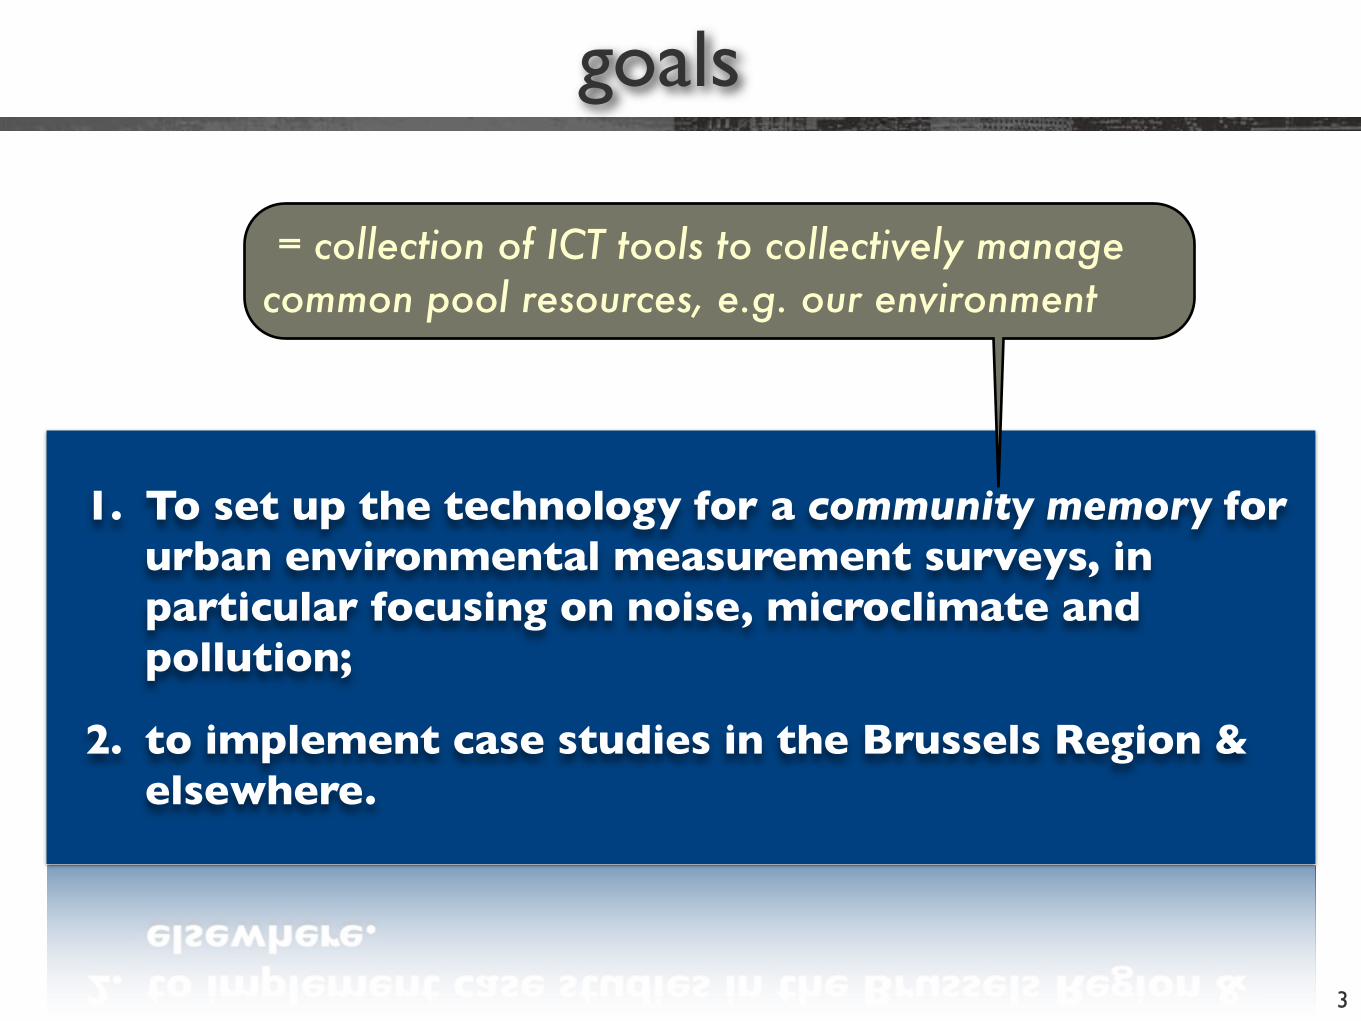
goals
3
1. To set up the technology for a community memory for urban environmental measurement surveys, in particular focusing on noise, microclimate and pollution;
2. to implement case studies in the Brussels Region & elsewhere.
= collection of ICT tools to collectively manage common pool resources, e.g. our environment
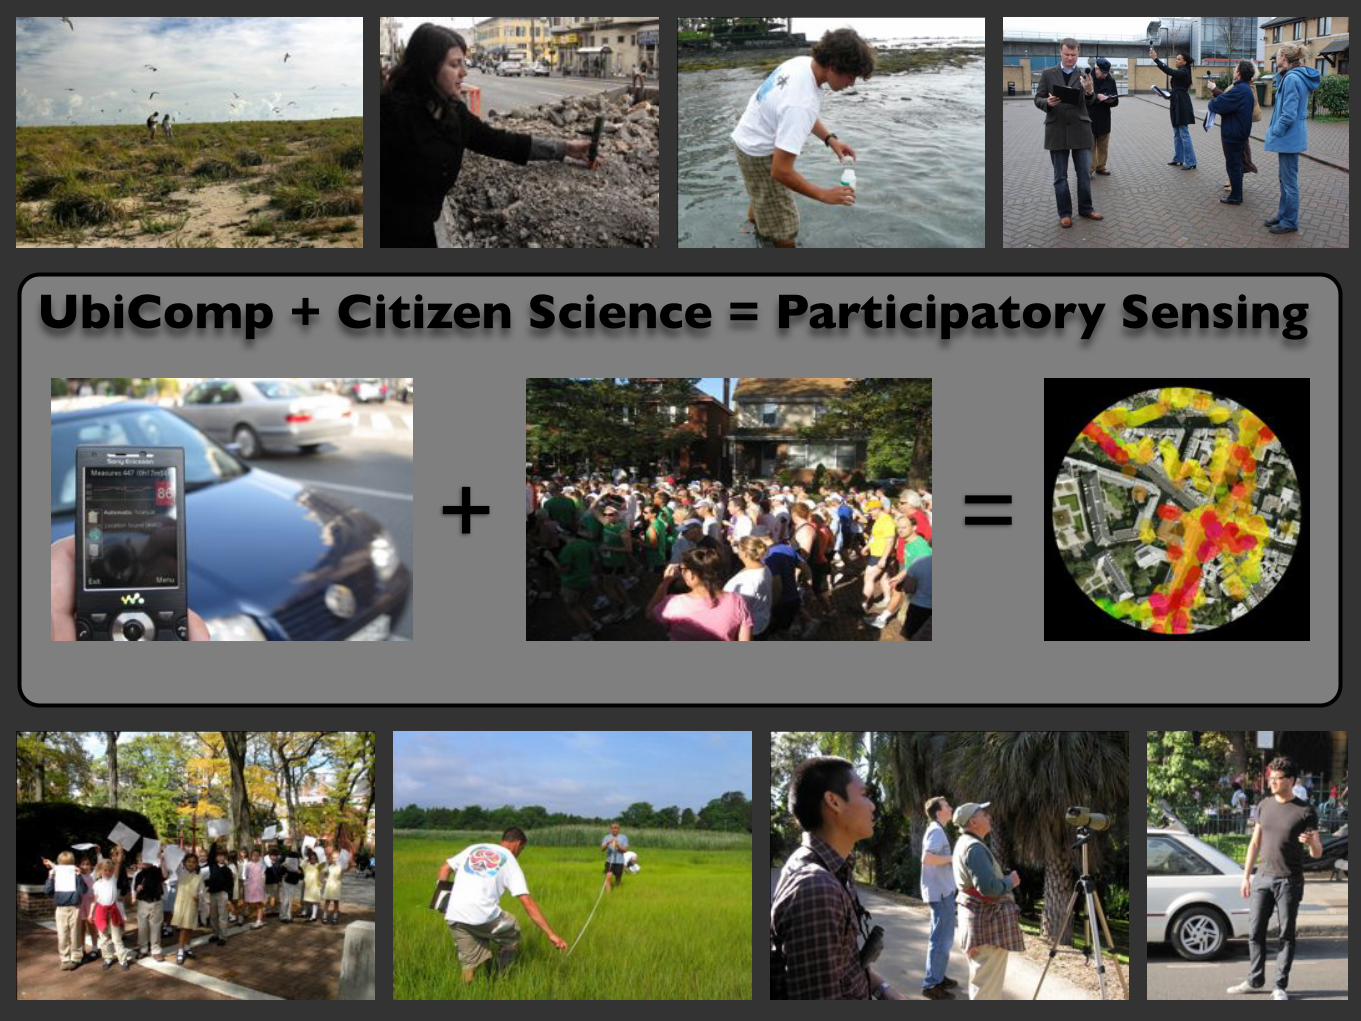
UbiComp + Citizen Science = Participatory Sensing
+ =
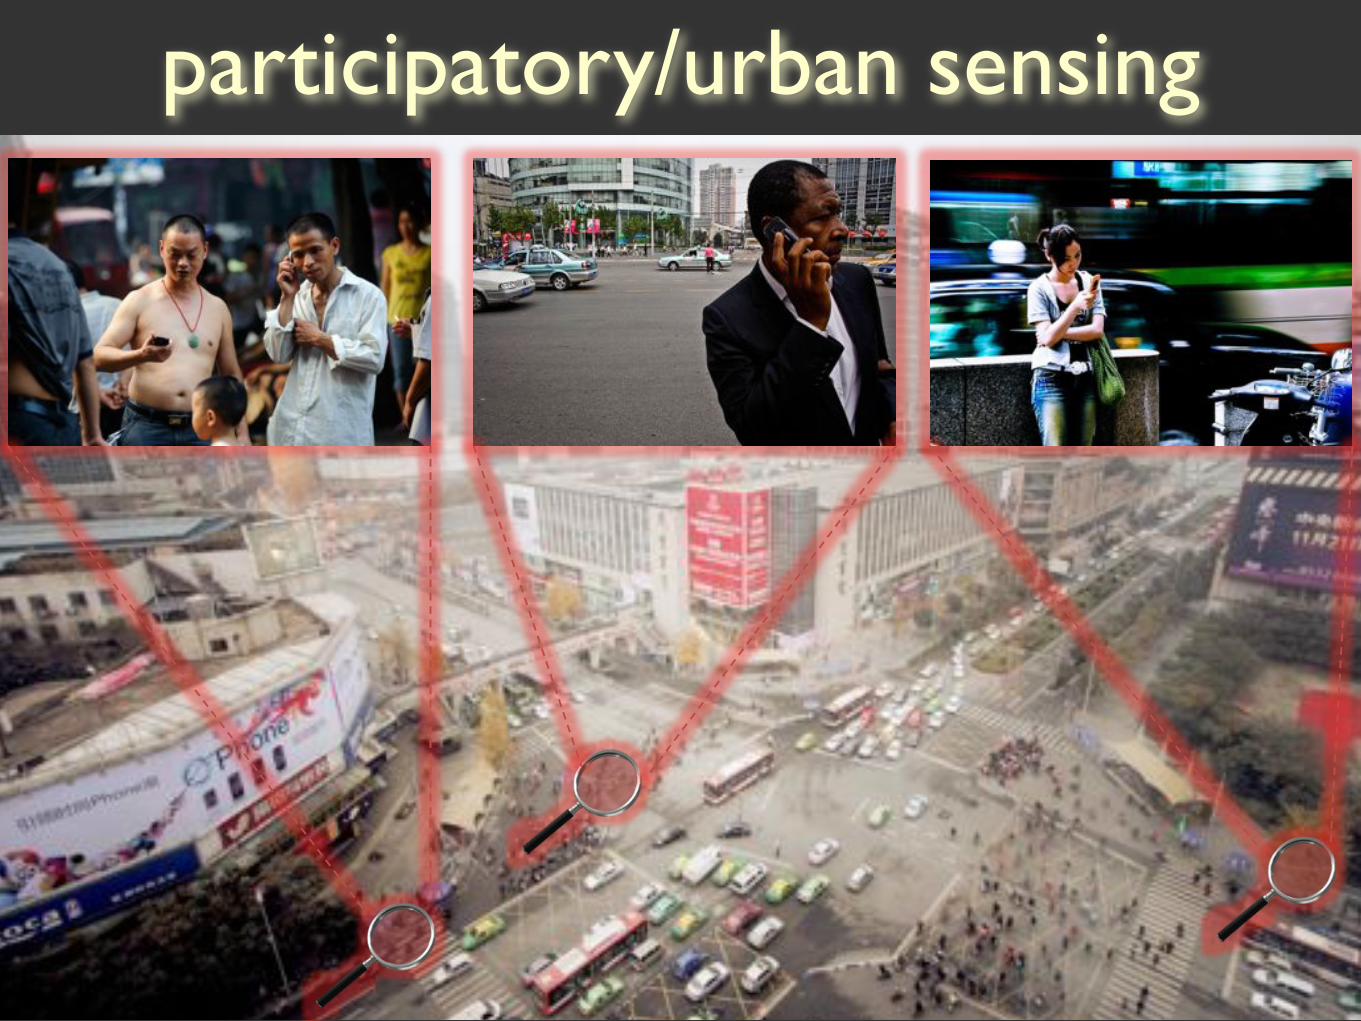
participatory sensingparticipatory/urban sensing
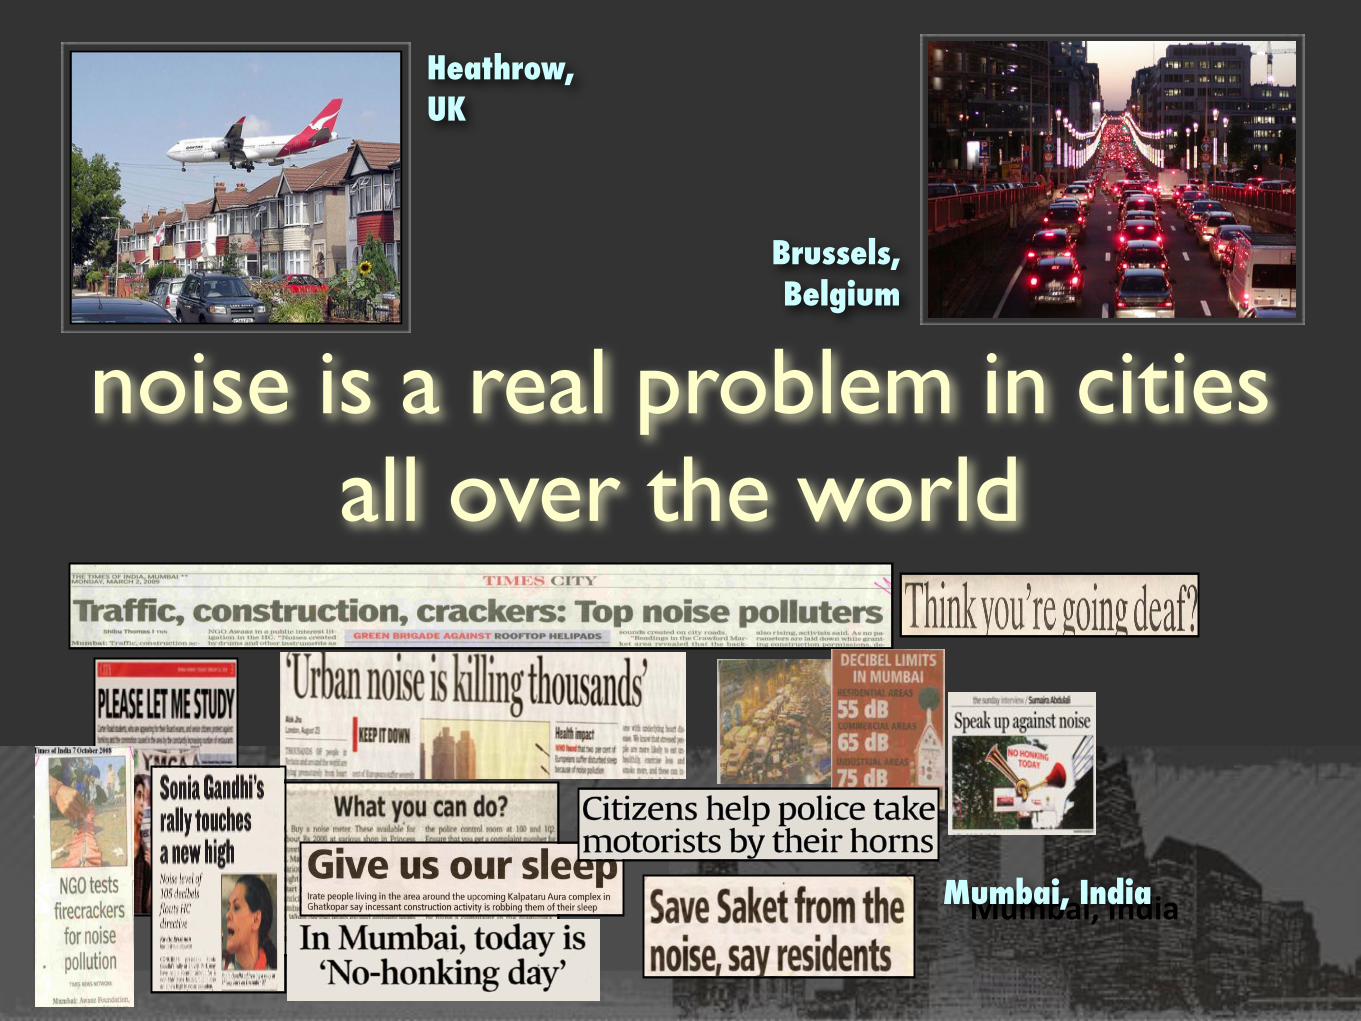
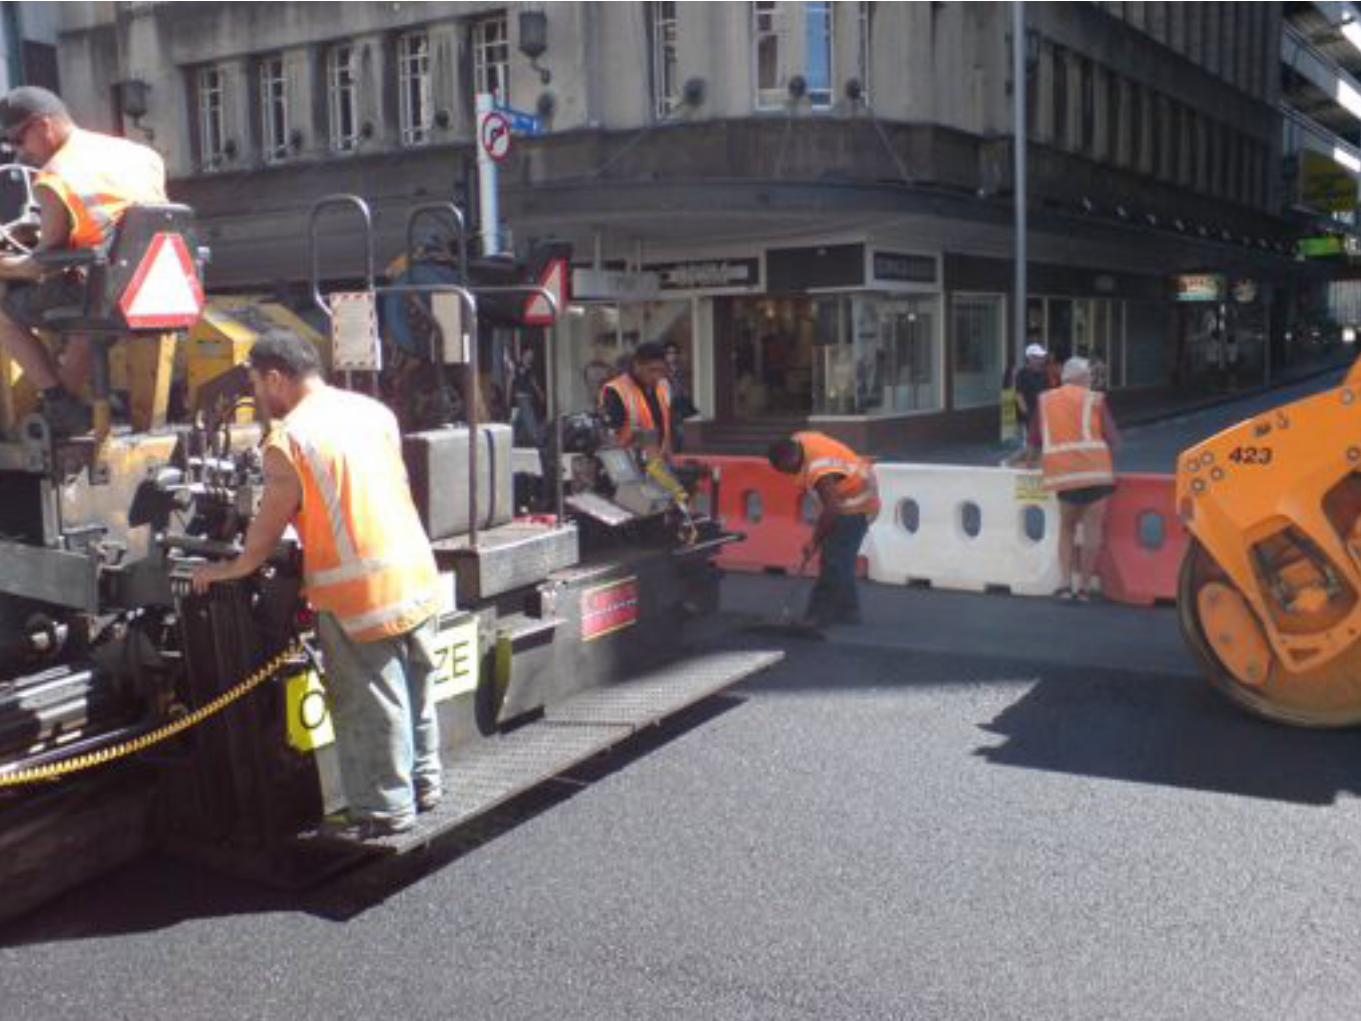
noise is a real problem in cities all over the world
!"#$%&'()*+&%(Mumbai, India
Heathrow, UK
Brussels, Belgium
7
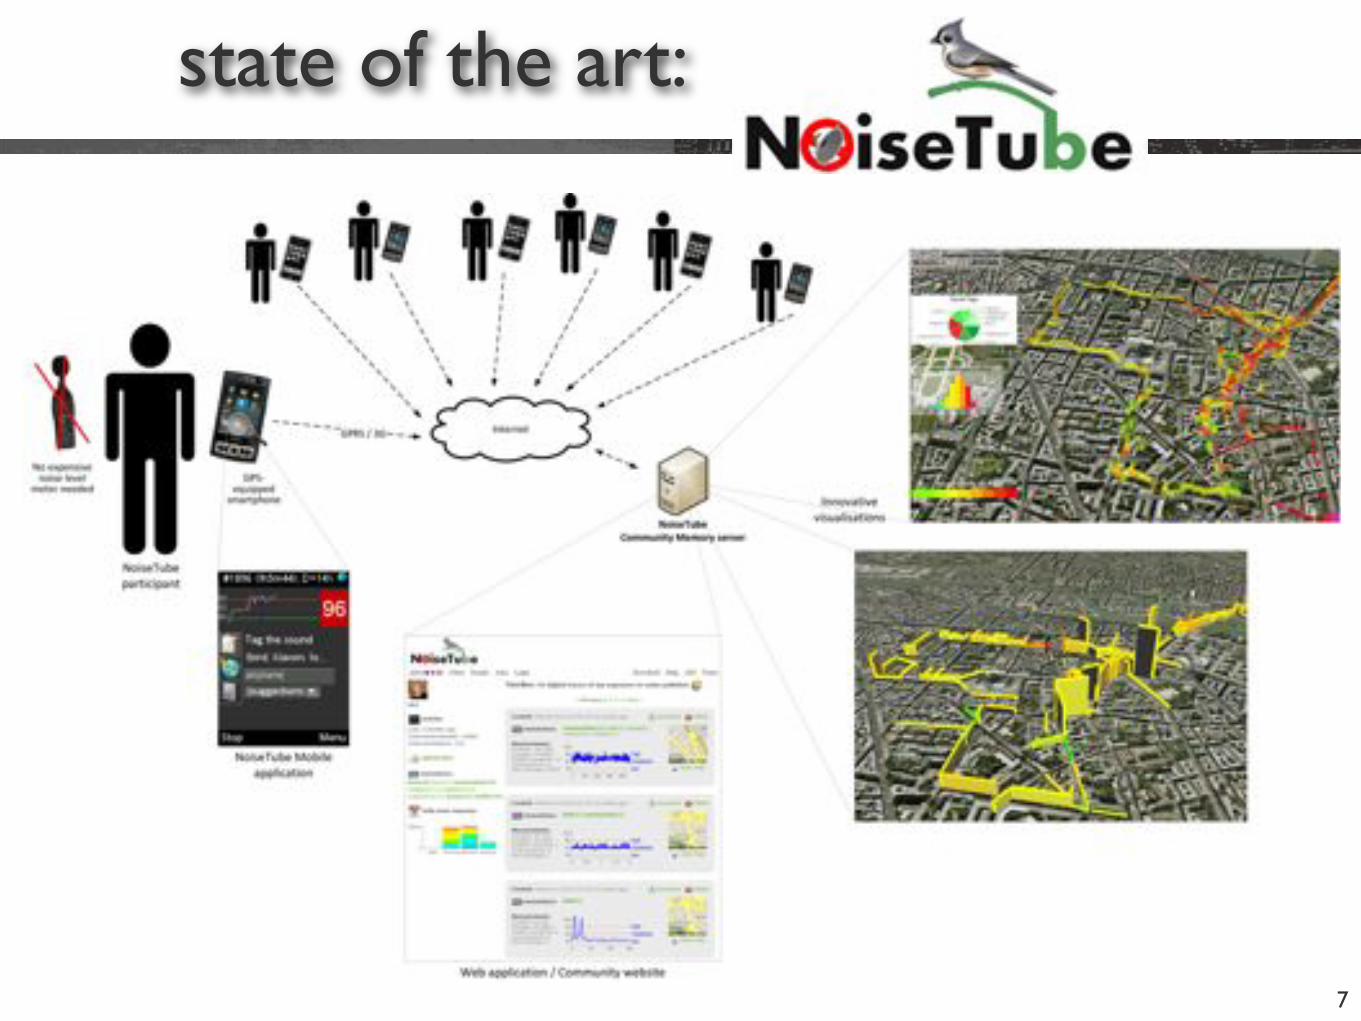
state of the art:
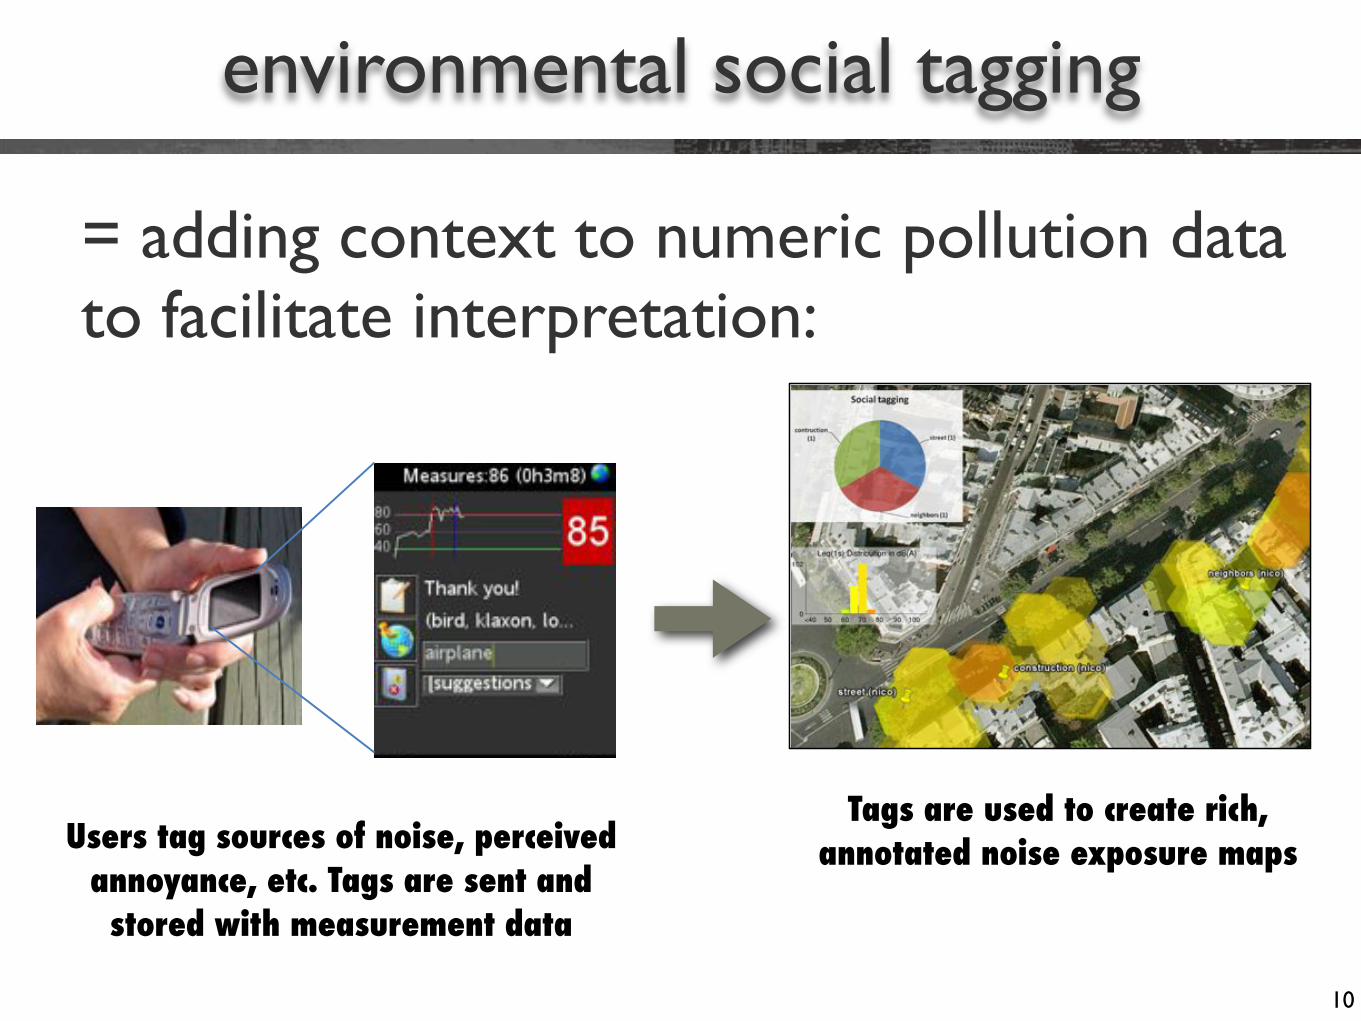
= adding context to numeric pollution data to facilitate interpretation:
environmental social tagging
10
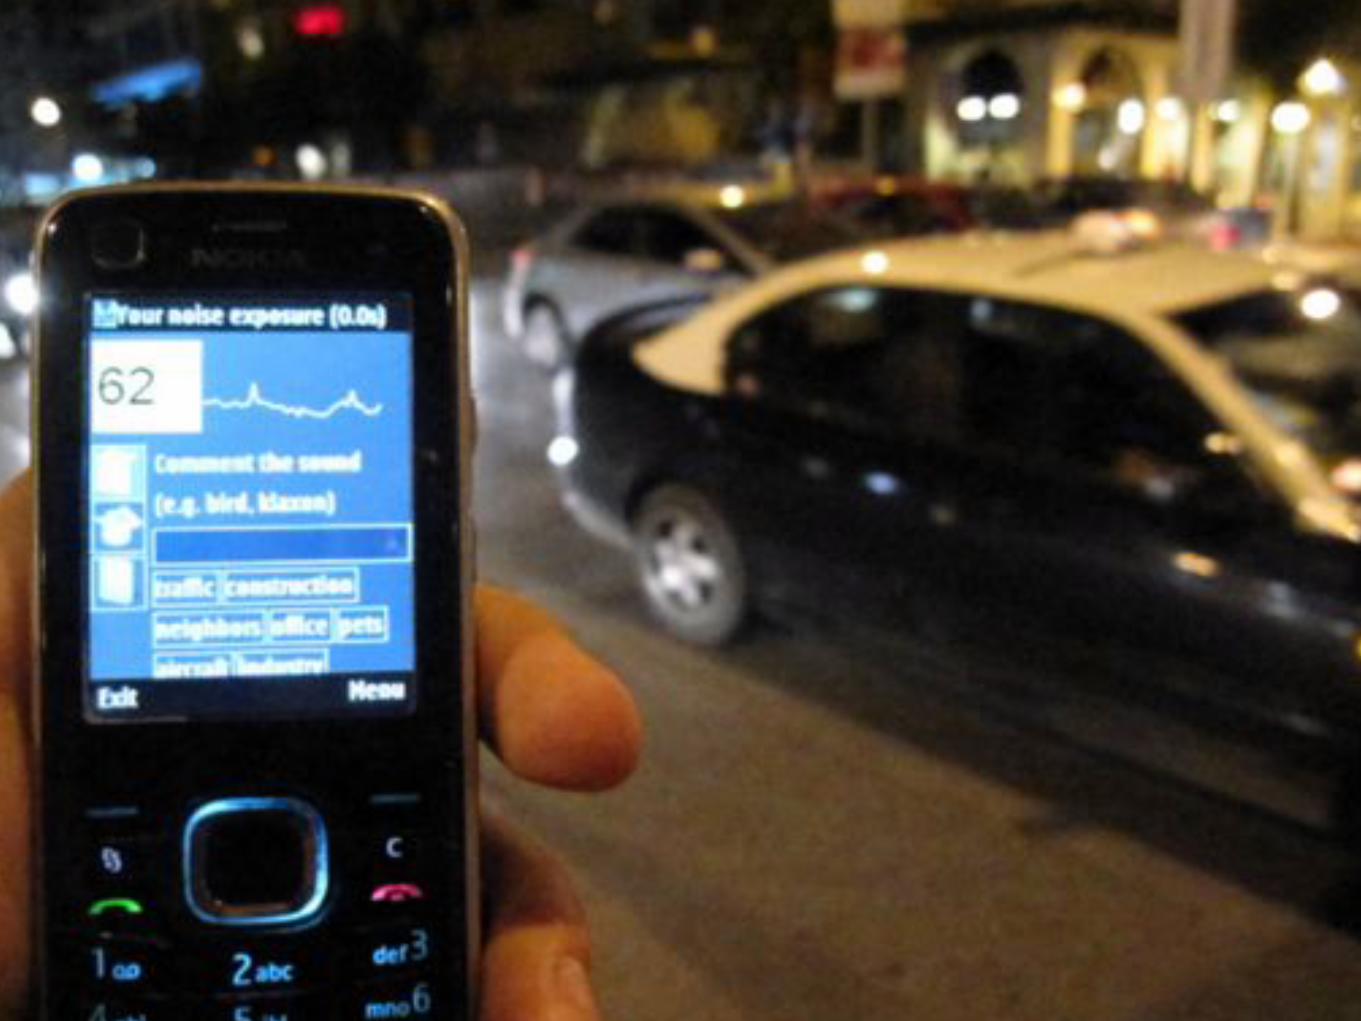
Users tag sources of noise, perceived annoyance, etc. Tags are sent and stored with measurement data
Tags are used to create rich, annotated noise exposure maps
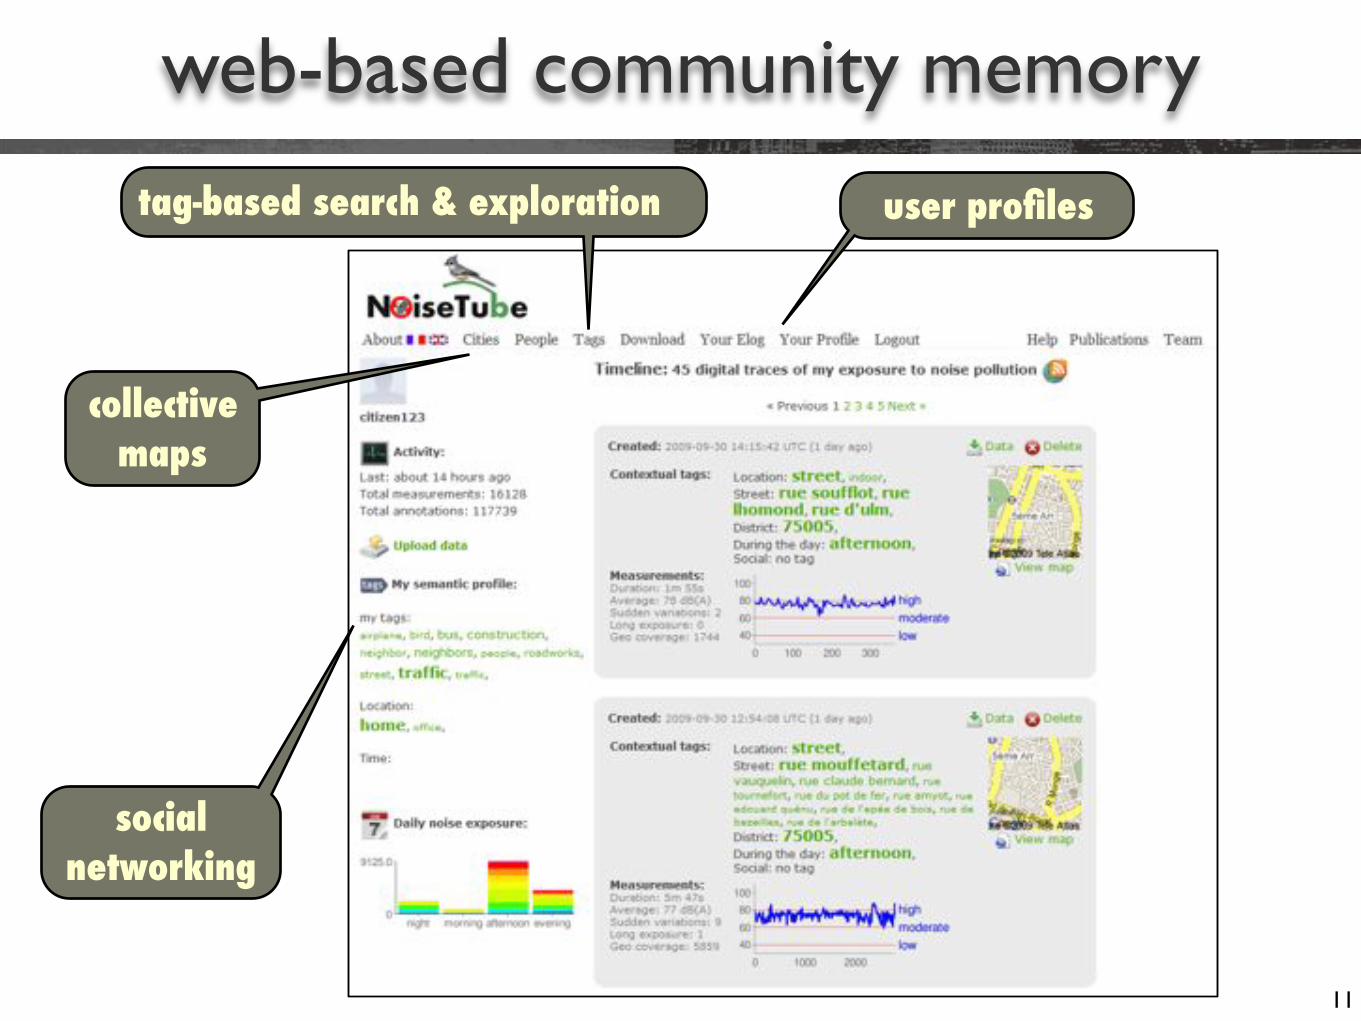
web-based community memory
11
user profiles
social networking
collective maps
tag-based search & exploration
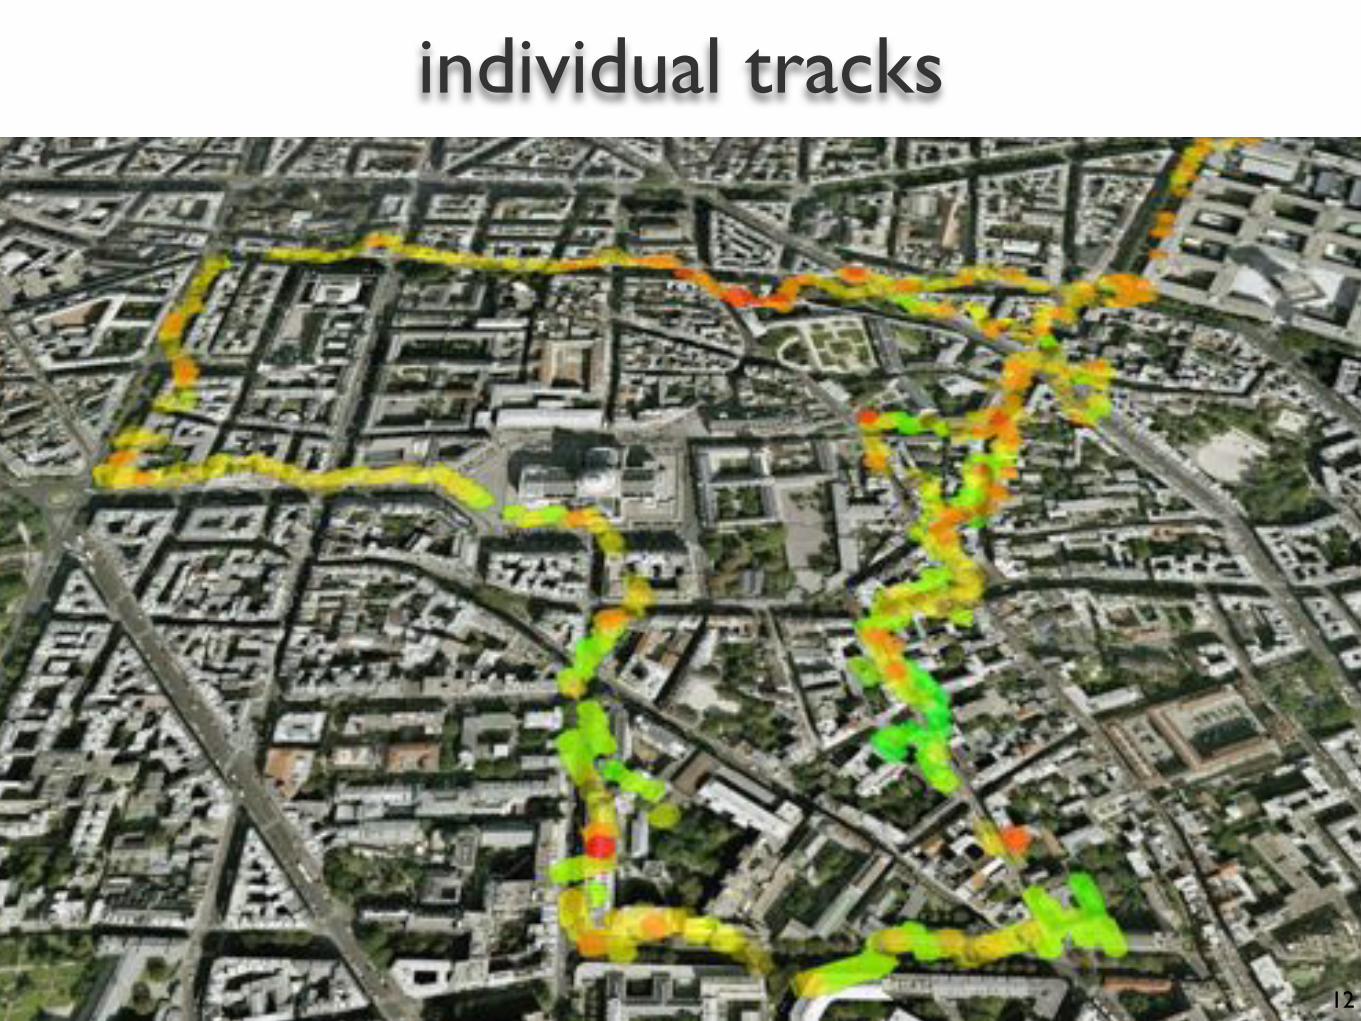
individual tracks
12
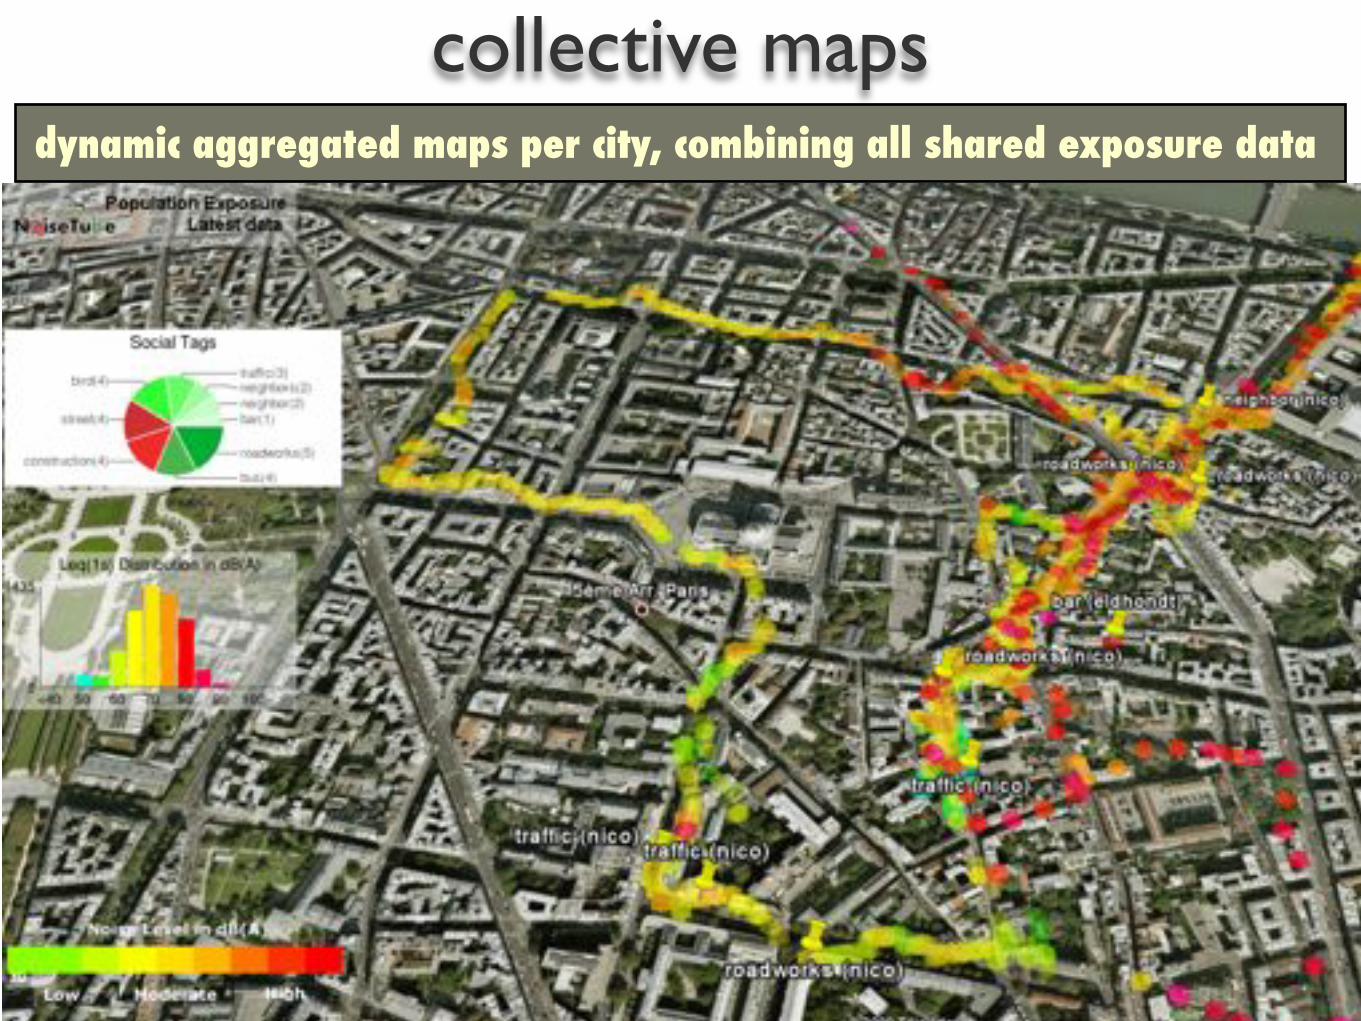
dynamic aggregated maps per city, combining all shared exposure data
collective maps

finding & motivating users
14
• Individuals• personal awareness
• worldwide & universal?
• so far: limited/scattered results
• Coordination is needed!.. and also necessary from scientific point of view (validation)
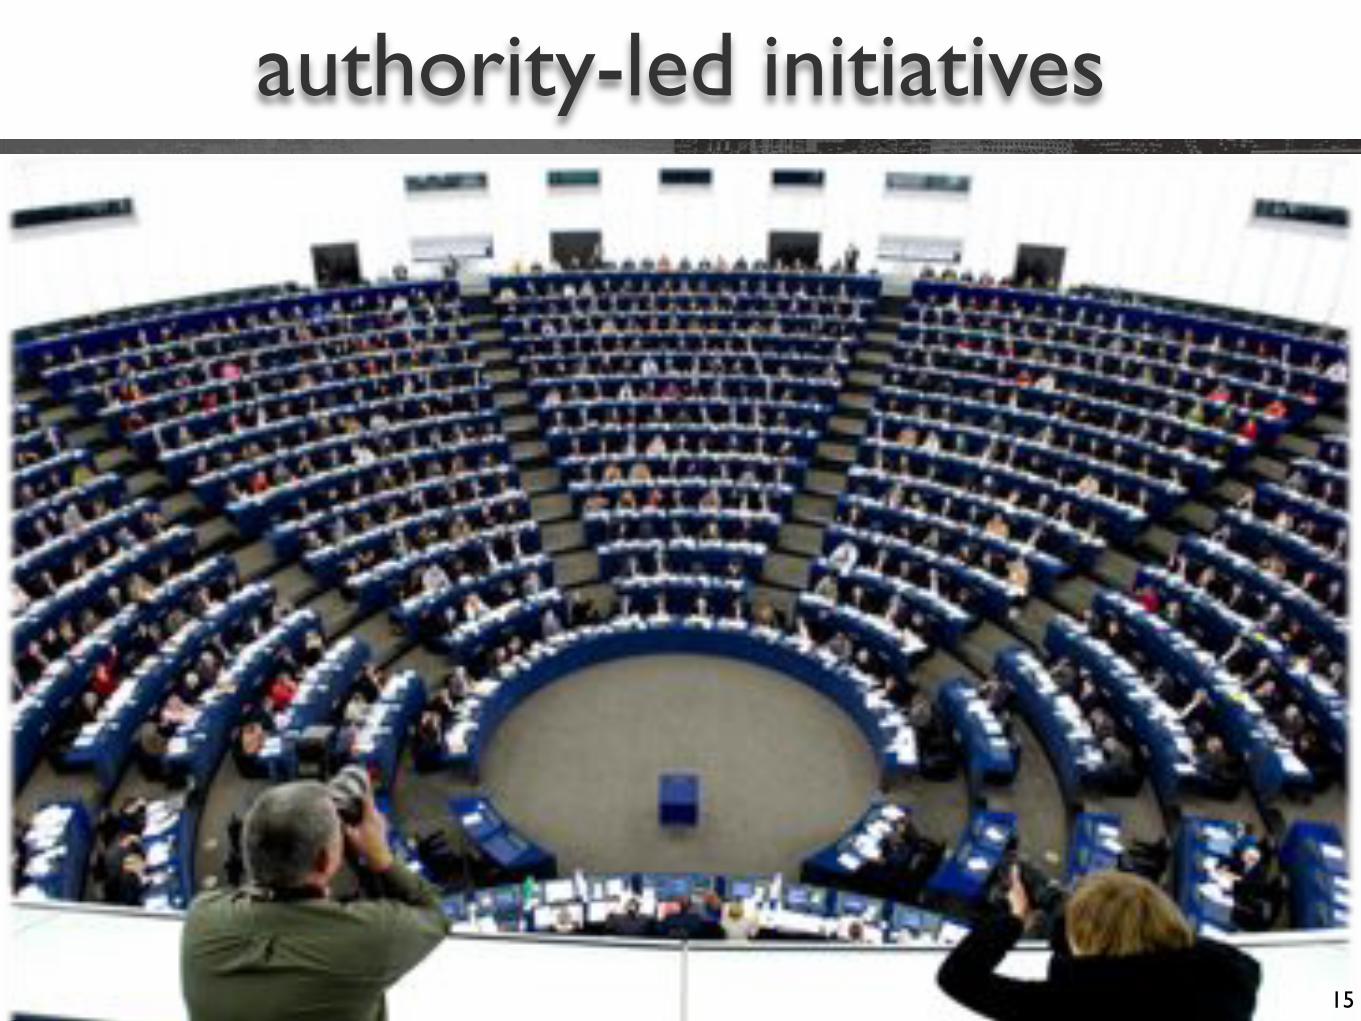
authority-led initiatives
15
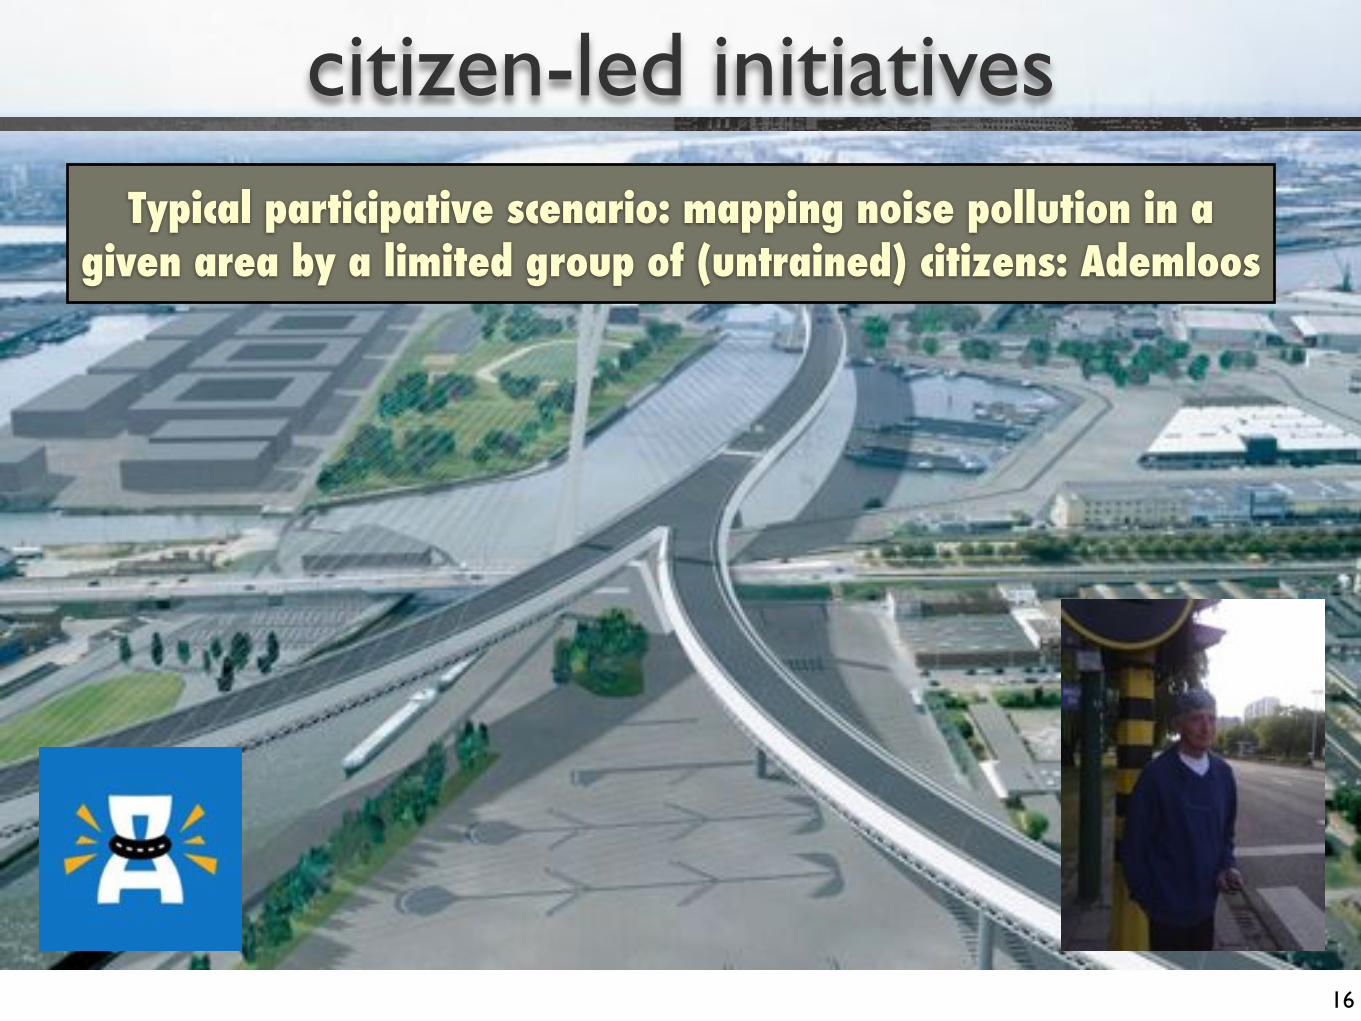
citizen-led initiatives
16
Typical participative scenario: mapping noise pollution in a given area by a limited group of (untrained) citizens: Ademloos
research question
17
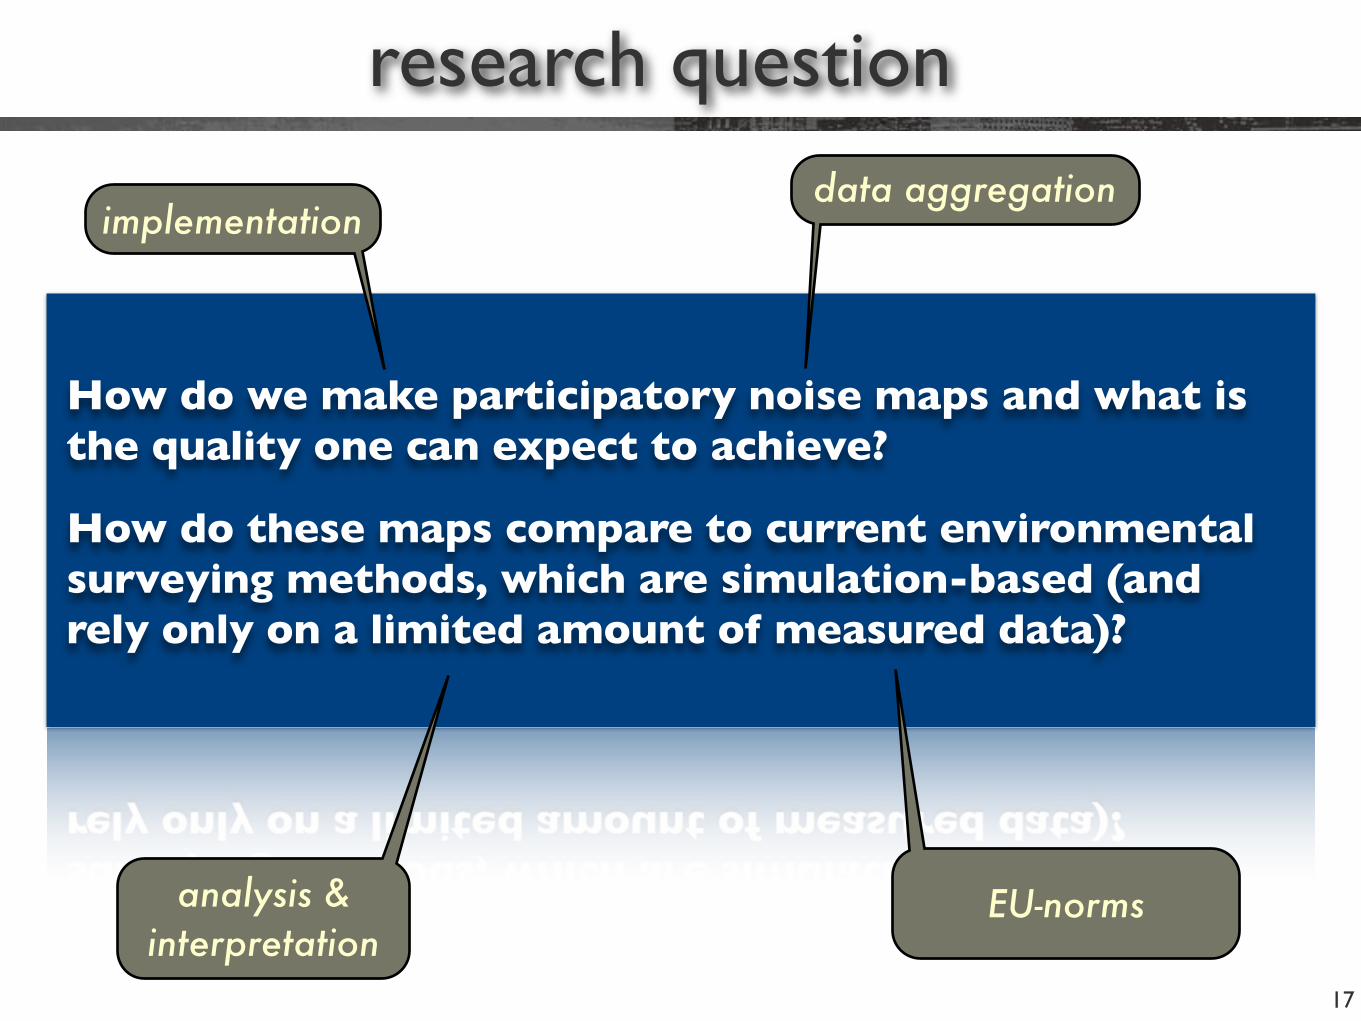
How do we make participatory noise maps and what is the quality one can expect to achieve?
How do these maps compare to current environmental surveying methods, which are simulation-based (and rely only on a limited amount of measured data)?
implementation
analysis & interpretation
EU-norms
data aggregation
state of the art
18
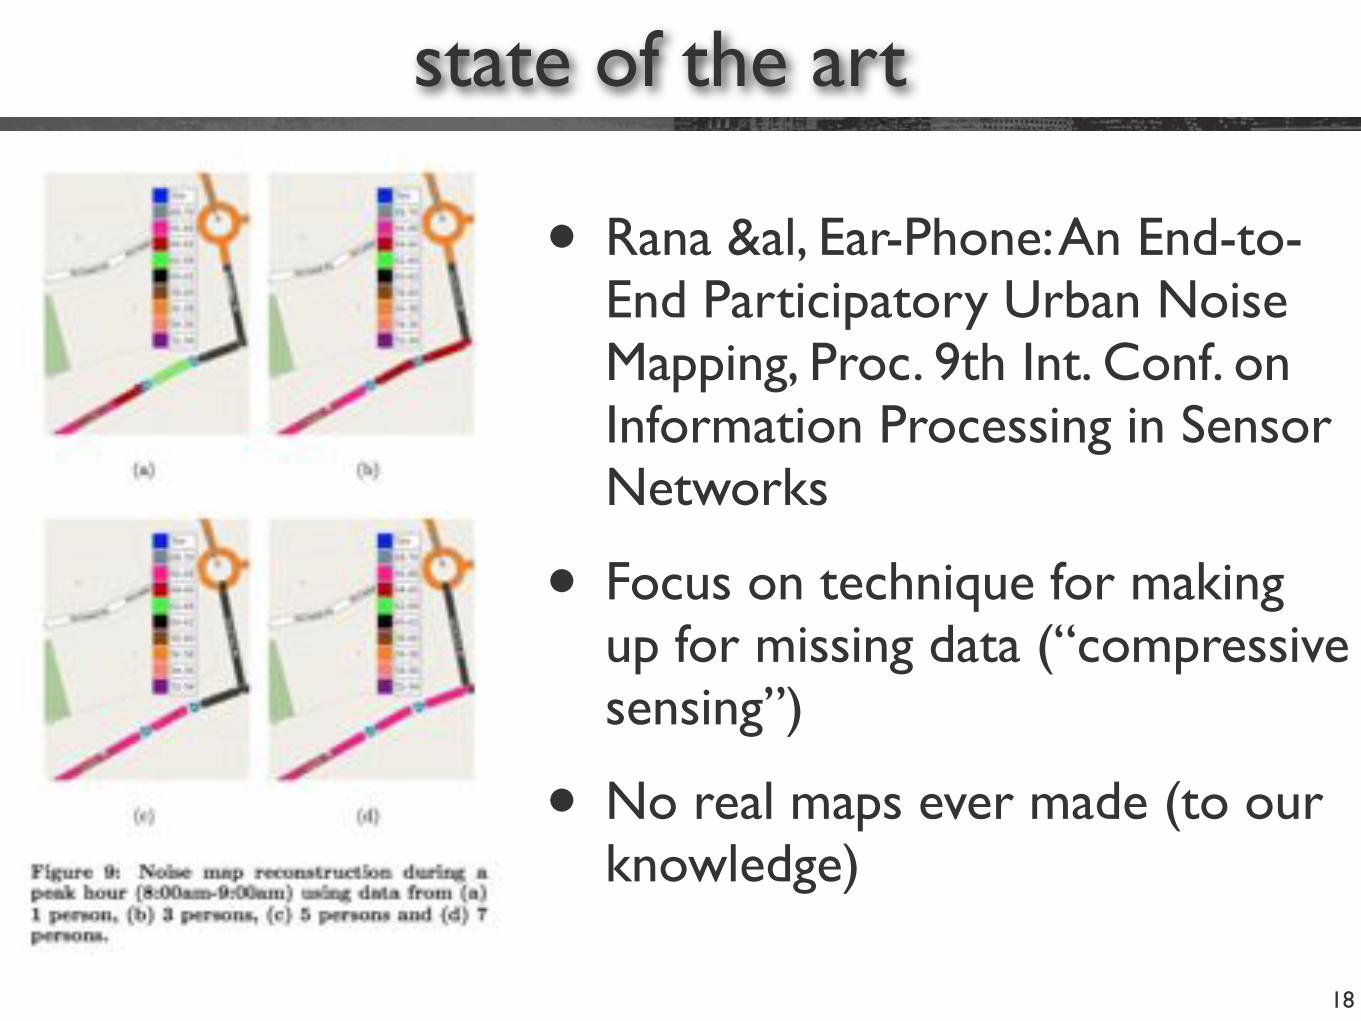
• Rana &al, Ear-Phone: An End-to-End Participatory Urban Noise Mapping, Proc. 9th Int. Conf. on Information Processing in Sensor Networks
• Focus on technique for making up for missing data (“compressive sensing”)
• No real maps ever made (to our knowledge)
sound level measurement
19
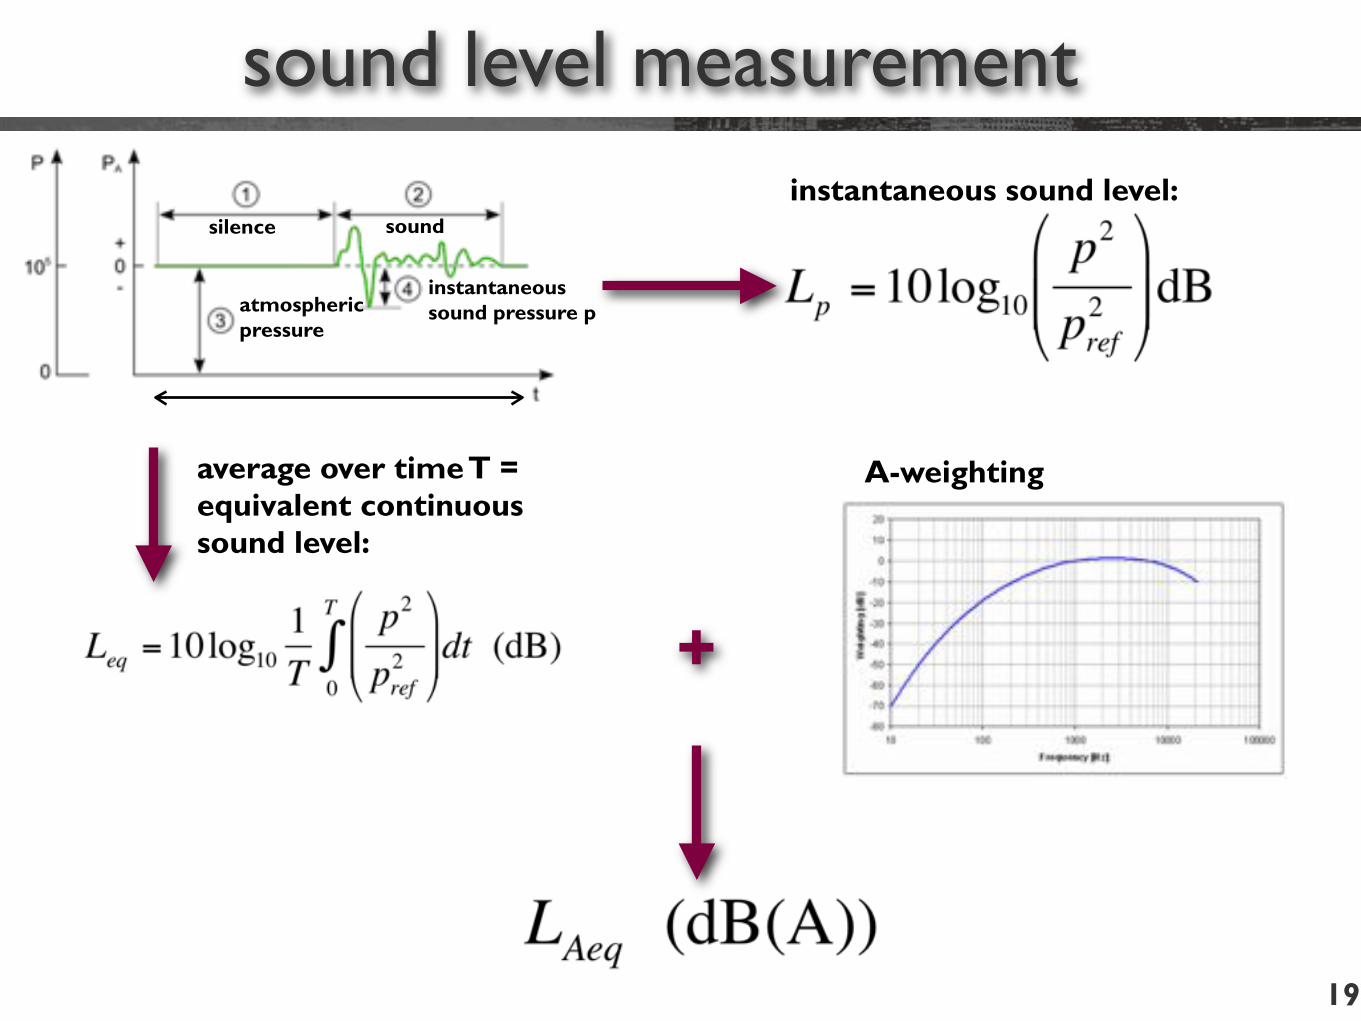
silence sound
atmospheric pressure
instantaneous sound pressure p
instantaneous sound level:
average over time T =equivalent continuous sound level:
+
A-weighting
EU norms
20
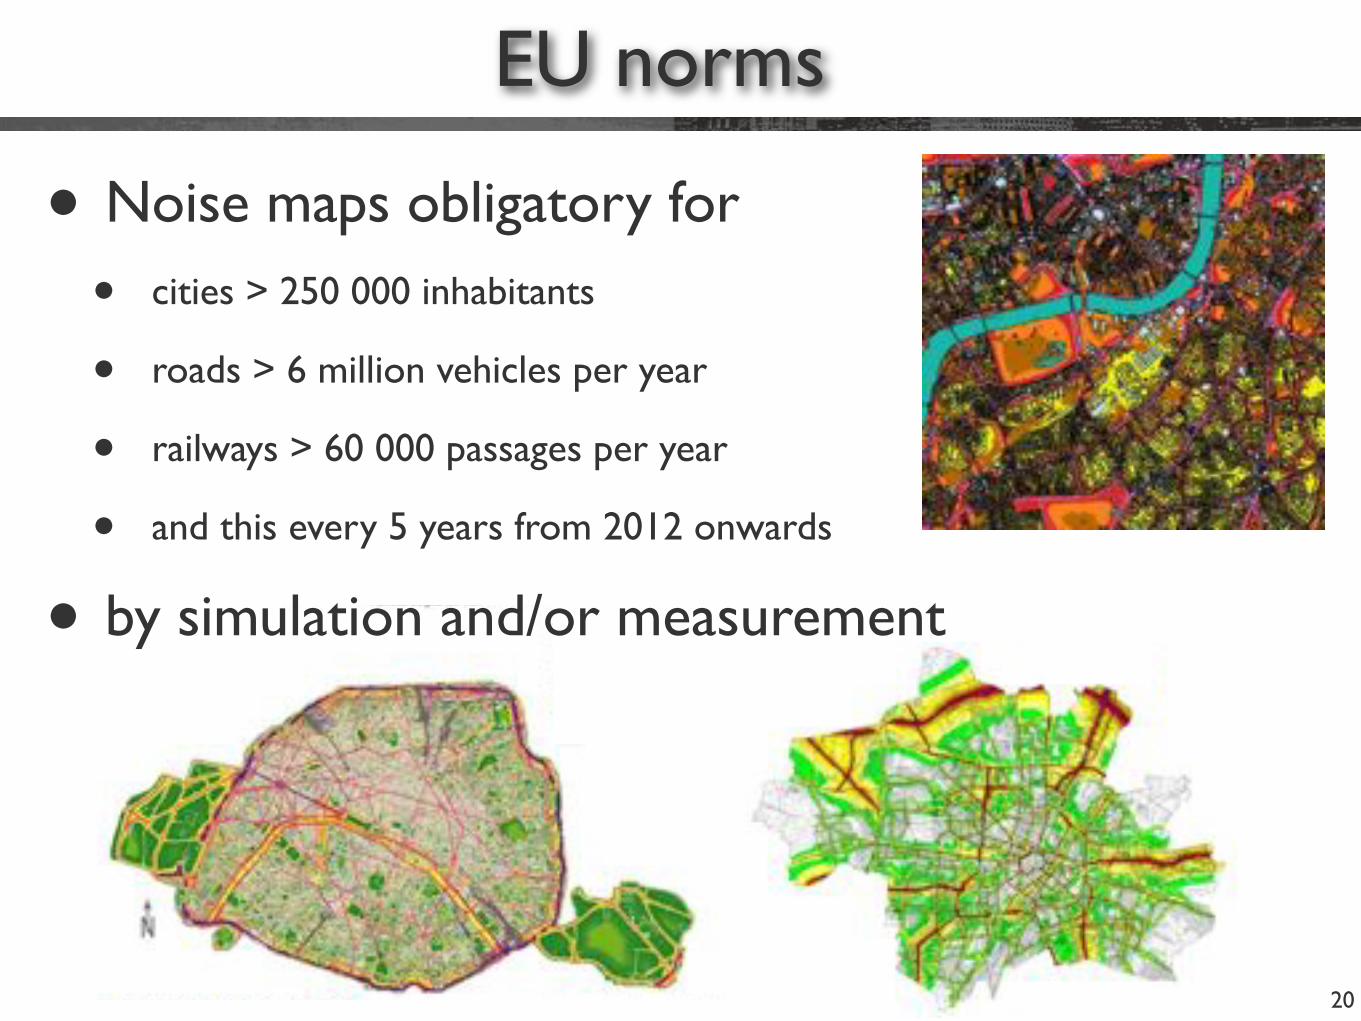
• Noise maps obligatory for
• cities > 250 000 inhabitants
• roads > 6 million vehicles per year
• railways > 60 000 passages per year
• and this every 5 years from 2012 onwards
• by simulation and/or measurement
EU norms
21
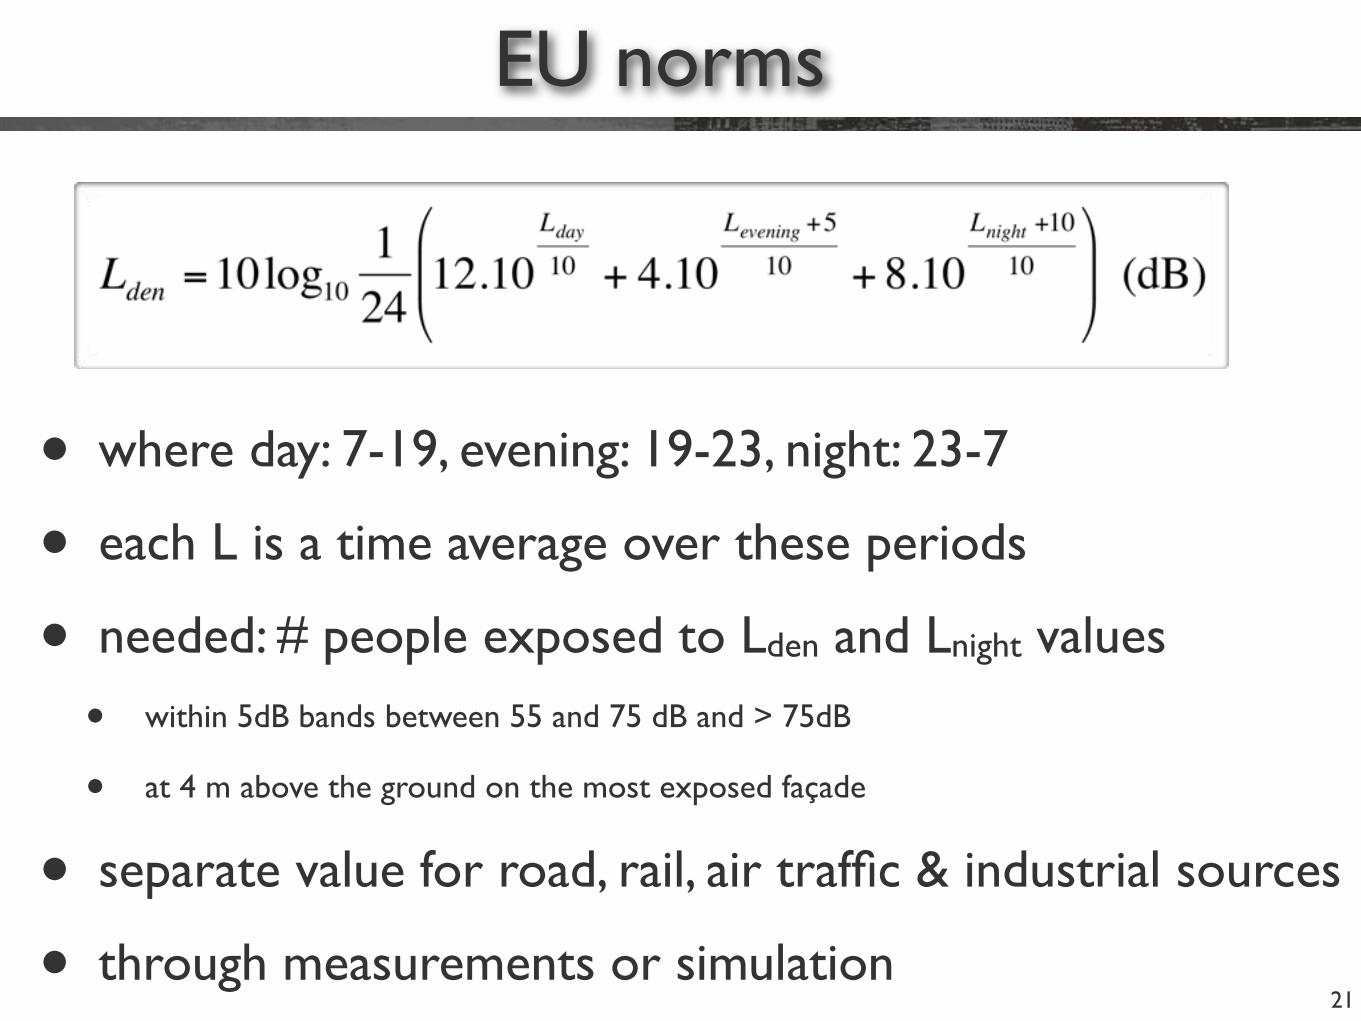
• where day: 7-19, evening: 19-23, night: 23-7
• each L is a time average over these periods
• needed: # people exposed to Lden and Lnight values
• within 5dB bands between 55 and 75 dB and > 75dB
• at 4 m above the ground on the most exposed façade
• separate value for road, rail, air traffic & industrial sources
• through measurements or simulation
MU
LTI-
EX
PO
SIT
ION
- 2
006
MU
LTI-
BL
OO
TS
TE
LL
ING
- 2
006
MU
LTI-
EX
PO
SIT
ION
- 2
006
MU
LTI-
BL
OO
TS
TE
LL
ING
- 2
006
0 21 km
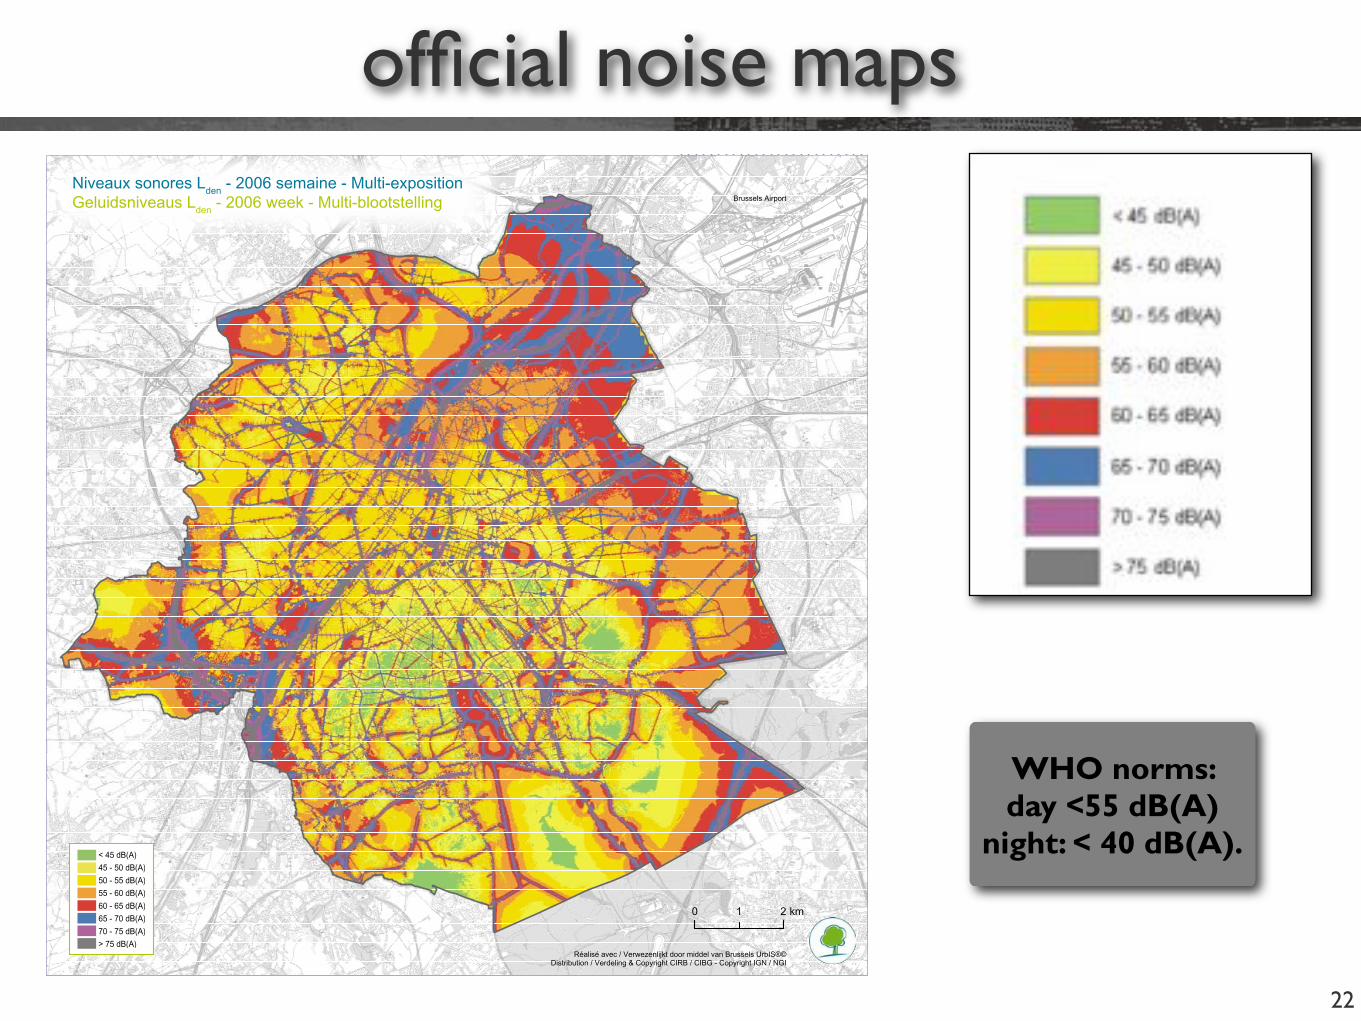
Niveaux sonores Lden - 2006 semaine - Multi-expositionGeluidsniveaus Lden - 2006 week - Multi-blootstelling
Réalisé avec / Verwezenlijkt door middel van Brussels UrbIS®© Distribution / Verdeling & Copyright CIRB / CIBG - Copyright IGN / NGI
Brussels Airport
Les impacts cumulés des transports provoquent un niveau sonore Lden supérieur à 45 dB(A) sur la grande majorité du territoire, à l’exception du Sud de la Région.
Au Nord, les nuisances sonores sont principalement causées par les routes aériennes au départ de la piste 25R, les lignes ferro-viaires depuis la gare du Nord vers la gare de Schaerbeek For-mation et les axes de pénétration depuis le Ring (A12, avenue de Vilvoorde, boulevard Léopold III). A l’Est, les routes aériennes dites du tournant gauche et, dans une moindre mesure, le Ring, influencent les résultats. A l’Ouest, les sources de bruit sont les lignes de train 28, 50, 50A, 60 et 96, le Ring et les pénétrantes routières (route de Lennik, boulevard Henri Simonet). Potentielle-ment 15 % de la population bruxelloise se situe, toutes sources de bruit confondues, au-dessus d’un Lden de 65 dB(A).
Pour un Lden supérieur à 55 dB(A), le bruit routier est prédominant, suivi par les bruits des trafics aérien et ferroviaire. Les tramways et métros sont minoritaires. En comparant les tableaux par source, il est intéressant de souligner que le seuil de gêne diurne Ld de 55 dB(A) fixé par l’OMS est franchi pour 39 % de la population en raison du seul bruit routier, pour 6 % en raison du seul bruit des avions et pour 2 % en raison du seul bruit des trains. Le trafic rou-tier expose à lui seul en Lden 10 % de la population à un niveau de bruit supérieur à 65 dB(A). C’est dix fois plus que pour le bruit lié au trafic ferroviaire (1 %). Le bruit du trafic aérien n’intervient quasi plus à partir de ce niveau sonore.
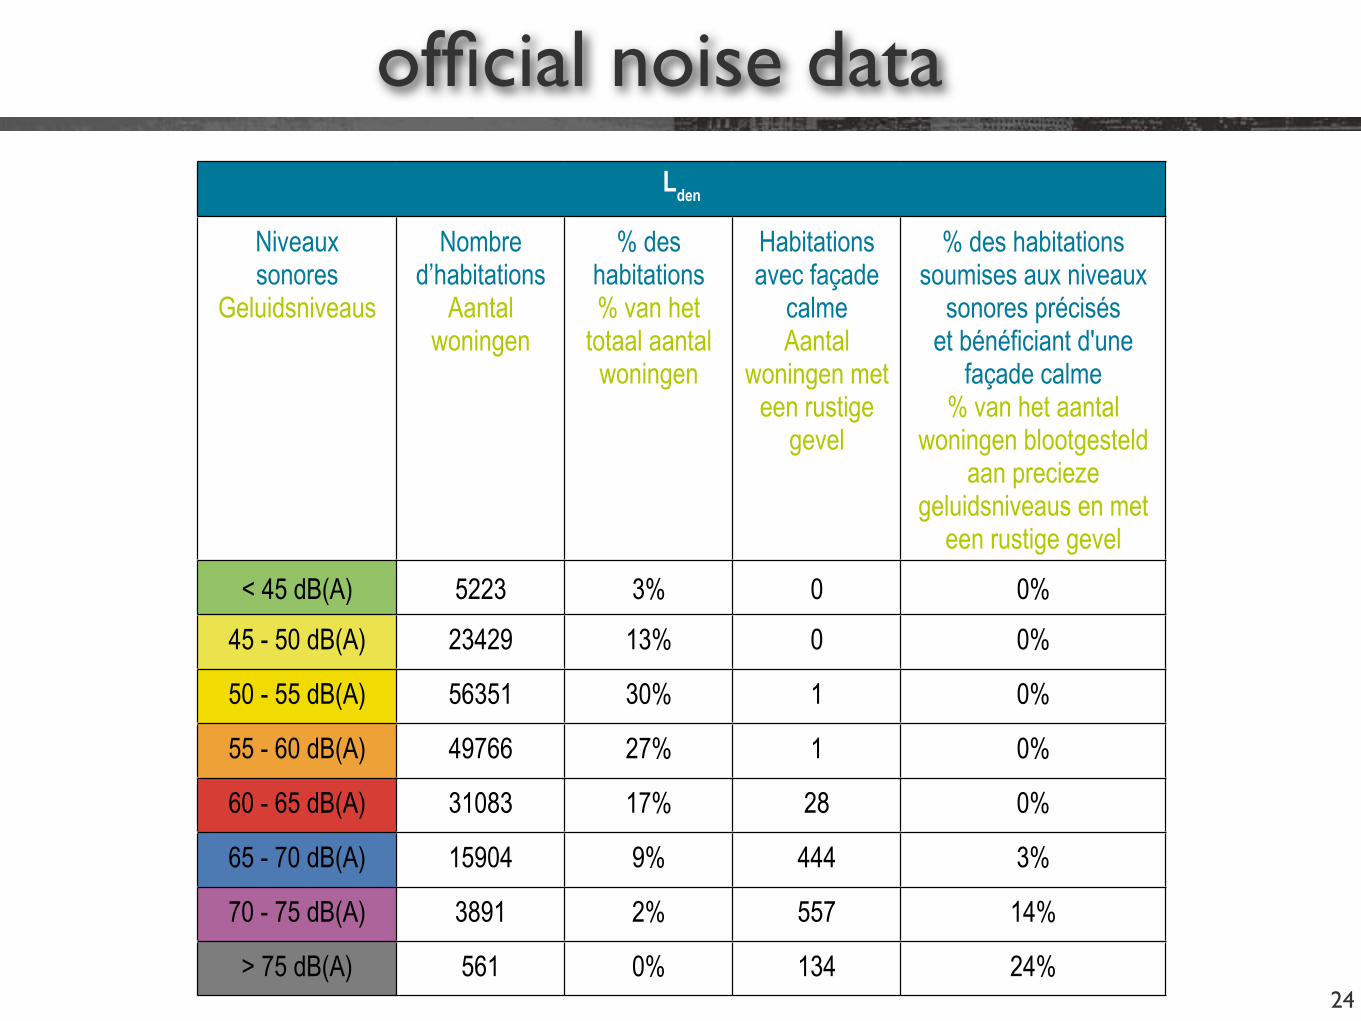
Dans les 11 % des habitations (20.356 habitations) exposés à un niveau de bruit au-delà du Lden de 65 dB(A), seulement 6 % bénéficient d’une façade calme. 25 % des habitations soumises à des niveaux Lden supérieurs à 65 dB(A) ont une façade calme vis-à-vis du bruit routier, et 18 % vis-à-vis du bruit ferroviaire, mais ce chiffre tombe à 6 % en multi-exposition. 54 % des habitations (101.205 habitations) sont exposées à un niveau de bruit au-delà du Lden de 55 dB(A).
Les cartes de multi-exposition Lden cumulent les sources de bruit (routier, tramway et métro aérien, ferroviaire et aérien) et illustrent, tous modes de transports confondus, la gêne sonore globale durant la semaine. La méthode de calcul consiste à ad-ditionner les énergies acoustiques des différentes sources en un point donné.
De Lden multi-blootstellingskaarten cumuleren de bronnen van geluidshinder (weg-, tram-, metro-, spoorweg- en luchtverkeer). Ze tonen de algemene geluidshinder gedurende de week van-wege alle vervoersmethoden. Bij de berekening werd de akoes-tische energie van de verschillende bronnen opgeteld in een bepaald punt.
In het overgrote deel van het Gewest (behalve in het zuiden) leidt de gecumuleerde impact van de verschillende vervoersmethoden tot een Lden-geluidsniveau hoger dan 45 dB(A).
In het noorden wordt de geluidshinder voornamelijk veroorzaakt door het luchtverkeer vertrekkende van de baan 25R, de spoorweglijnen vanuit het Noordstation naar het station Schaarbeek Vorming en de in-valswegen van de Ring (A12, de Vilvoordelaan en de Leopold-III-laan).In het oosten worden de resultaten beïnvloed door de vliegroutes die naar links afdraaien en, in minder mate, de Ring. In het westen zijn de belangrijkste bronnen voor geluidshinder de spoorlijnen 28, 50, 50A, 60 en 96, de Ring en de invalswegen (de Lenniksebaan en de Henri-Simonetlaan). Potentieel 15 % van de Brusselse bevol-king wordt blootgesteld aan een Lden-waarde hoger dan 65 dB(A) van-wege alle bronnen van geluidshinder.
Voor Lden-waarden hoger dan 55 dB(A) weegt vooral het wegverkeer door, gevolgd door het lucht- en spoorwegverkeer. De hinder van tram- en metrotoestellen is minder relevant. Na vergelijking van de tabellen voor elke bron valt het op dat 39 % van de bevolking wordt blootgesteld aan een Ld-waarde van 55 dB(A) (de WGO-drempelwaarde) vanwege het wegverkeer. Voor geluidshinder vanwege het luchtverkeer en het spoor-wegverkeer geldt dit voor respectievelijk 6 % en 2 % van de bevolking. 10 % van de bevolking wordt blootgesteld aan een Lden-waarde hoger dan 65 dB(A) vanwege het wegverkeer. Dat is tien keer meer dan bij het spoorwegverkeer (1 %). Het luchtverkeer heeft vanaf dit geluidsniveau vrijwel geen invloed meer.
11 % van de woningen (20.356 woningen) wordt blootgesteld aan een geluidsniveau hoger dan Lden = 65 dB(A). Daarvan beschikt slechts 6 % over een rustige gevel. Van de woningen die worden blootgesteld aan een Lden-waarde hoger dan 65 dB(A), heeft 25 % een rustige gevel ten opzichte van het lawaai van het wegverkeer en 18 % t.o.v. het spoorwegverkeer. Dat cijfer valt terug tot 6 % bij blootstel-ling aan meerdere bronnen van geluidshinder. 54 % van de woningen (101.205 woningen) wordt blootgesteld aan een geluidsniveau hoger dan Lden = 55 dB(A).
Trafic routierWegverkeer
Trafic des trams et métrosVerkeer van trams en metros
Trafic ferroviaireSpoorwegverkeer
Trafic aérienLuchtverkeer
Multi-expositionMulti-blootstelling
Lden Lden Lden Lden Lden
Niveaux sonoresGeluids-niveaus
Nombre d’habitants
Aantal inwoners
% de population% van de bevolking
Nombre d’habitants
Aantal inwoners
% de population% van de bevolking
Nombre d’habitants
Aantal inwoners
% de population% van de bevolking
Nombre d’habitants
Aantal inwoners
% de population% van de bevolking
Nombre d’habitants
Aantal inwoners
% de population% van de bevolking
< 55 dB(A) 569800 57% 991100 100% 953600 96% 855900 87% 364500 37%
55 - 60 dB(A) 173900 18% 1200 0% 18300 2% 106700 11% 268200 27%
60 - 65 dB(A) 141900 14% 0 0% 10500 1% 14800 2% 209600 21%
65 - 70 dB(A) 81600 8% 0 0% 6000 1% 1800 0% 116800 12%
70 - 75 dB(A) 22600 2% 0 0% 3400 0% 0 0% 29900 3%
> 75 dB(A) 2400 0% 0 0% 500 0% 0 0% 3400 0%
Lden
Niveaux sonores
Geluidsniveaus
Nombre d’habitations
Aantal woningen
% des habitations% van het
totaal aantal woningen
Habitations avec façade
calmeAantal
woningen met een rustige
gevel
% des habitations soumises aux niveaux
sonores précisés et bénéficiant d'une
façade calme% van het aantal
woningen blootgesteld aan precieze
geluidsniveaus en met een rustige gevel
< 45 dB(A) 5223 3% 0 0%
45 - 50 dB(A) 23429 13% 0 0%
50 - 55 dB(A) 56351 30% 1 0%
55 - 60 dB(A) 49766 27% 1 0%
60 - 65 dB(A) 31083 17% 28 0%
65 - 70 dB(A) 15904 9% 444 3%
70 - 75 dB(A) 3891 2% 557 14%
> 75 dB(A) 561 0% 134 24%
22
official noise maps
WHO norms: day <55 dB(A)
night: < 40 dB(A).
official noise maps
23
MU
LTI-
EX
PO
SIT
ION
- 2
006
MU
LTI-
BL
OO
TS
TE
LL
ING
- 2
006
MU
LTI-
EX
PO
SIT
ION
- 2
006
MU
LTI-
BL
OO
TS
TE
LL
ING
- 2
006
0 21 km
Niveaux sonores Lden - 2006 semaine - Multi-expositionGeluidsniveaus Lden - 2006 week - Multi-blootstelling
Réalisé avec / Verwezenlijkt door middel van Brussels UrbIS®© Distribution / Verdeling & Copyright CIRB / CIBG - Copyright IGN / NGI
Brussels Airport
Les impacts cumulés des transports provoquent un niveau sonore Lden supérieur à 45 dB(A) sur la grande majorité du territoire, à l’exception du Sud de la Région.
Au Nord, les nuisances sonores sont principalement causées par les routes aériennes au départ de la piste 25R, les lignes ferro-viaires depuis la gare du Nord vers la gare de Schaerbeek For-mation et les axes de pénétration depuis le Ring (A12, avenue de Vilvoorde, boulevard Léopold III). A l’Est, les routes aériennes dites du tournant gauche et, dans une moindre mesure, le Ring, influencent les résultats. A l’Ouest, les sources de bruit sont les lignes de train 28, 50, 50A, 60 et 96, le Ring et les pénétrantes routières (route de Lennik, boulevard Henri Simonet). Potentielle-ment 15 % de la population bruxelloise se situe, toutes sources de bruit confondues, au-dessus d’un Lden de 65 dB(A).
Pour un Lden supérieur à 55 dB(A), le bruit routier est prédominant, suivi par les bruits des trafics aérien et ferroviaire. Les tramways et métros sont minoritaires. En comparant les tableaux par source, il est intéressant de souligner que le seuil de gêne diurne Ld de 55 dB(A) fixé par l’OMS est franchi pour 39 % de la population en raison du seul bruit routier, pour 6 % en raison du seul bruit des avions et pour 2 % en raison du seul bruit des trains. Le trafic rou-tier expose à lui seul en Lden 10 % de la population à un niveau de bruit supérieur à 65 dB(A). C’est dix fois plus que pour le bruit lié au trafic ferroviaire (1 %). Le bruit du trafic aérien n’intervient quasi plus à partir de ce niveau sonore.
Dans les 11 % des habitations (20.356 habitations) exposés à un niveau de bruit au-delà du Lden de 65 dB(A), seulement 6 % bénéficient d’une façade calme. 25 % des habitations soumises à des niveaux Lden supérieurs à 65 dB(A) ont une façade calme vis-à-vis du bruit routier, et 18 % vis-à-vis du bruit ferroviaire, mais ce chiffre tombe à 6 % en multi-exposition. 54 % des habitations (101.205 habitations) sont exposées à un niveau de bruit au-delà du Lden de 55 dB(A).
Les cartes de multi-exposition Lden cumulent les sources de bruit (routier, tramway et métro aérien, ferroviaire et aérien) et illustrent, tous modes de transports confondus, la gêne sonore globale durant la semaine. La méthode de calcul consiste à ad-ditionner les énergies acoustiques des différentes sources en un point donné.
De Lden multi-blootstellingskaarten cumuleren de bronnen van geluidshinder (weg-, tram-, metro-, spoorweg- en luchtverkeer). Ze tonen de algemene geluidshinder gedurende de week van-wege alle vervoersmethoden. Bij de berekening werd de akoes-tische energie van de verschillende bronnen opgeteld in een bepaald punt.
In het overgrote deel van het Gewest (behalve in het zuiden) leidt de gecumuleerde impact van de verschillende vervoersmethoden tot een Lden-geluidsniveau hoger dan 45 dB(A).
In het noorden wordt de geluidshinder voornamelijk veroorzaakt door het luchtverkeer vertrekkende van de baan 25R, de spoorweglijnen vanuit het Noordstation naar het station Schaarbeek Vorming en de in-valswegen van de Ring (A12, de Vilvoordelaan en de Leopold-III-laan).In het oosten worden de resultaten beïnvloed door de vliegroutes die naar links afdraaien en, in minder mate, de Ring. In het westen zijn de belangrijkste bronnen voor geluidshinder de spoorlijnen 28, 50, 50A, 60 en 96, de Ring en de invalswegen (de Lenniksebaan en de Henri-Simonetlaan). Potentieel 15 % van de Brusselse bevol-king wordt blootgesteld aan een Lden-waarde hoger dan 65 dB(A) van-wege alle bronnen van geluidshinder.
Voor Lden-waarden hoger dan 55 dB(A) weegt vooral het wegverkeer door, gevolgd door het lucht- en spoorwegverkeer. De hinder van tram- en metrotoestellen is minder relevant. Na vergelijking van de tabellen voor elke bron valt het op dat 39 % van de bevolking wordt blootgesteld aan een Ld-waarde van 55 dB(A) (de WGO-drempelwaarde) vanwege het wegverkeer. Voor geluidshinder vanwege het luchtverkeer en het spoor-wegverkeer geldt dit voor respectievelijk 6 % en 2 % van de bevolking. 10 % van de bevolking wordt blootgesteld aan een Lden-waarde hoger dan 65 dB(A) vanwege het wegverkeer. Dat is tien keer meer dan bij het spoorwegverkeer (1 %). Het luchtverkeer heeft vanaf dit geluidsniveau vrijwel geen invloed meer.
11 % van de woningen (20.356 woningen) wordt blootgesteld aan een geluidsniveau hoger dan Lden = 65 dB(A). Daarvan beschikt slechts 6 % over een rustige gevel. Van de woningen die worden blootgesteld aan een Lden-waarde hoger dan 65 dB(A), heeft 25 % een rustige gevel ten opzichte van het lawaai van het wegverkeer en 18 % t.o.v. het spoorwegverkeer. Dat cijfer valt terug tot 6 % bij blootstel-ling aan meerdere bronnen van geluidshinder. 54 % van de woningen (101.205 woningen) wordt blootgesteld aan een geluidsniveau hoger dan Lden = 55 dB(A).
Trafic routierWegverkeer
Trafic des trams et métrosVerkeer van trams en metros
Trafic ferroviaireSpoorwegverkeer
Trafic aérienLuchtverkeer
Multi-expositionMulti-blootstelling
Lden Lden Lden Lden Lden
Niveaux sonoresGeluids-niveaus
Nombre d’habitants
Aantal inwoners
% de population% van de bevolking
Nombre d’habitants
Aantal inwoners
% de population% van de bevolking
Nombre d’habitants
Aantal inwoners
% de population% van de bevolking
Nombre d’habitants
Aantal inwoners
% de population% van de bevolking
Nombre d’habitants
Aantal inwoners
% de population% van de bevolking
< 55 dB(A) 569800 57% 991100 100% 953600 96% 855900 87% 364500 37%
55 - 60 dB(A) 173900 18% 1200 0% 18300 2% 106700 11% 268200 27%
60 - 65 dB(A) 141900 14% 0 0% 10500 1% 14800 2% 209600 21%
65 - 70 dB(A) 81600 8% 0 0% 6000 1% 1800 0% 116800 12%
70 - 75 dB(A) 22600 2% 0 0% 3400 0% 0 0% 29900 3%
> 75 dB(A) 2400 0% 0 0% 500 0% 0 0% 3400 0%
Lden
Niveaux sonores
Geluidsniveaus
Nombre d’habitations
Aantal woningen
% des habitations% van het
totaal aantal woningen
Habitations avec façade
calmeAantal
woningen met een rustige
gevel
% des habitations soumises aux niveaux
sonores précisés et bénéficiant d'une
façade calme% van het aantal
woningen blootgesteld aan precieze
geluidsniveaus en met een rustige gevel
< 45 dB(A) 5223 3% 0 0%
45 - 50 dB(A) 23429 13% 0 0%
50 - 55 dB(A) 56351 30% 1 0%
55 - 60 dB(A) 49766 27% 1 0%
60 - 65 dB(A) 31083 17% 28 0%
65 - 70 dB(A) 15904 9% 444 3%
70 - 75 dB(A) 3891 2% 557 14%
> 75 dB(A) 561 0% 134 24%
official noise data
24
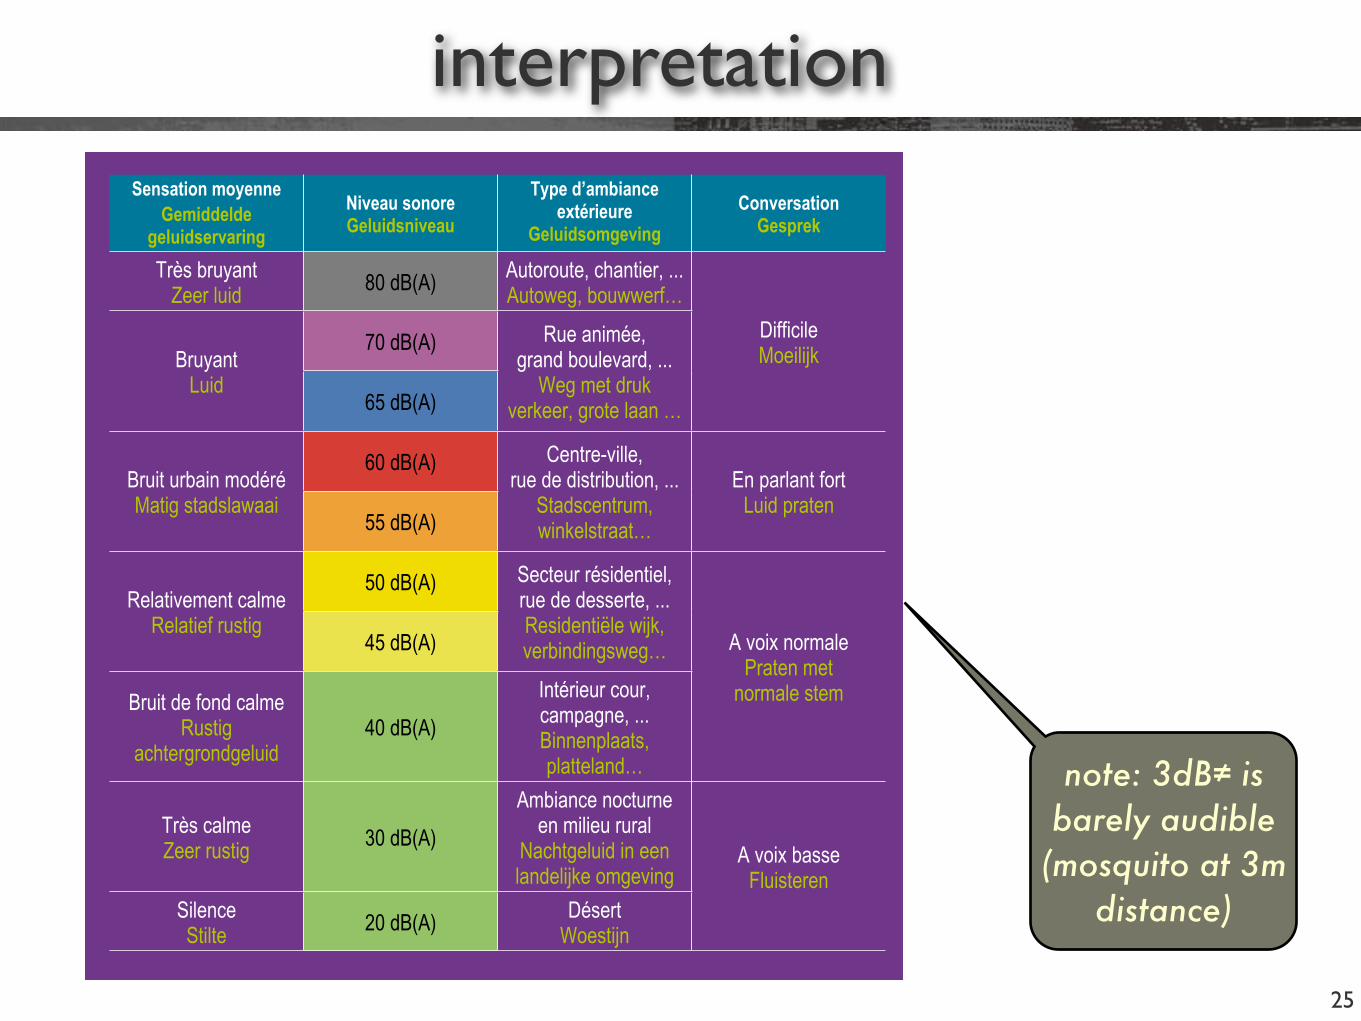
interpretation
25
Sensation moyenneGemiddelde
geluids ervaring
Niveau sonoreGeluidsniveau
Type d’ambiance extérieure
Geluidsomgeving
ConversationGesprek
Très bruyant Zeer luid 80 dB(A) Autoroute, chantier, ...
Autoweg, bouwwerf…
DifficileMoeilijkBruyant
Luid
70 dB(A) Rue animée, grand boulevard, ...
Weg met druk verkeer, grote laan …65 dB(A)
Bruit urbain modéréMatig stadslawaai
60 dB(A) Centre-ville, rue de distribution, ...
Stadscentrum, winkelstraat…
En parlant fortLuid praten
55 dB(A)
Relativement calmeRelatief rustig
50 dB(A) Secteur résidentiel, rue de desserte, ... Residentiële wijk, verbindingsweg… A voix normale
Praten met normale stem
45 dB(A)
Bruit de fond calme Rustig
achtergrondgeluid40 dB(A)
Intérieur cour, campagne, ... Binnenplaats, platteland…
Très calmeZeer rustig 30 dB(A)
Ambiance nocturne en milieu rural
Nachtgeluid in een landelijke omgeving
A voix basseFluisteren
Silence Stilte 20 dB(A) Désert
Woestijn
note: 3dB! is barely audible
(mosquito at 3m distance)
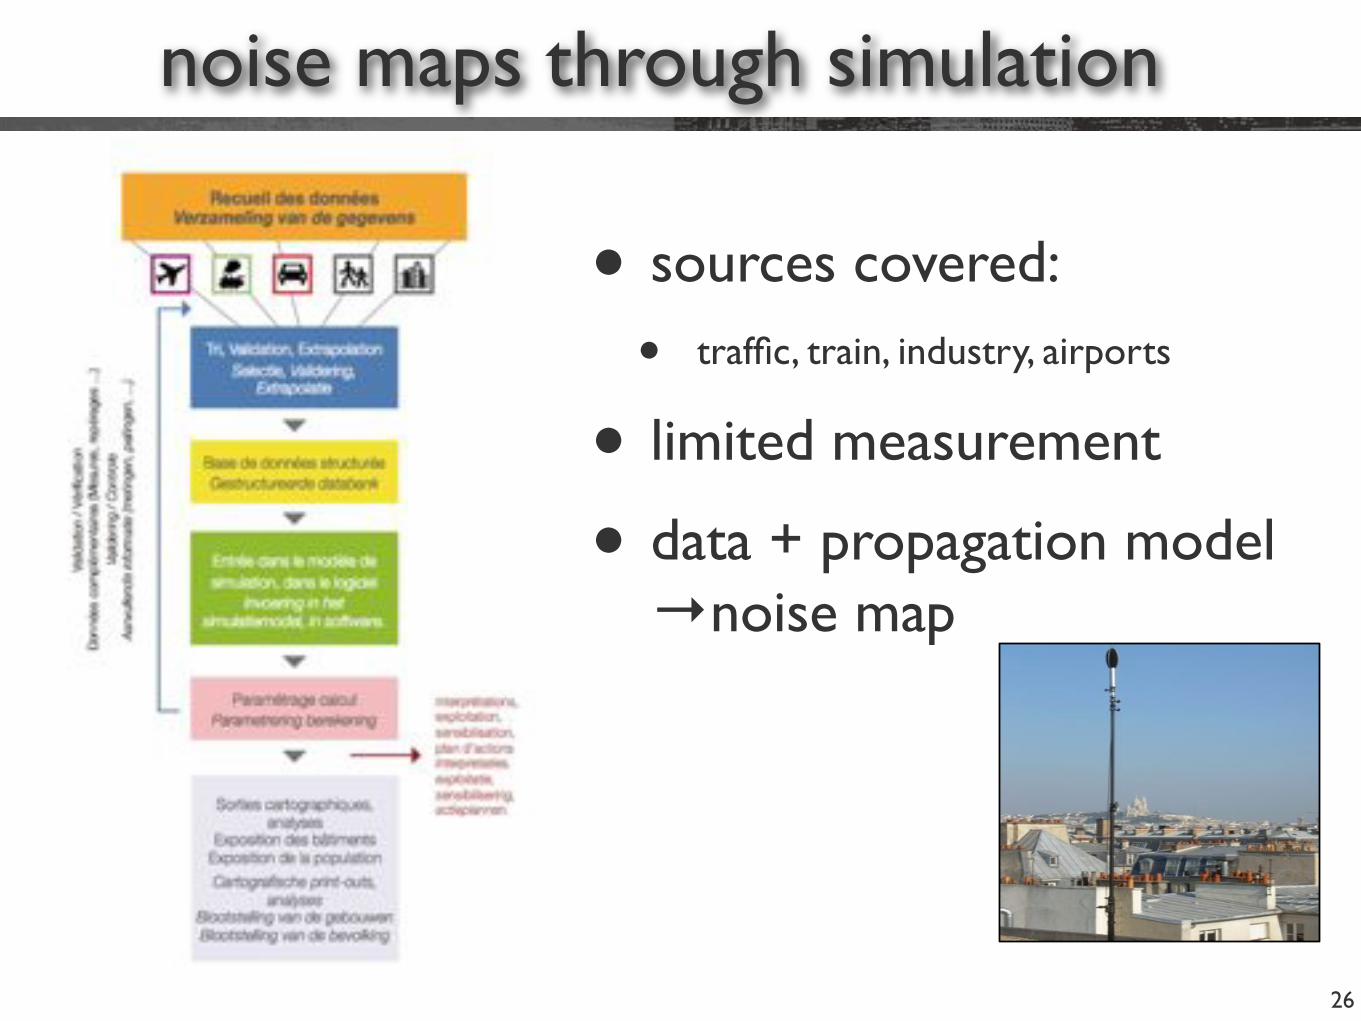
noise maps through simulation
26
• sources covered:
• traffic, train, industry, airports
• limited measurement
• data + propagation model →noise map
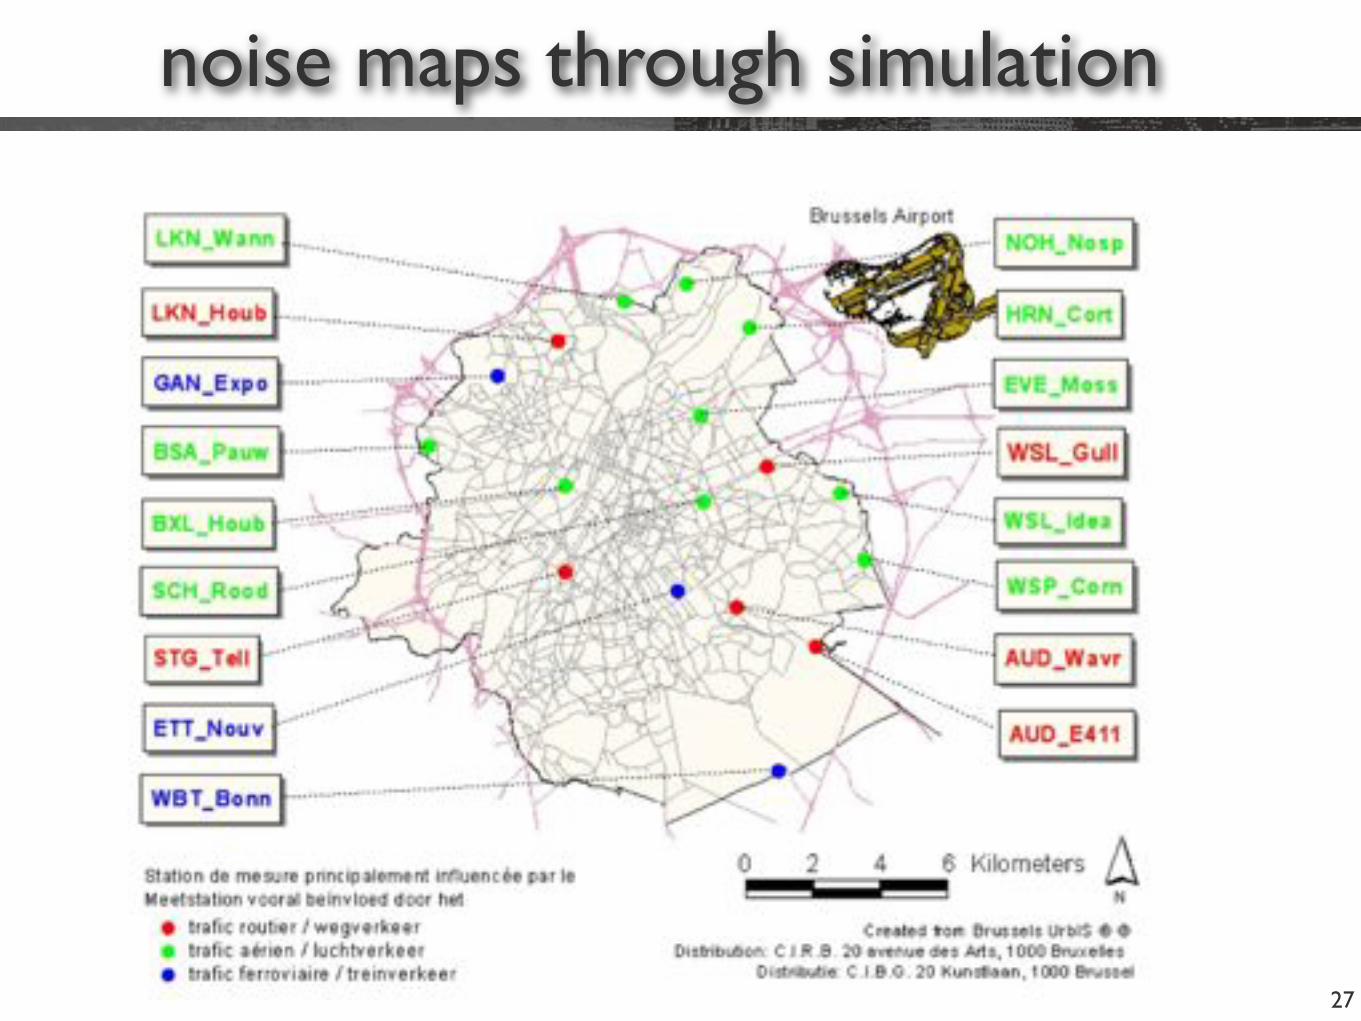
noise maps through simulation
27
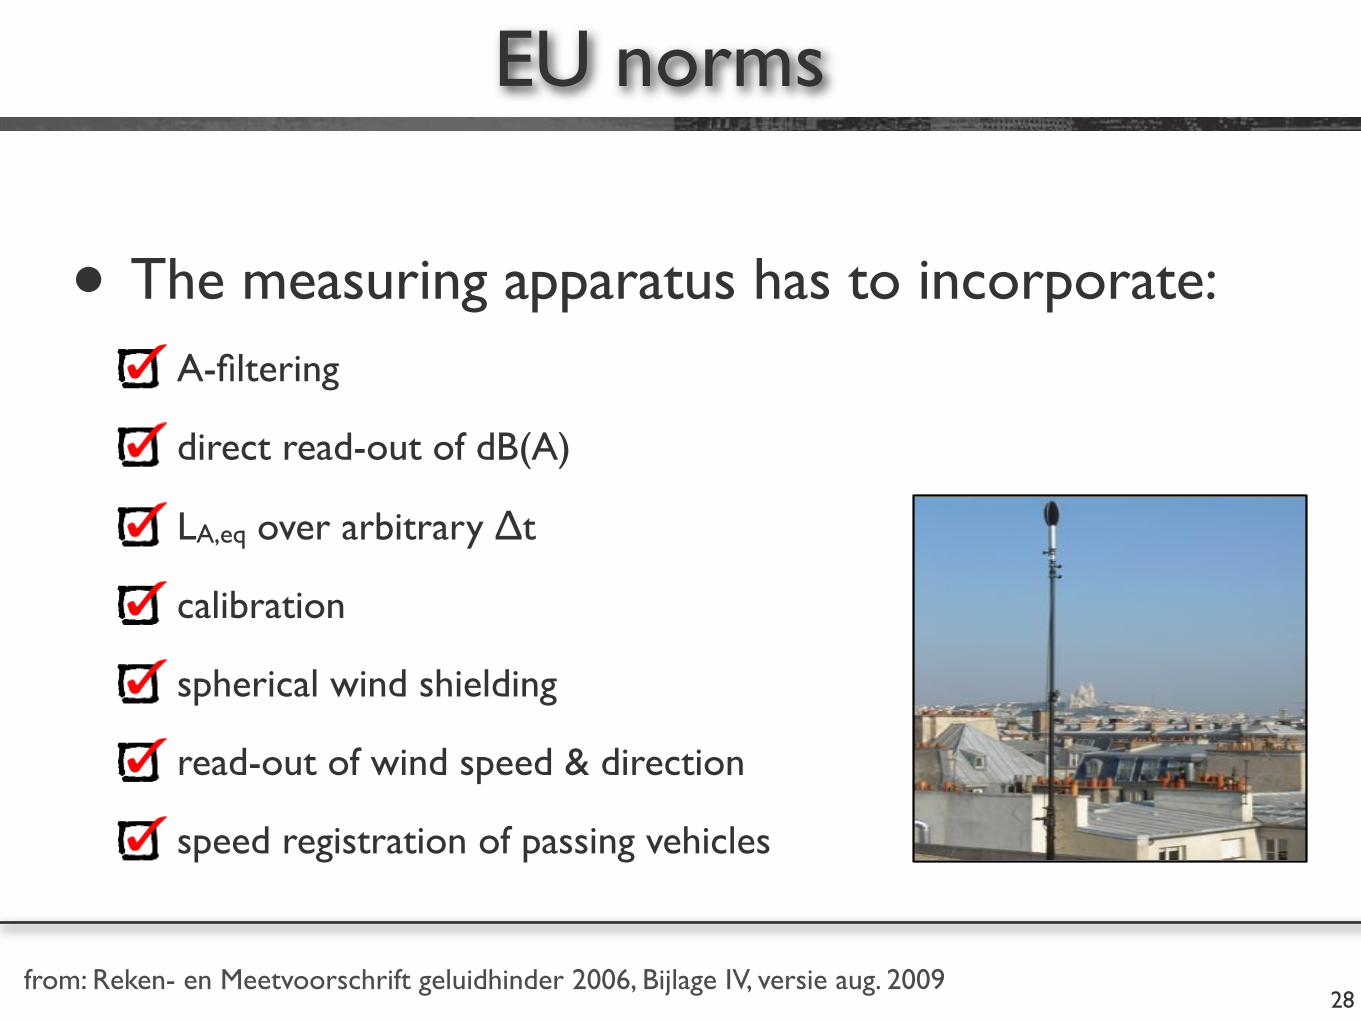
• The measuring apparatus has to incorporate: A-filtering
direct read-out of dB(A)
LA,eq over arbitrary ∆t
calibration
spherical wind shielding
read-out of wind speed & direction
speed registration of passing vehicles
EU norms
28from: Reken- en Meetvoorschrift geluidhinder 2006, Bijlage IV, versie aug. 2009
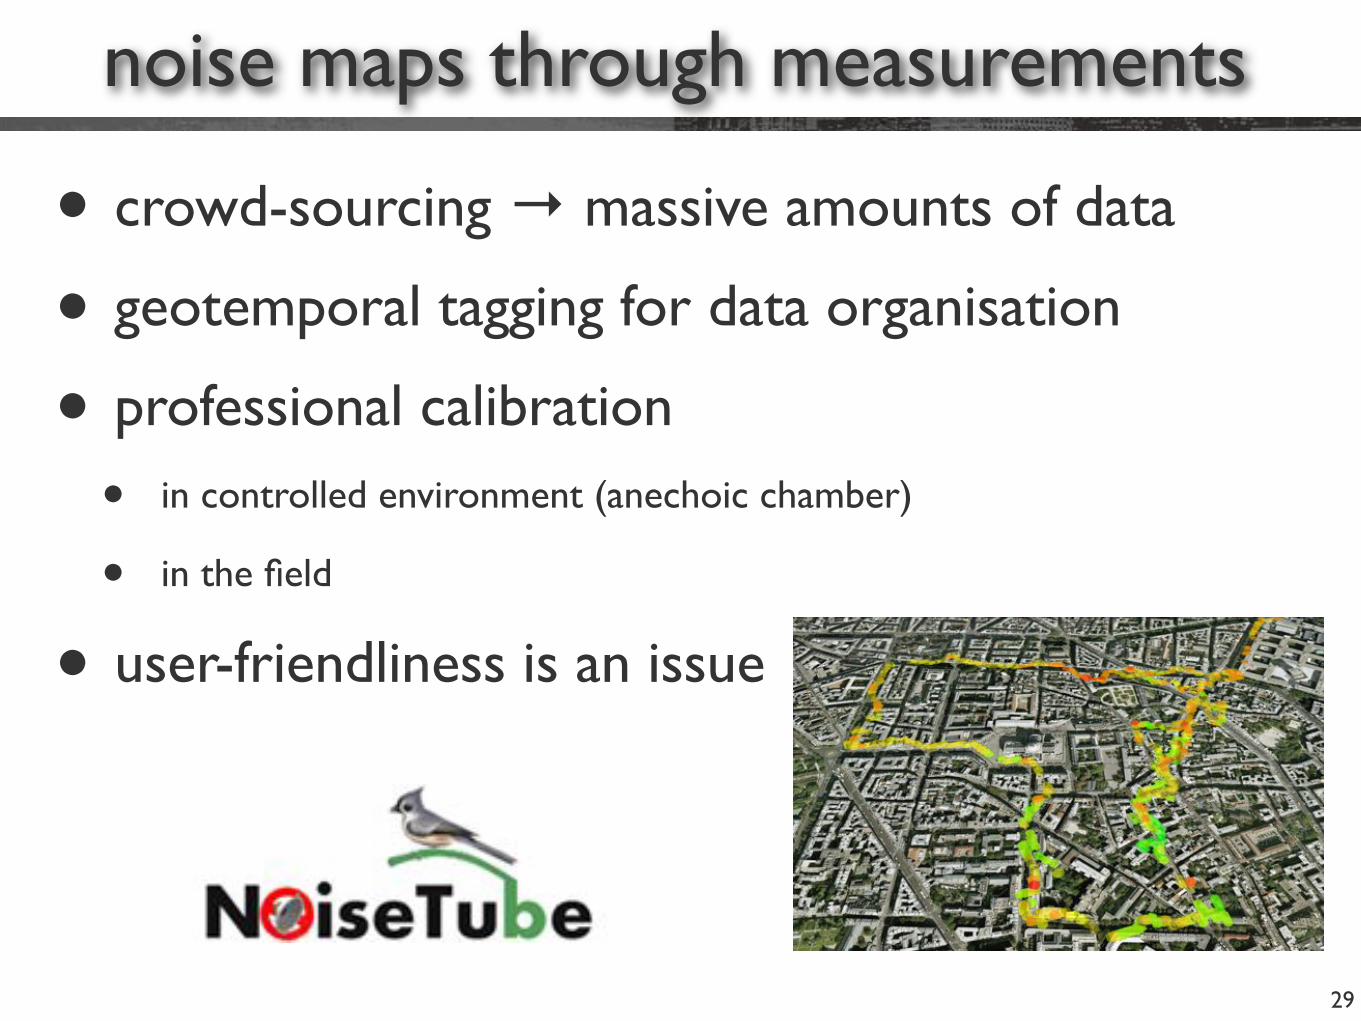
• crowd-sourcing → massive amounts of data
• geotemporal tagging for data organisation
• professional calibration
• in controlled environment (anechoic chamber)
• in the field
• user-friendliness is an issue
noise maps through measurements
29
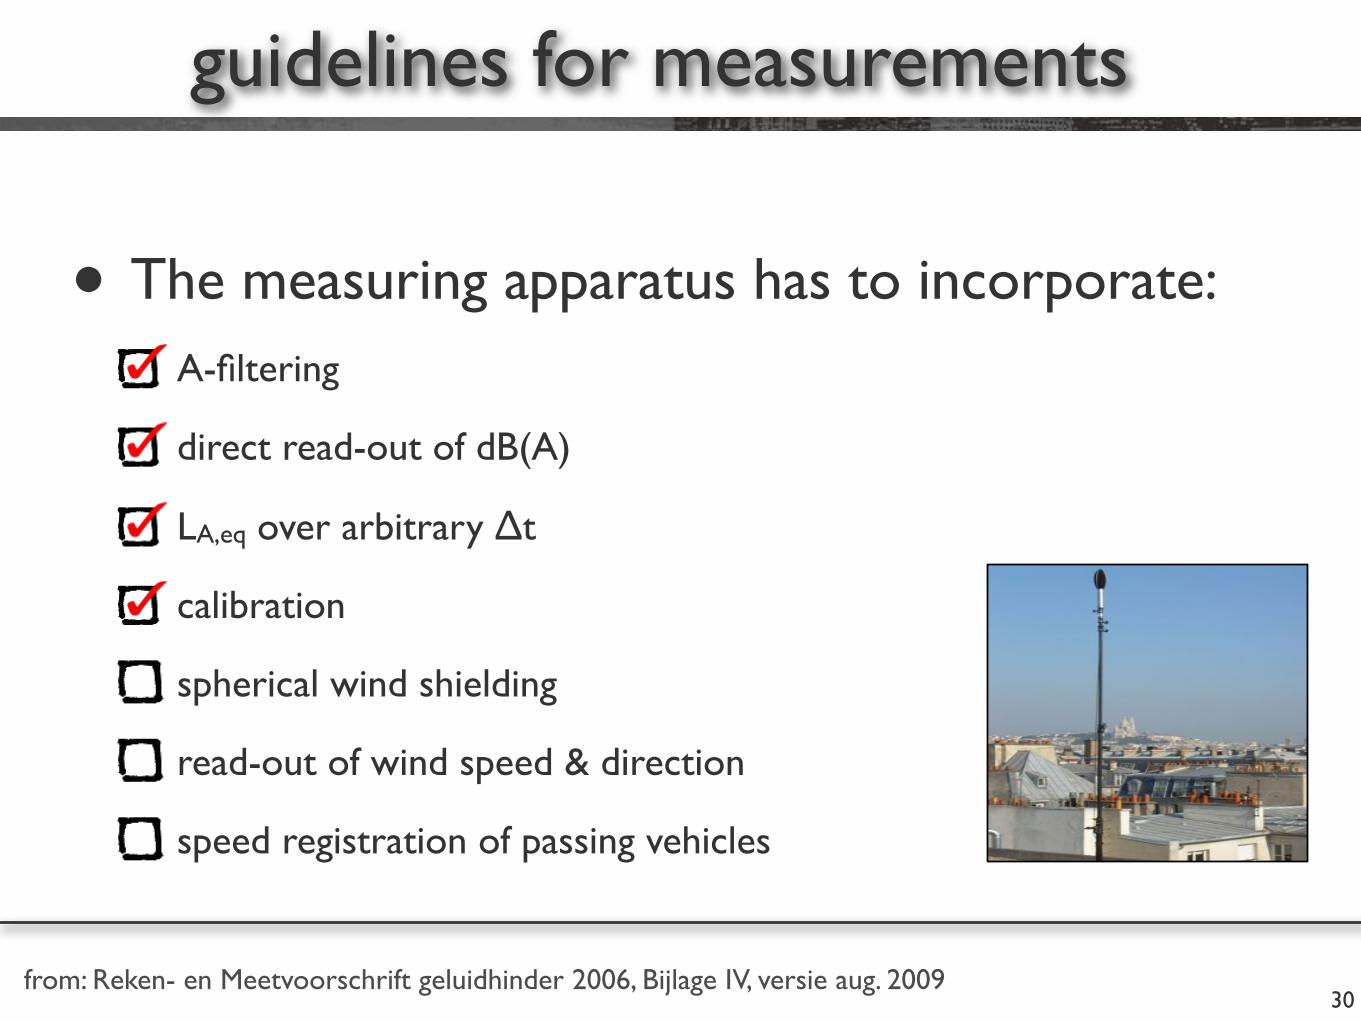
• The measuring apparatus has to incorporate: A-filtering
direct read-out of dB(A)
LA,eq over arbitrary ∆t
calibration
spherical wind shielding
read-out of wind speed & direction
speed registration of passing vehicles
guidelines for measurements
30from: Reken- en Meetvoorschrift geluidhinder 2006, Bijlage IV, versie aug. 2009
measurement equipment
31
+
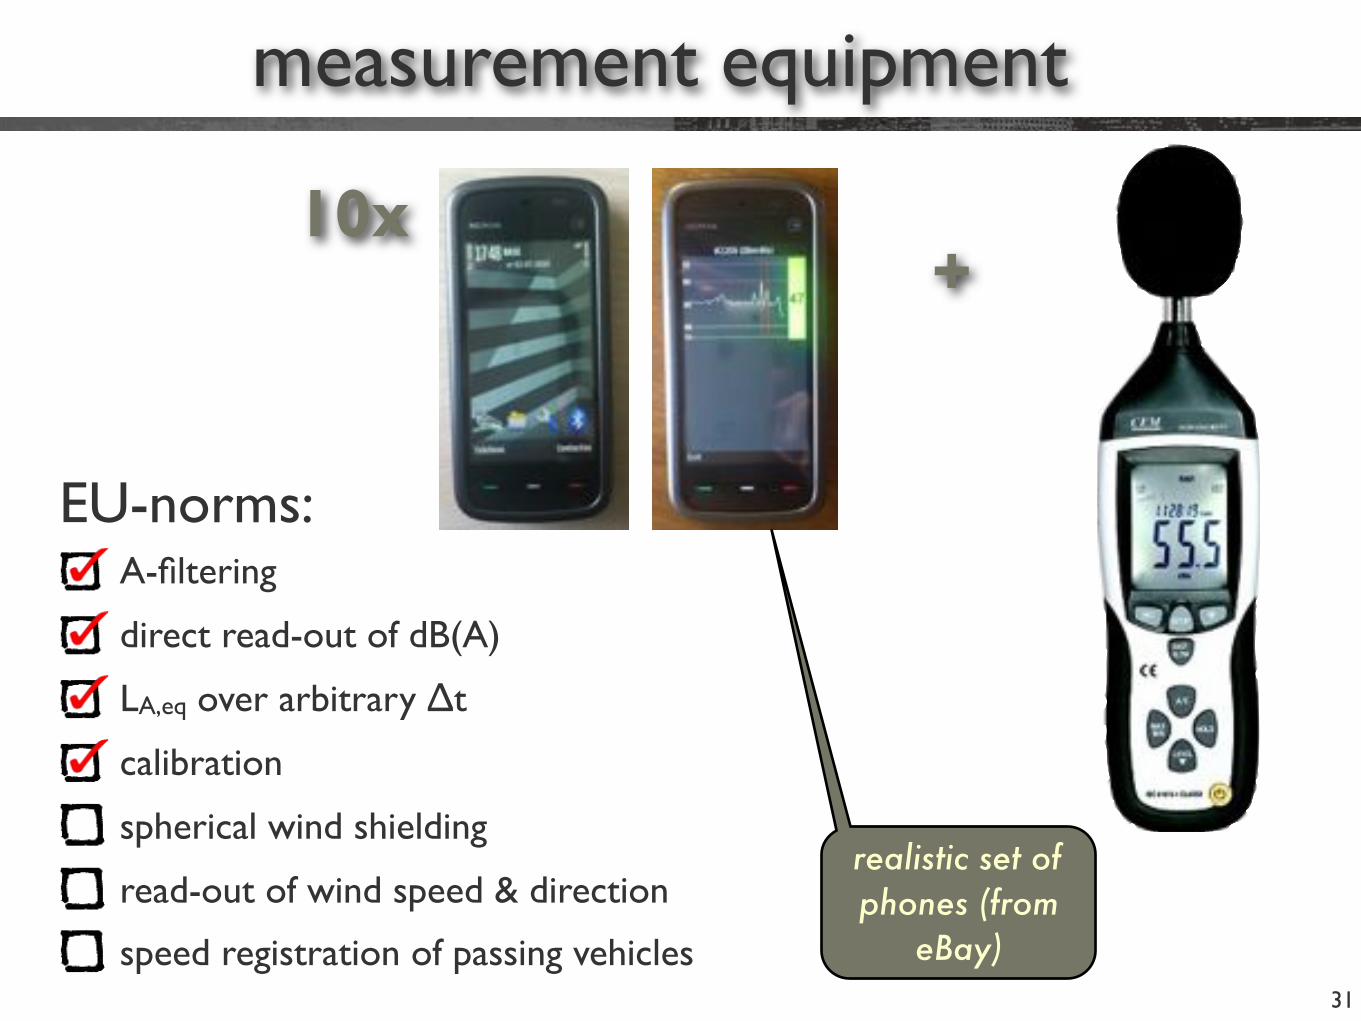
EU-norms:A-filtering
direct read-out of dB(A)
LA,eq over arbitrary ∆t
calibration
spherical wind shielding
read-out of wind speed & direction
speed registration of passing vehicles
10x
realistic set of phones (from
eBay)
comparison
32
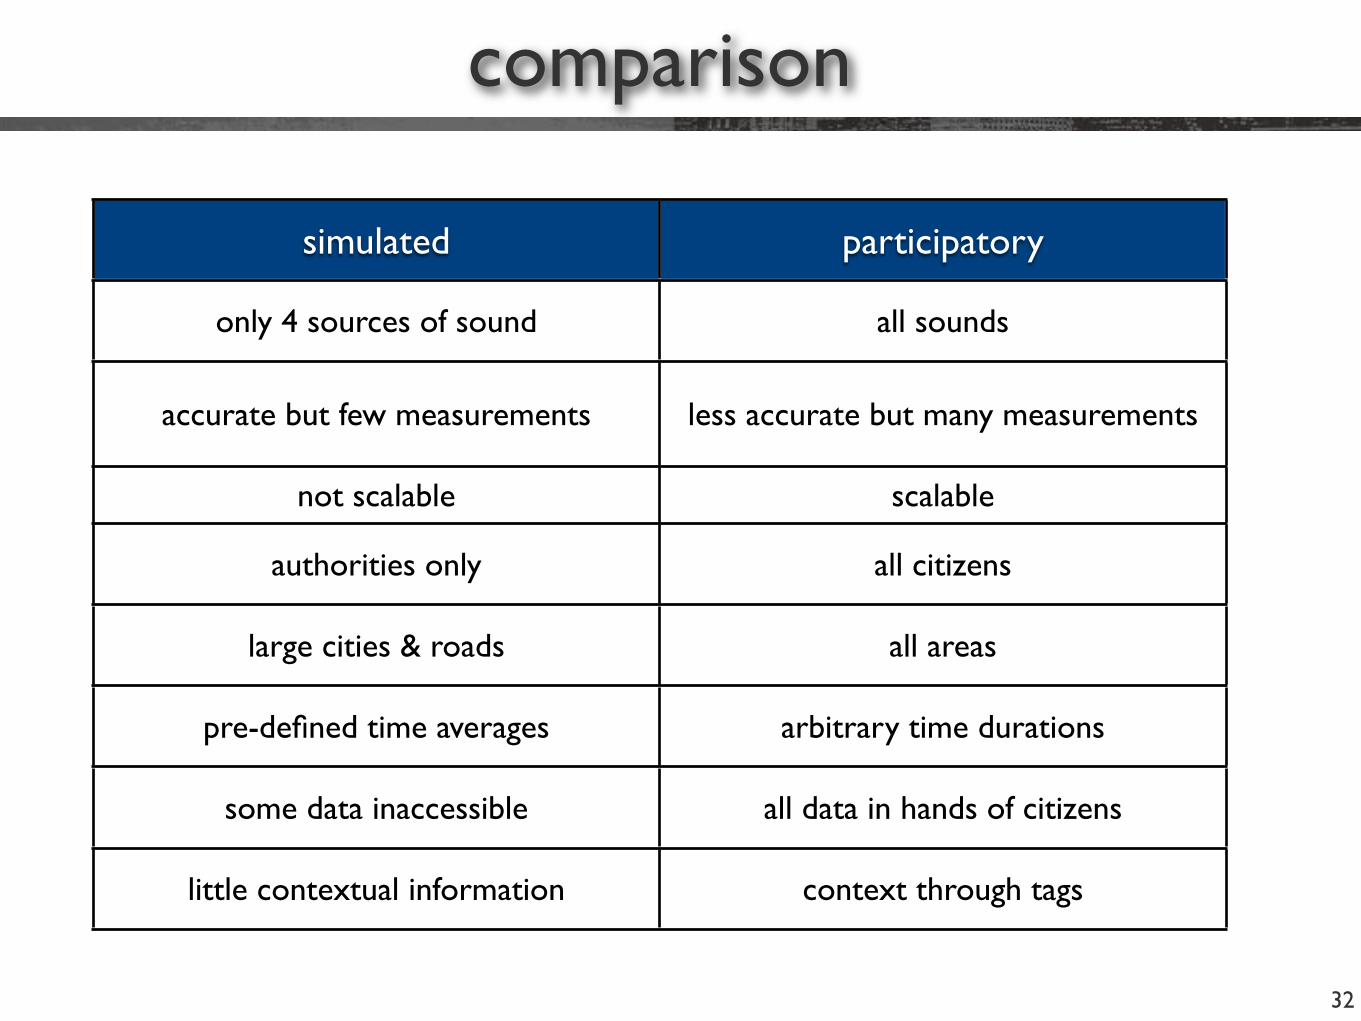
simulated participatory
only 4 sources of sound all sounds
accurate but few measurements less accurate but many measurements
not scalable scalable
authorities only all citizens
large cities & roads all areas
pre-defined time averages arbitrary time durations
some data inaccessible all data in hands of citizens
little contextual information context through tags
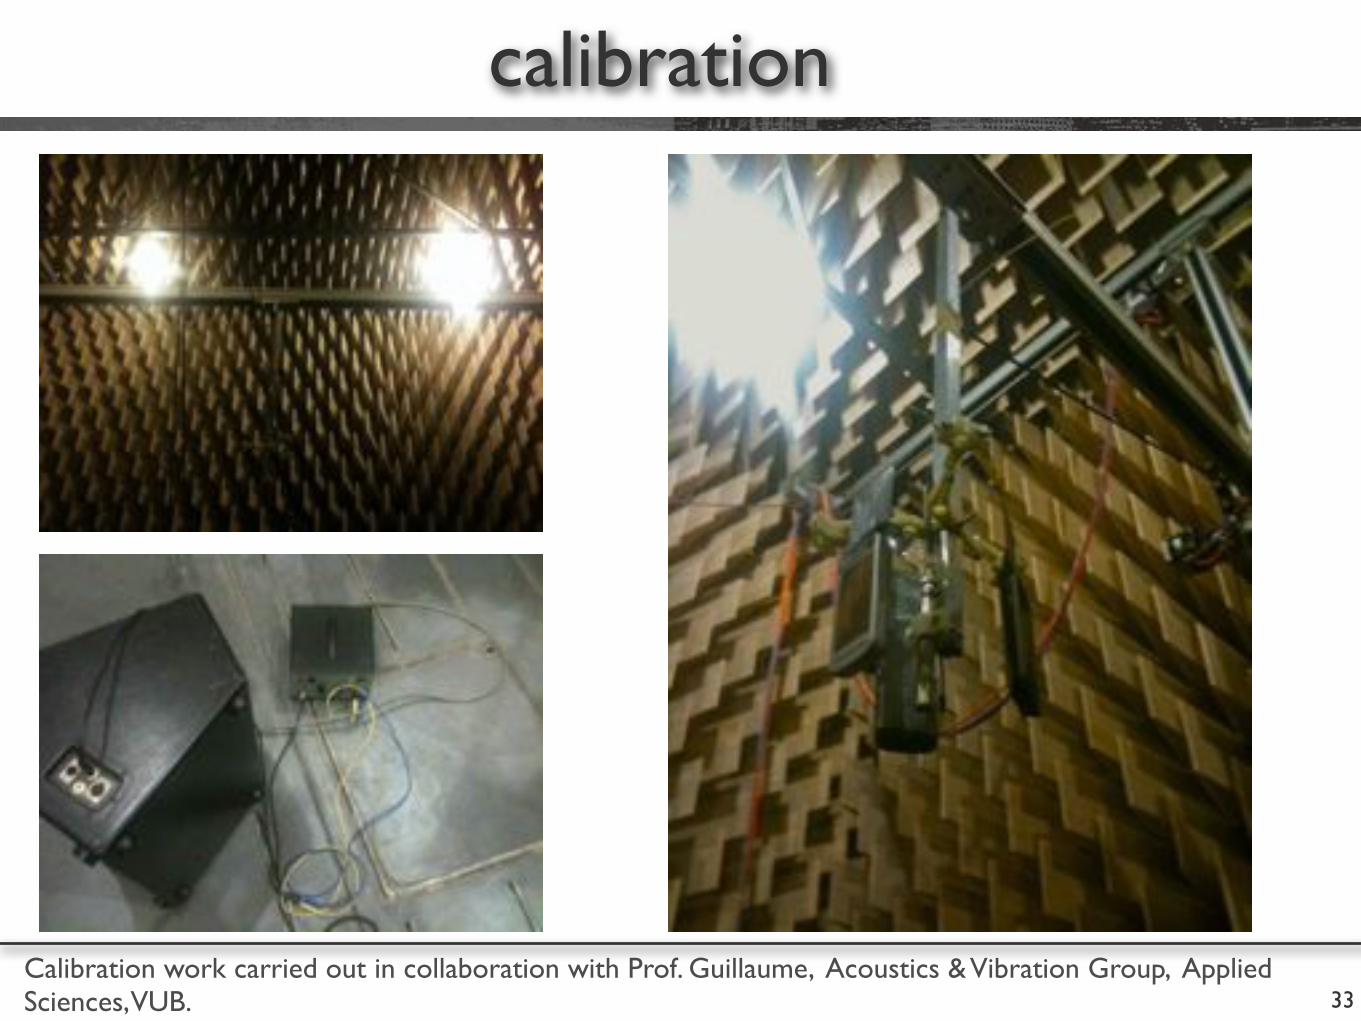
calibration
33Calibration work carried out in collaboration with Prof. Guillaume, Acoustics & Vibration Group, Applied Sciences, VUB.
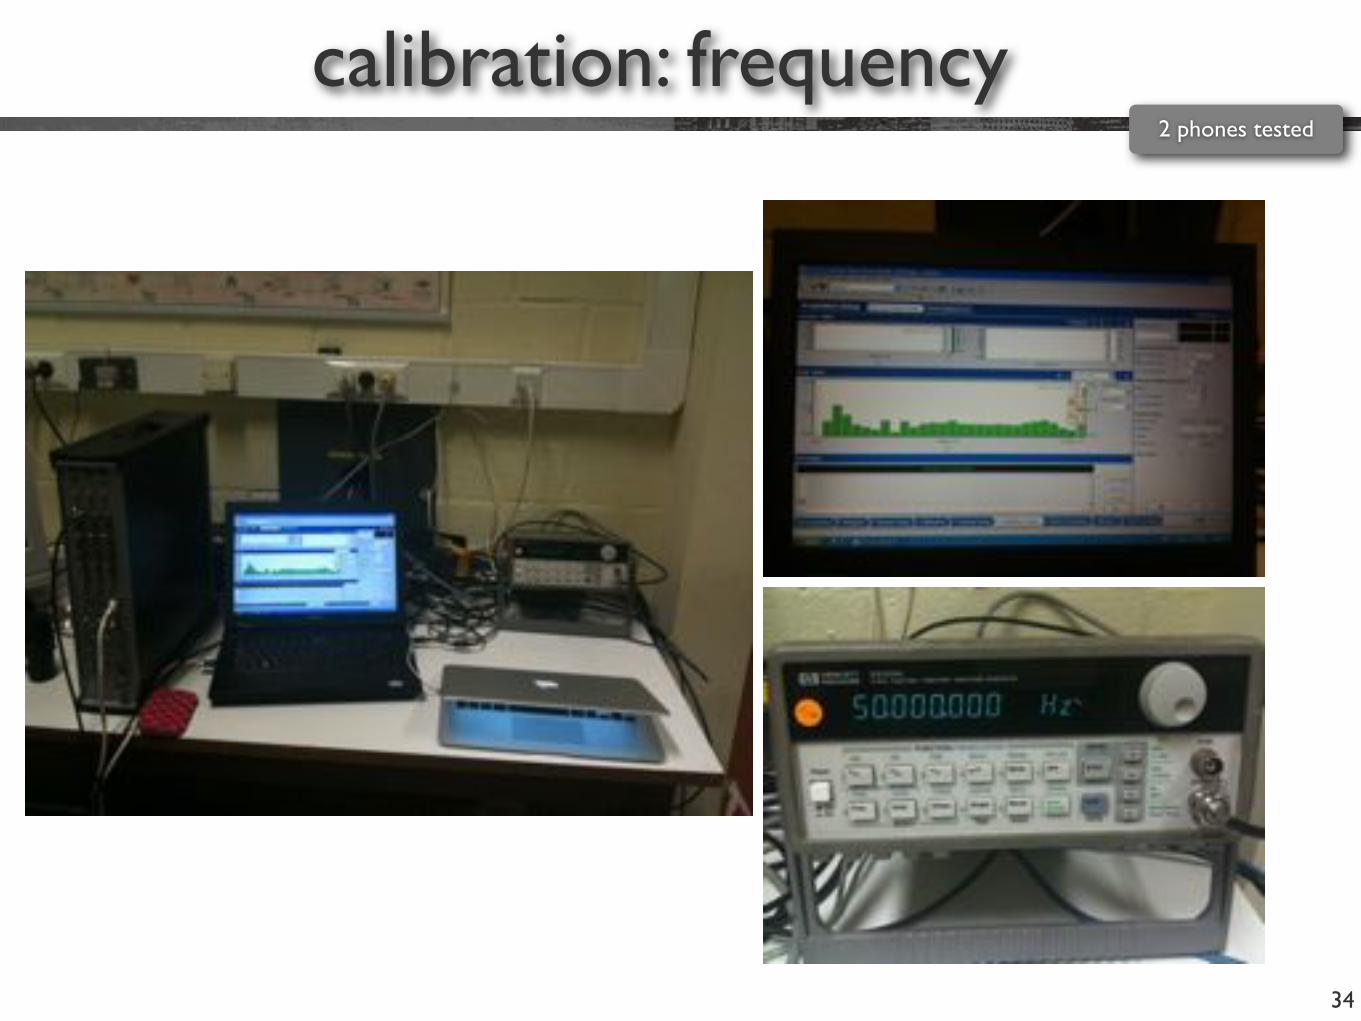
calibration: frequency
34
2 phones tested
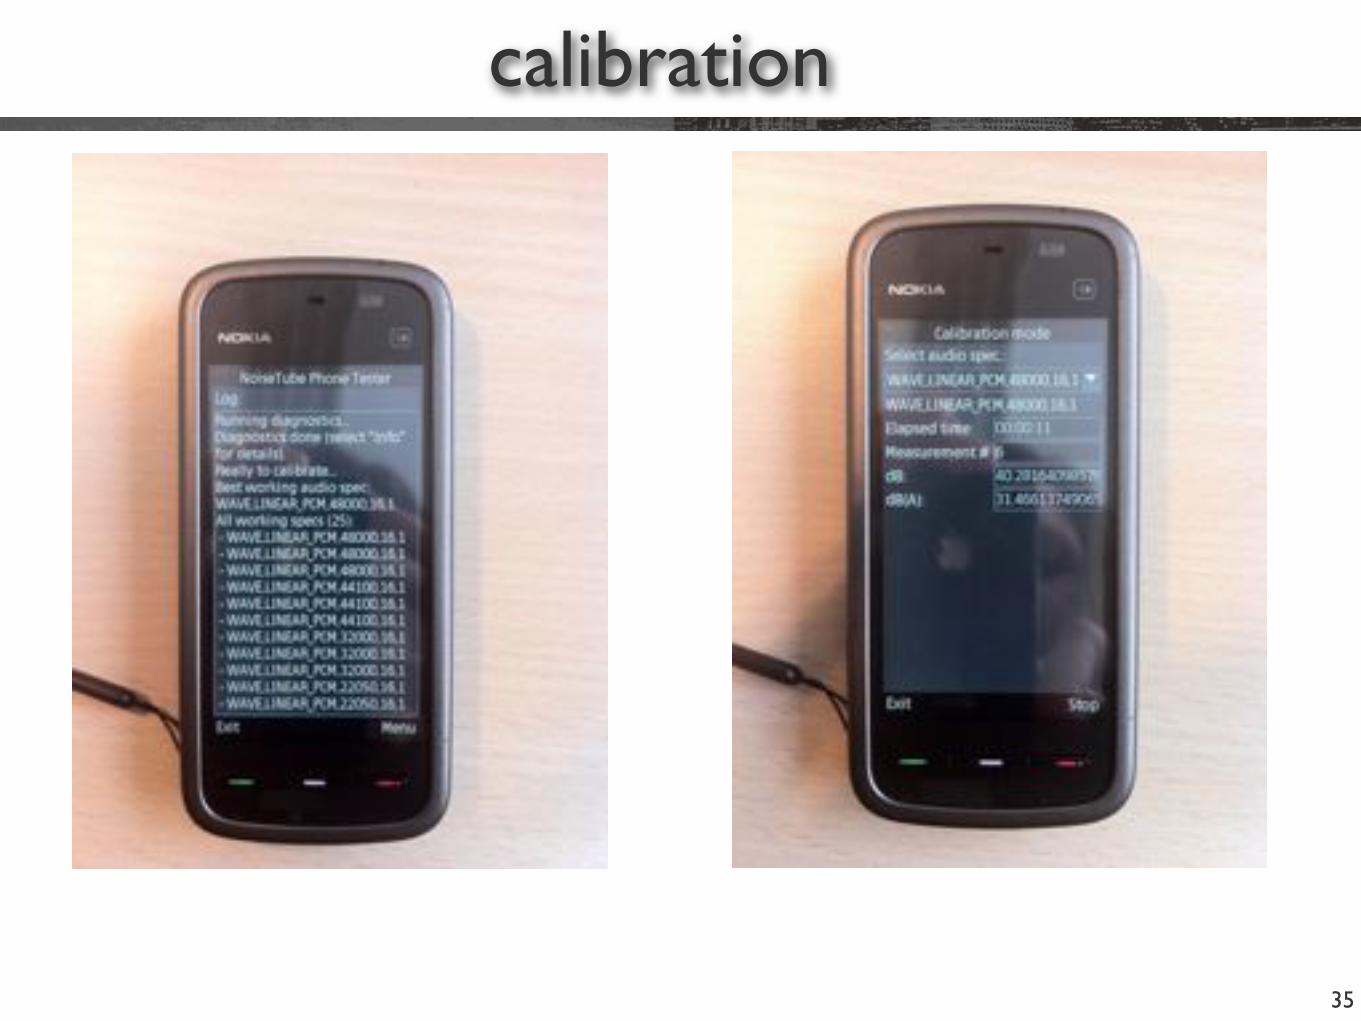
calibration
35
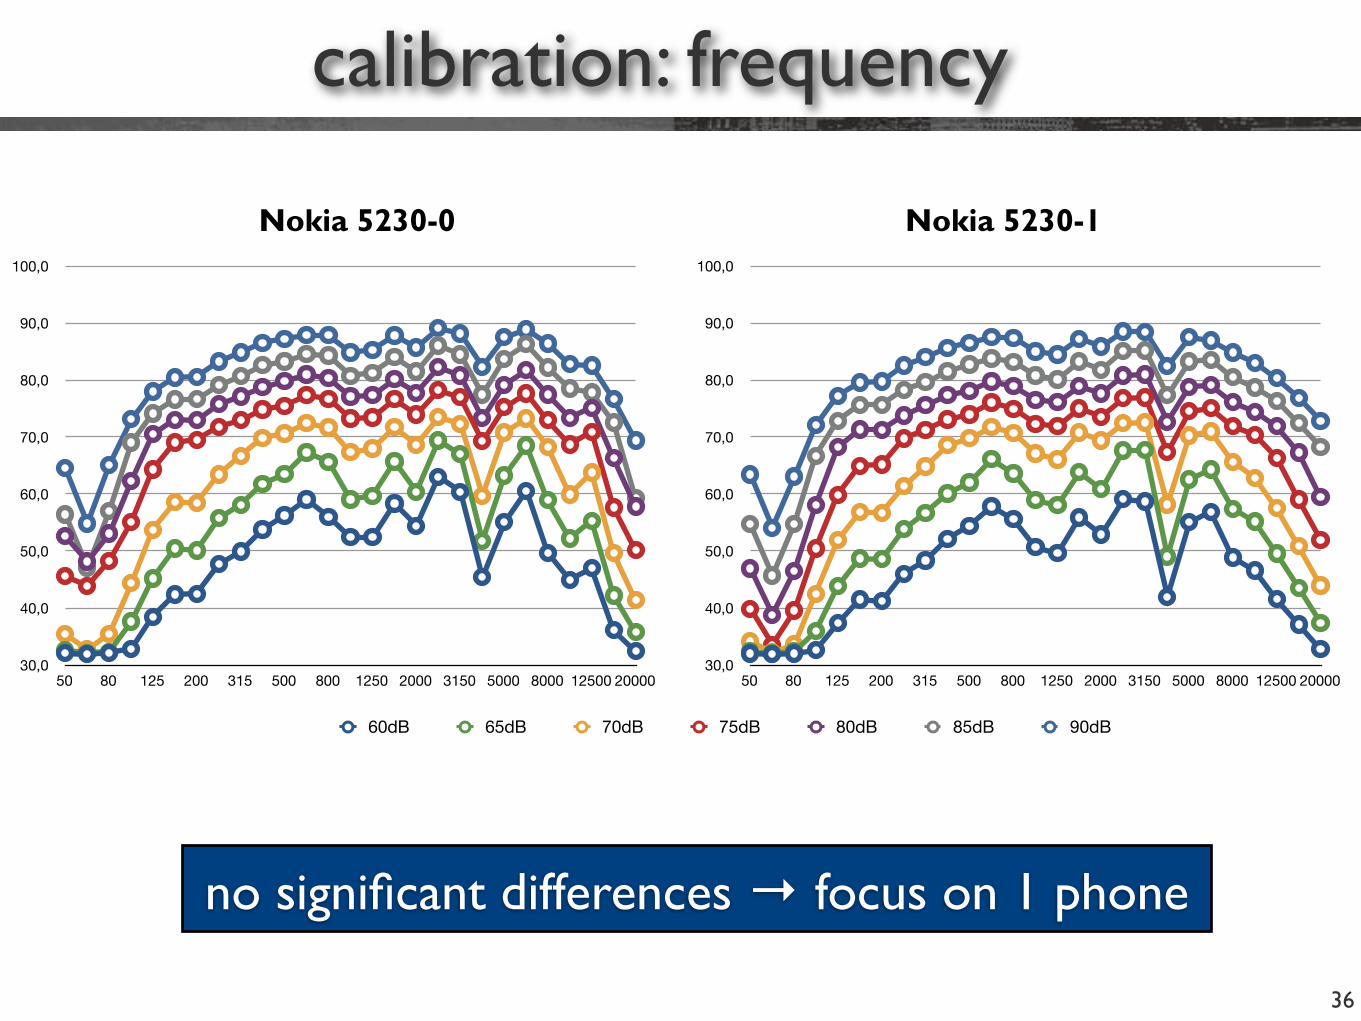
calibration: frequency
36
Nokia 5230-0 Nokia 5230-1
no significant differences → focus on 1 phone
30,0
40,0
50,0
60,0
70,0
80,0
90,0
100,0
50 80 125 200 315 500 800 1250 2000 3150 5000 8000 12500 20000
60dB 65dB 70dB 75dB 80dB 85dB 90dB
30,0
40,0
50,0
60,0
70,0
80,0
90,0
100,0
50 80 125 200 315 500 800 1250 2000 3150 5000 8000 12500 20000
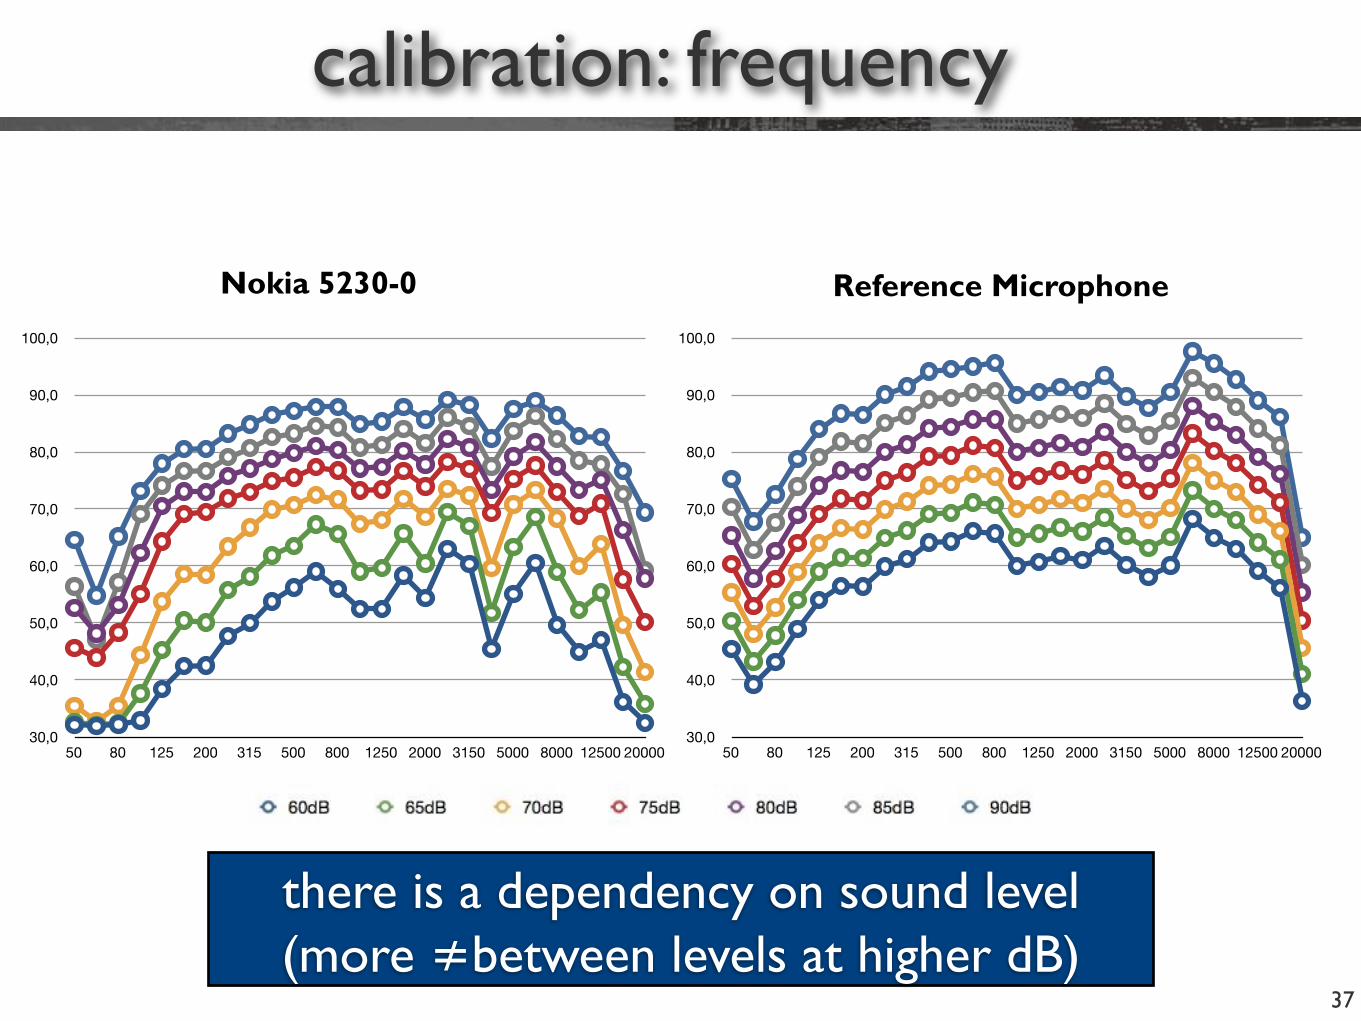
calibration: frequency
37
Reference MicrophoneNokia 5230-0
30,0
40,0
50,0
60,0
70,0
80,0
90,0
100,0
50 80 125 200 315 500 800 1250 2000 3150 5000 8000 12500 2000030,0
40,0
50,0
60,0
70,0
80,0
90,0
100,0
50 80 125 200 315 500 800 1250 2000 3150 5000 8000 12500 20000
there is a dependency on sound level (more ≠between levels at higher dB)
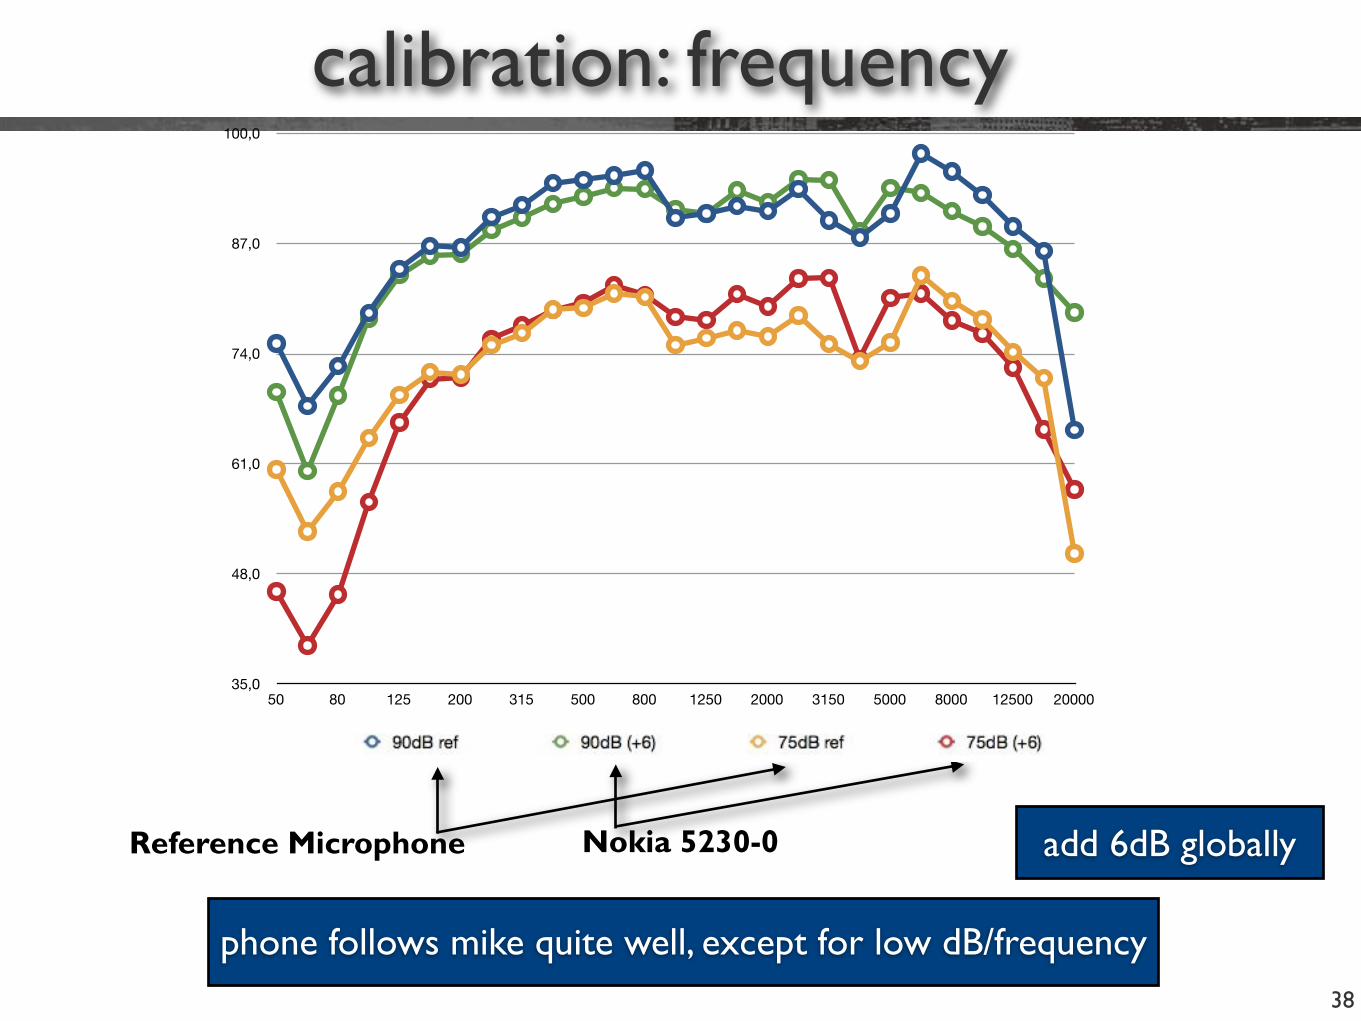
calibration: frequency
38
Reference Microphone Nokia 5230-0
35,0
48,0
61,0
74,0
87,0
100,0
50 80 125 200 315 500 800 1250 2000 3150 5000 8000 12500 20000
phone follows mike quite well, except for low dB/frequency
add 6dB globally
calibration: frequency
39
• for frequency-dependent calibration one needs to develop a digital filter, which is hard!
• sound level dependency points to frequency-independent technique
• correspondence between phone & reference is good in the domains that matter
conclusion: digital filter is overkill, use frequency-independent calibration technique instead (using white noise)
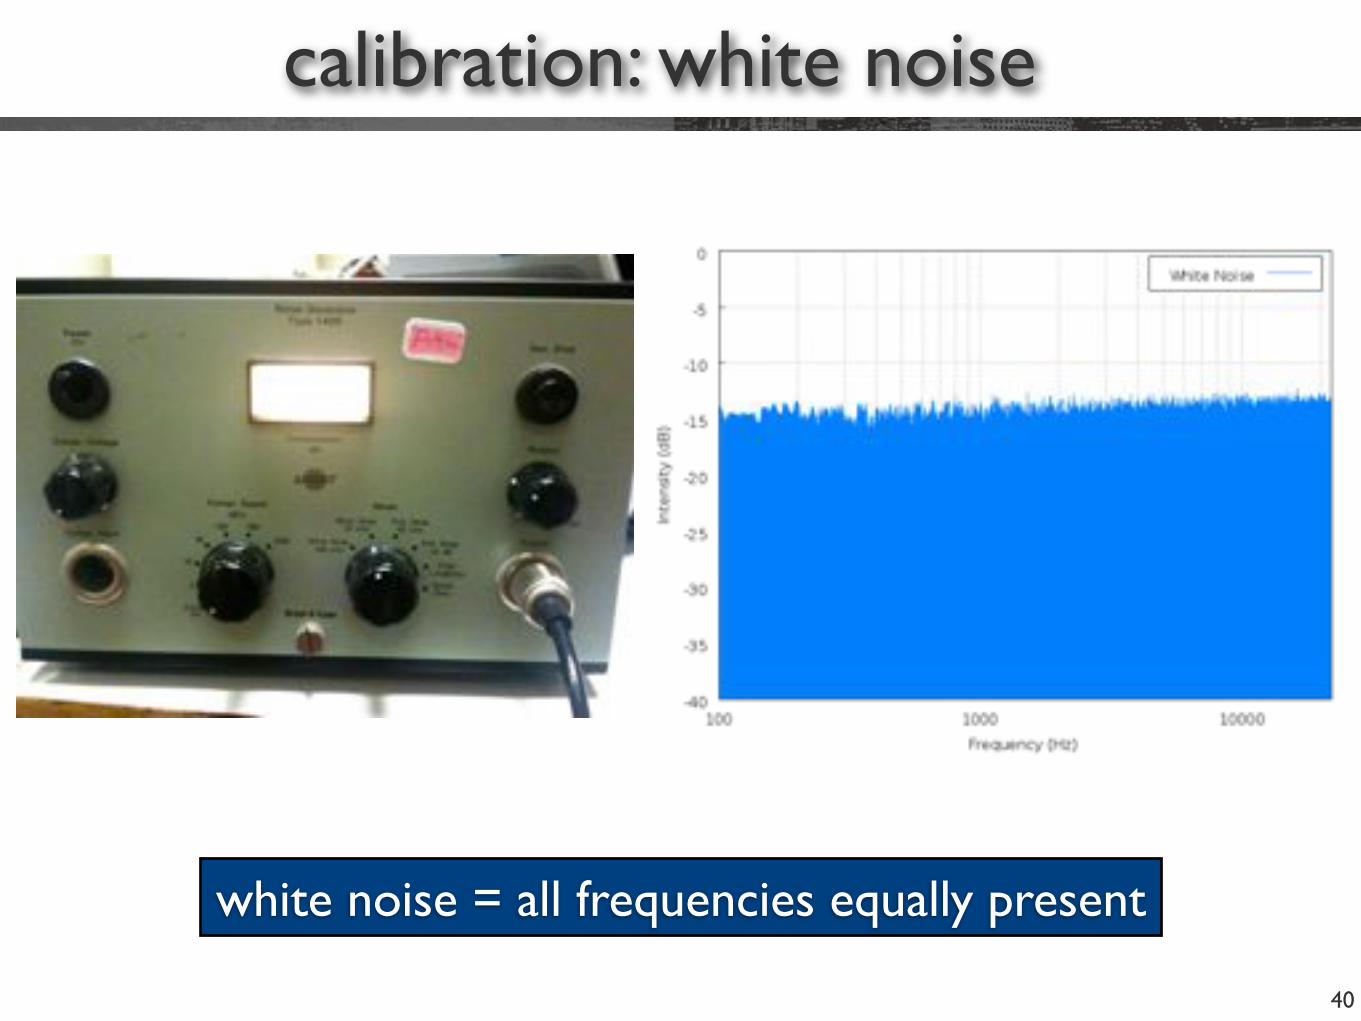
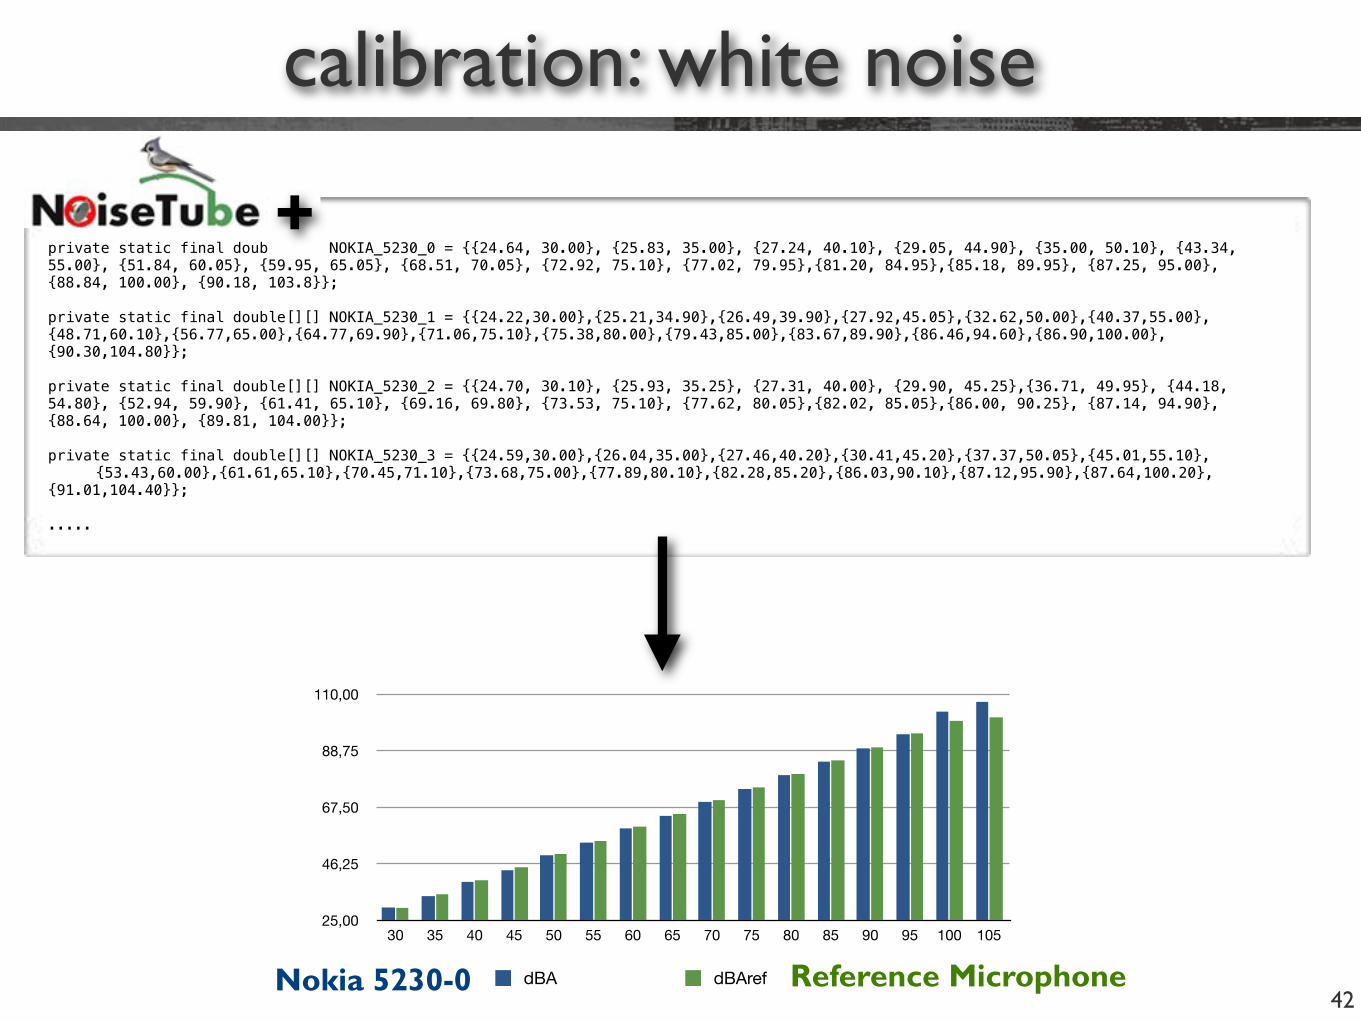
calibration: white noise
40
white noise = all frequencies equally present
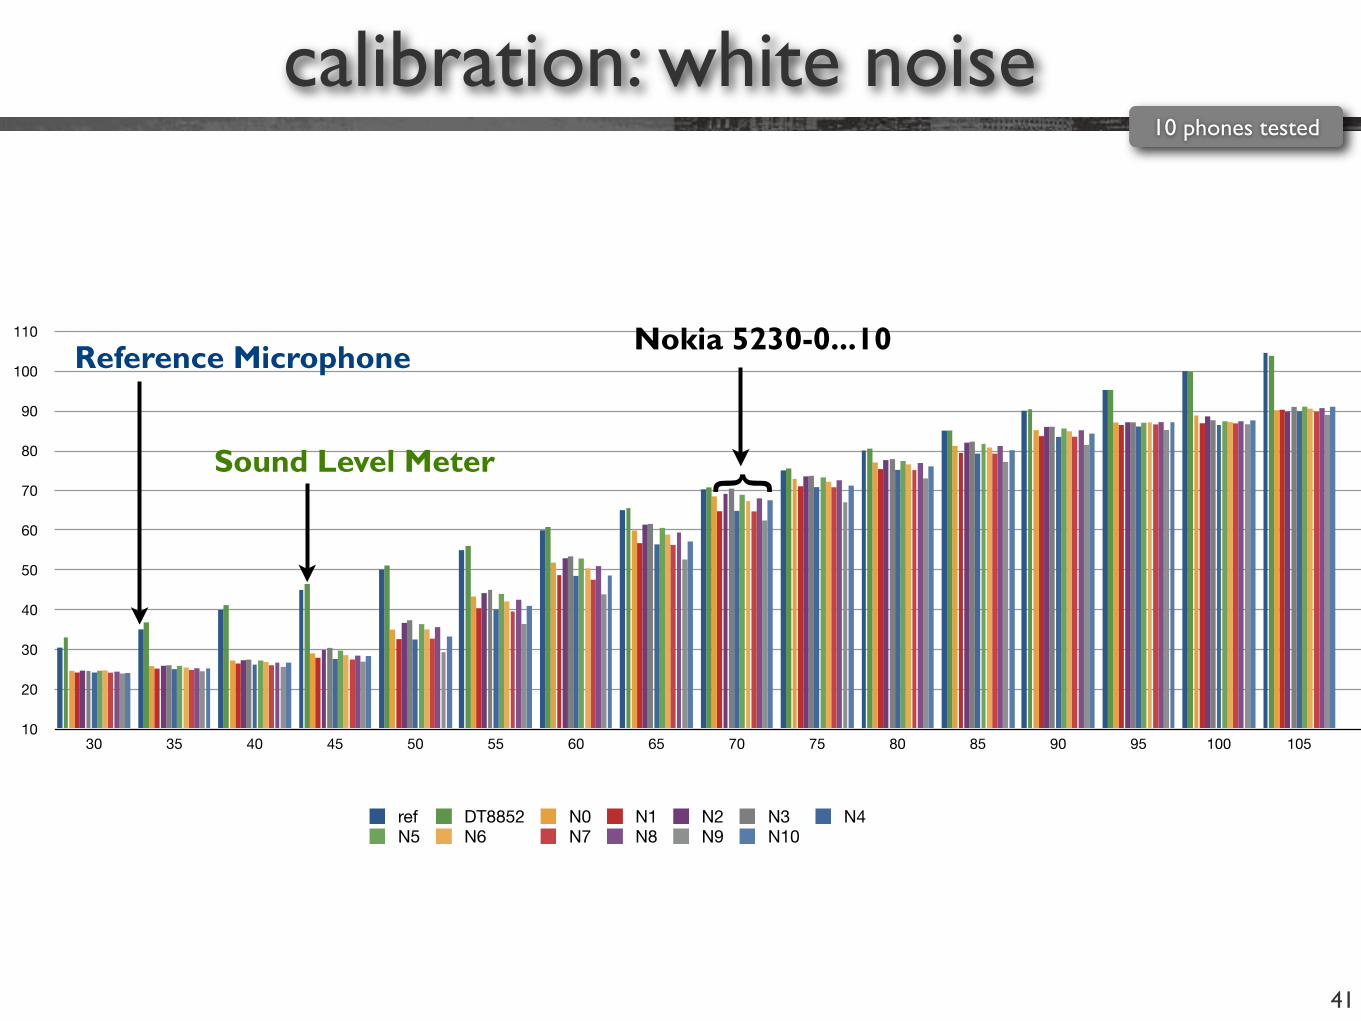
calibration: white noise
41
10
20
30
40
50
60
70
80
90
100
110
30 35 40 45 50 55 60 65 70 75 80 85 90 95 100 105
ref DT8852 N0 N1 N2 N3 N4N5 N6 N7 N8 N9 N10
Sound Level Meter
Reference Microphone
}
Nokia 5230-0...10
10 phones tested
calibration: white noise
42
private static final double[][] NOKIA_5230_0 = {{24.64, 30.00}, {25.83, 35.00}, {27.24, 40.10}, {29.05, 44.90},!{35.00, 50.10}, {43.34, 55.00}, {51.84, 60.05}, {59.95, 65.05}, {68.51, 70.05}, {72.92, 75.10}, {77.02, 79.95},{81.20, 84.95},{85.18, 89.95}, {87.25, 95.00}, {88.84, 100.00}, {90.18, 103.8}};
private static final double[][] NOKIA_5230_1 = {{24.22,30.00},{25.21,34.90},{26.49,39.90},{27.92,45.05},{32.62,50.00},{40.37,55.00},{48.71,60.10},{56.77,65.00},{64.77,69.90},{71.06,75.10},{75.38,80.00},{79.43,85.00},{83.67,89.90},{86.46,94.60},{86.90,100.00},{90.30,104.80}};
private static final double[][] NOKIA_5230_2 = {{24.70, 30.10}, {25.93, 35.25}, {27.31, 40.00}, {29.90, 45.25},{36.71, 49.95}, {44.18, 54.80}, {52.94, 59.90}, {61.41, 65.10}, {69.16, 69.80}, {73.53, 75.10}, {77.62, 80.05},{82.02, 85.05},{86.00, 90.25}, {87.14, 94.90}, {88.64, 100.00}, {89.81, 104.00}};
private static final double[][] NOKIA_5230_3 = {{24.59,30.00},{26.04,35.00},{27.46,40.20},{30.41,45.20},{37.37,50.05},{45.01,55.10}," {53.43,60.00},{61.61,65.10},{70.45,71.10},{73.68,75.00},{77.89,80.10},{82.28,85.20},{86.03,90.10},{87.12,95.90},{87.64,100.20},{91.01,104.40}};
.....
25,00
46,25
67,50
88,75
110,00
30 35 40 45 50 55 60 65 70 75 80 85 90 95 100 105
dBA dBArefNokia 5230-0 Reference Microphone
+
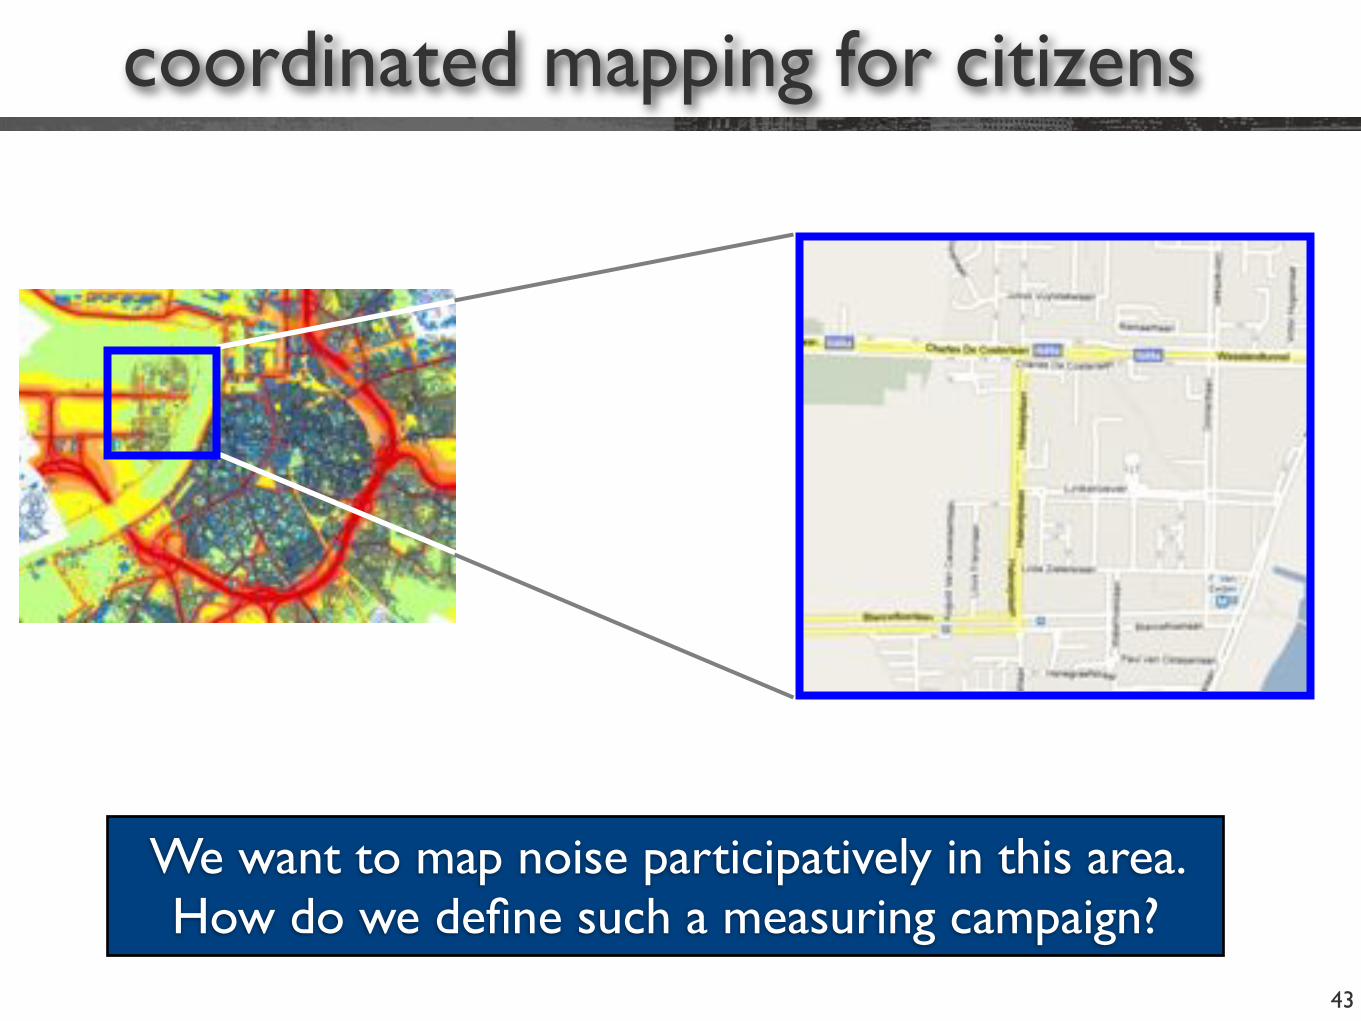
coordinated mapping for citizens
43
We want to map noise participatively in this area. How do we define such a measuring campaign?
coordinated mapping for researchers
44
We want to control as many parameters as possible, to evaluate the participatory technique (new research!).
• identical phones
• simplified NoiseTube
• identical tracks
• measurement technique
• ensure quantity of measurements
• pre-define time & area for measuring
• fixed # people
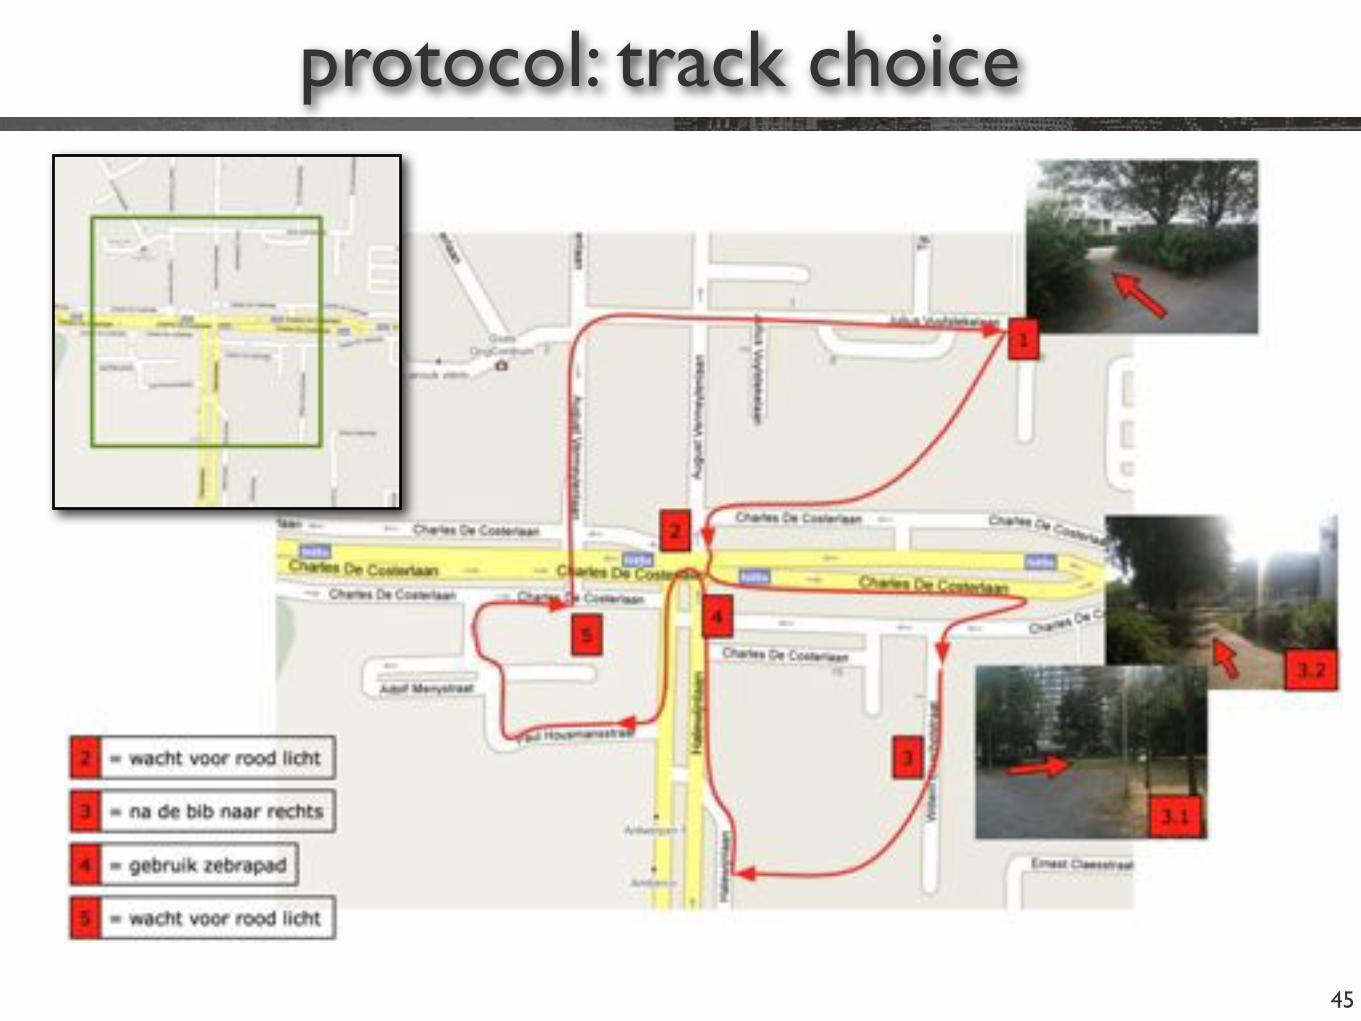
protocol: track choice
45
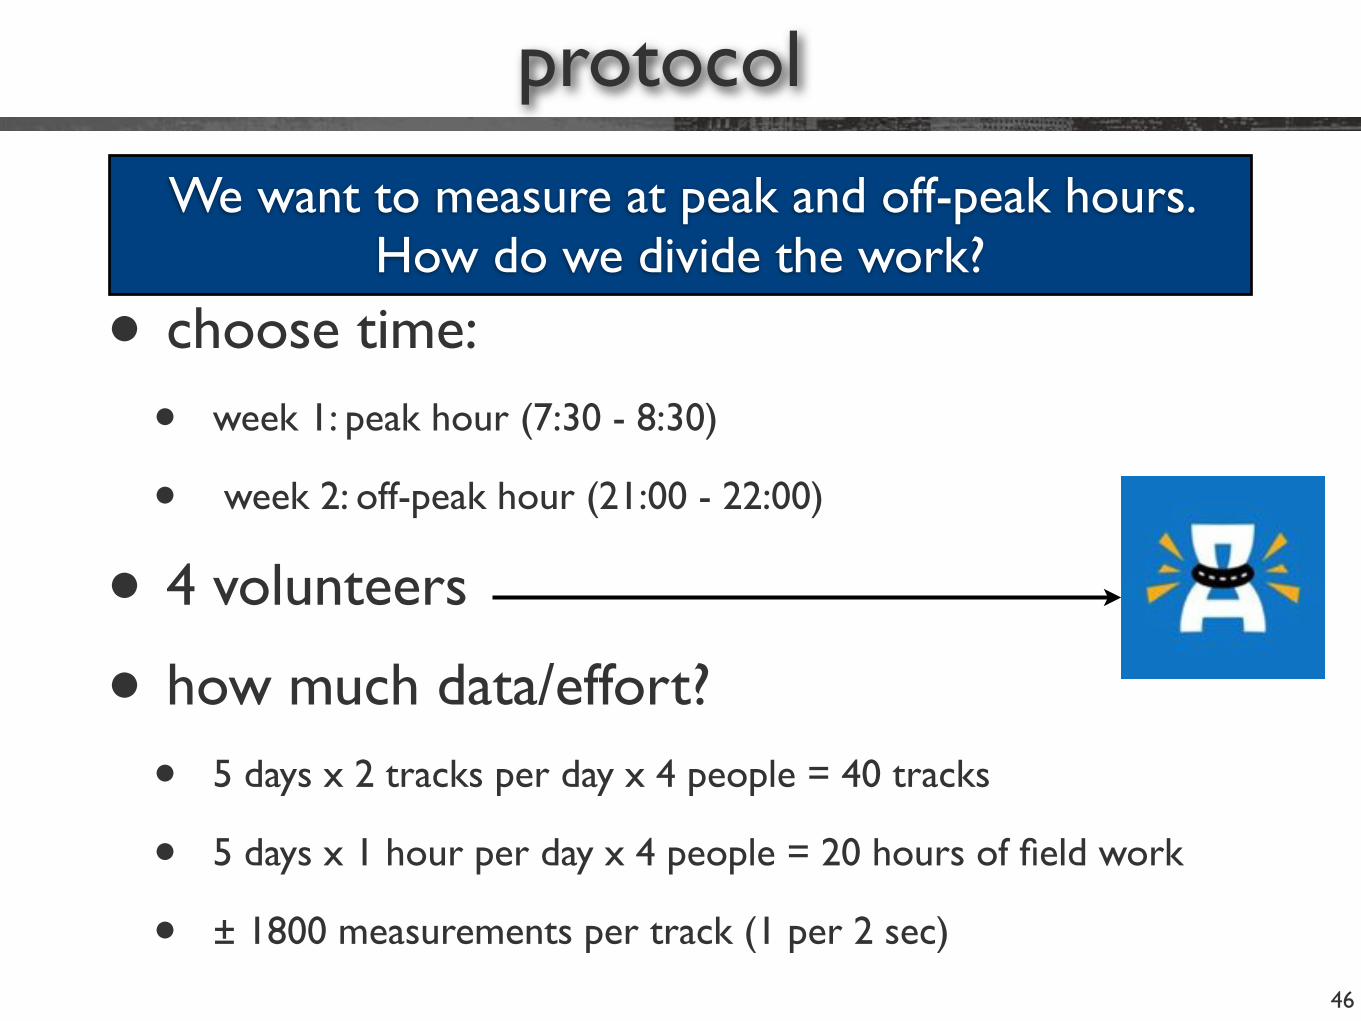
protocol
46
• choose time:
• week 1: peak hour (7:30 - 8:30)
• week 2: off-peak hour (21:00 - 22:00)
• 4 volunteers
• how much data/effort?
• 5 days x 2 tracks per day x 4 people = 40 tracks
• 5 days x 1 hour per day x 4 people = 20 hours of field work
• ± 1800 measurements per track (1 per 2 sec)
We want to measure at peak and off-peak hours. How do we divide the work?
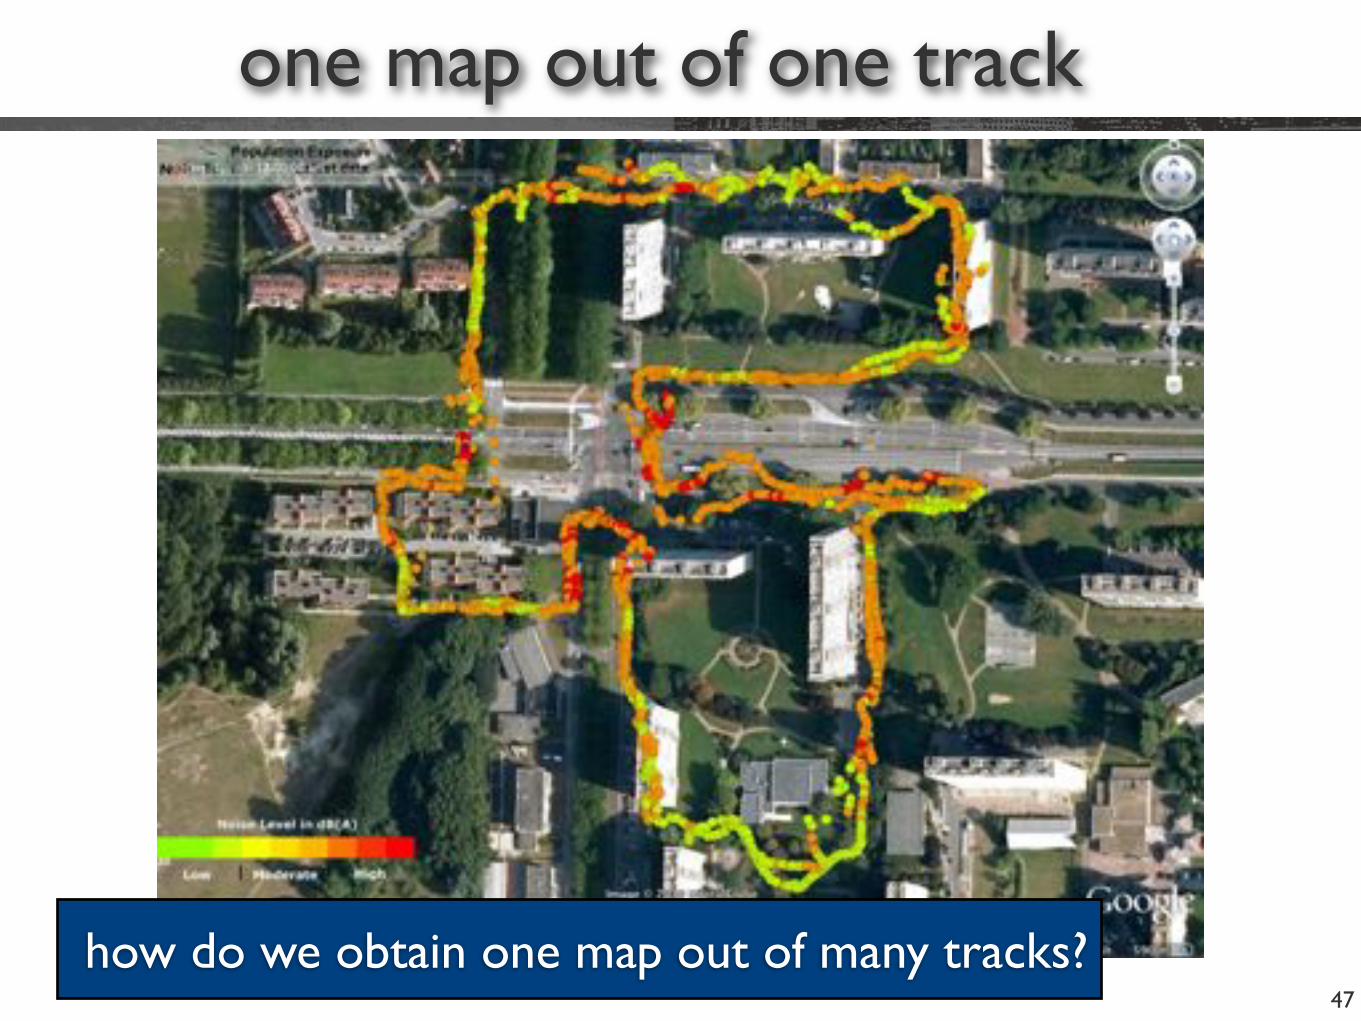
one map out of one track
47
how do we obtain one map out of many tracks?
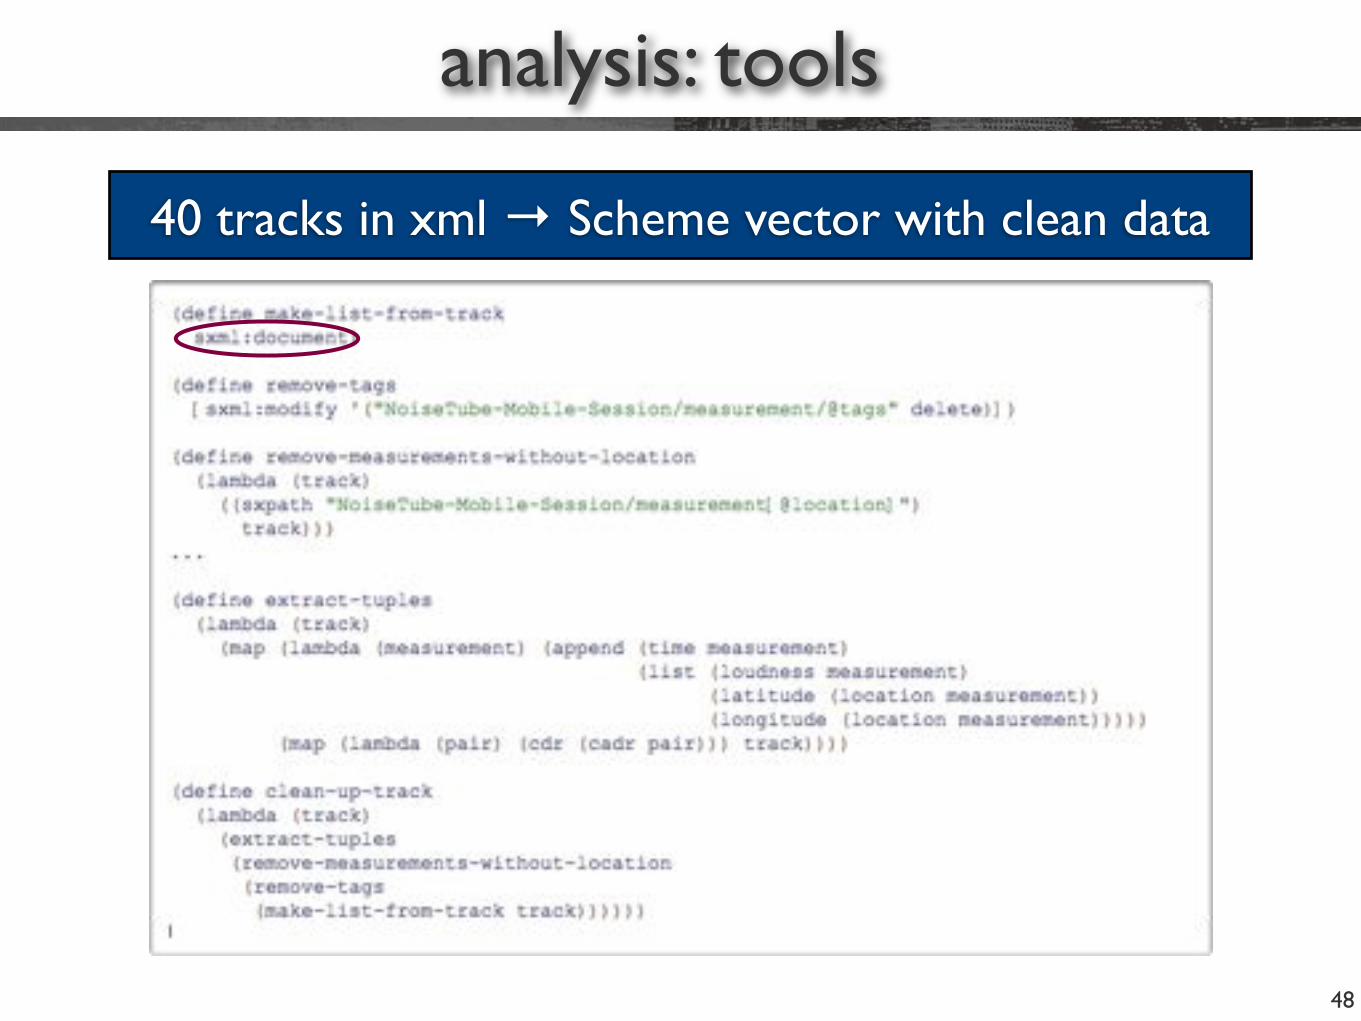
analysis: tools
48
40 tracks in xml → Scheme vector with clean data
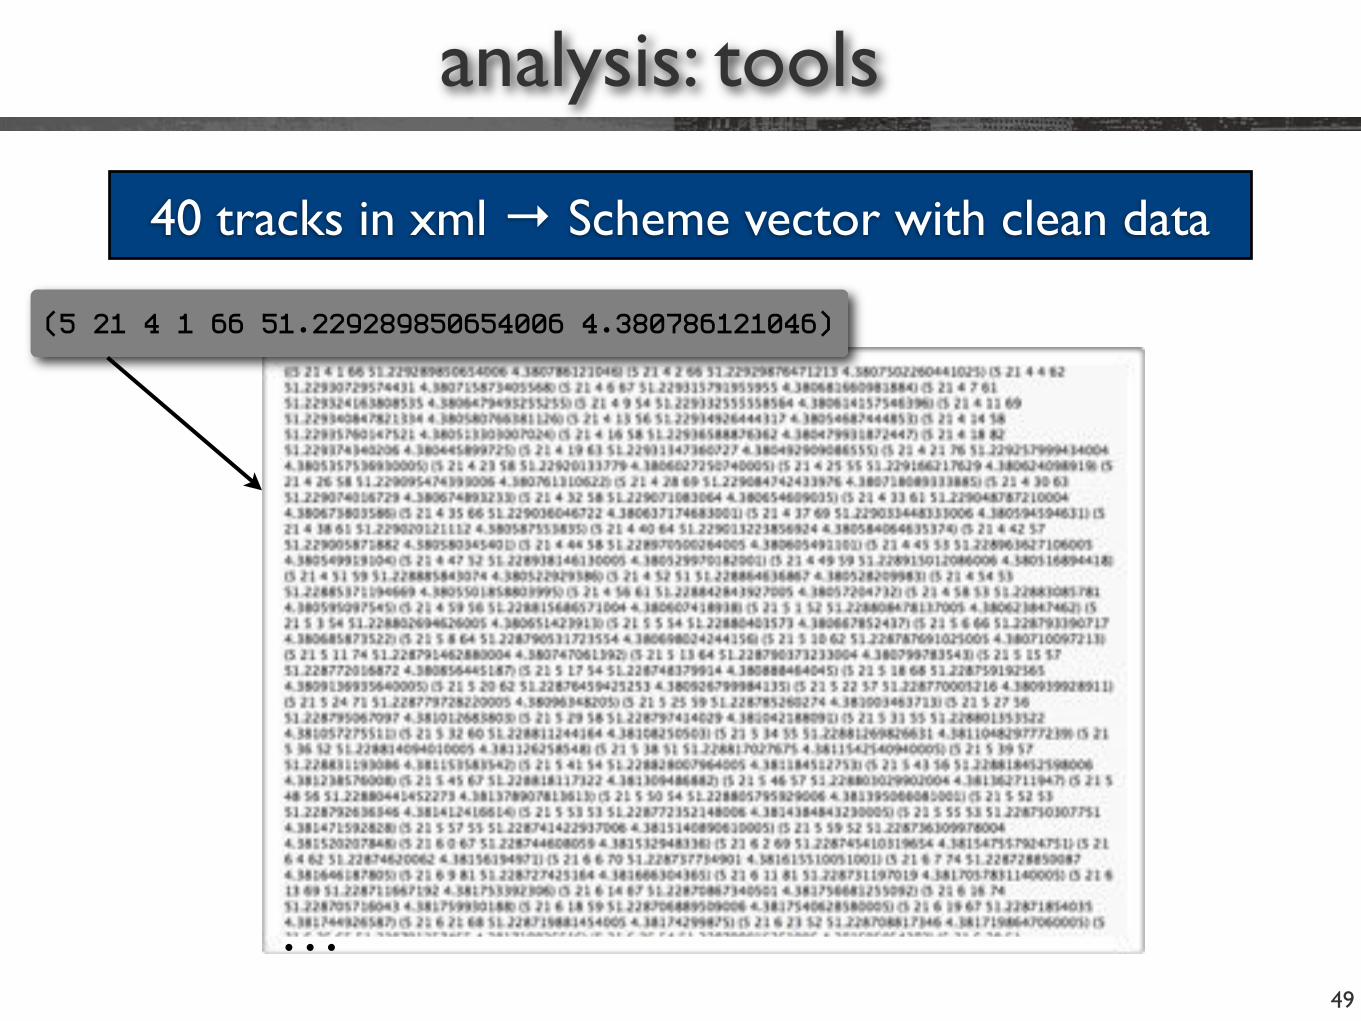
analysis: tools
49
40 tracks in xml → Scheme vector with clean data
...
(5 21 4 1 66 51.229289850654006 4.380786121046)
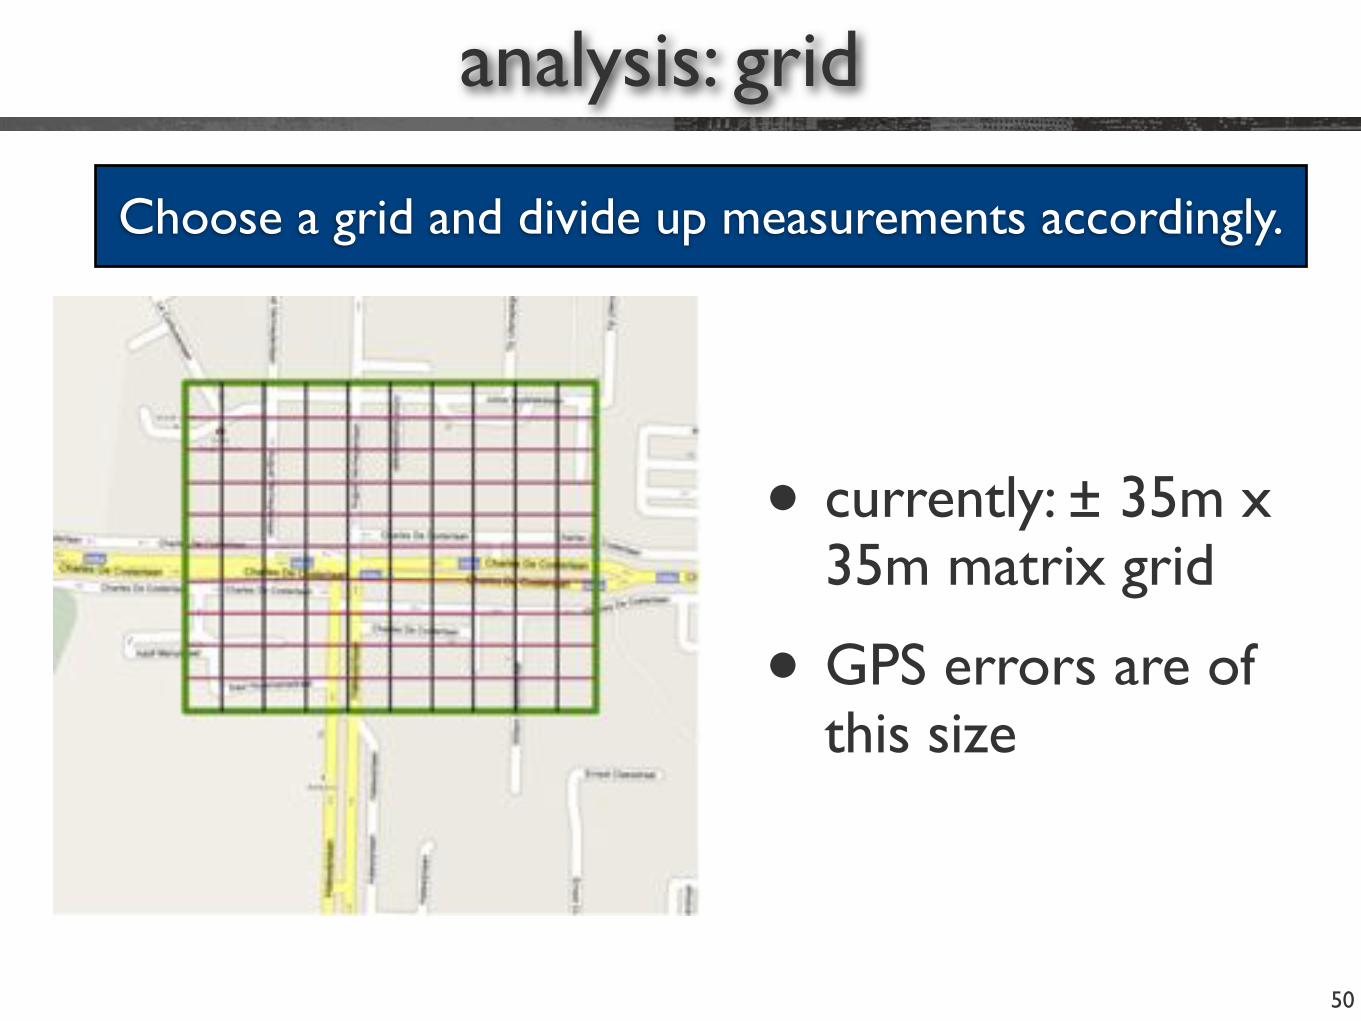
analysis: grid
50
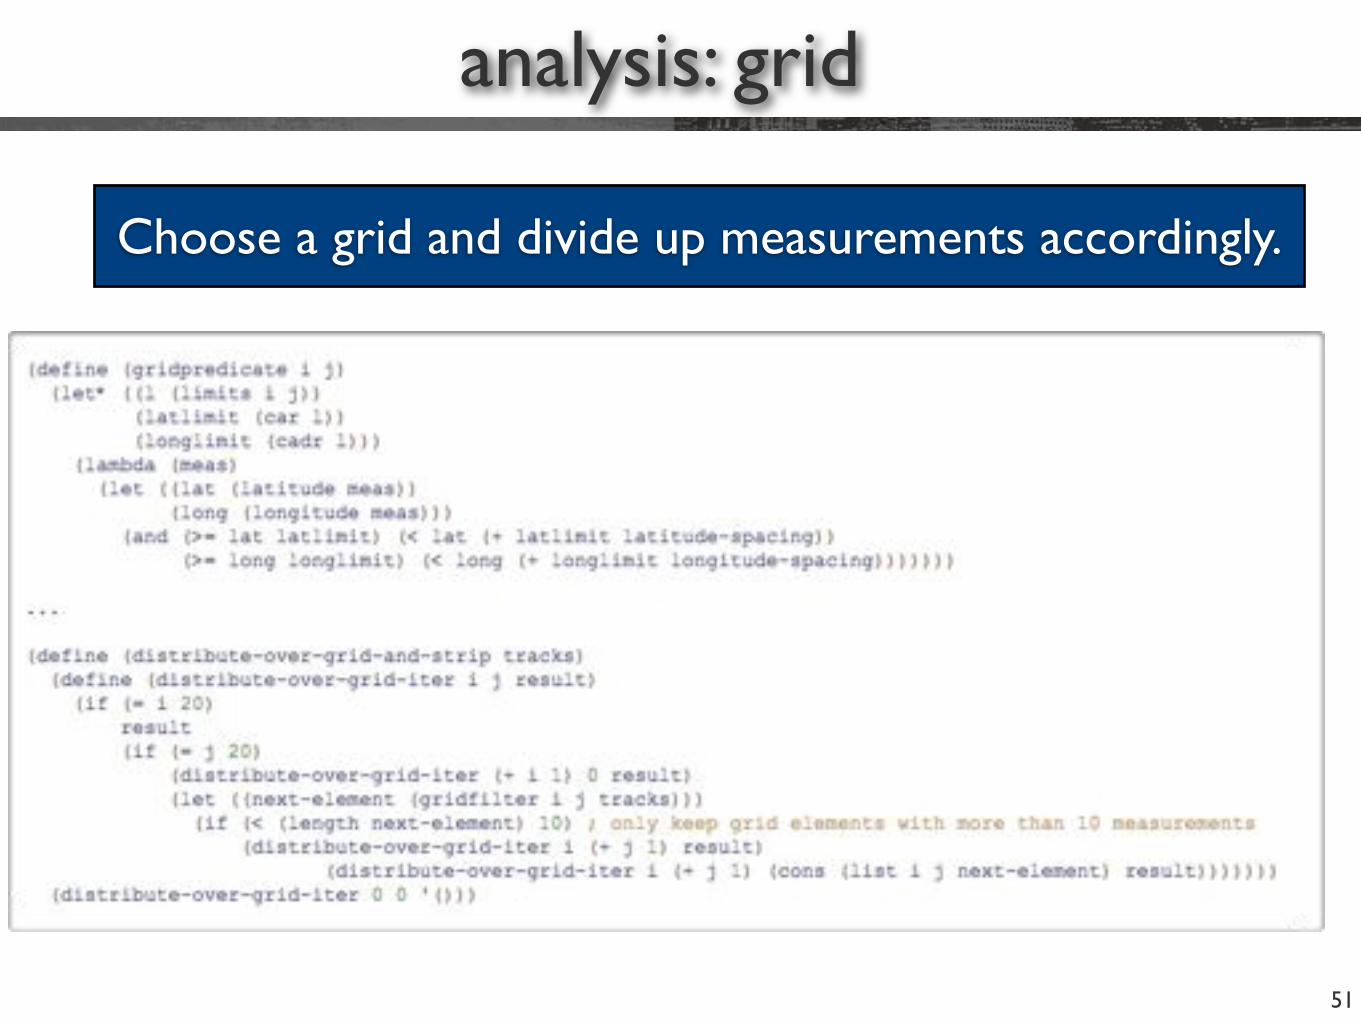
Choose a grid and divide up measurements accordingly.
• currently: ± 35m x 35m matrix grid
• GPS errors are of this size
analysis: grid
51
Choose a grid and divide up measurements accordingly.
analysis: statistics
52
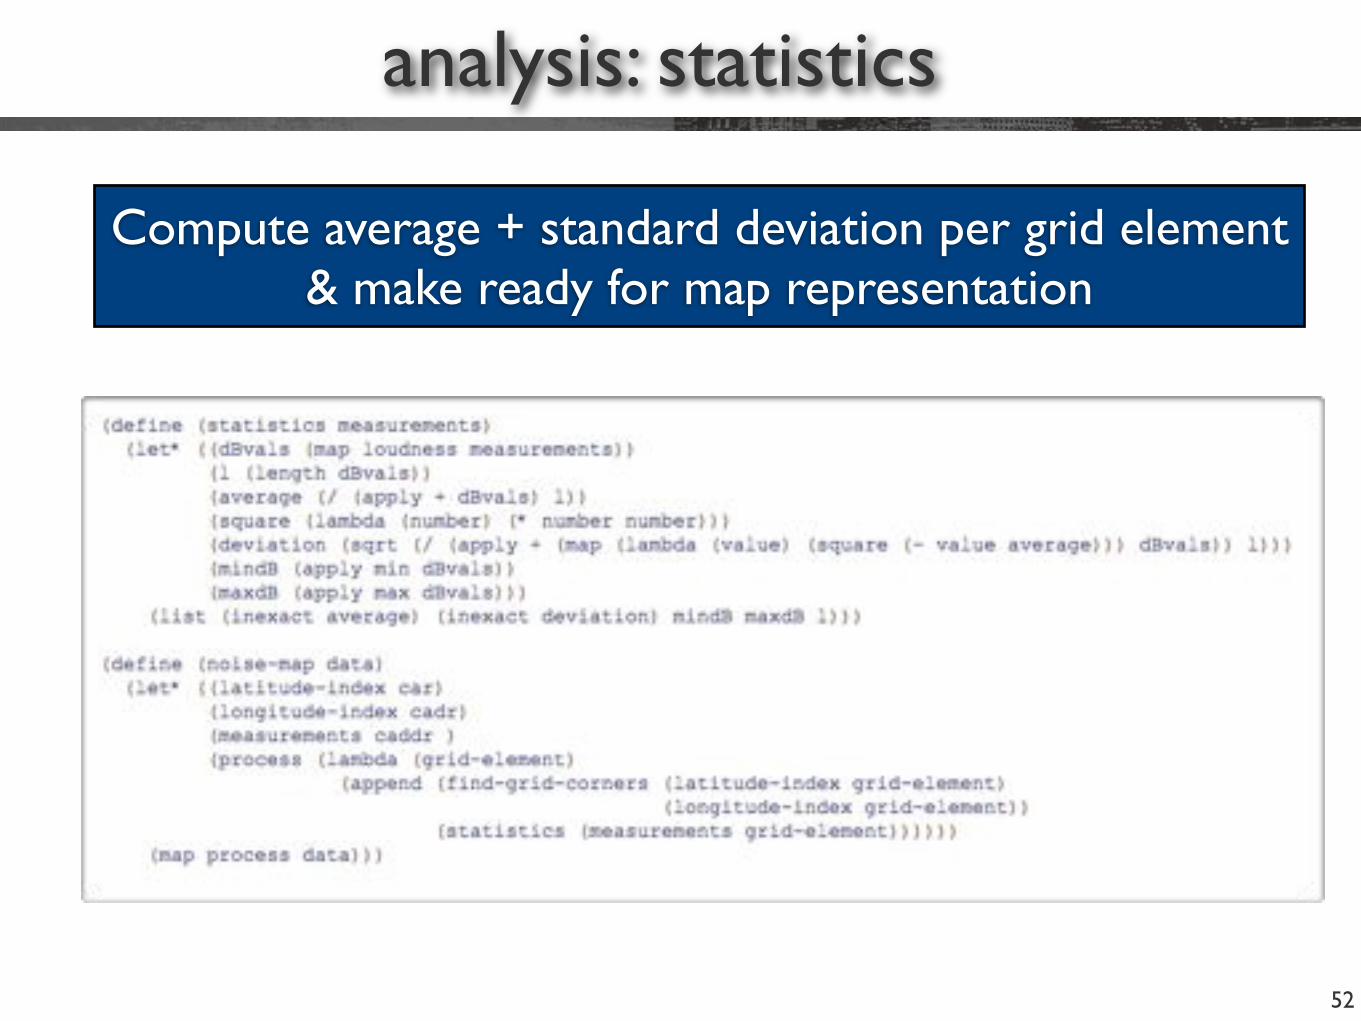
Compute average + standard deviation per grid element & make ready for map representation
results: noise map
53
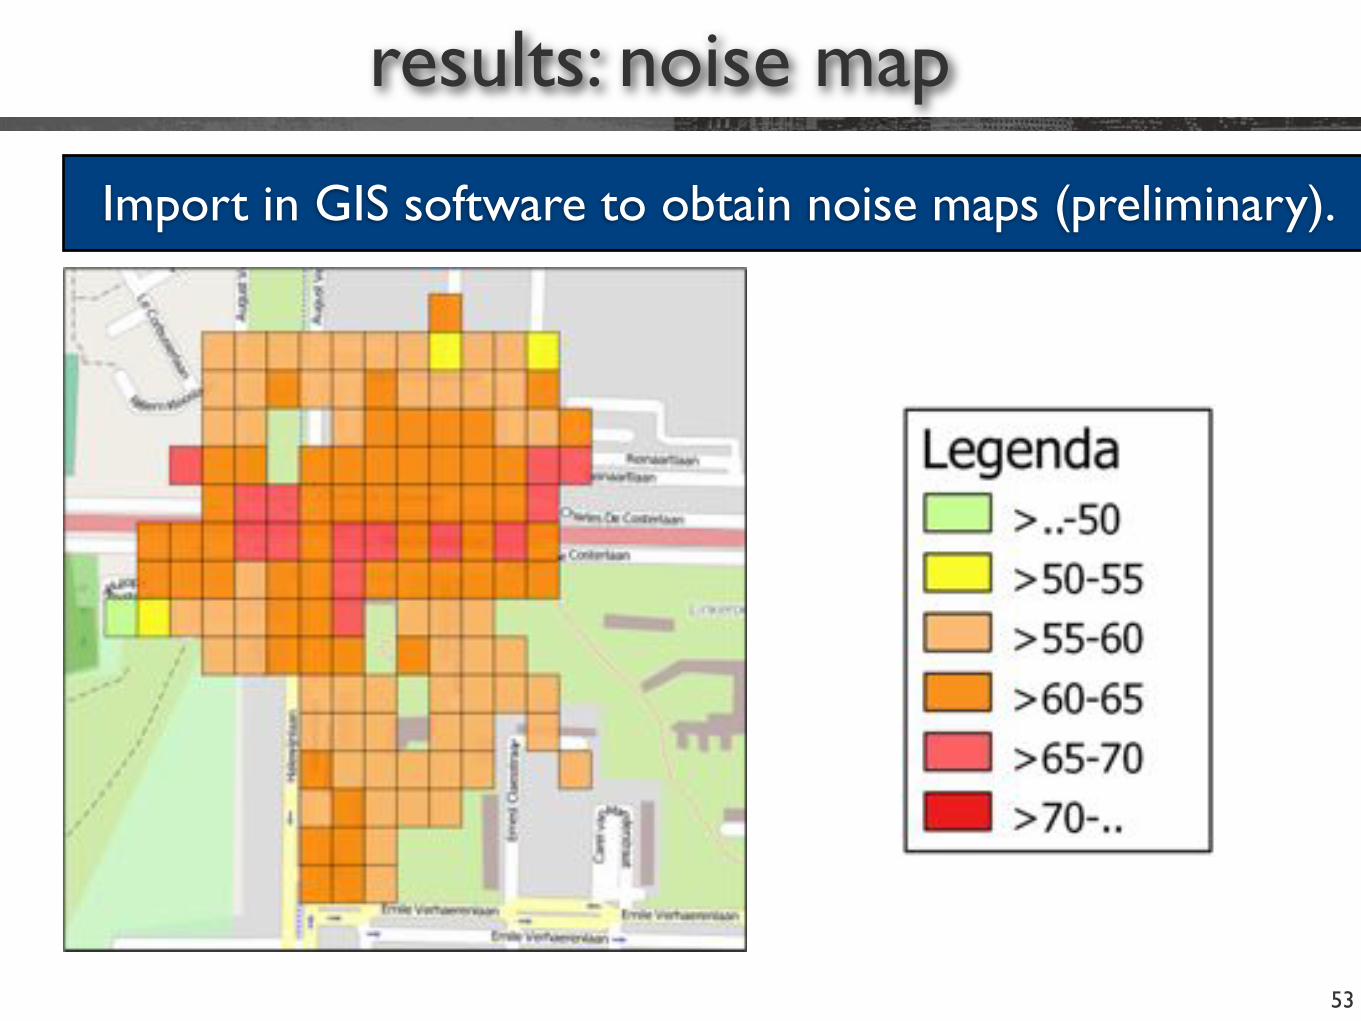
Import in GIS software to obtain noise maps (preliminary).
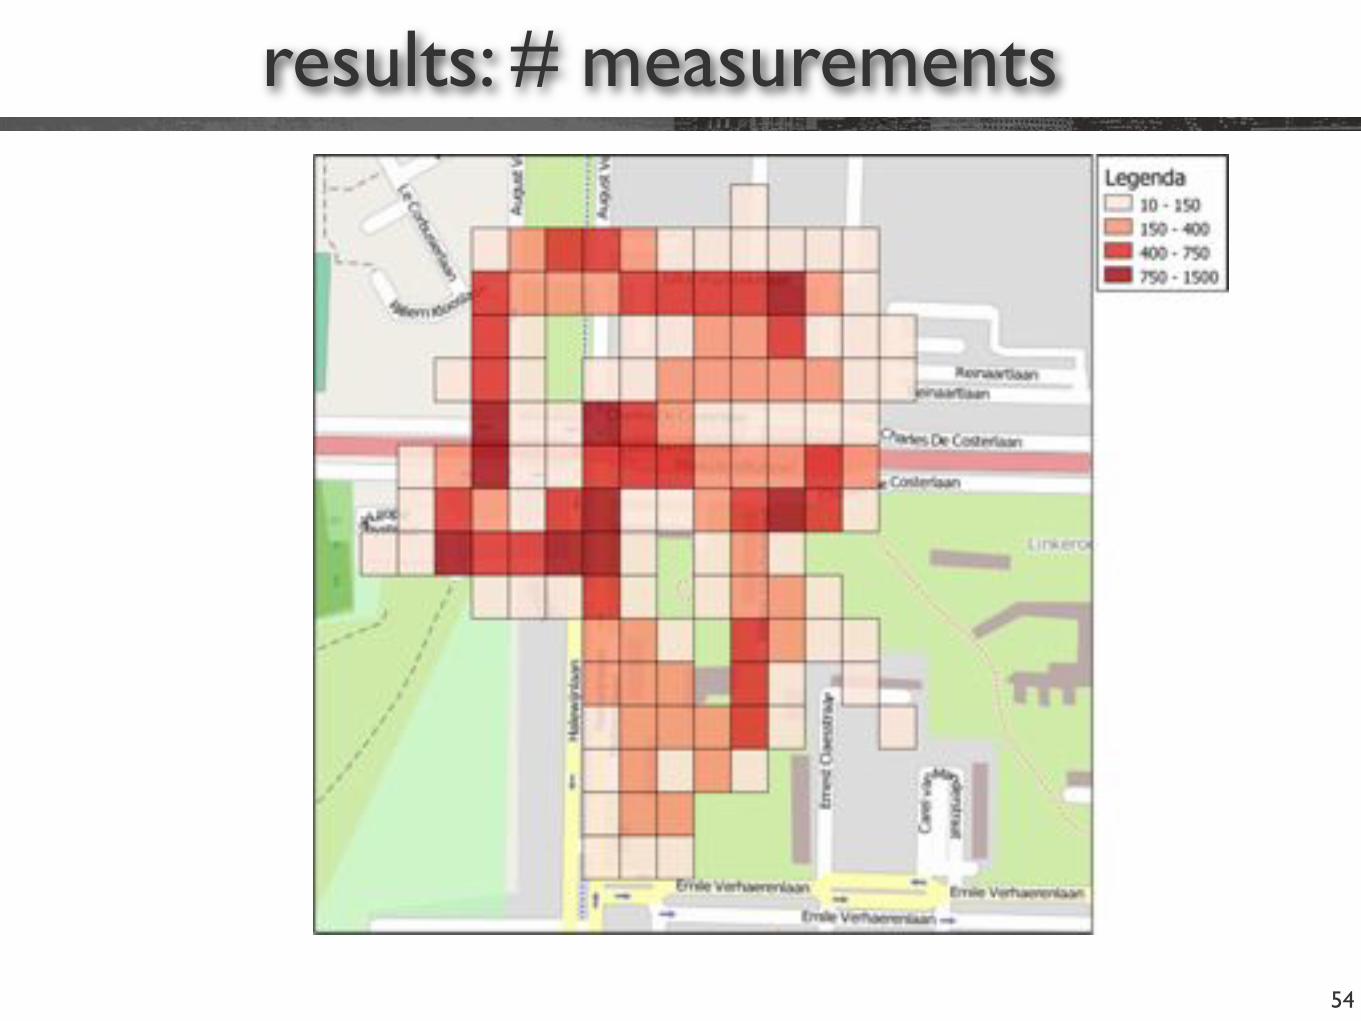
results: # measurements
54
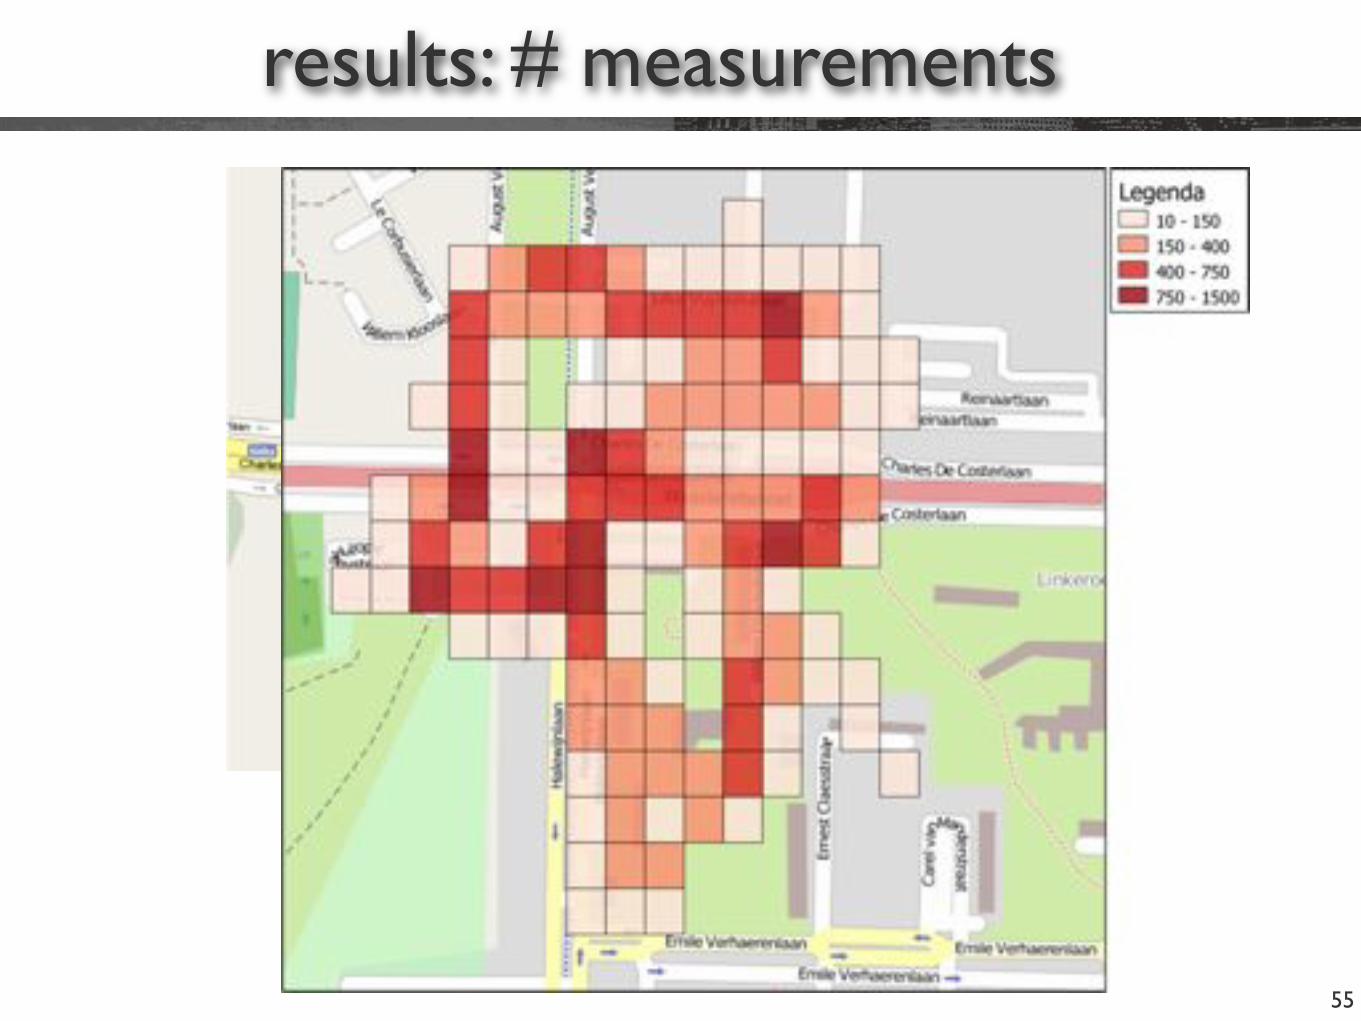
results: # measurements
55
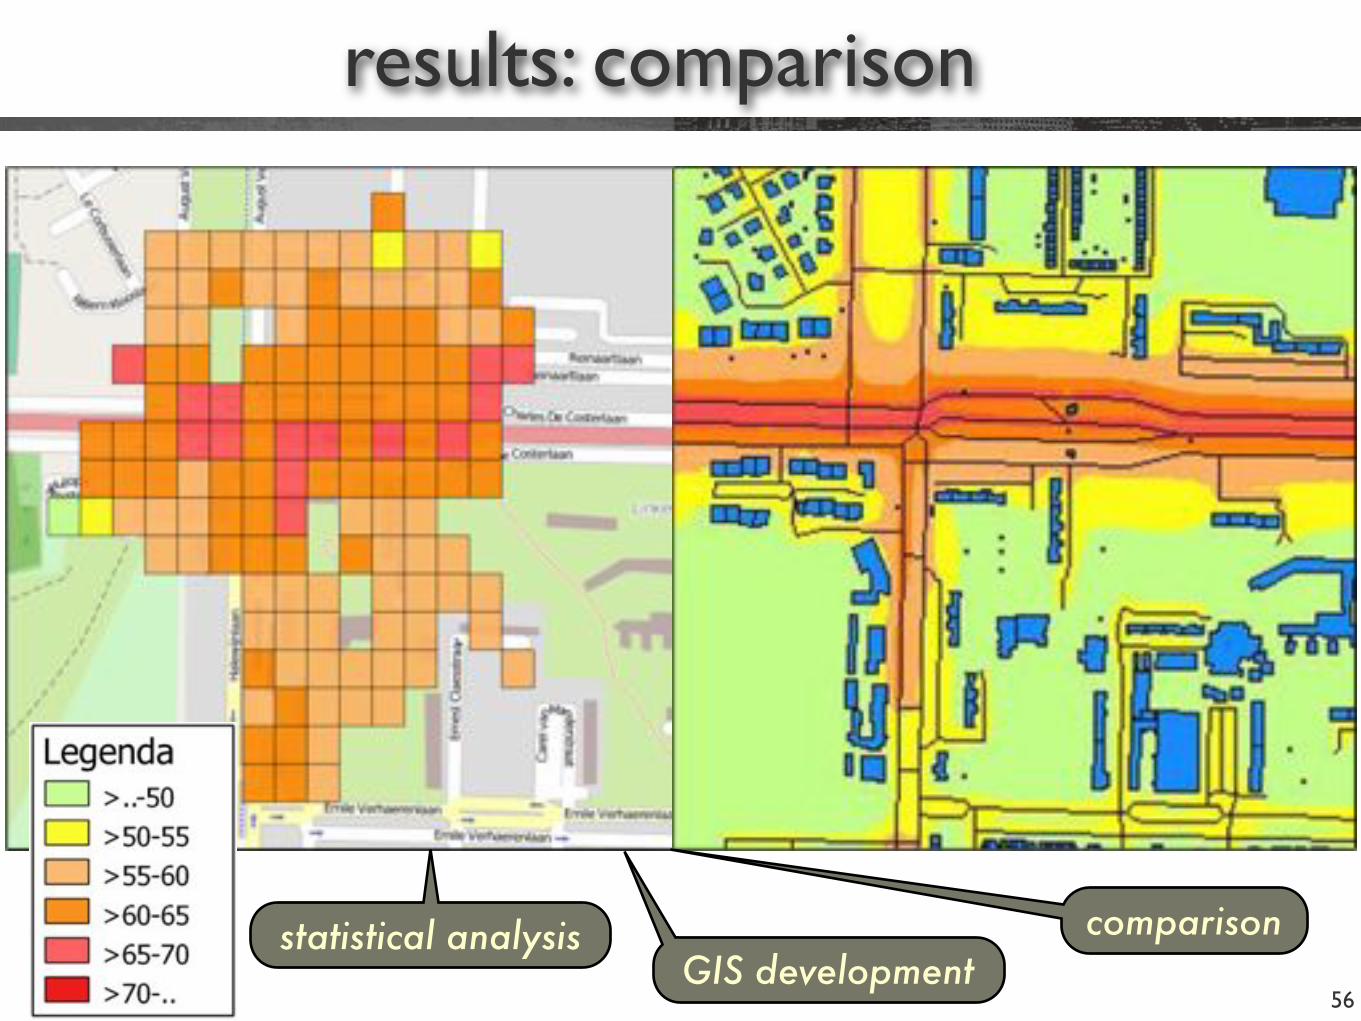
results: comparison
56
statistical analysisGIS development
comparison
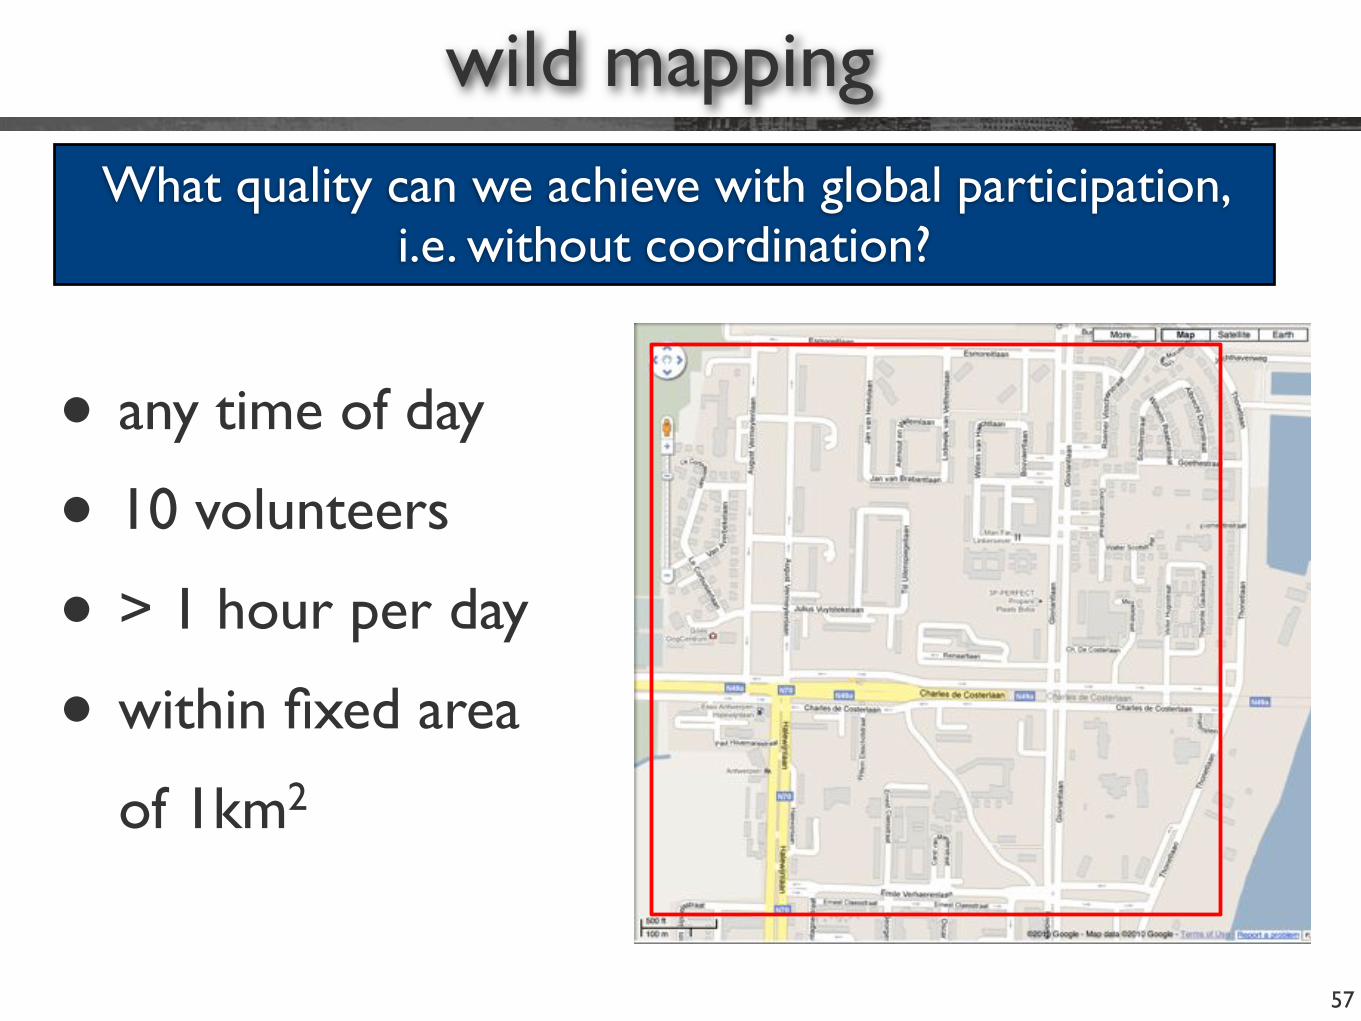
wild mapping
57
• any time of day
• 10 volunteers
• > 1 hour per day
• within fixed area
of 1km2
What quality can we achieve with global participation, i.e. without coordination?
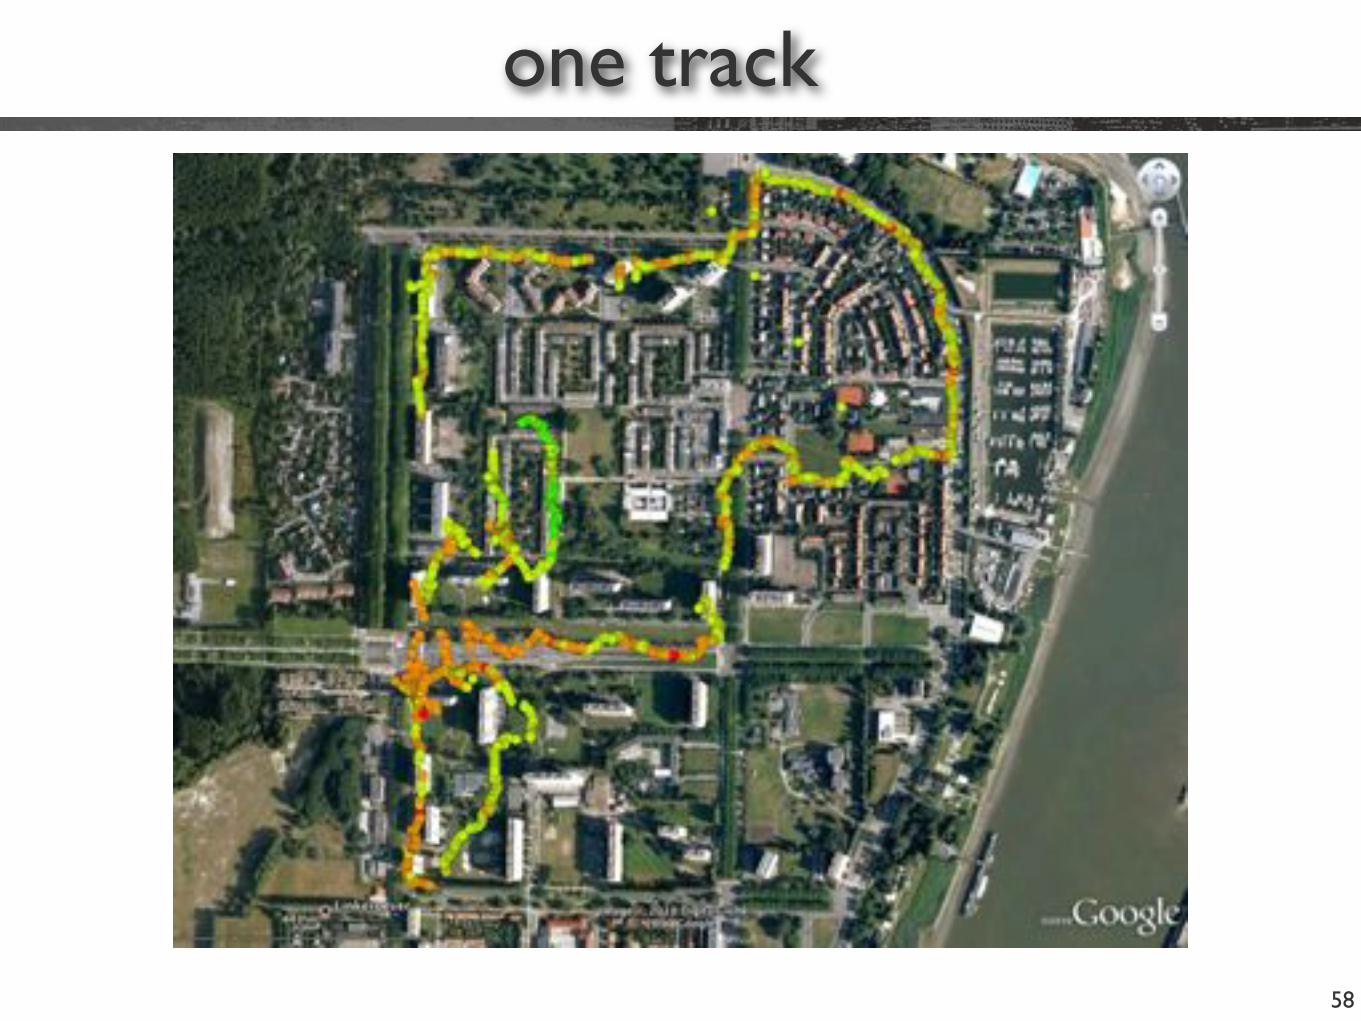
one track
58
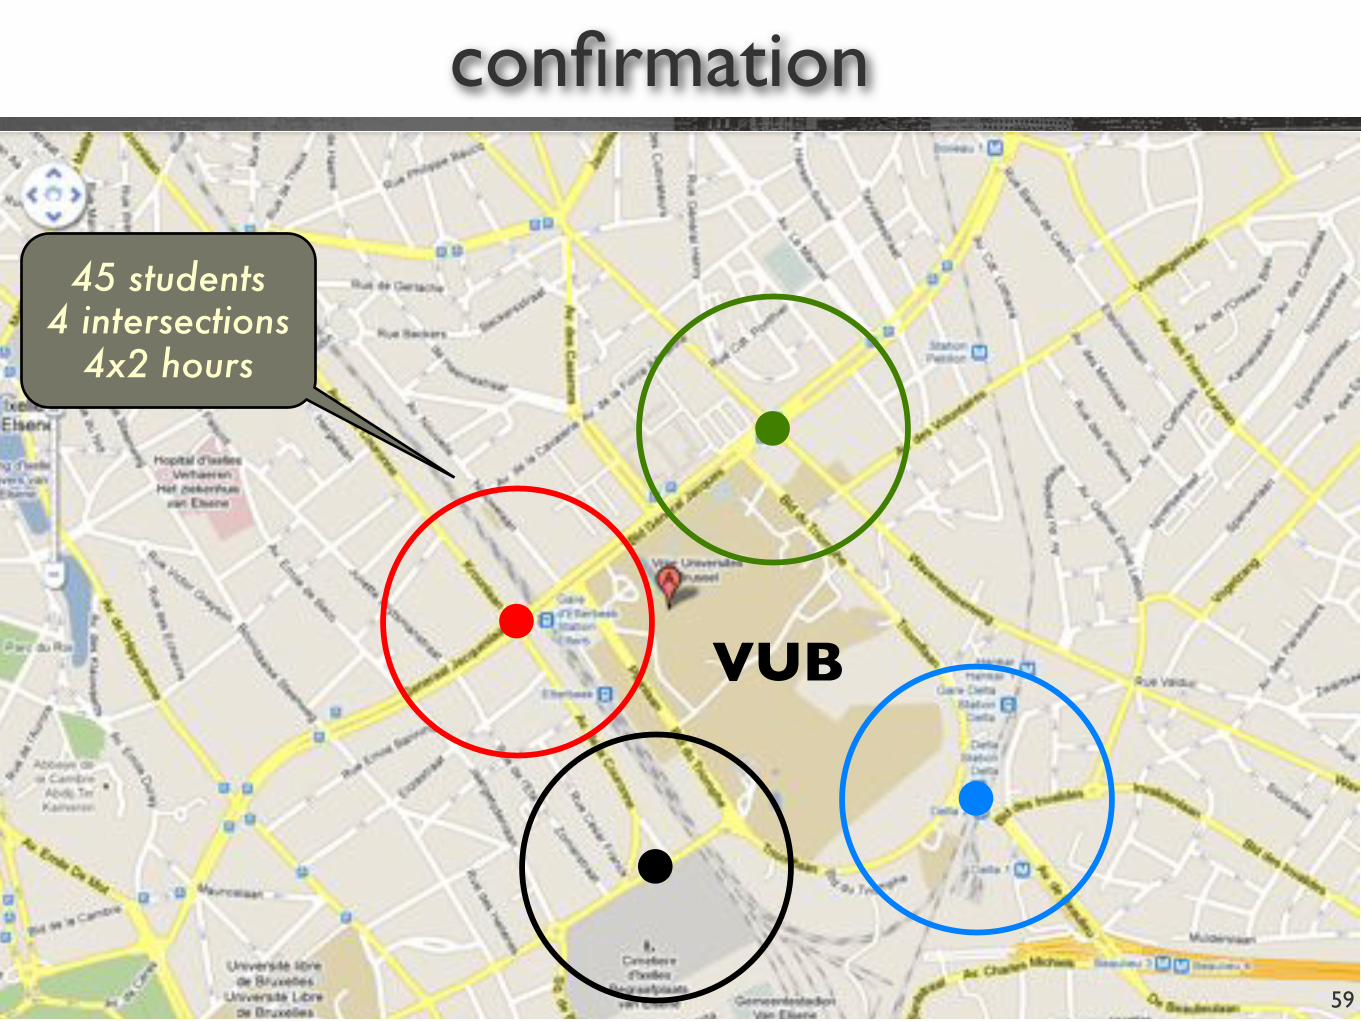
confirmation
59
45 students4 intersections
4x2 hours
VUB
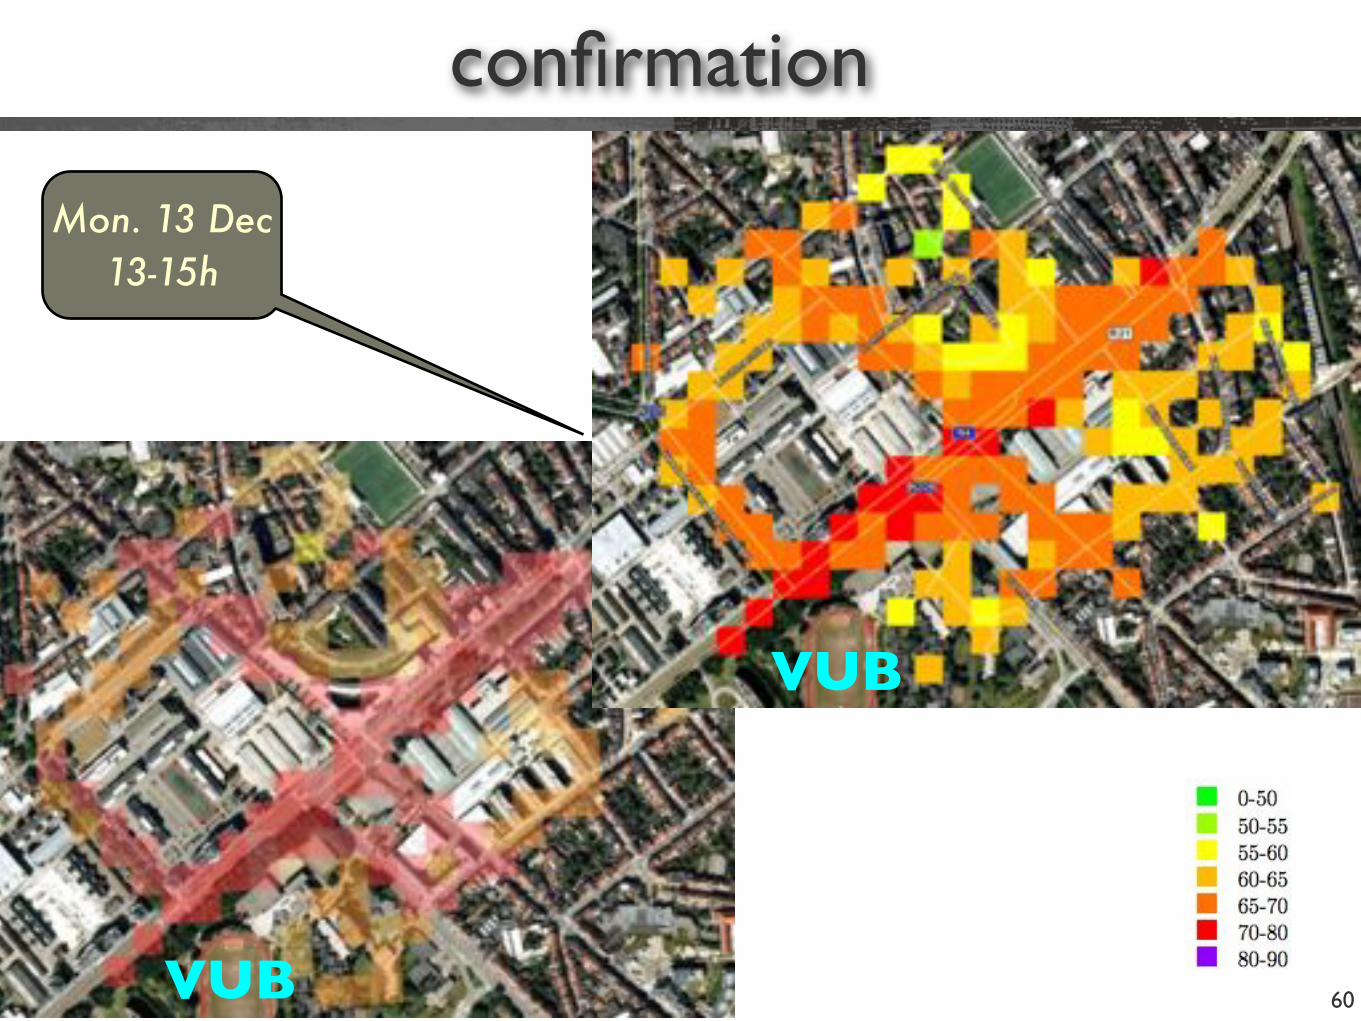
confirmation
60
Mon. 13 Dec13-15h
VUB
VUB
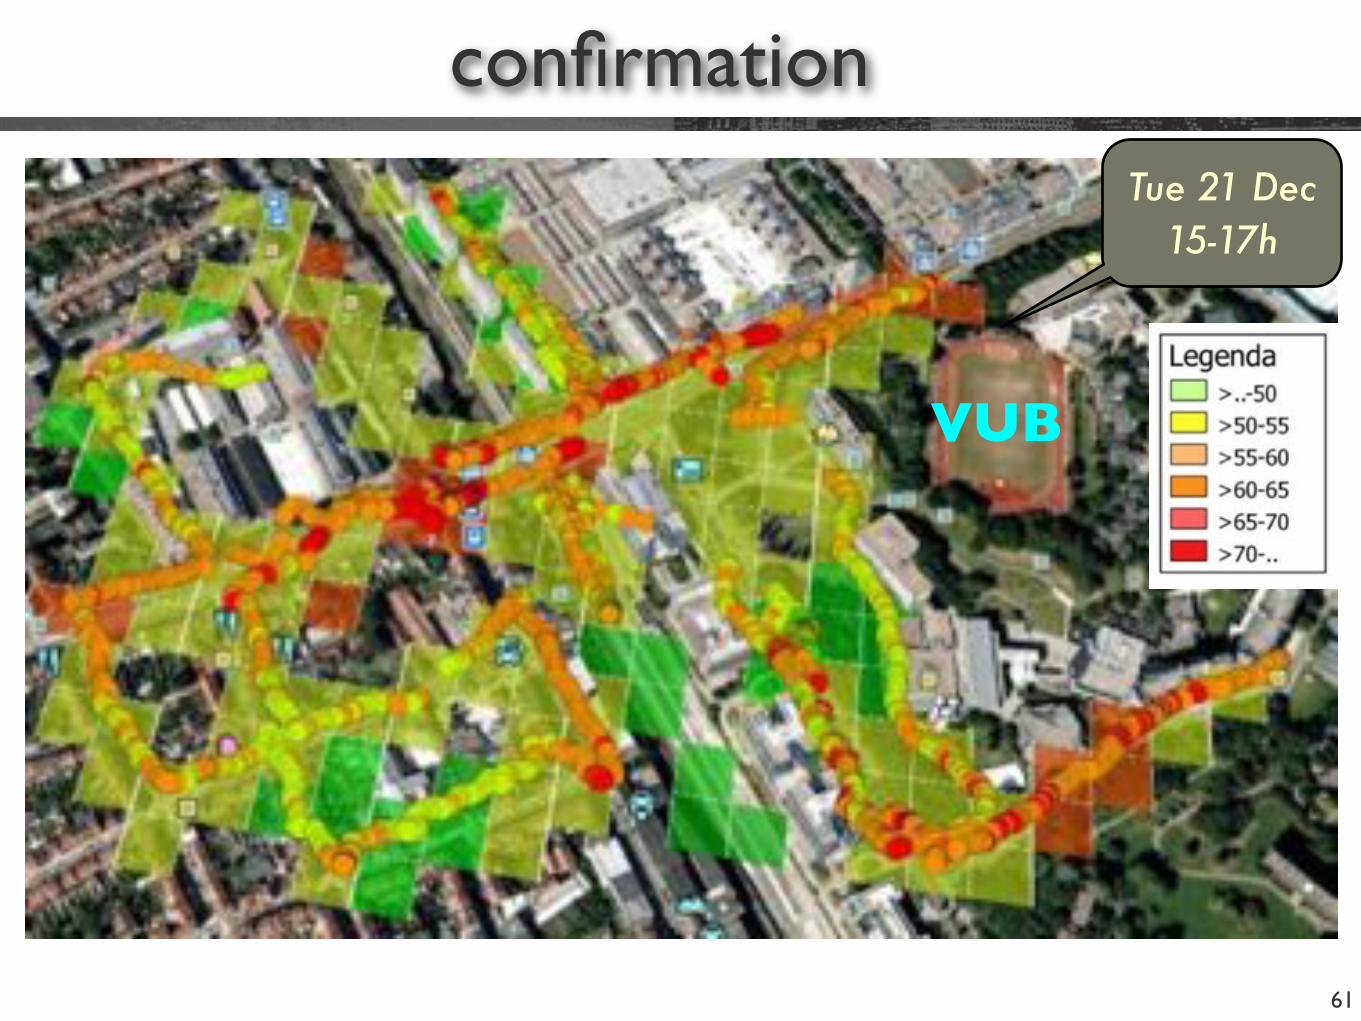
confirmation
61
VUB
Tue 21 Dec15-17h
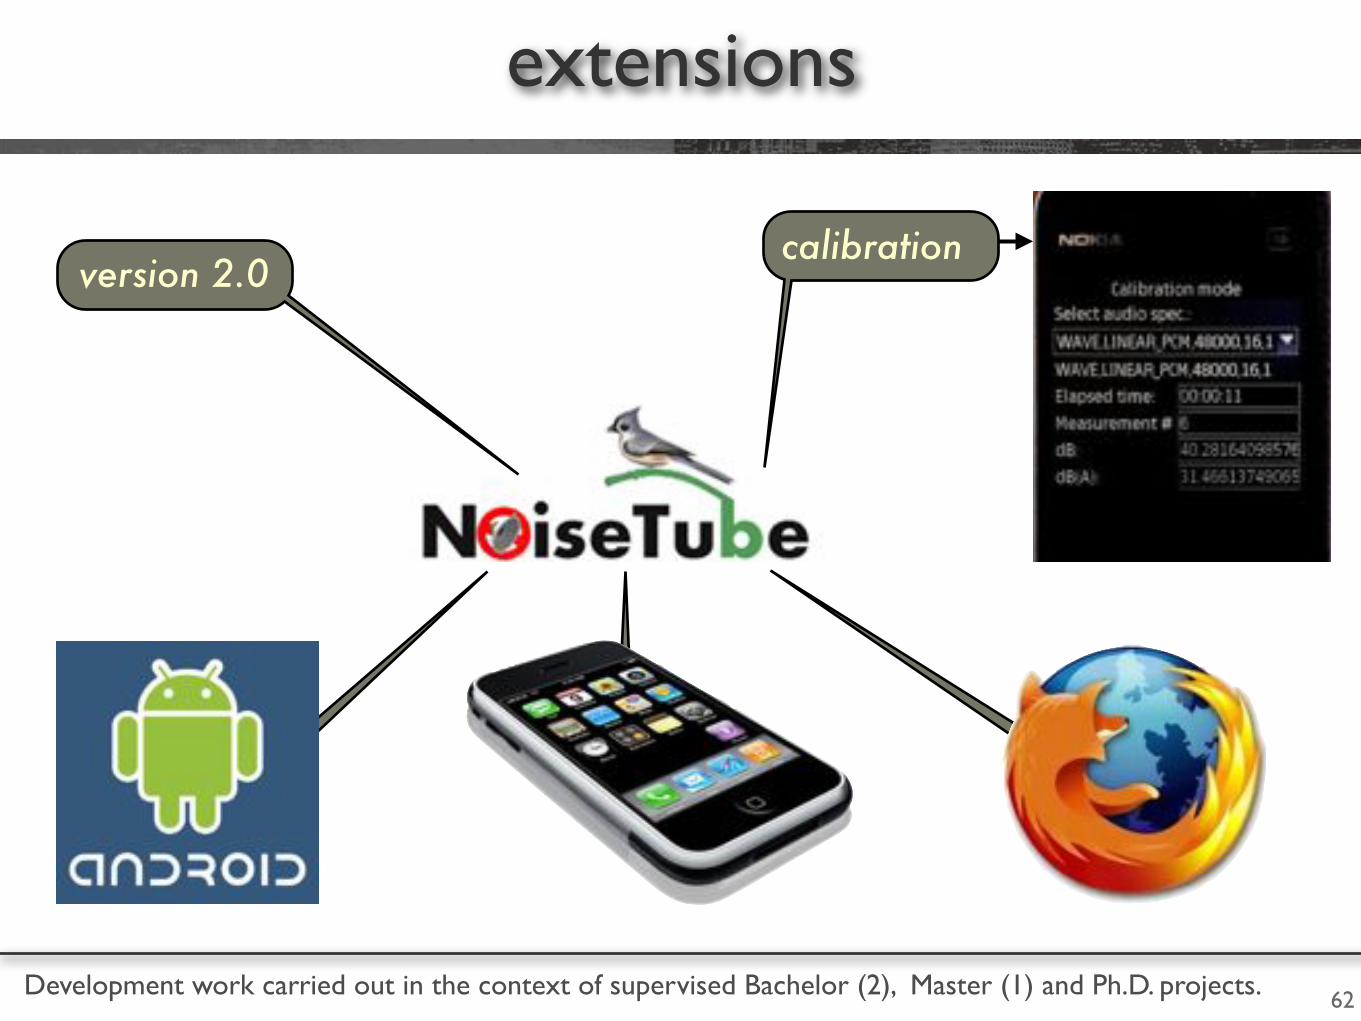
62
extensions
version 2.0calibration
Development work carried out in the context of supervised Bachelor (2), Master (1) and Ph.D. projects.
63
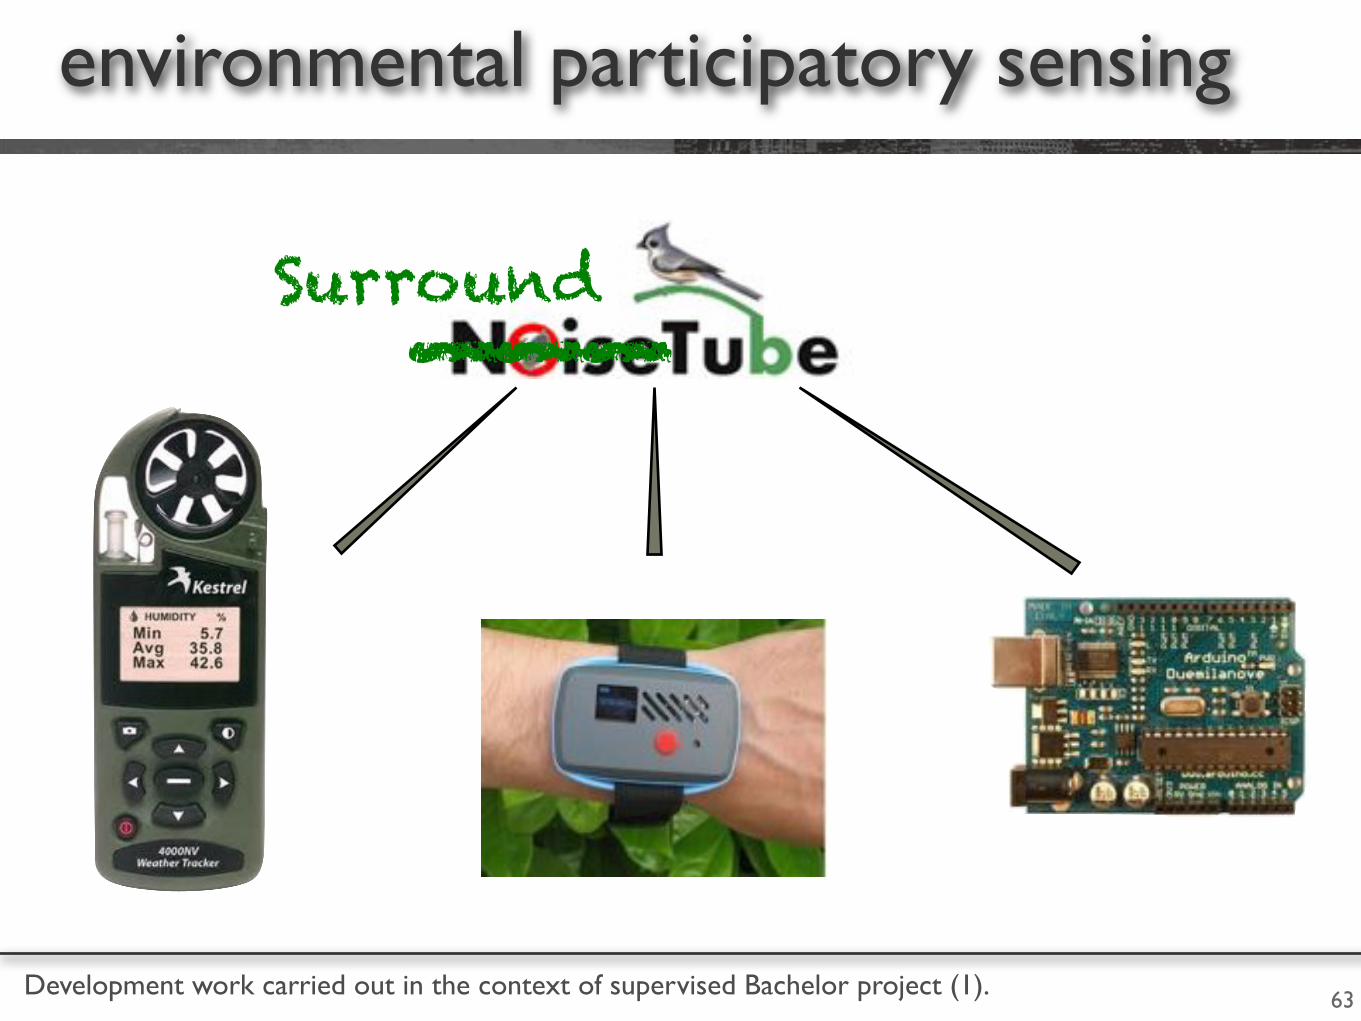
environmental participatory sensing
Development work carried out in the context of supervised Bachelor project (1).
Surround___
64
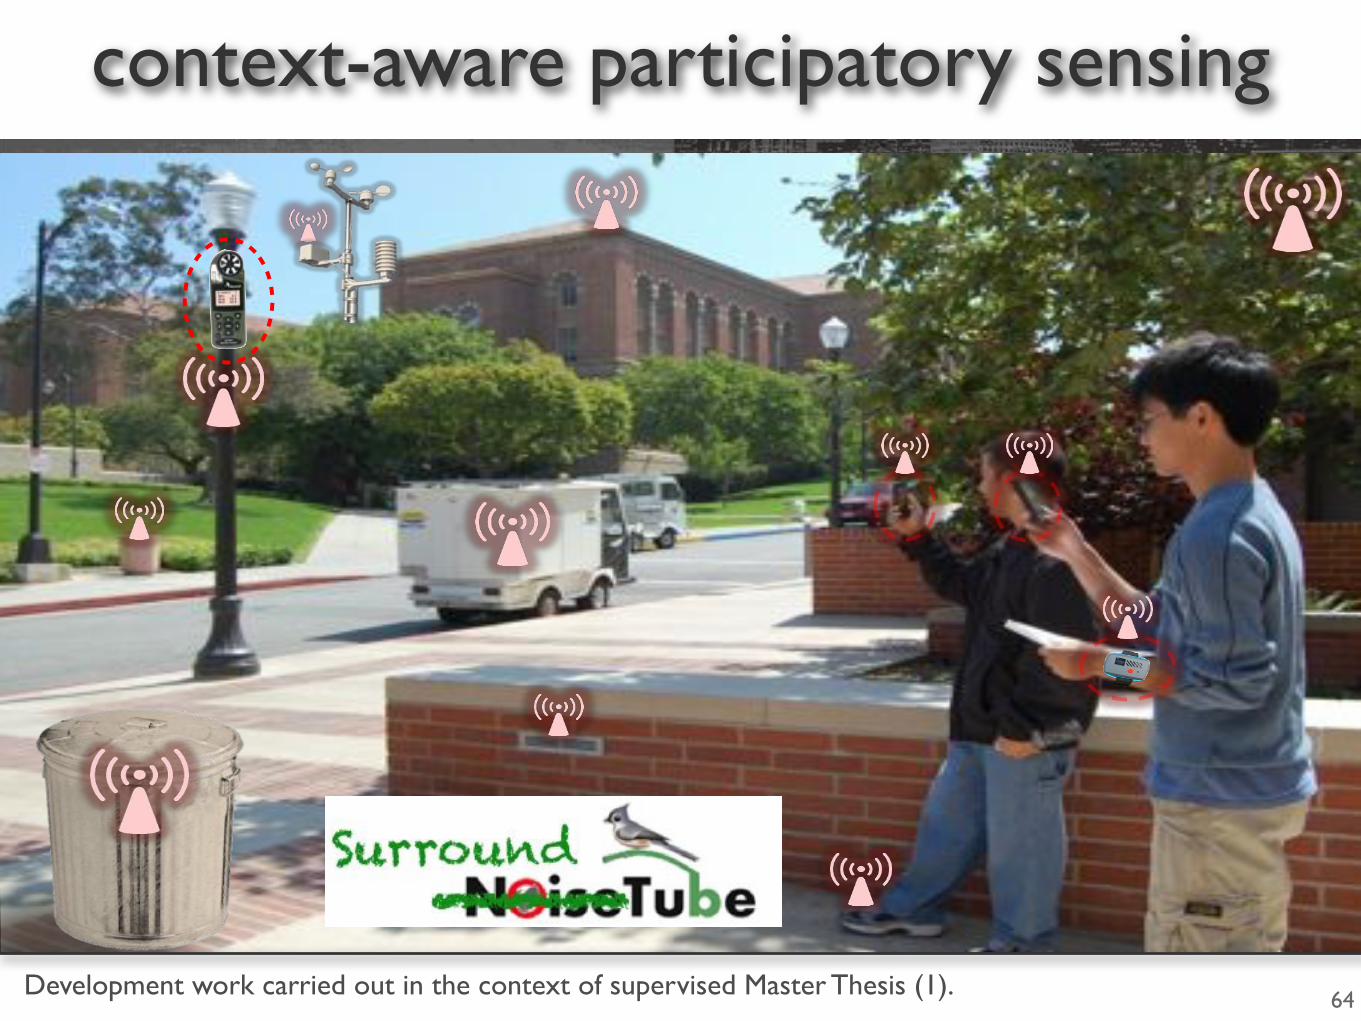
context-aware participatory sensing
Development work carried out in the context of supervised Master Thesis (1).

... to the public at large, the scientific and engineering community, as well as governmental policy makers.
dissemination
65
Exploratory Workshop: IoT for a Sustainable Future
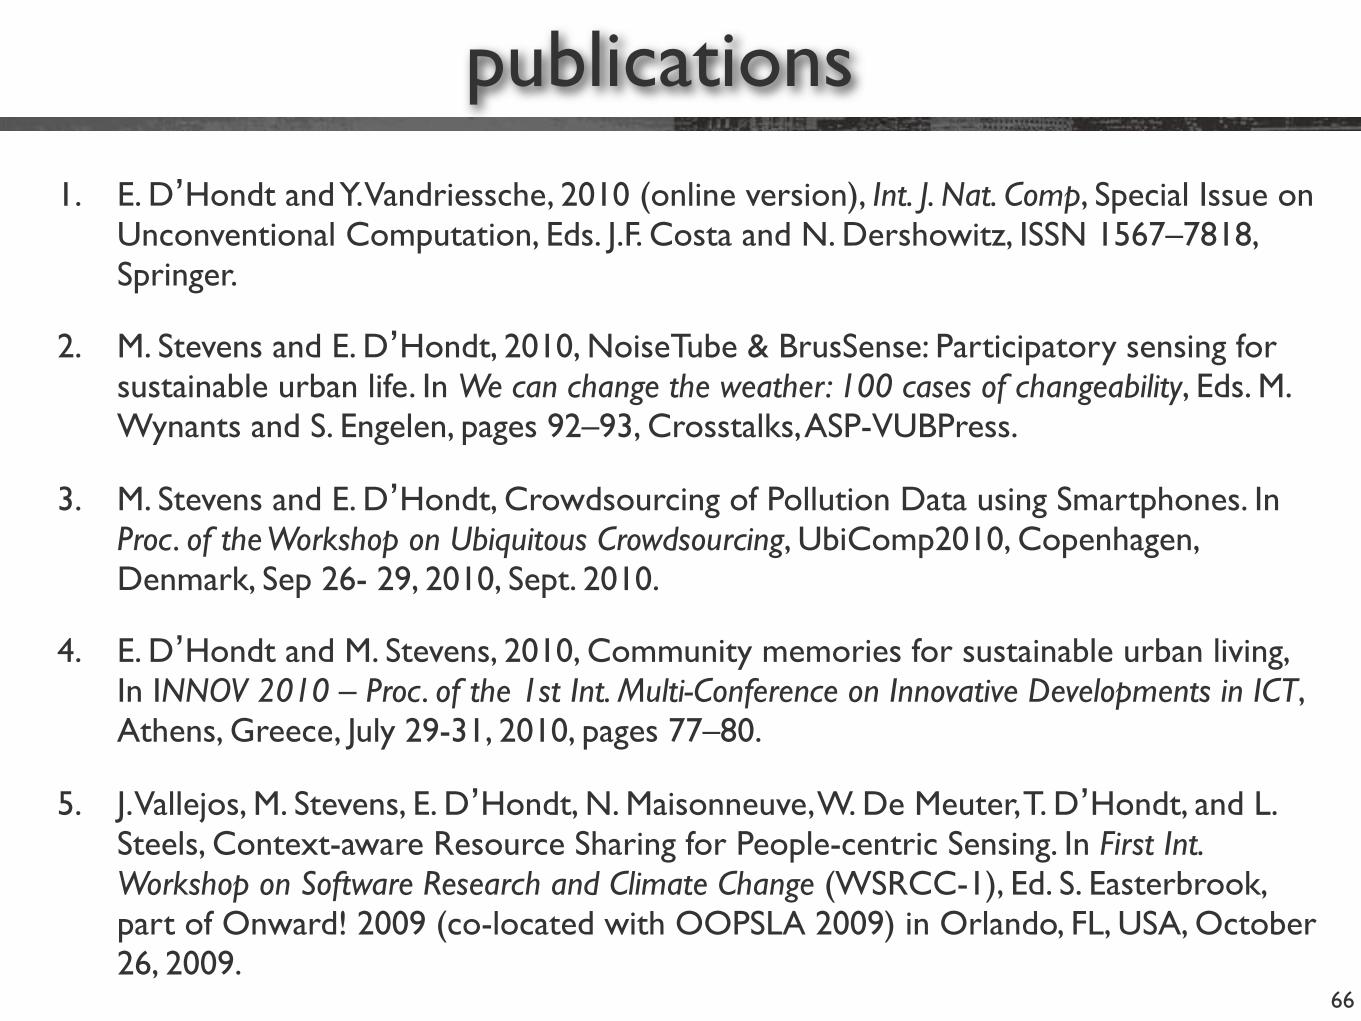
publications
1. E. D’Hondt and Y. Vandriessche, 2010 (online version), Int. J. Nat. Comp, Special Issue on Unconventional Computation, Eds. J.F. Costa and N. Dershowitz, ISSN 1567–7818, Springer.
2. M. Stevens and E. D’Hondt, 2010, NoiseTube & BrusSense: Participatory sensing for sustainable urban life. In We can change the weather: 100 cases of changeability, Eds. M. Wynants and S. Engelen, pages 92–93, Crosstalks, ASP-VUBPress.
3. M. Stevens and E. D’Hondt, Crowdsourcing of Pollution Data using Smartphones. In Proc. of the Workshop on Ubiquitous Crowdsourcing, UbiComp2010, Copenhagen, Denmark, Sep 26- 29, 2010, Sept. 2010.
4. E. D’Hondt and M. Stevens, 2010, Community memories for sustainable urban living, In INNOV 2010 – Proc. of the 1st Int. Multi-Conference on Innovative Developments in ICT, Athens, Greece, July 29-31, 2010, pages 77–80.
5. J. Vallejos, M. Stevens, E. D’Hondt, N. Maisonneuve, W. De Meuter, T. D’Hondt, and L. Steels, Context-aware Resource Sharing for People-centric Sensing. In First Int. Workshop on Software Research and Climate Change (WSRCC-1), Ed. S. Easterbrook, part of Onward! 2009 (co-located with OOPSLA 2009) in Orlando, FL, USA, October 26, 2009.
66