Participation of South-East European countries in the ...€¦ · Participation of South-East...
66
July 2010 Participation of South-East European countries in the competitive funding programmes for research in the European Commission Report to UNESCO-BRESCE www.technopolis-group.com Lorena Rivera León and Alasdair Reid Report to UNESCO BRESCE
Transcript of Participation of South-East European countries in the ...€¦ · Participation of South-East...

July 2010
Participation of South-East European countries in the competitive funding programmes for research in the European Commission
Report to UNESCO-BRESCE
www.technopolis-group.com
Lorena Rivera León and Alasdair Reid
Report to UNESCO BRESCE


SEE Countries in EU RTDI funding programmes, Technopolis 2010 i
Table of Contents Introduction 11. SEE countries eligibility for European research funding programmes 2
2. Comparative performance of SEE countries in the Framework Programme for
Research and Technological Development 6
2.1 Framework Programme 6 (FP6) 62.2 Framework Programme 7 (FP7) 8
3. Participation of SEE countries in COST and EUREKA 18
3.1 COST 183.2 EUREKA 20
4. Conclusions and recommendations 22
4.1 Conclusions 224.2 Recommendations 23
Appendix A - References 25
Appendix B - Additional data tables and country pages 25
Figure 1 : Western Balkan countries eligibility for EU RTDI funding programmes 2Figure 2 : SEE FP6 participations and financial contribution by country 6Figure 3: summary of co-operation patterns under FP6, Western Balkan countries 7Figure 4 SEE participation in FP7 9Figure 5: number of eligible proposals with at least one applicant in country and success rates, FP7 10Figure 6 : number of eligible FP7 proposals and success rates in SEE countries by theme 11Figure 7 : top 3 broad fields with largest shares of scientific publications in all publications, SEE 2001-2009 12Figure 8 : top links of SEE countries in main-listed proposals with all FP7 participant countries and success rates 12Figure 9 : Number of eligible proposals with at least one applicant in country and success rates, INCO-NETS 13Figure 10: Number of eligible proposals with at least one applicant in country and success rates, ERA-NETS 14Figure 11: European Commission’s contributions and requested contributions in FP715Figure 12 : Per capita EC contributions in signed grant agreements vs. contributions as a percentage of GERD in SEE 16Figure 13 : Evolution of success rates in FP7, SEE 17
SEE Countries in EU RTDI funding programmes, Technopolis 2010 ii
Figure 14 ; Scientific productivity in SEE countries, 2001-2009 17Figure 15: Number of preliminary and full proposals submitted to COST Open Call by experts from SEE countries, 2007-2010 19Figure 16 : Number of COST Actions SEE countries participations by country, 2009 19Figure 17: Participation of WBC in Eureka, by 2009 20Figure 18: a taxonomy of research funded by public funds 24
SEE Countries in EU RTDI funding programmes, Technopolis 2010 1
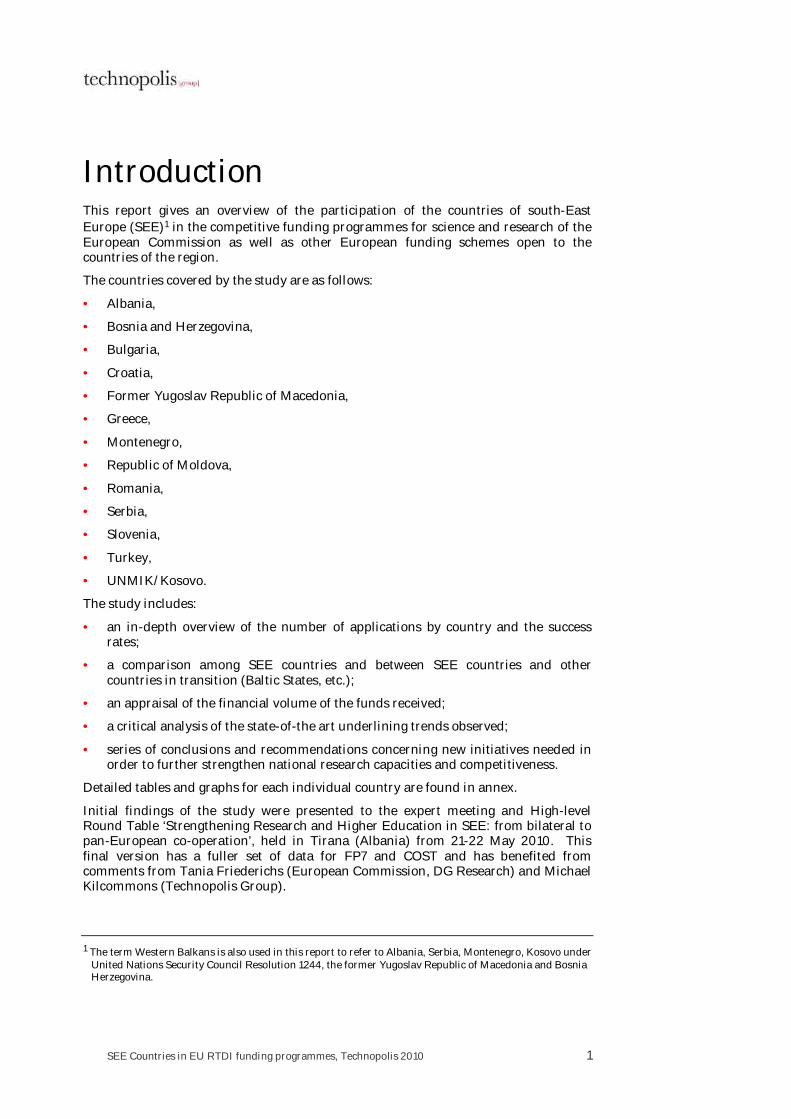
Introduction This report gives an overview of the participation of the countries of south-East Europe (SEE)1 in the competitive funding programmes for science and research of the European Commission as well as other European funding schemes open to the countries of the region.
The countries covered by the study are as follows:
• Albania,
• Bosnia and Herzegovina,
• Bulgaria,
• Croatia,
• Former Yugoslav Republic of Macedonia,
• Greece,
• Montenegro,
• Republic of Moldova,
• Romania,
• Serbia,
• Slovenia,
• Turkey,
• UNMIK/Kosovo.
The study includes:
• an in-depth overview of the number of applications by country and the success rates;
• a comparison among SEE countries and between SEE countries and other countries in transition (Baltic States, etc.);
• an appraisal of the financial volume of the funds received;
• a critical analysis of the state-of-the art underlining trends observed;
• series of conclusions and recommendations concerning new initiatives needed in order to further strengthen national research capacities and competitiveness.
Detailed tables and graphs for each individual country are found in annex.
Initial findings of the study were presented to the expert meeting and High-level Round Table ‘Strengthening Research and Higher Education in SEE: from bilateral to pan-European co-operation’, held in Tirana (Albania) from 21-22 May 2010. This final version has a fuller set of data for FP7 and COST and has benefited from comments from Tania Friederichs (European Commission, DG Research) and Michael Kilcommons (Technopolis Group).
1 The term Western Balkans is also used in this report to refer to Albania, Serbia, Montenegro, Kosovo under United Nations Security Council Resolution 1244, the former Yugoslav Republic of Macedonia and Bosnia Herzegovina.
SEE Countries in EU RTDI funding programmes, Technopolis 2010 2
1. SEE countries eligibility for European research funding programmes
The competitive funding programmes operating at European level are an increasingly important instrument complementing national funds for scientific research, technological development and innovation (RTDI). There are three main pillars of competitive funding programmes managed at European level:
• the Seventh Research Framework Programme (FP7) is main EU instrument for funding collaborative R&D (and related actions) for the period 2007-13 with a total budget of €50.5 billion
− Specific programmes (http://cordis.europa.eu/fp7/home_en.html)
− Specific calls for projects for non-EU countries are made through the International co-operation (INCO) programme
− ERA-NETS (http://netwatch.jrc.ec.europa.eu)
• COST (http://www.cost.esf.org)
− an intergovernmental network coordinating nationally funded research
− Budget €210m for 2007-13; approx. 100,000 euro per year/action
• EUREKA (http://www.eurekanetwork.org)
− promotes international, market-oriented innovation through support to SMEs, large industry, universities and research institutes;
− Currently, there are 722 running projects with an average budget of €1.8m;
− The new Eurostars initiative (http://www.eurostars-eureka.eu/) is specifically dedicated to research-performing SMEs
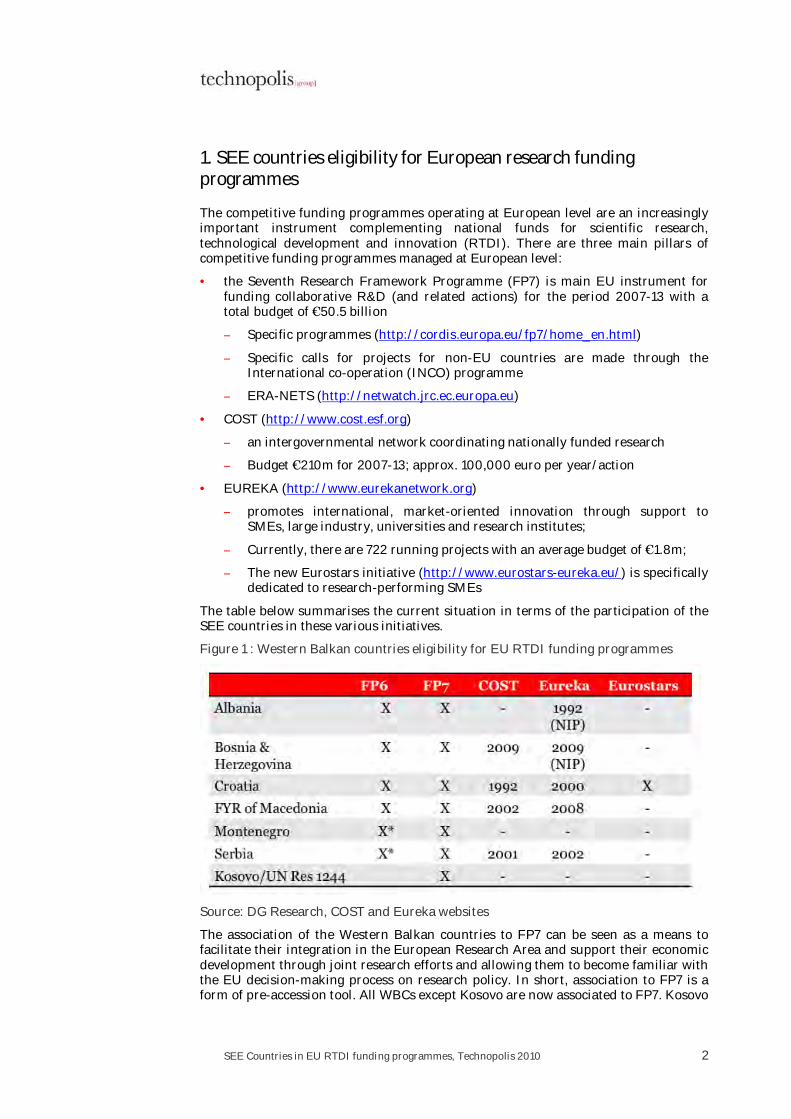
The table below summarises the current situation in terms of the participation of the SEE countries in these various initiatives.
Figure 1 : Western Balkan countries eligibility for EU RTDI funding programmes
Source: DG Research, COST and Eureka websites
The association of the Western Balkan countries to FP7 can be seen as a means to facilitate their integration in the European Research Area and support their economic development through joint research efforts and allowing them to become familiar with the EU decision-making process on research policy. In short, association to FP7 is a form of pre-accession tool. All WBCs except Kosovo are now associated to FP7. Kosovo
SEE Countries in EU RTDI funding programmes, Technopolis 2010 3
can participate in FP7 as a third country with International Cooperation Country Partner (ICPC) status. Association to FP7 allows for increased research opportunities because associated countries have the same possibilities (minimum requirement for participation) as the Member States.
As outlined in the international co-operation strategy paper of the European Commission for FP7 (EC, 2007), three basic principles have been adopted in order to expand the international collaboration compared to FP6:
• Programming: unlike previous RTD framework programmes, FP7 includes both a broad opening (‘mainstreaming’) of international research collaboration in both programmes and in research themes across the whole Framework Programme and a programming of specific priorities for third countries and regions in different calls for proposals across the thematic work programmes;
• Targeting: by defining specific actions for collaboration with third countries and regions in each of the thematic programmes, FP7 ensures that budgets for international cooperation are built in at the level of each of the relevant calls for proposals;
• Partnership and dialogue: the principle of partnership will be a particular focus of the specific international cooperation actions for third countries and regions under FP7. The Specific International Cooperation Actions aim at a fair level of participation for third countries in the collaboration with their European partners.
This approach has led for instance to the launch of specific INCO- and ERA-Nets for the WBC (see below) as well as specific calls for the Regional Potential instrument (the FP7-REGPOT-2010-5 call for Research Potential in the Western Balkan Countries, launched on 30 July 2009 with a budget of €8,000,000).
National Contact Points (NCPs) play a crucial role in European and international science and research cooperation as providers of information and assistance to public and private research, higher education and business organisations, to researchers and managers all around Europe. NCPs inform and raise awareness about the funding opportunities of the FP and they advise and assist potential applicants in the preparation, submission and follow-up of grant applications. NCPs also offer advice during the realisation of projects – especially with respect to legal and financial issues. The Western Balkan countries are to varying lengths of time integrated in the NCP system and have built up more or less sophisticated teams and systems (see Nyiri et al, 2010) and this clearly is an influencing factor on the success rates.
From a policy perspective, a considerable effort has been made to foster the integration of the Western Balkan countries (WBC) within the European Research Area (ERA). In particular, the Steering Platform on Research for the WBCs was launched in June 2006 under the auspices of the Austrian Presidency and the then Research Commissioner Potočnik. It aims at identifying the needs and means of research capacity in the region and consider together, with all stakeholders involved (Member States, WBCs associated to FP7 and other international organisations and initiatives dealing with research in the region), how best to address the concerns identified, and strengthen research capacity. Two specific ‘regional platforms’ for the WBC have been funded under the INCO-NET and ERA-NET actions of FP7.
The WB-INCO-NET project (http://www.wbc-inco.net) aims to identify the Western Balkan research needs and capacities, to select tools for the upgrading of existing scientific assets, and to create synergies between the different actors and stakeholders. Moreover, the WB INCO-NET portal is a source of targeted information on research in the Western Balkan countries and for the region, including an eJournal, with analytical studies, reports and directories.
The SEE-ERA.NET was funded under FP6 and ran from 2004-2008. Amongst other objectives, the ERA-NET launched a pilot joint call for funding of research networking projects. Only a limited number of countries (14) were eligible for cooperation, as it
SEE Countries in EU RTDI funding programmes, Technopolis 2010 4
was necessary to provide national contributions to the funding pot. Based on a “juste retour” principle, projects were funded in 2007, 321 project proposals were submitted of which 30 were selected for funding. Based on the success of the pilot call, a new call was launched under SEE-ERA-NET PLUS2 project for proposals in September 2009 in order to enhance the integration of the Western Balkan Countries into the European Research Area. The call budget is €3.5m (with funds provided by the participating countries and the European Commission) and focuses on two thematic fields
• ICT Software systems for learning process management and support and ICT for energy efficiency
• AgroFood Preservation of indigenous species and traditional food products (in SEE/WBC). Interdisciplinary field: Land use impact in agriculture on biodiversity
This call is for projects with a duration of one to two years and each approved project can receive up to €150,000. The projects must have at least two partners from the Western Balkan countries and one from other participating countries (2+1 principle).
As a complement to the research funding programmes, the Competitiveness and Innovation Framework (CIP) Programme is open to third country participation, and the international affairs unit of DG Enterprise and Industry is responsible for the opening up of the Entrepreneurship and Innovation Programme (EIP, a sub-pillar of the CIP). To do so, the DG informs relevant countries of the programme and the modalities for accession; and negotiates a Memorandum of Understanding which, regulates the rights and obligations, as well as the financial contribution of the country to the EIP programme budget. This so-called "entry ticket" and is calculated in proportion to the relative size of its Gross Domestic Product (GDP) of each country.
According to article 4 of Decision No. 1639/2006/EC of the European Parliament and of the Council, the CIP is open to the participation of:
• Accession countries and candidate countries benefiting from a pre-accession strategy, in accordance with the general principles and general terms and conditions for the participation of those countries in Community programmes established in the respective Framework Agreements and Association Council Decisions. Under this article, Croatia and the former Yugoslav Republic of Macedonia joined the programme in 2007 and Turkey joined in 2008.
• Countries of the Western Balkans, in accordance with the provisions to be determined with those countries following the establishment of Framework Agreements concerning their participation in Community programmes. Under this article, Serbia, Montenegro and Albania joined in 2008.
Given that research infrastructure (both buildings and equipment) have suffered from significant under-investment over the last two decades, the Western Balkan countries need to consider the use of loans from institutions such as the European Investment Bank (EIB). The EIB co-finances major projects in the region with other international financial institutions, particularly the European Bank for Reconstruction and Development (EBRD), the World Bank and the Council of Europe Development Bank. From a research policy perspective, such investments should be made in the framework of a national research infrastructure plan in line with the European Commission’s European Strategic Framework for Research Infrastructure3. For the
2 See http://plus.see-era.net SEE-ERA.NET PLUS shall support the development and administration of the first major joint call for Joint European Research Projects (JERPs) in SEE, and therefore the implementation of the first pillar of the Regional Programme for Cooperation with South-East Europe (ReP-SEE). The SEE-ERA.NET PLUS consortium consists of seventeen partners from fourteen countries (EU Member States, the South Eastern European (SEE) region and Turkey). It involves the relevant R&D programme owners from the involved countries, which are ministries or agencies responsible for science, technology and/or research.
3 http://ec.europa.eu/research/infrastructures/index_en.cfm?pg=esfri-other-roadmaps

SEE Countries in EU RTDI funding programmes, Technopolis 2010 5
WBC, research potential projects under FP7 could offer the possibility to develop action plans for such investments.
The EIB has been active in the countries of South Eastern Europe since 1977 and is progressively increasing its long-term lending in the region4. The EIB is today the largest international financier in the area and over the decade since 2000, the Bank has financed projects totalling €4.2bn in the Western Balkans5. To date, the EIB’s focus has been on the implementation of transport, energy, health and education projects, support for SMEs and local authorities, industry and services, water and sanitation. However, more recently, the EIB has begun to fund research and innovation infrastructure, as it has done for some years in the EU Member States themselves. A notable example is the recent major loan agreement for Serbia.
EIB loans for Public Sector Research and Development in Serbia
R&D in Serbia has suffered 20 years of neglect. In March 2010, the EIB signed a loan agreement with the Serbian government providing an EIB financial contribution of EUR 200 million to ta to total investment plan of EUR 420.8 million. This project is aimed at revitalising the country’s RDI activities.
The project concerns a series of investments aimed at revitalising public R&D in Serbia. These investments, spread throughout Serbia, include upgrading of existing infrastructure, creating a new science centre, construction of student and young scientist accommodation and upgrading the academic computer network.
http://www.eib.org/projects/pipeline/2009/20090283.htm
Last but not least, the EU’s Instrument for Pre-Accession (IPA)6 has a total funding for the current financial framework (2007-2013) of €11.5 billion. A full list of IPA projects related to research and innovation implemented since 2007 is not available. However, to date, IPA has funded only a few projects focused on R&D and innovation. On the other hand, IPA has contributed to funding the WBCs’ annual contribution to FP7.7
As the EU’s Europe 2020 strategy is rolled out, it is likely that the focus of IPA will shift to some degree towards the ‘knowledge economy’ from more traditional areas of support. In the coming years, IPA could be expected to play an increasing role in supporting Western Balkan countries in designing and implementing national R&D and innovation strategies. Indeed, the Regional Strategy for Research and Development for Innovation for the Western Balkans (RSRDI), promoted by the Regional Cooperation Council8, is expected to contribute to an effective implementation of the Ministerial declaration on the regional dimension of research adopted in Sarajevo in April 2009. The RSRDI project is financed from 2011 via the IPA Multi-beneficiary Programme, with the World Bank as the implementing agency.
4 http://www.eib.org/projects/regions/enlargement/the-western-balkans/index.htm 5 In 2009, the EIB concluded in the Western Balkan countries loan contracts reaching an annual record
level of EUR 1.3 bn. This represents a substantial increase compared to EIB lending of EUR 577 m in the region in 2008. In December 2009, the EIB launched, together with the European Commission, the Council of Europe Development Bank and the EBRD, the Western Balkans Investment Framework (WBIF). This provides a joint grant facility and a joint lending facility for priority investments.
6 http://ec.europa.eu/enlargement/how-does-it-work/financial-assistance/instrument-pre-accession_en.htm
7 In order to reflect the likely ‘absorption capacity’ and level of scientific excellence, a formula was agreed that makes the contribution proportional to GDP, growth rates of GDP (frozen at level of EU27 so as not to penalise the SEE for higher growth rates) and a correction factor or rebate (in effect paid by IPA). The rebate started at 80% in 2007 and is reduced by 5% per year. A review clause foresees an eventual re-adjustment in 2010 if the benefits derived by the SEE from FP7 still outweigh the financial contribution.
8 http://www.rcc.int/
SEE Countries in EU RTDI funding programmes, Technopolis 2010 6
2. Comparative performance of SEE countries in the Framework Programme for Research and Technological Development
2.1 Framework Programme 6 (FP6)
The 6th Framework Programme ran from 2002-2006 and allowed so called “third countries” (countries which are not part of the EU and are not associated to the framework programme) to participate in projects. All Western Balkan Countries had the status of third countries, except Croatia, which had been associated to FP6 in the final year of its implementation. Thus, Western Balkan countries were eligible to participate in projects and there were also some specific calls in the programme for International Cooperation (INCO), which explicitly encouraged the submission of projects from third countries
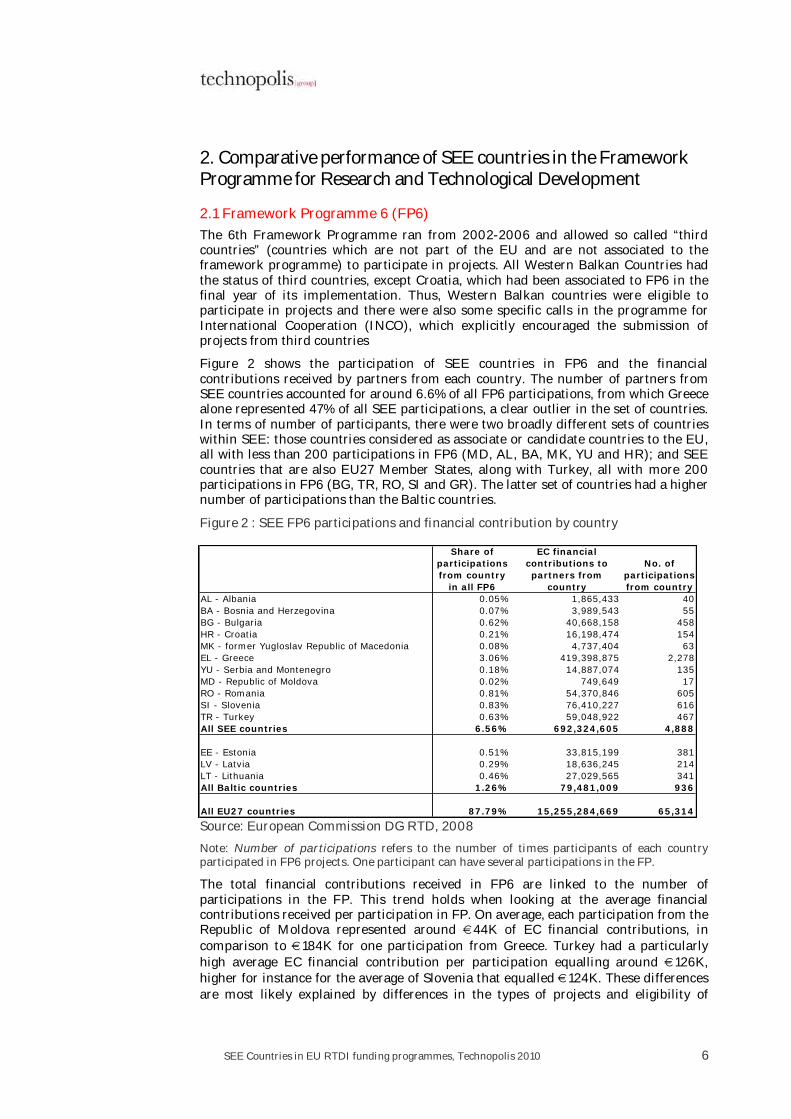
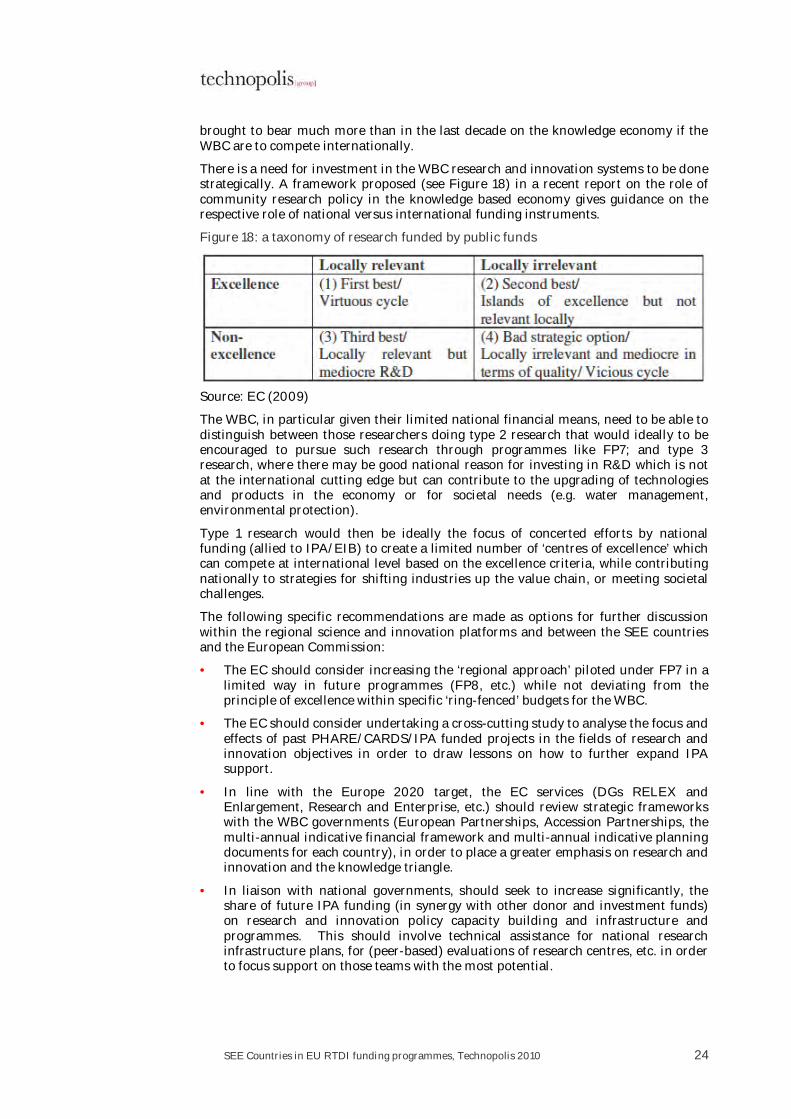
Figure 2 shows the participation of SEE countries in FP6 and the financial contributions received by partners from each country. The number of partners from SEE countries accounted for around 6.6% of all FP6 participations, from which Greece alone represented 47% of all SEE participations, a clear outlier in the set of countries. In terms of number of participants, there were two broadly different sets of countries within SEE: those countries considered as associate or candidate countries to the EU, all with less than 200 participations in FP6 (MD, AL, BA, MK, YU and HR); and SEE countries that are also EU27 Member States, along with Turkey, all with more 200 participations in FP6 (BG, TR, RO, SI and GR). The latter set of countries had a higher number of participations than the Baltic countries.
Figure 2 : SEE FP6 participations and financial contribution by country
Source: European Commission DG RTD, 2008
Note: Number of participations refers to the number of times participants of each country participated in FP6 projects. One participant can have several participations in the FP.
The total financial contributions received in FP6 are linked to the number of participations in the FP. This trend holds when looking at the average financial contributions received per participation in FP. On average, each participation from the Republic of Moldova represented around €44K of EC financial contributions, in comparison to €184K for one participation from Greece. Turkey had a particularly high average EC financial contribution per participation equalling around €126K, higher for instance for the average of Slovenia that equalled €124K. These differences are most likely explained by differences in the types of projects and eligibility of
Share of
participations
from country
in all FP6
EC financial
contributions to
partners from
country
No. of
participations
from country
AL - Albania 0.05% 1,865,433 40
BA - Bosnia and Herzegovina 0.07% 3,989,543 55
BG - Bulgaria 0.62% 40,668,158 458
HR - Croatia 0.21% 16,198,474 154
MK - former Yugloslav Republic of Macedonia 0.08% 4,737,404 63
EL - Greece 3.06% 419,398,875 2,278
YU - Serbia and Montenegro 0.18% 14,887,074 135
MD - Republic of Moldova 0.02% 749,649 17
RO - Romania 0.81% 54,370,846 605
SI - Slovenia 0.83% 76,410,227 616
TR - Turkey 0.63% 59,048,922 467
All SEE countries 6.56% 692,324,605 4,888
EE - Estonia 0.51% 33,815,199 381
LV - Latvia 0.29% 18,636,245 214
LT - Lithuania 0.46% 27,029,565 341
All Baltic countries 1.26% 79,481,009 936
All EU27 countries 87.79% 15,255,284,669 65,314
SEE Countries in EU RTDI funding programmes, Technopolis 2010 7
participations for Candidate and third countries in FP. For example, the performance of the former Yugoslav Republic of Macedonia in FP6 was influenced by a few ‘major’ projects acquired under INCO in the ICT field just before end of programme.
In absolute terms, the SEE country with the largest received EC financial contributions was Greece, equalling more than €419M.
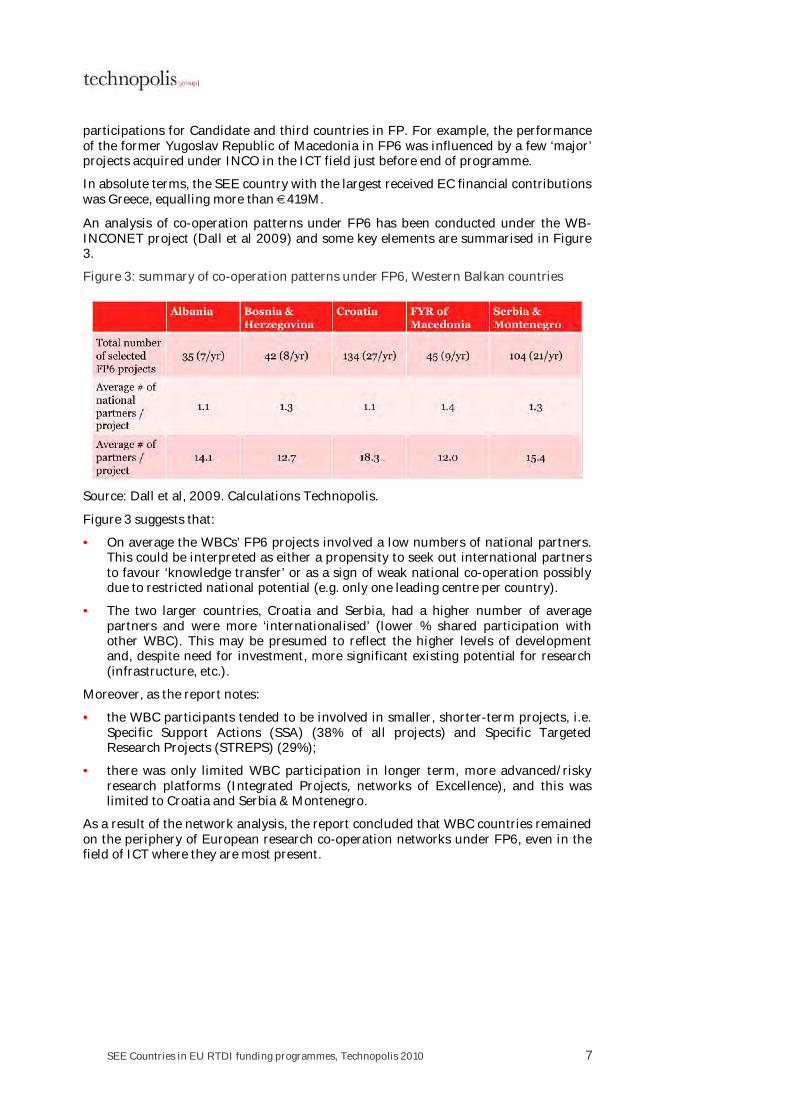
An analysis of co-operation patterns under FP6 has been conducted under the WB-INCONET project (Dall et al 2009) and some key elements are summarised in Figure 3.
Figure 3: summary of co-operation patterns under FP6, Western Balkan countries
Source: Dall et al, 2009. Calculations Technopolis.
Figure 3 suggests that:
• On average the WBCs’ FP6 projects involved a low numbers of national partners. This could be interpreted as either a propensity to seek out international partners to favour ‘knowledge transfer’ or as a sign of weak national co-operation possibly due to restricted national potential (e.g. only one leading centre per country).
• The two larger countries, Croatia and Serbia, had a higher number of average partners and were more ‘internationalised’ (lower % shared participation with other WBC). This may be presumed to reflect the higher levels of development and, despite need for investment, more significant existing potential for research (infrastructure, etc.).
Moreover, as the report notes:
• the WBC participants tended to be involved in smaller, shorter-term projects, i.e. Specific Support Actions (SSA) (38% of all projects) and Specific Targeted Research Projects (STREPS) (29%);
• there was only limited WBC participation in longer term, more advanced/risky research platforms (Integrated Projects, networks of Excellence), and this was limited to Croatia and Serbia & Montenegro.
As a result of the network analysis, the report concluded that WBC countries remained on the periphery of European research co-operation networks under FP6, even in the field of ICT where they are most present.
SEE Countries in EU RTDI funding programmes, Technopolis 2010 8
2.2 Framework Programme 7 (FP7)
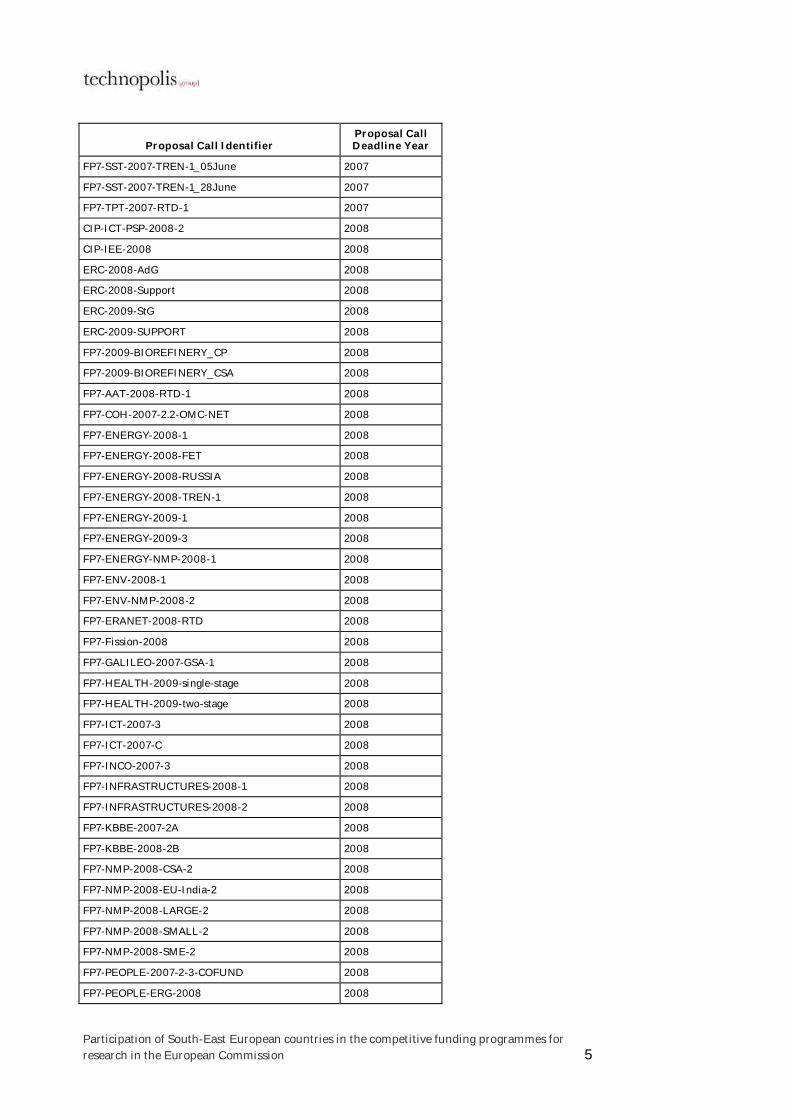
2.2.1 Method of analysis
The analysis presented in this section is based on data extracted from eCORDA on 8 June 2010. All the calls for proposals covered by the analysis are listed in Appendix B. ‘Eligible proposals’ are all submitted proposals to calls that are not classified by the European Commission (EC) services as ‘ineligible’ based on the selection criteria of each call for proposals. The yearly analysis presented in the following sections is based on the closure year of the calls for proposals. Data tagged as ‘All FP7’ is the aggregation of the analysis of each year within the period 2007-2010. Proposals retained for funding are those proposals classified by the EC as ‘main-listed’. Success rates are obtained by looking at the ratio of ‘main-listed proposals’ divided by all ‘Eligible proposals’. Hence, the success rates analysis includes the calls for proposals where the EC has issued an evaluation status for the submitted proposals.
Two types of data are provided concerning the EC contributions to countries in FP7. First, the participants’ EC contribution in signed contracts, that refers not only to ‘main-listed’ proposals, but also to those main-listed proposals where a grant agreement was signed for calls closed in a given year. Second, the applicants’ requested EC contributions (aggregated for FP7), refers to the sum of the requested contributions in all main-listed proposals, regardless if a grant agreement has been signed, and before the start of a negotiation process of an agreement with the EC.
The thematic analysis of FP7 proposals is based on the classification of eCORDA. The top links of SEE countries are calculated using an aggregation of all individual countries’ top 10 country partners in main-listed proposals.
As a benchmark for SEE countries, success rates for the Baltic countries (Estonia, Latvia and Lithuania) are calculated as an aggregation of the individual main-listed and eligible proposals.
2.2.2 Eligible proposals and success rates – a comparative perspective
This section provides an analysis of eligible proposals and success rates in all SEE countries as well as a benchmark with Baltic countries and the EU27. Figure 4 presents a yearly summary of eligible and main-listed proposals and success rates per country. Once again, Greece has the largest number of eligible proposals in FP7, followed by Romania and Turkey. In general, the EU27 Member States amongst the SEE countries are in the top places, with the exception of Turkey that is in the top three places of eligible proposals since 2008. Croatia and Serbia also have a higher amount of eligible proposals than Latvia, for instance. The Republic of Moldova and UNMIK/Kosovo are the countries with the least eligible proposals so far in FP7 (a total of 90 and eight eligible proposals respectively).
In absolute terms, the figures for main-listed proposals are quite similar to those of eligible proposals and it is once again Greece, Romania and Turkey the top countries. UNMIK/Kosovo has no eligible proposals in the analysed calls in FP7.
Absolute numbers reflect the size, sophistication of national research systems and also longevity of participation (assuming a learning curve of participants in successful bidding). A more telling analysis is to consider success rates and their evolution over time across countries. The countries above the average SEE success rate of 17% are average are Montenegro (22%), Republic of Moldova (20%), Slovenia (18%), former Yugoslav Republic of Macedonia, Greece, Bulgaria and Turkey (the latter four countries with a success rate of 17%). When looking at overall FP7 success rates, all SEE countries are below the success rate of the Baltic countries (22%) with the exception of Montenegro (22%) that is also the only SEE country with a higher success rates than the EU27 rate of 21%. However, whether 22% of 111 proposals is better than say Serbia’s 14% of 836 proposals is a moot point.

SEE Countries in EU RTDI funding programmes, Technopolis 2010 9
Figure 4 SEE participation in FP7
Source: eCORDA, 8 June 2010
All FP7 2007 2008 2009 2010 All FP7 2007 2008 2009 2010 All FP7 2007 2008 2009 2010
AL - Albania 148 77 29 32 10 24 6 5 9 4 16% 8% 17% 28% 40%
BA - Bosnia and Herzegovina 155 78 24 41 12 23 8 4 6 5 15% 10% 17% 15% 42%
BG - Bulgaria 1,872 882 474 421 92 315 132 69 87 27 17% 15% 15% 21% 29%
HR - Croatia 878 331 233 252 61 138 50 34 35 19 16% 15% 15% 14% 31%
MK - fYR of Macedonia 271 113 66 68 23 47 19 14 7 6 17% 17% 21% 10% 26%
EL - Greece 7,466 3,004 1,913 2,193 339 1,278 469 286 439 81 17% 16% 15% 20% 24%
ME - Montenegro 111 51 27 26 7 24 8 9 3 4 22% 16% 33% 12% 57%
MD - Republic of Moldova 90 34 30 18 7 18 3 8 5 2 20% 9% 27% 28% 29%
RO - Romania 2,928 1,353 712 722 137 456 192 105 125 34 16% 14% 15% 17% 25%
RS - Serbia 836 323 198 263 49 114 40 27 33 14 14% 12% 14% 13% 29%
SI - Slovenia 2,094 911 504 574 102 373 148 88 109 28 18% 16% 17% 19% 27%
TR - Turkey 2,559 849 753 758 196 428 115 93 154 66 17% 14% 12% 20% 34%
UNMIK/Kosovo 8 0 2 6 0
Sum SEE countries 19,416 8,006 4,965 5,374 1,035 3,238 1,190 742 1,012 290 17% 15% 15% 19% 28%
EE - Estonia 990 434 244 252 55 242 97 62 69 14 24% 22% 25% 27% 25%
LV - Latvia 595 249 148 161 36 130 47 34 38 10 22% 19% 23% 24% 28%
LT - Lithuania 881 411 214 202 53 180 68 45 49 18 20% 17% 21% 24% 34%
Sum Baltic countries 2,466 1,094 606 615 144 552 212 141 156 42 22% 19% 23% 25% 29%
All EU27 countries 45,544 14,632 14,680 14,377 1,855 9,470 2,931 2,581 3,407 551 21% 20% 18% 24% 30%
Number of eligible proposals with at least
one applicant in country
Number of proposals retained for funding
(Mainlisted) in calls with closure in
reference year
Success rates

SEE Countries in EU RTDI funding programmes, Technopolis 2010 10
Figure 5 distinguishes the position of SEE success rates against the benchmark of the EU27 and the Baltic countries. The bars in the figure show the number of eligible proposals per country, while the left-hand axe shows the success rates of these proposals per country.
Figure 5: number of eligible proposals with at least one applicant in country and success rates, FP7
Source: eCORDA, 8 June 2010
Countries lying below the SEE success rate of 17% are Albania (16%), Croatia (16%), Romania (16%), Bosnia and Herzegovina (15%), Serbia (14%) and UNMIK/Kosovo (0%). The countries with the highest success rates are EU27 SEE countries (with the exception of Turkey) in contrast with the countries with the lowest success rates (with the exception of Romania) that are either candidate or associate countries.
Thematic success rates and scientific specialisation
Figure 6 shows the success rates of SEE proposals by theme as classified by the Commission services. The success rates differ considerably across the themes. If the overall SEE success rate of 17% is taken as a benchmark, themes with considerable success across SEE participation in FP7 are General Activities (77%), Fusion Energy (63%) and Research Infrastructures (53%). In contrast, themes with low success rates are those related to the European Research Council (ERC, 3%), Social Sciences and Humanities (SSH, 7%) and Research Potential (8%).
In terms of the applicants’ requested EC financial contribution in main-listed proposals, the thematic with the highest requested amount are those related to Information and Communications Technologies (ICT) equalling more than €208m and a low success rate of 12%, followed by Research Potential (€91m and a low success rate of 8%), Transport (€62m and success rate of 19%), Nanosciences and nanotechnologies (€59m and success rate of 21%), and Research Infrastructures (€57m and a high success rate of 53%).
Finally, the largest amount of eligible proposals is found in themes such as ICTs (12% success rate), Marie-Curie actions (28%), Environment including Climate change (19%), and Research for SMEs (16%).

SEE Countries in EU RTDI funding programmes, Technopolis 2010 11
Figure 6 : number of eligible FP7 proposals and success rates in SEE countries by theme
Source: eCORDA, 8 June 2010
In order to understand whether the participation of SEE countries in specific themes in FP is a consequence of the scientific focus of these countries, Figure 7 presents the top 3 br0ad fields with largest shares of scientific publications in all publications in SEE countries between 2001-2009. The figure shows in which broad scientific fields each of the countries publishes the most. The trend among SEE countries is rather clear, with research capacities being mainly focused on Engineering, and exact sciences such as Medicine, and Physics and Astronomy. ‘Modern’ science like Biochemistry, Genetics and Molecular Biology is only a major focus in Greece and Turkey. Particularly absent among the research capacities of SEE countries are Social Sciences and Humanities (only a top focus in Bosnia and Herzegovina). The lack of capacity in this thematic might explain the low success rates in FP7 equal to 7% (1,245 eligible proposals versus 82 main-listed proposals).
In regards to the partnership of SEE countries in main-listed proposals, Figure 7 looks at the top links of SEE countries with regard of all FP7 participant countries and their respective success rates. The small group of 25 countries provided in this figure resulted from the aggregation of the top partners of each of the SEE countries. These figures also show cross participations between SEE countries. Considering the absolute number of main-listed proposals, the top five main partners of SEE countries are countries of the ‘EU15’ such as Germany, the UK, Italy, France, Spain. Although important in volume terms, the success rates are lower (except France) if compared with the rest of the top partners (Netherlands, Belgium Greece and Austria and Sweden) in volume terms.

SEE Countries in EU RTDI funding programmes, Technopolis 2010 12
Figure 7 : top 3 broad fields with largest shares of scientific publications in all publications, SEE 2001-2009
Source: SCOPUS, calculations by Technopolis Group. Note: Shares exceeding 100% are due to double entries across fields.
Figure 8 : top links of SEE countries in main-listed proposals with all FP7 participant countries and success rates
Source: eCORDA, 8 June 2010

SEE Countries in EU RTDI funding programmes, Technopolis 2010 13
At the other extreme, high success rates on a low volume of proposals are recorded when SEE countries partner with other third countries such as Armenia (53%), Azerbaijan (43%), Turkey (37%) and Georgia (33%). This probably reflects the nature of the INCO type calls for proposals for which SEE countries are eligible, which have for instance a geographical or regional focus. Additionally, this could also suggest that proximity and other cultural factors trigger partnerships and might determine the success of these partnerships.
INCO and ERA-NETS – specific instruments supporting research policy governance
Two FP7 instruments are particularly important for SEE countries: INCO-NETS and ERA-NETS. Although in terms of EC financial contributions this type of project does not represent a large share in FP, these instruments are particularly important for SEE countries due to their high success rates, and the share that these projects represent in FP7 participation of SEE countries (particularly INCO-NETS).
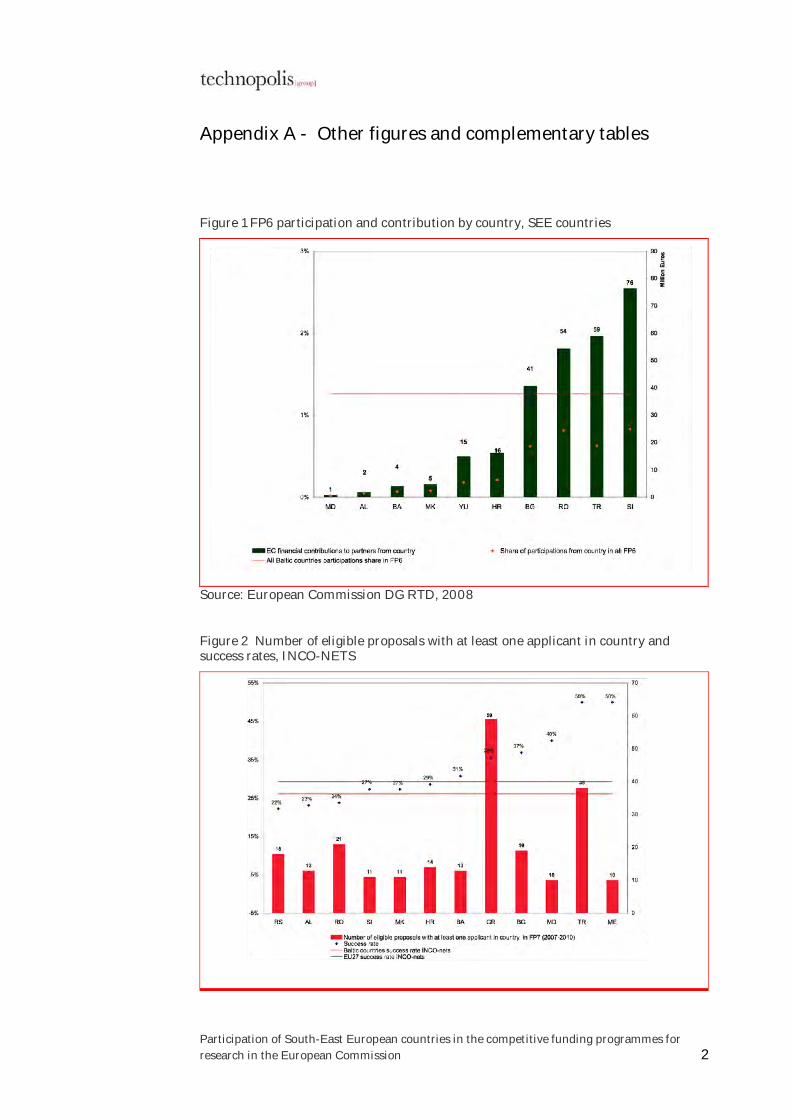
Figure 9 shows the success rates of SEE in INCO-NETS and the received EC contributions in signed grant agreements in FP7. Although for all SEE countries the share of INCO-nets represents broadly 1% in terms of EC financial contributions, these projects represent more than 10% of all granted funds for Albania (10%), Montenegro (12%) and the Republic of Moldova (13%).
Figure 9 : Number of eligible proposals with at least one applicant in country and success rates, INCO-NETS
Source: eCORDA, 8 June 2010
As was the case of overall FP7 participation, the countries with the largest number of eligible and main-listed proposals for INCO-NETS are Greece, Turkey and Romania. These are also the countries with the largest granted EC financial contributions in absolute terms; which, nevertheless, only represented for these countries between 1% and 3% of all granted funds in FP7.
The success rates in INCO-NETS range from 22% to 50%, with an overall rate for SEE countries of 35%, which represents more than double the success rate of overall FP7 participation. Countries above the SEE success rate are Turkey (50%), Montenegro (40%), the Republic of Moldova (40%), Bulgaria (37%) and Greece (36%).
ERA-NETS play a more marginal role, representing only between 1% and 2% for SEE countries of all EC financial contributions in FP7. Not all SEE countries participated in this type of project, due to eligibility of associated countries and the illegibility of third
Country
Number of eligible
proposals with at
least one applicant
in country
Number of
proposals retained
for funding
(Mainlisted)
Success
rate
Participant EC
Contribution
(only in
signed
contracts)
Share of INCO-
NETS in FP7
participation
AL 13 3 23% 77,657 10%
BA 13 4 31% 76,356 6%
BG 19 7 37% 159,542 0%
HR 14 4 29% 100,966 1%
MK 11 3 27% 68,591 1%
GR 59 21 36% 3,185,662 1%
ME 10 5 50% 101,085 12%
MD 10 4 40% 151,691 13%
RO 21 5 24% 646,479 1%
RS 18 4 22% 132,560 1%
SI 11 3 27% 43,878 0%
TR 38 19 50% 1,315,993 3%
All SEE countries 237 82 35% 4,744,467 1%
EE 14 5 36% 356,520 1%
LV 3 1 33% 0 0%
LT 6 0 0% 0 0%
All Baltic countries 23 6 26% 356,520 1%
EU27 229 67 29% 43,385,040 0%

SEE Countries in EU RTDI funding programmes, Technopolis 2010 14
countries. Nevertheless the success rates of the SEE participating countries are very high, ranging from 84% to 100%, which was the case of Bulgaria, Croatia and the former Yugoslav Republic of Macedonia.
Figure 10: Number of eligible proposals with at least one applicant in country and success rates, ERA-NETS
Source: eCORDA, 8 June 2010
Countries below the average of SEE countries success rates are Romania (84%), Slovenia (88%) and Turkey (89%). However, these countries received the largest EC financial grants for ERA-NETS in absolute terms.
2.2.3 Appraisal of the financial volume of FP7 grants received
As regards the financial volume of FP7 grants received Greece remains the top country with signed financial grants equalling more than €312m, which is considerably more than the sum of the grants received by Baltic countries of around €60M. Other top countries are Turkey (around €50m) and Romania (€45m), which were also top countries in the absolute amount of eligible proposals and main-listed proposals. Slovenia appears to perform relatively well with over €41m from FP7 out-doing or performing almost as well as significantly larger SEE EU Member States such as Bulgaria (€33m) and Romania. In contrast, the grants received by the candidate or pre-accession WBC countries range from €766k in Albania to €18m for Croatia.
The value of the grants received is in most cases lower than the amounts requested in proposals. The figures above also reflect the financial values of already signed agreements under FP7 and thus exclude the volumes of those main-listed proposals that are currently undergoing a negotiation process with the Commission services. The negotiation process sometimes ends in granted contributions lower than what was initially requested. The requested EC financial contributions (in signed and non-signed agreements) in Member States range from €59m in the case of Bulgaria to €470m for Greece; in comparison to between €Mm for the Republic of Moldova to €70m in Turkey for non-EU Member States.
To date, the EC financial contribution awarded to signed agreements for SEE participations represent 64% of the initial requests, compared to 66% for Baltic countries. The difference in the ratio of requested to granted financial contribution between countries is quite large, ranging from only 36% in the case of Montenegro, to 93% in the case of the Republic of Moldova. This may reflect the capacities to fulfil administrative requirements in order to accelerate negotiation processes in signing grant agreements; as well as the type of projects for which contracts were concluded.
Country
Number of eligible
proposals with at
least one applicant
in country
Number of
proposals retained
for funding
(Mainlisted)
Success
rate
Participant EC
Contribution
(only in
signed
contracts)
Share of ERA-
NETS in FP7
participation
BG 7 7 100% 286,264 1%
HR 3 3 100% 96,707 1%
MK 2 2 100% 31,429 1%
GR 17 16 94% 766,433 0%
RO 19 16 84% 546,209 1%
SI 16 14 88% 425,009 1%
TR 27 24 89% 796,784 2%
All SEE countries 91 82 90% 2,948,835 1%
EE 10 8 80% 10,212 0%
LV 12 9 75% 439,114 4%
LT 9 9 100% 100,735 1%
All Baltic countries 31 26 84% 550,061 1%
EU27 58 46 79% 64,677,946 0%
SEE Countries in EU RTDI funding programmes, Technopolis 2010 15
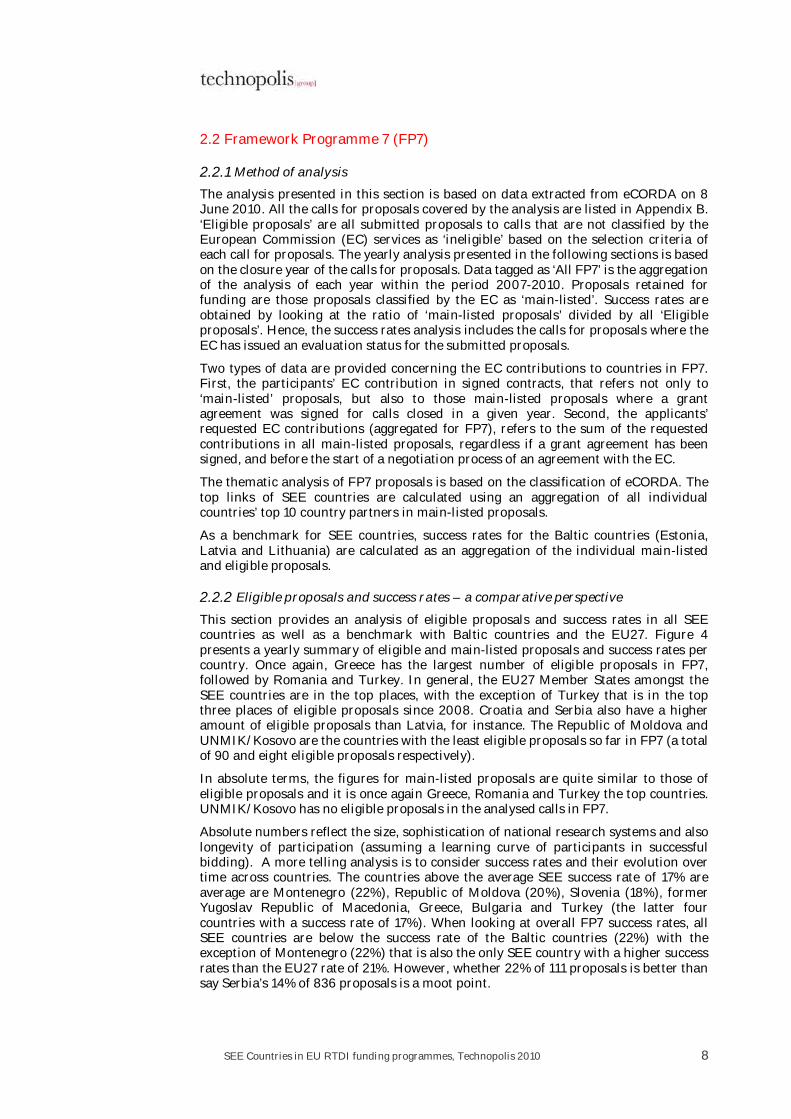
Figure 11: European Commission’s contributions and requested contributions in FP7
Source: eCORDA, 8 June 2010
While there is no concept of ‘juste retour’ in FP7, it is instructive to compare the financial contributions received by each country’s participation in FP7 with the financial contribution of the SEE countries to FP7. Considering the period 2007-2009, only Albania and Turkey have theoretically (ignoring the 80/75/70% rebates for 2007-2009 respectively) paid more into FP7 than they have secured in return through project funding. The former Yugoslav Republic of Macedonia has gained the highest return from FP7 against FP7 (gross before rebate) contribution of a factor of 3.1 followed by Montenegro and Serbia (both with 2.3 times more received than paid), Croatia (1.6) and Bosnia & Herzegovina (1.2).
In order to understand the importance and impact that FP7 funding has on the scientific and R&D structures of SEE countries, Figure 12 presents an analysis that compares the EC financial contributions as a percentage of Government Expenditures in R&D (GERD) and the per capita EC contributions in signed agreements. On average, SEE countries were granted around €6 per inhabitant for FP7 projects, compared to €11 for the Baltic countries and €32 for the EU27. On a per capita basis, Greece and Slovenia have done best from FP7 grants, with around €28 and €20 per inhabitant respectively. In contrast, Romania and Turkey, countries that were in top in terms of absolute financial grants and in respect to the number of eligible proposals and main-listed proposals have received about €2 and €0.70 per inhabitant.
The left axe of Figure 12 gives an estimate of the importance of FP7 grants versus national funds for R&D. On average, FP7 funds accounted for around 2% of GERD between 2007-2009 in the EU27, in comparison to 3% for the Baltic countries and 6% for SEE countries. Countries above the regional average, and to which FP7 grants seem to have an important role in R&D funding at national level are Bulgaria (7% of accumulated GERD in 2007-2009), Greece (8%) and especially the former Yugoslav Republic of Macedonia (17%).
Applicant
Requested EC
Financial
Contribution
(cumulative,
not only of
signed
agreements)
Share of
signed
contracts in
requested
contributions
All FP7 2007 2008 2009 All FP7
AL - Albania 765,652 369,800 167,244 228,608 1,505,469 51%
BA - Bosnia and Herzegovina 1,217,869 668,482 158,073 391,314 1,409,863 86%
BG - Bulgaria 33,197,276 15,924,228 10,454,514 6,818,534 58,717,946 57%
HR - Croatia 18,206,608 8,783,021 7,483,541 1,940,046 28,012,392 65%
MK - fYR of Macedonia 5,414,426 2,175,478 2,779,948 459,000 7,511,762 72%
GR - Greece 312,501,101 161,099,615 88,519,438 62,882,047 469,585,643 67%
ME - Montenegro 858,821 368,436 458,385 32,000 2,413,771 36%
MD - Republic of Moldova 1,155,478 762,102 367,162 26,215 1,242,188 93%
RO - Romania 44,857,966 25,826,436 13,241,203 5,790,326 78,249,573 57%
RS - Serbia 16,447,410 10,062,498 4,124,798 2,260,114 27,406,094 60%
SI - Slovenia 41,381,966 25,164,956 10,710,571 5,506,439 69,392,504 60%
TR - Turkey 49,876,566 21,939,116 15,790,139 12,147,310 70,183,024 71%
Sum SEE countries 525,881,138 273,144,167 154,255,017 98,481,954 815,630,228 64%
EE - Estonia 32,321,024 17,606,121 9,137,879 5,577,025 44,656,793 72%
LV - Latvia 10,618,639 6,845,095 2,580,817 1,192,727 17,309,107 61%
LT - Lithuania 17,053,921 5,924,706 8,560,776 2,568,439 28,999,931 59%
Sum Baltic countries 59,993,584 30,375,922 20,279,471 9,338,191 90,965,830 66%
All EU27 countries 15,941,623,108 6,248,486,973 4,118,181,974 4,609,196,801 -
Participant EC Contribution (only in signed contracts of calls closed
in reference year)

SEE Countries in EU RTDI funding programmes, Technopolis 2010 16
Figure 12 : Per capita EC contributions in signed grant agreements vs. contributions as a percentage of GERD in SEE
Source: eCORDA, 8 June 2010; Eurostat 2010; the World Factbook, 2010.
2.2.4 A critical analysis of the state-of-the art underlining trends observed
The observed trends of SEE participation in FP7 are generally positive. The success rates increased from 15% to 19% in SEE countries between 2007 and 2009. Nevertheless, the success rates had also increased for the EU27 (from 20% to 24%) and for the Baltic countries (19% to 25%). The gap between successful participation of SEE countries and the rest of the EU remains thus steady in absolute terms.
In relative terms each country follows different patterns and trends. Figure 13 shows the evolution of success rates in FP7 in each SEE country. There are countries where the success rates had increased considerably in the period 2007-2009, such as Albania, passing from a success rate of 8% in 2007 to 28% in 2009; and the Republic of Moldova (from 9% to 28%). Some other countries present unsteady success rates, such as Bosnia and Herzegovina, the former Yugoslav Republic of Macedonia, Greece, Montenegro, Serbia and Turkey; while Croatia has seen its success rates decrease during FP7. Finally, some countries have regular and steady increases in their success rates, as is the case of the EU countries of Bulgaria, Romania and Slovenia.
The trends might be a reflection of the scientific capacities of SEE countries and its evolution. Figure 14 shows the scientific productivity of SEE countries between 2001-2009, presenting the total number of publications per country and thus indicating the scale of scientific production of the different countries. Turkey and Greece present the largest number of publications in absolute terms, followed by Romania, Croatia, Slovenia and Bulgaria. The top three countries in terms of number of publications are also the top countries in participation in FP7 in terms of the amount of eligible and main-listed proposals, which could be the consequence of larger research communities due to the relatively larger size of these SEE countries. Despite the significant share that these countries have in SEE research output, Turkey only represents about 0.8% of the world’s scientific production per year.

SEE Countries in EU RTDI funding programmes, Technopolis 2010 17
Figure 13 : Evolution of success rates in FP7, SEE
Source: eCORDA, 8 June 2010
Figure 14 ; Scientific productivity in SEE countries, 2001-2009
Source: SCOPUS, data analysis by Technopolis Group
Note: Scopus search based on affiliations by country.
The growth rates of the scientific production in SEE countries may provide a hint for the observed and possible future trends in terms of research capacities. Particularly high growth rates are found in Montenegro (113%), Serbia (74%), and Bosnia and

SEE Countries in EU RTDI funding programmes, Technopolis 2010 18
Herzegovina (31%). These three countries (see Figure 13) have fluctuating annual success rates in FP7 during 2007-2009. In the calls for proposals analysed for 2010, these countries present higher success rates than the SEE rate of 28%, equal to 42% in Bosnia and Herzegovina, 57% for Montenegro, and 29% for Serbia.
Making a link between the increasing rates of success and scientific productivity is fraught with difficulties, but the two ‘tentative trends’ could suggest a learning curve effect from participating in FP7 and re-opening of research systems to international co-operation, that could lead to further improvements if national efforts to improve research potential are sustained; e.g. in BiH the NCP network has been trained and accredited during 2009-10, partly with the support of an EC IPA project; a five million euro Science and Innovation investment fund has been supported through the IPA in Croatia; or the aforementioned EIB loan for Serbian investment in research infrastructure.
3. Participation of SEE countries in COST and EUREKA
3.1 COST
COST –“European CO-operation in the field of Scientific and Technical Research”, is an intergovernmental framework for European Cooperation in Science and Technology, allowing the coordination of nationally-funded research on a European level. Together with EUREKA and the EU framework programmes it is one of the three pillars of joint European research initiatives.
The strengths of COST rely on their non-competitive research and the ease of access for institutions from non-member countries of the European Union, which makes the initiative a very interesting tool for tackling global topics. Bosnia and Herzegovina, Bulgaria, Croatia, former Yugoslav Republic of Macedonia, Greece, Romania, Serbia, Slovenia and Turkey are COST member states.
COST has seen its allocation of resources increase considerably between FP6 and FP7, with an allocation of up to €250m for the duration of FP7 (2007-2013), which represents an increase of about 80% of financial support from FP6.
A COST Action is a network centred on research projects nationally funded in fields that are of interest to al least five COST countries. A COST Open Call, with two cut-off dates per year, is used to select the best proposals for new COST Actions. Proposals are assessed in two stages, where the top ranked preliminary proposals are invited to submit full proposals that are then peer reviewed according to an established assessment criterion. Passing from a preliminary stage to full proposals is an indication of the research capacity of countries and their ability to build and lead research networks. Figure 15 shows the success rates of SEE countries of in being selected to submit full proposals that would eventually translate into COST Actions. Greece is by far the country that has submitted the most number of preliminary proposals between 2007-2010, followed by Bulgaria and Romania. Two SEE countries have submitted less than five preliminary proposals: former Yugoslav Republic of Macedonia (4) and Bosnia and Herzegovina (1).
SEE Countries in EU RTDI funding programmes, Technopolis 2010 19
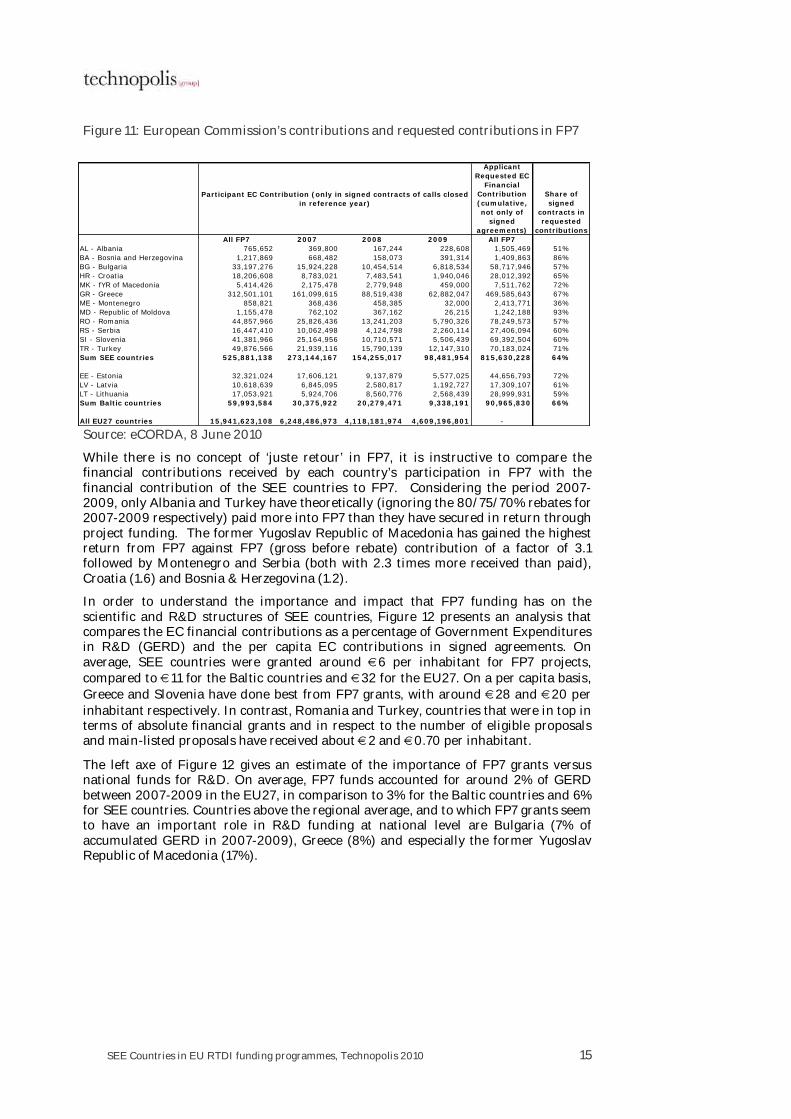
Figure 15: Number of preliminary and full proposals submitted to COST Open Call by experts from SEE countries, 2007-2010
Source: COST Office Brussels, 9 June 2010
Notes: Annual figures are the sum of both collection dates in a given year. 2010 figures are only for the first collection date of the year. Success rates are defined as all full proposals divided by all submitted preliminary proposals.
Regarding the number of full proposals submitted only Greece has been asked more than five times for complete submissions, with 22 full proposals submitted in the period 2007-(first part of) 2010. This results in a rather low participation in absolute terms. Nevertheless, the 12% success rate of proposals by SEE countries is higher than that of the Baltic countries at 7% (27 preliminary proposals vs. two full proposals). Four countries (not including the 100% rate for BiH from a single proposal) have higher success rates than the SEE rate of 12% suggesting relatively stronger research and networking capacities than the rest of SEE, these are Croatia (23%), Slovenia (19%), Turkey (17%) and Greece (15%).
Figure 16 : Number of COST Actions SEE countries participations by country, 2009
Source: COST Office Brussels, 9 June 2010
Figure 16 shows the number of COST Actions in which SEE countries participated in 2009, in comparison to the average participations of Baltic countries. Greece remains
Pre Full Pre Full Pre Full Pre Full Pre Full
Success
rate
BA - Bosnia and Herzegovina 1 1 1 1 100%
BG - Bulgaria 22 1 13 1 13 1 9 57 3 5%
HR - Croatia 3 5 3 7 1 7 1 22 5 23%
MK - fYR of Macedonia 4 4 0 0%
GR - Greece 45 5 31 6 49 8 23 3 148 22 15%
RO - Romania 8 1 20 2 20 1 49 3 6%
RS - Serbia 7 1 8 8 2 25 1 4%
SI - Slovenia 7 1 8 2 3 3 1 21 4 19%
TR - Turkey 12 3 6 1 4 1 23 4 17%
Sum SEE countries 104 11 72 13 108 12 66 7 350 43 12%
EE - Estonia 2 2 0 0%
LV - Latvia 1 1 1 1 4 0 0%
LT - Lithuania 4 1 12 2 4 21 2 10%
Sum Baltic countries 7 0 2 0 13 2 5 0 27 2 7%
Total2007 2008 2009 2010

SEE Countries in EU RTDI funding programmes, Technopolis 2010 20
the country with the most participation (195), followed by Slovenia (122), Romania (116), Bulgaria (109) and Turkey (94). All these countries were above the average of SEE participations of 92.
It is important to note is that the SEE countries average participation in COST actions is higher than those of the Baltic countries, equalling an average of 79. This might indicate something about the benefits to SEE countries of more flexible initiatives that allow ease of access for institutions from non-member countries, and thus with less administrative and capacity burdens (i.e. if compared with FP7).
3.2 EUREKA
EUREKA supports three types of projects
• Cluster Projects
− Long-term, strategically-significant initiatives
− Large number of participants, many from Europe’s major companies
− Develop generic technologies of key importance to European competitiveness
• Individual Projects
− Small, shorter-term projects
− Involve participants from at least two member countries
− Result in a product, process or service with a significant advance for the sector
• Eurostars Projects
− Small, short-term projects, involving participants from at least two member countries
− Consortium leader is an R&D-performing SME
− Programmed jointly with the European Commission
According to the EUREKA secretariat, the results of EUREKA individual projects (based on 1000 final reports from 2000-2005) are that €1.0m of public funding invested in a EUREKA project stimulated on average an investment of €2.5m from private funds, which resulted in €13m of additional turnover (real and expected) and 54 jobs created (real and expected). Hence, while the scale of investment and return for WBC might be expected to be lower, there is clearly potential in more active involvement of SEE countries in EUREKA and expanding membership to all countries.
Figure 17: Participation of WBC in Eureka, by 2009
Country Project involvement (to mid 2009)
Croatia
EUREKA member since 2000
• 24 running projects; total budget 9,0 M€
− 36 organisations (SMEs: 15, Companies: 5, Research: 3, Universities: 13)
• 20 finished projects; total budget 8,2 M€
− 34 organisations (SMEs: 11, Companies: 2, Research: 5, Universities: 16)
Serbia
EUREKA member since 2002
• 36 running projects; total budget 15,3 M€
− 95 organisations (SMEs: 31, Companies: 8, Research: 4, Universities: 52)
• 9 finished projects; total budget 3,5 M€
− 19 organisations (SMEs: 4, Companies: 3, Research: 1, Universities: 11)

SEE Countries in EU RTDI funding programmes, Technopolis 2010 21
Country Project involvement (to mid 2009)
Former Yugoslav Republic of Macedonia
EUREKA member since 2008
• 1 running project; total budget 0,2 M€
− 4 organisations (SMEs: 1, Companies: 1, Research: 0, Universities: 2)
• 2 finished projects; total budget 0,1 M€
− 2 organisations (SMEs: 0, Companies: 1, Research: 0, Universities: 1)
Source: S. Halada (2009)
According to the EUREKA secretariat, projects with Croatian, Serbian or former Yugoslav Republic of Macedonia participation are predominately the information technologies, new materials and environmental fields; and are largely aimed at pursuing national R&D strategies. Current weaknesses of EUREKA (Halada, 2009) are considered to be the low political visibility of the programme, lack of national financial support, varying link to the most active players in EUREKA and lack of more ambitious projects.
The EUREKA secretariat is actively pursuing a number of suggested actions including a promotion campaign of successful EUREKA results, organising EUREKA workshop /brokerage events in WBC and training for R&D project managers.
However, given the limited capacities (financial and human) of the WBC national stakeholders (private firms and governmental agencies, etc.) to become more actively involved in an initiative like EUREKA, there is clearly a need for a concerted effort or possibly a ‘regional EUREKA’ support action that could be funded by a multi-country project under IPA.
SEE Countries in EU RTDI funding programmes, Technopolis 2010 22
4. Conclusions and recommendations
4.1 Conclusions
This report has made use of available data on European competitive funding programmes supporting research, technological development and innovation (RTDI, although the emphasis is on RTD and less on the I) and for which the countries of South-East Europe and of the Western Balkans, in particular, are eligible.
National results drawn from such data need to be placed in context (longevity of participation in the programmes and hence ‘learning-curve’, size of countries and hence of research systems, level of economic development and hence scale of national RTDI budgets, etc.). Nevertheless, there are a number of ‘key messages’ meriting further analysis and policy action to improve SEE participation in EU funding programmes and in the wider European Research Area (ERA) concept.
A positive trend in applications and retained proposals but highly variable success rates due to new ‘regional calls’
• in terms of absolute numbers of eligible and retained proposals, and leaving aside the clear outlier of Greece (which alone accounts for 39% of all eligible proposals and retained proposals), the number of proposals submitted and retained per country under FP7 (three years of calls to date) has increased significantly in relative terms compared to FP6 (five years in total).
• the success rate of SEE countries in FP7 is highly variable year-on-year (2007-2010) which, probably, reflects specific calls targeted at SEE/WBC countries. The analysis of success rates and the patterns of success rates with specific partner countries tend to point to WBC succeeding more in calls more specifically aimed at their needs/potential.
• Moreover, the average success rate of 17% is still significantly below the EU27 average (21%) and that of the Baltic countries (22%) as a benchmark for EU27 countries with a similar scale amongst the EU27.
Highly variable results per FP7theme, in part related to scientific specialisation of SEE region
• Absolute figures in terms of proposals and relative success rates by thematic sub-programme of the FP7, show a contrasting picture where SEE countries are scoring high success rates with very few proposals on specific themes (nuclear fusion and fission) and very low success rates in some fields with a relatively high number of proposals (SSH, 7%, and Research Potential, 8%). If compared with ‘specialisation’ patterns in terms of scientific publications, the weak showing of SSH may not be such a surprise, whereas a stronger performance in some fields such as nanotechnologies (21%) and transport (19%) may reflect regional strengths in physics and engineering.
• In some cases low success rates are being offset by the absolute number of proposals such as for ICT (12% of over 4000 proposals) but this does lead to some doubt as to the quality of many proposals in a field that the SEE region claims to be strong in.
• More encouragingly a good share of projects in research infrastructure (53% of about 500 proposals requesting €53m financing) seem to have been of sufficient quality to be main-listed.
SEE Countries in EU RTDI funding programmes, Technopolis 2010 23
The financial contribution of FP7 remains heavily skewed to the ‘incumbent’ EU Member States in the SEE region.
• In absolute financial terms, the SEE countries have already (2007-9) accumulated just over half a billion euro in funding which is 76% of the funding received during FP6 (five years). However, Greece alone accounts for 59% of this total. Funds received by the WBC range from 765,000 euro in Albania to €18m in Croatia. On average funds granted corresponded to 64% of funds requested comparing favourably with 66% in the Baltic countries.
• Absolute figures are of course misleading since they do not take into account the size of the national research system. In per capita, terms SEE countries received €6 per head, compared to €11 in the Baltic Countries and €32 for the EU27. Amongst the SEE countries, Greece remains at the top of the ranking with €28/capita followed by Slovenia (€20), in contrast countries such as Albania, BiH. Montenegro and Turkey are all well below the SEE average per capita for FP7.
• Considering FP7 funding received as a share of gross national expenditure on R&D, while the SEE countries as whole have an average of 6% (compared to 2% for the EU27 and 3% for the Baltic States), this average is pulled upwards by countries such as Greece and Bulgaria (7.9% and 7%) which are ‘dependent’ on EU funds (FP7 but also Structural Funds) to finance their ‘innovation systems’. The reality in the candidate and pre-accession countries is more sobering with FP7 still representing a minor, if growing share of GERD. The exception is the former Yugoslav Republic of Macedonia (17% of GERD from FP7) but this represents only some €5m over 2007-9 and only serves to underline the low national R&D spend.
• COST and EUREKA remain of marginal importance for the SEE countries, notably the WBC. COST appears to be more favoured as an instrument for co-operation and the SEE countries participation is higher in relative terms than might be expected. EUREKA, no doubt due to the need for national financing of projects, remains an instrument only applied by a few of the WBC, even if industrially orientated R&D applicable to support economic development should probably be a higher priority in these countries.
4.2 Recommendations
The evidence from the participation of SEE countries in European level programmes funding science and innovation clearly point to progress over the last three-five years since 2006. However, the difficulty for the countries of the Western Balkans to compete in international level programmes where excellence is the driving criteria is clearly visible. Results from FP6/FP7 data suggest that European funding remains a marginal, if growing, contribution to most national research systems in the WBC.
The gap between the EU27 Member States and the candidate and associate countries in the WBC is clear, and if anything FP7 funding flows are increasing not closing the gap between the more and less developed ‘research and innovation’ systems in the region. If the investment effect of the Structural Funds is added to the equation in Bulgaria, Greece, Romania and Slovenia (and soon Croatia), the remaining non-EU member states in the Western Balkans are likely to find it even more difficult to compete over time.
Hence, the primary recommendation of this report is that it is not enough for the EU to support ‘NCP networks’ in each of the pre-accession/candidate countries or ‘soft’ interventions to improve research policy making capacity, etc. (as much as this is needed as well), there is a clear need for a concerted investment in research and innovation infrastructure and in the training and re-skilling of scientists, technicians and engineers working in public, higher education and private sectors in the WBC. This investment needs to start, in 2010, not in 2015 or later. The EC’s IPA allied to EIB funds, plus those of other donors, needs to be
SEE Countries in EU RTDI funding programmes, Technopolis 2010 24
brought to bear much more than in the last decade on the knowledge economy if the WBC are to compete internationally.
There is a need for investment in the WBC research and innovation systems to be done strategically. A framework proposed (see Figure 18) in a recent report on the role of community research policy in the knowledge based economy gives guidance on the respective role of national versus international funding instruments.
Figure 18: a taxonomy of research funded by public funds
Source: EC (2009)
The WBC, in particular given their limited national financial means, need to be able to distinguish between those researchers doing type 2 research that would ideally to be encouraged to pursue such research through programmes like FP7; and type 3 research, where there may be good national reason for investing in R&D which is not at the international cutting edge but can contribute to the upgrading of technologies and products in the economy or for societal needs (e.g. water management, environmental protection).
Type 1 research would then be ideally the focus of concerted efforts by national funding (allied to IPA/EIB) to create a limited number of ‘centres of excellence’ which can compete at international level based on the excellence criteria, while contributing nationally to strategies for shifting industries up the value chain, or meeting societal challenges.
The following specific recommendations are made as options for further discussion within the regional science and innovation platforms and between the SEE countries and the European Commission:
• The EC should consider increasing the ‘regional approach’ piloted under FP7 in a limited way in future programmes (FP8, etc.) while not deviating from the principle of excellence within specific ‘ring-fenced’ budgets for the WBC.
• The EC should consider undertaking a cross-cutting study to analyse the focus and effects of past PHARE/CARDS/IPA funded projects in the fields of research and innovation objectives in order to draw lessons on how to further expand IPA support.
• In line with the Europe 2020 target, the EC services (DGs RELEX and Enlargement, Research and Enterprise, etc.) should review strategic frameworks with the WBC governments (European Partnerships, Accession Partnerships, the multi-annual indicative financial framework and multi-annual indicative planning documents for each country), in order to place a greater emphasis on research and innovation and the knowledge triangle.
• In liaison with national governments, should seek to increase significantly, the share of future IPA funding (in synergy with other donor and investment funds) on research and innovation policy capacity building and infrastructure and programmes. This should involve technical assistance for national research infrastructure plans, for (peer-based) evaluations of research centres, etc. in order to focus support on those teams with the most potential.

SEE Countries in EU RTDI funding programmes, Technopolis 2010 25
• National governments should seek focus efforts on a limited number of national research centres able to participate in ‘networks of excellence’. In doing so there is a need to have a more realistic recognition of the ‘scientific specialisation’ (engineering, medicine, physics) of the national research system. This could involve strategic reviews of higher education and public research institutes and rationalisation where required.
• There is a need to balance justified efforts to enhance and optimise ‘Western-Balkans’ co-operation through ERA-NETS and other forms of regional co-operation; with greater effort to integrating SEE researchers in international networks with ‘leading players’ – breaking out of “closed” regional networks. Enhanced EC support for NCP networks needs to twinned with a national commitment to giving such intermediaries the time and resources required to carry out their mission pro-actively.
• All WBC should be encouraged to join EUREKA and play and active part in this industrially orientated research initiative.
• From a demand side perspective, the EC should open up and promote full participation of all WBC in the Competitiveness and Innovation Programme instruments, which, from a technology diffusion or innovation management perspective, are highly relevant for the ‘upgrading’ of the business sectors in these transition economies.
Appendix A - References
COST Office (2009), Annual Report 2008, European Cooperation in Science and Technology, Brussels
Dall E. A. Kesselring (2009) Analysis of Cooperation Patterns of Western Balkan Countries in International Research Cooperation Programmes, WB-INCO-NET project report,
European Commission (2007) Commission Staff Working Document. A new approach to international scientific and technological co-operation in the 7th Research Framework Programme (2007-2013) and 7th Framework Programme of the European Atomic Energy Community (Euratom) (2007-2011) Brussels, 12.1.2007, SEC(2007)47
European Commission (2008), FP6 Final Review: Subscription, Implementation, Participation, Research Directorate-General, Brussels June 2008.
European Commission (2009) The role of Community Research policy in the knowledge-based economy
Halada S. (2009) EUREKA in Western Balkans Countries, Presentation to the Meeting of Steering Platform on Research for Western Balkans Countries, EUREKA Secretariat
Nyiri L, K. Schuch and E. Dall (2010) International Benchmarking of the NCP Systems in Europe. Report prepared as part of the EU funded project ‘Capacity building and institutional strengthening of Science and Research in BiH.
Appendix B - Additional data tables and country pages
See separate volume.

Technopolis Belgium Avenue de Tervuren 12 B-1040 Brussels Belgium T Tel +32 2 737 74 40 F +32 2 727 74 49 E [email protected] www.technopolis-group.com

July 2010
Participation of South-East European countries in the competitive funding programmes for research in the European Commission
ANNEXES to Report to UNESCO-BRESCE
www.technopolis-group.com
Additional data tables and country ages


Participation of South-East European countries in the competitive funding programmes for research in the European Commission i
Table of Contents Appendix A - Other figures and complementary tables 2
Appendix B - Country pages 10
B.1. Albania 10 B.2. Bosnia & Herzegovina 12 B.3. Bulgaria 14 B.4. Croatia 16 B.5. former Yugoslav Republic of Macedonia 18 B.6. Greece 20 B.7. Montenegro 22 B.8. Republic of Moldova 24 B.9. Romania 26 B.10. Serbia 28 B.11. Slovenia 30 B.12. Turkey 32
Table of Figures Figure 1 FP6 participation and contribution by country, SEE countries 2 Figure 2 Number of eligible proposals with at least one applicant in country and success rates, INCO-NETS 2 Figure 3 Number of eligible proposals with at least one applicant in country and suceess rates, ERA-NETS 3 Figure 4 List of analysed FP7 calls for proposals in the period 2007-2010, by proposal call deadline year 3
Participation of South-East European countries in the competitive funding programmes for research in the European Commission 2
Appendix A - Other figures and complementary tables
Figure 1 FP6 participation and contribution by country, SEE countries
Source: European Commission DG RTD, 2008
Figure 2 Number of eligible proposals with at least one applicant in country and success rates, INCO-NETS

Participation of South-East European countries in the competitive funding programmes for research in the European Commission 3
Source: eCORDA, 8 June 2010
Figure 3 Number of eligible proposals with at least one applicant in country and success rates, ERA-NETS
Source: eCORDA, 8 June 2010
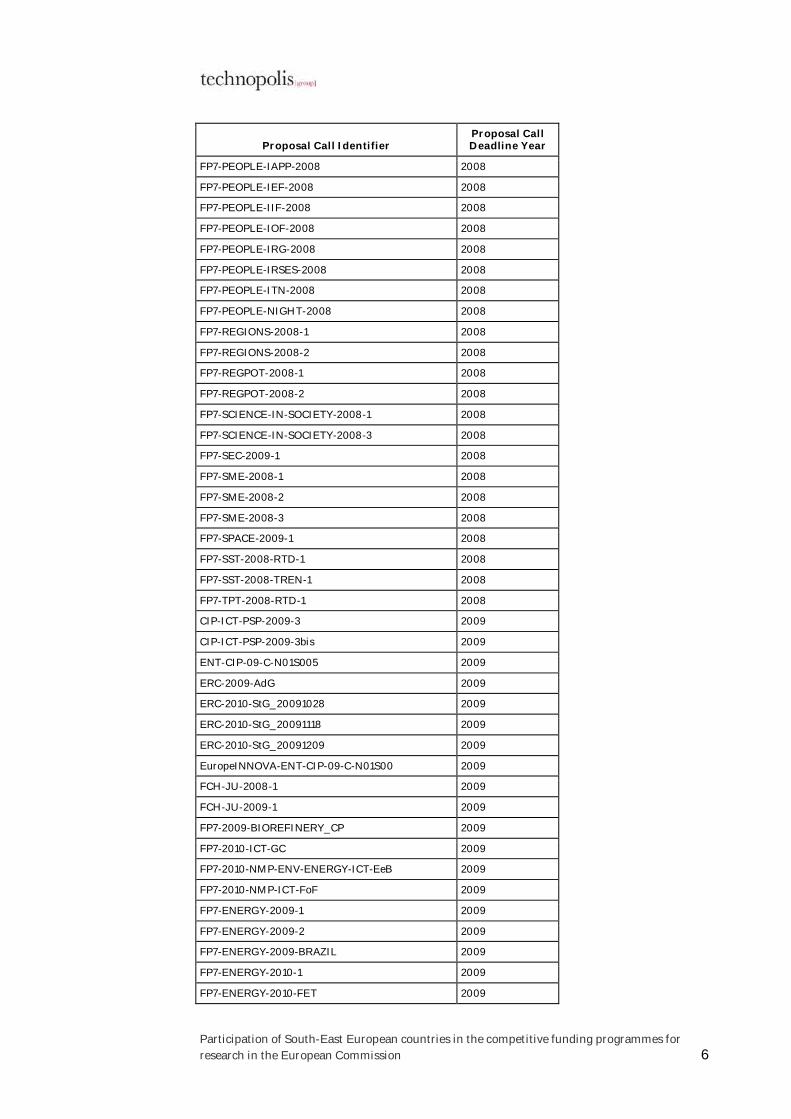
Figure 4 List of analysed FP7 calls for proposals in the period 2007-2010, by proposal call deadline year
Proposal Call Identifier Proposal Call Deadline Year
CIP-ICT-PSP-2007-1 2007
ERC-2007-StG 2007
FP7-2007-COST 2007
FP7-2007-ERANET-4.2.2.2 2007
FP7-AAT-2007-RTD-1 2007
FP7-AAT-2007-TREN-1 2007
FP7-ENERGY-2007-1-RTD 2007
FP7-ENERGY-2007-2-TREN 2007
FP7-ENV-2007-1 2007
FP7-ERANET-2007-RTD 2007
FP7-ERARESORG-2007-1-RTD 2007
FP7-Fission-2007 2007
FP7-HEALTH-2007-A 2007
FP7-HEALTH-2007-B 2007
FP7-ICT-2007-1 2007

Participation of South-East European countries in the competitive funding programmes for research in the European Commission 4
Proposal Call Identifier Proposal Call Deadline Year
FP7-ICT-2007-2 2007
FP7-ICT-2007-C 2007
FP7-ICT-SEC-2007-1 2007
FP7-INCO-2007-1 2007
FP7-INCO-2007-2 2007
FP7-INCO-2007-4 2007
FP7-INFRASTRUCTURES-2007-1 2007
FP7-INFRASTRUCTURES-2007-2 2007
FP7-KBBE-2007-1 2007
FP7-KBBE-2007-2A 2007
FP7-NMP-2007-CSA-1 2007
FP7-NMP-2007-LARGE-1 2007
FP7-NMP-2007-SMALL-1 2007
FP7-NMP-2007-SME-1 2007
FP7-PEOPLE-2007-1-1-ITN 2007
FP7-PEOPLE-2007-2-1-IEF 2007
FP7-PEOPLE-2007-2-2-ERG 2007
FP7-PEOPLE-2007-3-1-IAPP 2007
FP7-PEOPLE-2007-4-1-IOF 2007
FP7-PEOPLE-2007-4-2-IIF 2007
FP7-PEOPLE-2007-4-3-IRG 2007
FP7-PEOPLE-2007-5-1-1-NIGHT 2007
FP7-PEOPLE-2007-5-2-AWARDS 2007
FP7-PEOPLE-2007-5-3-ERA-MORE 2007
FP7-PEOPLE-2007-5-4-NCP 2007
FP7-REGIONS-2007-1 2007
FP7-REGIONS-2007-2 2007
FP7-REGIONS-2007-3 2007
FP7-REGPOT-2007-1 2007
FP7-REGPOT-2007-2 2007
FP7-REGPOT-2007-3 2007
FP7-REGPOT-2007-4 2007
FP7-SCIENCE-IN-SOCIETY-2007-1 2007
FP7-SCIENCE-IN-SOCIETY-2007-2 2007
FP7-SEC-2007-1 2007
FP7-SME-2007-1 2007
FP7-SME-2007-2 2007
FP7-SME-2007-3 2007
FP7-SPACE-2007-1 2007
FP7-SSH-2007-1 2007
FP7-SST-2007-RTD-1 2007
Participation of South-East European countries in the competitive funding programmes for research in the European Commission 5
Proposal Call Identifier Proposal Call Deadline Year
FP7-SST-2007-TREN-1_05June 2007
FP7-SST-2007-TREN-1_28June 2007
FP7-TPT-2007-RTD-1 2007
CIP-ICT-PSP-2008-2 2008
CIP-IEE-2008 2008
ERC-2008-AdG 2008
ERC-2008-Support 2008
ERC-2009-StG 2008
ERC-2009-SUPPORT 2008
FP7-2009-BIOREFINERY_CP 2008
FP7-2009-BIOREFINERY_CSA 2008
FP7-AAT-2008-RTD-1 2008
FP7-COH-2007-2.2-OMC-NET 2008
FP7-ENERGY-2008-1 2008
FP7-ENERGY-2008-FET 2008
FP7-ENERGY-2008-RUSSIA 2008
FP7-ENERGY-2008-TREN-1 2008
FP7-ENERGY-2009-1 2008
FP7-ENERGY-2009-3 2008
FP7-ENERGY-NMP-2008-1 2008
FP7-ENV-2008-1 2008
FP7-ENV-NMP-2008-2 2008
FP7-ERANET-2008-RTD 2008
FP7-Fission-2008 2008
FP7-GALILEO-2007-GSA-1 2008
FP7-HEALTH-2009-single-stage 2008
FP7-HEALTH-2009-two-stage 2008
FP7-ICT-2007-3 2008
FP7-ICT-2007-C 2008
FP7-INCO-2007-3 2008
FP7-INFRASTRUCTURES-2008-1 2008
FP7-INFRASTRUCTURES-2008-2 2008
FP7-KBBE-2007-2A 2008
FP7-KBBE-2008-2B 2008
FP7-NMP-2008-CSA-2 2008
FP7-NMP-2008-EU-India-2 2008
FP7-NMP-2008-LARGE-2 2008
FP7-NMP-2008-SMALL-2 2008
FP7-NMP-2008-SME-2 2008
FP7-PEOPLE-2007-2-3-COFUND 2008
FP7-PEOPLE-ERG-2008 2008
Participation of South-East European countries in the competitive funding programmes for research in the European Commission 6
Proposal Call Identifier Proposal Call Deadline Year
FP7-PEOPLE-IAPP-2008 2008
FP7-PEOPLE-IEF-2008 2008
FP7-PEOPLE-IIF-2008 2008
FP7-PEOPLE-IOF-2008 2008
FP7-PEOPLE-IRG-2008 2008
FP7-PEOPLE-IRSES-2008 2008
FP7-PEOPLE-ITN-2008 2008
FP7-PEOPLE-NIGHT-2008 2008
FP7-REGIONS-2008-1 2008
FP7-REGIONS-2008-2 2008
FP7-REGPOT-2008-1 2008
FP7-REGPOT-2008-2 2008
FP7-SCIENCE-IN-SOCIETY-2008-1 2008
FP7-SCIENCE-IN-SOCIETY-2008-3 2008
FP7-SEC-2009-1 2008
FP7-SME-2008-1 2008
FP7-SME-2008-2 2008
FP7-SME-2008-3 2008
FP7-SPACE-2009-1 2008
FP7-SST-2008-RTD-1 2008
FP7-SST-2008-TREN-1 2008
FP7-TPT-2008-RTD-1 2008
CIP-ICT-PSP-2009-3 2009
CIP-ICT-PSP-2009-3bis 2009
ENT-CIP-09-C-N01S005 2009
ERC-2009-AdG 2009
ERC-2010-StG_20091028 2009
ERC-2010-StG_20091118 2009
ERC-2010-StG_20091209 2009
EuropeINNOVA-ENT-CIP-09-C-N01S00 2009
FCH-JU-2008-1 2009
FCH-JU-2009-1 2009
FP7-2009-BIOREFINERY_CP 2009
FP7-2010-ICT-GC 2009
FP7-2010-NMP-ENV-ENERGY-ICT-EeB 2009
FP7-2010-NMP-ICT-FoF 2009
FP7-ENERGY-2009-1 2009
FP7-ENERGY-2009-2 2009
FP7-ENERGY-2009-BRAZIL 2009
FP7-ENERGY-2010-1 2009
FP7-ENERGY-2010-FET 2009
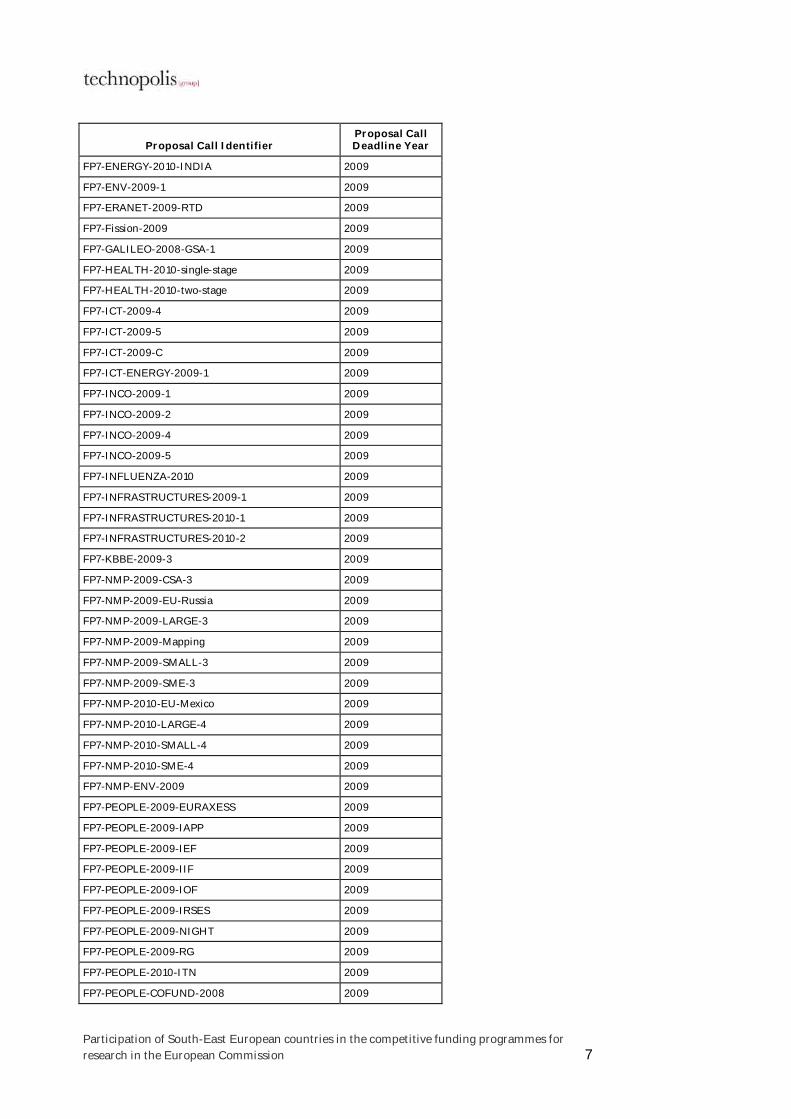
Participation of South-East European countries in the competitive funding programmes for research in the European Commission 7
Proposal Call Identifier Proposal Call Deadline Year
FP7-ENERGY-2010-INDIA 2009
FP7-ENV-2009-1 2009
FP7-ERANET-2009-RTD 2009
FP7-Fission-2009 2009
FP7-GALILEO-2008-GSA-1 2009
FP7-HEALTH-2010-single-stage 2009
FP7-HEALTH-2010-two-stage 2009
FP7-ICT-2009-4 2009
FP7-ICT-2009-5 2009
FP7-ICT-2009-C 2009
FP7-ICT-ENERGY-2009-1 2009
FP7-INCO-2009-1 2009
FP7-INCO-2009-2 2009
FP7-INCO-2009-4 2009
FP7-INCO-2009-5 2009
FP7-INFLUENZA-2010 2009
FP7-INFRASTRUCTURES-2009-1 2009
FP7-INFRASTRUCTURES-2010-1 2009
FP7-INFRASTRUCTURES-2010-2 2009
FP7-KBBE-2009-3 2009
FP7-NMP-2009-CSA-3 2009
FP7-NMP-2009-EU-Russia 2009
FP7-NMP-2009-LARGE-3 2009
FP7-NMP-2009-Mapping 2009
FP7-NMP-2009-SMALL-3 2009
FP7-NMP-2009-SME-3 2009
FP7-NMP-2010-EU-Mexico 2009
FP7-NMP-2010-LARGE-4 2009
FP7-NMP-2010-SMALL-4 2009
FP7-NMP-2010-SME-4 2009
FP7-NMP-ENV-2009 2009
FP7-PEOPLE-2009-EURAXESS 2009
FP7-PEOPLE-2009-IAPP 2009
FP7-PEOPLE-2009-IEF 2009
FP7-PEOPLE-2009-IIF 2009
FP7-PEOPLE-2009-IOF 2009
FP7-PEOPLE-2009-IRSES 2009
FP7-PEOPLE-2009-NIGHT 2009
FP7-PEOPLE-2009-RG 2009
FP7-PEOPLE-2010-ITN 2009
FP7-PEOPLE-COFUND-2008 2009

Participation of South-East European countries in the competitive funding programmes for research in the European Commission 8
Proposal Call Identifier Proposal Call Deadline Year
FP7-REGIONS-2009-1 2009
FP7-REGPOT-2009-1 2009
FP7-REGPOT-2009-2 2009
FP7-REGPOT-2010-1 2009
FP7-REGPOT-2010-5 2009
FP7-SCIENCE-IN-SOCIETY-2009-1 2009
FP7-SCIENCE-IN-SOCIETY-2010-UNIV 2009
FP7-SEC-2010-1 2009
FP7-SME-2008-2 2009
FP7-SME-2009-1 2009
FP7-SME-2010-1 2009
FP7-SPACE-2010-1 2009
FP7-SSH-2009-A 2009
FP7-SSH-2009-B 2009
FP7-SSH-2009-C 2009
FP7-SSH-2010-4 2009
PROINNOEurope-ENT-CIP-09-C-N02S00 2009
SP1-JTI-CS-2009-01 2009
ARTEMIS-2010-1 2010
CIP-ICT-PSP-2009-4 2010
ENIAC-2010-1 2010
ERC-2010-AdG_20100224 2010
ERC-2010-AdG_20100317 2010
ERC-2010-AdG_20100407 2010
FP7-2010-GC-ELECTROCHEMICAL-STORAGE 2010
FP7-AAT-2010-RTD-1 2010
FP7-AAT-2010-RTD-CHINA 2010
FP7-AAT-2010-RTD-RUSSIA 2010
FP7-AFRICA-2010 2010
FP7-ENERGY-2010-1 2010
FP7-ENERGY-2010-2 2010
FP7-ENERGY-2010-FET 2010
FP7-ENV-2010 2010
FP7-ERANET-2010-RTD 2010
FP7-Fission-2010 2010
FP7-HEALTH-2010-Alternative-Testing 2010
FP7-ICT-2009-6 2010
FP7-ICT-2009-C 2010
FP7-INCO-2010-1 2010
FP7-INCO-2010-2 2010
FP7-INCO-2010-3 2010

Participation of South-East European countries in the competitive funding programmes for research in the European Commission 9
Proposal Call Identifier Proposal Call Deadline Year
FP7-INCO-2010-6 2010
FP7-KBBE-2010-4 2010
FP7-NMP-2010-CSA-4 2010
FP7-NMP-2010-EU-USA 2010
FP7-OCEAN-2010 2010
FP7-PEOPLE-2010-COFUND 2010
FP7-PEOPLE-2010-IRSES 2010
FP7-PEOPLE-2010-NIGHT 2010
FP7-PEOPLE-2010-RG 2010
FP7-REGIONS-2010-1 2010
FP7-SCIENCE-IN-SOCIETY-2010-1 2010
FP7-SCIENCE-IN-SOCIETY-2010-CAREERS 2010
FP7-SCIENCE-IN-SOCIETY-2010-NCP 2010
FP7-SSH-2010-1 2010
FP7-SSH-2010-2 2010
FP7-SSH-2010-3 2010
FP7-SST-2010-RTD-1 2010
FP7-TRANSPORT-2010-TREN-1 2010
SP1-JTI-CS-2009-02 2010
SP1-JTI-CS-2010-01 2010
Source: eCORDA, 8 June 2010
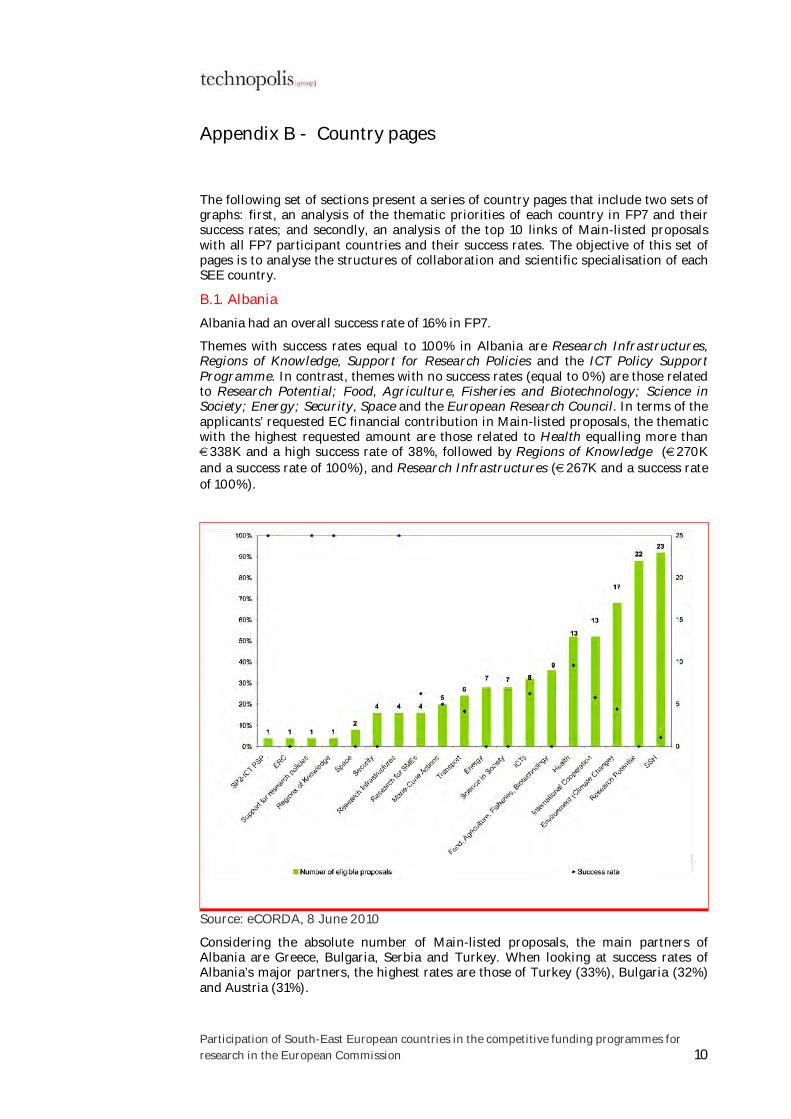
Participation of South-East European countries in the competitive funding programmes for research in the European Commission 10
Appendix B - Country pages
The following set of sections present a series of country pages that include two sets of graphs: first, an analysis of the thematic priorities of each country in FP7 and their success rates; and secondly, an analysis of the top 10 links of Main-listed proposals with all FP7 participant countries and their success rates. The objective of this set of pages is to analyse the structures of collaboration and scientific specialisation of each SEE country.
B.1. Albania
Albania had an overall success rate of 16% in FP7.
Themes with success rates equal to 100% in Albania are Research Infrastructures, Regions of Knowledge, Support for Research Policies and the ICT Policy Support Programme. In contrast, themes with no success rates (equal to 0%) are those related to Research Potential; Food, Agriculture, Fisheries and Biotechnology; Science in Society; Energy; Security, Space and the European Research Council. In terms of the applicants’ requested EC financial contribution in Main-listed proposals, the thematic with the highest requested amount are those related to Health equalling more than €338K and a high success rate of 38%, followed by Regions of Knowledge (€270K and a success rate of 100%), and Research Infrastructures (€267K and a success rate of 100%).
Source: eCORDA, 8 June 2010
Considering the absolute number of Main-listed proposals, the main partners of Albania are Greece, Bulgaria, Serbia and Turkey. When looking at success rates of Albania’s major partners, the highest rates are those of Turkey (33%), Bulgaria (32%) and Austria (31%).

Participation of South-East European countries in the competitive funding programmes for research in the European Commission 11
Source: eCORDA, 8 June 2010
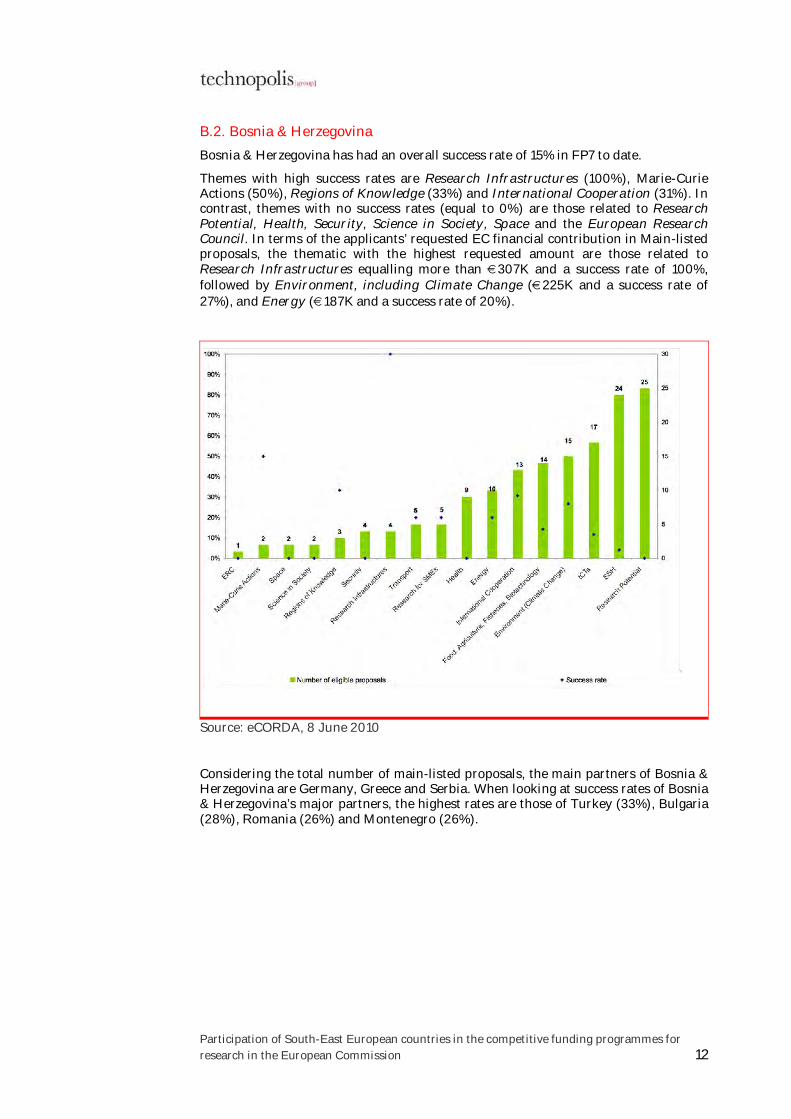
Participation of South-East European countries in the competitive funding programmes for research in the European Commission 12
B.2. Bosnia & Herzegovina
Bosnia & Herzegovina has had an overall success rate of 15% in FP7 to date.
Themes with high success rates are Research Infrastructures (100%), Marie-Curie Actions (50%), Regions of Knowledge (33%) and International Cooperation (31%). In contrast, themes with no success rates (equal to 0%) are those related to Research Potential, Health, Security, Science in Society, Space and the European Research Council. In terms of the applicants’ requested EC financial contribution in Main-listed proposals, the thematic with the highest requested amount are those related to Research Infrastructures equalling more than €307K and a success rate of 100%, followed by Environment, including Climate Change (€225K and a success rate of 27%), and Energy (€187K and a success rate of 20%).
Source: eCORDA, 8 June 2010
Considering the total number of main-listed proposals, the main partners of Bosnia & Herzegovina are Germany, Greece and Serbia. When looking at success rates of Bosnia & Herzegovina’s major partners, the highest rates are those of Turkey (33%), Bulgaria (28%), Romania (26%) and Montenegro (26%).

Participation of South-East European countries in the competitive funding programmes for research in the European Commission 13
Source: eCORDA, 8 June 2010

Participation of South-East European countries in the competitive funding programmes for research in the European Commission 14
B.3. Bulgaria
Bulgaria has an overall success rate of 17% in FP7.
Themes with high success rates in Bulgaria are General Activities (100%), Support for the development of coherent research policies (67%), Research Infrastructures (56%), and Fusion Energy (50%). In contrast, themes with success rates below the overall country’s success of 17% are those related to the European Research Council (5%), Social Sciences and Humanities (9%), ICTs (11%), Security (11%), Nanosciences and Nanotechnologies (11%), Research Potential (12%), Research for the benefit of SMEs (13%), Energy (14%), and Health (16%). In terms of the applicants’ requested EC financial contribution in Main-listed proposals, the thematic with the highest requested amount are those related to Research Potential equalling more than €8M and a success rate of 12%, followed by ICTs (€8M and a success rate of 11%), and Research Infrastructures (€5M and a success rate of 56%).
Source: eCORDA, 8 June 2010
Considering the absolute number of main-listed proposals, the main partners of Bulgaria are Germany, the United Kingdom, Italy and France. When looking at success rates of Bulgaria’s participation with major partners, the highest rates are those resulting from partnerships with the Netherlands (25%), Belgium (23%) and France (21%).

Participation of South-East European countries in the competitive funding programmes for research in the European Commission 15
Source: eCORDA, 8 June 2010

Participation of South-East European countries in the competitive funding programmes for research in the European Commission 16
B.4. Croatia
Croatia has had an overall success rate of 16% in FP7 to date.
Themes with high success rates in Croatia are Space (75%) and Research Infrastructures (50%). In contrast, themes with success rates below the overall country’s success of 16% are those related to Social Sciences and Humanities (5%), Science in Society (8%), Health (9%), Security (10%), Research Potential (10%), ICTs (12%), and Marie-Curie Actions (13%). In terms of the applicants’ requested EC financial contribution in Main-listed proposals, the thematic with the highest requested amount are those related to Research Potential equalling more than €7M and a success rate of 10%, followed by Transport including Aeronautics (€5M and a success rate of 20%), and Energy (€2M and a success rate of 24%).
Considering the absolute number of main-listed proposals, the main partners of Croatia are Germany and the United Kingdom. When looking at success rates of Croatia’s participation with major partners, the highest rates are those resulting from partnerships with Sweden (29%) and the Netherlands (25%).
Source: eCORDA, 8 June 2010

Participation of South-East European countries in the competitive funding programmes for research in the European Commission 17
Source: eCORDA, 8 June 2010

Participation of South-East European countries in the competitive funding programmes for research in the European Commission 18
B.5. former Yugoslav Republic of Macedonia
The former Yugoslav Republic of Macedonia has an overall success rate of 17% in FP7.
Themes with high success rates in Macedonia are Research Infrastructures (86%) and Support for the development of coherent research policies (50%). In contrast, themes with success rates below the overall country’s success of 17% are those related to Transport including Aeronautics (14%); Research for the benefit of SMEs (13%); Environment including Climate Change (12%); Food, Agriculture, Fisheries and Biotechnology (10%); Research Potential (8%), Social Sciences and Humanities (4%), Science in Society (0%) and those related to the European Research Council (0%). In terms of the applicants’ requested EC financial contribution in main-listed proposals, the thematic with the highest requested amount are those related to Research Potential equalling more than €2M and a success rate of 8%, followed by Energy (€1M and a success rate of 43%).
Source: eCORDA, 8 June 2010
Considering the total number of main-listed proposals, the main partners of Macedonia are Greece, Bulgaria and Serbia. When looking at success rates of Macedonia’s participation with major partners, the highest rates are those resulting from partnerships with Turkey (31%), Greece (28%), Croatia (28%), Romania (28%) and France (28%).

Participation of South-East European countries in the competitive funding programmes for research in the European Commission 19
Source: eCORDA, 8 June 2010

Participation of South-East European countries in the competitive funding programmes for research in the European Commission 20
B.6. Greece
Greece has had an overall success rate of 17% in FP7 to date.
Themes with high success rates in Greece are Fusion Energy (100%) and General Activities (75%). In contrast, themes with success rates below the overall country’s success of 17% are those related to Research for the benefit of SMEs (16%); Health (16%); Food, Agriculture, Fisheries and Biotechnology (16%); ICTs (12%); Security (12%); Research Potential (10%); Social Sciences and Humanities (6%); and those related to the European Research Council (4%). In terms of the applicants’ requested EC financial contribution in Main-listed proposals, the thematic with the highest requested amount by far are those related to ICTs equalling around €154M and a success rate of 12%.
Source: eCORDA, 8 June 2010
Considering the total number of main-listed proposals, the main partners of Greece are Germany and the United Kingdom. When looking at success rates of Greece’s participation with major partners, the highest rates are those resulting from partnerships with Sweden (22%), the Netherlands (22%), Belgium (21%), Switzerland (21%) and France (21%).

Participation of South-East European countries in the competitive funding programmes for research in the European Commission 21
Source: eCORDA, 8 June 2010

Participation of South-East European countries in the competitive funding programmes for research in the European Commission 22
B.7. Montenegro
Montenegro has an overall success rate of 22% in FP7. Themes with high success rates in Montenegro are Research Infrastructures (100%), Marie Curie Actions (67%), International Cooperation (50%), Science in Society (50%) and Security (50%). In contrast, themes with success rates of 0% are those related to the European Research Council, support for the development of coherent research policies, Space, Energy, Transport (including Aeronautics), Research for the benefit of SMEs, and Health. In terms of the applicants’ requested EC financial contribution in Main-listed proposals, the thematic with the highest requested amount by far are those related to Research potential equalling around €1.3M and a success rate of 9%, and Research infrastructures equalling around €448K and a success rate of 100%.
Source: eCORDA, 8 June 2010
Considering the total number of main-listed proposals, the main partners of Montenegro are Serbia and Greece. When looking at success rates of Montenegro’s participation with major partners, the highest rates are those resulting from partnerships with Turkey (53%) and France (52%).
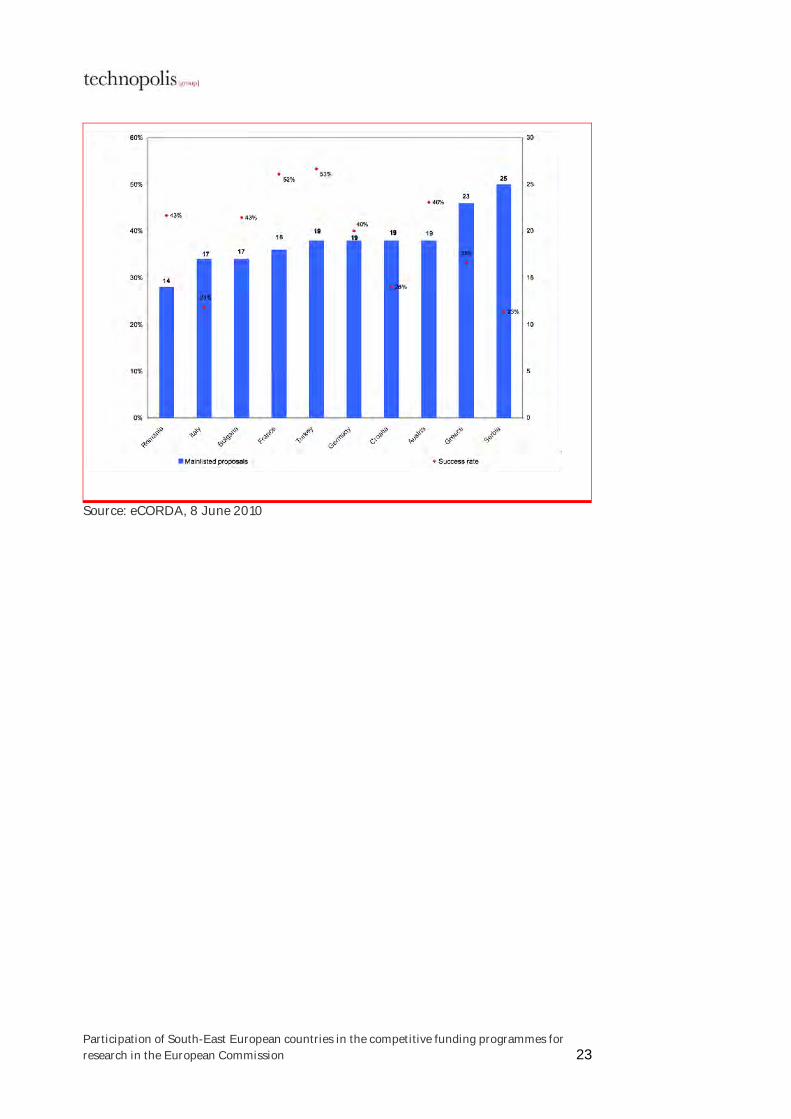
Participation of South-East European countries in the competitive funding programmes for research in the European Commission 23
Source: eCORDA, 8 June 2010

Participation of South-East European countries in the competitive funding programmes for research in the European Commission 24
B.8. Republic of Moldova
The Republic of Moldova has had an overall success rate of 20% in FP7 to date. Themes with high success rates in the Republic of Moldova are Research Infrastructures (67%), Research for the benefit of SMEs (50%), and Transport (including Aeronautics) (50%). In contrast, themes with success rates of 0% are those related to Energy; Science in Society; Security; Nanosciences and Nanotechnologies; Social Sciences and Humanities; and Food, Agriculture, Fisheries and Biotechnology. In terms of the applicants’ requested EC financial contribution in Main-listed proposals, the thematic with the highest requested amount by far are those related to Research Infrastructures equalling around €492K and a success rate of 67%, and International Cooperation equalling around €461K and a success rate of 40%.
Source: eCORDA, 8 June 2010
Considering the total number of main-listed proposals, the main partners of Montenegro are Serbia and Greece. When looking at success rates of Montenegro’s participation with major partners, the highest rates are those resulting from partnerships with Turkey (53%) and France (52%).

Participation of South-East European countries in the competitive funding programmes for research in the European Commission 25
Source: eCORDA, 8 June 2010
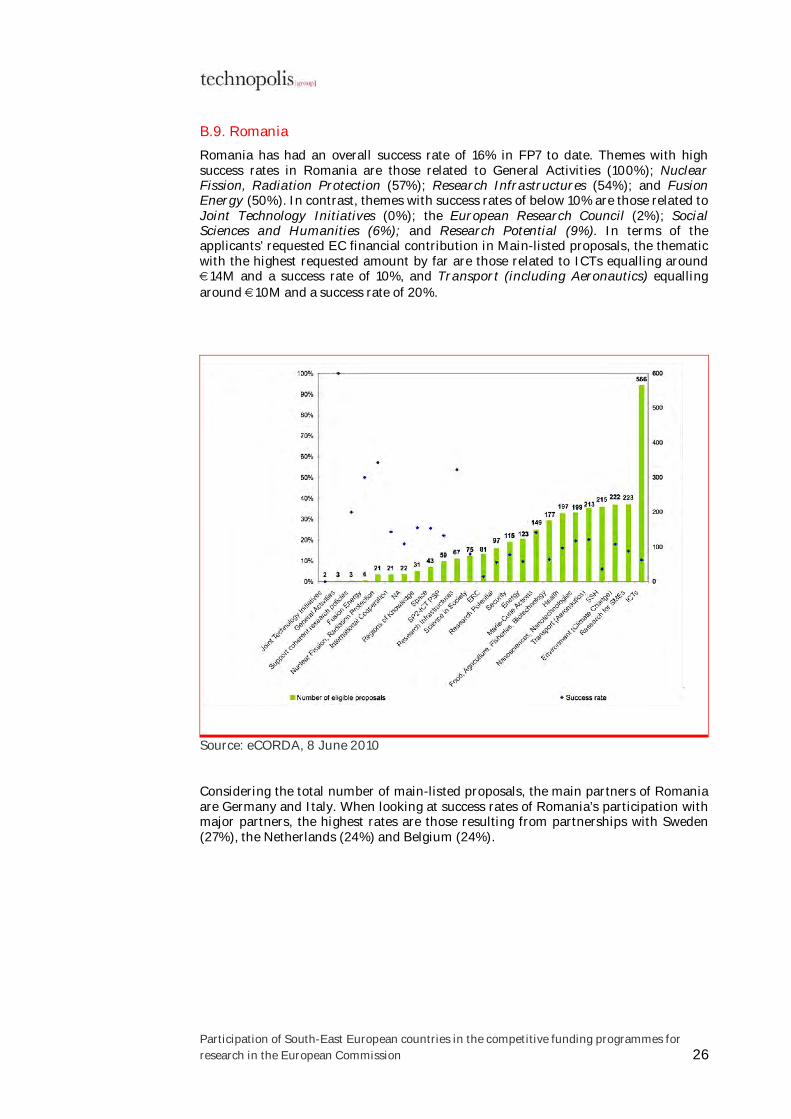
Participation of South-East European countries in the competitive funding programmes for research in the European Commission 26
B.9. Romania
Romania has had an overall success rate of 16% in FP7 to date. Themes with high success rates in Romania are those related to General Activities (100%); Nuclear Fission, Radiation Protection (57%); Research Infrastructures (54%); and Fusion Energy (50%). In contrast, themes with success rates of below 10% are those related to Joint Technology Initiatives (0%); the European Research Council (2%); Social Sciences and Humanities (6%); and Research Potential (9%). In terms of the applicants’ requested EC financial contribution in Main-listed proposals, the thematic with the highest requested amount by far are those related to ICTs equalling around €14M and a success rate of 10%, and Transport (including Aeronautics) equalling around €10M and a success rate of 20%.
Source: eCORDA, 8 June 2010
Considering the total number of main-listed proposals, the main partners of Romania are Germany and Italy. When looking at success rates of Romania’s participation with major partners, the highest rates are those resulting from partnerships with Sweden (27%), the Netherlands (24%) and Belgium (24%).

Participation of South-East European countries in the competitive funding programmes for research in the European Commission 27
Source: eCORDA, 8 June 2010

Participation of South-East European countries in the competitive funding programmes for research in the European Commission 28
B.10. Serbia
Serbia has had an overall success rate of 14% in FP7 to date. Themes with high success rates in Serbia are those related to the ICT Policy Support Programme (100%), Research Infrastructures (38%), Nanosciences and Nanotechnologies (33%), and Support for the development of coherent research policies (33%). In contrast, themes with success rates of 0% are those related to Nuclear Fission and Radiation Protection; and Space. In terms of the applicants’ requested EC financial contribution in Main-listed proposals, the thematic with the highest requested amount by far are those related to Research Potential equalling around €14M and a success rate of 9%; and ICTs equalling around €5M and a success rate of 16%.
Source: eCORDA, 8 June 2010
Considering the total number of main-listed proposals, the main partners of Serbia are Germany, Greece and Italy. When looking at success rates of Serbia’s participation with major partners, the highest rates are those resulting from partnerships with Switzerland (30%), Bulgaria (23%) and France (23%).
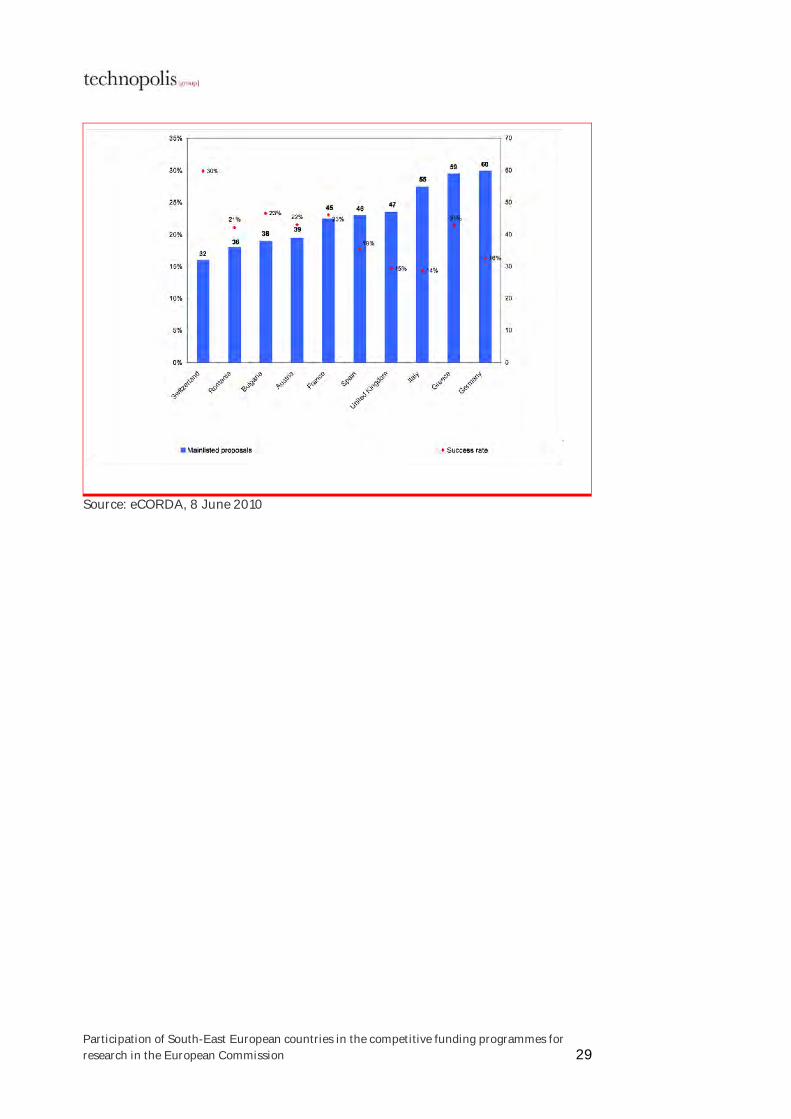
Participation of South-East European countries in the competitive funding programmes for research in the European Commission 29
Source: eCORDA, 8 June 2010

Participation of South-East European countries in the competitive funding programmes for research in the European Commission 30
B.11. Slovenia
Slovenia has had an overall success rate of 18% in FP7 to date. Themes with high success rates in Slovenia are those related to Nuclear Fission and Radiation Protection (69%); Support for the development of coherent research policies (50%); and General Activities (50%). In contrast, themes with success rates of below 10% are those related to the European Research Council (0%) and Social Sciences and Humanities (8%). In terms of the applicants’ requested EC financial contribution in Main-listed proposals, the thematic with the highest requested amount by far are those related to ICTs equalling around €15M and a success rate of 12%; and Nanosciences and Nanotechnologies equalling around €9M and a success rate of 23%.
Source: eCORDA, 8 June 2010
Considering the total number of main-listed proposals, the main partners of Slovenia are Germany and the United Kingdom. When looking at success rates of Slovenia’s participation with major partners, the highest rates are those resulting from partnerships with the Netherlands (26%), Belgium (26%) and Sweden (26%).
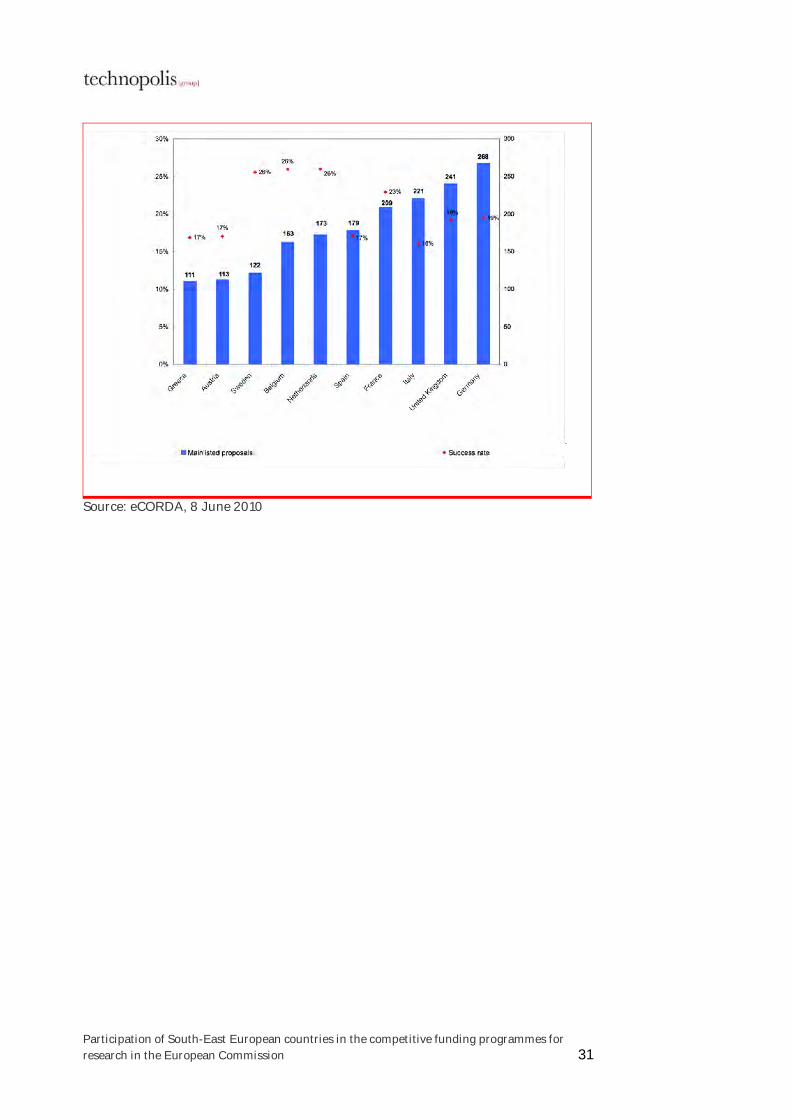
Participation of South-East European countries in the competitive funding programmes for research in the European Commission 31
Source: eCORDA, 8 June 2010

Participation of South-East European countries in the competitive funding programmes for research in the European Commission 32
B.12. Turkey
Turkey has had an overall success rate of 17% in FP7 to date. Themes with high success rates in Turkey are those related to General Activities (67%); Research Infrastructures (56%); and International Cooperation (50%). In contrast, themes with success rates of 0% are those related to Nuclear Fission and Radiation Protection; and the ICT Policy Support Programme. In terms of the applicants’ requested EC financial contribution in Main-listed proposals, the thematic with the highest requested amount by far are those related to ICTs equalling around €10M and a success rate of 10%; and Research Potential equalling around €10M and a success rate of 3%.
Source: eCORDA, 8 June 2010
Considering the total number of main-listed proposals, the main partners of Turkey are Germany, the United Kingdom, and France. When looking at success rates of Turkey’s participation with major partners, the highest rates are those resulting from partnerships with Austria, Portugal, the Netherlands, and France (all with a success rate of 24%).

Participation of South-East European countries in the competitive funding programmes for research in the European Commission 33
Source: eCORDA, 8 June 2010

Technopolis Belgium Avenue de Tervuren 12 B-1040 Brussels Belgium T Tel +32 2 737 74 40 F +32 2 727 74 49 E [email protected] www.technopolis-group.com