
CHILEAN KIWI COMMITTEE [email protected] CHILEAN KIWI AND INTERNATIONAL MARKETS.

Center for Financial Studies an der Johann Wolfgang Goethe-Universität § Taunusanlage 6 § D-60329 Frankfurt am Main
Tel: (+49)069/242941-0 § Fax: (+49)069/242941-77 § E-Mail: [email protected] § Internet: http://www.ifk-cfs.de
No. 2000/13
(Partial) Privatization Social Security: The Chilean Model – A Lesson to Follow?
Roland Eisen

No. 2000/13
(Partial) Privatization Social Security: The Chilean Model – A Lesson to
Follow?
Roland Eisen

CFS Working Paper No. 2000/13
(Partial) Privatization Social Security: The Chilean Model – A Lesson to Follow ?
Roland Eisen*
September 2000
Abstract: This paper examines thoroughly the Chilean Pension Reform, giving first an overview of the mandatory saving plan, the relevant institutions, and the rules for transition from the old to the new system. The main part of the paper contains a critical evaluation of the reform, in particular the macroeconomic performance with respect to capital formation and growth, and the effects on the savings rate as well as on the rates of return and labor market are di scussed. Furthermore, the development of capital markets is reviewed. A short critique is presented with respect to intergenerational distribution and risk sharing as well as with respect to the social consequences.
Keywords: Privatization, Social Securit y reform, Chile
JEL classification: H 55
* This paper is the result of a CFS -Institut fuer Kapitalmarktforschung sponsored research project. A
preliminary version was presented at the meeting of the committee of Social Policy of the Verein fuer Socialpolitik, May 1999 and at the 55th Congress of IIPF, 23 -26 August 1999, in Moskow. For able research assistance I thank Martin Skala and Dimitrios Gotsis, and Anke Russ for typing several versions of the paper. Address of the author: Prof. Dr. Roland Eisen, F aculty of Economics, Chair of Economic and Labour Market Policy, Goethe -University, D -60054 Frankfurt am Main. E-mail: [email protected] -frankfurt.de.

1
Summary
There is an ongoing debate about economic problems, macroeconomic and social effects of
different forms to finance pension insurance: pay -as-you-go vs. funded systems, state vs.
private. The background of the paper is a report of the World Bank (1 994) about "Averting
the Old Age Crisis" where a three -pillar system is propagated. Furthermore, because of the
"double aging" effects, the traditional pension systems face increasing financial problems.
Privatization combined with funded individual pensions may have several positive
advantages: a more efficient labor market, higher savings and via extra investment faster
growth, and faster development of financial markets, combined with financial self -
determination of the citizens.
In Chapter II, the conc ept of privatization and different possibilities of privatization as well as
the reasons for privatizing Social Security are summarized. In Chapter III the Social Insurance
reform of Chile is reviewed shortly: Starting with an overview of the old Social Se curity
system and its problems, the mandatory saving plan and the Administradoras de Fondos de
Pensiones (AFPs) are presented. Then the role of the transition rules is described, in particular
the bonos de reconocimiento and the indexed bonds. This chapter closes with a preliminary
statement about the performance of the new system: the rates of return, the costs as well as the
role of the state's guarantee of a minimum rate of return and a minimum pension.
The main part (Chapter IV) contains the critical e valuation of the reform (while recognizing
that the model is still in its "infancy", and some of the early mistakes were amended in later
stages). This is done in three steps: In the first step (Chapter IV.2), though no econometric
model is available, the macroeconomic performance of the Chilean economy is reviewed and
compared with her neighbours', the Western Hemisphere, and the World, with respect to
growth rates and capital formation. Then the effects on the savings rate, on the rates of return
as well as on the labor market are presented. In the second step (Chapter IV.3), a finance -
theoretic perspective is taken and the development of capital markets is reviewed using
different indicators. In the third step (Chapter V) a short critique is presented wit h respect to
intergenerational redistribution and risk sharing as well as with respect to the social
consequences of the Chilean reform, taking into account two alternative targets of social
policy: to avoid poverty in old age and to maintain the standard of living. Chapter VI contains
a short summary and some conclusions.

2
Contents
Summary/Zusammenfassung p. 1
Contents p. 2
I. Introduction p. 3
II. Possible Forms and Ways and Some Reasons for Privatization of Social Security
II. 1. Privatization: Forms and Ways p. 4
II.2. Some Reasons for Privatization p. 6
III. The Chilean Pension Reform
III. 1. First Steps away from the Old System p. 8
III. 2. The Mandatory Scheme p. 10
III. 3. Transition Arrangements p. 11
III. 4. A Preliminary Statement about Performance p. 13
IV. Critical Evaluation of the Chilean Pension Reform
IV. 1. Preliminary Notes p. 19
IV. 2. Macroeconomic Evaluation
IV. 2. 1. Effects on Economic Growth and Capital Formation p. 21
IV. 2. 2. Effects on National Savings Rate p. 23
IV. 2. 3. Comparison of Rates of Return p. 26
IV. 2. 4. Effects on Labor Market Development p. 28
IV. 3. Finance-Theoretic Perspective and Development of Capital Markets
IV. 3. 1. A General Finance-theoretic Perspective p. 30
IV. 3. 2. Development of the Chilean Capital Markets p. 31
V. Intergenerational Redistribution and Risk Sharing p. 33
VI. Summary and Conclusions p. 37
VII. References p. 41
VIII. Further Litera ture p. 45
Appendix A: A Short Review of the Development of the AFP Industry p. 48
Appendix B: The Rates of Return of the AFPs p. 53 Appendix C: An Overlapping-Generations-Model with p. 57
Different Pension Systems (and Uncerta inty)

3
I. Introduction
Pushed by the World Bank's report on "Averting the Old Age Crisis" (World Bank 1994) and
the example of Chile, the discussion about the multi - or three -pillar-system of old age security
is flourishing around the world recently.
While Chile went first, in 1981, with mandatory individual retirement accounts administered
by competing fund-management companies, many other countries in the region followed with
reforms of their own − Peru in 1993, Columbia in 1994, Argentina in 1994, Uruguay in 1996
and Mexico in 1997 (see Mitchell/Barreto, 1997, and Queisser, 1998 for overviews of other
Latin American nations' pension reforms). Changes in Social Security are on the agendas of
many countries, and since there are differences in financing so cial security, in the state of the
economy, in the political details etc., topics of discussions vary across countries 1.
Partial privatization combined with funded individual pensions may have several positive
advantages: a more efficient labor market, b ecause the distorting social -security tax levied
only on labor income is replaced; higher savings and therefore extra investment and faster
growth; as well as faster development of financial markets which in turn may foster economic
growth.
As mentioned, s everal Latin American countries have shown that the reforms can be
politically feasible and successful, in the following we shall discuss whether those reforms are
also economically successful. As an example the Chilean reform will be taken because it
started in 1981, so there are at least almost twenty years of history. Nevertheless the critical
evaluation of the reform will recognize that the model is still in its "infancy", and that some
early mistakes were amended in later stages.
On the other hand the consequences in relation to social policy or the social dimension of
these reforms has to be considered. To assess these consequences one needs a measuring rod
which can be either of the following goals of old age income security: To avoid or to alleviate
poverty in old age or to secure the standard of living in retirement 2. While in a public PAYG
social security system different forms of income redistribution, are incorporated, in a
(compulsory) private system these choices are much more restricted (and on e must rely
almost entirely on the redistributive power of the tax system).
1 See for an overview Gern (1998). 2 Cf. e.g. Hauser (1999).

4
However, all these questions will be discussed in the following not primarily within a
theoretical model but with the help of an empirical example, namely the Chilean economic
performance.
The discussion, therefore, will follow these lines: First of all, in section II the different steps
to privatization as well as the reasons to privatize will be summarized. In the third section a
"curmudgeon's guide" to the Chilean social security reform is presented. In the section four
then follows a discussion of the macroecononomic performance of the Chilean economy in
particular with respect to growth rates and capital formation, savings, rates of return, and the
labor market. In the fifth sec tion the performance of the capital markets is evaluated using
different indicators relating to financial development. The social consequences, in particular
with respect to income distribution and intergenerational risk sharing, are discussed. The last
section contains a short summary and some conclusion whether the "Chilean model" is only a
"historic stroke of good luck" or a model case to be followed not only by "transformation
countries" but also by industrialized countries.
II. Possible Forms and Ways and Some Reasons for Privatization of Social
Security
II.1 Privatization: Forms and Ways
"Privatization of retirement income means often the replacement of government -managed
social security by plans with private sector management and private sector inves tment"
(Turner and Rajnes, 1998, p. 283).
However, even a mandatory government -managed scheme can rely on capital accumulation,
originally the German as well as the (old) Chilean social security system were fully -funded
systems but changed to pay -as-you-go systems in the fifties! Furthermore, government -
managed schemes may have individual capital accounts. Moreover, government intervention
can take many forms: taxes, transfers, guarantees, regulation, tax incentives etc.
"Privatization" is a relatively ambiguous concept, nevertheless there seems to be consensus
that the substitution of one function of the State (or the government) by the private sector is
part of privatization. Most retirement income schemes maintain however some government
involvement, sometimes even extensively. The Chilean scheme e.g. incorporates a number of
State guarantees and tight regulations and therefore is not a purely private system.
5
Furthermore, the notion of privatization is sometimes extended to include supplementary
occupational or private pension plans, mandatory plans that "replace benefits that would have
been provided by government" (Turner and Rajnes, 1998, p. 283).
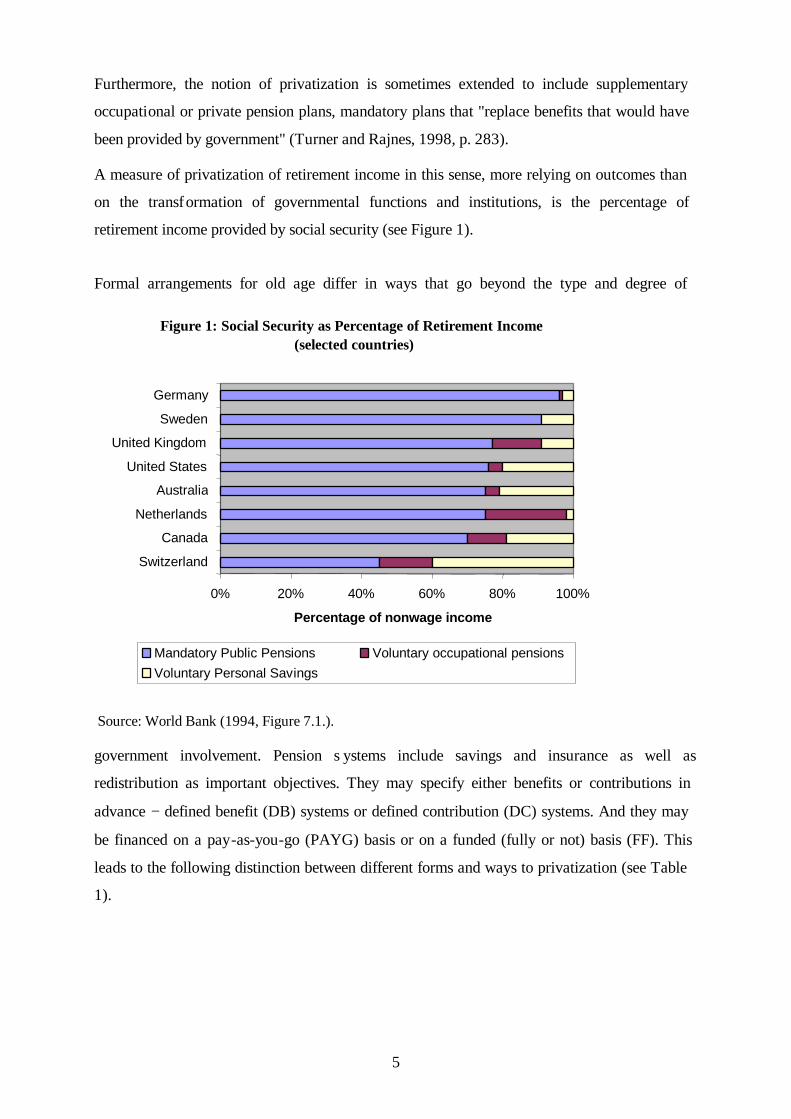
A measure of privatization of retirement income in this sense, more relying on outcomes than
on the transf ormation of governmental functions and institutions, is the percentage of
retirement income provided by social security (see Figure 1).
Formal arrangements for old age differ in ways that go beyond the type and degree of
government involvement. Pension s ystems include savings and insurance as well as
redistribution as important objectives. They may specify either benefits or contributions in
advance − defined benefit (DB) systems or defined contribution (DC) systems. And they may
be financed on a pay-as-you-go (PAYG) basis or on a funded (fully or not) basis (FF). This
leads to the following distinction between different forms and ways to privatization (see Table
1).
Source: World Bank (1994, Figure 7.1.).
Figure 1: Social Security as Percentage of Retirement Income(selected countries)
0% 20% 40% 60% 80% 100%
Switzerland
Canada
Netherlands
Australia
United States
United Kingdom
Sweden
Germany
Percentage of nonwage income
Mandatory Public Pensions Voluntary occupational pensionsVoluntary Personal Savings

6
Table 1: Forms and Ways to Privatization
Country Form of Privatization Defined
contribution Defined benefit Combined Hybrid Form
Fully Privatized + Mandatory
Bolivia Chile
Mexico
Fully Privatized and Voluntary
Columbia Peru
Partial Mandatory Privatization
Denmark Australia Finland
Netherlands Sweden
Switzerland France
Voluntary Partial Privatization (or Opting Out)
Argentina Japan United Kingdom
Source: Adapted from Turner and Rajnes (1998, Table 4.2.1).
The management of investments in a funded scheme may be the most important aspect of
social security privatization, it is how ever only one of several functions that can be privatized.
To see how different functions can be privatized, the Thrift Savings Plan for federal
government employees in the United States is an illuminating example: The individual worker
can choose within l imits the amount he/she wants to contribute and the assets in which the
contributions are invested. The government contracts with private investment management
companies to handle the investment. The government organizes the administration and the
book keeping, the choice of investment managers, and the menue of possible investments.
The workers select the investments from this menue. A similar interesting example along
these lines is the Central Provident Fund of Singapore.
II.2. Some Reasons for Privatization3
In the literature several reasons for privatization are put forward. As mentioned above, in
economics mainly efficiency arguments are at the focal point of all considerations. Besides
this, however, also very pragmatic reasons were considered. Neve rtheless, considerable
controversy exists over many of the reasons, therefore, some will be discussed later while
evaluating the Chilean performance.
1. In many countries the contributions to the current social security systems are not sufficient
to cover exp enditures, therefore, large subsidies (or transfers) by the government are
3 Cf. also Turner and Rajnes (1998)

7
necessary. Privatization tends to reduce the need to subsidize the system, therefore reduces
the government budget and the deficit.
2. Many countries face problems in managing defined benefit systems and think that defined
contribution systems could be easier to manage − both financially and politically.
Competition in privatized services will be more efficient and lead to better quality (than
the monopolistic management by government).
3. Some of the PAYG systems distribute their benefits very inequitably. Since most Latin
American countries rely or relied heavily on indirect taxation to subsidize social security
benefits, the poor contribute disproportionately to services they probably wi ll never
receive. Another aspect of equity is equity across generations in contributions paid and
benefits received (generational accounting, in particular see Figure 13).
4. Many economists conjecture that privatization of social security (a) will tend to ra ise
domestic savings, (b) will reduce economic distortions in labor markets presumably
caused by traditional financing methods, and (c) will tend to reduce contribution evasion.
5. Demographic changes will raise the dependency ratio (the ratio of beneficiari es NB to
covered or contributing workers N C) making PAYG systems cet.par. more expensive.
Given the balance BC NBWNb ⋅=⋅⋅ , it follows easily that WB
NN
bC
B ⋅= . This means: the
contribution rate (b) is given by the dependency ratio (N B/NC) times the income -
replacement ratio (B/W; with B = benefits, W =Wage income). Furthermore, the decline
of the population growth rate and the growth rate of real wages have reduced the implicit
rate of return of social security contributions, making the market rates of return (on
capital) more attractive (cf. Figure 9).
6. Some people favour privatization as a means to increase the choice set of the individual,
and also to move to greater individual responsibility for his/her retirement income.
7. Privatization is favoured as a way to develop the private enterprise sector (financial
services providers, insurance companies) as well as a way to develop capital markets in
countries with poorly developed capital markets. However, the argument can be put
differently: privatization is feasible in countries where capital markets have developed up
to the point where they could provide adequate investment opportunities.
8. In some countries privatization is favoured because capital markets show a remarkable
strength in rec ent years. On the one hand, the average real rate of return of stocks in the
United States increased from an average of 6 to 7 percent per year to over 11 percent in

8
the past decade. On the other hand, negative rates of return became less probable and the
volatility declined. Hence, privatization seems to provide higher benefits for the same
level of contributions.
9. Privatizing social security may be used as a vehicle in privatization of government assets.
The assets of state -owned enterprises can be sold t o the privatized social security system!
10. In general, the public seems to mistrust the financial operations of the government − in
particular as a financial or asset manager.
As mentioned in the World Bank report (World Bank, 1994, p. 255), privatiza tion seems to be
difficult and more costly, the higher are the "unfunded liabilities" (the implicit social security
debt) of the existing systems. Furthermore, privatization should not be confounded with
capital formation or fully-funded systems (see Table 1), because also privatized systems can
rely on PAYG financing (see e.g. France) 4. And last but not least, some (or most?) of the
advantages expected from privatization may equally well be gained from reforms within the
existing social security systems.
III. The Chilean Pension Reform
III.1 First Steps away from the Old System
The Chilean pension reform was part of a far reaching social program of modernization, re -
orienting the social and economic order towards the neo -liberal model of Chicago. Besides an
extreme de -regulation of labor relations in 1978/9 and a wide-reaching privatization of the
health sector 5, the state drew back widely and transferred also other functions to the private
sector 6.
The old Chilean social security system was founded in 1924 as one of the first comprehensive
social insurance systems outside Europe. With the creation of the Private Employees Social
Security Fund (EMPART, i.e., Caja de Prevision de Empleados Particulares) and the State
Workers and Journalists National Social Security Fund (CANAEMPU, i.e. Caja Nacional de
Empleados Publicos y Periodistas) in 1925, the system expanded rapidly, reaching about 75
4 Geanakoplos/Mitchell/Zeldes (1998, p. 140) present a tripartite decomposition, the third component is diversification which means "inverting funds (either from the personel accounts or from Social Security trust funds) into a broad range of assets" (139). 5 Cf. Sapelli (1999). 6 On the global Chilean reforms see Bosworth et al. (1994) and Edwards and Edwards (1991).
9
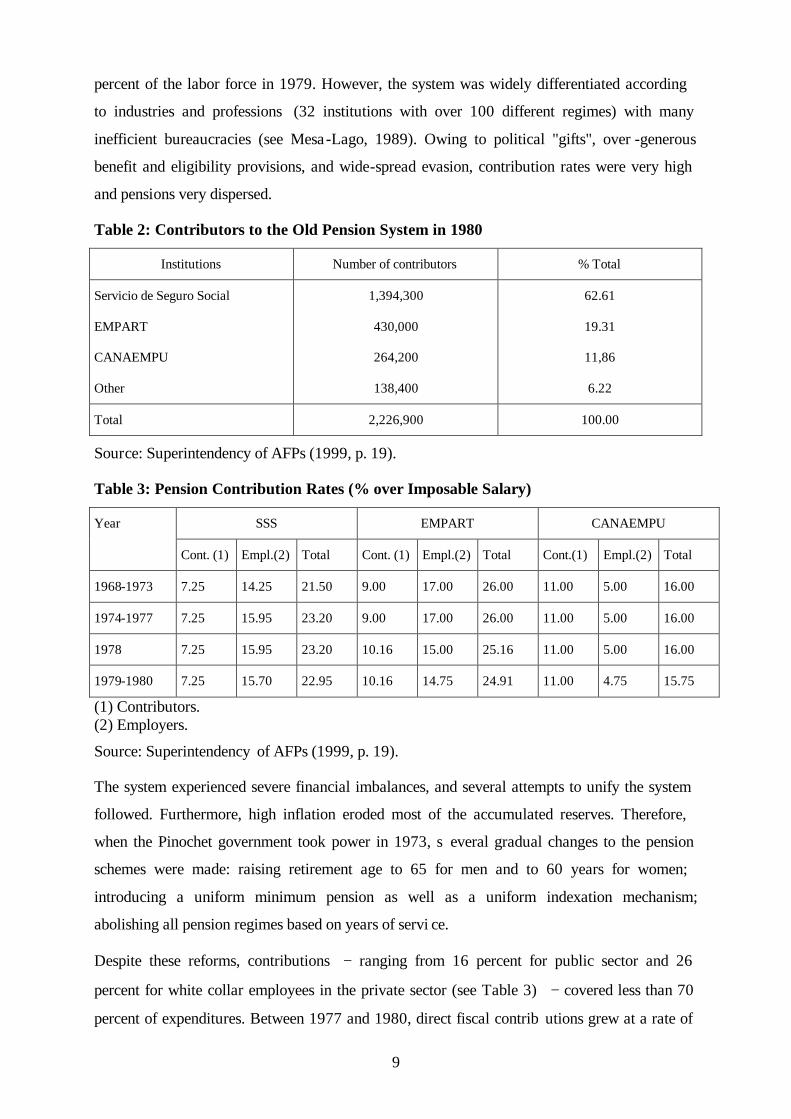
percent of the labor force in 1979. However, the system was widely differentiated according
to industries and professions (32 institutions with over 100 different regimes) with many
inefficient bureaucracies (see Mesa-Lago, 1989). Owing to political "gifts", over -generous
benefit and eligibility provisions, and wide-spread evasion, contribution rates were very high
and pensions very dispersed.
Table 2: Contributors to the Old Pension System in 1980
Institutions Number of contributors % Total
Servicio de Seguro Social
EMPART
CANAEMPU
Other
1,394,300
430,000
264,200
138,400
62.61
19.31
11,86
6.22
Total 2,226,900 100.00
Source: Superintendency of AFPs (1999, p. 19).
Table 3: Pension Contribution Rates (% over Imposable Salary)
SSS EMPART CANAEMPU Year
Cont. (1) Empl.(2) Total Cont. (1) Empl.(2) Total Cont.(1) Empl.(2) Total
1968-1973 7.25 14.25 21.50 9.00 17.00 26.00 11.00 5.00 16.00
1974-1977 7.25 15.95 23.20 9.00 17.00 26.00 11.00 5.00 16.00
1978 7.25 15.95 23.20 10.16 15.00 25.16 11.00 5.00 16.00
1979-1980 7.25 15.70 22.95 10.16 14.75 24.91 11.00 4.75 15.75
(1) Contributors. (2) Employers.
Source: Superintendency of AFPs (1999, p. 19).
The system experienced severe financial imbalances, and several attempts to unify the system
followed. Furthermore, high inflation eroded most of the accumulated reserves. Therefore,
when the Pinochet government took power in 1973, s everal gradual changes to the pension
schemes were made: raising retirement age to 65 for men and to 60 years for women;
introducing a uniform minimum pension as well as a uniform indexation mechanism;
abolishing all pension regimes based on years of servi ce.
Despite these reforms, contributions − ranging from 16 percent for public sector and 26
percent for white collar employees in the private sector (see Table 3) − covered less than 70
percent of expenditures. Between 1977 and 1980, direct fiscal contrib utions grew at a rate of

10
8.5 percent per year, reaching 2.7 percent of GDP in 1980. To prepare for the more
fundamental reform in 1981, the Chilean government took steps during 1974 -1979 to build up
a remarkable budget surplus (see World Bank, 1994, p. 268 ).
III. 2. The Mandatory Scheme
In 1981, a fully-funded defined-contribution scheme with individual pension accounts was
introduced (see for a short description Queisser (1995) and Edwards (1996)).
The centerpieces of the reform are a privatized compulsa ry savings plan together with a
market for indexed annuities to convert capital accounts into retirement income. The system is
administered by private pension funds, the Administradoras de Fondos de Pensiones (AFP),
which compete for members. The new syste m allows the workers to choose the AFP they
want to affiliate with, and to transfer their accumulated funds among them (twice a year).
Membership is mandatory for new entrants into the labor force and optional for self -
employed. The new system emphasizes u niformity of contributions and its structure of
benefits, therefore, every private or public -sector employee contributes 10 percent of his
monthly income (subject to a ceiling of about US -$ 1,500 monthly) and on average 3 percent
for invalidity and survivors' insurance. This insurance is bought on a group basis by the AFP
with private insurance companies. Contributions and benefits are exempt from the income tax;
workers can make additional voluntary contributions (in particular to a so -called Voluntary
Saving Account (VSA)) which are subject to taxation only when they are withdrawn.
Furthermore, these funds are not taken into consideration when determining the State
minimum pension guarantee.
Every AFP manages only one fund, and the returns are credited to the personal accounts
minus the fees charged by the AFP for its services.
The employers pay no contribution. The contribution of employers within the old system was
redeemed by a once -and-for-all increase in gross wages. The contribution rate of employers
within the old system were on average 16 percent (see Table 3), and the increase in income
was 17 percent, i.e. 10 percent for old age security and 7 percent for health insurance 7.
Upon retirement (fixed by law at 65 for men and 60 years for women), member s can choose
either to purchase an annuity with a life insurance company or to negotiate a phased with -
7 The total contribution rate of employers (for p ensions, health benefits and labor accident) however ranged from 14 percent (CANAEMPU) over 25,95 percent (SSS) to 28, 71 percent (EMPART) (see Superintendency, 1999, Table I.1, p. 18)!

11
drawal of their balance with the AFP. Early retirement is possible if the balance of the
individual pension account is sufficient to provide for an annui ty at least 50 percent of the
previous wage income (subject to the above -mentioned ceiling). A minimum pension is
guaranteed by the state to all members who have contributed for at least 20 years to the new
scheme but whose balances are not sufficient to r each the minimum pension throughout the
retirement period. Therefore, the government also guarantees the minimum pension to those
individuals who, having apted for a phased withdrawal, outlive the program and exhaust their
accumulated funds. Furthermore, the state guarantees the contractual obligations of the AFPs
and insurance companies up to the minimum pension and thereafter 75 percent up to a
maximum level.
The AFPs are licensed and regulated by the AFP Superintendency. An AFP can be
established by any groups of shareholders; but they are allowed to operate or manage only one
pension fund for all its affiliates. The AFP has a minimum capital requirement (US-$
160,000) which rises, however, with the number of affiliates. There is strict regulation of the
capital stock, however, the regulation has been gradually relaxed in recent years. The Chilean
system imposes a maximum and a minimum rate of return, set in relation to the average
performance of the whole system over the last twelve months 8. The AFPs charge fixed fees
and commissions related to the covered wages for the services, in 1996 on average 3 percent
of the base salary or 10 percent of contributions! The importance of the fixed fees (on average
1.5 percent) is declining. 70 percent of total fees a re for management, 30 percent for sales and
marketing. Compared to other systems, e.g. in the U.S.A., the scheme is criticized as being
relatively expensive9. Despite high competition between the AFPs, so their number declined
from more than 20 in the mid -eighties to 8 in 1998, the operating costs remained high: Instead
of reducing commissions, the AFPs have spent more on advertising and sales agents 10.
III.3. Transition Arrangements
Most of the discussion about privatizing pensions is turning around the tr ansition
arrangements: "The costs of a transition from one system of old age security to another are
large" (World Bank, 1994, p. 255). Even in many theoretical analyzes there remains a "double
burden" at least for one generation (cf. Breyer, 1989). This b urden falls on the working
population, who has to pay the pensions of the old system and the contributions for their own
8 The minimum rate, e.g. is equal to the average of all AFPs minus 2 p ercent or 50 percent of the average real rate of return of all AFPs, depending on what is lower. 9 See Diamond (1998, pp. 54-55) for some cost calculation. 10 The number of sales agents, e.g. increased from 1.882 in 1982 to 17.448 in 1997 (see Superintenden cy, 1999, p. 226).

12
capital accounts. But, first and most important, efficiency gains can and should be used to pay
off the implicit debt behind the value of expected benefit rights of the elderly (see e.g.
Homburg and Richter, 1990, and Belan, Michel and Pestieau, 1998).
Additional debt reduction comes from the reform of the social security itself, e.g. by raising
the retirement age and by eliminating the early and special retirement regimes. "What remains
of the debt can be financed by issuing government bonds, cutting other government
expenditures, selling public assets, or raising tax rates. The methods chosen will determine
savings, growth, and the gene rational distribution of the benefits and costs of the transition"
(World Bank, 1994, pp. 266-267).
The Chilean government privatized more then 500 firms in two rounds - the first from 1974 to
1982, the second from 1985 through 1992, while between 1982 and 1984 there "was a partial
reversal in the process" when the government had to take over more than 50 banks and firms
that failed in the recession of 1981 -1982 (see Edwards, 1996, p. 3).
In Chile, upon establishment of the new AFP -system in 1981, the members of the old pension
system (who had not already retired when the new system was introduced) were given the
choice of remaining in the public system or to switch to one of the private AFP.
Current and future pensions for those members who had already ret ired or have chosen to stay
with the old system are financed from current contributions to the public scheme and from the
general treasury.
For those who moved to the new scheme, the accumulated entitlements were paid off by an
immediate issue of "recognit ion bonds" ('bonos de reconocimiento'). These recognition bonds
were supposed to equal the expected present value of the benefits these workers had thus far
earned. However, calculating the social security entitlement is difficult in developing
countries where employment records are incomplete. Therefore, the recognition bonds are
rated so as to equal the present value of a pension replacing, for a full contribution period, 80
percent of the member's average income in the 12 months prior to June 1979 (see Q ueisser,
1995, p. 27; Edwards, 1996, p. 26).
The recognition bonds were nontransferable, are adjusted to inflation and earn 4 percent real
interest, and are redeemable for lump sum payments into the workers' mandatory savings
account upon retirement (or i nvalidity or death).

13
III.4 A Preliminary Statement about Performance11
The annual deficit resulting from subsidies to current pension payments and recognition
bonds started at 0.6 percent of GDP in 1981, raised gradually to 4.8 percent in 1991 (see
World Bank 1994, Box Table 8.5, p. 268), and is now expected to decline thereafter, "as older
retirees die". The pension debt will gradually diminish until the last covered retiree dies and
the last worker with a recognition bond retires, around 2025.
The subsidy to the Pension Normalization Institute (INP), the central administration of the
still existing different old regimes (with different contribution rates and benefit levels), has
been fluctuating around 3 percent of GDP (see Superintendency 1999, Table II. 3). These costs
will, however, decline rapidly because of life expentancy in Chile. In September 1998, the old
pension system still had around 300,000 contributors (or 4 percent of the labor force) and paid
benefits to about 1 million pensioners.
The new AFP scheme consisted in the first year of 13 AFPs with 1.4 million persons − 38
percent of the labor force − enrolled. 1993 the system expanded to 25 AFPs with a total of 5
million members, corresponding to a coverage of almost 95 percent of the Chilean lab or
force. In Sept. 1998 the number of affiliates is above 5.8 millions, and after a process of
mergers and acquisitions, the number of AFPs was 10. (For a short summary of the AFP
industry's development see Appendix A.) However, the share of contributors h as been
declining steadily, from 65 percent in 1982 to less than 55 percent in 1998. These figures are
shown in Table 4 for some selected years.
Table 4: Evolution of Affiliates and Contributors (selected years)
New Pension System 1) Year
No. of Affiliates No. of Contributors
Pension Normalization In-stitute (former SS Funds) 2)
1979 - - 2,291,184
1981 1,400,000 - 731,939
1982 1,440,000 1,060,000 488,856
1985 2,283,830 1,558,194 454,409
1989 3,470,845 2,267,622
1994 5,014,444 2,879,637
1997 5,780,400 3,296,361 1) Up to Dec. each year 2) Annual Average Source: Superintendency (1999, Table II.1 and Table V.1).
11 See Superintendency of AFPs (1999).

14
Several reasons are responsible for this decline: on the one hand pensioners, who chose the
phased withdrawal of their balance, count sti ll as members but don't pay contributions, on the
other hand loss of a job or withdrawal from the labor force, and non -payment of contributions
by self-employed affiliates, who contribute on a voluntary basis.
The number of pensioners in the AFP system is still very low; in Sept. 1998 only 282 757
pensions have been processed (see Figure 2).
In 1998 the AFPs managed assets of more than US -$ 28 Billion, corresponding to 40 percent
of GDP (see for the evolution Figure 3). The investment portfolio (end of 1997) was
composed of 40 percent government bonds, 23 percent equities, 17 percent mortgages, 5
percent corporate bonds, and 15 percent other instruments (see for a comparison between
1981 and 1998, Figure 4).
Source: Superintendency of AFPs (1999, p.134).
DECEMBER 1991(112 800)
Others1,44%
Orphan-hood
26,08%
Widow-hood
18,15%
Tot. Disability13,72%
Early Retire-ment
13,89%
Old Age26,72%
SEPTEMBER 1998(282 757)
Orphan-hood
14,70%
Widow-hood
14,45%
Early Retirement
37,24%
Old Age24,62%
Others1,40%
Tot. Disability6,96%
Part. Disability0,62%

15
From the beginning of the AFP system the co mposition of the AFPs' investment was highly
regulated. In early 1985 Pension Funds were allowed to invest up to 30 percent of their
resources in corporate stock of formerly State -owned companies in the process of
privatization. The greater depth of the ca pital market following the privatization let to an
increase in investments in private corporations' stock. Another change took place in 1990,
when Pension Funds were allowed to engage in stock investments in corporations with a
concentrated ownership and i n foreign instruments. "A significant change in regulations
governing Pension Funds investments is included in the so -called Capital Market Act, which
amended investment limits and increased the number of eligible instruments"
(Superintendency, 1999, p. 140). An overview is given in Table 5.
Figure 4: Changes in AFPs Portfolios
Source: Superintendency of AFPs (1999, p. 220).
PENSION FUNDS PORTFOLIO - 1981 (DEC.)
Mortgage Credit9,40%
Corporate Bonds0,60% Finan. Inst.
Dep. + Prom. Notes
61,90%
State-Issued28,10%
PENSION FUNDS PORTFOLIO - 1998 (SEP.)
Mortgage Credit
16,41%
Term deposits + Derivates14,08%
Stocks17,20%
Bonds4,56%
Foreign5,25%
State-Issued42,35%
Pensions Funds Value in Sept . 98 -U S $ . Data up to September 1998. Source: Superintendency (1999, p. 21 7).
Figure 3: Pension Funds Evolution
0 5000
10000 15000 20000 25000 30000 35000
1981
1982
1983
1984
1985
1986
1987
1988
1989
1990
1991
1992
1993
1994
1995
1996
1997
1998
Years
US
$-M
illio
ns
0 5 10 15 20 25 30 35 40 45
Per
cent
age
Pens ion Funds Va lue Fund/GDP

16
Table 5: Limits per Instrument before and after the Capital Market Amendment Act1) Before Amendment After Amendment
Range Range
Instrument Lower Limit Upper Limit Lower Limit Upper Limit
1. State-Issued 0 % 45 % 35 % 50 % 2. Financial Inst. Deposits and
Bonds 3. Titles Guaranteed by Financial
Institutions
40 % if at least 1/4 has expiry date beyond one year. 30 % if expiry term is ≤ one year
100 %
30 %
50%
4. Credit Bills issued by Financial Institutions
40 % 100 % 35 % 50 %
5. Bonds from Public and Private Companies
- -
6. Convertible Bonds from Public and Private Companies
30 %
100 %
10 %
30 %
15 %
50 %
7a. Stocks from Open Corporations Subject to Chapter XII of DL 3.500
10 %
30 %
7b. Stocks from Open Corporations not subject to Chapter XII of DL 3.500
10 %
20 % 30 %
40 %
30 %
40 %
8. Real Estate Corporate Stock 10 % 20 % 30 % 40 % - - 9. Real Estate Closed Mutual 10 % 10 % 20 % 20% -
10 % -
20 %
10. Shares of Corporate Development Closed Mutual Funds + the Amount of inputs committed via promissory con -tracts of subscription and pay -ment of C.D.C.M.F. accounts
0 %
5 %
2 %
5 %
11. Shares in Personalty Closed Mutual Funds
10 %
10 %
20 %
20 %
5 % 10 %
12. Shares in Securitized-Credit Closed Mutual Funds
Non-eligible instruments 5 % 10 %
13. Negotiable Instruments repre -senting Bills of Exchange or Promissory Notes with Expiry term ≤ one year.
10 %
100 %
10 %
20 %
10 % Fixed-Income
6 % Fixed- Income
12 % Fixed- Income
14. Credit titles, securities and ne -gotiable Instruments issued or guaranteed by Foreign States, Foreign Banks and Central Banks, and Shares, Stocks and Bonds issued by foreign compa -nies, open and closed mutual funds; and hedging operations of the instruments noted in this number.
0 %
Varia-ble Income Non-eligible
10 %
3 % Varia-ble Income
6 %
6 % Varia-ble Income
12 %
15. Hedging Instruments -Domestic Non-eligible instruments 5 % 15 % 16. Pension Funds Shares 20 % 100 % Non-eligible instruments 17. Others authorized by the Central
Bank, whose issuers are surveil -led by the Superintendency of Securities and Insurances or by the Superintendency of Banks and Financial Institutions.
Non-eligible instruments
1 %
5 %
1) Limits mentioned in the 'After Amendment' column may be found in the so -called Capital Market Act of 1994. Source: Superintendency (1999, Table V. 6 (resp. Table III.2)).

17
At the end of 1994, th e maximum limit for investment abroad was 10 percent of total assets (it
is now 20 percent), but AFPs invested less than 1 percent in these assets. Only recently, AFPs
raised their share of foreign assets to 5 percent.
Private capital markets have flourished since 1981: When the new contributions to the AFPs
substituted for the former "wage tax", then a new market for financial assets (inclusive
government bonds) was created. Even when private savings decline in proportion to the new
compulsory savings, the composition of portfolios is different: Shares and bonds subsitute for
bank credits and deposits. Even 1994 the AFPs kept 55 percent of governments bonds, 62
percent of outstanding mortgage credits, 59 percent of industry bonds, and 11 percent of all
shares.
Since the introduction of the system, the AFPs have achieved an annual real rate of return of
15.9 percent (from 1982 through 1994) or of 11 percent (up to 1998), fluctuating between
44.5 percent in 1983 and - 2.7 percent in 1995 with a standard devia tion of 11.63 (resp.
12.06). This has been partly due to the fact that government subsidies to the financial system
shielded the pension funds during the 1983 -1984 financial crash, the pension funds, however,
reaped all the benefits of the recovery startin g in the late eighties. The real annual rate of
return of 1998 is expected to be negative. For a more detailed review of the rates of return of
different AFPs see Appendix B.
The Superintendency (see Superintendency, 1999, pp. 151 -152) calculates an annual real (UF-
deflated)12 share yield, reflecting the profitability of the investments by the AFPs. It is
identical to all affiliates of an AFP and independent of the accrued balance and the
commissions collected. "This yield, measured in annual terms, is the p ercentage variation in
the average value of the share [the value of which increases or decreases depending on the
economic, or market, value of investments] in any given month, as compared with the average
monthly value of that share in the same month of t he previons year" (ibid, 151 and note 61).
This yield peaked in 1991, reaching 29.7 percent, with a trough of merely - 2.5 percent in
1995. For 1998 the value end Sept. is - 9.6 (see Figure 5). However, there is an almost 5 -
percentage -points difference in the after-tax rate of return between low wage earner and the
top earner, as reported by Diamond (1997, p. 288).
12 UF (= unidad de fomento), Chile's indexed unit of account.

18
Source : Superintendency (1999, p.152) for 1998: http://www.safp.cl/
The "money stream" into the AFPs and the relatively favourable rates of return in the 1980s
are certainly determined endogenously. The short time period since the implementation in
1981 reflects the "immature character" of the system whose growth rates are high.
Furthermore, real rates of interest were decreasing, leading to s udden increases in some share
prices and, therefore, high capital gains. Thus, the question remains, how such a system will
perform when it is "mature"! Also the demographic changes so far were advantageous.
However, the "normal" development of interest r ates shows high rates (see Tables 6 and
Figure 6). Considering only the interest rate of deposites in 1997 (12 percent), subtracting the
inflation rate (6 percent in 1997), yields a real interest rate of 6 percent. Comparing this figure
with the rate of re turn of the AFPs of 4 percent in the same year, then the "gloriole"
disappears. Furthermore, the high real returns of the new Chilean AFP system in 1981
through 1990 is not exceptional: It reflects only similar developments in other securities
markets around the world.
Source: International Financial Statistics Yearbook (IMF) (1998, p. 109).
Figure 5: Real Annual UF-Deflated Share Yield
-0,050
0,050,1
0,150,2
0,250,3
0,35
1981
1982
1983
1984
1985
1986
1987
1988
1989
1990
1991
1992
1993
1994
1995
1996
1997
1998
Years
Rea
l Ann
ual Y
ield
Real Annual Yield Average Yield
Table/Figure 6: Interest Rates in Chile -- Deposit Rate/Lending Rate in % p.a.
Deposit Rate Lending Rate1980 37,72 47,141981 40,9 52,021982 48,68 63,861983 28,01 42,821984 27,63 38,331985 31,97 40,811986 18,99 26,271987 25,22 32,81988 15,11 21,171989 27,72 35,921990 40,27 48,831991 22,32 28,551992 18,26 23,921993 18,24 24,31994 15,08 20,341995 13,73 18,161996 13,46 17,371997 12,02 15,67
Interest Rates in Chile
0
10
20
30
40
50
60
70
1980
1981
1982
1983
1984
1985
1986
1987
1988
1989
1990
1991
1992
1993
1994
1995
1996
1997
Year
% p
.a.
Deposit RateLending Rate

19
IV. Critical Evaluation of the Chilean Pension Reform
IV. 1 Preliminary Notes
In the following, my critical remarks will be related to two sets of key macroeconomic
questions13. First, the welfare effects: How does privatization affect the relation between
market interest rates, capital formation and economic growth? In answering this question the
demographic changes have to be taken into account, because there are diffe rent effects caused
alone by a reduction in population growth.
In simple models the "Aaron proposal" (cf. Aaron, 1966) holds: A PAYG system is "cheaper"
(i.e. in a stationary equilibrium the contribution rate necessary for a given benefit level is
lower) than a fully-funded scheme, if the interest rate is lower than the natural growth rate
(defined as growth rate of the population plus productivity growth) or the growth rate of
wages. This point has sometimes been discussed with reference to "dynamic ineffi ciency",
where individuals are so eager to save that market rates of return fall below the population
plus wage growth rate. Therefore, except under practically irrelevant conditions (cf. Abel et
al., 1989), the implicit "return" of social security contrib ution is below comparable market
rates of return.
In an ongoing social security system, the burden borne by the current generation depends
upon the distance between the market rate of return and the population plus productivity
growth rates. And it is not surprising that social security has been cast more and more under
attack as population growth and wage or productivity growth have declined. But, is this not a
historic "windfall gain"? Dynamic economies with relatively high government indebtedness
(as a demand on the capital market) lead to relatively high average rates of return. However,
the widespread attempts in reforming public budgets (i.e. the reduction of new indebtedness
below the "3 percent line" of GDP) in combination with a declining population may well lead
to declining real interest rates. However, the conversion of the "implicit social security debt"
can compensate for this shortfall and contribute to the flourishing of (world -wide) capital
markets.
The second set of questions raised here, re lates to the distributional and risk -sharing question:
How does a certain policy proposal affect the expected cash flows between different
generations and the government, how are the macroeconomic risks allocated across
13 That does not mean, that microeconomic questions are not important for Social Security reforms (see e.g. Mitchell and Zeldes (1996)), they are only beyond the scope of this paper.

20
generations, and how does the govern ment affect the sharing of such risks (cf. Bohn, 1997)?
These questions are only briefly commented on in the following chapter V, mostly because
there is no empirical evidence at hand.
To answer the first set of questions, a first -rate solution here would be to develop a
macroeconomic model of an open economy in which it is possible to explicitly incorporate
the transition from a social security -defined benefit (PAYG-DB) system to a fully-funded,
defined-contribution (FF-DC) scheme. On this basis the main e ffects of the reform could be
formulated: First, the reform affects positively national savings and capital accumulation, and
hence contributes to economic growth. Second, the reform enhances and accelerates financial
market developments and thus the effic iency allocation. Third, the reform reduces labor
market distortions, because a closer link between contributions and benefits is introduced, and
thus may result in higher labor market participation. In the next step, this model should then
be tested econo metrically using data of Chile before and after the social security reform. This
task, however, seems impossible, at least for me (but see Appendix C for a simple
overlapping-generations model). In the following the most important variables will be
identified, and then a non -structural approach is chosen: Instead of testing a particular theory
(or model) to explain the macroeconomic relationship, a comprehensive statistical picture will
be given. This "method of inspection" is less rigorous than desirable a nd mostly relies on
"proof by assurance". Nevertheless, there are important results.
Furthermore, there exists a more basic problem. As mentioned above, the social security
reform was part of a "landmark reform" starting in the mid - 1970s. These structura l reforms
and the stabilization program – coupled with a severe shock in the terms of trade (e.g. higher
oil prices and a collapse of copper prices) – "led to a harsh recession ... followed by several
years of strong economic recovery... The euphoria came to an abrupt end in 1981, when the
economy again collapsed ... The resulting recession was among the most severe in all Latin
America: unemployment, including workers in special government -subsidized employment
programs, rose to 30 percent of the labor for ce in 1983 ..."(Bosworth, Dornbusch, Labau,
1994, pp. 1-2). However, since 1983 Chile has achieved a sustained strong economic
expansion: unemployment has declined; inflation, while still high, is below the rates that
existed in the 70s and below the rates in other Latein America countries. "To a great extent,
the growth of the Chilean economy during the 1980s should be viewed as a recovery from an
extreme depression, fueled by high levels of surplus labor" (as Marfan/Bosworth, 1994, p.
165 remark). Therefore, it seems impossible to attribute or to credit the social security reforms
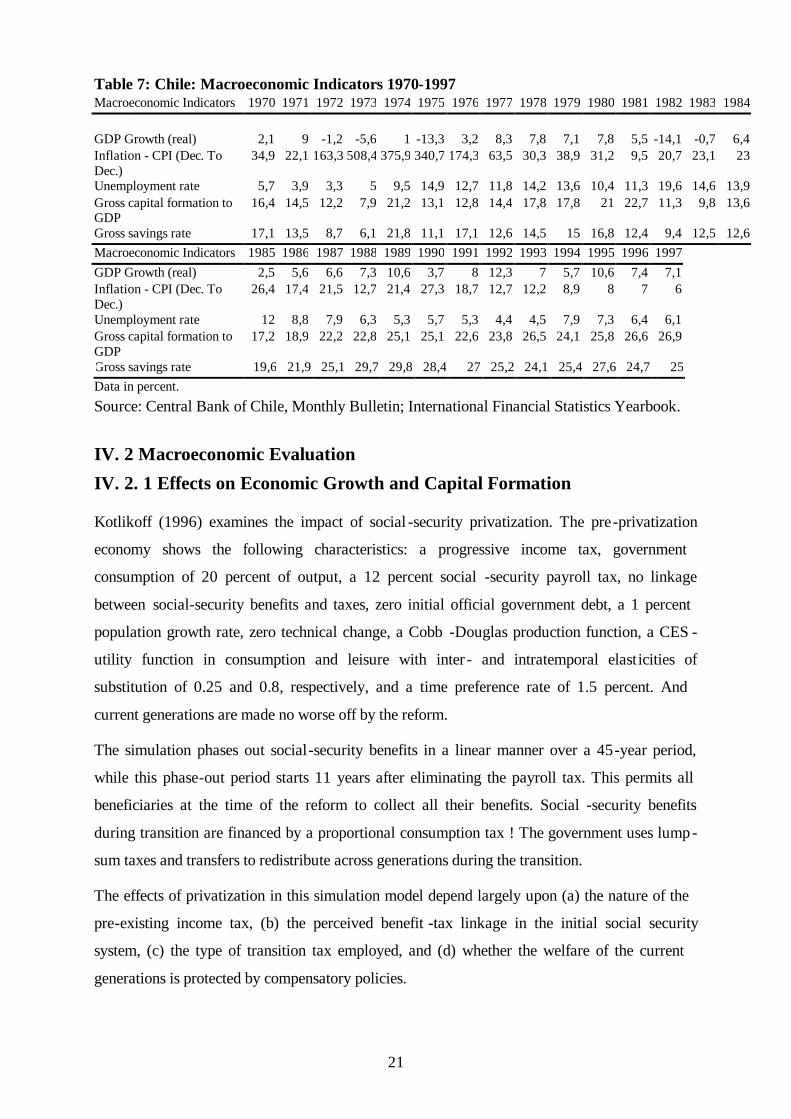
with this development (see Table 7 for an overview of some macroeconomic indicators).
21
Table 7: Chile: Macroeconomic Indicators 1970-1997 Macroeconomic Indicators 1970 1971 1972 1973 1974 1975 1976 1977 1978 1979 1980 1981 1982 1983 1984
GDP Growth (real) 2,1 9 -1,2 -5,6 1 -13,3 3,2 8,3 7,8 7,1 7,8 5,5 -14,1 -0,7 6,4 Inflation - CPI (Dec. To Dec.)
34,9 22,1 163,3 508,4 375,9 340,7 174,3 63,5 30,3 38,9 31,2 9,5 20,7 23,1 23
Unemployment rate 5,7 3,9 3,3 5 9,5 14,9 12,7 11,8 14,2 13,6 10,4 11,3 19,6 14,6 13,9 Gross capital formation to GDP
16,4 14,5 12,2 7,9 21,2 13,1 12,8 14,4 17,8 17,8 21 22,7 11,3 9,8 13,6
Gross savings rate 17,1 13,5 8,7 6,1 21,8 11,1 17,1 12,6 14,5 15 16,8 12,4 9,4 12,5 12,6 Macroeconomic Indicators 1985 1986 1987 1988 1989 1990 1991 1992 1993 1994 1995 1996 1997 GDP Growth (real) 2,5 5,6 6,6 7,3 10,6 3,7 8 12,3 7 5,7 10,6 7,4 7,1 Inflation - CPI (Dec. To Dec.)
26,4 17,4 21,5 12,7 21,4 27,3 18,7 12,7 12,2 8,9 8 7 6
Unemployment rate 12 8,8 7,9 6,3 5,3 5,7 5,3 4,4 4,5 7,9 7,3 6,4 6,1
Gross capital formation to GDP
17,2 18,9 22,2 22,8 25,1 25,1 22,6 23,8 26,5 24,1 25,8 26,6 26,9
Gross savings rate 19,6 21,9 25,1 29,7 29,8 28,4 27 25,2 24,1 25,4 27,6 24,7 25
Data in percent. Source: Central Bank of Chile, Monthly Bulletin; International Financial Statistics Yearbook.
IV. 2 Macroeconomic Evaluation IV. 2. 1 Effects on Economic Growth and Capital Formation
Kotlikoff (1996) examines the impact of social -security privatization. The pre -privatization
economy shows the following characteristics: a progressive income tax, government
consumption of 20 percent of output, a 12 percent social -security payroll tax, no linkage
between social-security benefits and taxes, zero initial official government debt, a 1 percent
population growth rate, zero technical change, a Cobb -Douglas production function, a CES -
utility function in consumption and leisure with inter - and intratemporal elast icities of
substitution of 0.25 and 0.8, respectively, and a time preference rate of 1.5 percent. And
current generations are made no worse off by the reform.
The simulation phases out social-security benefits in a linear manner over a 45-year period,
while this phase-out period starts 11 years after eliminating the payroll tax. This permits all
beneficiaries at the time of the reform to collect all their benefits. Social -security benefits
during transition are financed by a proportional consumption tax ! The government uses lump -
sum taxes and transfers to redistribute across generations during the transition.
The effects of privatization in this simulation model depend largely upon (a) the nature of the
pre-existing income tax, (b) the perceived benefit -tax linkage in the initial social security
system, (c) the type of transition tax employed, and (d) whether the welfare of the current
generations is protected by compensatory policies.

22
The upper part of Figure 7 shows that "privatization of social -security can generate substantial
long-run increases in output, capital stock, and real wages despite the fact that the initial
elderly are compensated for their higher fiscal burden arising from the consumption tax"
(Kotlikoff, 1996, p. 370). The capital stock would increase by 6.5 percent after 10 years, 14
percent after 25 years, and 21 percent after 50 years.
The lower part of Figure 7 shows the efficiency gain equivalent to a 4 percent increase in the
annual consumption and leisure levels for all generations born after year 0. The intuition for
these results is simple: An unlinked social -security payroll tax combined with a progressive
income tax is highly distortive. Privatization of social -security immediately links marginal
retirement saving (whether compu lsory or not) to marginal retirement income and reduces the
total effective marginal tax on labor supply (Kotlikoff, 1996, p. 370).
"Efficiency gains from privatization are, however, not guaranteed" (ibid). The same model
produces a 3 percent utility loss for all future generations when (a) the old social -security
scheme is perfectly linked at the margin, and (b) income taxation is used to finance
transitional benefits. "The efficiency loss here results from the increased labor supply and
savings distortions arising from the temporarily higher rate of income taxation" (ibid). Since
social security currently provides (at least in Germany, but also in other major countries)
partial but incomplete linkage, the effects of privatization should lie somewhere betwe en
these two sets of results. Kotlikoff (1996) also shows that using debt to finance part of the
transition costs will generally reduce the short - and medium-term effects on saving.
Figure 7: Proportional Consumption-Tax Finance of Benefits and Progressive
Income-Tax Finance of General Revenues
Notes: K = capital stock, Y = output, w = real wages, and r = real interest rate. Source: Kotlikoff (1996, p. 370).
Macro Variables
0,8
0,85
0,9
0,95
1
1,05
1,1
1,15
1,2
1,25
0 20 40 60 80 100 120 140 160
Year
Inde
x
Remaining Life Time Utility
0,98
0,99
1
1,01
1,02
1,03
1,04
1,05
-50 0 50 100 150
Year of Birth
Inde
x
K
Y
w
r

23
Comparing these simulation results 14 with the actual performance of Chile is – as noted ear lier
– premature. However, the overall picture points in this direction: Savings first fell due to
government borrowing and to a severe recession, but then increased, also gross fixed capital
formation rose, leading to a rise in GDP (see Tables 7 and 9). B ut the picture is somehow
"mixed" because first, there was still high growth in Chile before the Social security reform
and a sharp fall shortly after the reform. But overall the average growth rate of the period
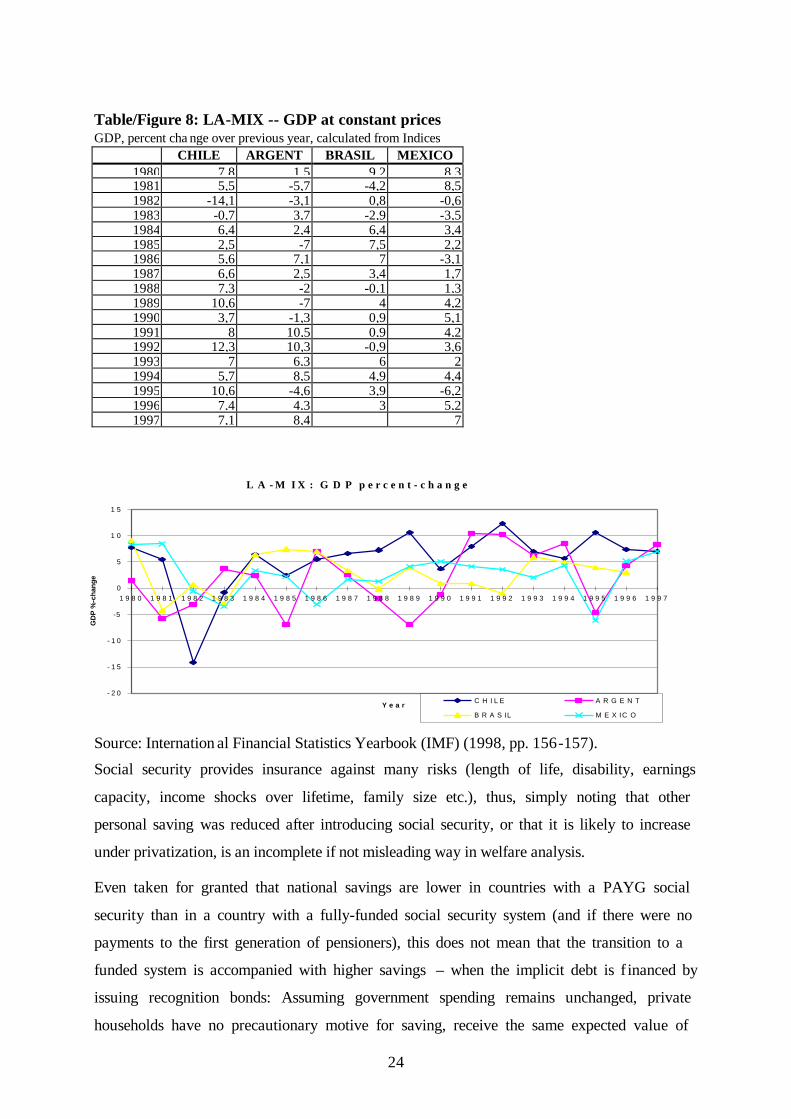
1970-1981 was 2.79 percent and for 1982 to 1997 it was 5.38 percent. Also, compared to her
neighbors, Chile shows on average higher growth rates (Table/Figure 8). However, as
remarked by Marfan/Bosworth (1994, p. 165), "it is surprising that the benefits of economic
liberalization are not more evident in an improved efficiency of resource use as measured by
either the level of labor productivity or the joint productivity of capital and labor".
Whereas between 1950 and 1973, Chile ranked near the bottom of all the surveyed
(seventeen) countries, with an annual rate of growth in output per worker of 2.9 percent
(compared to the average for LA with 3.3 percent); of that growth, 1.8 percentage points can
be attributed to increased capital intensity (capital per worker or capital -labor substitution)
and 1.1 percentage points to technical progress. In the period 1973 to 1989, the performance
of output per worker is even worse, falling off to only 0.6 percent a year 15, and 0.4 resp. 0.2
can be attributed to increased capital intensity resp. total factor produ ctivity (see Table 4-1 of
Marfan/Bosworth, 1994).
IV. 2. 2. Effects on National Savings Rate
One of the primary reasons cited for privatization of social security is that it would boost the
national savings rate and capital accumulation. However, raising the savings rate does not
necessarily imply an increase in the welfare of households. In an economy with taxes and
market imperfections, households might save to overcome those imperfections, regardless of
the tax distortions on intertemporal substitution of consumption (see Engen and Gale, 1997,
and the discussion): There may exist unfair private annuity markets, liquidity constraints of
households, no insurance against income risks etc.
14 An OLG model calibrated to the Chilean reform results in an increase in GDP after 200 years of 3 to 5 percent, compared to the base -line scenario, when the transition generation is burdened twice by repaying t he implicit debt via higher transitory taxation; cf. Arrau and Schmidt -Hebbel (1993). 15 However, the average for Latin America is even smaller, which is due to negative developments in Argentina and Venezuela.
24
Table/Figure 8: LA-MIX -- GDP at constant prices GDP, percent cha nge over previous year, calculated from Indices
CHILE ARGENT BRASIL MEXICO 1980 7,8 1,5 9,2 8,3 1981 5,5 -5,7 -4,2 8,5 1982 -14,1 -3,1 0,8 -0,6 1983 -0,7 3,7 -2,9 -3,5 1984 6,4 2,4 6,4 3,4 1985 2,5 -7 7,5 2,2 1986 5,6 7,1 7 -3,1 1987 6,6 2,5 3,4 1,7 1988 7,3 -2 -0,1 1,3 1989 10,6 -7 4 4,2 1990 3,7 -1,3 0,9 5,1 1991 8 10,5 0,9 4,2 1992 12,3 10,3 -0,9 3,6 1993 7 6,3 6 2 1994 5,7 8,5 4,9 4,4 1995 10,6 -4,6 3,9 -6,2 1996 7,4 4,3 3 5,2 1997 7,1 8,4 7
Source: Internation al Financial Statistics Yearbook (IMF) (1998, pp. 156-157).
Social security provides insurance against many risks (length of life, disability, earnings
capacity, income shocks over lifetime, family size etc.), thus, simply noting that other
personal saving was reduced after introducing social security, or that it is likely to increase
under privatization, is an incomplete if not misleading way in welfare analysis.
Even taken for granted that national savings are lower in countries with a PAYG social
security than in a country with a fully-funded social security system (and if there were no
payments to the first generation of pensioners), this does not mean that the transition to a
funded system is accompanied with higher savings – when the implicit debt is f inanced by
issuing recognition bonds: Assuming government spending remains unchanged, private
households have no precautionary motive for saving, receive the same expected value of
L A - M I X : G D P p e r c e n t - c h a n g e
- 2 0
- 1 5
- 1 0
-5
0
5
1 0
1 5
1 9 8 0 1 9 8 1 1 9 8 2 1 9 8 3 1 9 8 4 1 9 8 5 1 9 8 6 1 9 8 7 1 9 8 8 1 9 8 9 1 9 9 0 1 9 9 1 1 9 9 2 1 9 9 3 1 9 9 4 1 9 9 5 1 9 9 6 1 9 9 7
Y e a r
GD
P %
-cha
nge
C H I L E A R G E N T
B R A S IL M E X IC O

25
future benefits, and face the same expected future taxes, then with no chan ge in national
output, current private consumption, and thus national savings would be unchanged. "This
occurs because the interest payments on the increased explicit national debt are a transfer
from young to old which exactly replaces the transfer under the old, unfunded Social Security
system" (Mitchell/Zeldes, 1996, p. 366). Relaxing some of these assumptions could,
therefore, change saving (cf. also Appendix C, proposition 4).
The performance of the Chilean economy in the last half of the 1970s shows an excess
demand for saving, resulting in raising (domestic) interest rates and an increasing current
account deficit. The debt crisis of 1982 interrupted the inflow of foreign financing. In a
nutshell, while the recovery in 1975-1981 was mainly financed by credits from abroad, the
recovery of 1985-1991 seems to be financed mainly by resources from the growing pension
funds (see Morandé, 1998, pp. 222 sqq.).
The national savings rate raised from extremely low levels of around 9 percent of GDP in
1982 to 12.6 percent in 1984, up to 18.9 percent in 1986, and peaked in 1989 with nearly 30
percent, mostly through an increase in public sector savings. In fact, between 1980 and 1985
net savings were negative, and only in 1986 became positive. The increased nation al savings
provide the funds needed for investment, and substitute for external savings, which are highly
volatile. In a certain sense, high saving rates have "immunized" Chile to the 'tequila effect'
("Mexican Crisis") in 1995 and 1996.
For the investment rate there is a similar picture: In nominal prices, the investment rate kept
relatively constant through the 1970s and early 1980s. In the beginning of the 1980s the
investment rate was declining to 11 and 10 percent, to grow from here up to 25.1 percent in
1989; since then the investment rate is oscillating around 23 to 25 percent (see Table 7).
At the start of the reform, the public deficit increased (see Fig./Table 6), because the receipts
of the wage tax in the old system were falling caused by the shi ft of contributors to the new
AFP system. This reduction was not balanced by the contributions to the new system,
however, because the contribution rates were lower than "combined employer -employee
contribution rates" of the old system. Therefore, most of the public deficit is stemming from
government's obligations towards "old" retirees. These costs start declining rather rapidly,
however, after 1995 because of life expectancy in Chile (cf. Edwards, 1998, p. 27).
Nevertheless, the effects of an increase in the public deficit upon macroeconomic savings
were nearly compensated by the surplus of the new system. The remaining part reflects the
increase in labor income, leading probably to an increase in private consumption. Thus, the
increase in the public deficit overvalues the expansionary effect of the social security reform.

26
Whether the Chilean pension reform has actually increased private savings directly, is still an
open question. Marfan and Bosworth (1994) as well as Holzmann (1996) find that,
privatization appears to have contributed directly to only a small portion (between 3.3 percent
in 1990-92 or between 2 and 3 percent in 1991 -1995) of the rise in national savings to date
(see Table 9 for a splitting up of saving and investment).
However, the govern ment undertook a series of economic reforms which probably raised the
growth rate, and in turn the savings rate. In the same vain worked the indirect effect of
deepening financial markets. Both factors may have risen private, non -pension saving as
reported by Morfan and Bosworth (1994). And a significant portion of the increase in national
savings was due to increased public saving (see Kotlikoff, 1996).
Table 9: Components of Saving and Investment, Selected Periods, 1974-92 Item 1974-78 1979-81 1982-85 1986-89 1990-92a Components of/investmentb Change in inventories 2.2 6.1 -1.6 1.4 2.1 Fixed capital formation 14.6 17.6 14.0 16.8 19.2 Nonresidential 10.8 13.3 10.6 13.0 15.0 Residential 3.9 4.3 3.4 3.7 4.2 Total inves tment 16.8 23.7 12.4 18.2 21.3 Components of savingc Foreignd 2.6 9.0 8.6 3.7 1.3 National 13.3 11.5 3.6 13.6 18.3 Public sector e 11.5 9.3 -2.4 2.8 3.6 Copper and oil funds 0.0 0.0 0.0 1.9 1.9 Private pensio n funds 0.0 0.3 1.9 2.6 3.3 Private f 1.8 1.9 4.2 6.3 9.6 Total saving 15.9 20.5 12.2 17.2 19.6 a. Saving data cover 1990-91 period. b. Percent of GDP, 1977 prices. c. Percent of GDP, current prices. d. Equals the current acco unt deficit. e. Equals the general government, public firms, and Central Bank, net of the Copper and oil funds. f. Calculated as a residual. Source: Marfan/Bosworth (1994, p. 186) .
IV. 2. 3 Comparison of Rates of Return An important and – maybe – decisive question is the comparison of the rates of return
between the different schemes. At first view, the Chilean model comes off well: The average
real rate of return of the new system (from 1981 through 1997) was around 12 percent,
however, there was a differ ence of 3 percent between higher income groups and lower income
groups (cf. Diamond, 1996, p. 73) 16. For a more detailed overview of the rates of return of
16 Cf. also Diamond (1997, p. 288), where he ar gues that in Chile "over the first decade of their new ... pension system they found almost a 5 -percentage point difference in the after -tax rate of return between the low earner and the top earner, because of the fixed position of charges".

27
different AFPs see Appendix B. The question whether such high rates are easy to get with
high inflation rates, see Table 7, will not be discussed here. But also the growth rate of real
GDP was on average 6 to 7 percent in this period. However, the development of real wages
lagged behind.
As argued above, normally the rate of return on equities (stocks) i n pension accounts (r) is
higher than the implicit return in social security (g) (see Figure 9 and Table 10). However,
some caveats should be taken into account: First, a part of the higher returns is a
compensation for the higher risk (measured e.g. by th e standard deviation or the variance,
σ)17; second, another part serves to finance the "unfunded" obligations of the pensioners, a
burden that must always be carried! So, even when the private returns (r) exceed those of the
social security system (g), the interests of the recognition bonds as well as the old (social
security) pensions have to be paid out of this difference. Thus, the question is whether the
risk-adjusted rate of return of the privatized scheme 18 minus the necessary taxes is still higher
than that of the social security system. Furthermore, as reported in Diamond (1998, pp. 50 -
57), depending on the chosen model (with more or less worker choice of portfolio) there may
be significant administrative costs (and increased scope for very poor invest ment choices).
Source: Leimer, ORS WP# 59, 1994; see Geanakoplos/Mitchell/Zeldes (1998, 143, Fig. 4 -1).
17 A standard deviation of 20.5% e.g. means that in every (individual) year there is a chance of 1 out of three that the real rate of return is below (9.4 – 20.5) – 11.1 percent or above (9.4 + 20.5) + 29.9 percent. 18 There exist several methods to adjust the rate of re turn to risk. One "easy measure" is the "Sharpe ratio", which converts total returns to excess return by subtracting the risk -free rate, and then devides that result by the standard deviation or sigma, to get a measure of "reward per unit of risk". The "Tr eynor-ratio" adjusts excess returns for the capital asset pricing model's beta, to get a measure of the "reward to volatility".
F i g u r e 9 : E s t i m a t e d R e a l I n t e r n a l R a t e s o f R e t u r n o n S o c ia l S e c u r i ty C o n t r i b u t io n s
0
5
1 0
1 5
2 0
2 5
3 0
3 5
4 0
1 8 7 6 1 8 8 6 1 8 9 6 1 9 0 6 1 9 1 6 1 9 2 6 1 9 3 6 1 9 4 6 1 9 5 6 1 9 6 6 1 9 7 6
B i r t h y e a r
Per
cent
-1
0
1
2
3
4
5
Per
cent
A l l b i r t h yea rs( u s e l e f t s c a l e )
B i r t h y e a r s 1 9 2 4 - 1 9 7 6( u s e r i g h t s c a l e )

28
Table 10: Annual Inflation-adjusted Rates of Return of Stocks and Bonds (1926-1996)
Asset
Average Yield
Standard Deviation (%)
Real S&P 500 9.4 20.5 Real Long Term government bond 2.4 10.5 Real Interm. Term government bond 2.3 7.1 Real Short Term T-bill 0.7 4.2 Source: Geanakoplos/Mitchell/Zeldes (1998, p. 142, Table 4 -5). Database: Ibbotsen & Associates
IV.2.4 Effects on Labor Market Development
Switching from a PAYG to a funded system and from a defined -benefit to a defined -
contribution system, which establishes a closer link between contributions and benefits, will
improve the efficiency of the labor market 19. The Chilean reform reduced total payroll taxes
considerably, therefore reducing the cost of labor and thus encouraging employment creation.
By relying on a capitalization scheme, the pension reforms also has reduced greatly – if not
eliminated – the effective taxes on labor. By reducing l abor market distortions and informal
labor market activities, by encouraging formal labor market participation and payments of
contribution, this will lead to a higher pension coverage of the population and therefore also
to higher growth rates. However, t he multiplicity of the old Social Security funds (prior to
1981) with frequent double counting makes it difficult to evaluate the labor market effects of
the new system. The structure of the overlapping -generations model suggests to consider two
different aspects of the labor market effects: on the one hand the labor supply of the young
workers, on the other hand the retirement decision of the old generation.
With regard to younger workers, the most important question is the potential rate of evasion,
leading to a dependency rate higher than the demographic one, a higher required contribution
rate, and, hence, a misallocation of labor to the informal sector, with a less productive
technology. The rate of evasion to the informal sector in a funded DC system will be smaller
because of the closer link between benefits and contributions.
Though it is difficult to compare pre - and post -1981 developments, preliminary evidence from
Chile suggests (see Figure 10) that the ratio of actual contributors under the new a nd old
pension schemes to the number of potential mandatory contributors has increased since 1982,
19 In projections for the U.S., Feldstein/Samwick (1996) estimate that, in steady state, a fully funded DC system would reduce t he deadweight loss from the payroll tax by 1% of GNP annually; see also Kotlikoff (1996). For Germany, Homburg/Richter (1990) estimate an annual efficiency gain of reducing the deadweight loss of about 36 billion DM or 1.5 % of GNP.

29
reaching almost 100 percent. The ratio of contributors under the old and new schemes to all
employed (i.e. to all potential contributors) has largely stabili zed since 1987 at around 60
percent. The difference between the two ratios reflects a very low permanent take -up rate by
the self-employed. As mentioned above, the self -employed prefer not to contribute constantly
to the new scheme but to invest in educati on, housing, consumer durables, or their mostly
small enterprises. Furthermore, the overall labor force participation rate has also increased by
some 10 percentage points.
"In summary, the new pension scheme seems to have been no obstacle for higher labor market
participation and may have generated a higher and more formal labor force participation of
the dependently employed. As regards the self -employed, their voluntary contributions status
in the new scheme may also have reduced informal labor market ac tivities" (Holzmann, 1996,
p. 22).
Sources: Superintendency of AFPs (1999, pp. 130, 131, 211). Holzmann (1996, p. 40, Figure 6). Data in 1998 until September. Employment Data in 1998 is estimated.
Social security affects also the retireme nt decisions. Fully funded DC plans may mitigate the
early-retirement effect because the costs of early -retirement are internalized. Thus there may
be an incentive to continue working to raise lifetime income. Then the supply of
(experienced) labor and out put are both increased. However, the cost -effectiveness and the
higher rate of return of the funded system may induce workers to spend some of their
F ig u r e 1 0 : C o v e r a g e U n d e r O ld a n d N e w P e n s i o n S c h e m e
0 %
1 0 %
2 0 %
3 0 %
4 0 %
5 0 %
6 0 %
7 0 %
8 0 %
9 0 %
1 0 0 %
1982
1983
1984
1985
1986
1987
1988
1989
1990
1991
1992
1993
1994
1995
1996
1997
1998
O ld + N e w /O b lig a t o r y C o n t r i b u t o r R atio
O ld + N e w C o n t r i b u t o r s / E m p l o y e d R atio
N e w C o n t r ib u t o r / E m p l o y e d R a t i o
P a r t i c i p a t i o n R a t e
C o n t r i b u t o r / A f f i l i a t e R a t i o

30
increased income in leisure, taken in the form of early retirement. Unfortunately, there is no
empirical evidence on this issue for Chile; however, estimates of the impact of changing
social security on average retirement ages generally show small effects.
IV. 3 Finance-theoretic Perspective and Development of Capital Markets
IV. 3. 1 A General Finance-theoretic Perspective
Under a finance-theoretic perspective the differences between fully -funded and PAYG
systems almost disappear and dwindle to the difference in incentive effects 20. The investments
of the AFPs are – in the first step – almost entirely in government bonds, only in the second
step in private shares and bonds. In as much this leads to higher growth rates (via a reduction
of capital costs of real investment) is unclear outside the "wonder world" of neoclassics.
Furthermore, in the future the pension funds will be decumulated because there is less demand
unless future generations will have a higher individual marginal propensity to save. Thus, also
in this respect the "biological rate of interest" (Samuelson, 1958) will be working.
However, a natural extension is a stochastic overlapping -generations model. In this setting,
the government not only has to issue inflation -indexed bonds but wage -indexed bonds to
mimic the wage-indexed social security benefits. Therefore, any proposal – like the Chilean –
with only traditional debt and a finite pay-off period is not neutral but "call for a significant
redistribution from the transitional generations that pay off the debt to future generations"
(Bohn, 1997, p. 202). Furthermore, to analyze alternative investm ent strategies (of the
government or the AFPs), explicit assumptions about the sources of macroeconomic risk are
needed. When there is only uncertainty about future productivity ("productivity shocks") then
– given a Cobb-Douglas technology – future output , wages, and capital income would be
perfectly correlated. Baxter and Jermann (1997) have shown that capital and labor incomes
are indeed highly correlated in the long run. Therefore: "Equities are a much more natural
hedging instrument for a wage -indexed social security system than government bonds. (Of
course, wage -indexed securities would be even better from this perspective)" (Bohn, 1997, p.
204).
An interesting aspect are the effects of alternative AFP investments on capital markets. In
principle one would expect that a pension fund to pay for the contributors' own future
20 Behind this are the a ssumptions that the debt grows in expectation of the rate of population growth plus wage growth, and that the debt has the same contingent payments as Social Security benefits (e.g. wage indexation); cf. Geanakoplos/Mitchell/Zeldes (1998, p. 149) and Appen dix C. In other words, the "gap between market returns on Social Security contributions is in effect a perpetual tax that is exactly equal to the initial net transfers in present value terms" (Bohn, 1997, p. 196).

31
retirement has no real effects. This "neutrality proposition" (see Bohn, 1997, p. 200) is
narrower than Ricardian neutrality and it states only that such pension funds are virtually
perfect substitutes for private savings. Abstracting from liquidity constraints – and other
imperfections of capital markets – individual accounts are irrelevant for macroeconomic
analysis.
However, there are other effects relating to the development of capi tal markets and the
relation to economic development. At least three opinions can be distinguished. First, the
development of the real economic sector is the leading sector, and financial arrangements and
the financial system satisfy this demand automatically. Second, there are economists who note
that in economics the role of financial factors in economic growth and development may be
badly over-stressed. This opinion sometimes ignores the financial system altogether. The third
view – following Joseph Schu mpeter – stresses the role of a well -functioning banking or
credit system for the enhancement of technical progress by identifying and then financing
innovative entrepreneurs. More generally, banks and other financial intermediaries play an
important role in financing as well as in controlling or supervising firms ("corporate
governance") as long as capital markets are underdeveloped and/or not able to do this function
by themselves. Or the liberalization and accelerated development of capital or financial
markets will foster the efficiency of resource allocation.
IV. 3. 2 Development of the Chilean Capital Markets
There is some evidence that the level of financial system's development – or the effectiveness
of financial markets – has a great explanatory pow er for future growth rates, rates of capital
accumulation and technical progress (cf. Levine, 1997). However, there is a debate how to
measure the depth, liquidity and maturity of financial markets. Some indications are given by
Roubini and Sala-i-Martin (1992) who introduce financial market aspects in an endogenous
growth model through an AK -technology, where A, the rate of return on capital, depends
positively on the level of financial market intermediation: .;CK)(At/K 0>∂−⋅=∂∂ θθ
Here θ is higher the less financial markets are repressed. Estimates suggest nonnegligible and
statistically significant effects on the transitional growth rate of 0.5 to 3.1 percent per annum.
Another simple endogenous growth model incorporating potential growth effects of fin ancial
market developments is proposed by Holzmann (1996). This model "allows also for other
effects since pension reform and financial market developments are usually surrounded by
many other policy changes at macro - and microeconomic level" (ibid, p. 7).

32
Here a "financial market variable" Κ is introduced, "measuring the depth, liquidity, and
maturity of financial markets" (p. 9). This variable is positively related to the savings ratio
(i.e. investment ratio in a closed economy) and to an efficiency varia ble which is responsible
– besides an exogenously given rate of labor -augmenting technical change – for the change in
technical progress. This efficiency variable depends "also on other variables traditionally
quoted in the literature (such as level of exp ort orientation and share of education expenditure
in the budget)" (ibid, p. 9).
To test this model and the advanced hypothesis that pension funds should contribute to the
deepening of financial markets, higher liquidity, enhanced competition, and better risk
allocation in financial markets (and hence significant growth effects), appropriate financial
market indicators must be chosen (see Holzmann, 1996, pp. 11 sqq.): FIR (financial
interrelation ratio) compares the range of financial instruments with net wealth, approximated
by the capital stock; FMR (financial intermediation ratio) compares the scope of financial
instruments with the assets of the financial institutions. FIR -1/FMR-1 cover financial
liabilities, enhanced by the assets of pension funds, mut ual funds, and insurance companies.
FIR-2/FMR-2 follows a more traditional approach and covers both the asset and liability side
of the financial market. These indicators "are similar in magnitude, but differ somewhat in
their composition and thus in trend ... The main difference is due to the scope of bank credits
to the private sector (included in instrument measure 1)", which rose sharply up to 1982, but
"decreased with the banking crisis" (p. 12).
Specific stock market development indicators are used to measure the impact on real
economic activity: MCR (market capitalization ratio) equals the value of listed shares divided
by GDP; VTR (total value traded ratio) measures the total value of shares traded on the stock
market exchange divided by GDP; TOR (turnover ratio) equals the value of total shares
divided by market capitalization; and SMI (stock market index) equals the average of these
three indicators.
Holzmann (1996) uses these financial market indicators as proxies for financial market
deepening and liquidity. As indicators for competitiveness and risk allocation he suggests to
use "asset mispricing", e.g. the systematic deviations of actual returns from those implied by
reference models (e.g. capital asset pricing [CAP] and arbitrage pricing [AP] mo del).
The results of Holzmann's study (1996) can be summarized as follows: "Essentially all
investigated FMIs (Financial Market Indicators) exhibit a strong upward movement once the
banking crisis of 1981-1983 has been solved ... The almost linear rise in the stock market

33
index (SMI), starting in 1985 corresponds to the year of the first participation of pension
funds in stock market activities" (p. 14).
The correlation of AFP assets and FMIs, and of AFP shares in total traded shares and MCR, is
very strong (cf. Fig. 11). "This empirical evidence is consistent with the claim that pension
funds made the financial markets deeper and more liquid" (p. 15).
With regards to the contribution of pension funds to enhanced competitiveness and risk
allocation, the available data only allow for a very cursory investigation. Figure 12 presents
yearly data for the asset mispricing indicators based on AP, CAP and ICAP (international
asset pricing model) and indicators of pension funds assets. "If pension fund activities
improve the performance of the finance market, the mispricing should decrease with enhanced
fund activities" (p. 15): The correlation shows the correct sign, is statistically significant at the
5 percent error level, and ranges between -0.27 and - 0.52.
Furthermore, there is evidence that the pension funds' activities have contributed to a more
sophisticated financial market: they helped to develop indexed annuities, they are important
providers of funds to key sectors such as mortgage bonds to housing finan ce, enterprise
bonds, and increased holding of traded shares. Holzmann (1996, p. 15) cites also evidence
that pension funds are operating efficiently. "In a competitive environment this may
contribute indirect proof of the overall efficiency of the financi al system" (ibid).
V. Intergenerational Redistribution and Risk-Sharing
There is no such thing as a free lunch, therefore, any shift back from an unfunded PAYG to a
fully-funded system is generally burdensome for the transitional generations
Figure 11. Pension Fund Assets and Financial Market Indices
0
1
2
3
4
5
6
7
8
1975 1977 1979 1981 1983 1985 1987 1989 1991 1993
Fina
ncia
l Mar
ket I
ndic
es
(198
1=1)
0%
5%
10%
15%
20%
25%
30%
35%
40%
45%
AFP
Ass
ets
in %
of G
DP
Source: Holzmann (1996, p. 39, Figure 3).
SMI(left scale)
AFP Assets/GDP(right scale)
FIR-1(left scale)
FIR-2(left scale)

34
(intergenerational redistribution). For a clear picture of this, see Figure 13 for a
"generational balance" of the U.S.A. pension system. This is so because in a PAYG scheme
the first generation(s) receive(s) a "gift" or benefits in excess of her (their) contribution that
future generations have to pay back 21.
In a standard overlapping -generations model any increased redistribution from young workers
to old retirees reduces the disposable income of young workers, reduces thus their need to
save for old age income, and hence raises the equilibrium rate of interest. This in turn may
crowd out capital investment and bring the economy on a growth path with lower per capita
income. Therefore, less redistribution from young to old will put the economy on a higher per
capita income growth path!
Furthermore, as Bohn (1997, p. 203) has observed, "reduced population growth per se has
positive macroeconomic effects": Reduced population growth raises the capital -labor ratio
which reduces the real return on capital while increasing the wage rate. Hence, a slowdown in
population growth tends to reduce interest rates and to raise per capita incomes.
Source: Leimer (1994) tax increase balanced budget scenarion, and author's calculations. All figures are present values as of 1997; see Geanakoplos/Mitchell/Zeldes (1998, p. 145, Fig. 4-2).
21 Cf. also the argument in note 18.
Figure 13: Social Security Net Intercohort Transfers
-150
-100
-50
0
50
100
150
200
250
300
350
1876 1886 1896 1906 1916 1926 1936 1946 1956 1966 1976
birth year
Ann
ual a
mou
nt: b
illio
ns o
f 199
7 do
llars
0
1000
2000
3000
4000
5000
6000
7000
8000
9000
10000
cum
ulat
ive:
bill
ions
of 1
997
dolla
rs
Netto-transfers to cohort born in each year(use left scale)
cumulative sum:net transfers to all cohortsborn in and prior to each year(use right skale)

35
To assess the second bundle of problems related to intergenerational risk-sharing a
stochastic overlapping -generations model seems to be the best tool for analyzing the
allocation of macroeconomic risks across generations (see Appendix C). To use this model,
however, it has to be calibrated and then simulations could be run (see for such an exercise
Bohn (1997)). In an OLG-model the older generation owns all the wealth, so they bear all the
capital risk. If the Social Insurance fund will balance the system when there is a downturn or
upturn in the stock market by changing the taxes on the young workers and not by changing
the benefits of the older generation, then this shifts capital -market risk from the old to the
young. This effectively lets the unborn young generation take a position in the current stock
market. Private markets cannot accomplish this because it is impossible to write contracts
with the unborn generation. Given that capital income is ris kier than labor income (see,
however, note 1 of Appendix C) such a policy leads to more efficient intergenerational risk -
sharing. Here, however, the analyses will be less sophisticated, and touch only upon four
different points.
The first point to be raise d is related to the "risk shifting" of the transition from a DB (defined
benefit) to a DC (defined contribution) plan and from a public to a private system. This point
relates to the "insurance function" of social security vs. private funds: It is of impor tance that
the Chilean AFPs are rather "savings institutions" than insurers (they have to buy insurance
e.g. for invalidity and survivors' benefits with insurance companies against a premium).
Furthermore, while closing the individual account the balance c an be used to buy an annuity
with a life insurance company or – as described above – to a phased withdrawal.
However, this leads to the second point which in turn has several facets. On the one hand, the
incomplete liquidization (i.e. before normal retire ment) tends to reduce the rate of
participation of self-employed – which are members of the AFPs on an optional basis. To
save for a house or a commercial investment is more attractive for the young than
participating in a pension scheme (cf. Gillion and Bonilla, 1992). On the other hand, allowing
early withdrawal (see the Singapur scheme) leads to the problem that the balance will be
consumed early, and then the individual may fall into the "poverty trap". As always, a
possible solution is to allow early d issolving (or partial dissolving) only according to rules
governing for example life insurance policy with a "dread disease" clause.
Somehow related to this point is a third problem, namely that the current systems of social
insurance pay the benefits in t he form of an annuity, which is indexed to inflation or wage
income (or even both), providing insurance against living too long and against inflation (and
against "relative poverty"). However, private markets for annuity insurance are (or may be)

36
plagued by adverse selection: those expecting to live longer are more likely to purchase
annuities. To get around this problem two possibilities exist: First to mandate a national risk
pool (i.e. not to allow insurers to use information about expected lifespan) or requiring
annuity purchase at a young age (cf. Mitchell and Zeldes, 1996, p. 364).
The insurance against inflation (or even "relative poverty") is possible when the government –
as in the case of Chile – issues indexed bonds (indexed to inflation or – even better – to wage
income growth) 22.
The fourth point to raise relates to poverty, i.e. the aim of social security to protect against
poverty in old age (or even to secure – e.g. as the German system – a relative income position
in retirement, cf. Hauser, 19 99). Privatization of social security implies that a large part of
income redistribution – a characteristic of most social security systems – is no longer
possible. On the one hand, there is intragenerational earnings insurance, and private systems
will provide less of this type, because adverse selection is strong in "earnings insurance". In
general, the benefit formula is structured to provide a higher rate of return to low lifetime
earners than to high lifetime earners. "This is justified on the grounds that a social insurance
plan can pool over the entire population certain risks that are difficult to insure privately"
(Geanakoplos/Mitchell/Zeldes, 1998, p. 154). This is true in particular for shocks of earnings,
disability, unemployment, length of life, inflation and poverty.
On the other hand, social insurance is also intergenerational risk-sharing (because the bene -
fits of the current old are positively related to the earnings of the current young), and this is
absent in private markets. Therefore, the retirement income of the "working poor" is based no
longer on a progressive social insurance benefit function. [As a side -remark: However, poor
people die – on average – earlier than rich one, hence they could bequeath relatively more of
their funds to th eir children!] However, the government could supplement the contributions of
the poor – either upon retirement (by a minimum pension) or earlier (by supplementing con -
tributions). Then the overall result depends very much upon the share of the poor populat ion.
Before the reform, in Chile more than 90 percent of workers got only the minimum pension.
Under the new system there are only little information available at the moment (see Table 11).
In Chile, the minimum pension is not set as a constant fraction of the minimum wage and is
adjusted to inflation occasionally, its current level is 73 percent of the minimum wage and
around 25 percent of the average wage. This level is, however, quite low! But as row 6 in
22 It should, however, be noted that the privatized system offers new opportunities to hedge other household risks in private capital markets, and they confront less political risk.

37
Table 11 shows, the old ratio of age pension to a verage income raised from 27 percent in
1983 to 44 percent in 1991 and then fell to 32 in 1998, and the early retirement pension ratio
to average income fell from 90 percent in 1988 to 50 percent in 1998. The influence of the
great recession of 1982/3 is c learly visible in these figures. In a certain sense, most of these
pensioners live still "on the pockets of the state"!
This proposition is supported by results of Marcel/Solimano (1994) with respect to income
distribution: During the Pinochet administrati on (1974-1989) the income share of the lower
two quintiles decreased by 1.5 percentage points compared to the period 1960 -1973, while the
share of the highest quintile increased by 4.7 percentage points. Essentially, this change in the
income distribution is due to the increase in unemployment after 1974, and the decrease of the
real minimum wage.
Table 11: Average Amount of Pensions Paid through the System (3) (Data up to December each year, 1998-Ch$)
Years Old-Age Early Retirement
Total Disability(2)
Real Average Imposable Income(4)
Ratio Old-Age/Real Av.
Impos. Income
Ratio Early Retirement/Real
Av. Impos. Income 1982 204,899 181,823 1983 42,676 173,478 157,031 27,18% 1984 47,205 143,663 143,177 32,97% 1985 45,306 132,849 134,68 33,64% 1986 53,052 131,095 145,914 36,36% 1987 55,829 129,195 140,336 39,78% 1988 63,135 138,402 135,187 154,569 40,85% 89,54% 1989 70,443 121,595 135,187 167,638 42,02% 72,53% 1990 70,881 125,979 132,556 174,272 40,67% 72,29% 1991 80,674 137,229 138,109 181,898 44,35% 75,44% 1992 84,327 141,909 137,818 192,981 43,70% 73,54% 1993 82,427 141,326 134,894 209,358 39,37% 67,50% 1994 86,978 148,969 137,601 220,885 39,38% 67,44% 1995 88,677 146,872 139,252 234,317 37,84% 62,68% 1996 87,671 145,725 132,743 244,997 35,78% 59,48% 1997 88,805 141,791 127,859 259,142 34,27% 54,72%
1998(1) 86,259 135,775 126,241 268,978 32,07% 50,48% (1) Data up to September 1998. (2) Does not include transitory Disability Pensions. (3) Excludes pensions co rresponding to a first payment. (4) Corresponds to overall contributors (salaried and self -employed). Source: Superintendency of AFPs (1999, p. 214 and p. 224).
VI. Summary and Conclusions
The Chilean pension reform and the subsequent "second -generation reforms" in other Latin -
American countries show that pension reforms are politically feasible and successful. (For

38
summaries see e.g. James (1997); Mitchell/Barreto (1997); and Queisser (1999). However,
their economic benefits have been overestimated.
(Partial) privatization of classical PAYG social security systems, combined with funded
individual pensions, have certainly different positive effects on the economy. First of all, this
reform may lead to a separation of pensions, contributions and (individua l or institutional)
wealth from current political decisions. However, politicians as well as trade unionists will
find very quickly new political fields which they can concentrate their efforts. Second, this
reform may increase efficiency of labor markets because the distorting effects of contributions
will be lower. This in turn may increase economic growth. Third, because of increasing
(private) savings, capital accumulation and hence growth rates tend to increase. Fourth, this
reform may have great posit ive effects for the development of capital markets which has itself
positive effects on economic growth. In all these aspects, the Chilean reform model has done
well. However, these advantages are mixed up with the effects of the total reform programme
(e.g. in Chile). A direct discrimination is therefore very dificult. The Chilean reform,
however, shows that most of the positive effects are connected with raising the retirement age.
A second effect on savings is caused by the big savings effort of the Chil ean government and
the tax increases to finance the pension system reform.
These advantages must be confronted with the costs – not to mention the political questions:
Privatized annuities have remarkably higher administration and selling costs than tradit ional
(DB) systems. And there are some intriguing aspects of adverse selection (cf. Diamond
(1998); NASJ (1998); Murthi/Orszag/Orszag (1999).
To summarize, Chile instituted a two -pillar system, a first pillar paying a guaranteed
minimum pension, and a second mandatory pillar offering a private DC account. The first
pillar is financed with general tax revenue. The minimum benefit level is independent of the
contribution amount, however, eligibility depends – in order to reduce moral hazard that
otherwise might induce evasion – on both age and years of membership in the new system.
For the second pillar Chile uses payroll taxes, and older workers were given some "credit" in
the form of recognition bonds for contribution under the old system.
With regard to th e Chilean reform, the new Chilean AFP system has strengths and
weaknesses (see Vittas, 1995) to take into account as lessons for other countries
contemplating similar reforms:
• The system emphasizes personal responsibility and the direct link between contr ibutions
and benefits. It is simple and transparent.

39
• However, the great discrepancy between the number of affiliates and the number of active
contributors seems to be a great problem not guaranteeing universal coverage.
• Adding the contributors to the old system, the total coverage of the Chilean pension
system rose from 53 percent of total employment to 65 percent in 1995. The relatively low
"coverage" is one of the most important weaknesses of the system. It can be explained,
however, by the great informa l sector of the labor market, the small number of self -
employed in the AFPs, and the (still existing) moral hazard created by the government
guarantee of minimum pensions.
• The state guarantees with respect to the minimum pension and the minimum rate of re turn
as well as the inflation-proofness are nevertheless remarkable features.
• Despite this minimum level, the relationship between workers' private account
accumulation and what happens to these accounts in the event of disability, death, or very
low income on old age is still open. In this case, most of the accumulation is done in early
years with the result that, e.g. the costs weigh higher (cf. Diamond, 1998, p. 54).
• Furthermore, the level of the minimum pensions seems to be too low to secure a decent
life during retirement. It is only targeted at about 25 percent of the average wage.
Furthermore, how many workers will retire with the minimum pension is still an open
question.
• Even this emaciated first pillar may imply that government sector liabilities c an prove to
be too high compared to the tax base. Therefore, the system's future financial viability has
to be looked at carefully.
• The flexibility in moving in and out of individual AFPs is of great advantage, however,
the high frequency leads to excessiv e marketing and administrative costs.
• The volume of the pension funds managed by AFPs has risen steadily from 10 percent of
GDP in 1985 to more than 42 percent in 1997. The total amount of ressources of the funds
reached US-$ 30 billion by the end of 1997.
• The tight investment rules and regulation of the AFPs solved some problems at the start.
However, the rule to build only one fund per AFP and one account per worker hinder the
diversity of the offers. Nevertheless, there is a remarkable difference in the rate of returns
between low life -time earners and high life-time earners before and after tax.
• Three major forces have driven the portfolio composition of the pension funds: the
evolution of investment limits, the increase in the size of the pension funds , and the
development of domestic capital markets as well as new investment instruments.

40
• The average rate of return of the pension funds portfolio has reached 12 percent in real
terms (with great fluctuations, however). Whether this is "exceptionally good" is difficult
to say in a period of high inflation, high growth rate, and high real interest rates and
starting financial development. In a certain sense, these high rates reflect the good
economic circumstances. Since 1995, the situation has changed, on t he one hand because
of the Mexican crisis, on the other hand because of the significant fall in the terms of trade
(e.g. copper prices). Therefore, it is not yet clear how much this reflects good investment
opportunities, and how much it reflects greater r isk and excess demand for limited
domestic assets (i.e. most portfolios have shares of only a very small group of companies;
cf. Edwards, 1996, p. 15).
It is more difficult to evaluate the macro -economic benefits with regards to the impact on
private savings, overall economic efficiency, and the development of capital markets.
• The direct effect of the pension reform on household saving is difficult to ascertain
because the pension reform was part of a thorough -going economic reform.
Furthermore, the impact depends upon the way the transition period is financed: If it is not
financed by debt this means an increase in taxes on current generations; there maybe also
a fall in consumption; besides this the contribution rate fell from 22 percent to 13 percent
raising consumption. So overall, whether the reform has increased private savings, is still
an open question. However, the increase found by some research is not very significant.
• With respect to overall economic efficiency the same reasoning applies: Chile achieved
better growth performance than her neighbours in the late 80s and 90s. However, only part
of it may be attributed to the pension reform.
• The accumulation of pension funds and their investment in financial markets has led e.g.
to the development of a housing market and a private market for mortgage bonds.
Furthermore, the insurance markets have flourished, leading to a fall in premium rates.
The pension funds also contributed to the privatization of public enterprises. Their
investments led to bet ter performance in stock and other financial assets markets. And
new financial instruments have been introduced to meet the growing demand of pension
funds.
The Chilean example and other reforms not only in Latinamerica, but also in Europe (cf.
Gern, 1998), have shown that reforms of Social Security are possible and politically feasible.
However, one should not expect "economic miracles".

41
VII. References:
Aaron, Henry J. (1966): The Social Insurance Paradox, in: CanJPublEcon & Pol. Science 32,
pp. 371-377.
Abel, Andrew B., N. Gregory Mankiw, Lawrence H. Summers and Richard J. Zeckhauser
(1989): Assessing Dynamic Efficiency, in: Review of Economic Studies 56, pp. 1-19.
Arrau, Patricio and Klaus Schmidt-Hebbel (1993): Macroeconomic and Intergenerational
Welfare: Effects of a Transition from a Pay -as-You-Go to Fully-Funded Pensions, mimeo
Washington/D.C. (Background paper for the World Bank Study on Old -Age Security).
Baxter, Marianne and Urban J. Jermann (1997): The International Diversification Puzzle Is
Worse Than You Think, in: American Economic Review 87, pp. 170-180.
Belan, Pascal, Philippe Michel and Pierre Pestieau (1998): Pareto -Improving Social Security
Reform, in: The Geneva Papers on Risk and Insurance Theory 23 (No. 2, Dec.), pp. 119 -125.
Blanchard, Olivier J. and Stanley Fisher (1989): Lectures on Macroeconomics,
Cambridge/Mass. and London (The MIT Press).
Bohn, Henning (1997): Social Security Reforms and Financial Markets, in: St. A. Sass and
R.K. Triest (eds.): Social Security Reform, Conference Proceedings, FRB of Boston, pp. 193 -
227.
Bossworth, Barry P., Rudiger Dornbusch, and Raul Laban (1994): Introduction, in: B. P.
Bosworth, et al. (eds.) (1994): The Chilean Economy, Policy Lessons and Challenges,
Washington, D.C. (Brookings Inst. Press), pp . 1-28.
Breyer, Friedrich (1989): On the Intergenerational Pareto Efficiency of Pay -As-You-Go
Financed Pensions Systems, in: Journal of Institutional and Theoretical Economics 145, pp.
643-658.
Diamond, Peter A. (1996): Proposals to Restructure Social Secu rity, in: Journal of Economic
Perspectives, 10 (No. 3, Summer), pp. 67 -88.
Diamond, Peter A. (1997): Political Aspects of Social Security Reform, in: St. A. Sass and
R.K. Triest (eds.): Social Security Reform, Conference Proceedings, FRB of Boston, pp. 287 -
292.
Diamond, Peter A. (1998): The Economics of Social Security Reform, in: R.D. Arnold, M.J.
Graetz, A. H. Munnell (eds): Framing the Social Security Debate, National Academy of
Social Insurance, Washington, D. C. (Brookings Inst. Press), pp. 38 -64.

42
Edwards, Sebastian (1996): The Chilean Pension Reform: A Pioneering Program, NBER
Working Paper No. W5811, Cambridge, M.A. (National Bureau of Economic Research).
Edwards, Sebastian and Alejandra Edwards (1991): Monetarism and Liberalization: The
Chilean Experiment, Chicago (Univ. of Chicago Press), 2nd ed.
Engen, Eric M. and William G. Gale (1997): Effects of Social Security Reform on Private and
National Saving, in: St. A. Sass, and R.K. Triest (eds): Social Security Reform, Conference
Proceedings, Federal Re serve Bank of Boston, pp. 103 -142.
Geanakoplos, John; Olivia S. Mitchell, and Stephen P. Zeldes (1998): Would a Privatized
Social Security System Really Pay a Higher Rate of Return?, in: R. D. Arnold, M. J.Graetz,
and A. H. Munnell (eds.): Framing the Social Security Debate, National Academy of Social
Insurance, Washington, D.C. (Brookings Inst. Press), pp. 137 -156.
Gern, Klaus-Jürgen (1998): Recent Developments in Old -Age Pension Systems - An
International Overview, Kiel Working Paper No. 863, Kiel Institute of World Economics.
Gillion, Colin and Alejandro Bonilla (1992): Analysis of a National Private Pension Scheme:
The Case of Chile, in: International Labour Review 131, pp. 171-195.
Hardes, Heinz-Dieter (1996): Zur Gestaltung von Alterssicherungssystemen in internationaler
Perspektive, unpubl. manuscript.
Hassler, John and Assar Lindbeck (1997): Intergenerational Risk Sharing, IES - Seminar Pa-
pers No. 631, Stockholm.
Hauser, Richard (1999): Adequacy and Poverty Among Retired People, in: International
Social Security Review 52, pp. 107-124.
Homburg, Stefan and Wolfram Richter (1990): Eine effizienzorientierte Reform der GRV, in:
Felderer, B. (ed.): Bevölkerung und Wirtschaft, SVSP, Bd. 202, Berlin (Duncker and
Humblot), pp. 183-191.
Holzmann, Robert (1996): Pension Reform, Financial Market Development, and Economic
Growth: Preliminary Evidence from Chile, International Monetary Fund WP 96/94,
Washington, D.C.
Institut für Iberoamerika-Kunde (ed.) (1997): Lateinamerika - Analysen, Daten,
Dokumentation, Nr. 36, December, Hamburg.
IMF, International Financial Statistical Yearbook, Washington, D.C., 1998.

43
James, Estelle (1997): New Systems for Old Age Security -Theory, Practice and Empirical
Evidence, Policy Research Working Paper, No. 1766, Washington/D.C. (Wor ld Bank).
Kotlikoff, Lawrence J. (1996): Privatizing Social Security at Home and Abroad, in: American
Economic Review, PaP, 86 (No. 2, May), pp. 368 -372.
Levine, Ross (1997): Financial Development and Economic Growth: Views and Agenda, in:
Journal of Economic Literature XXXV, pp. 688 -726.
Marcel, Mario and Andres Solimano (1994): The Distribution of Income and Economic
Adjustment, in: B. P. Bosworth et al. (eds): The Chilean Economy: Policy Lessons and
Challenges, Washington/D.C. (Brookings), pp. 217 -255.
Marfan, Manuel and Barry P. Bosworth (1994): Saving, Investment, and Economic Growth,
in: B. P. Bosworth, et al. (eds.): The Chilean Economy: Policy Lessons and Challenges,
Washington, D. C. (Brookings), pp. 165 -200.
Mesa-Lago, Carmelo (1989): Ascent to Bankruptcy: Financing Social Security in Latin
America, Pittsburg/PA (University of Pittsburgh Press).
Mitchell, Olivia S. and Flavio A. Barreto (1997): After Chile, What? Second -Round Pension
Reforms in Latin America, NBER Working Paper No. W 6316, Cambridge, M.A. (National
Bureau of Economic Research).
Mitchell, Olivia S. and Stephen P. Zeldes (1996): Social Security Privatization: A Structure
for Analysis, in: American Economic Review, PaP, 86 (no. 2, May), pp. 363 -367.
Morandé, Felipe G. (1998): Savings in Chile. What went right? in: Journal of Development
Economics 57, pp. 201-228.
Murthi, Mamta, J. Michael Orszag, and Peter R. Orszag (1999): Administrative Costs under a
Decentralized Approach to Individual Accounts: Lessons from the United Kingdom,
manuskript, The World Bank, Sept. 1999.
Queisser, Monika (1993): Vom Umlage- zum Kapitaldeckungsverfahren: Die chilenische
Rentenreform als Modell für Entwicklungsländer, München (ifo-Institut).
Queisser, Monika (1995): Chile and Beyond: The Second -generation Pension Reforms in La-
tin America, in: International Social Security Review 48, pp. 23-39.
Queisser, Monika (1999): Pension Reform: Lessons from Latin America, OECD-Policy Brief
No. 15, Paris.

44
Rösner, Hans Jürgen (1995): Chancen und Risiken von Privatisi erungsstrategien im Bereich
der sozialen Sicherung: Das Beispiel Chile, in: Informationsdienst Nr. 244, GVG, Köln.
Roubini, Nouriel and Xavier Sala-i-Martin (1992): Financial Repression and Economic
Growth, in: Journal of Development Economics 39, pp. 5-30.
Samuelson, Paul A. (1958): An Exact Consumption Loan Model of Interest with or without
the Social Contrivance of Money, in: Journal of Political Economy 66, pp. 467-482.
Sapelli, C. (1999): Mandatory Health Insurance in Chile: Issues of Design in Theory and in
Practice, paper presented at the IHEA 2 nd World Conference, June 6 -9, 1999, Rotterdam.
Schulz-Weidner, Wolfgang (1996): Das "chilenische Modell" einer Privatisierung der Ren -
tenversicherung - mehr Leistung für weniger Beiträge?, in: Deutsche Rentenversicherung
3/96, pp. 158-175.
Superintendencia de Administradoras de Fondos de Pensiones (1997), Evolucion del Sistema
Chileno de Pensiones, 1981-1996, 2nd ed., Santiago/Chile.
Superintendency of Pension Funds Administrators (1999), The Chilean Pension System, 3rd
ed., Santiago/Chile.
Turner, John A. and David Rajnes (1998): Privatization of Retirement Income, in: Peter Flora
et al. (eds), The State of Social Welfare, 1997, Aldershot et al. (Ashgate), pp. 283 -296.
Valdrina, Victor H. (1997): The Insurance Role of Social Security: Theory and Lessons for
Policy Reform, IMF Working Paper 97/113, Washington, D. C.
Vittas, Dimitri (1995): Strengths and Weaknesses of the Chilean Pension Reform,
unpublished manuscript, Financial Sector Development, Washington, D .C. (World Bank).
World Bank (1994), Averting the Old Age Crisis, A World Bank Policy Research Report, Ox -
ford UP, Washington.

45
VIII. Further (not cited) literature, relevant to the subject:
Abel, Andrew B.: The Social Security Trust Fund, the Riskless I nterest Rate, and Capital
Accumulation, NBER Working Paper No. W 6991, März 1999.
Agarwal, Jamuna A. and Peter Nunnenkamp (1992): Methods and Sequencing of
Privatization – What Post -Socialist Countries Can Learn from Chile, Kiel Working Paper No.
527.
Altimir, Oscar (1994): Distribución del ingreso e incidencia de la pobreza a lo largo del
ajuste, in: Revista de la CEPAL, Nr. 52, April.
Arrau, Patricio and Klaus Schmidt-Hebbel (1995): Pension Systems and Reform: Country
Experiences and Research Issues, World Bank Working Paper No. 1470, June.
Aiyer, Sri-Ram (1997): Pension Reform in Latin America: Quick Fixes or Sustainable
Reform?, Worldbank Working Paper No. 1865, Dez.
Bohn, Henning (1999): Social Security and Demographic Uncertainty: The Risk Sharing
Properties of Alternative Policies, NBER Working Paper No. W7030, März.
Corsetti, Giancarlo and Klaus Schmidt -Hebbel (1995): Pension Reform and Growth, World
Bank Working Paper No. 1471, June.
Diamond, Peter (1994): Privatization of Social Security: Lessons fr om Chile, NBER Working
Paper No. W4510, Okt. 1993, published in: Revista de Analisis Economico, Jun. 1994, pp. 21-
33.
epd: Chile – Das monetaristische Wirtschaftskonzept führt in den Ruin, Nr. 13, Neufassung
1983.
Diamond, Peter and Jean Geanakoyplos (1999): Social Security Investment in Equities I:
Linear Case, NBER Working Paper No. W7103, April.
Edwards, Sebastian (1998): Interest Rate Volatility, Capital Controls, and Contagion, NBER
Working Paper No. W6756, Okt.
Engel, Eduardo M.R.A., Alexander Galetov ic and Claudio E. Raddatz (1998): Taxes and
Income Distribution in Chile: Some Unpleasant Redistributive Arithmetic, NBER Working
Paper No. W6828, Dez.
Feldstein, Martin and Elena Ranguelova (1999): The Economics of Bequests in Pensions and
Social Security, NBER Working Paper No. W7065, April.
Fontaine, Juan A.(1997): Are there (good) Macroeconomic Reasons for Limiting External
Investment by Pension Funds? The Chilean Experience, in: The Economics of Pensions –
Principles, Policies, and International Experience, ed. by Salvador Valdés -Prieto,
Cambridge, pp. 251-274.

46
Gersdorf, Hermann von (1997): Pension Reform in Bolivia: Innovative Solutions to Common
Problems, World Bank Working Paper No. 1832, Sept.
Goldberg, Fred T. and Michael J. Graetz (1999): Reformin g Social Security: A Practical and
Workable System of Personal Retirement Accounts, NBER Working Paper No. W6970, Feb.
Imbusch, Peter (1995): Unternehmer und Politik in Chile, Frankfurt/Main.
James, Estelle (1997): Pension reform: Is there a Tradeoff betw een Efficiency and Equity?
Worldbank Working Paper No. 1767, Mai.
James, Estelle (1996): Protecting the Old and Promoting Growth: A Defence of Averting the
Old Age Crisis, World Bank Working Paper No. 1570, Jan.
James, Estelle (1997): Public Pension Plans in International Perspective: Problems, Reforms,
and Research Issues, in: The Economics of Pensions – Principles, Policies, and International
Experience, ed. by Salvador Valdés -Prieto, Cambridge, pp. 350 -370.
Kiefer, Manfred: Die Rentenreform in Peru – Auswirkungen auf soziale Sicherung,
Finanzmärkte und Staatsfinanzen, in: Entwicklung und Finanzierung, Vol. 4, ed. by
Nitsch/Schmidt/Zeitinger.
Loayza, Norman and Luisa Palacios and Economic Reform and Progress in Latin America
and the Caribbean, in: World Bank Working Paper No. 1829, Sept.
McHale, John (1999): The Risk of Social Security Benefit Rule Changes: Some International
Evidence, NBER Working Paper No. W7031, März.
Mesa-Lago, Carmelo and Kristin Kleinjans (1997): Die internationale Rentenreformdebatt e –
Annahmen und Realität der lateinamerikanischen Reformen, in: Lateinamerika, Nr. 16, Dez.
Mulligan, Casey B. and Xavier Sala-i-Martin (1999): Social Security in Theory and Practice
(I): Facts and Political Theories, NBER Working Paper No. W7118, Mai.
Mulligan, Casey B. and Xavier Sala-i-Martin (1999): Social Security in Theory and Practice
(II): Efficiency Theories, Narrative Theories, and Implications for Reform, NBER Working
Paper No. W 7119, Mai.
Nitsch, Manfred and Helmut Schwarzer (1996): Recent Dev elopments in Financing Social
Security in Latin America, in: International Labour Organization: Issues in Social
Protection, Discussion Paper No. 1.
Queisser, Monika (1997): Pension Reform and Private Pension Funds in Peru and Colombia,
World Bank Working Paper No. 1853, Nov.
Queisser, Monika, O. Larrañga, and M., Panadeiros (1993): Adjustment and Social
Development in Latin America During the 1980s – Education, Health Care and Social
Security, Köln – London.

47
Ramos, Joseph (1997): Un balance de las reformas estructurales neoliberales en América
Latina, in: Revista de la CEPAL, Nr. 62, August.
Rivera Urrutia, Eugenio (1991): Stabilisierung, Wachstum und Gerechtigkeit: Bilanz der
Wirtschafts- und Sozialpolitik in Chile im ersten Jahr der demokratischen Regieru ng, in:
Modellfall Chile? – Ein Jahr nach dem demokratischen Neuanfang, hrsg. von Jaime Ensignia
und Detlef Nolte, Hamburg.
Shah, Hemant (1997): Toward better Regulation of Private Pension Funds, Worldbank
Working Paper No. 1791, June.
Sperberg, F. Jaime (1997): Die Rentenreform in Chile: Kein Modell für Lateinamerika, in:
Lateinamerika, Nr. 36, December.
Superintendencia de AFP: El Sistema de Capitalización Individual,
http://www.safp.cl/bases.html, 04.05.1999.
Turner, Philip (1995): Capital Flows in Latin America, in: Bank for International Settlements,
Economic Papers, No. 44, May.
Valdés-Prieto, Salvador (ed.) (1997): The Economics of Pensions – Principles, Policies, and
International Experience, Cambridge.
Valdés-Prieto, Salvador (1997): Financing a Pension Reform toward Private Funded
Pensions, in: The Economics of Pensions, ed. by Valdés -Prieto, Cambridge.
Vittas, Dimitri (1998): Regulatory Controversies of Private Pension Funds,
WorldbankWorking Paper No. 1893, March.
World Bank (1997): Chile, in: Social Security Programs throughout the World.
World Bank (1997): The Long March: A Reform Agenda for Latin America and the
Caribbean in the Next Decade, Washington, DC.
World Bank (1997): Annual World Bank Conference on Development in Latin America.

48
Appendix A: A Short Review of the Development of the AFP Industry
I.
The number of functioning AFPs in the market increased from 12 in 1981 over 21 in 1993,
and then a merger process took place resulting in 8 AFPs in 1999. Between these years,
different ch anges took place (see Superintendency, 1999, pp. 112 sqq.).
The 12 starting pension funds were Alameda, Concordia, Cuprum, El Libertador, Habitat,
Invierta, Magister, Planvital, Provida, San Cristóbal, Santa Mariá, and Summa, of which the
AFPs in italics s till exist.
Up to 1985, the number remained unchanged, when Alameda and San Cristóbal merged,
forming Union. In 1983 and 1987, two legal reforms to change DL 3500 were enacted, which
influenced in different ways the entry barriers of AFPs to the industry. In 1983, the required
cash reserve was reduced from 5 to 1% of the administrated pension funds. In 1987, the
minimum equity capital for establishing an AFP was lowered from 20 million UF (equivalent
to US-$ 631,345) to 5 million UF (US-$ 157,836).
Starting from these changes, the number of AFPs changed in the following way:
• In 1986, 1988 and 1990, Protección, Futuro and Bannuestro entered the industry;
however, Bannuestro was wound up in the following year.
• In 1992, six AFPs began operating: Banguardia, Bansander, Fomenta, Laboral, Previpan
and Qualitas.
• During 1993, three AFPs joint the market: Aporta, Genera and Norprevisión (which
changed its name to Valora). In the same year, Invierta and Planvital merged.
• In 1994, Armoniza initiated operations, but Labo ral was wound up.
• In 1995, Provida and El Libertador merged as well as Santa Mariá and Banguardia, and
Qualitas and Previpan merged with Valora. During the same year, Genera was wound up.
• In 1996, three mergers took place: Planvital merged with Concordia, Magister with
Futuro, and Valora with Armoniza called Qualitas.
• During 1998, four mergers have taken place: Provida merged with Union, Summa with
Bansander, Magister with Qualitas, and finally Aporta with Fomenta.
49
• In January 1999 Provida merged with Protección, so that in the year 1999 there existed
only 8 AFPs (see also Table B1).
II.
Competition can take place on three different levels, in the relevant market itself and in the
markets for subsitutes and in markets on a lower or higher level. In consequ ence, the working
of competition in the market in a narrower sense cannot be judged appositely if not all these
levels of economic activity are taken into account. In other words, one has to take into
account at least also the market situation of suppliers (e.g. life insurance companies, banks,
brokerage firms; see Superintendency, 1999, pp. 118 sqq.).
Furthermore, competition in a market (in a narrower sense) depends upon the growth rate of
this market, of the industry, and of the macro economy. About the macro economic
development and the industry of financial intermediaris, some remarks are in the main text.
The growth of the relevant market of AFPs was large in the beginning years when the number
of affiliates grew rapidly: growth rates of affiliates wer e 10, 18 and 12% in the first 4 years,
then decreased up to 1992/3 to 1 %, then 1993 to 1995 the growth rates were 5.5 % and 6.3
%. Beginning with 1995 the market was almost saturated (see the figures in Table 4).
According to the Superintendency (1999, p. 117) 5,959 affiliates (both salaried and self -
employed) joined the system in September 1998 while 59,854 affiliates changed from one
AFP to another during that same month.
Also, barriers to entry or to exit a market play a significant role for competition . However,
neither absolut cost advantages (e.g. in acquiring capital via close connections to a large bank)
nor economies of scale or scope are of importance in this industry. Therefore, only advantages
of product differentiation may be of relevance. Thes e advantages are related to preferences of
customers for known products, or to brand loyalty which can be built up by marketing and
other services. Important advantages can also result from distribution channels or networks.
These investments are product s pecific and can be viewed as sunk costs in case of a market
exit. Hence, this exit barrier is an entry barrier for newcomers. However, the partial or total
buying of the stock of contracts by mergers and acquisitions or of the distribution network are
possible. This can be seen clearly in this industry after the legal barriers to entry have been
lowered in 1983 and 1987.

50
Competition can be carried through with three different means: price, product (or quality) and
preferences. In highly regulated markets, p rices (i.e. contribution) and products (e.g. through
rate of return regulation and limits to investments) are almost irrelevant. Furthermore, the
commission structure of AFPs and the consequences for the individual rate of return are –
even for experts – not transparent. In those situations, the "fight for clients" goes via
"services" or selling efforts, taking into account that transferring from one AFP to another
does not imply any direct cost for the affiliates.
III.
Taken together, these arguments sup port the hypothesis that the market concentration will
first decrease and then – after the market reaches a certain degree of maturity – will increase.
To verify this hypothesis, the Herfidahl Index is used 1. This index (H(y)) shows clearly a
decrease from 0,216 to 0,125 in 1994. From 1995 the Herfindahl index (H(y)) increases. This
is also true for H(x) which measures the concentration by contributors: From 1990 this index
decreases from 0,203 to 0,178 in 1994, and then increases up to 0,207. Therefore, th e
hypothesis seems to be supported.
Given an observed value of H= H, one can ask, how many firms of equal size would be
necessary to generate the same level of concentration. This number is called "equivalent
number" of firms and is given by N=1/ H. This number allows comparisons among different
markets at a given point in time, and may suggest whether a given market is becoming more
or less concentrated. The results are given in Table A1. The numbers show that at the highest
eight equally large firms (with a market share of about 12.5 percent) could have served the
market giving the same decree of concentration.
1 The Herfindahl Index is defined by ∑= 2]Q/q[H i , i=1, ...,n, where q i is "output" of firm i, Q is total
"output" of the industry, the refore q i/Q is the "market (net) share" of firm i, n is the number of firms in the industry.
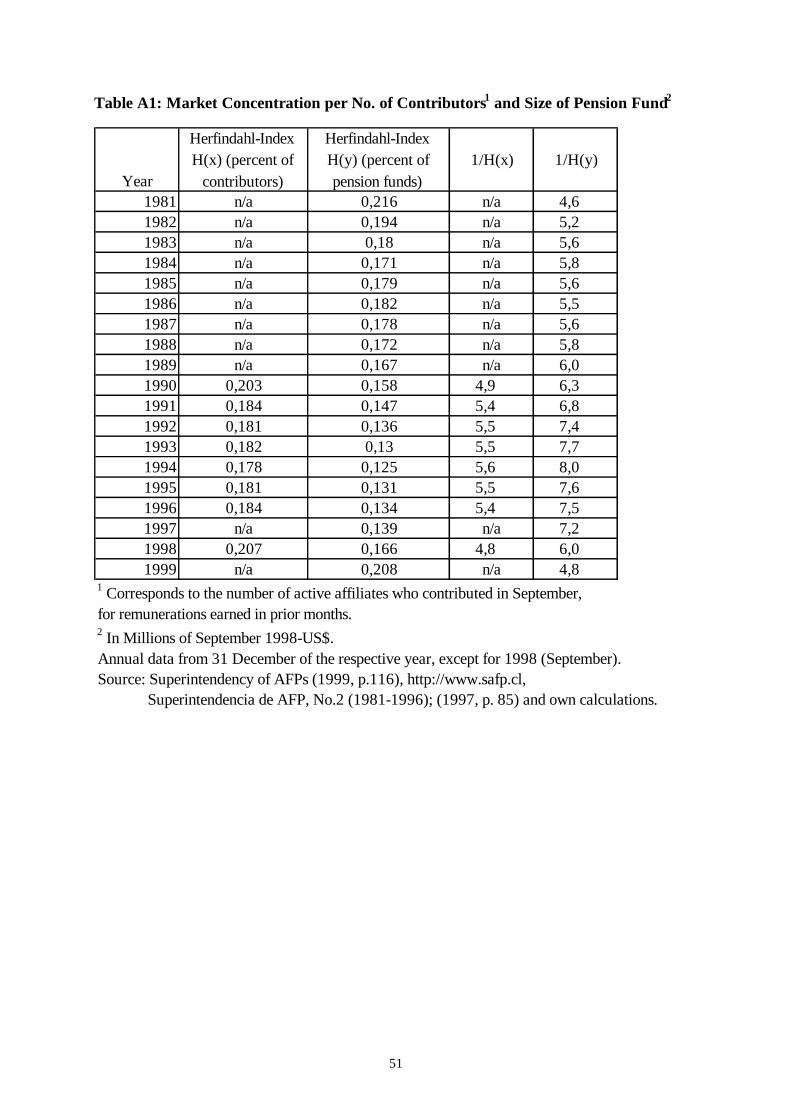
51
Table A1: Market Concentration per No. of Contributors1 and Size of Pension Fund2
Year
Herfindahl-Index H(x) (percent of
contributors)
Herfindahl-Index H(y) (percent of pension funds)
1/H(x) 1/H(y)
1981 n/a 0,216 n/a 4,6 1982 n/a 0,194 n/a 5,2 1983 n/a 0,18 n/a 5,6 1984 n/a 0,171 n/a 5,8 1985 n/a 0,179 n/a 5,6 1986 n/a 0,182 n/a 5,5 1987 n/a 0,178 n/a 5,6 1988 n/a 0,172 n/a 5,8 1989 n/a 0,167 n/a 6,0 1990 0,203 0,158 4,9 6,3 1991 0,184 0,147 5,4 6,8 1992 0,181 0,136 5,5 7,4 1993 0,182 0,13 5,5 7,7 1994 0,178 0,125 5,6 8,0 1995 0,181 0,131 5,5 7,6 1996 0,184 0,134 5,4 7,5 1997 n/a 0,139 n/a 7,2 1998 0,207 0,166 4,8 6,0 1999 n/a 0,208 n/a 4,8
1 Corresponds to the number of active affiliates who contributed in September, for remunerations earned in prior months.2 In Millions of September 1998-US$.Annual data from 31 December of the respective year, except for 1998 (September).Source: Superintendency of AFPs (1999, p.116), http://www.safp.cl, Superintendencia de AFP, No.2 (1981-1996); (1997, p. 85) and own calculations.
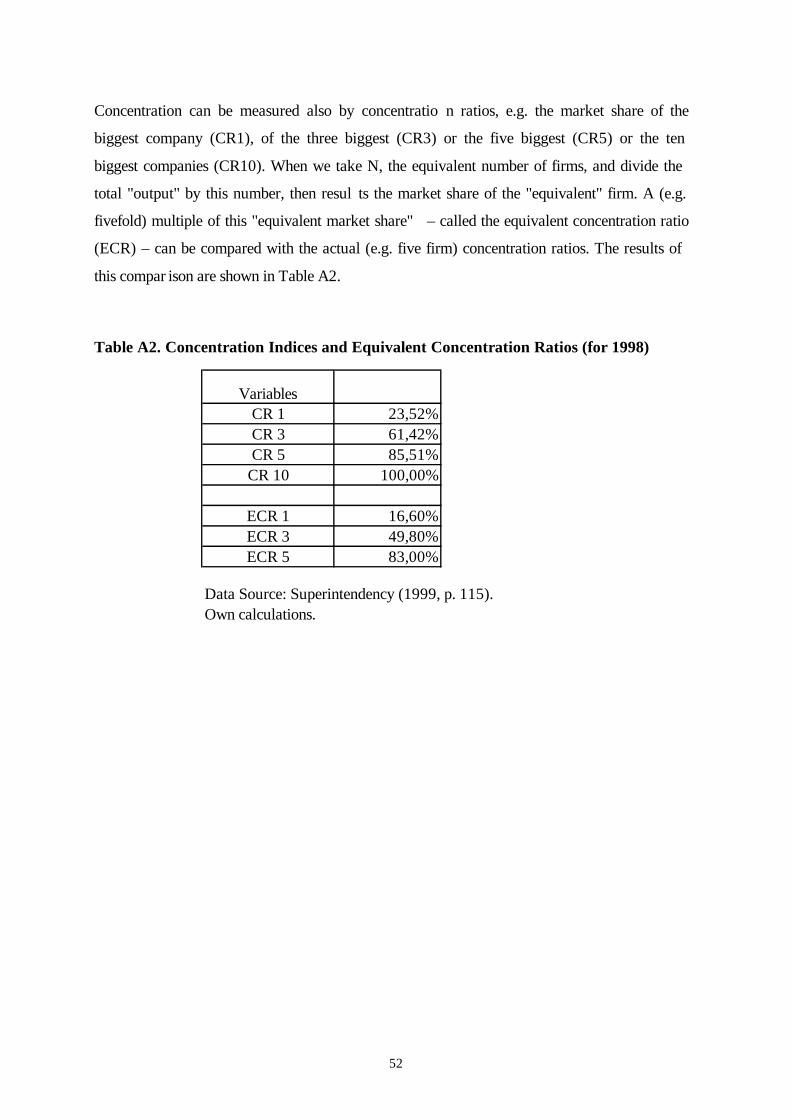
52
Concentration can be measured also by concentratio n ratios, e.g. the market share of the
biggest company (CR1), of the three biggest (CR3) or the five biggest (CR5) or the ten
biggest companies (CR10). When we take N, the equivalent number of firms, and divide the
total "output" by this number, then resul ts the market share of the "equivalent" firm. A (e.g.
fivefold) multiple of this "equivalent market share" – called the equivalent concentration ratio
(ECR) – can be compared with the actual (e.g. five firm) concentration ratios. The results of
this compar ison are shown in Table A2.
Table A2. Concentration Indices and Equivalent Concentration Ratios (for 1998)
CR 1 23,52%CR 3 61,42%CR 5 85,51%
CR 10 100,00%
ECR 1 16,60%ECR 3 49,80%ECR 5 83,00%
Data Source: Superintendency (1999, p. 115). Own calculations.
Variables

53
Appendix B: The Rates of Return of the AFPs
The figures given on page 15 (and Figure 5) reflect the rate of return (of a share 1) deflated by
UF (unit of account = unidad de fomento) as measured by the Superintendency of Pension
Funds Administrators (cf. Su perintendency, 1999, pp. 151 -152). Even this rate fluctuates very
much: between 30.9 percent in 1991 to -2.6 percent in 1995. Although, the average rate
amounts to 11.0 percent (over the years 1981 to 1998), the standard deviation is 9.36,
meaning that in two out of three cases the rate of return can be either 20.36 or 1.64 percent.
However, this aggregated (and weighted) average hides fluctuations within the year as well as
between the different Pensions Funds. Table B1 gives an overview of the yearly rate s of
return of the AFPs, the unweighted and the weighted average. Also, the standard deviations
and the coefficients of variation are calculated.
In any year, the standard deviations and the coefficients of variation are relatively small
indicating that th ere seems to be an "uniform investment strategy". This may be the result of
the "minimum rate of return" regulation 2, because fund managers who deviate too far from the
industry's average get "penalized" if downward and not appropriately rewarded if upward
deviations occur. This is evidenced in Table B2 which shows the diversification of the
investment portfolios of the AFPs for 1998. The only "real" difference can be seen in the
partition of bonds and other fixed -income securities between government and co rporate, but
not between stocks and bonds.
Furthermore, the last three rows of Table B1 show that the performance of the individual AFP
over the years, despite some relaxation with regards to investment limits, is also very similar:
it fluctuates between 1 1.4 (Cuprum) and 10.5 percent (Provida) for those AFPs which are
working from the beginning.
1 "The Pension Fund is expressed in a unit of measurement known as 'share' ... Changes in the value of the share
reflect the yield of the investments of Pension Funds" (Superintendency, 1999, p. 151, note 61). 2 The real rate of return of the AFP must not be lower than the lesser of (1) the average real rate of return of all
AFPs in the last 12 months minus 2 percentage points, and (2) 50 percent of the average real rate of return of all AFPs in the last 12 months. If there is an "excess return" this must be p laced in a fluctuation reserve, from which funds are drawn in case the return falls below the minimum rate. If this reserve plus the cash reserve (1% of total assets) are not high enough, the government makes up the difference and the AFP is wound up.

54
Table B1: Real (UF) Rates of Return of AFPs, 1982-1998
Ala
med
a
Con
cor-
dia
Cup
rum
Libe
rtado
r
Hab
itat
Invi
erta
Mag
iste
r
Pla
nvita
l
Pro
vida
San
C
risto
bal
Sta
. M
aria
S
umm
a
Uni
on
Pro
tec-
cion
Fu
turo
Apo
rta
Arm
oniz
a
Ban
guar
-di
a B
ansa
n-de
r Fo
men
ta
Gen
era
Pre
vipa
n
1982 29,8 30,1 25,4 23,1 25,6 25 27,6 24,4 29,5 27,5 30,2 28 1983 21,4 24,7 18,5 20,2 24,4 20,7 20,5 22,2 20,3 20,7 20,9 22,5 1984 4,4 2,1 3,2 3,3 2,7 3,4 5 3,5 4 3,9 3 2,8 1985 13 13,7 13,2 13,3 13,3 13,5 13 13,5 13 14,3 13,6 1986 12,7 15,5 13,5 12,5 11,9 12,4 11,5 11,8 11,8 12,4 13,4 10,6 1987 4,8 8,5 5,8 5,5 5,5 4,5 5,2 5,1 5,1 5,2 6,3 7 1988 7,3 7,8 6,9 6,4 8,7 7,1 7,2 6,3 5,9 6,4 7,1 7,7 1989 7 9,5 8,2 6,8 9,1 6,9 8,9 5,9 6,5 7,3 8,7 8,2 4 1990 16,2 18,2 16,6 15,9 19,4 15,8 18,7 13,3 14,6 18,1 17,2 17,7 17 1991 28,7 30,4 30,8 30,4 27,9 34,3 32 25,8 30,1 33,1 30,9 32,7 31,2 1992 2,8 3,6 3,4 2,8 0,9 3 3,6 3,1 2,9 3 2,8 4,2 4,1 1993 16,7 16,1 16,3 15,9 16,7 17 15,9 16,3 16,9 16,4 16,8 14,6 15 15,8 14,91994 18,6 19,5 17,5 18,1 18,2 19,9 17,9 18 17,1 18,5 18,8 17,2 15,7 18,8 21,1 17,4 18,81995 -2,4 -1,8 -2,8 -3,3 -2,6 -2,5 -3,3 -2,1 -2,6 -2,1 -4,6 -2,6 -3,1 -2 -2,8 1996 3,6 3,8 3,5 3,3 3,4 3,7 3,2 3,5 3,5 4,1 3,3 2,9 1997 4,3 5,7 4,4 4,7 4,6 4,5 4,7 4,6 4,7 3,9 3,8 6,2 1998 -2,7 0,4 -1,4 -1 -0,1 -0,8 -1,9 -2,1 -1,9 Mean
13,02 11,4 13,75 11,0 13,3 11,1 11,3 10,5 10,73 11,2 10,8 9,82 11,9 0,88 7,94 6,85
St. Dev.
9,74 9,08 7,87 9,28 8,5 9,87 9,44 8,83 9,62 9,95 8,43 9,25 10,9 3,14 7,96 8,83
St. D. /Mean
0,75 0,8 0,57 0,84 0,64 0,89 0,84 0,84 0,9 0,89 0,78 0,94 0,91 3,58 1 1,29
Source: Superintendencia de AFP, Monthly Bulletin, various issues.

55
Table B2: Investment Portfolio Diversification by Type of Instrument and AFP, 1998
Total Portfolio
Bonds and other Stocks Fixed -Income Securities
AFP Chilean Non- Total Govern- Corpo- Non- Total Others Cash and Chilean Stocks ment rate Chilean Bonds Equi- valents
Aporta Fomenta 12.89 0.00 12,89 38.90 41.58 1,35 81.83 5.25 0.03 Cuprum 15.40 0.00 15.40 44.88 31.25 5,50 81.63 2.89 0.08 Habitat 14.91 0.01 14.92 43.87 34.46 4,48 82.81 1.74 0.53 Magister 17.03 0.00 17,03 33.54 41.97 1,56 77.01 5.52 0.38 Planvital 15.61 0.00 15.61 40.26 36.28 4,46 81.00 3.07 0.32 Protección 14.68 0.00 14.68 34.18 42.34 5.97 82.49 2.81 0.02 Provida 14.72 0.00 14.72 38.31 36.62 6.82 81.75 3.37 0.16 Santa Maria 14.73 0.00 14.73 39.81 36.01 6.12 81.94 3.29 0.04 Summa Bansander 14.68 0.00 14.68 43.29 33.03 6.00 82.32 2.98 0.02 Mean 14.90 0.00 14.90 40.96 35.44 5.63 82.03 2.88 0.19 Variance 1.18 0.00 1.18 16.05 16.38 3.96 2.95 1.45 0.04 1 As a percentage of total Portfolio assets.
Source: Superintendencia de AFP, Bulletino Estadistico, no. 148 (1999), pp. 221 -223.

56
B3: Pension Funds Portfolio Evolution
1981 1982 1983 1984 1985 1986 1987 1988 1989 1990 1991 1992
Government 28,10% 26,00% 44,50% 42,10% 42,40% 46,60% 41,40% 35,40% 41,50% 44,10% 38,30% 49,90%61,90% 26,60% 2,70% 12,20% 20,40% 22,90% 27,40% 28,50% 20,80% 16,30% 11,70% 9,40%
Mortgage Bonds 9,40% 46,00% 50,70% 42,90% 35,20% 25,50% 21,30% 20,60% 17,70% 16,10% 13,40% 14,20%0,00% 0,00% 0,00% 0,60% 0,40% 0,30% 0,70% 1,00% 0,70% 1,10% 1,50% 1,60%
Corporate Stocks 0,00% 0,00% 0,00% 0,00% 0,00% 3,80% 6,30% 8,10% 10,10% 11,30% 23,80% 24,00%Corporate Bonds 0,60% 0,60% 2,20% 1,80% 1,10% 0,80% 2,60% 6,40% 9,10% 11,10% 11,10% 9,60%Shares of Investment Funds 0,00% 0,00% 0,00% 0,00% 0,00% 0,00% 0,00% 0,00% 0,00% 0,00% 0,00% 0,20%Foreign Instruments 0,00% 0,00% 0,00% 0,00% 0,00% 0,00% 0,00% 0,00% 0,00% 0,00% 0,00% 0,00%Cash 0,00% 0,00% 0,00% 0,50% 0,50% 0,10% 0,40% 0,00% 0,00% 0,10% 0,10% 0,10%Total 100% 100% 100% 100% 100% 100% 100% 100% 100% 100% 100% 100%
1In percentage up to December of each year.
Source: Superintendencia de AFP (1997, p. 63).
Deposits and Papers of Financial Institutions
Bonds and equities of Financial Institutions
Instruments

57
Appendix C: An Overlapping-Generations-Model with Different Pension Systems (and Uncertainty)1
The model follows the structure of the OG -model of Blanchard and Fisher (1989, chap. 3). In particular three questions will be analyzed here: First, the in troduction of a fully funded pension system and its effects on private savings. Second, the effects of a transition from a PAYG to a FF system on private savings; third, the welfare implications of the repayment of the implicit debt of the existing pension system, and the burden of the transition period.
All of these problems are analyzed under the favourable assumption, that the market rate of return of capital is higher than the natural rate of growth (i.e. productivity growth plus population growth) or equivalently labor income growth. I. The Basic Model The economy consists of individuals and firms. The individuals live for two periods and consume c1,t in their first period of life, and c 2,t+1 in their second period of life. Since there is uncertainty with respect to the future, the utility of an individual over his "life cycle" is
),c(u(E)c(u t,t, 121 +−++ 1)1 θ
with θ > 0 as the subjective time discount rate, E the expectations operator, and u` > 0, and u'' < 0.
The individuals work only in their first life period: They offer (one unit of) labor inelastically and receive the wage w t > 0. They consume part of their labor income and save the remainder, invest their savings to finance their consumption in their second life period.
The savings of the "young workers" i n period t built up the capital stock, which is used in period t+1 together with labor supplied by the new young workers. The number of individuals born at the beginning of period t and working in this period is N t. The growth of the (working) population is given exogenously with the rate n, so that N t=(1+n)tN0. The growth factor of aggregate (labor) income is hence ttttt Nw/NwG ⋅≡ +++ 111 .
The firms act competitively and produce outpout using a neoclassical production function (i.e. the INADA conditions ap ply). Output per worker is then given by y t=f(kt), with k t measuring the capital-labor-ratio or capital per head. The firms take the wage rate and the rental price (cost) of capital (r t) as exogenously given while maximizing their profits.
The maximization problem of a representative individual is hence:
Max )c(uE)c(u t,t, 121 +−++ 1)(1 θ
s.t. ttt, wsc =+1
).r(1sc 1tt1t2, ++ +=
Denoting by tV the utility obtained by solving the above problem, the first order condition is
1 To introduce uncertainty in an interesting sense is beyond the scope of this Appendix. Therefore it is assumed that there are productivity shocks that have common effects (e.g. with a Cobb -Douglas technology) on output, wages, and capital income, i.e. all these variables are perfectly correlated. Therefore, there is no advantage of risk sharing between generations. Furthermore, when the productivity shocks are identically and independently distributed, this is also true for the exogeneous as well as for the endogeneous variables. In par ticular, the savings propensity is independent of time and of the state of nature. See, however, Bohn (1997).

58
(1) 01)(1)1 1t1 =+++−−= ++
− ))r(u'(sr(E)sw('udcdV
ttttt
t1θ
implicitly giving the following "savings function":
(2) ),r,w(ss ttt 1+=
where 0 < sw < 1, but the sign of s r is ambiguous because of the opposite income and substitution effect.
The result of the maximation problem of the firms yields th e following first-order conditions
(3) tttt w)k('fk)k(f =−−
and .r)k('f tt =
Equilibrium in the goods market requires that demand for and supply of goods are equal or equivalently that the demand for capital by firms equals the supply of capital by consumers
,K)r,w(sNKK tttttt −⋅=− ++ 11
where the left hand side shows net -investment as a change in the capital stock, and the right hand side shows the savings of the young generation minus the de -savings of the old. Eleminating kt and division by Nt results in
(4) ).rw(sk)n( t,tt 11 ++ =+1 II. An Economy with a Fully Funded Pension System
In a fully funded pension system, the state (or the pension funds) collect in period t the premium dt from the young workers and invests the sum in the capital stock. In the sa me period the funds pay pensions to the retirees b t=(1+rt)dt-1 whose premium were invested in period t -1. Equations (1) and (4) now change as follows:
(5) 0))r)(1ds(('u)((E))ds(w('u 1tttttt =++++−+− ++−
1t1 r1)1 θ
(6) .k)n(ds ttt 1++=+ 1
A comparison between eq. (1) and (2) and eq. (5) and (6) shows that when k t fulfils these eq. then it fulfils also those eq., as long as d t < (1+n)kt+1.
Proposition 1: As long as the premium of a fully funded pension systems is not higher than the voluntary savings which would exist when there is no pension system, the introduction of a fully funded system does not change the level of privat savings.
All individuals receive the same rate of return on the premium as well as on their savings, therefore, they are indifferent towards the allocation betwe en st and dt. They adjust only their "voluntary" saving s to take into account the "forced savings" d.
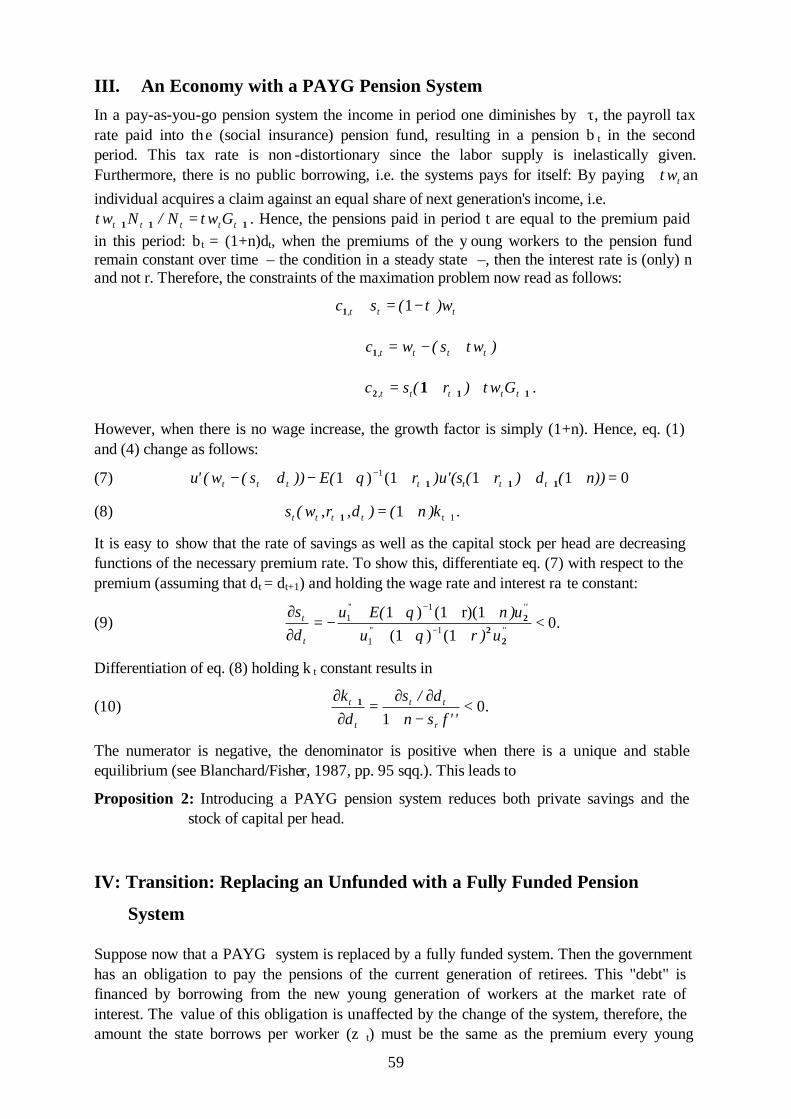
59
III. An Economy with a PAYG Pension System In a pay-as-you-go pension system the income in period one diminishes by τ, the payroll tax rate paid into th e (social insurance) pension fund, resulting in a pension b t in the second period. This tax rate is non -distortionary since the labor supply is inelastically given. Furthermore, there is no public borrowing, i.e. the systems pays for itself: By paying twτ an individual acquires a claim against an equal share of next generation's income, i.e.
111 +++ = ttttt GwN/Nw ττ . Hence, the pensions paid in period t are equal to the premium paid in this period: b t = (1+n)dt, when the premiums of the y oung workers to the pension fund remain constant over time – the condition in a steady state –, then the interest rate is (only) n and not r. Therefore, the constraints of the maximation problem now read as follows:
ttt, w)(sc τ−=+ 11
)ws(wc tttt, τ+−=1
112 1 ++ ++= tttt,t Gw)r(sc τ .
However, when there is no wage increase, the growth factor is simply (1+n). Hence, eq. (1) and (4) change as follows:
(7) 011(1)1 1 =+++++−+− +++− n))(d)r()u'(sr(E))ds(w('u ttttttt 111θ
(8) .k)n()d,r,w(s tttt 1t1 ++ +=1
It is easy to show that the rate of savings as well as the capital stock per head are decreasing functions of the necessary premium rate. To show this, differentiate eq. (7) with respect to the premium (assuming that dt = dt+1) and holding the wage rate and interest ra te constant:
(9) 0.(1)(1
r)(1(1)11''
1
1''1 <
+++++++−=
∂∂
−
−
''
''
t
t
u)ruu)n(Eu
ds
22
2
θθ
Differentiation of eq. (8) holding k t constant results in
(10) ''fsn
d/sd
k
r
tt
t
t
−+∂∂=
∂∂ +
11 < 0.
The numerator is negative, the denominator is positive when there is a unique and stable equilibrium (see Blanchard/Fisher, 1987, pp. 95 sqq.). This leads to
Proposition 2: Introducing a PAYG pension system reduces both private savings and the stock of capital per head.
IV: Transition: Replacing an Unfunded with a Fully Funded Pension
System
Suppose now that a PAYG system is replaced by a fully funded system. Then the government has an obligation to pay the pensions of the current generation of retirees. This "debt" is financed by borrowing from the new young generation of workers at the market rate of interest. The value of this obligation is unaffected by the change of the system, therefore, the amount the state borrows per worker (z t) must be the same as the premium every young

60
worker had to pay under the old PAYG system (d t). Assuming that the interest rate is unaffected by this system's change, eq. (1) and (4) become
(11) 01)1)1 1 =++++−+− ++− ))r(zu'((sr((E))zs(w('u ttttttt 11θ
(12) .k)n(s tt 1++= 1
Assuming dt = dt+1, eq. (7) and (8) are identical to eq. (11) and (12) except that the portion of savings going to finance the consumption of the current generation of retirees now earnes a rate of return of r t+1, rather than n. This increase (throughout it is assumed that r > n) generates a pure income effect that will tend to decrease current period savings.
Proposition 3: The transition from an unfunded PAYG pension system to a fully funded pension system generates an immediate income effect that lowers private savings.
The state (or the pension funds) has to refloat continuously this debt, when there is no "fiscal consolidation". Hence, to repay in period t+1 the amount borrowed in period t, the state has to borrow z t+1 = zt(1+rt+1)/(1+n) from each young worker in period t+1. The first -order conditions change to
(13) ))r)(zs(('u)r(E))zs(w('u ttttttt 2112111 ++++−
+++ ++⋅++=+− 1(1)1 1θ
(14) .k)n(s tt 21 ++ += 1
Assuming r > n, the debt per worker increases in every period, hence the savings for capital accumulation will (in partial equilibrium) decrease resulting in a reduced capital stock (in each future period relative to what it would otherwise have been). Eq. (13) shows that the increases in z are fully offset by decreases in s, until voluntary savings disappear (given that individuals are indifferent between buying government bonds and investing in capital stock).
However, this is a partial equilibrium result, because the in terest rate was held constant. When the capital stock falls, the interest rate will increase and the wage rate will decrease, both trends will influence the level of savings.
The answer is obtained by differentiating eq. (14) with respect to z t+1, to obta in
.)k(''fsn
d/sdzdk
tr
tt
t
t
2
11
1
2
+
++
+
+
−+∂∂=
1
As before (see eq. 10) the numerator is negative and the denominator positive when 0≥rs so that the equilibrium is unique and stable. Hence, an increase in government borrowing per worker decreases the stock of capital in equilibrium.
Proposition 4: Financing the transition (only) by borrowing (e.g. by "recognition bonds") leads to a growing debt per head since z t increases at the rate (1+r)/(1+n). Furthermore, the decrease of the capital stock will lead to a n increase in the interest rate and generate additional savings, in the end the explosive path of z t will exhaust output. Therefore, some adjustment in the fiscal balance will be required to ensure stability of the economy.