PARTIAL BRIQUETTING vs DIRECT ADDITION OF BIOMASS...
29
1 PARTIAL BRIQUETTING vs DIRECT ADDITION OF BIOMASS IN COKING BLENDS M.G. Montiano, E. Díaz-Faes, C. Barriocanal* Instituto Nacional del Carbón, INCAR-CSIC, Apartado 73, 33080 Oviedo. Spain *Corresponding author. Tel: +34 985 11 90 90; Fax:+34 985 29 76 62; e.mail address: [email protected] ABSTRACT In this work partial briquetting is employed as a means of biomass densification to allow for biomass inclusion in coking coal blends. The effect of increasing the bulk density was evaluated by comparison with direct addition. Two briquettes of different composition were studied. The influence of the briquettes on the Gieseler plasticity of the coals was determined. It was found that the effect of the binder was not enough to compensate for the decrease in plasticity produced by the inert components of the briquettes. Carbonizations were carried out in a movable wall oven of 17 kg capacity and the quality of the cokes produced was tested by evaluating their mechanical strength, coke reactivity to CO 2 and post-reaction strength. In addition, the porosity and ash chemistry of the cokes was determined and an attempt was made to establish a relation between these results and the quality of the cokes. Coke quality results suggest that 10-15 wt% of briquettes containing biomass can be included in coking blends. Keywords: waste sawdust, coal, briquettes, coking, coke
Transcript of PARTIAL BRIQUETTING vs DIRECT ADDITION OF BIOMASS...
1
PARTIAL BRIQUETTING vs DIRECT ADDITION OF BIOMASS IN COKING BLENDS M.G. Montiano, E. Díaz-Faes, C. Barriocanal*
Instituto Nacional del Carbón, INCAR-CSIC, Apartado 73, 33080 Oviedo. Spain *Corresponding author. Tel: +34 985 11 90 90; Fax:+34 985 29 76 62; e.mail address:
[email protected] ABSTRACT In this work partial briquetting is employed as a means of biomass densification to allow for
biomass inclusion in coking coal blends. The effect of increasing the bulk density was
evaluated by comparison with direct addition. Two briquettes of different composition were
studied. The influence of the briquettes on the Gieseler plasticity of the coals was
determined. It was found that the effect of the binder was not enough to compensate for the
decrease in plasticity produced by the inert components of the briquettes. Carbonizations
were carried out in a movable wall oven of 17 kg capacity and the quality of the cokes
produced was tested by evaluating their mechanical strength, coke reactivity to CO2 and
post-reaction strength. In addition, the porosity and ash chemistry of the cokes was
determined and an attempt was made to establish a relation between these results and the
quality of the cokes. Coke quality results suggest that 10-15 wt% of briquettes containing
biomass can be included in coking blends.
Keywords: waste sawdust, coal, briquettes, coking, coke
2
1. Introduction
There is general concern about the generation of greenhouse gases due to
anthropogenic causes such as the use of fossil fuels. The steel industry is a major contributor
to CO2 emissions because of its use of coal [1-3]. On the other hand, the international coal
market has experienced considerable volatility in recent years, giving rise to a notorious
variability in coal prices and problems related to supply.
The use of additives is a common practice in cokemaking in the search for alternative
materials with which to make low-cost coking blends and to improve the coking
characteristics of a specific coal blend [4-8]. With these considerations in mind the inclusion
of biomass in coking blends has been the subject of a number of recent studies [9-12].
The co-carbonization of coal blends with additives has been observed to modify the
coking properties of coals and the quality of the resulting cokes significantly [5, 13]. In the
present work, the effects of adding alternative raw materials to coking coals have been
assessed. The possibility of including materials different from coking coals in coke ovens is
of great interest because of the lower cost of these materials and also as a way to overcome
the problems related to the shortage of coking coals. In view of the immense importance of
the plastic stage on the properties of the final coke, the effect of biomass on coal plastic
properties has been investigated by high-temperature small-amplitude oscillatory-shear
(SAOS) rheometry and Gieseler plasticity test to determine whether the use of a specific
biomass can produce a reduction in coal plastic properties [10, 14].
Some research works have already been published on the inclusion of biomass in
coking blends [1, 11, 12] but to our knowledge this is the first study on the use of partial
briquetting to allow the inclusion of biomass in coking blends. The procedure is based a
combination of two factors: 1. increasing the bulk density of the charge and 2. using the
binder present in the briquettes to restore the coal’s plastic properties.
It is generally recognized that coke reactivity and post-reaction strength are the
parameters that should be used to determine coke quality. Therefore a study of the reactivity
of the biomass will contribute greatly to assess the effect of using biomass as additive on the
3
quality of the coke produced. Biomass-derived chars are more reactive than coal chars. This
higher reactivity is thought to derive from their porous structure and the presence of inherent
catalytic elements such as K that have a strong catalytic effect [15-18]. When using a highly
reactive coke in a blast furnace it is important to bear in mind that lowering the temperature
of the thermal reserve zone will decrease the CO/CO2 ratio and increase the gas utilization
ratio. This will result in a lower reducing agent rate which is considered to be an effective
method for decreasing the emission of carbon dioxide in steel works [19, 20]
The aim of the present work is to study the effect of addition of biomass on the quality
of the coke produced from two coking coals of different quality. The effect of densifying the
charge on the quality of the coke produced by adding briquettes was compared with the
effect of direct addition of the briquette components.
2. Experimental
2.1. Materials and methods
Waste chestnut sawdust (SC1), a non-coking coal of high rank (K) normally used as
pulverized injection coal (K), two coking coals (P and M) and coal tar (T) were selected as
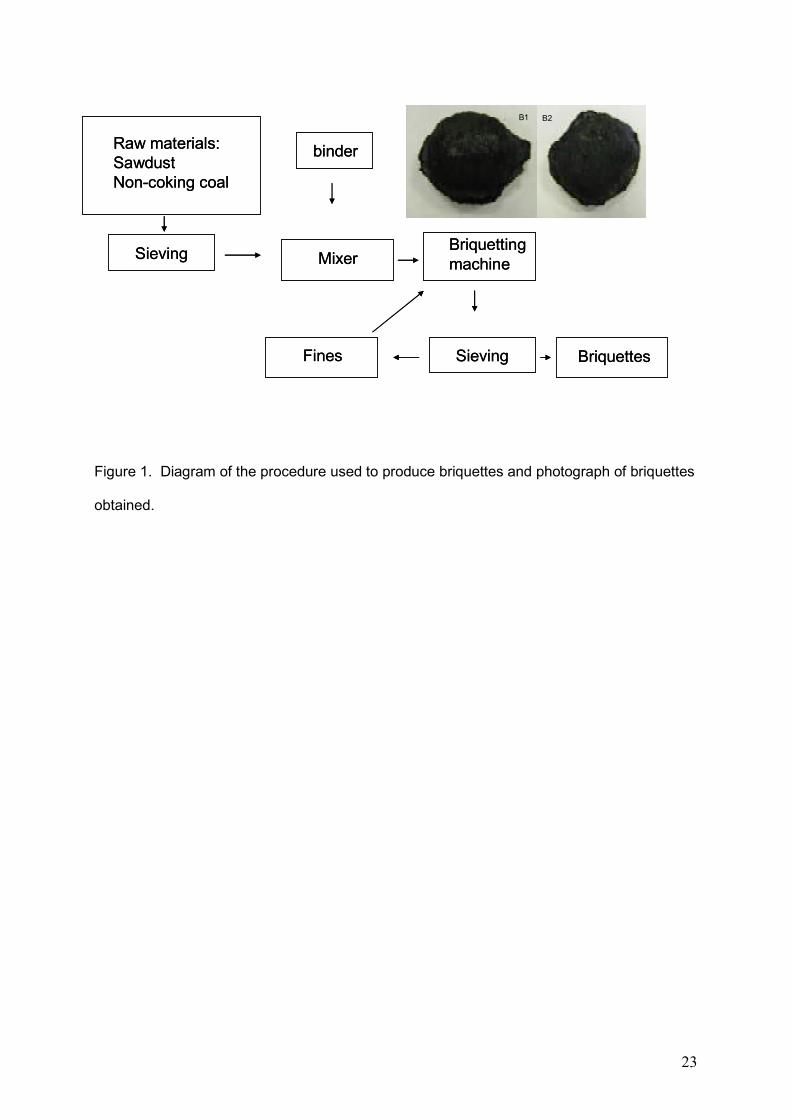
materials for the experiments. Briquettes were prepared by using a roller press consisting of
two rollers rotating in opposite directions at the same speed [21]. The material was squeezed
through the gaps between the two rollers. The briquettes obtained had an ellipsoidal shape,
with 46 and 42 mm long axes and a weight of around 23 g. Two briquettes with different
compositions were produced: B1 and B2. A diagram of the procedure used for making
briquettes is presented in Figure 1.
Proximate analyses were performed following the ISO562 and ISO1171 standard
procedures for the volatile matter and ash content, respectively. An elemental analysis was
carried out using a LECO CHN-2000 for C, H and N, a LECO S-144 DR for sulphur and a
LECO VTF-900 for the direct determination of oxygen. The inorganic matter composition of
each sample was analysed by X-Ray fluorescence (XRF) in a SRS 3000 Bruker
spectrometer in accordance with the ASTM D4326-04 standard procedure.
4
2.2. Assessment of coal thermoplastic properties
The thermoplastic properties of the base coal and of the blends containing 2, 5, 10
and 15 wt% of each briquette were measured by means of the Gieseler test (ASTM D2639-
74). The Gieseler fluidity of the briquettes was also measured. A 5 g sample with a size <
0.425 mm was heated while a constant torque was applied to a stirrer placed in the crucible
containing the coal charge. The parameters measured by this test were: (i) softening
temperature, Ts; (ii) the temperature of maximum fluidity, Tf; (iii) resolidification temperature, Tr;
(iv) plastic range, Tr-Ts, which is defined as the difference between the resolidification and
softening temperatures; and (v) maximum fluidity, MF, expressed as dial divisions per minute
(ddpm).
2.3. Carbonization experiments and coke quality evaluation
Carbonization tests were carried out in a movable wall oven of approximately 17 kg
capacity (MWO17) [8]. The dimensions of the oven are 250 mm L x 165 mm W x 790 mm H.
A load cell was mounted on the movable wall to measure the force exerted on the wall during
carbonization. A programmable controller was used to control the oven temperature. The
temperature at the centre of the coal charge was monitored by means of a thermocouple
connected to a computer. The coal was charged when the oven had reached 1100 °C. The
temperature of the wall was kept constant throughout the test. The coke was pushed out 15
min after the centre of the charge had reached 950 °C. The coking time lasted approximately
3.5 hours. The moisture of the charge was fixed at 5 wt%. The carbonizations were carried
out in two ways: 1. by means of a partial briquetting procedure in which a mixture of the coal
and a percentage of the briquettes was carbonized in the carbonization oven and 2. by direct
addition where a mixture of the coal and the corresponding percentages of briquette
components (binder, biomass, non-coking coal, coking coal) were directly added. Special
care was taken with direct addition to ensure the homogeneity of the mixture to be
carbonized. The following nomenclature was used: B1 and B2 represent partial briquetting
procedure and B1D and B2D direct addition of the components of briquettes B1 and B2
respectively.

5
The cold mechanical strength of the cokes produced was assessed by the JIS test
(JIS K2151 standard procedure). After the test the coke was sieved and the DI150/15 index
was calculated from the amount of coke with a particle size greater than 15 mm. The coke
reactivity and mechanical strength after reaction were assessed by means of the NSC test
(ASTM D5341 standard procedure). Two indices were derived from this test i.e. the CRI
index which represents the loss of weight of a 200 g sample of coke with size between 19-
22.4 mm after reaction with CO2 at 1100 °C for two hours and the CSR index which
represents the percentage of partially-reacted coke that remains on the 9.5 mm sieve after
600 revolutions in a standardized drum. The relationship between the CSR values obtained
in a MWO of 17 kg capacity and those obtained in a MWO of 300 kg has been published
recently [22].
2.4. Determination of the porous structure of the cokes
The true density (ρHe) of the cokes was measured by means of helium pycnometry in
a Micromeritics Accupyc 1330 Pycnometer. Their apparent density (ρAp) was determined
with Hg (ρHg) using coke samples with a particle size between 1-3 mm, and water (ρH2O). The
ρH2O was determined by water displacement using a 300 g coke sample with a particle size
of 19–22.4 mm. From the true and apparent densities, the open porosity was calculated by
means of the following equation:
(1)
3. Results and discussion
3.1. Characteristics of materials used
The results of the proximate and elemental analyses of the raw materials have been
included in Table 1. The base coals P and M have a volatile matter content of 22.7 and 24.5
wt% db respectively and an ash content of around 8 wt% db. The sawdust (SC1) presents a
high volatile matter content but a low ash and negligible sulphur content. The PCI coal (K)
has a low volatile matter content and sulphur and ash contents similar to that of the base
100)/(
)/(1(%)
3
3
⋅
−=
cmg
cmg
He
Ap
ρ
ρε
6
coal. The C/H and C/O atomic ratio is low for sawdust due respectively to its low carbon
content and high oxygen content. The composition of the briquettes appears in Table 2 along
with the amount of the briquette components that each percentage of briquettes represents
in the whole blend. These percentages were used for the tests carried out with direct
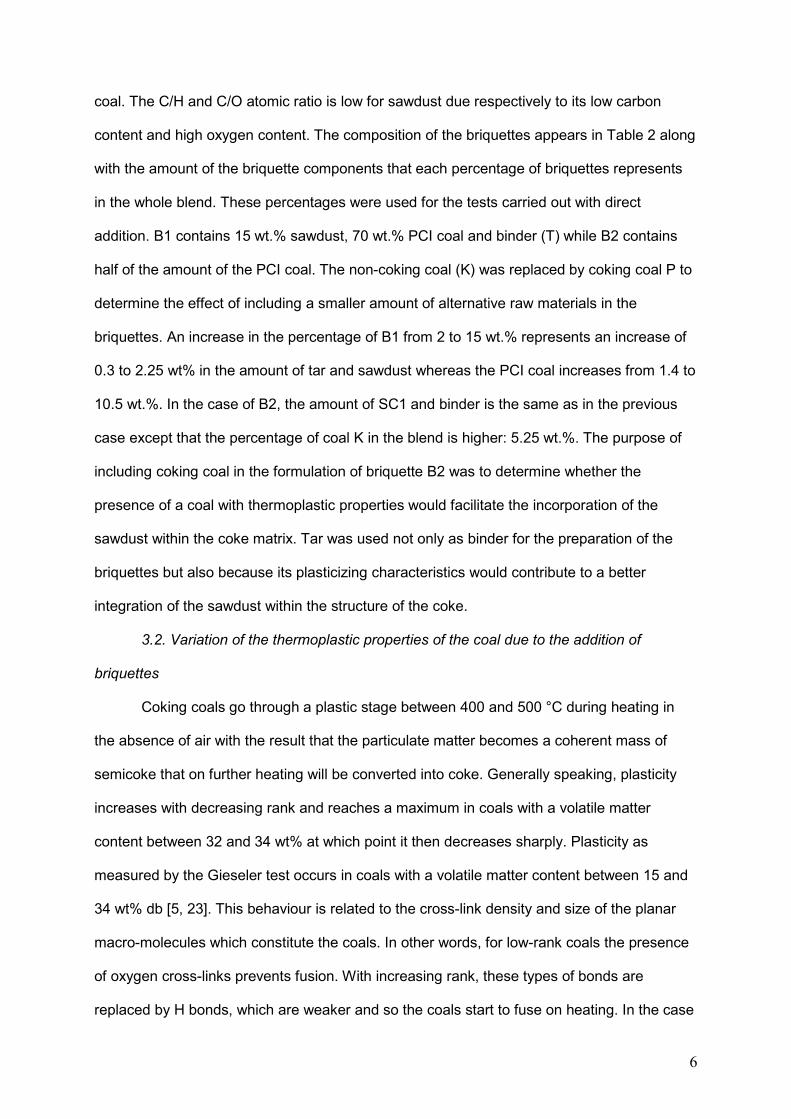
addition. B1 contains 15 wt.% sawdust, 70 wt.% PCI coal and binder (T) while B2 contains
half of the amount of the PCI coal. The non-coking coal (K) was replaced by coking coal P to
determine the effect of including a smaller amount of alternative raw materials in the
briquettes. An increase in the percentage of B1 from 2 to 15 wt.% represents an increase of
0.3 to 2.25 wt% in the amount of tar and sawdust whereas the PCI coal increases from 1.4 to
10.5 wt.%. In the case of B2, the amount of SC1 and binder is the same as in the previous
case except that the percentage of coal K in the blend is higher: 5.25 wt.%. The purpose of
including coking coal in the formulation of briquette B2 was to determine whether the
presence of a coal with thermoplastic properties would facilitate the incorporation of the
sawdust within the coke matrix. Tar was used not only as binder for the preparation of the
briquettes but also because its plasticizing characteristics would contribute to a better
integration of the sawdust within the structure of the coke.
3.2. Variation of the thermoplastic properties of the coal due to the addition of
briquettes
Coking coals go through a plastic stage between 400 and 500 °C during heating in
the absence of air with the result that the particulate matter becomes a coherent mass of
semicoke that on further heating will be converted into coke. Generally speaking, plasticity
increases with decreasing rank and reaches a maximum in coals with a volatile matter
content between 32 and 34 wt% at which point it then decreases sharply. Plasticity as
measured by the Gieseler test occurs in coals with a volatile matter content between 15 and
34 wt% db [5, 23]. This behaviour is related to the cross-link density and size of the planar
macro-molecules which constitute the coals. In other words, for low-rank coals the presence
of oxygen cross-links prevents fusion. With increasing rank, these types of bonds are
replaced by H bonds, which are weaker and so the coals start to fuse on heating. In the case
7
of higher rank coals, the aromaticity increases along with the macromolecular size and
covalent cross-linkages which in turn lead to a decrease in fluidity [23-25]. This property is
essential for the development of the structure and properties of cokes and for this reason the
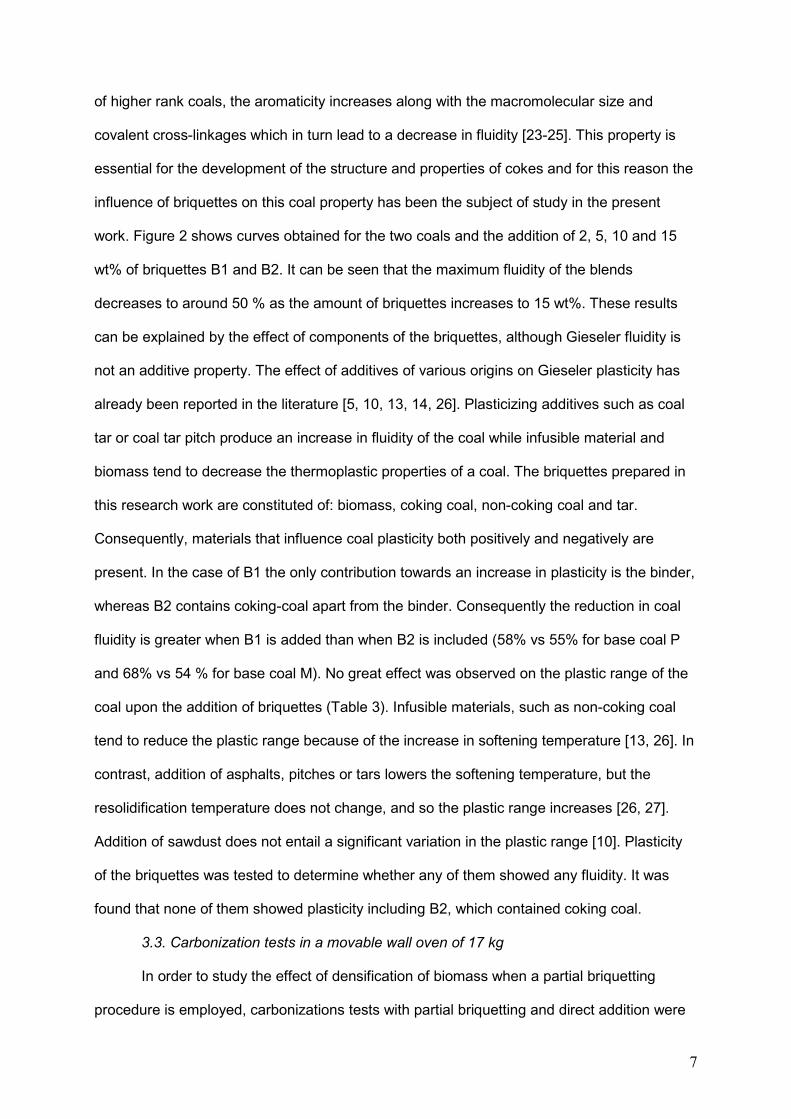
influence of briquettes on this coal property has been the subject of study in the present
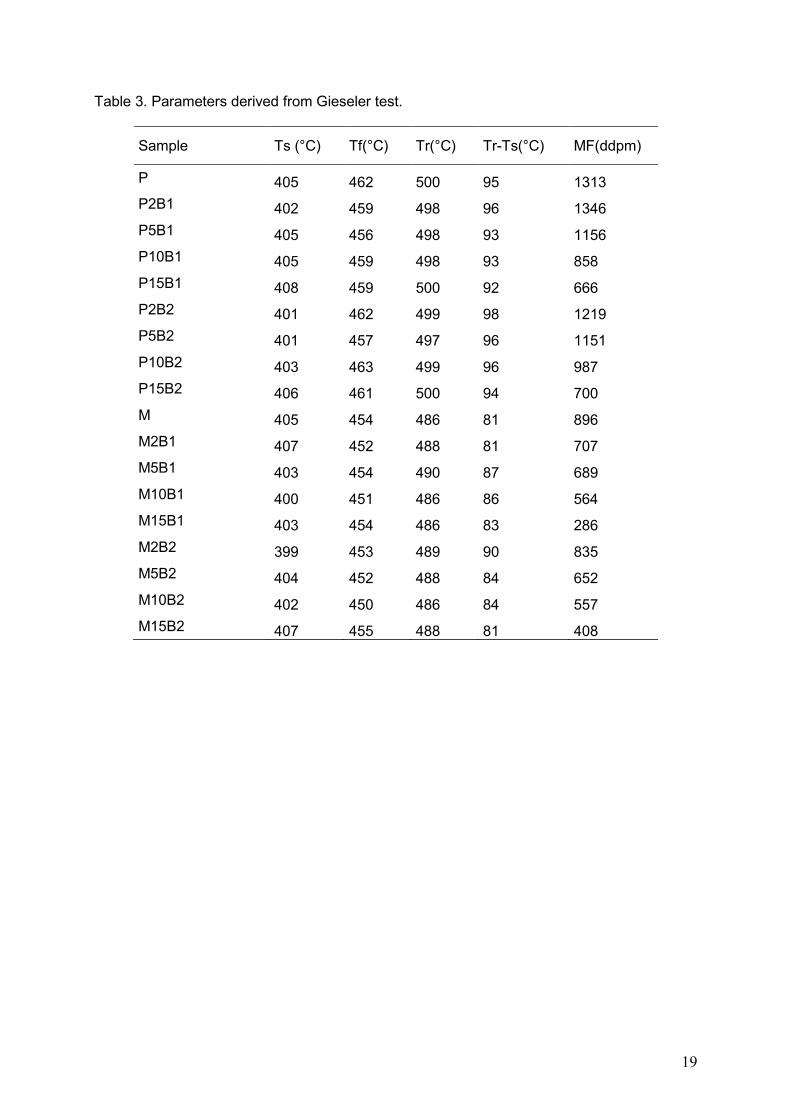
work. Figure 2 shows curves obtained for the two coals and the addition of 2, 5, 10 and 15
wt% of briquettes B1 and B2. It can be seen that the maximum fluidity of the blends
decreases to around 50 % as the amount of briquettes increases to 15 wt%. These results
can be explained by the effect of components of the briquettes, although Gieseler fluidity is
not an additive property. The effect of additives of various origins on Gieseler plasticity has
already been reported in the literature [5, 10, 13, 14, 26]. Plasticizing additives such as coal
tar or coal tar pitch produce an increase in fluidity of the coal while infusible material and
biomass tend to decrease the thermoplastic properties of a coal. The briquettes prepared in
this research work are constituted of: biomass, coking coal, non-coking coal and tar.
Consequently, materials that influence coal plasticity both positively and negatively are
present. In the case of B1 the only contribution towards an increase in plasticity is the binder,
whereas B2 contains coking-coal apart from the binder. Consequently the reduction in coal
fluidity is greater when B1 is added than when B2 is included (58% vs 55% for base coal P
and 68% vs 54 % for base coal M). No great effect was observed on the plastic range of the
coal upon the addition of briquettes (Table 3). Infusible materials, such as non-coking coal
tend to reduce the plastic range because of the increase in softening temperature [13, 26]. In
contrast, addition of asphalts, pitches or tars lowers the softening temperature, but the
resolidification temperature does not change, and so the plastic range increases [26, 27].
Addition of sawdust does not entail a significant variation in the plastic range [10]. Plasticity
of the briquettes was tested to determine whether any of them showed any fluidity. It was
found that none of them showed plasticity including B2, which contained coking coal.
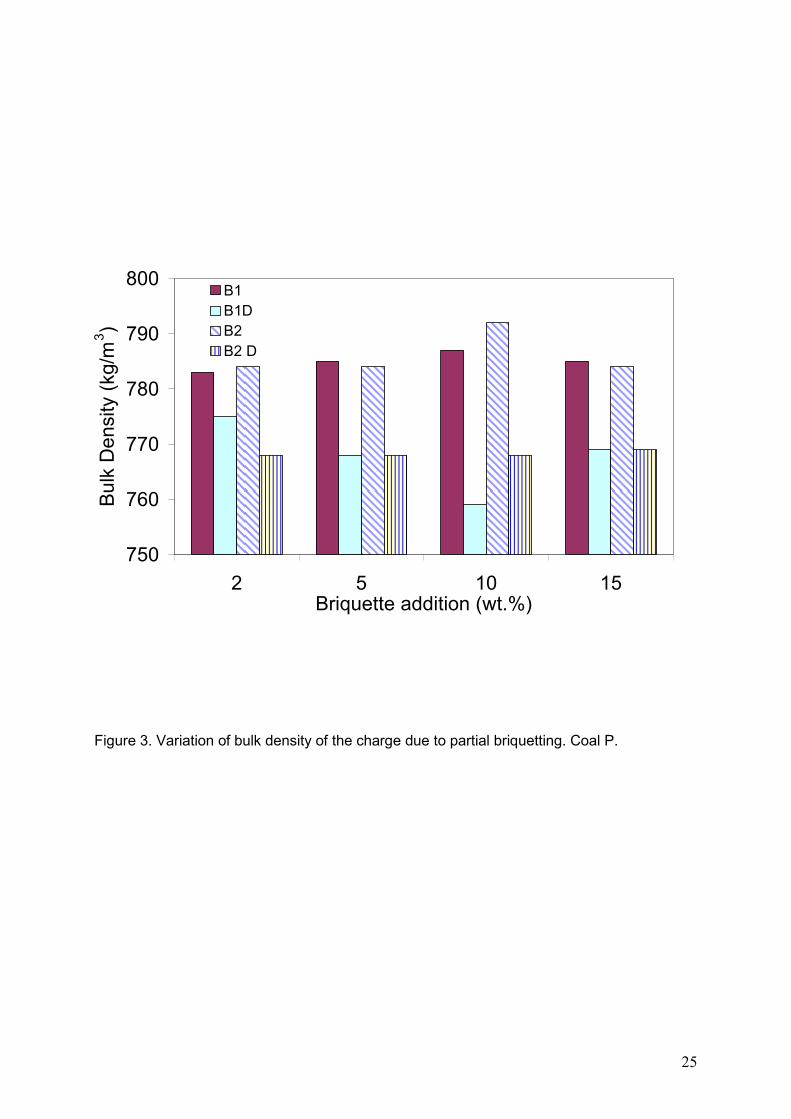
3.3. Carbonization tests in a movable wall oven of 17 kg
In order to study the effect of densification of biomass when a partial briquetting
procedure is employed, carbonizations tests with partial briquetting and direct addition were
8
carried out in an oven of 17 kg capacity. One of the problems associated with the use of
biomass is its low bulk density. At the same time, bulk density of the charge is considered an
important factor for controlling the coking process because of its influence on the yield, the
quality of the product and operational problems such as the generation of excessive coking
pressure. The bulk density of a coal charge using a top charging procedure depends on the
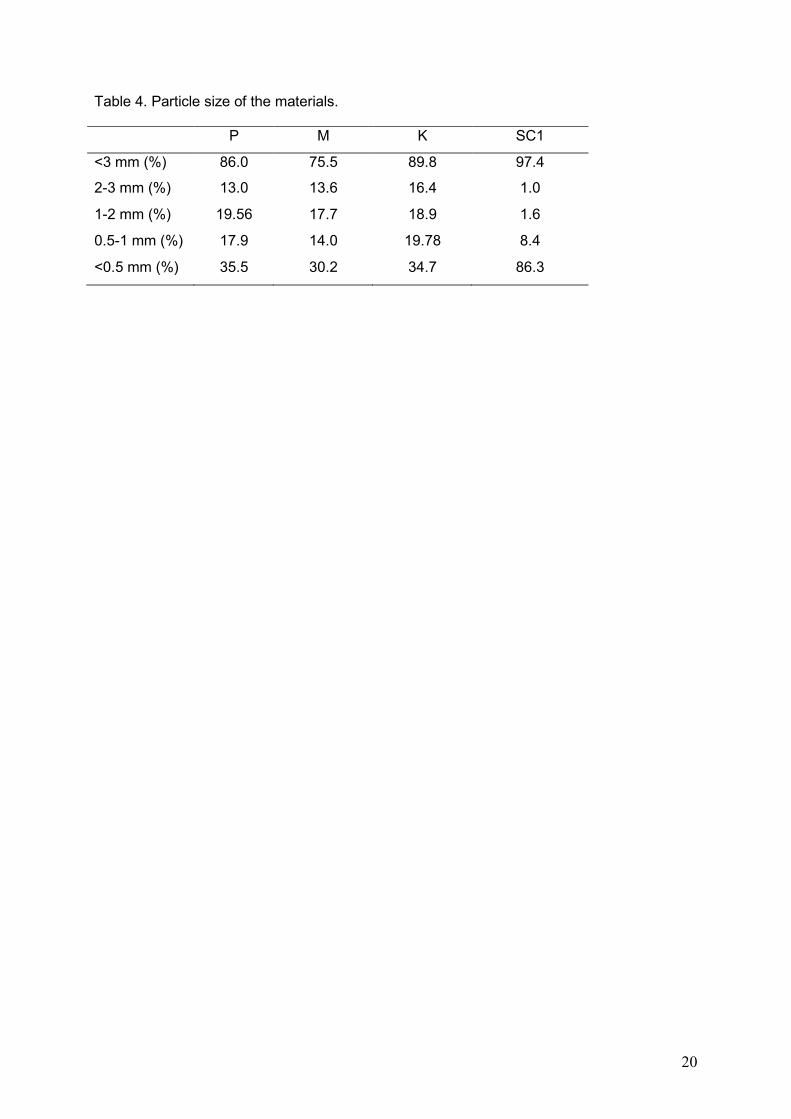
moisture and particle size of the coal. Table 4 presents the particle size for the base coals P
and M and for the materials employed in the preparation of the briquettes. Sawdust has the
finest particle size distribution with 97 wt% smaller than 3 mm and 86 wt% smaller than 0.5
mm. The non-coking coal (K) has around 90 wt% that is smaller than 3 mm but only 35 wt%
smaller than 0.5 mm. In a previous research work the effect of direct addition of sawdust on
the bulk density of the coal charge in a coking oven was studied to find out whether even a
low percentage of sawdust produced a reduction in bulk density [12]. The data in Figure 3
show the variation in bulk density with increasing amounts of briquettes B1 and B2 and allow
the partial briquetting procedure to be compared with that of direct addition in relation to the
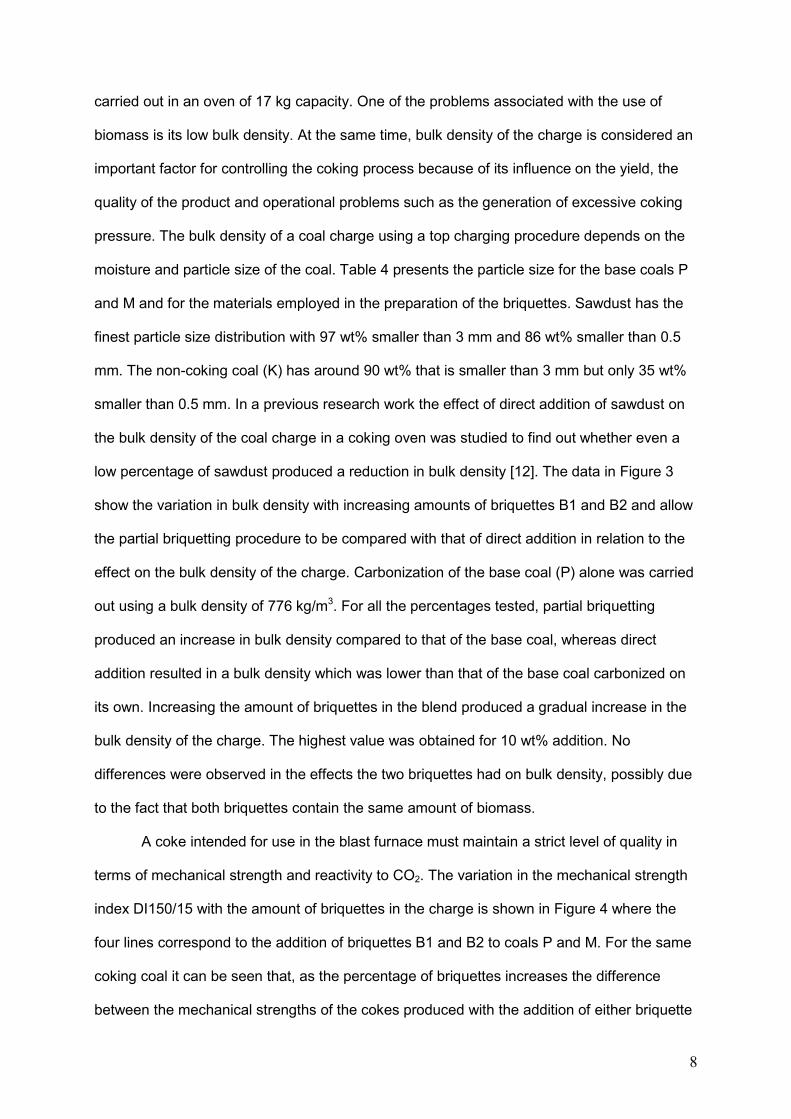
effect on the bulk density of the charge. Carbonization of the base coal (P) alone was carried
out using a bulk density of 776 kg/m3. For all the percentages tested, partial briquetting
produced an increase in bulk density compared to that of the base coal, whereas direct
addition resulted in a bulk density which was lower than that of the base coal carbonized on
its own. Increasing the amount of briquettes in the blend produced a gradual increase in the
bulk density of the charge. The highest value was obtained for 10 wt% addition. No
differences were observed in the effects the two briquettes had on bulk density, possibly due
to the fact that both briquettes contain the same amount of biomass.
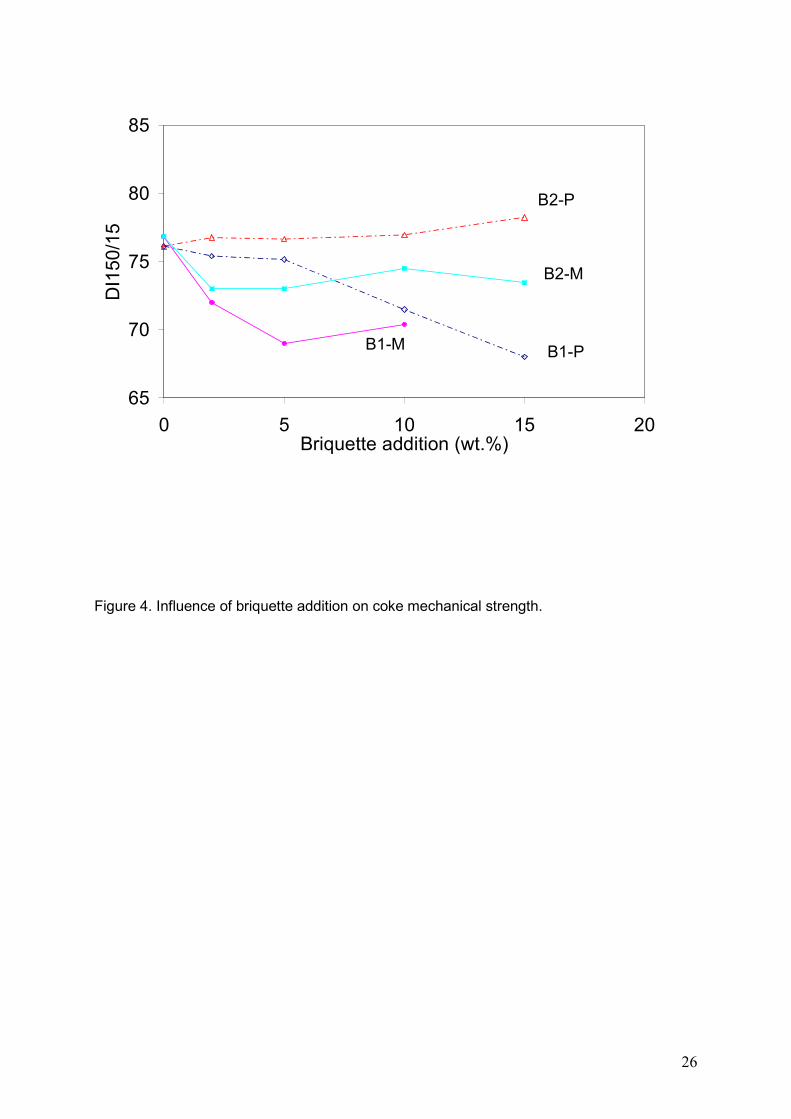
A coke intended for use in the blast furnace must maintain a strict level of quality in
terms of mechanical strength and reactivity to CO2. The variation in the mechanical strength
index DI150/15 with the amount of briquettes in the charge is shown in Figure 4 where the
four lines correspond to the addition of briquettes B1 and B2 to coals P and M. For the same
coking coal it can be seen that, as the percentage of briquettes increases the difference
between the mechanical strengths of the cokes produced with the addition of either briquette
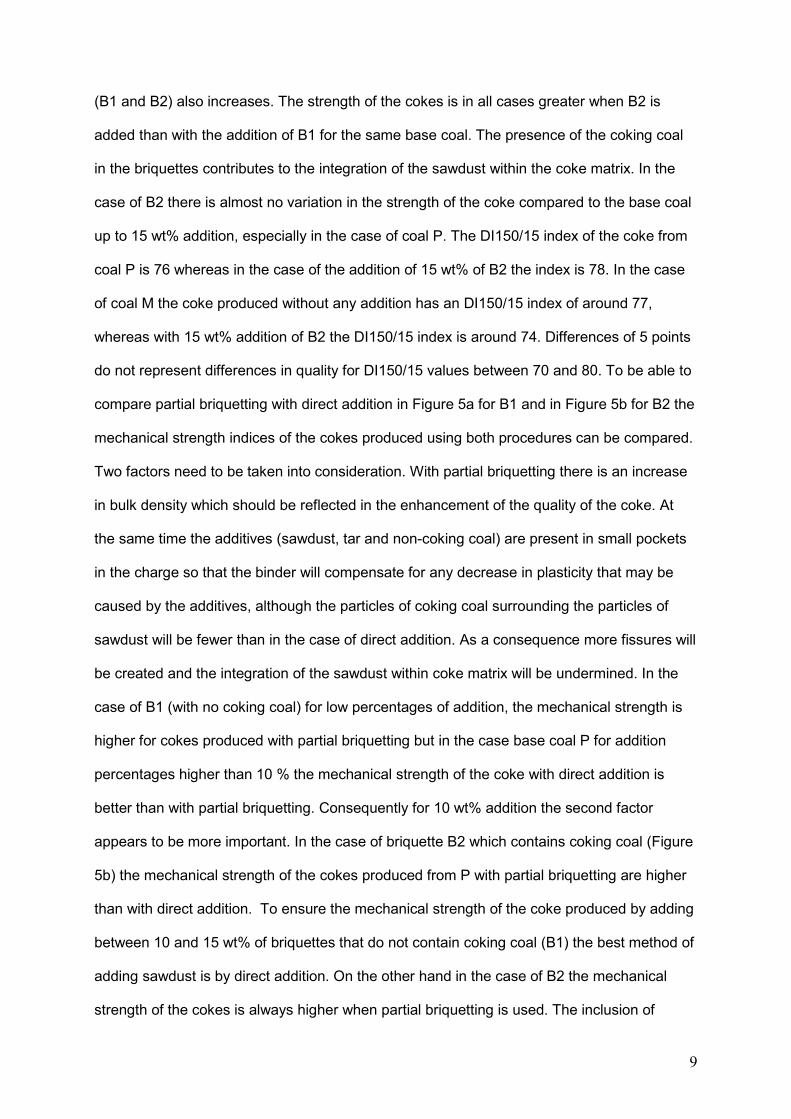
9
(B1 and B2) also increases. The strength of the cokes is in all cases greater when B2 is
added than with the addition of B1 for the same base coal. The presence of the coking coal
in the briquettes contributes to the integration of the sawdust within the coke matrix. In the
case of B2 there is almost no variation in the strength of the coke compared to the base coal
up to 15 wt% addition, especially in the case of coal P. The DI150/15 index of the coke from
coal P is 76 whereas in the case of the addition of 15 wt% of B2 the index is 78. In the case
of coal M the coke produced without any addition has an DI150/15 index of around 77,
whereas with 15 wt% addition of B2 the DI150/15 index is around 74. Differences of 5 points
do not represent differences in quality for DI150/15 values between 70 and 80. To be able to
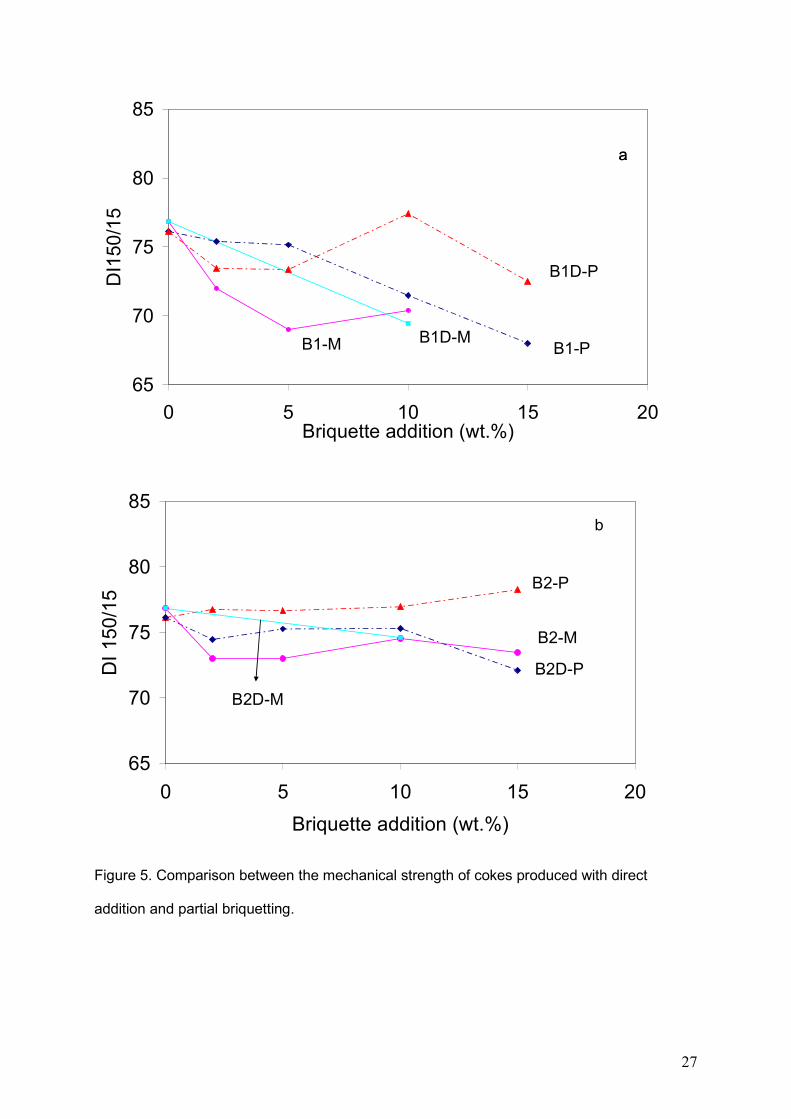
compare partial briquetting with direct addition in Figure 5a for B1 and in Figure 5b for B2 the
mechanical strength indices of the cokes produced using both procedures can be compared.
Two factors need to be taken into consideration. With partial briquetting there is an increase
in bulk density which should be reflected in the enhancement of the quality of the coke. At
the same time the additives (sawdust, tar and non-coking coal) are present in small pockets
in the charge so that the binder will compensate for any decrease in plasticity that may be
caused by the additives, although the particles of coking coal surrounding the particles of
sawdust will be fewer than in the case of direct addition. As a consequence more fissures will
be created and the integration of the sawdust within coke matrix will be undermined. In the
case of B1 (with no coking coal) for low percentages of addition, the mechanical strength is
higher for cokes produced with partial briquetting but in the case base coal P for addition
percentages higher than 10 % the mechanical strength of the coke with direct addition is
better than with partial briquetting. Consequently for 10 wt% addition the second factor
appears to be more important. In the case of briquette B2 which contains coking coal (Figure
5b) the mechanical strength of the cokes produced from P with partial briquetting are higher
than with direct addition. To ensure the mechanical strength of the coke produced by adding
between 10 and 15 wt% of briquettes that do not contain coking coal (B1) the best method of
adding sawdust is by direct addition. On the other hand in the case of B2 the mechanical
strength of the cokes is always higher when partial briquetting is used. The inclusion of
10
coking coal in the formulation of the briquettes produces cokes with greater mechanical
strength.
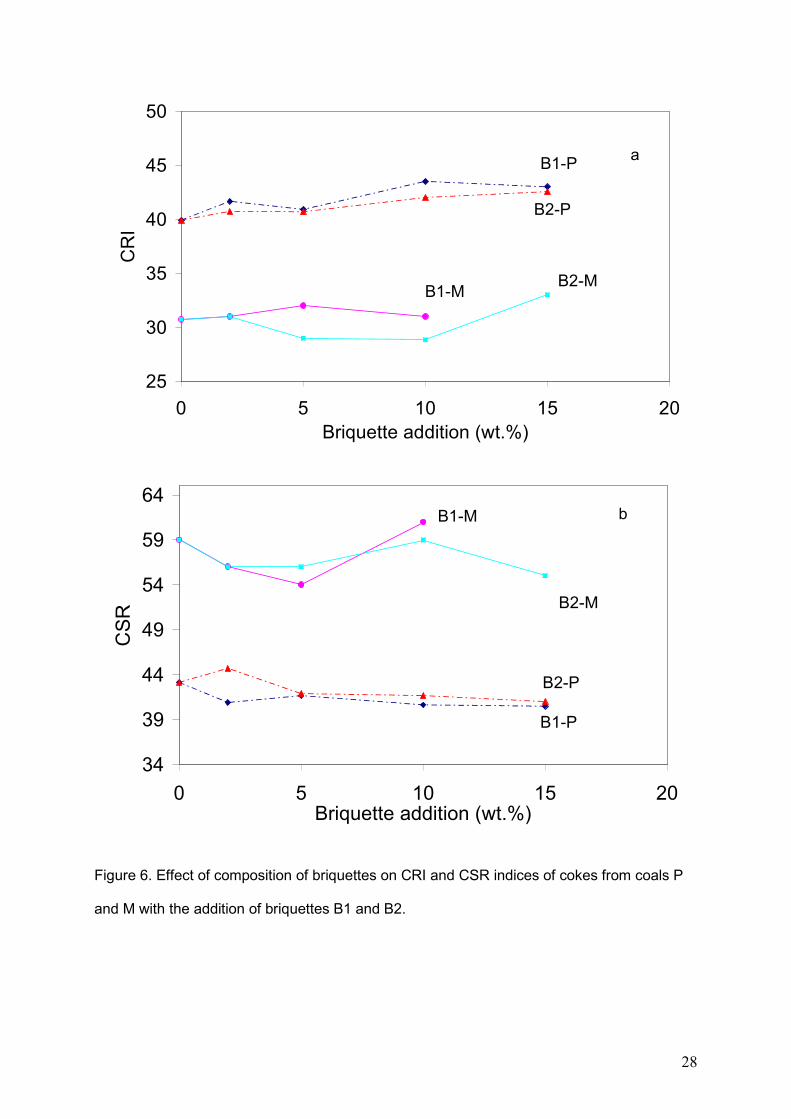
The most widely used procedure for testing coke quality is to measure the reactivity to
CO2 (CRI index) and the post-reaction strength (CSR index). Coke reactivity depends mainly
on the characteristics of the raw materials. Consequently coal rank and ash chemistry are
the most important parameters that will determine the reactivity of a coke. In the present
work coke reactivity was measured in order to assess the effect of biomass addition and the
effectiveness of the procedure used. Figure 6 shows the variation in the CRI and CSR values
of the cokes produced with the addition of increasing amounts of briquettes B1 and B2 for
the two coals tested i.e. P and M. In this way it was possible to assess the effect of including
a coking coal in the composition of the briquettes. The base cokes show similar cold
mechanical strength characteristics but different reactivities to CO2 and post-reaction
strengths. Whereas coal P produces a coke of poor quality, coal M produces a good quality
coke. The results obtained do not reveal significant differences in the CRI and CSR indices
obtained for the cokes produced with the addition of the two briquettes. In the case of coal P
it is possible to include up to 15 wt% of either type of briquette without causing any significant
impairment of the CRI and CSR indices. In the case of coal M the impairment is more
pronounced specially when 15 wt% is added. To be able to compare the effect of the two
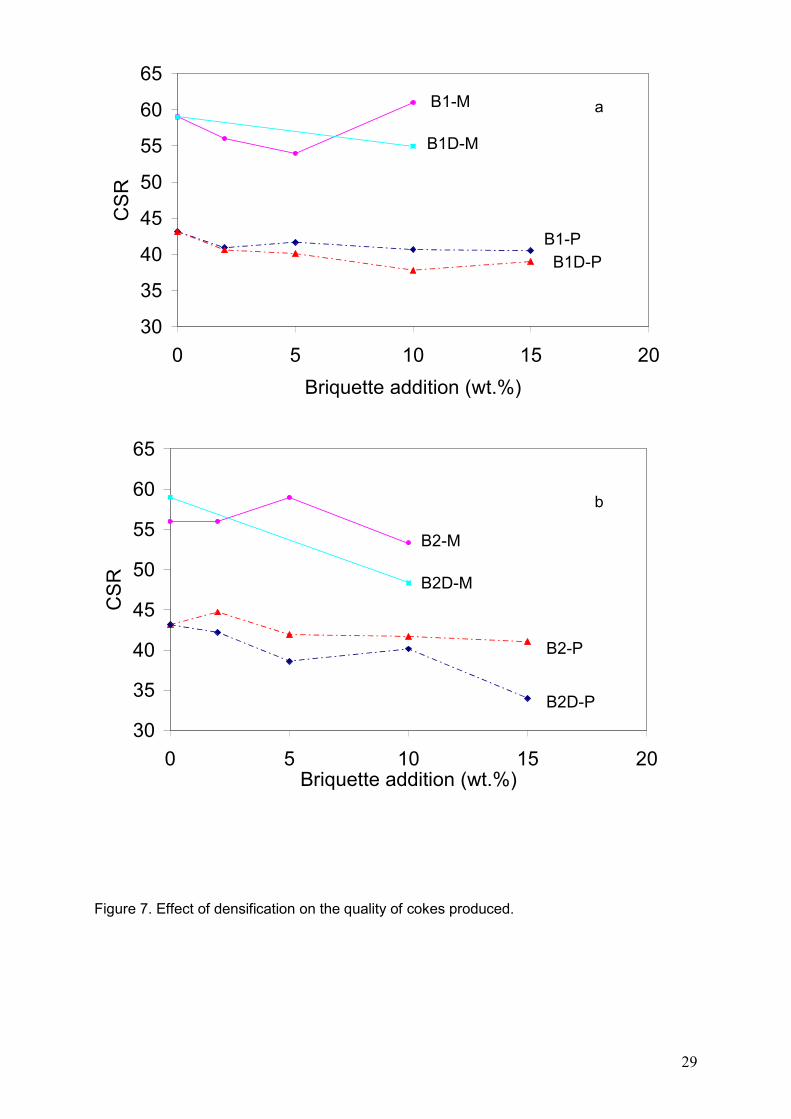
addition procedures -i.e. direct addition and partial briquetting - Figure 7 shows the CSR
results of the cokes produced by these two methods. Partial briquetting causes an increase
in the bulk density of the charge (Figure 3) and it is well known that increasing the bulk
density of a charge in the coking oven is related to increases in the CSR of the coke
produced. Our results show that in this case the CSR values of the cokes produced from
partial briquetting are in every case higher than those produced by direct addition. Contrary
to the results obtained for the mechanical strength which indicated that for percentages
greater than 10 wt% addition the results are better with direct addition, in this case the
influence of the increase in the bulk density of the charge overrides the effect of the
distribution of the biomass within the coking charge. Generally speaking, the main factors
11
that influence the quality of the cokes produced due to the presence of additives can be
summarized as follows: 1. modification of the coal plastic stage, which is the most important
phase during the coking process and determines the structure of the product and 2. effect on
the ash chemistry of the cokes. The porous characteristics of the cokes prepared with coal P
as base have been included in Table 5. In general, for the same level of addition partial
briquetting produces cokes with a lower total porosity as a consequence of the higher bulk
density during coking. In a previous research paper [12] it was found that the addition of
sawdust to an industrial coal blend gave rise to cokes with a higher total porosity, although
no relationship was established between the data obtained from the mechanical strength
drum test and porosity determinations. Nevertheless, it is evident that, pores are the places
where microfissures form and then develop into flaws [28].
In contrast, the porosity corresponding to pore sizes lower than 12 µm is not as
extended in cokes produced with direct addition. The results shown in Figure 5 indicate that
for additions higher than 10 wt%, direct addition produces cokes with better mechanical
strength. This could be related to the results obtained for the porosity corresponding to sizes
lower than 12 µm supporting the explanation proposed above that with the presence of a
certain amount of sawdust in the coking blend, the resulting closer contact of the sawdust
with the coking coal allows it to be more easily integrated within the coke matrix, reducing the
number of microfissures that might otherwise develop into fractures.
Another important factor that may have an effect on the quality of the cokes produced
with additives is the modification of the coke ash chemistry due to the catalytic effects of
metals such as Fe, Ca, K, Na or Mg. To take into consideration the ash chemistry, models
used to predict coke strength after reaction include, among other factors such as plasticity
and maceral composition, a alkalinity index (AI) being the ratio between the basic oxides and
acidic oxides [1, 29] :
+
++++⋅=
232
2232
SiOOAl
MgOOKONaCaOOFeAshAI
12
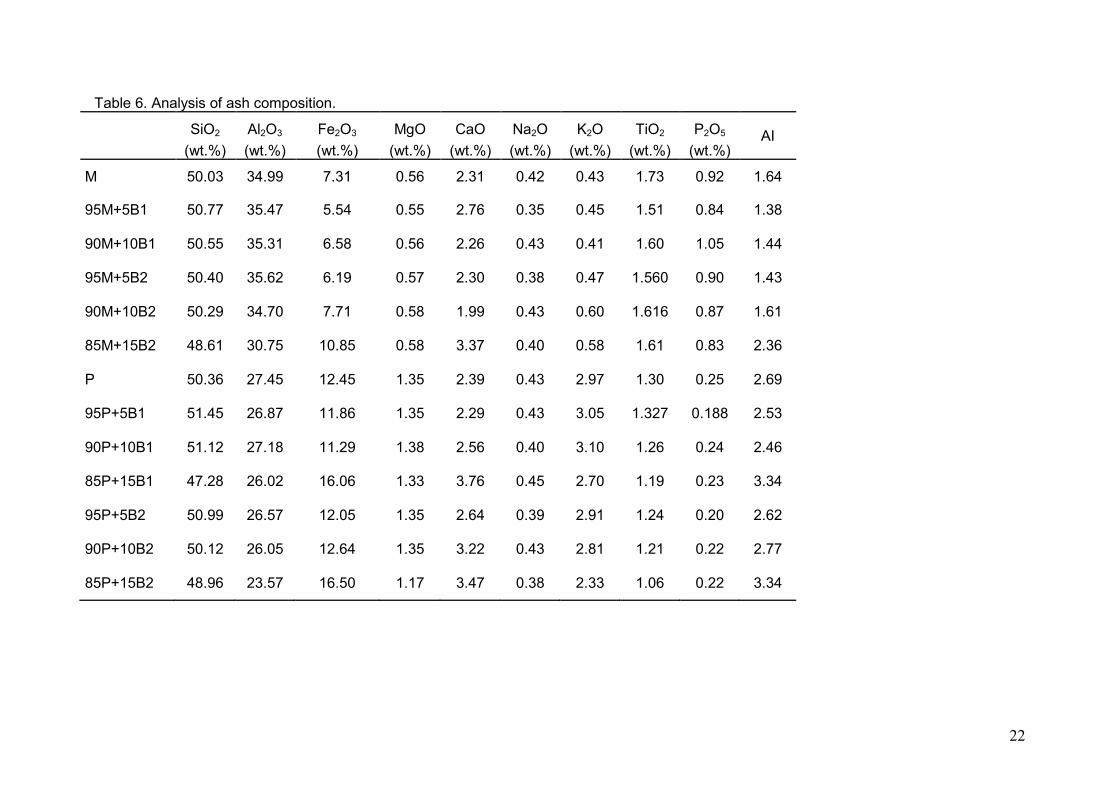
An analysis of the composition of the ash is presented in Table 6. From these values,
the alkalinity index was calculated. It was found that the CSR of the corresponding cokes
were linearly correlated to the AI with a correlation coefficient of r=0.893.
In view of the results presented in a previous paper [10] it appears that the addition of
sawdust in the form of briquettes gives rise to cokes of better quality than when only sawdust
is included in the coking blend. This enhances the role of the binder that may help to restore
the loss of fluidity produced by the sawdust and the increase of bulk density produced by the
addition of sawdust in the form of briquettes.
The two coals chosen presented similar volatile matter contents but produced cokes
of different quality, especially with respect to coke reactivity to CO2 (CRI and CSR indices).
Whereas coal P produced a coke of low quality, coal M gave rise to a coke which could be
used in most blast furnaces. It is apparent from the results that the base coal used for the
additions is of great importance considering the different behaviours of the two coals
selected. It might therefore be of interest to study the use of a complex industrial blend as
base. Some questions still remain to be answered such as the importance of the size of the
briquettes which may affect the distribution of the biomass within the coal mass.
4. Conclusions
1. Direct addition produces a decrease in the bulk density of the charge which does
not occur with partial briquetting.
2. The mechanical strength of cokes produced was better when briquettes were used,
except in the case of 10 and 15 wt% addition of B1 due to a better distribution of sawdust
within the coal mass resulting in a more effective interaction between sawdust and coking
coal.
3. With respect to coke reactivity it would be possible to add up to 15 wt% of
briquettes without impairing coke quality in the case of coal P. However, the amount should
not exceed 10 wt% in the case of coal M.
4. The total porosity is lower in cokes produced by partial briquetting due to the
increase in bulk density.

13
Acknowledgements
The research leading to these results has received funding from the European Union's
Research Programme of the Research Fund for Coal and Steel (RFCS) research programme
under grant agreement No. [RFCR-CT-2010-00007]. M.G.M. thanks the Government of the
Principado de Asturias for the award of a pre-doctoral grant with funds from the PCTI-
Asturias within the Severo Ochoa program.
14
References
1. Ng KW, MacPhee JA, Giroux L, Todoschuk T. Reactivity of bio-coke with CO2. Fuel Process Technol 2011; 92: 801-804.
2. Carpenter A. CO2 abatement in the iron and steel industry. IEA Clean Coal Centre; 2012. 3. Norgate T, Haque N, Somerville M, Jahanshahi S. Biomass as a source of renewable
carbon for iron and steelmaking. ISIJ Int 2012; 52: 1472-1481. 4. Patrick JW, Stacey AE. The strength of industrial cokes. 7. Further studies of the
influence of additives in a coke-oven charge on the tensile strength of coke. Fuel 1978; 57 258-264.
5. Loison R, Foch P, Boyer A (Eds.) Coke Quality and Production. Butterworths, London
1989. 6. Menéndez JA, Pis JJ, Álvarez R, Barriocanal C, Canga CS, Fuente E, Díez MA.
Characterization of petroleum coke as additive in metallurgical cokemaking. Influence on metallurgical coke quality. Energ Fuel 1997; 11: 379-384.
7. Barranco R, Patrick JW, Snape C, Thompson A. Impact of low-cost filler material on coke
quality. Fuel 2007; 86: 2179-2185. 8. Fernández AM, Barriocanal C, Alvarez R. The effect of additives on coking pressure and
coke quality. Fuel 2012; 95: 642–647. 9. MacPhee JA, Gransden JF, Giroux L, Price JT. Possible CO2 mitigation via addition of
charcoal to coking coal blends. Fuel Process Technol 2009; 90:16-20. 10. Montiano MG, Barriocanal C, Alvarez R. Effect of the addition of waste sawdust on
thermoplastic properties of a coal. Fuel 2013; 106: 537–543. 11. Kokonya S, Castro-Díaz M, Barriocanal C, Snape CE. An investigation into the effect of
fast heating on fluidity development and coke quality for blends of coal and biomass. Biomass Bioenerg 2013; 56: 295-306.
12. Montiano MG, Díaz-Faes E, Barriocanal C, Alvarez R. Influence of biomass on
metallurgical coke quality. Fuel 2014; 116: 175–182. 13. Fernández AM, Barriocanal C, Díez MA, Álvarez R. Influence of the additives of various
origins on thermoplastic properties of coal. Fuel 2009; 88: 2365-2372. 14. Castro-Díaz M, Zhao H, Kokonya S, Dufour A, Snape CE. The effect of biomass on
fluidity development in coking blends using high-temperature SAOS rheometry. Energ Fuel 2012; 26: 1767-1775.
15. Vassilev SV, Baxter D, Andersen LK, Vassileva CG. An overview of the chemical
composition of biomass. Fuel 2010; 89: 913–933. 16. Dupont C, Nocquet Te, Da Costa Jr JA, Verne-Tournon Cl. Kinetic modelling of steam
gasification of various woody biomass chars: Influence of inorganic elements. Bioresour Technol 2011; 102: 9743–9748.
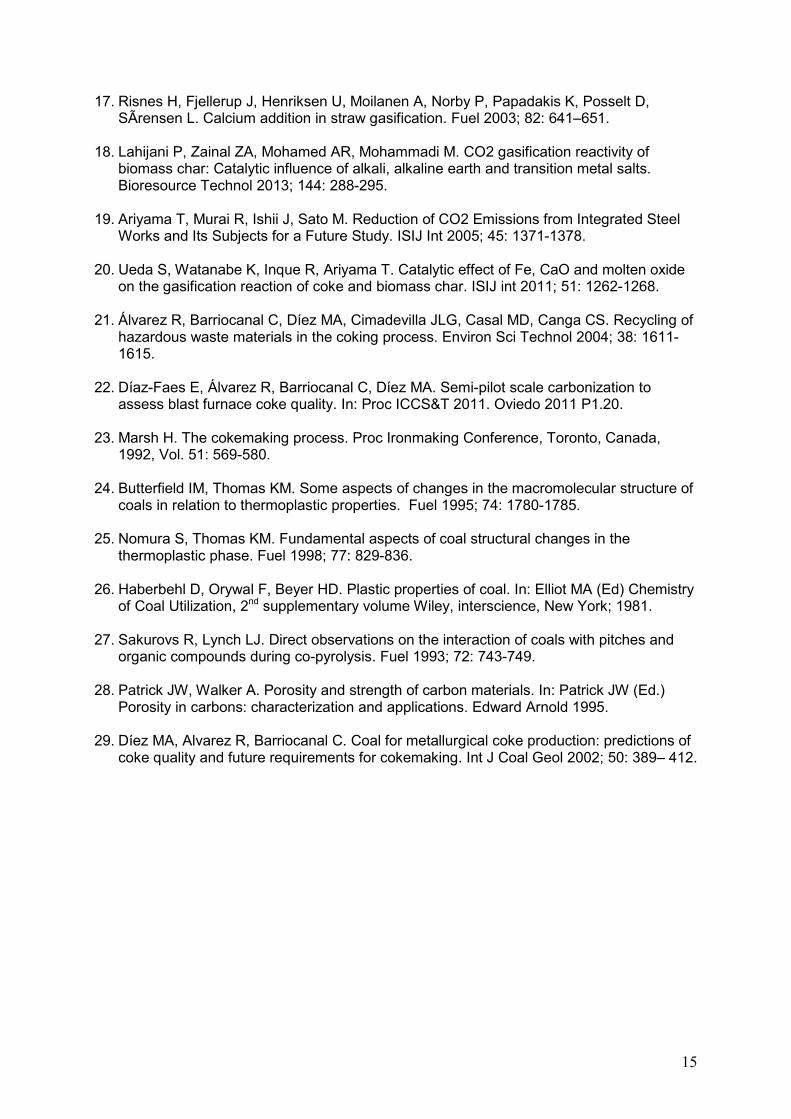
15
17. Risnes H, Fjellerup J, Henriksen U, Moilanen A, Norby P, Papadakis K, Posselt D, SÃrensen L. Calcium addition in straw gasification. Fuel 2003; 82: 641–651.
18. Lahijani P, Zainal ZA, Mohamed AR, Mohammadi M. CO2 gasification reactivity of
biomass char: Catalytic influence of alkali, alkaline earth and transition metal salts. Bioresource Technol 2013; 144: 288-295.
19. Ariyama T, Murai R, Ishii J, Sato M. Reduction of CO2 Emissions from Integrated Steel
Works and Its Subjects for a Future Study. ISIJ Int 2005; 45: 1371-1378. 20. Ueda S, Watanabe K, Inque R, Ariyama T. Catalytic effect of Fe, CaO and molten oxide
on the gasification reaction of coke and biomass char. ISIJ int 2011; 51: 1262-1268. 21. Álvarez R, Barriocanal C, Díez MA, Cimadevilla JLG, Casal MD, Canga CS. Recycling of
hazardous waste materials in the coking process. Environ Sci Technol 2004; 38: 1611-1615.
22. Díaz-Faes E, Álvarez R, Barriocanal C, Díez MA. Semi-pilot scale carbonization to
assess blast furnace coke quality. In: Proc ICCS&T 2011. Oviedo 2011 P1.20. 23. Marsh H. The cokemaking process. Proc Ironmaking Conference, Toronto, Canada,
1992, Vol. 51: 569-580. 24. Butterfield IM, Thomas KM. Some aspects of changes in the macromolecular structure of
coals in relation to thermoplastic properties. Fuel 1995; 74: 1780-1785. 25. Nomura S, Thomas KM. Fundamental aspects of coal structural changes in the
thermoplastic phase. Fuel 1998; 77: 829-836. 26. Haberbehl D, Orywal F, Beyer HD. Plastic properties of coal. In: Elliot MA (Ed) Chemistry
of Coal Utilization, 2nd supplementary volume Wiley, interscience, New York; 1981. 27. Sakurovs R, Lynch LJ. Direct observations on the interaction of coals with pitches and
organic compounds during co-pyrolysis. Fuel 1993; 72: 743-749. 28. Patrick JW, Walker A. Porosity and strength of carbon materials. In: Patrick JW (Ed.)
Porosity in carbons: characterization and applications. Edward Arnold 1995. 29. Díez MA, Alvarez R, Barriocanal C. Coal for metallurgical coke production: predictions of
coke quality and future requirements for cokemaking. Int J Coal Geol 2002; 50: 389– 412.
16
Figure Captions
Figure 1. Diagram of the procedure used to produce briquettes and photograph of briquettes
obtained.
Figure 2. Gieseler fluidity curves of coal P and M with addition of various amounts of
briquettes B1 and B2.
Figure 3. Variation of bulk density of the charge due to partial briquetting. Coal P.
Figure 4. Influence of briquette addition on coke mechanical strength.
Figure 5. Comparison between mechanical strength of cokes produced with direct addition
and partial briquetting.
Figure 6. Effect of composition of briquettes on CRI and CSR indices of cokes from coals P
and M with the addition of briquettes B1 and B2.
Figure 7. Effect of densification on the quality of cokes produced.

17
Table 1. Proximate and ultimate analysis of the materials.
P M SC1 K Tar
VM (wt.% db)1 22.7 24.5 78.8 14.6 65.93
Ash (wt.%db) 7.8 7.5 1.3 8.4 --
C (wt.%db) 83.7 82.5 50.2 83.0 90.3
H (wt.%db) 4.8 4.6 5.7 3.9 4.7
N (wt.%db) 1.5 1.4 0.5 2.1 0.8
S (wt.%db) 0.75 0.72 0.00 0.48 0.38
O (wt.%db) 2.6 3.0 43.0 2.6 2.8
C/H2 1.5 1.5 0.7 1.8 1.6
C/O2 42.9 33.3 1.6 42.6 43.0 1VM, volatile matter content on a dry basis (db). 2 Atomic ratio. 3: From thermogravimetric
analysis.

18
Table 2. Composition of briquettes and percentage of each component present in blends of the base coal with briquettes. P (wt.%) M (wt.%) SC1 (wt.%) K (wt.%) Tar (wt.%)
B1 0.00 -- 15.00 70.00 15.00
B2 35.00 -- 15.00 35.00 15.00
P2B1 98.00 -- 0.30 1.40 0.30
P5B1 95.00 -- 0.75 3.50 0.75
P10B1 90.00 -- 1.50 7.00 1.50
P15B1 85.00 -- 2.25 10.50 2.25
P2B2 98.70 -- 0.30 0.70 0.30
P5B2 96.75 -- 0.75 1.75 0.75
P10B2 93.50 -- 1.50 3.50 1.50
P15B2 90.25 -- 2.25 5.25 2.25
M2B1 -- 98.00 0.30 1.40 0.30
M5B1 -- 95.00 0.75 3.50 0.75
M10B1 -- 90.00 1.50 7.00 1.50
M2B2 0.70 98.00 0.30 0.70 0.30
M5B2 1.75 95.00 0.75 1.75 0.75
M10B2 3.50 90.00 1.50 3.50 1.50
M15B2 5.25 85.00 2.25 5.25 2.25
19
Table 3. Parameters derived from Gieseler test.
Sample Ts (°C) Tf(°C) Tr(°C) Tr-Ts(°C) MF(ddpm)
P 405 462 500 95 1313
P2B1 402 459 498 96 1346
P5B1 405 456 498 93 1156
P10B1 405 459 498 93 858
P15B1 408 459 500 92 666
P2B2 401 462 499 98 1219
P5B2 401 457 497 96 1151
P10B2 403 463 499 96 987
P15B2 406 461 500 94 700
M 405 454 486 81 896
M2B1 407 452 488 81 707
M5B1 403 454 490 87 689
M10B1 400 451 486 86 564
M15B1 403 454 486 83 286
M2B2 399 453 489 90 835
M5B2 404 452 488 84 652
M10B2 402 450 486 84 557
M15B2 407 455 488 81 408
20
Table 4. Particle size of the materials.
P M K SC1
<3 mm (%) 86.0 75.5 89.8 97.4
2-3 mm (%) 13.0 13.6 16.4 1.0
1-2 mm (%) 19.56 17.7 18.9 1.6
0.5-1 mm (%) 17.9 14.0 19.78 8.4
<0.5 mm (%) 35.5 30.2 34.7 86.3

21
Table 5. Comparison between porosity characteristics of cokes produced via partial
briquetting and direct addition. Coal P.
Sample ρHe
(cm3/g) ρH2O
(cm3/g) ρHg
(cm3/g) ε (%) ε<12µm (%)
P 1.852 0.879 1.516 53 18
P10B1 1.846 0.886 1.518 52 18
P10B1 D 1.875 0.859 1.564 54 17
P15B1 1.917 0.874 1.450 54 24
P15B1 D 1.875 0.856 1.468 54 22
P10B2 1.848 0.913 1.493 51 19
P10B2 D 1.883 0.878 1.487 53 21
P15B2 1.907 0.936 1.429 51 25
P15B2 D 1.911 0.882 1.477 54 23
22
Table 6. Analysis of ash composition.
SiO2 Al2O3 Fe2O3 MgO CaO Na2O K2O TiO2 P2O5 AI (wt.%) (wt.%) (wt.%) (wt.%) (wt.%) (wt.%) (wt.%) (wt.%) (wt.%)
M 50.03 34.99 7.31 0.56 2.31 0.42 0.43 1.73 0.92 1.64
95M+5B1 50.77 35.47 5.54 0.55 2.76 0.35 0.45 1.51 0.84 1.38
90M+10B1 50.55 35.31 6.58 0.56 2.26 0.43 0.41 1.60 1.05 1.44
95M+5B2 50.40 35.62 6.19 0.57 2.30 0.38 0.47 1.560 0.90 1.43
90M+10B2 50.29 34.70 7.71 0.58 1.99 0.43 0.60 1.616 0.87 1.61
85M+15B2 48.61 30.75 10.85 0.58 3.37 0.40 0.58 1.61 0.83 2.36
P 50.36 27.45 12.45 1.35 2.39 0.43 2.97 1.30 0.25 2.69
95P+5B1 51.45 26.87 11.86 1.35 2.29 0.43 3.05 1.327 0.188 2.53
90P+10B1 51.12 27.18 11.29 1.38 2.56 0.40 3.10 1.26 0.24 2.46
85P+15B1 47.28 26.02 16.06 1.33 3.76 0.45 2.70 1.19 0.23 3.34
95P+5B2 50.99 26.57 12.05 1.35 2.64 0.39 2.91 1.24 0.20 2.62
90P+10B2 50.12 26.05 12.64 1.35 3.22 0.43 2.81 1.21 0.22 2.77
85P+15B2 48.96 23.57 16.50 1.17 3.47 0.38 2.33 1.06 0.22 3.34
23
Figure 1. Diagram of the procedure used to produce briquettes and photograph of briquettes
obtained.
Mixer
Raw materials:SawdustNon-coking coal
Sieving
binder
Briquettingmachine
SievingFines Briquettes
Mixer
Raw materials:SawdustNon-coking coal
Sieving
binder
Briquettingmachine
SievingFines Briquettes
B1 B2

24
Figure 2. Gieseler fluidity curves of coal P and M with addition of various amounts of
briquettes B1 and B2.
0
200
400
600
800
1000
1200
1400
400 420 440 460 480 500
Temperature (°C)
Gie
sele
r flu
idity
(ddpm
) PP+2B1P+5B1P+10B1P+15B1
0
200
400
600
800
1000
1200
1400
400 420 440 460 480 500
Temperature (°C)
Gie
sele
r flu
idity
(ddpm
) PP+2B2P+5B2P+10B2P+15B2
0
200
400
600
800
1000
400 420 440 460 480 500
Temperature (°C)
Gie
sele
r flu
idity
(ddpm
) MM+2B1M+5B1M+10B1M+15B1
0
200
400
600
800
1000
400 420 440 460 480 500
Temperature (°C)
Gie
sele
r flu
idity
(ddpm
) MM+2B2M+5B2M+10B2M+15B2
25
Figure 3. Variation of bulk density of the charge due to partial briquetting. Coal P.
750
760
770
780
790
800
2 5 10 15Briquette addition (wt.%)
Bu
lk D
en
sity
(kg
/m3)
B1B1DB2B2 D
26
Figure 4. Influence of briquette addition on coke mechanical strength.
65
70
75
80
85
0 5 10 15 20Briquette addition (wt.%)
DI1
50/1
5
B2-P
B2-M
B1-PB1-M
27
Figure 5. Comparison between the mechanical strength of cokes produced with direct
addition and partial briquetting.
65
70
75
80
85
0 5 10 15 20
Briquette addition (wt.%)
DI
150
/15
B2D-P
B2-M
B2-P
B2D-M
65
70
75
80
85
0 5 10 15 20Briquette addition (wt.%)
DI1
50/1
5
B1D-P
B1D-MB1-PB1-M
a
b
a
28
Figure 6. Effect of composition of briquettes on CRI and CSR indices of cokes from coals P
and M with the addition of briquettes B1 and B2.
25
30
35
40
45
50
0 5 10 15 20Briquette addition (wt.%)
CR
I
B2-P
B2-M
B1-P
B1-M
34
39
44
49
54
59
64
0 5 10 15 20Briquette addition (wt.%)
CS
R
B2-P
B2-M
B1-P
B1-M
a
b
29
Figure 7. Effect of densification on the quality of cokes produced.
30
35
40
45
50
55
60
65
0 5 10 15 20Briquette addition (wt.%)
CS
R
B2-M
B2D-M
B2-P
B2D-P
30
35
40
45
50
55
60
65
0 5 10 15 20
Briquette addition (wt.%)
CS
R
B1-P
B1D-P
B1-M
B1D-M
a
b