
McGraw-Hill/Irwin ©2005 The McGraw-Hill Companies, All rights reserved McGraw-Hill/Irwin.
date post
20-Dec-2015Category
view
215download
0
PART THREE
CONCEPT/PROJECT EVALUATION
McGraw-Hill/Irwin – Merle Crawford Anthony Di Benedetto 9th Edition Copyright © 2008 by The McGraw-Hill Companies, Inc. All Rights Reserved.

Concept/Project EvaluationFigure III.1
8-2

Chapter 8
The Concept Evaluation System
8-3

The Evaluation SystemFigure 8.1
8-4

Cumulative Expenditures Curve
% ofexpenditures
Time Launch
Many high-techproducts
Many consumerproducts
Figure 8.2
8-5
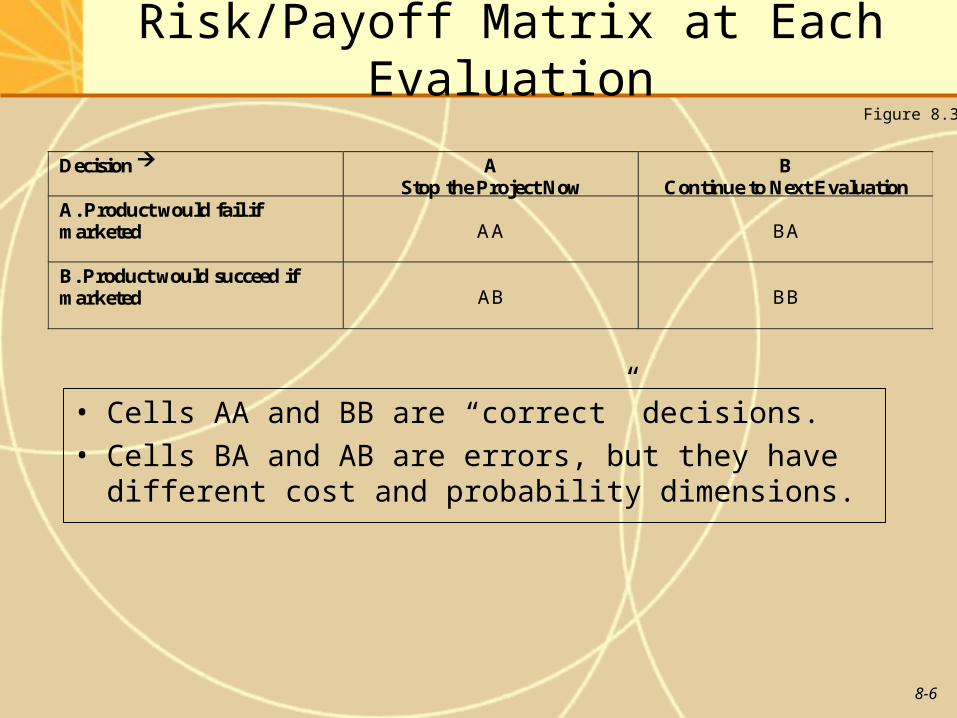
Risk/Payoff Matrix at Each Evaluation
• Cells AA and BB are “correct” decisions.• Cells BA and AB are errors, but they have different
cost and probability dimensions.
Decision AStop the Project Now
BContinue to Next Evaluation
A. Product would fail ifmarketed AA BA
B. Product would succeed ifmarketed AB BB
Figure 8.3
8-6
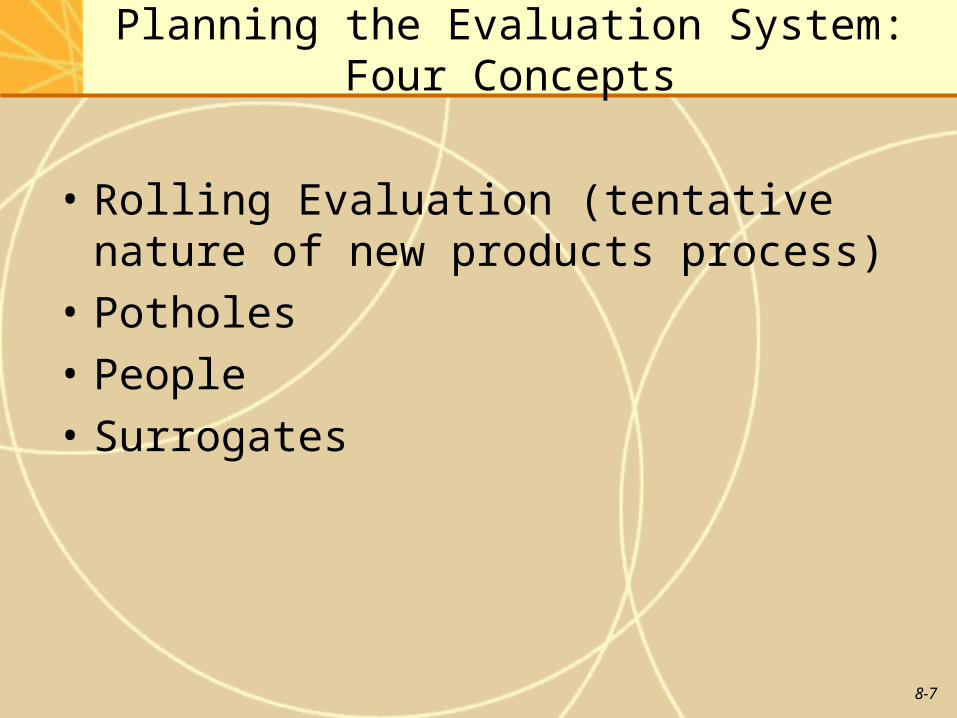
Planning the Evaluation System: Four Concepts
• Rolling Evaluation (tentative nature of new products process)
• Potholes
• People
• Surrogates
8-7
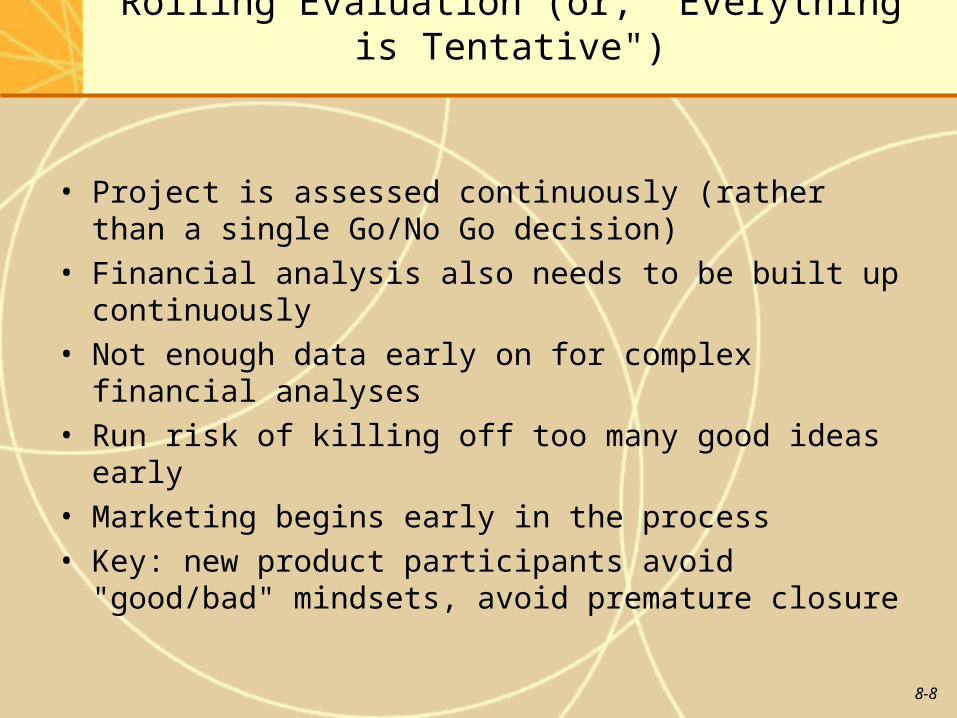
Rolling Evaluation (or, "Everything is Tentative")
• Project is assessed continuously (rather than a single Go/No Go decision)
• Financial analysis also needs to be built up continuously• Not enough data early on for complex financial analyses• Run risk of killing off too many good ideas early• Marketing begins early in the process• Key: new product participants avoid "good/bad"
mindsets, avoid premature closure
8-8
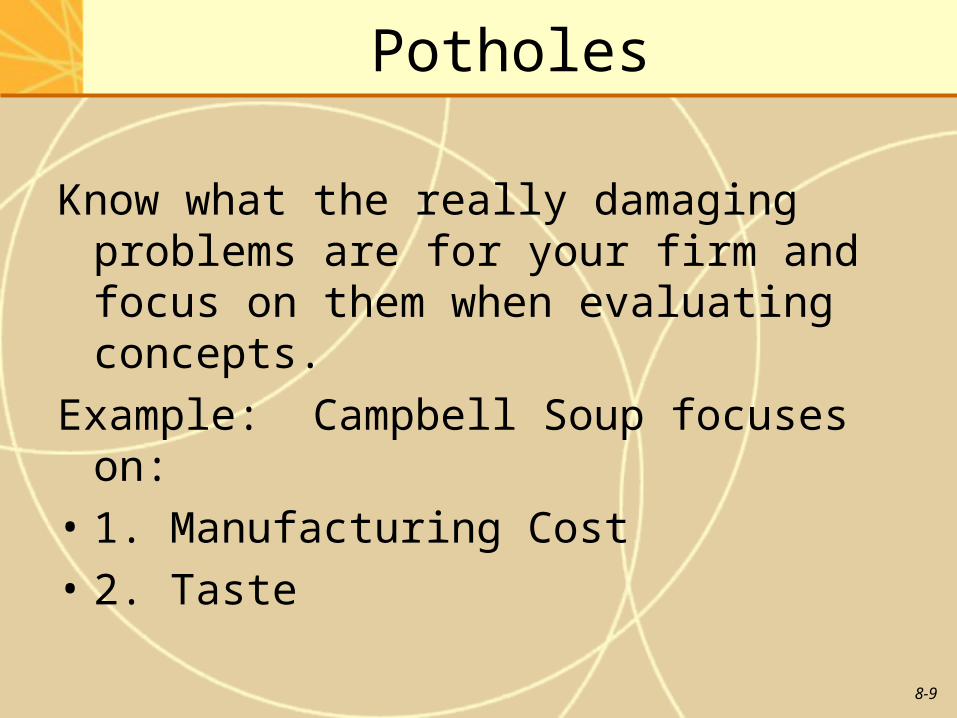
Potholes
Know what the really damaging problems are for your firm and focus on them when evaluating concepts.
Example: Campbell Soup focuses on:
• 1. Manufacturing Cost
• 2. Taste
8-9

People
• Proposal may be hard to stop once there is buy-in on the concept.
• Need tough demanding hurdles, especially late in new products process.
• Personal risk associated with new product development.
• Need system that protects developers and offers reassurance (if warranted).
8-10

Surrogates
• Surrogate questions give clues to the real answer.
Real Question Surrogate Question
Will they prefer it? Did they keep the prototype product we gave them
after the concept test?
Will cost be competitive? Does it match our manufacturing skills?
Will competition leap in? What did they do last time?
Will it sell? Did it do well in field testing?
8-11
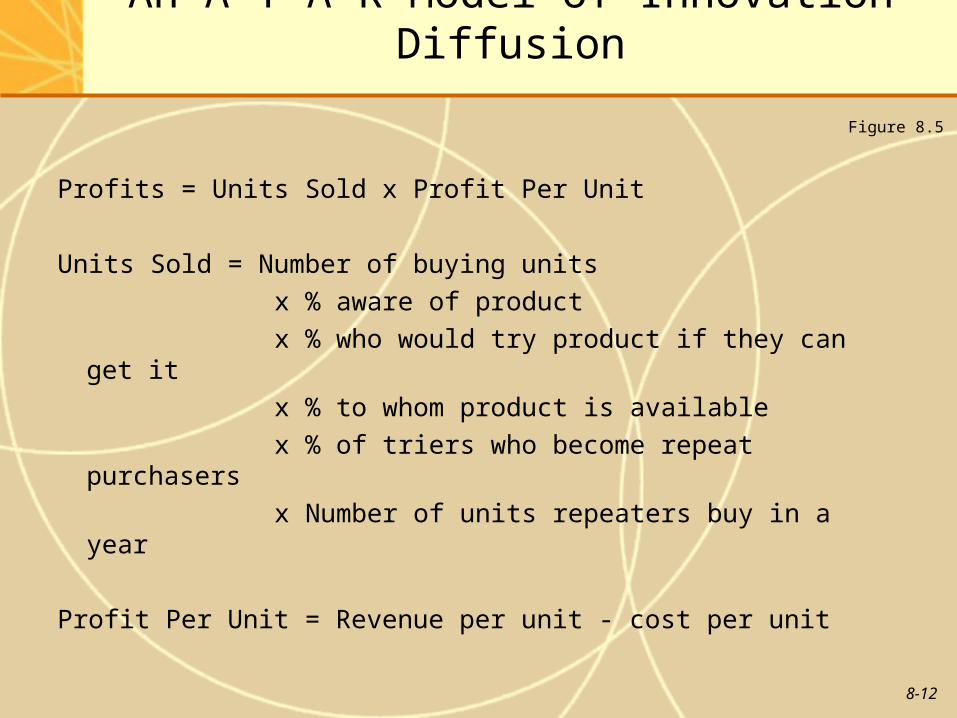
An A-T-A-R Model of Innovation Diffusion
Profits = Units Sold x Profit Per Unit
Units Sold = Number of buying units
x % aware of product
x % who would try product if they can get it
x % to whom product is available
x % of triers who become repeat purchasers
x Number of units repeaters buy in a year
Profit Per Unit = Revenue per unit - cost per unit
Figure 8.5
8-12

The A-T-A-R Model: Definitions
• Buying Unit: Purchase point (person or department/buying center).
• Aware: Has heard about the new product with some characteristic that differentiates it.
• Available: If the buyer wants to try the product, the effort to find it will be successful (expressed as a percentage).
• Trial: Usually means a purchase or consumption of the product.
• Repeat: The product is bought at least once more, or (for durables) recommended to others.
Figure 8.6
8-13

A-T-A-R Model Application
10 million Number of owners of video cellphones
x 40% Percent awareness after one year
x 20% Percent of aware owners who will try product
x 70% Percent availability at electronics retailers
x 20% Percent of triers who will buy a second unit
x $50 Price per unit minus trade margins and
discounts ($100) minus unit cost at the
intended volume ($50)
= $5,600,000 Profits
8-14

Points to Note About A-T-A-R Model
1. Each factor is subject to estimation.
Estimates improve with each step in the development phase.
2. Inadequate profit forecast can be improved by changing factors.
If profit forecast is inadequate, look at each factor and see which can be improved, and at what cost.
8-15

Getting the Estimates for A-T-A-R Model
xx: Best source for that item.
x: Some knowledge gained.
Figure 8.7
Item MarketResearch
Concept Test Product UseTest
ComponentTesting
Market Test
Market Units XX X X XAwareness X X X XTrial XX X XAvailability X XXRepeat XX XConsumption X X X XXPrice/Unit X X X X XXCost/Unit X XX
8-16

Chapter 9
Concept Testing
McGraw-Hill/Irwin – Merle Crawford Anthony Di Benedetto 9th Edition Copyright © 2008 by The McGraw-Hill Companies, Inc. All Rights Reserved.

Many Ideas Are Eliminated Before Concept Testing
• PIC eliminates most new product ideas even before they are developed into concepts.
• Ideas of the following types are excluded:– Ideas requiring technologies the firm does not have.– Ideas to be sold to customers about whom the firm
has no close knowledge.– Ideas that offer too much (or too little) innovativeness.– Ideas wrong on other dimensions: not low cost, too
close to certain competitors, etc.
9-18

Market Analysis and Initial Reaction
• Market analysis: in-depth study of market area that the PIC has selected for focus. – Conducted immediately after PIC approval.
• Initial reaction: preliminary, inexpensive assessment of concepts, which may be flowing very quickly at this point.– Avoid “bazooka effect” (quickly blasting out concepts
without forethought)– Do not include idea source in initial reaction.– Respect the “fragility of ideas” -- have more than a single
person involved.– Use more than pure intuition -- keep records and stay
objective.
9-19

Suggested Questions for the Initial Reaction
• Market Worth: what is the attractiveness of the new product to the targeted customer population?
• Firm Worth: Is the new product project viewed positively by management? Does this new product project enhance the firm’s competencies?
• Competitive Insulation: Can the product’s advantage be maintained against competitive retaliation?
9-20

Concept Testing Cautions and Concerns
• If the prime benefit is a personal sense (aroma, taste).
• If the concept involves new art and entertainment.
• If the concept embodies a new technology that users cannot visualize.
• If concept testing is mishandled by management, then blamed for product failure.
• If customers simply do not know what problems they have.
9-21

What Is a Product Concept Statement?
• A statement about anticipated product features (form or technology) that will yield selected benefits relative to other products or problem solutions already available.
• Example: “A new electric razor whose screen is so thin it can cut closer than any other electric razor on the market.”
• Recall the importance of getting responses to product concepts and not simply ideas (Chapter 4).
9-22

Purposes of Concept Testing
• To identify very poor concepts so that they can be eliminated.
• To estimate (at least crudely) the sales or trial rate the product would enjoy (buying intentions, early projection of market share).
• To help develop the idea (e.g. make tradeoffs among attributes).
9-23

Procedure for a Concept Test
• Prepare concept statement
• Clarify specific purposes
• Decide format(s)
• Select commercialization
• Determine price(s)
• Select respondent type(s)
• Select response situation
• Define the interview
• Conduct trial interviews
• Interview, tabulate, analyze
9-24
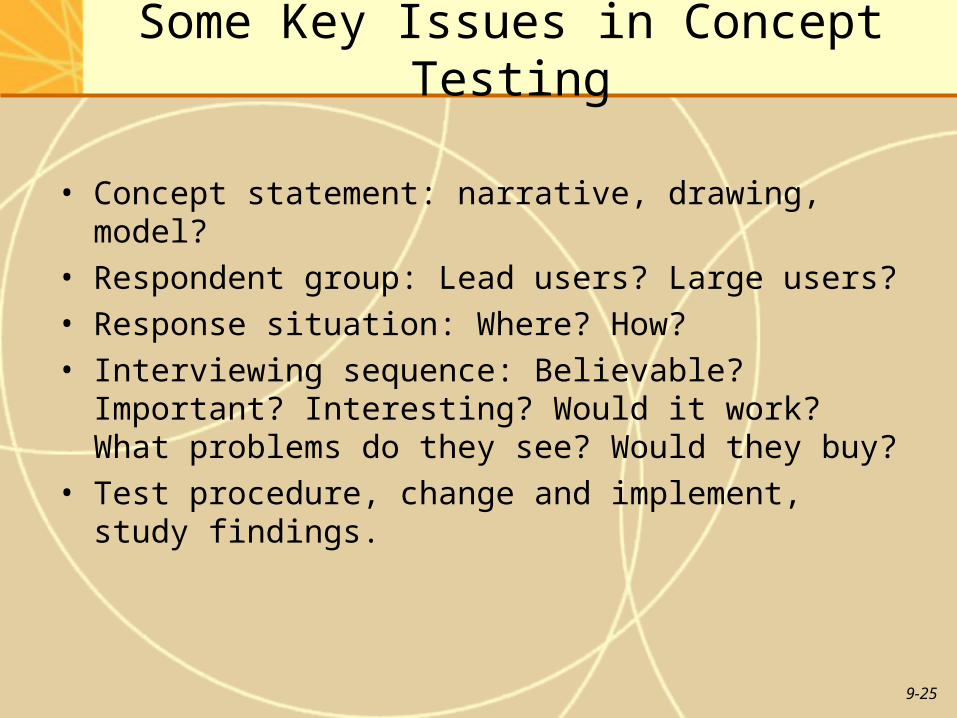
Some Key Issues in Concept Testing
• Concept statement: narrative, drawing, model?• Respondent group: Lead users? Large users?• Response situation: Where? How?• Interviewing sequence: Believable? Important?
Interesting? Would it work? What problems do they see? Would they buy?
• Test procedure, change and implement, study findings.
9-25

Mail Concept Test -- Verbal Description
Here is a tasty, sparkling beverage that quenches thirst, refreshes, and makes the mouth tingle with a delightful flavor blend of orange, mint, and lime.
It helps adults (and kids too) control weight by reducing the craving for sweets and between-meal snacks. And, best of all, it contains absolutely no calories.
Comes in 12-ounce cans or bottles and costs 60 cents each.
1. How different, if at all, do you think this diet soft drink would be from other available products now on the market that might be compared with it?
Very different ( ) ( ) ( ) ( ) Not at all different
2. Assuming you tried the product described above and liked it, about how often do you think you would buy it?
More than once a week ( ) ( ) ( ) ( ) ( ) ( ) Would never buy it
Figure 9.1
9-26
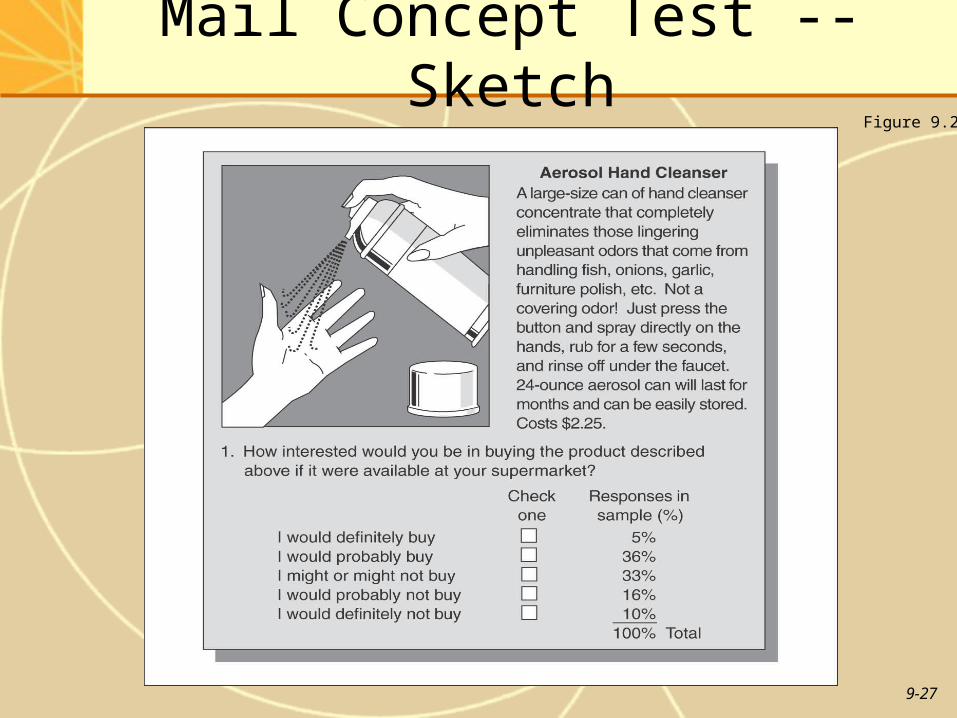
Mail Concept Test -- SketchFigure 9.2
9-27

Co
mfo
rtFashion
Segment 2 Segment 3
Segment 1x
xx x xx
x xx
x
x
xx
x x
xx
x x xx
xx
x
xx
x
x xxx
x x xx
xx
x xx
x
x x
Benefit Segmentation in Swimsuit Market Figure 9.3
9-28

Aqualine
Islands
Splash
Molokai
Sunflare
23
1
FashionC
om
fort
Joint Space Map Showing Ideal Points
Figure 9.4
9-29

Aqualine
Islands
Splash
Molokai
Sunflare
Benefit Segment 2
Benefit Segment 1
Overall
Fashion
Co
mfo
rt
X
Joint Space Map Showing Ideal VectorsFigure 9.5
9-30

Conjoint Analysis in Concept Testing: EZPass
• Key attributes: number of accounts to open, how to apply and pay for an account, number of EZPass lanes at each toll plaza, etc.
• 11-minute video of product in action and its effectiveness in reducing congestion.
• Respondents all received the video, a questionnaire, and scenario cards showing combinations of attributes.
9-31
Chapter 10
The Full Screen
McGraw-Hill/Irwin – Merle Crawford Anthony Di Benedetto 9th Edition Copyright © 2008 by The McGraw-Hill Companies, Inc. All Rights Reserved.

The Full Screen
• A step often seen as a necessary evil, yet very powerful and with long-lasting effects.
• Forces pre-technical evaluation, and summarizes what must be done.
• Methods range from simple checklists to complex mathematical models.
10-33

Purposes of the Full Screen
• To decide whether technical resources should be devoted to the project.– Feasibility of technical accomplishment -- can we do it?– Feasibility of commercial accomplishment -- do we want to do
it?
• To help manage the process.– Recycle and rework concepts– Rank order good concepts– Track appraisals of failed concepts
• To encourage cross-functional communication.
10-34

Screening Alternatives
• Judgment/Managerial Opinion
• Concept Test followed by Sales Forecast
(if only issue is whether consumers will like it)
• Scoring Models
10-35

A Simple Scoring Model
ValuesFactors: 4 Points 3 Points 2 Points 1 PointDegree of FunNumber of PeopleAffordabilityCapability
MuchOver 5EasilyVery
Some4 to 5ProbablyGood
Little2 to 3MaybeSome
NoneUnder 2NoLittle
Student's Scores: Skiing Boating HikingFun 4 3 4People 4 4 2Affordability 2 4 4Capability 1 4 3 Totals 11 15 13
Answer: Go boating.
Figure 10.2
10-36
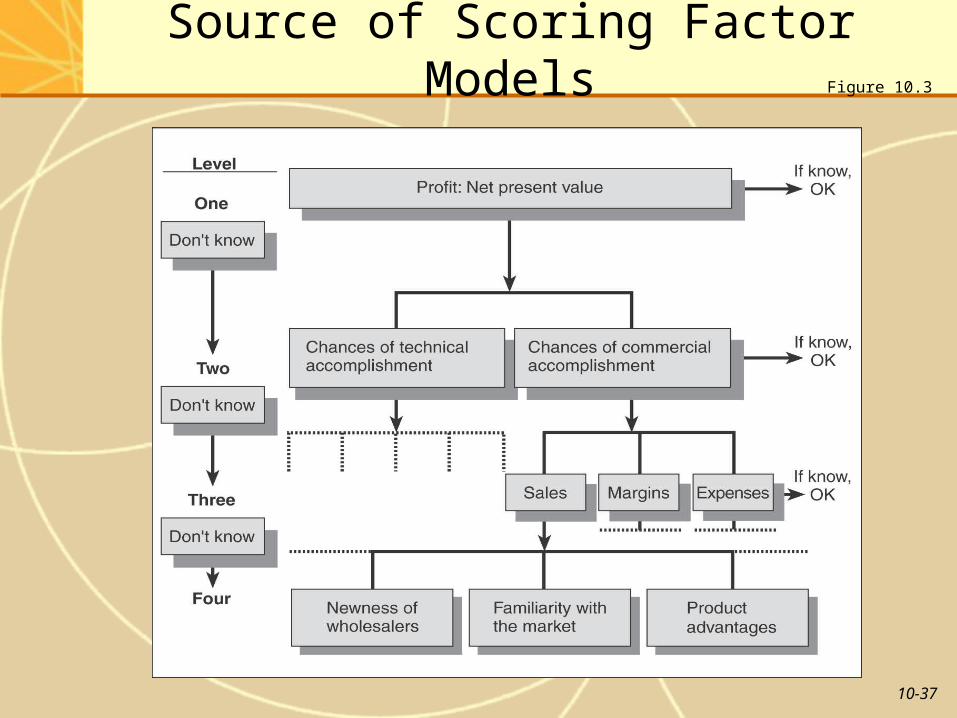
Source of Scoring Factor ModelsFigure 10.3
10-37
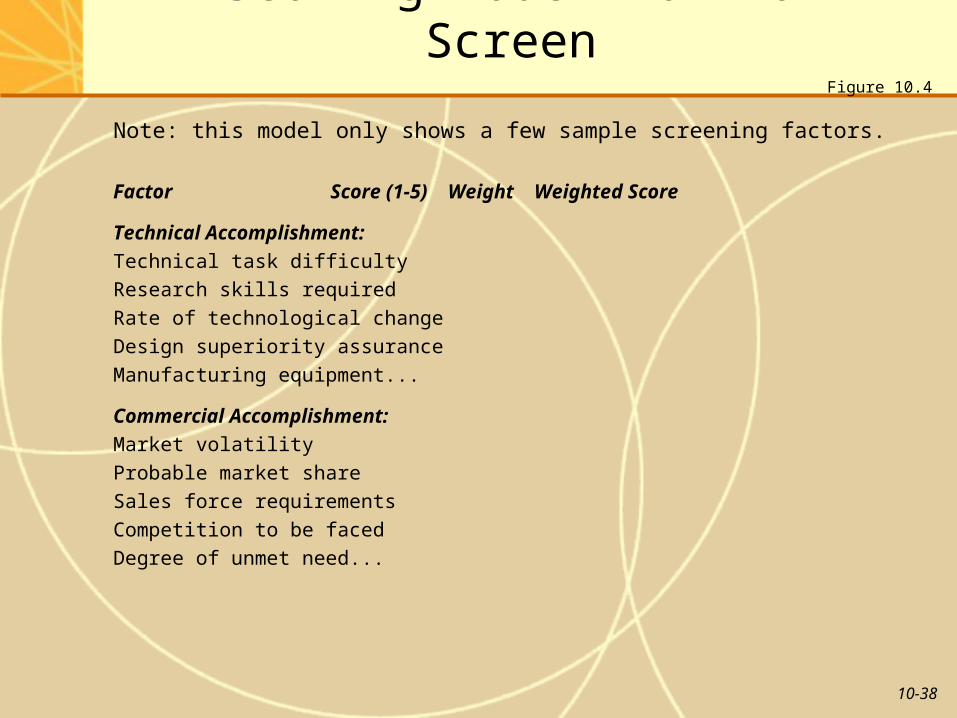
A Scoring Model for Full Screen
Note: this model only shows a few sample screening factors.
Factor Score (1-5) Weight Weighted Score
Technical Accomplishment:
Technical task difficulty
Research skills required
Rate of technological change
Design superiority assurance
Manufacturing equipment...
Commercial Accomplishment:
Market volatility
Probable market share
Sales force requirements
Competition to be faced
Degree of unmet need...
Figure 10.4
10-38
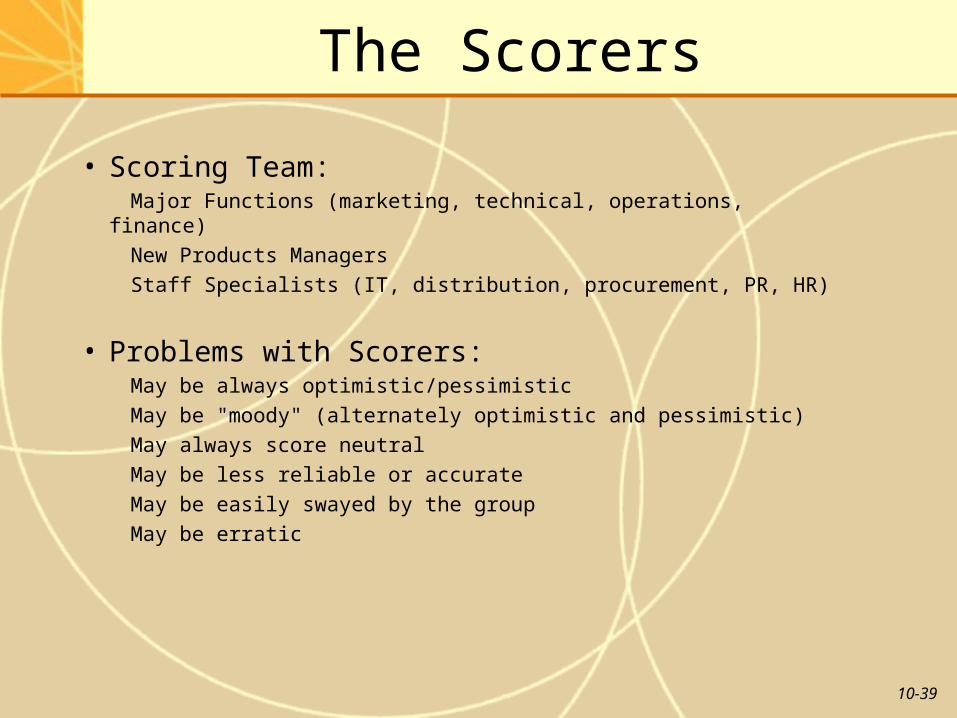
The Scorers
• Scoring Team: Major Functions (marketing, technical, operations, finance)
New Products Managers
Staff Specialists (IT, distribution, procurement, PR, HR)
• Problems with Scorers: May be always optimistic/pessimistic
May be "moody" (alternately optimistic and pessimistic)
May always score neutral
May be less reliable or accurate
May be easily swayed by the group
May be erratic
10-39

Industrial Research Institute Scoring Model
Technical success factors:
• Proprietary Position• Competencies/Skills• Technical Complexity• Access to and Effective
Use of External Technology
• Manufacturing Capability
Commercial success factors:
• Customer/Market Need • Market/Brand
Recognition • Channels to Market• Customer Strength• Raw
Materials/Components Supply
• Safety, Health and Environmental Risks
Source: John Davis, Alan Fusfield, Eric Scriven, and Gary Tritle, “Determining a Project’s Probability of Success,” Research-Technology Management, May-June 2001, pp. 51-57.
Figure 10.5
10-40

Alternatives to the Full Screen
• Profile Sheet
• Empirical Model
• Expert Systems
• Analytic Hierarchy Process
10-41
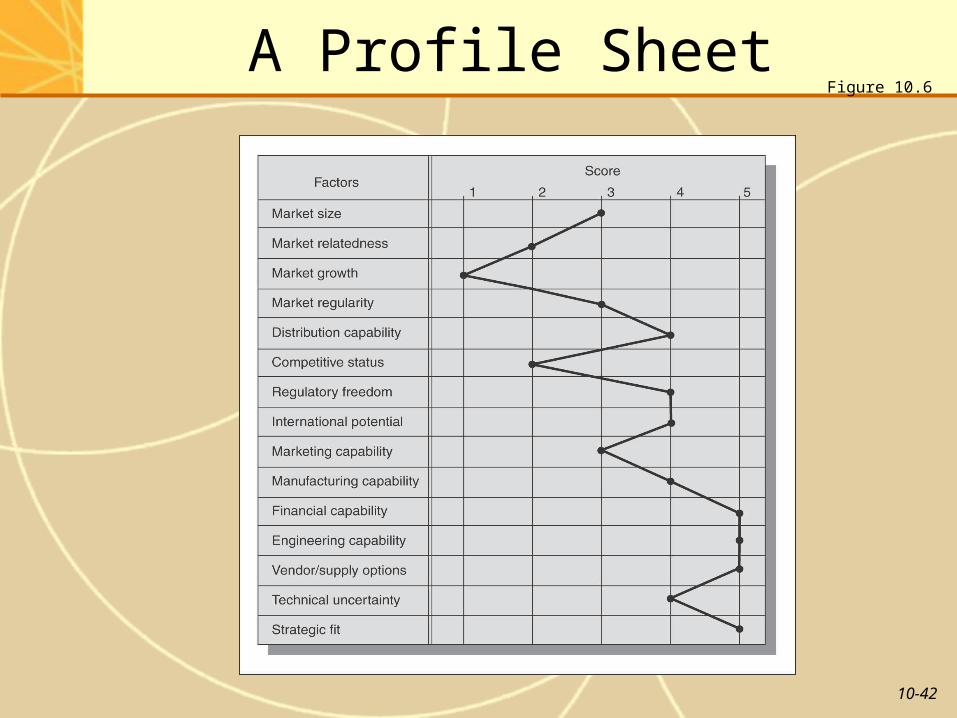
A Profile SheetFigure 10.6
10-42
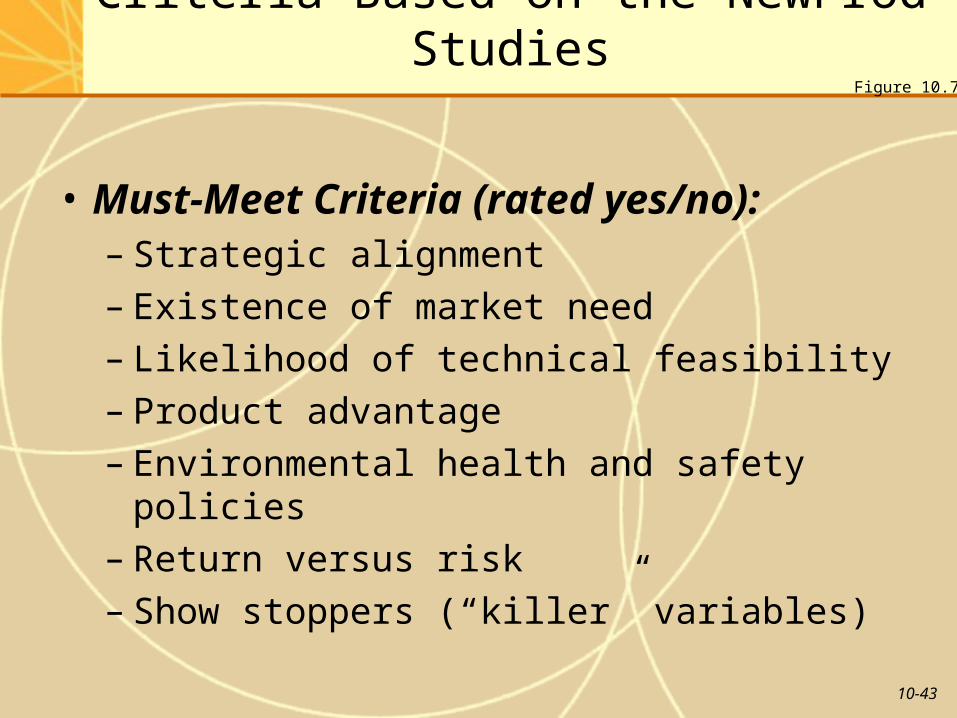
Criteria Based on the NewProd Studies
• Must-Meet Criteria (rated yes/no):– Strategic alignment– Existence of market need– Likelihood of technical feasibility– Product advantage– Environmental health and safety policies– Return versus risk– Show stoppers (“killer” variables)
Figure 10.7
10-43

Criteria Based on the NewProd Studies(continued)
• Should-Meet Criteria (rated on scales):– Strategic (alignment and importance)– Product advantage (unique benefits, meets
customer needs, provides value for money)– Market attractiveness (size, growth rate)– Synergies (marketing, distribution, technical,
manufacturing expertise)– Technical feasibility (complexity, uncertainty)– Risk vs. return (NPV, IRR, ROI, payback)
Figure 10.7(cont’d.)
10-44

Products 1, 2, 3, and 4
Goal: Select Best NPD Project
Market Fit Tech. Fit Dollar Risk Uncertainty
Product Line
Channel
Logistics
Tim ing
Price
Sal es Force
Desi gn
Materials
Suppl y
Mfg. Tech.
Mfg. Tim ing
DifferentialAdvantage
Payof fs
Losses
Unmit igated
Mi tigated
Product Line
Analytic Hierarchy Process (AHP)Figure 10.9
10-45

Ranking of Alternatives:Project Overall WeightP1 0.381 xxxxxxxxxxxxxxxxxxxxxxxxxxxxxxxxxxxxxx
P2 0.275 xxxxxxxxxxxxxxxxxxxxxxxxxxxx
P3 0.175 xxxxxxxxxxxxxxxxxx
P4 0.170 xxxxxxxxxxxxxxxxx
Abbreviated Output from AHPFigure 10.9
10-46

Chapter 11
Sales Forecasting and Financial Analysis
McGraw-Hill/Irwin – Merle Crawford Anthony Di Benedetto 9th Edition Copyright © 2008 by The McGraw-Hill Companies, Inc. All Rights Reserved.

Why Financial Analysis for New Products is Difficult
• Target users don’t know.
• If they know they might not tell us.
• Poor execution of market research.
• Market dynamics.• Uncertainties about
marketing support.
• Biased internal attitudes.
• Poor accounting.• Rushing products to
market.• Basing forecasts on
history.• Technology
revolutions.
11-48

Forecasting the Demand For Satellite Radio
• In 2000: forecast for 2007 was 36 million subscribers.
• In 2001: forecast revised to 16 million.
• By end of 2006: actual number of subscribers = 11 million.
Source: Sarah McBride, “Until Recently Full Of Promise, Satellite Radio Runs Into Static,” Wall Street Journal, August 15, 2006, pp. A1-A9.
11-49

Forecasters Are Often Right
In 1967 they said we would have:• Artificial organs in humans by 1982.• Human organ transplants by 1987.• Credit cards almost eliminating currency by 1986.• Automation throughout industry including some
managerial decision making by 1987.• Landing on moon by 1970.• Three of four Americans living in cities or towns by
1986.• Expenditures for recreation and entertainment doubled
by 1986.
Figure 11.1
11-50
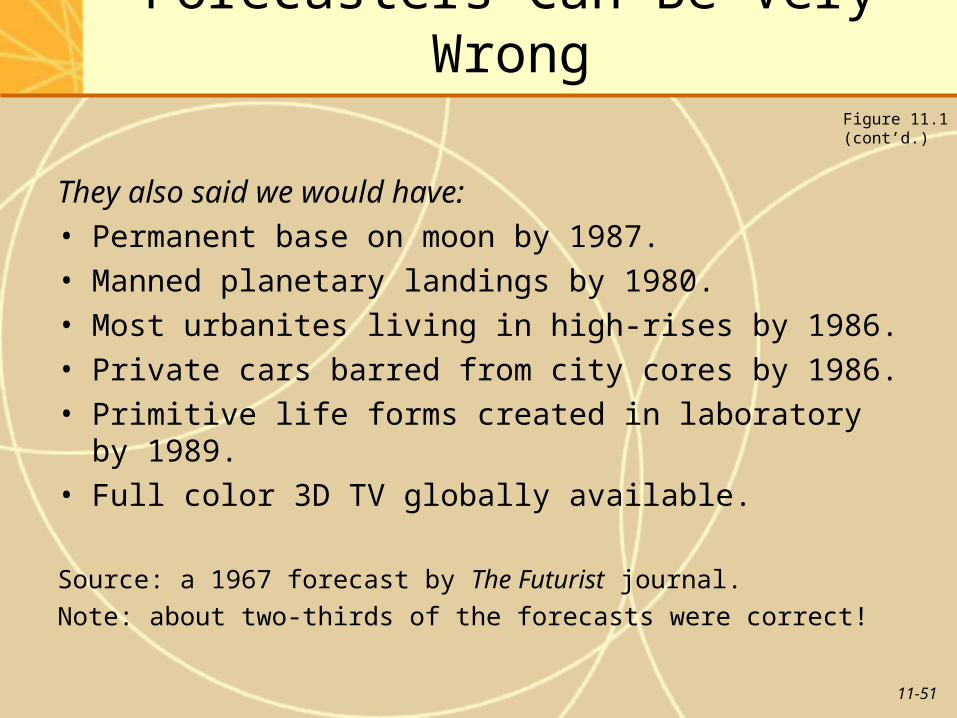
Forecasters Can Be Very Wrong
They also said we would have:• Permanent base on moon by 1987.• Manned planetary landings by 1980.• Most urbanites living in high-rises by 1986.• Private cars barred from city cores by 1986.• Primitive life forms created in laboratory by 1989.• Full color 3D TV globally available.
Source: a 1967 forecast by The Futurist journal.
Note: about two-thirds of the forecasts were correct!
Figure 11.1(cont’d.)
11-51
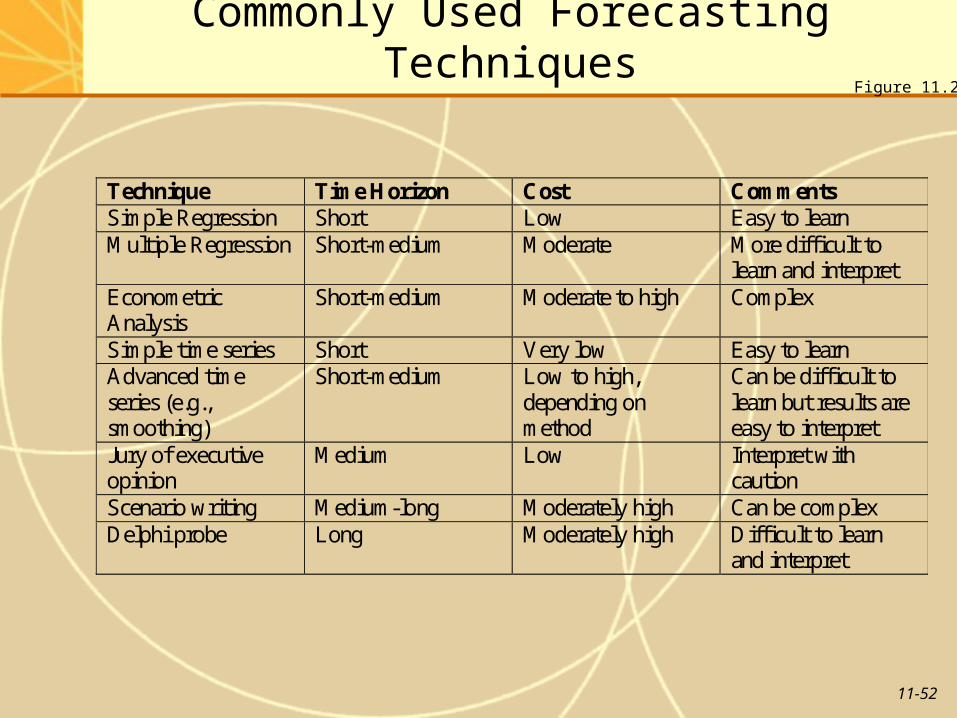
Commonly Used Forecasting Techniques
Technique Time Horizon Cost Comments Simple Regression Short Low Easy to learn Multiple Regression Short-medium Moderate More difficult to
learn and interpret Econometric Analysis
Short-medium Moderate to high Complex
Simple time series Short Very low Easy to learn Advanced time series (e.g., smoothing)
Short-medium Low to high, depending on method
Can be difficult to learn but results are easy to interpret
Jury of executive opinion
Medium Low Interpret with caution
Scenario writing Medium-long Moderately high Can be complex Delphi probe Long Moderately high Difficult to learn
and interpret
Figure 11.2
11-52

Forecasting Satellite Radio Sales Using Purchase Intentions
• In 2000, 213 million vehicles in U.S.• 95% availability, 40% awareness.• Market potential = 213 million x 95% x 40% = 81 million.• Assume half can afford satellite radio = 40.5 million.• Percentage that will be among the first to try the new
technology = 16%.• Forecast for first year = 40.5 million x 16% = 6.4 million.• Projected yearly growth rate = 10%.• Assuming this growth rate, by end of 2006, expected
total sales = about 10 million.• Note: not too far from the attained number = 11 million!
11-53

Handling Problems in Financial Analysis
• Improve your existing new products process.• Use the life cycle concept of financial analysis.• Reduce dependence on poor forecasts.
– Forecast what you know.– Approve situations, not numbers (recall Campbell
Soup example)– Commit to low-cost development and marketing.– Be prepared to handle the risks.– Don’t use one standard format for financial
analysis.– Improve current financial forecasting methods.
11-54

Forecasting Sales Using Purchase Intentions
• Use top-two-boxes scores obtained in concept testing, appropriately adjusted or calibrated.
• Example: Recall for hand cleanser from Chapter 9:– Definitely buy = 5%– Probably buy = 36%
• Based on history, calibrate as follows:– 80% of “definitelies” actually buy– 33% of “probablies” actually buy
• Forecasted market share = (0.8)(5%) + (0.33)(36%) = 16%.
11-55

Forecasting Sales Using Purchase Intentions (continued)
• The 16% forecast assumes 100% awareness and availability.
• Adjust downwards to account for incomplete awareness and availability.
• If 60% of the market is aware of the product and has it available, market share is recalculated to (0.6) (16%) = 9.6%.
11-56

Forecasting Sales Using A-T-A-R Model
• Assume awareness = 90% and availability =67%.• Trial rate = 16% (16% of the market that is aware of the
product and has it available tries it at least once).• RS = proportion who switch to new product = 70%.• Rr = proportion who repeat purchase the new product =
60%.• Rt = Long-run repeat purchase = RS /(1+Rs-Rr) = 63.6%.• Market Share = T x Rt x Awareness x Availability =
16% x 63.6% x 90% x 67% = 6.14%.
The following bar chart shows this procedure graphically.
11-57

0.9
0.603
0.0965 0.0614
0%10%20%30%40%50%60%70%80%90%
100%
Aware Available Trial Repeat
A-T-A-R Model Results:Bar Chart Format Figure 11.3
11-58

Bass Model Forecast ofProduct Diffusion
Figure 11.4
11-59

The Life Cycle of AssessmentFigure 11.5
11-60

Calculating New Product’s Required Rate of Return
Risk
% ReturnReqd. Rateof Return
Cost ofCapital
Avg. Riskof Firm
Risk on Proposed Product
Figure 11.6
11-61

Hurdle Rates on Returns and Other Measures
Figure 11.8
Hurdle RateProduct Strategic Role or Purpose Sales Return on
InvestmentMarket Share
IncreaseA Combat competitive entry $3,000,000 10% 0 PointsB Establish foothold in new
market$2,000,000 17% 15 Points
C Capitalize on existingmarkets
$1,000,000 12% 1 Point
Explanation: the hurdles should reflect a product’s purpose,or assignment. Example: we might accept a very lowshare increase for an item that simply capitalized on ourexisting market position.
11-62

Hoechst-U.S. Scoring Model
Key Factors Rating Scale (from 1 - 10)1 ………. 4 ………. 7 ………. 10
Probability of TechnicalSuccess
<20% probability >90% probability
Probability of CommercialSuccess
<25% probability >90% probability
Reward Small Payback < 3 yearsBusiness-Strategy Fit R&D independent of R&D strongly supports
business strategy business strategyStrategic Leverage "One-of-a-kind"/ Many proprietary
dead end opportunities
Source: Adapted from Robert G. Cooper, Scott J. Edgett, and Elko J. Kleinschmidt. Portfolio Managementfor New Products, McMaster University, Hamilton, Ontario, Canada, 1997, pp. 24-28.
Figure 11.9
11-63
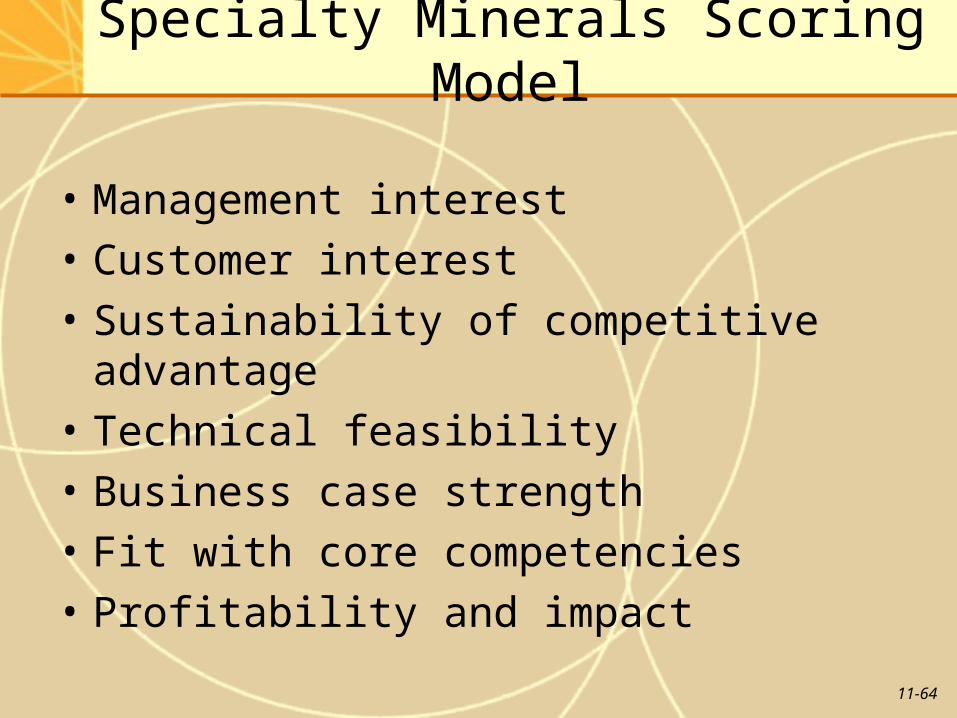
Specialty Minerals Scoring Model
• Management interest
• Customer interest
• Sustainability of competitive advantage
• Technical feasibility
• Business case strength
• Fit with core competencies
• Profitability and impact
11-64

Manufacturing Firm Scoring Model (disguised)
• Net Present Value
• Internal Rate of Return
• Strategic Importance of Project (how well it aligns with business strategy)
• Probability of Technical Success
Note how in each of these examples, the model contains financial as well as strategic criteria.
11-65

A Tool for Concept Evaluation
Strategic FitDoes the concept fit with corporate vision?
Customer FitDoes the concept allow the customer to better meet consumer needs?
Consumer FitDoes the concept satisfy an unmet consumer need?
Market AttractivenessIs the concept unique relative to competition?
Technical FeasibilityIs the concept feasible and protectable?
Financial ReturnsWill the project break even soon?
Source: Erika B. Seamon, “Achieving Growth Through an Innovative Culture,” in P. Belliveau, A. Griffin, and S. M. Somermeyer, The PDMA Handbook 3 For New Product Development, Wiley, 2004, Ch. 1.
Figure 11.10
11-66

Chapter 12
Product Protocol
McGraw-Hill/Irwin – Merle Crawford Anthony Di Benedetto 9th Edition Copyright © 2008 by The McGraw-Hill Companies, Inc. All Rights Reserved.

A Marketing-R&D Conversation
MKTG: We’re going to be needing a solar-powered version of our standard garage door opener, soon.
R&D: How reliable should it be? Should it be controllable from inside the house? Should we use new electronics technology? Should it be separate from the collector system already installed?
MKTG: Well, you’re the technical people, make some recommendations.
R&D: In other words, you don’t know what you want.MKTG: Cripes, do we have to tell you everything? What do you do for a
living? How should we know where the collectors should be located?
R&D: If we go electronic, you’ll say it’s too expensive. If we go electric, you’ll say we’re living in the 1930s. Wherever we put the collectors you will say we are wrong. If we guess, you second-guess.
MKTG: OK. Put the collectors on the garage roof.R&D: That probably can’t be done.
Figure 12.1
12-68

Why Have A Protocol?
• Also known as product requirements, product definition, etc.
• Doesn’t it seem obvious and simple?
• Actually is one of the top success factors distinguishing winning from losing projects.
• Maybe because it involves more than technical aspects.
12-69

Purposes of Protocol
• To determine what marketing and R&D groups need to do their work.– Think concept life cycle: this is more than a simple concept
statement, yet less than we will have when the first prototype is available.
– Try to identify the key deliverables at this point.• To communicate essential to all players and integrate their actions,
directing outcomes consistent with the full screen and financials.• To set boundaries on development process or cycle time.• To permit the development process to be managed (i.e., what needs
to be done, when, why, how, by whom, whether).
12-70
Contents of a Product Protocol
• Target market
• Product positioning
• Product attributes (benefits)
• Competitive comparison
• Augmentation dimensions
• Timing
• Marketing requirements
• Financial requirements
• Production requirements
• Regulatory requirements
• Corporate strategy requirements
• Potholes
12-71

Narrow Version of Protocol: End-User “I Want” List
This is the “I Want” list for a new lawn leaf blower /vacuum. These are benefits -- how they are achieved is determined during development.
• Manufacturer stands behind product -- two year full warranty.• Electrically and mechanically safe. Good value and lasts a long time
-- top quality component parts, state-of-the-art manufacturing.• Makes yard clean-up easier -- most powerful blower you can buy.• Converts from blower to vacuum without tools.• Electrical cord does not come loose.• Can be used with existing extension cord.• Easy to maneuver.• Clog-free vacuuming.• Tubes go together and stay together.
12-72

A Sample Protocol: Trash Disposal System
• Must automate trash disposal at factory cost not to exceed $800.• Clean, ventilated, odor-free, no chance of combustion.• Must be safe enough to be operated by children; outside storage
safeguards against children and animals.• Size must be small enough to work as kitchen appliance, to provide
easy access and eliminate need for double handling of trash.• Simple installation• Decor adaptable to different user tastes.• If design requires opening of exterior walls, structural integrity and
insulation against elements must be maintained.• User-friendly, automatic operation, easy to maintain by technical
servicepeople.
Figure 12.3
12-73

Example of Difficulty of Translating Idea Into Product: Morton Hot Salt
• The Voice of the Customer (VOC) might suggest this is a great idea.
• But how to translate it into a product? How spicy? How different from regular chili powder? Flavored more like cayenne or chipotle?
• Without specific, precise information, food engineers are left just to guess.
12-74

Quality Function Deployment (QFD)
• A technique designed to insure that customer needs are focused on throughout the new product project.
• First step is the House of Quality (HOQ): gathers desired attributes from customers and translates them to engineering characteristics.
• Requires inputs from marketing and technical personnel; encourages communication and cooperation across the functional areas.
12-75

QFD and Its House of QualityFigure 12.4
12-76

Benefits in QFD Example
• Compatibility
• Print quality
• Ease of use
• Productivity
12-77
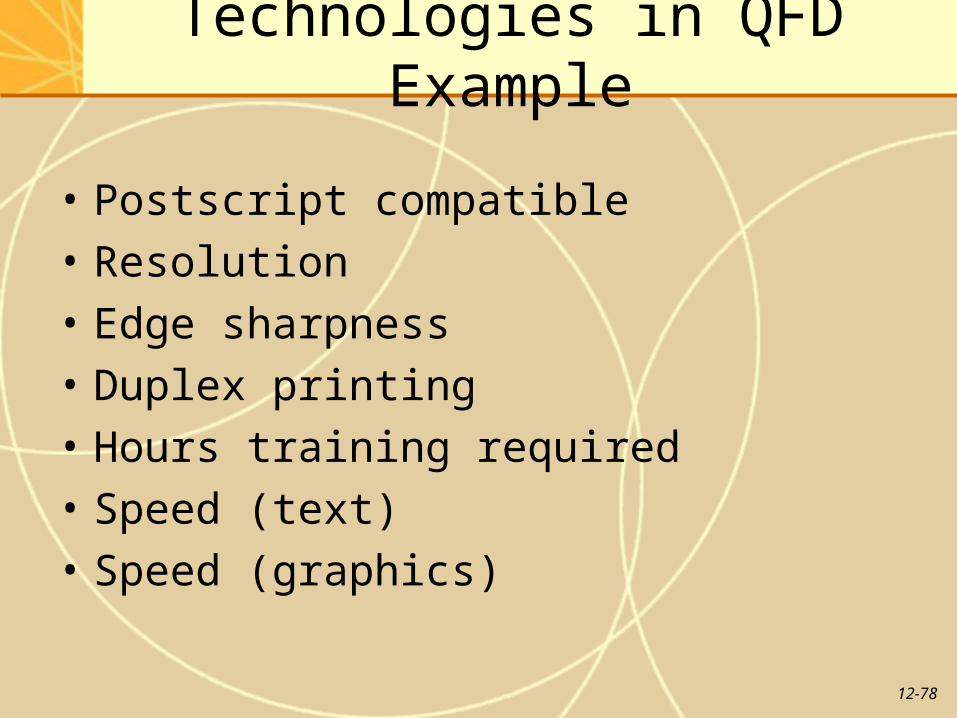
Technologies in QFD Example
• Postscript compatible
• Resolution
• Edge sharpness
• Duplex printing
• Hours training required
• Speed (text)
• Speed (graphics)
12-78

Tradeoffs in QFD Example
• Improving resolution slows down text printing and really slows down graphics printing.
• Increasing edge sharpness slows down both text and graphics printing.
• Duplex printing speeds up text and graphics printing.
• Postscript compatibility improves resolution and edge sharpness.
12-79

House of Quality:
Source: Adapted from John R. Hauser and Don Clausing, “The House of Quality,” Harvard Business Review, May-June, 1988.
Customer Attributes Engineering Characteristics
Engineering Characteristics Parts Characteristics
Parts Characteristics Process Operations
Process Operations Production Requirements
Parts Deployment:
Process Planning:
Production Planning:
Converted to:
Converted to:
Converted to:
Converted to:
Moving to Later Stages of QFDFigure 12.5
12-80

QFD Realities
• Substantial cost and time commitment.• Only mixed results in some applications.• Requires top management support and
commitment.• Must be viewed internally as an investment.• Requires good functional integration.• May work better if the team members have a
successful track record of working together before.
12-81

Improving QFD Efficiency
• Concentrate on only some of the Engineering Characteristics: the most critical, or the ones where improvements are easy to accomplish.
• Organize the Engineering Characteristics into groups, and designate responsibility to functional areas.
• Do cost-benefit analysis on each Engineering Characteristic to determine which provide the greatest benefit relative to cost of improvement.
12-82