Research Findings from the NCAT Test Track APAI Winter Conference Indianapolis, December 14, 2010.

Guidelines and template for developing a vital statistics report
18 September 2017
1

Prepared byHelge Brunborg and Vibeke Oestreich Nielsen Statistics Norway
INSERT PUBLICATION DATA
PUBLISHED BY ECA, ESCAP AND STATISTICS NORWAY
2

Part One: Guidelines The guidelines in part one of this document contains an introductory part with general information, such as purpose and how to use the guidelines and the template.
The table of contents for tables, boxes, figures and graphs specify where the guidelines information can be found.
For information on the template, see the table of contents for the template in part two of the document.
Table of contents for the guidelinesTABLE OF CONTENTS FOR THE GUIDELINES....................................................................................................3
GUIDELINE BOXES.......................................................................................................................................... 4
GUIDELINE TABLES AND FIGURES AND MAPS.................................................................................................5
ACKNOWLEDGEMENTS.................................................................................................................................. 6
ABBREVIATIONS AND ACRONYMS................................................................................................................. 7
A. PURPOSE............................................................................................................................................... 8
B. RATIONALE.................................................................................................................................................8
C. TARGET AUDIENCE AND IMPORTANT CONSIDERATIONS........................................................................9
D. LINK WITH OTHER ACTIVITIES................................................................................................................ 9
E. INITIAL FOCUS ON KEY VITAL EVENTS...................................................................................................10
F. REASONS FOR PUBLISHING A VITAL STATISTICS REPORT..................................................11
G. HOW TO USE THIS DOCUMENT............................................................................................................12
PART TWO - VITAL STATISTICS REPORT TEMPLATE.......................................................................................14
ANNEXES..................................................................................................................................................... 79
Annex I: Civil registration variables
Annex II: Tabulation plan
Annex III: Registration forms
REFERENCES................................................................................................................................................ 79
3

Guideline boxesBox 1: Definition of vital statistics and vital events for statistical purposes (BLUE BOX)
Box 2 Tabulation programs (BLUE BOX)
Box 3 Confidentiality of data (BLUE BOX)
Box 4 Civil registration and vital statistics organization in Kenya (GREEN BOX)
Box 5 Sub counties and CR office overview for Kenya (GREEN BOX)
Box 6 Timeliness of birth registration (GREEN BOX)
Box 7 Civil Registration and Population Registers (BLUE BOX)
Box 8 Importance of coordination and cooperation (BLUE BOX)
Box 9 General and country examples of incentives and disincentives for registration (BLUE BOX)
Box 10 Data quality (BLUE BOX)
BoX 11 Coverage and completeness (BLUE BOX)
Box 12 Examples of graphs and maps showing completeness of birth registration (GREEN BOX)
Box 13 Tabulation plan (BLUE BOX)
Box 14 Presenting data (BLUE BOX)
Box 15 Key birth registration variables (BLUE BOX)
Box 16 Calculating birth indicators (Blue box)
Box 17 Country examples of birth registration tables and graphs (GREEN BOX)
Box 18 Key death registration variables (BLUE BOX)Box 19. Calculating death indicators (Blue box)
Box 19 Calculating death indicators (BLUE BOX)
Box 20 Age and sex specific mortality rates in South Africa (GREEN BOX)
Box 21 Summary cause of death table from Kenya (GREEN BOX)
Box 22 Why marriage and divorce statistics? (BLUE BOX)
Box 23 Examples of tables on figures on marriages and divorces in Botswana (GREEN BOX)
Box 24 Expected population size and distribution (GREEN BOX)
Guideline tables and figures
4

FIGURE B4.1 FLOW OF VITAL EVENTS INFORMATION OCCURRING IN THE HOME OR COMMUNITY, KENYA, 2013.................................................................................................ERROR: REFERENCE SOURCE NOT FOUND
FIGURE B4.2 FLOW OF VITAL EVENTS INFORMATION OCCURRING IN A MEDICAL INSTITUTION, KENYA, 2013........................................................................................................ERROR: REFERENCE SOURCE NOT FOUND
FIGURE B5 MAP AND EXCERPT OF TABLE OF LOCAL CR OFFICES IN KENYA.. . .ERROR: REFERENCE SOURCE NOT FOUND
FIGURE B6.1 BIRTH REGISTRATIONS BY STATUS OF REGISTRATION, SOUTH AFRICA, 1994–2014...........ERROR: REFERENCE SOURCE NOT FOUND
FIGURE B6.2 TABLE OR PIE CHART SHOWING WHETHER BIRTHS WERE REGISTERED CURRENTLY OR LATE (OCCURRED IN PREVIOUS CALENDAR YEARS) IN BOTSWANA, 2012.....ERROR: REFERENCE SOURCE NOT FOUND
FIGURE B12.1 GRAPH SHOWING BIRTH REGISTRATION COMPLETENESS IN KENYA, 2010-2013.............ERROR: REFERENCE SOURCE NOT FOUND
FIGURE B12.2 MAP SHOWING BIRTH REGISTRATION COMPLETENESS IN INDIA, 2010........ERROR: REFERENCE SOURCE NOT FOUND
FIGURE B12.3 MAP SHOWING BIRTH REGISTRATION COMPLETENESS IN SOUTH AFRICA, 2014.............ERROR: REFERENCE SOURCE NOT FOUND
TABLE B13.1 EXAMPLE OF TABULATION PLAN FOR LIVE BIRTHS........ERROR: REFERENCE SOURCE NOT FOUND
TABLE B15.1 EXAMPLE OF BIRTH REGISTRATION VARIABLES.............ERROR: REFERENCE SOURCE NOT FOUND
TABLE B17.1 SUMMARY STATISTICS ON BIRTHS, BOTSWANA: 2011-14.........ERROR: REFERENCE SOURCE NOT FOUND
FIGURE B17.1 LIVE BIRTHS BY ETHNIC GROUP IN MALAYSIA..............ERROR: REFERENCE SOURCE NOT FOUND
FIGURE B17.2 BIRTH REGISTRATIONS ACCORDING TO REGISTRATION STATUS, SOUTH AFRICA: 1994–2014........................................................................................................ERROR: REFERENCE SOURCE NOT FOUND
FIGURE B17.3 REGISTERED BIRTHS, INDIA: 1981-2010 (IN 100,000). . .ERROR: REFERENCE SOURCE NOT FOUND
FIGURE B17.4 DISTRIBUTION OF REGISTERED BIRTHS AND DEATHS, INDIA: 2010. ERROR: REFERENCE SOURCE NOT FOUND
FIGURE B20.1 EXAMPLE OF AGE AND SEX SPECIFIC MORTALITY RATES FROM SOUTH AFRICA..............ERROR: REFERENCE SOURCE NOT FOUND
FIGURE B20.2 INFANT MORTALITY RATE, ALGERIA: 1980-2015..........ERROR: REFERENCE SOURCE NOT FOUND
TABLE B20.1 EXAMPLE OF LIFE TABLE (ABRIDGED, I.E. FOR AGE GROUPS).. . .ERROR: REFERENCE SOURCE NOT FOUND
FIGURE B20.3 LIFE EXPECTANCY AT BIRTH FOR MALES AND FEMALES SEX IN NORWAY 1850-2015.......ERROR: REFERENCE SOURCE NOT FOUND
TABLE B21.1 THE TEN LEADING CAUSES OF DEATH IN KENYA, 2013...ERROR: REFERENCE SOURCE NOT FOUND
FIGURE B21.1 TEN PRINCIPAL CAUSES OF DEATHS IN MALAYSIA, 2014.........ERROR: REFERENCE SOURCE NOT FOUND
FIGURE B23.1 TOTAL NUMBER OF MARRIAGES REGISTERED, BOTSWANA, 2005-2014......................................
FIGURE B23.2 REGISTERED MARRIAGES BY MONTH OF REGISTRATION, BOTSWANA, 2014
5

TABLE B23.1 MEAN AGE AT FIRST MARRIAGE, BOTSWANA 2005-
2014………………………………………………Acknowledgements
This guide and template for developing a vital statistics report was drafted by Helge Brunborg and Vibeke Oestreich Nielsen of Statistics Norway. The document was requested by the Economic Commission for Africa (ECA) and the Economic and Social Commission for Asia and the Pacific (ESCAP) as an input to the ongoing work in both regions on improving the civil registration and vital statistics systems.
The authors are grateful to Anneke Schmider (World Health Organization) for initiating contact with ECA in the development of this report and for her valuable comments. They are also very grateful for comments and suggestions from Raj Gautam Mitra and Gloria Mathenge (ECA), Tanja Sejersen, Sinovia Moonie and Yanhong Zhang (ESCAP), Yacob Zewoldi (African Development Bank consultant), Srdjan Mrkic of the Statistics Division, Carla Abouzahr and Sam Notzon (Bloomberg Data for Health Initiative), Vebjørn Aalandslid (Statistics Norway) and from representatives of the statistical offices of Namibia and Turkey. The authors benefited greatly from the participants at the expert group meeting and interregional seminar on civil registration and vital statistics, held in Addis Ababa from 30 May to 3 June 2016, and from the experiences gained as facilitators of two workshops for representatives of eight countries in Bangkok in 2017, as part of the project to strengthen national capacity in producing and disseminating vital statistics from civil registration records in Asia and the Pacific, organized by ESCAP in 2017, with the support of the Bloomberg Data for Health Initiative.
6

A. PurposeThe purpose of this document is to serve as a guidance tool for producing vital statistics reports vital statistics report from civil registration systems. It is intended especially for countries that have little or no prior experience with preparing such reports. The tool may also serve as a standardized approach for continental and international reporting. The tool has two parts:
Part one: guidelines that explain how the template may be used and that provide support when writing a vital statistics report
Part two: a template outline for a vital statistics report with specifications on what should be included.
B. Rationale
This guideline and template was prepared by Statistics Norway at the request of the Economic Commission for Africa (ECA) and the Economic and Social Commission for Asia and the Pacific (ESCAP). Both organizations have, in recent years, established programmes to strengthen civil registration and vital statistics systems in the countries in their regions.
The Africa programme on accelerated improvement of civil registration and vital statistics was launched in 2012 (Economic Commission for Africa, 2012). In the Yamoussoukro Declaration, African ministers responsible for civil registration during their third conference, held in February 2015, declared that “we commit [ourselves] to analyse and disseminate statistics from civil registration regardless of the level of completeness as a means to establish the state of the system and its development”.1 This template has been prepared to support countries in the realization of this goal.
ESCAP launched the “Get everyone in the picture” initiative in Asia and the Pacific region in 2014 and the regional action framework on civil registration and vital statistics in Asia and the Pacific. The Asia-Pacific civil registration and vital statistics decade (2015–2024) was endorsed by 62 countries in 2014.2 The civil registration and vital statistics =initiative in the ESCAP region prioritizes the production of vital statistics from civil registration systems (Economic and Social Commission for Asia and the Pacific, 2015).
In line with the recent efforts to coordinate improvement of civil registration and vital statistics in the ECA and ESCAP regions and in an effort to establish a standardized model, Statistics Norway was approached with a request to develop a template for a vital statistics report and guidelines to be followed when preparing a vital statistics report. The current document is a first version of this. Further versions will incorporate the experiences of various countries.
1 Available from https://unstats.un.org/unsd/demographic/crvs/Global_CRVS_Docs/news/ThirdConf_resolutions.pdf.
2 See www.unescap.org/our-work/statistics/civil-registration-and-vital-statistics/about.
7

C. Target audience and important considerationsThis guideline and template is for use by national authorities responsible for the production of vital statistics based on civil registration information, primarily in developing countries with little experience in this area. These authorities vary from country to country depending on the institutional responsibilities provided by the country’s legal framework for civil registration and vital statistics, as well as its existing administrative and organizational structures. In most countries, responsibility for the production of a vital statistics report rests with the national statistics office. In some countries, the civil registration office produces statistics pertaining to birth and death events, while in others the Ministry of Health is responsible for the production of statistics on deaths and cause of death. Irrespective of the model adopted, it is indispensable that all involved agencies collaborate in the production of the national vital statistics report.
A major challenge when preparing this template and guidelines document was that the civil registration and vital statistics vary tremendously between countries, from practically non-existent to well-functioning systems. It is therefore difficult to make a template that suits all countries. Certainly, the responsible authorities need to adjust their vital statistics reports to the context of their civil registration and vital statistics systems and the conditions in their own countries.
Given that there are numerous detailed manuals and recommendations on vital statistics, this template and guide is intended mainly for countries with limited data availability and resources. More advanced options have also been included for countries where this is feasible.
D. Link to other activitiesThe quality and reliability of national vital statistics depend on the principles and the processes followed in the production of these statistics. Moreover, it is critical that these statistics respond to the needs and meet the demands of potential users and stakeholders. Therefore, before writing the first vital statistics report, it is useful to involve other parties. Some options are the following:
Conduct a vital statistics stakeholder analysis that identifies the most important national and international users of the vital statistics and their needs
Conduct a rapid and/or comprehensive assessment of the vital statistics system. As part of this investigation, the data requirements of the various users and stakeholders should be identified
Assess the compliance of existing national vital statistics reports with international standards in terms of content and completeness
Another important activity is to align the vital statistics reporting with the national strategy for development of statistics or similar. Doing so will ensure that the vital statistics report is an institutionalized process that is sufficiently planned and resourced. A separate action plan for vital statistics production, outlining activities and their timing, the responsible parties, as well as the resources required, is also beneficial. However, a thorough assessment is not necessary every time a vital statistics report is written.
All these activities should be considered not only for preparing a vital statistics report, but also for supporting the work of building and improving the vital statistics system.
8

Other references that provide additional support and guidance should therefore also be used, namely:
The United Nations Principles and Recommendations for a Vital Statistics System: Revision 3 (2014)
The United Nations handbook, guidelines and training manuals on civil registration and vital statistics systems (2002)
The World Health Organization’s (WHO) strengthening civil registration and vital statistics for births, deaths and causes of death resource kit (2012)
The WHO document entitled Improving the Quality and Use of Birth, Death and Cause-of-death Information: Guidance for a Standards-based Review of Country Practices (2010b)
The Centers for Disease Control and Prevention training course on civil registration and vital statistics systems (2015)
An extensive library of resources related to civil registration and vital statistics, available from www.getinthepicture.org/resources
E. Initial focus on key vital eventsThe current template focuses initially on civil registration and statistics of two vital events, namely, live births and deaths. This is in line with the recommendations of the United Nations (2014) that top priority should be given to live births and to deaths because they are basic to the assessment of population growth as well as the health of the population.
Although the major data source for the vital statistics report outlined here is civil registration of births and deaths, other data sources are required in most countries to obtain estimates of rates and indicators, such as birth and death rates. To find these rates, a figure for the total population is needed. This may, in most countries, be obtained independently from population censuses, population registers, sample surveys and intercensal estimation procedures (United Nations, 2014). With this information, data disaggregated by age, sex, marital status, geographical location or other socioeconomic characteristics can be obtained.
In this first version of the current template, the focus chosen is on births and deaths and there is therefore less material on marriages and divorces, adoptions, legitimations, foetal deaths and marriage annulments.
Information on causes of death is often included in death registration forms, and this is important for monitoring and planning the health sector of a country. The recent epidemic of the Ebola virus in West Africa, as well as the recently endorsed Sustainable Development Goals, have underlined the significance and need to prioritize proper cause of death records and statistics. Given that determining causes of death is a highly technical topic, with few developing countries having good data, cause of death statistics are not described in as much detail as birth and death statistics. Considering the importance of this issue, there are plans to expand on this in a later version or in a separate template and guideline. Countries should nevertheless include available cause of death data in a standard vital statistics report.
9

It is intended that a revised version of this document will be published after a few years. The new version will be an improvement of the present draft, based on the experiences of countries that have used it and it may also be expanded in scope to elaborate on other events.
Internal and external migrations are not considered vital events by the United Nations. These events are nevertheless very important, both in peoples’ lives and for the population development of a country. The inclusion of statistics on such events is encouraged if such data are available, of sufficient quality, and the country has the resources to evaluate and process them properly. This is in line with the recommendations of United Nations (2014) that the aim must be to achieve centralized and peripheral coordination among the civil registration system, the vital statistics system, the general statistical service, population and migration statistical services, health statistics services, etc. Migration will not be covered as a specific topic in the current version of this template.
Recording migrations is particularly important for updating a comprehensive population register. Otherwise, a population register cannot be used to make statistics of the population by age, sex, location and other essential variables. See also box 7 on civil registration and population registers.
F. Reasons for publishing a vital statistics report
1. National planning Vital statistics are used to produce the fundamental demographic and epidemiological measures that are needed in national planning across multiple sectors such as education, labour and health. Birth and death information from civil registration is also critical for a wide range of government activities (e.g., the construction of population registers and other administrative registers) and in commercial enterprises (e.g., life insurance, and marketing of products). In the health sector, vital statistics form the core of a country’s health information system (World Health Organization, 2010c).
The most important reason for developing and publishing a vital statistics report is the needs of the public, the Government, civil society and the international community for data on births and deaths and essential indicators derived from these. Such information is important for monitoring time trends in the country and to study regional variation. Are there, for example, subnational areas with particularly high death rates? Is the birth rate declining or not?
The production and availability of a vital statistics report is a key step towards stimulating and guiding civil registration improvements. For example, regional completeness data will visualize which regions are in most need of improvement. Putting the vital statistic into the public domain provides a demonstration of transparency and openness to scrutiny. On the other hand, it also exposes possible errors and omissions in the available data. However, this can have positive repercussions. By identification of errors in the data, civil registrars and other officials engaged in the collection of civil events information may be stimulated to produce more reliable and accurate registers. At the national level, vital statistics that reflect the inadequate state of the civil registration may stimulate the Government to increase investment for improving the system. In general, a report is a good opportunity to learn from experience. In this regard, it is recommended that all countries produce an annual vital statistics report, even if a relatively low number of vital events are registered.
Moreover, civil registration data also have other potential areas of use, such as establishing school districts and planning regional and local school capacity. Further use includes the planning of health and social services. Civil registration data are essential for updating a population register, which may
10

be used as a basis for identifying persons eligible to vote, that is, for establishing electoral rolls. This is a cost-effective use of government funds and may significantly reduce the costs of holding elections. Population registers are discussed in box 7.
2. Sustainable development goalsThe Sustainable Development Goals replaced the Millennium Development Goals, the latter of which had been adopted in 2000 for the period 2000–2015. Within the Sustainable Development Goals, civil registration and vital statistics are:
A target in their own right (target 16.9 of Goal 16: by 2030, provide legal identity for all, including birth registration)
Necessary for monitoring key outcome indicators, such as maternal mortality and non-communicable disease related deaths
A key strategy for effecting progress in others, such as social inclusion and access to education
There are 17 Sustainable Development Goals, with 169 targets and over 230 global indicators, which were endorsed by the Statistical Commission in March 2016.3
A substantial number of the indicators on sustainable development require information on vital events from a civil registration and vital statistics system. It has been reported that more than 40 per cent of all Sustainable Development Goals statistics could be estimated in full or in part using data originating from a well-functioning system.4
An example is indicator 3.7.2 of Sustainable Development Goal 3 (“Adolescent birth rate (aged 10-14 years; aged 15-19 years) per 1,000 women in that age group”). The numerator of this indicator is based on civil registration and vital statistics data, whereas the denominator requires information on the number of women in five-year age groups. Other examples are the targets under Goal 4 on education and Goal 5 on gender equality, which will require continuous updating of vital statistics and population figures in order to calculate participation rates and measure various forms of gender inequality.
In general, many Sustainable Development Goal indicators require information about the size of the total population or about specific population groups. The most common sources of such data are a recent population census or population projections (see box 24). The best source of population data is a population register, but only a few countries have registers that can produce high-quality statistics on population size and distribution (see box 7). A good civil registration and vital statistics system is a necessity for a good population register.
G. How to use this documentThis document is meant to be a template and guide for writing a vital statistics report based on data provided by a civil registration system. The table of contents in the template (part two) specifies the priority areas that should be covered in a vital statistics report.
3 See www.un.org/sustainabledevelopment/blog/2016/03/un-statistical-commission-endorses-global-indicator-framework/ . 4 See http://unstats.un.org/sdgs/ .
11

In each chapter, the template specifies the areas that should be covered, often with a supplementary comment or specification to make it easier to write about each country. A simple way of doing this is to use the chapters directly to fill in the country specifics. This is why this template will also be available as an electronic Word file on the websites on civil registration and vital statistics of ECA and ESCAP.5 A list of the essential tables and figures that should be included in a vital statistics report are shown at the beginning of the template. The tables and figures to be included in a real vital statistics report will depend on the availability of data and the needs identified in the specific country.
There are many boxes in part two (the template) providing background information on how to develop and write a vital statistics report. The boxes are meant as additional input, some of them providing examples. They are not part of the template as such and are, unless relevant, not meant to be included in the country vital statistics report. To make them easier to use, the boxes have been colour-coded to identify the various purposes. The codes are as follows:
Blue boxes: guidance on how to use the document, as well as thoughts and suggestions from the authors
Green boxes: country examples and extracts from recommendations in the United Nations Principles and Recommendations for a Vital Statistics System: Revision 3 (United Nations, 2014)
Several documents were consulted during the development of this template and guide, in particular the United Nations Principles and Recommendations (2014). This is a comprehensive international guide providing detailed background information that is useful when preparing a vital statistics report. We also consulted past handbooks on civil registration and vital statistics published by the United Nations (2002), several reports from WHO and the Centers for Disease Control training course (2015), which are listed in the references. These handbooks and reports also provide detailed background information for consideration when preparing a vital statistics report.
Reference is made to vital statistics reports from a few countries, in particular, Botswana, India, Kenya and South Africa. References to these reports can be found in the reference list at the end.
5 Available from www.apai-crvs.org and www.getinthepicture.org .
12

Part two: Vital statistics report template
The following sections present the actual proposed content of a vital statistics report. The table of contents presented can serve as a comprehensive model and gives an overview of the topics that should be included. In the various chapters, the text in this template touches upon the relevant areas that should be covered if data are available. Additional guidance, including definitions and explanatory notes, can be found in the text boxes.
Preface A preface is usually a short introduction to the report, why and for whom it is prepared and who contributed. It may be signed by a high-ranking officer, such as the Minister or Permanent Secretary of the Ministry under which the main contributing institution is placed, the Director General of the main contributing institution and/or the head of the department writing the report, depending on the traditions of the institutions in the country.
AcknowledgementsAll parties that contributed to the vital statistics report should be mentioned here. This includes those who contributed financially and those who provided input and suggestions.
Executive summary A short summary of main findings should be presented.
Abbreviations and acronyms The acronyms and abbreviations used in the vital statistics report should be inserted.
ABR Abbreviation
Definitions It is useful to include a list of definitions used in the vital statistics report, especially for terms with varying definitions internationally, such as for live births and completeness of vital registration, including the formula for estimating the completeness rates.
13

Table of contents of the templatePREFACE...................................................................................................................................................... 14
ACKNOWLEDGEMENTS................................................................................................................................ 14
EXECUTIVE SUMMARY................................................................................................................................. 14
ABBREVIATIONS AND ACRONYMS................................................................................................................ 14
DEFINITIONS................................................................................................................................................ 15
*TABLES IN THE TEMPLATE.......................................................................................................................... 15
CHAPTER 1. INTRODUCTION AND BACKGROUND.........................................................................................17
CHAPTER 2. CIVIL REGISTRATION SYSTEM OF THE COUNTRY........................................................................19
2.1. HISTORY................................................................................................................................................192.2. LEGAL AND ADMINISTRATIVE ISSUES............................................................................................................202.3. ORGANIZATIONAL STRUCTURE, REGISTRATION PROCESS AND INFORMATION FLOWS...............................................22TRANSFER OF RECORDS AND INFORMATION FLOW IN THE CIVIL REGISTRATION SYSTEM.......................................................322.4 INCENTIVES AND DISINCENTIVES FOR REGISTRATION...............................................................................................34
CHAPTER 3. DATA QUALITY, COMPLETENESS AND DEFINITIONS...................................................................38
3.1. QUALITY OF DATA....................................................................................................................................383.2. COMPLETENESS.......................................................................................................................................423.3. DEFINITIONS AND SPECIFICATIONS.....................................................................................................................47
CHAPTER 4. BIRTHS...................................................................................................................................... 50
CHAPTER 5. DEATHS.................................................................................................................................... 63
CHAPTER 6. CAUSES OF DEATH.................................................................................................................... 71
CHAPTER 7. MARRIAGES AND DIVORCES......................................................................................................74
CHAPTER 8. SUMMARY TABLES................................................................................................................... 77
ANNEXES..................................................................................................................................................... 79
REFERENCES................................................................................................................................................ 79
14

Tables in the templateThe list below shows the tables that have been included in this template. A country vital statistics report should ideally contain many more tables, figures and maps than this, given that they often provide good visualizations of data.
TABLE 3.1. NUMBER AND SHARE OF REGISTERED LIVE BIRTHS BY REGION....................................................43
TABLE 3.2. SHARE OF REGISTERED LIVE BIRTHS OVER TIME AND BY REGION.................................................45
TABLE 4.1. REGISTERED LIVE BIRTHS BY PLACE OF OCCURRENCE, 201X.........................................................54
TABLE 4.2. REGISTERED LIVE BIRTHS* BY REGION, 201X...............................................................................55
TABLE 4.3. REGISTERED LIVE BIRTHS BY PLACE OF BIRTH, 201X.....................................................................55
TABLE 4.4 REGISTERED LIVE BIRTHS BY GENDER, 201X..................................................................................55
TABLE 4.5 REGISTERED LIVE BIRTHS BY AGE OF MOTHER, 201X....................................................................59
TABLE 5.1 REGISTERED DEATHS BY AGE AND GENDER, 201X.........................................................................66
TABLE 5.2. NUMBER OF REGISTERED DEATHS BY PLACE OF DEATH, 201X.....................................................66
TABLE 5.3 REGISTERED DEATHS BY REGION, 201X........................................................................................67
TABLE 5.4 REGISTERED DEATHS BY MONTH OF DEATH, 201X........................................................................67
TABLE 7.1 TIME SERIES OF VITAL EVENTS, 201X............................................................................................77
TABLE 7.2. TIME SERIES OF VITAL RATES, 201X.............................................................................................77
15

Chapter 1. Introduction and background This chapter should provide information on the objectives of writing the vital statistics report, including the needs of the public, the Government and international organizations for data on births and deaths. A description of the background and rationale for the report should also be included.
There should be an explanation of the scope of the report, including the vital events covered and the year(s) for which the statistics are released. It would also be useful to include a small paragraph in the introduction on the current level of registration coverage and completeness, recent improvements (or deteriorations) and plans for future improvements.
The content of each chapter of the report should also be described under this heading. If the same set-up is used as in this template, the major contents of the chapters would be as described.
Chapter 2 should describe the civil registration system, including history, legal background, administrative structure, local and regional systems, data flows, relationship between the civil registration and vital statistics authorities and agencies, incentives and disincentives for civil registration, and plans for further improvement of civil registration and vital statistics. The length of this chapter would depend on previous descriptions of the system and the capacity of the office. If the system has been described earlier, a short summary with recent updates or changes and a link or reference to the earlier report might be sufficient.
Chapter 3 should present the quality and completeness of the civil registration data, in the form of tables and, preferably, graphs and maps. Both the absolute numbers of registered events should be shown and, if possible, the completeness rates. Data for several years are useful for showing the time trends at the national and regional levels to see where the need for improvement is the greatest.
Chapter 4 should be devoted to basic tables and an analysis of registered live births and the most essential fertility indicators. Graphs and maps may also be presented.
Chapter 5 should cover tables and analysis of registered deaths and the most essential mortality indicators.
Cause of death statistics are presented in chapter 6. According to the United Nations Principles and Recommendations (2014), causes of death should be included as part of the mortality tabulations. If cause of death data are available, statistics should therefore be presented in the vital statistics report, even if the data are incomplete.
A chapter on marriages and divorces should be included in the vital statistics report if such data are recorded and available. Key information to include can be found in chapter 7.
Chapter 8 should show key summary tables and graphs from the civil registration and vital statistics system, based on the United Nations Principles and Recommendations (2014), if possible combined with estimates of the population size for various groups.
At the end of the vital statistics report, there should be: an appendix on the definitions used, which also specifies the formulas used for computation of the different indicators presented
16

An appendix that includes copies of notification and registration forms for the vital events presented in the vital statistics report
A list of references, including reports, selected available vital statistics reports and other reference material
Box 1: Definition of vital statistics and vital events for statistical purposes (BLUE BOX)
Vital statistics constitute the collection of statistics on vital events in the lifetime of a person and relevant characteristics of the events themselves and of the person and persons concerned. Vital statistics provide crucial and critical information on the population in a country.
For statistical purposes, vital events concern the life and death of individuals and their family members. Vital events proper concern life and death and include live births, deaths and foetal deaths. Dual events are those occurring simultaneously in the lives of two individuals, which cannot occur again in the life of either individual without a previous change to his or her status. Those events include marriage, registered partnership, separation, divorce, legal dissolution of registered partnerships and annulment of marriage. Lastly, vertical family events are those involving a descendant; they comprise adoption, legitimation and recognition. The focus of this document is births and deaths. The recommended definition of the event for which data are collected for vital statistics purposes are given in part I of the United Nations Principles and Recommendations (2014).
END BOX 1.
Box 2. Tabulation programmes (BLUE BOX)
This template does not provide any advice on how to create tables. There are many different programmes that are useful in the tabulation process, depending on the format of the data and the experience of the users. For many of these programmes, there are good online training solutions. The programmes are of varying complexity and cost. Information on them can easily be found on the Internet. Some examples are:
Excel: for many purposes, this program is sufficient. Its advantage is that most institutions already have it and have experience using it
CSPro (Census and Survey Processing System): a free program provided by the United States Census Bureau that, among other things, can be used for data entry and tabulations
R: another freeware, used mainly for data analysis, but which can also be used for tabulations
There are also other statistical packages that can be very helpful, but which require licence payments. Some of the most common programs are:
o SPSS (Statistical Package for the Social Sciences)o SAS (Statistical Analysis System)o Stata (Data analysis and statistical software)
END BOX 2.
17
Chapter 2. Civil registration system of the country
Before presenting the data, the civil registration and vital statistics system should be presented to the audience as background information. This could be brief or long, depending on the availability of this information in earlier reports or elsewhere, the situation in the country and the capacity of the office publishing the vital statistics report.
The description should highlight the most important historical, legal, organizational, administrative and practical issues. To help in this description, we have formulated a number of questions that would be useful to answer or, at least, to address.
Many of the suggestions in this chapter are based on the United Nations Principles and Recommendations (2014), the United Nations handbooks, guidelines and training manuals on civil registration and vital statistics systems (2002), ESCAP guidelines for setting and monitoring the goals and targets of the regional action framework on civil registration and vital statistics in Asia and the Pacific and vital statistics reports from Botswana, Kenya and South Africa in the ECA region and India in the ESCAP region. A list of reference materials is also provided at the end of this document. Countries may find it useful to consult these publications. It may also be useful to refer to the tools and guidelines developed by ECA,6 ESCAP (Economic and Social Commission for Asia and the Pacific, 2015),7 WHO (World Health Organization, 2010b),8 the Centers for Disease Control and Prevention (2015) and others to review and assess civil registration and vital statistics systems, reports, reviews and assessments that have been undertaken in the country. The ESCAP and WHO publications, in particular, include a number of relevant questions and issues that would guide the development of a well-functioning civil registration and vital statistics system.
2.1. HistoryIt is useful for the audience of the vital statistics report to learn about the history of civil registration and the production of vital statistics in the country. Key questions that should be addressed are the following:
When was civil registration introduced and by whom? What where the reasons for introducing civil registration? Was civil registration initially including everybody or did it only include some regions or
population groups? Have there been important changes in civil registration over time on issues such as
legislation, organization and completeness? Does the country produce vital statistics reports? How frequently are they published and
what is the reference period covered by each report?
2.2. Legal and administrative issues
Countries have different legal traditions, with some having very detailed legislation, while others have a tradition of writing rather general laws but developing detailed regulations and directives. A
6 See See www.uneca.org/sites/default/files/uploaded-documents/Statistics/CRVS/assessment_tool_en.pdf . 7 See also www.unescap.org/resources/guidelines-setting-and-monitoring-goals-and-targets-regional-action-framework-civil-0 , http://www.unescap.org/our-work/statistics/civil-registration-and-vital-statistics/about or getinthepicture.org . 8 See also www.emro.who.int/civil-registration-statistics/assesment/crvs-rapid-assessments.html .
18

reference to acts, laws, regulations and directives related to civil registration and vital statistics would be necessary, preferably with links to central documents available online. It would also be useful to note whether the law specifies in detail the items of information to be collected at the time of registration. Such documents should be annexed to the report.
Key issues that should be addressed are listed below in italics:
Are there special laws or acts for registration of vital events?
It would be useful to identify the laws and when they were introduced and what the most important paragraphs are.
Does the legislation specify which vital events should be registered?
Births and deaths are most commonly registered. The legislation may also indicate whether the registration of births and deaths is compulsory.
What are the timelines for vital event registration?
In accordance with the legal framework of the country, when should vital events be registered? Is there a deadline for registering a vital event? Is there a difference in how soon an event is registered, depending on where the vital event takes place and what kind of vital event it is? Is there a difference between birth and death registration? If yes, then both should be specified. In general, in actual practice, are vital events usually registered immediately or only some days, weeks or months afterwards? Is the time limit for late registration aligned to international recommendations of up to one year?
Does the legislation specify how the registration should be done?
Does it specify who can do the registration, for example, only the civil registration office or also health personnel and/or other key actors?
is it usually the case that for institutional births the institution is responsible for providing a notification of a birth to the parents? What about non-institutional births? Are the parents responsible for obtaining a birth notification from a midwife, village chief or other respected person or do they have to register the birth elsewhere afterwards?
Does the legislation specify which information should be included when registering?
Typical key information could be name of person, birth or death date, etc.
Does the legislation specify who can be registered? Can the vital events of all residents be registered or only those of citizens? Is it, for example, possible to register vital events for citizens of other countries, including refugees and stateless persons? If yes, under which conditions?
In some countries, the law specifies that every birth should be registered, but, in practice, persons with a foreign or an undetermined nationality are often denied the registration of their births.
Is it specified in the legislation which administrative units should register vital events, that is, name of the institution, geographic level, etc.?
19
For example, is it specified that registration should be done by local health facilities or by civil registration offices? Can vital events be registered outside the country? Where?
Are there any fees related to registration?
Does the person registering a vital event have within the time stipulated by law or regulation to pay a fee to the government registrar? If possible, state where in the law this is specified and how it is regulated.
Is there a penalty for late and delayed registration? What is considered “late” in the law?
Some countries have a timeline of six months for early registration, whereas other countries have no timeline at all.
What do the relevant laws say about sharing and the confidentiality of data?
Is it specified which data can be shared with other institutions and which cannot? Are there exceptions for producing statistics or other areas? (See box 7.)
How are the registration laws implemented?
If possible, say something about to what extent the intentions of the registration law are followed in different parts of the country and for different population groups.
Is there a system for issuing and administering identification cards that is integrated with the civil registration system or is there a separate system for identification management? Are personal identification numbers used to identify individuals in the civil registration system and other systems?
Does the legislation assign overall responsibility for official vital statistics to one organization?
Has this responsibility, for example, been assigned to the national statistics office or to another agency? If not and if there is more than one publication on vital statistics data, is there one which is specified as the official source?
Box 3. Confidentiality of data (BLUE BOX)
In some countries, data on vital events are not transferred from one government agency to another, purportedly for confidentiality reasons. In general, individual data should not be shared with others, but exceptions should be made for agencies producing official statistics. This is also in line with the United Nations Principles and Recommendations (2014, p. 12, paras. 36-37), in which the importance of safeguarding vital statistics microdata and having the data used only for authorized statistical or administrative purposes is emphasized.
Many countries have a national statistical system based on a Statistics Act, and the national statistics office has the overall responsibility for all official statistics, including checking the quality of statistics produced by other public agencies. However, in some countries, the capacity of these office for doing this is limited.
20

It is very important for the office compiling vital statistics9 to have microdata on all vital events, because it will do a much better job in tabulation and analysis if it has access to such data. In particular, microdata are necessary for checking for and detecting errors, which can be fed back to the civil registration system.
Norway, for example, has a very strict Personal Data Act and a strong data protection authority. Nevertheless, the transfer of microdata from the national population registry and other public registers to Statistics Norway is permitted by the Statistics Act, even with the inclusion of name and personal identification number. Statistics Norway is, however, not allowed to publish information on individuals or anonymous information that can be linked to specific individuals, except data in an aggregate form such as in tables, analyses and research reports.
In April 2015, the European Union passed a specific regulation on this topic, in which it was clearly stated that national statistics offices should have free access to administrative registers and the possibility of using administrative records for statistics. In the regulation, it was also stated that, when a new administrative register is established, the national statistics office should be consulted in order to see how best to use information from the register to produce statistics.10In Botswana, vital statistics information is captured by three organizations, namely, the Department of Civil and National Registration, Ministry of Health and Administration of Justice. Data are transferred to Statistics Botswana for analysis and reporting (Statistics Botswana, 2014). In Kenya, the annual vital statistics report is produced by the Civil Registration Department, in collaboration with the Kenya National Bureau of Statistics (Civil Registration Department, 2014).
In general, it should be noted that both the civil registration authority and the national statistics office should have good routines in place to protect the data from misuse and use by unauthorized persons. This includes limited or controlled access to buildings and to servers and computers that contain the microdata and the registration of all use of the data by date, time and person.
END BOX 3.
2.3. Organizational structure, registration process and information flows
The description of the organizational structure should cover the two following issues:
How the civil registration and vital statistics system is organized between agencies at the central level, who has which responsibilities and the data flow between the various agencies
How the various agencies are organized internally, the data flow between the various units and administrative levels and their responsibilities
In order for the audience to get a quick overview, it may be useful to present flowcharts of the interlinkages and data flows. Box 4 presents some examples of how this can be done (one general, B4.1, and two for Kenya, B4.2 and B4.3).
Figure B4.1 presents a possible way of showing the overall structure and data flows within and between agencies. Such a structure includes:
9 In most countries, that the national statistics produces the vital statistics, but not everywhere.10 See http://eur-lex.europa.eu/legal-content/EN/TXT/PDF/?uri=CELEX:32015R0759&from=EN.
21

Regional levels of registration offices. In some countries, there are only one or two levels, while in others there can be three or more. In the example, there are three levels. It is useful to mention the number of local registration offices and the number of regional offices
Flow of information from one unit to another. In the figure, it is assumed that the local health facility is the first point of registration. The arrows show how the information flows go from there. It is assumed that information is shared with the local civil registration office, but, in some countries, there are no registration offices at the local level. In some countries, information may also be sent directly to the Ministry of Health or the vital statistics compiling office
Data flow at central level. It is common that the data flow from the civil register to the vital statistics compiling office, as shown in the figure. In some countries, the civil registration authority carries out the compilation and statistical work itself, while, in others, a ministry, often the Ministry of Health, might be responsible
22

23

Box 4. civil registration and vital statistics organization (GREEN BOX)
Figure B4.1 Possible organizational chart presenting multisectoral health facility-based engagements at various levels
It is possible to split the information in figure B4.1 into two or more figures, presenting various levels or reporting schemes. Figure B4.1 does not provide information on the responsibilities of the various actors involved. ECA has developed a general figure showing possible data flow and the responsibilities of the various actors at the central level.11
Figures B4.2 and B4.3 show two charts taken from a civil registration and vital statistics assessment for Kenya. They show the flow of information on vital events that occur at home, in the community or in a health facility. The 2013 vital statistics report for Kenya (Civil Registration Department, 2014) gives a more detailed explanation, which is quoted below as an example of how a civil registration and vital statistics system at the local level can be described:
The first chart shows that assistant chiefs are responsible for notifying events that occur at home or in the community to the local civil registration office (CRO). The registration assistant enters information on an official registration form. This form has two parts that contain a matching serial number—an Acknowledgment of Birth Notification (ABN) in the case of a birth and a Burial Permit in the case of a death—and a registration form. The ABN is a perforated slip that is part of the birth registration form. The death registration form has a detachable section called the Burial Permit. The registration assistant retains the counterfoil copy of the ABN or Burial Permit and gives the original slip to the parents or next of kin as proof of notification, which they later submit to the CRO to obtain an official certificate. The local assistant sends the registration form, including the original and the duplicate, to the CRO, who retains the counterfoil of the duplicate. The CRO forwards the duplicate to the national Civil Registration Department, which transfers vital events data to the National Bureau of Statistics.
Figure B4.211 Available from http://apai-crvs.org.
24

Flow of vital events information occurring in the home or community in Kenya, 2013
Source: Measure Evaluation Kenya Associate Award (2013).
Figure B4.3Flow of vital events information occurring in a medical institution in Kenya, 2013
25

Source: Measure Evaluation Kenya Associate Award (2013).
End BOX 4
Registration process and information flows
In this section, following the overall presentation of the organization in the previous chapter, the processes and information flows should be presented in more detail.
The vital statistics report, especially if it is published for the first time, should include a description of how a vital event is registered in the country. It may be useful to present the registration of births and deaths separately, given that there are important differences between these events, although there are also similarities for events occurring at health facilities. A graph may be included here or in the respective vital events chapter on the data flows for each event. It may be important to provide separate charts for the registration processes of institutional and non-institutional events, that is, events occurring outside health institutions. If the process is different for the different vital events, charts should be presented separately for each event, as shown in figures B4.2 and B4.3 for Kenya (see box 4).
The description of the registration process should include the following key issues:
Where do the vital events usually occur? At home, at a medical facility or elsewhere?
If there is available information, it is useful to know the share of births and deaths taking place at the various locations. These shares are quite different for births and deaths in most countries, so information should be included separately for both. A table or graph showing the figures by place of occurrence, such as in box 4, could be included here.
Where are the vital events usually registered?
Are they registered at a medical facility or at a local registration office? Can births and deaths be registered at medical institutions or only at local civil registration offices, or both? Are there differences between birth and death registration on this?
For vital events occurring in a health facility, the registration process is often initiated there, either by health personnel or by civil registration staff located there. It is important to describe the system that has been established for notification of the event, registration of the event and possible certification of the event. The division of labour between the various institutions has to be clearly explained, describing the role of the health facility and what falls under the responsibility of the local civil registration office and other roles, such as the local government if it is involved in the process. For births (and deaths) occurring at home or elsewhere in the community, informants, that is, the affected family members (parents or next of kin) or those designated by law, need to initiate the registration process. This is usually done by reporting the event to the local registration office within the period required by law. This is important for collecting current vital events information.
The report should include a map or a table showing the various regional divisions and the registration service points in the country, including the lowest administrative unit where the registration of vital events takes place. The table should ideally include regional codes, etc. A good example of this can
26

be found in the Kenya vital statistics report for 2013, which shows a map of the subcounties in Kenya and a list of local civil registration offices in each county (see box 5).
Box 5. Subcounties and civil registration office overview for Kenya (GREEN BOX)
Figure B5.1Map and excerpt of table of local civil registration offices in Kenya
Source: Civil Registration Department (2014).
END BOX 5.
How are the vital events usually registered?
Information on a vital event is usually recorded at a local registration office. It is useful to know if this information is entered into a book, on a paper list, a separate paper form or slip for each event, a computer/electronic database or by any other means. If the data are computerized, are the data entered at a stand-alone computer or through the Internet into a local, regional or national server? In cases that rely on paper forms, is all the information in the forms recorded and made available electronically in a database?
Are there procedures for checking the quality of data?
Are there procedures for verification of information received and entered? Is there a supervisor who has as his/her responsibility to verify that the information has been entered correctly?
Late or delayed registration
How soon after the occurrence is the vital event registered? How is this related to the law on registration? What is the share of late registrations for births and deaths?
There are two issues with regard to late or delayed registration: The first issue is vital events that are registered after the deadline for registration according to the law of the country, called late or
27

delayed registrations. There is no international recommendation on this, and national laws usually range from three months (or less) to one year (or more). Some, but far from all, countries have introduced a special fee for late registrations. Such fees may encourage people to register earlier, but they may also have the effect of discouraging some people from registering their vital events at all.
The second issue is registrations that arrive too late for inclusion in the annual (or monthly or quarterly) statistics. There is no international recommendation on this. The Nordic countries, for example, have a deadline of 1 February in the calendar year succeeding the year x under consideration. Vital event records that arrive after 1 February are included in the vital statistics for the current calendar year (x+1). This is more or less compensated for by events that arrive too late for the current year and that are included in the following year (x+2). In periods with rapid changes in demographic events, such as births, however, the number of registered events for a year may be too low (or high). For most countries, a cut-off date of 1 February may be too soon. In Botswana, for example, “Timely registration are births that were registered within 60 days of occurrence as stipulated in the Births and Deaths Act.” (Statistics Botswana, 2014).
A graph or table showing the proportion of vital events that are registered within the timelines set by the law would be useful. It would also be useful to know whether in actual practice the vital events are registered immediately or only some days, weeks, months or years afterwards. Box 6 provides examples of how timelines are presented in South Africa and Botswana. In the 2012 vital statistics report for Botswana, for example, there is a table and a chart showing whether the births were registered currently or late (i.e., occurred in previous calendar years). Another table shows how soon the births were registered (within 1 month, 1-3 months, etc.).
It may also be useful to make a table showing when (e.g., how late) the events that took place in a specific year were registered. Box 6 also provides an example of this.
It would be useful to mention whether the registration of births is linked to other public services, such as immunization, the use of other health services or enrolment in social security programmes
Some countries with low birth registration sometimes link registration to other public services in order to increase registration rates for older children or grown-ups. This may be considered as a form of delayed registration of births. For the purpose of legal rights and protection, this is very useful. For vital statistics it is, however, far from ideal. One reason is that these delayed registrations cannot be used in vital statistics compilation.
Issuance of documentation
Does the institution where the vital event occurred issue a notification document on the birth or death to the relatives or those designated persons by law?
Does the local registration office issue birth and death certificates or are these issued by another office? If yes, what is the procedure? Does the local civil registrar transmit the recorded information to the office responsible for issuing the certificates? How is this done: on paper or electronically?
28

Box 6: Timeliness of birth registration (GREEN BOX)
This box provides a few examples relating to the timeliness of registration. Figure B6.1 is from South Africa’s vital statistics report and presents recent trends in current and late registrations. In South Africa, the law requires that registration be done within 30 days of a birth (defined as current registration). Figure B6.2 presents the time taken for the registration of births and deaths in 2014 in Botswana.
Figure B6.1Birth registrations by status of registration in South Africa, 1994–2014
Source: Statistics South Africa (2015a).
Figure B6.2Table or pie chart showing whether births were registered currently or late (occurred in previous calendar years) in Botswana, 2012
29

Source: Statistics Botswana (2014).
Table B6.1 is an example of how late registrations can be illustrated in an alternative way. It shows the number of births in the years 2013-2016 by the year of registration. The numbers are for a real country but changed so that the specific country is not identified. It shows that less than one quarter of the births are registered in the same year as they occurred and that a significant proportion of the births were registered fully three years after the occurrence. The recommendation for this country would be to try to speed up the registration of births to be able to publish more timely vital statistics. In addition, delayed registration of this magnitude is likely to miss many births owing to infant deaths.
Table B6.1Births by year of occurrence and year of registration
Year of Occurrence
Year of registration
2013 2014 2015 2016 Total
2013 12 675 0 0 0 12 6752014 37 130 13 670 0 0 50 8002015 1 865 40 175 21 695 0 63 7352016 4 830 1 960 29 205 17 945 53 940Total 56 500 55 805 50 900 17 945
Percentage of births registered in each year2013 22 0 0 02014 66 24 0 02015 3 72 43 02016 9 4 57 100
100 100 100 100
END BOX 6.Box 7. Civil registration and population registers (BLUE BOX)
Confusion about population registers is common. In United Nations (1969), the term “population register” is defined as “an individualized data system, that is, a mechanism of continuous recording, and/or of coordinated linkage, of selected information pertaining to each member of the resident population of a country in such a way to provide the possibility of determining up-to-date
30

information concerning the size and characteristics of that population at selected time intervals”. A population register has information both about the vital events (flow variables) and the status of the population (stock variables), such as the population by age and sex, usually for the residents of the country. A complete population register may provide population data on a regular basis, in addition to vital statistics, on a regular and permanent basis, including at low geographical levels. Relatively few countries, primarily the Nordic countries, have high-quality population registers that are used to produce vital and other statistics.
An important condition is that the register be updated with migrations: external migrations for national estimates and internal migrations if regional estimates are required.
There are other registers that are sometimes misunderstood as population registers. One type is a register of vital events, where registered births and deaths are recorded (computerized or paper-based). This is not a population register unless the register also includes information on the status of the total population of a country or region, and this information is updated regularly with records of births and deaths, as well as migration records, preferably both internal and external.
Another type of administrative register is a national identification register (or database), as part of the identity management system of a country. This usually includes data about all identification cards that have been issued to a population above a certain age, usually 18 years. Such registers have been established in many countries in recent years, including Botswana, India, Kenya, Pakistan, South Africa and Thailand. Such registers are not proper population registers, given that they normally do not contain unique identification numbers for everybody and because they are usually not updated with deaths and migrations on a continuous or regular basis.
Registers of vital events and national identification cards have been merged in some countries, for example, in Botswana and Lesotho, but are separate in most countries, such as Ethiopia, India and Kenya.
To conclude, civil registration is an essential and necessary condition for running a population register. However, civil registration data are usually insufficient for establishing a population register, which should also include persons who have not experienced a vital event recently. This can be done by utilizing data from a recent population census or a special registration of everybody in the population. In Statistics Norway (2014, pp. 8-9), the role that civil registration can play in the building up of a population register through various stages is described.
END BOX 7
Transfer of records and information flow in the civil registration system
Once the actual registration process has been described, it should be explained how the records are transferred from the local registration office (or medical institution) to a higher administrative level, regionally and/or nationally. In many countries, there are differences between the information flows of the vital events. If this is the case, the various processes should all be presented. A few key issues to consider are:
From which and to which office or institution are the records on vital events transferred? Is all information on the vital registration records transferred or only part of it?
31

For example, if the health sector is responsible for registration, are data from the vital registration records first transferred to the civil registration office at the local level or are they transferred directly to a regional health or civil registration office? These records can either be the original record of the registration document or a copy of this, or an aggregate of many records.
Are the transfers done electronically or on paper?
In the previous chapter, specifications were made on how data were registered locally. If the registration was not done with an online system, are there different systems for recording the information at various organizational levels, that is, on paper locally or regionally and electronically at the centre? Are all local offices reporting the civil events on paper or are some reporting electronically? Is the system electronic from the lowest administrative level at which registration takes place to the national level?
With regard to the following key points, there should be an agreement with the stakeholder concerned (e.g., civil registration office, Ministry of Health or national statistics office), preferably through a memorandum of understanding that should be updated from time to time.
If the information and data are transferred electronically, how is this done?
Which is the main approach for data transfer: online, by mobile phone or tablet or offline using memory sticks or similar?
How often are the data transferred: daily, monthly, annually or irregularly?
Are there differences in the frequency of data transfer by reporting level and to whom are the data transferred? Are there regional differences in efficiency and delivery upon agreed time?
Are data transferred on an individual or aggregate level? How is confidentiality protected and maintained?
This should also be presented for the various stages of the data transfer. Key information is whether the organization(s) that work on compiling vital statistics has (have) access to microdata or not and, if yes, to which data they have access. This is because microdata make it easier to check for errors and prepare the relevant tables, as discussed in box 3. With aggregate data, there are very limited possibilities of checking the quality of the data received, and it is usually not possible to design tables that deviate significantly from those received.
Are there systems for checking, editing and validating the data?
Are there, for example, procedures for checking the quality of the information received from the local registration offices? If yes, which information and which offices? Who is responsible for the checking? Are checks done at the regional or central level of the civil registration agency? What is the role of the statistical office in checking the data quality? Does the responsible organization carry out field visits, etc.? Are there systems in place for statistical editing and validation of the received data? See box 9 for a quick overview of data quality issues.
Are there systems for ensuring data security?
For example, are the paper forms stored securely after information has been entered electronically in such a way that a verification of records can be done several months or years later? Are the
32

electronic data stored in safe locations with a stable power supply? Is access to the data limited to specified persons and with secure passwords? Are there back-up solutions for the electronic data?
Organization of vital statistics production and dissemination Once the data have been collected, who is responsible for processing and publishing the
data?
In most countries, there are two organizations at the national level that could be tasked with the processing and dissemination of vital statistics. These are either the civil registration authority or the national statistical office.
In most countries, the statistical office has the main responsibility for compiling, analysing and publishing vital statistics. This is the case in countries such as Botswana, Ethiopia, Mozambique, Norway and Pakistan.
In some countries, the production and dissemination of vital statistics is done by the civil registration agency (or the Ministry of Health) alone, as in India, or in collaboration with the national statistics office, as in in Kenya.
In a few countries, both civil registration functions and the production and dissemination of vital statistics are the responsibility of the national statistics office, as in the Philippines. This was also the case in Norway from 1946 to 1964, when Statistics Norway was in charge of both. Between 1964 and 1990, the central civil registry was located within Statistics Norway and run jointly by the National Tax Administration and Statistics Norway. The legal dimension of population registration was the main reason for its transfer from Statistics Norway to the Directorate of Taxes in 1991. There is, however, close cooperation between the two institutions, and Statistics Norway receives daily a copy of all registration records.
Box 8. Importance of coordination and cooperation (BLUE BOX)Civil registration and vital statistics systems are multidisciplinary and multisectoral in nature. The systems require the engagement of a wide range of stakeholders to ensure their optimal functioning. This section emphasizes the importance of coordination and close cooperation between the health sector, local government, civil registration authorities and national statistical offices, among other stakeholders. These institutions play very unique and fundamental roles in ensuring completeness in registration and in producing high-quality vital statistics. Some of these functions are briefly described:
The local health system often has first-hand knowledge of births and deaths occurring and can therefore help to improve the coverage and completeness of the civil registration system. In many countries, health institutions often play a role as civil registration informants. The cause of death certification should also be carried out by skilled health personnel and their work coordinated and linked with the coding and production of these statistics. The health sector is also an important user of vital statistics for the planning of health services.
The civil registration authority is key to the recording of information on vital events and has the most detailed knowledge of the registration procedures. This knowledge is important when working with and processing the data for statistical compilation. They can also more easily provide direct feedback to the local offices so that they can improve or correct the data directly and thus increase quality in the longer run. On the other hand, it is important to have external users of the data, such as the health sector and the statistical office, which can
33

also provide important feedback. Input on how to process the data and improve their quality in an efficient way can also lead to a better system and reduce the time needed to work on improvements and to write the vital statistics report.
The national statistics office usually has broad knowledge and experience in processing and analysing data. The office can be helpful in identifying errors and providing feedback to the civil registration agency, besides cleaning the data and tabulating the results. Cooperation with the statistical office also opens up access to a more detailed comparison with the most recent population census figures. The input of the statistical office will be more useful if it has access to microdata from the civil registration system and a thorough knowledge of how it is operating, including how vital events are registered, coded, checked, stored and transferred. Access to microdata for statistical offices is also discussed in box 3.
END BOX 8
2.4 Incentives and disincentives for registrationIt would be useful, but not absolutely necessary, to include a few paragraphs on factors that have influenced the registration of vital events positively or negatively (often called incentives and disincentives) in the time period for which the report is valid. In box 9, many examples of both incentives and disincentives have been included that might provide input on what could be relevant for the contents of this chapter in the vital statistics report.
Box 9: General and country examples of incentives and disincentives for registration (BLUE BOX)People are more likely to register vital events if they are aware of the benefits that registration brings. In most settings, registration papers are the key to the following:
Obtaining proof of place of birth and place of registration Obtaining identity papers needed for government services Establishing citizenship by showing the place of birth and origin of parents Obtaining proof of age in relation to rights and obligations that are conditional upon reaching a certain age, such as schooling, military duties and pension entitlements Providing evidence of identity and age for marriage Obtaining a driver’s licence, passport or other travel documents Obtaining evidence of death for use by the heirs of the deceased Having access to health services, such as vaccination Having access to utility services, such as water, electricity and gas Birth registration document needed for private services, such as:
o Working in the formal sectoro Opening a bank accounto Obtaining a loan or microcredit
Other factors having a positive effect on the frequency and magnitude of birth registration and issuance of birth certificates (incentives) include the following: Easy access to free registration
34

Registration at health facilities so that the family can register a birth directly at the hospital before taking the baby home. It is also common for hospitals to report births to the civil registration office and to provide the papers necessary for the family to forward to the office
Registration while receiving the first vaccination of a child Mobile health teams offering initial registration services (SMS notification, etc.) No payment for the registration and issuance of documents
Similar factors affect the registration of deaths. The share of people registering deaths could be increased if the heir of a deceased is required to document that a death has occurred or if obtaining evidence of cause of death is important for insurance or legal purposes. Another incentive could be to provide only the permission to transport the deceased to the burial place if the death has been registered. By linking death registration with permission to transport the deceased to the burial place, there is a direct incentive for the funeral director to register the death quickly. Relatives receive the legal documents from the local civil registrar afterwards. Some countries provide monetary rewards for death registration.
Factors having a negative effect on birth and death registration and the issuance of birth certificates (disincentives) include the following:
Difficult access to registration offices Populations living in hard-to-reach areas High travel and/or registration costs Different languages Illiteracy Long waiting queues Need to visit the office several times Cultural factors, such as when, in some countries, a child who has not been given a name yet
may not be registered or when the father needs to be present at the registration
The civil registration and vital statistics resource kit (World Health Organization, 2012) provides more examples that can be consulted for inspiration. In general, knowledge in the population about the benefits of registration and the drawbacks of not registering a vital event is likely to have an effect. If data have been collected about people’s knowledge and awareness of the benefits of registration, they could be included here.
In some countries, for example the Cook Islands, there are small cash incentives for families to register births. In Brazil, maternity wards are given small monetary rewards for each child whom they register. In Nauru, families receive financial support for funeral arrangements when they register a death (civil registration and vital statistics resource kit). The Nordic countries are examples of systems in which all social benefits, including child allowance, depend on registration.
Regular information and communication campaigns are also an important way of encouraging people to register vital events. Individuals should never be charged a fee to register vital events. Fees are a strong disincentive to public cooperation, in particular among poor and marginalized people. To encourage families to register, many countries issue an abridged copy of the birth or death certificate free of charge at the time of registration. However, it is reasonable to request payment for
35

subsequent additional copies of birth and death certificates. In many societies, copies of birth certificates are commonly required for administrative purposes, and the income generated from issuing copies contributes to the running costs of the civil registration service.
In order to enforce civil registration law, many countries impose penalties for late registration or failure to register. This sometimes includes not being allowed to register. It is important to monitor the unintended and potentially adverse effects of such penalties. For example, families may misreport dates of births or deaths to avoid penalties, resulting in inaccuracies in the resulting data, especially when a publicity campaign has led to a sudden increase in late registrations. Penalties and restrictions may also lead to people not to register at all, which has adverse effects not only on data, but also for the persons or relatives concerned. In general, penalties may discourage registration and can lead to false declarations that distort the data. This is a problem, in particular, for deaths in areas where burial permits are not enforced.
Lastly, the report should mention plans to strengthen the civil registration system.
End box 9.
Box 10. Data quality (BLUE BOX)The quality of vital statistics is defined in the United Nations Principles and Recommendations (2014) as being measured according to their completeness, correctness or accuracy, availability and timeliness.
The most important aspect of the quality of vital events data is the completeness of civil registration, which is discussed in section 3.2. There is also a need to evaluate the quality of the civil registration data and check for errors. Errors are common in all systems, even the best, and may occur at any stage of the civil registration and vital statistics process, owing to reporting errors, clerical errors, misprints, misunderstanding, errors in the computer code, tabulation errors, problems with the electricity supply and perhaps corruption. A quality assessment procedure is very important for data quality. Some national statistical systems have procedures for this. More thorough discussions of quality issues are presented in the United Nations Principles and Recommendations (2014) and World Health Organization (2010b, pp. 53-64).
As specified in chapter 3, it would be useful for the audience to know how the civil registration data are checked and verified for errors.
Checking for errorsThe first task is to identify errors and present the methods of error detection. The office registering the information should ideally have a system for checking the data while they are being entered. However, external control mechanisms, such as random checks at the central civil registration level or other involved organizations, are also important. Common approaches are:
Checking against other time periods and sources of vital statistics
A common way of detecting errors in data is to compare data against other time periods or sources of vital statistics. Consistency checks should always be carried out both on the raw data and on key indicators (e.g., birth and death rates) before they are used or made more widely available. Comparison of raw data can be done by checking against corresponding figures from previous years. If there are major changes from one period to another, this should be investigated further.
36
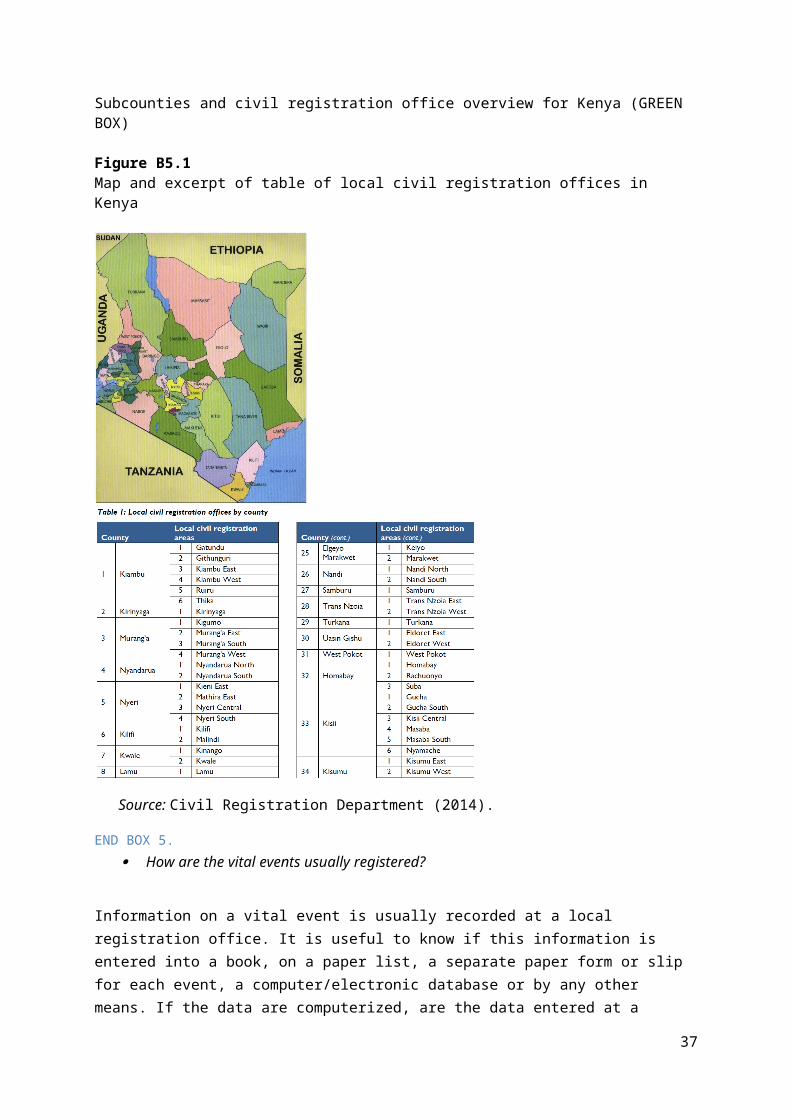
Most countries will have a number of censuses and surveys that include questions about vital events occurring in the population available. From these data, fertility and mortality estimates by age and sex are usually available. These estimates should be compared with the age and sex-specific mortality and fertility data calculated from vital registration. Data can also be checked for various regions or other subdivisions. Typically, vital events from censuses and surveys are higher than comparable rates from vital registration in countries where they are undertaken, suggesting an underreporting of deaths and births in the civil registration system. The civil registration completeness rate would provide further clues on this.
Checking proportion of missing values
For each vital event, are all the specified variables recorded or are there missing values, such as for the date of birth of the mother of a child? What is the general picture? Is it, for example, the case that many variables lack information, although they are specified as obligatory on the birth or death registration forms? Does the law stipulate anything on correcting errors?
Checking for duplicates
Has information on some vital events been recorded or reported two or more times? Are there any records that are identical or almost identical?
Checking data that seem very improbable
Are there any odd patterns of births (or deaths) by age of the mother or by month, out-of-range values for date of birth and age of the mother or unrealistic values of crude birth and death rates for some regions?
Checking for digit preference or rounding
Are there any values that occur more often than other without any specific reason? For example, when people are asked about their age, there is often an overreporting on ages ending in 0 or 5, and sometimes also on other ages, such as 7. This is mostly a problem in census and surveys, but it may also occur in a civil registration system when recording background information on parents who had not previously been registered, when clearing backlogs and for recording deaths of persons without a birth registration. If data are presented in the vital statistics report in age groups of 5 or more, this is of less importance. However, if variables are published for single ages, this should be looked at more closely. Dialogue with registration officersIf data control is carried out elsewhere than at the place of registration, for example, at the central agency responsible for vital statistics, it is important to say something about how detected errors are reported back to the registration officers responsible. Do they receive information on key errors and are they expected to go through and improve data quality, if possible? Are they allowed to change the records?
In general, focusing on errors that have the most impact on the results can be a useful approach. This is also true for differences between regions and between local offices. If one office has many errors
37

and missing values, then it might be useful to focus feedback and work to improve data in this specific office. The reason is that improved quality from poor performers often may lead to a significant change in the general quality of data. Different approaches on how quality checks and feedback is carried out can be useful information for the audience.
Correcting errorsThere are various methods for correcting errors. The best approach is that the local registration officer goes through the records and fills in missing or erroneous information, if possible, and reports back to the central or regional level on these changes. Other methods exist and can be considered. Some examples are briefly described below. Correction methods used should be described in the vital statistics report.
Removing duplicates, errors and outliers
If this is done, the original data set should first be saved and there should be methods for marking changes, such as flagging. In addition, before removing duplicates, there should be a check to see whether the event is a multiple birth.
Imputation of missing or inconsistent values
In this process, missing or deficient values may be imputed. A typical imputation algorithm is to use the value of similar observations or an average value for such cases. However, imputation should be considered only as a last resort, if absolutely necessary.
Imputation should be used with caution. It may make the producer of data look good but it does not really improve the data. If imputation is applied, then it should be thoroughly documented. It is also important that there be a high probability that the imputed value is close to the actual (unknown) value
Small numbersThe number of births and deaths in areas with small populations may fluctuate from year to year owing to random variations. This variability is not due to sample errors, given that the vital events are usually registered for the total population. Consequently, one has to be careful when analyzing rates based on small numbers of vital events. This is the case for all countries, regardless of their size and the quality and completeness of their civil registration. For the United States of America, for example, the National Center for Health Statistics annual vital statistics report includes a table that provides correction factors when the number of deaths is less than 100 (Centers for Disease Control and Prevention, 2016, table XIV).
END BOX 10.
Chapter 3. Data quality, completeness and definitions
3.1. Quality of dataThis chapter should first provide information on the approaches that are used when controlling data quality and processing data. The information on data quality may be short. Important information relates to the following:
38

Specifications in the legislation or overall statistical guidelines regarding data quality and how to make corrections
There might be concrete specifications in the civil registration law. On a more general note, there might be guidelines within the national statistical system on how data should be cleaned. This will often be linked to quality assessment or quality assurance frameworks. If a specific method or system is used, this should be specified, as well as its main aspects.
Main procedures for checking for data errors
Are there routines for quality control at the local registration offices? Is data quality control carried out on a regional or national level?
Key methods used for improving quality
A short description may be given of the measures that have been taken to improve data quality. If the data quality control is done at a central level, are there specific mechanisms for verification against the local level (e.g., checks against original paper forms or with the persons who provided the information)? How and how often? If not, have errors been corrected using other methods? Which ones?
In this template, we have included additional guidance in box 11 on how to check and improve data quality. The United Nations Principles and Recommendations for a vital statistics system also provide useful information on quality assurance.
BOX 11. Coverage and completeness (BLUE BOX)The two terms “coverage” and “completeness” are often used inconsistently. Coverage is sometimes used when completeness would have been a more appropriate term. We therefore start with a definition of how the two terms are used in this document, on the basis of the WHO recommendations. Later in the document, the focus will be primarily on completeness rates, but coverage is, in many countries, also used as an indicator of the share of the population that is covered by the civil registration system. Moreover, some countries continue to use it to mean completeness, which is now considered to be the most appropriate term for the proportion of the actual number of births (or deaths) that are registered.
Definition of coverageCoverage means the population in a geographical area that is covered by the civil registration system. It is an attempt to measure the proportion of the population of a country that has access to civil registration (geographical coverage). In World Health Organization (2010b), it is defined as the number of people living in census enumeration districts with at least one civil registration office, expressed in the percentage of the total national population.
Definition of completeness (or completeness of coverage)Civil registration completeness means the actual number of registered events divided by the estimated number of vital events (births or deaths). Complete registration has been reached when every vital event that has occurred to the members of the population of a specific country (or area), in a specified time period, has been registered in the system. This means that the system has attained 100 per cent completeness within its area of coverage. Any deviation from completeness is
39

measured by completeness error. Vital statistics from registration data are complete when, in addition to registration of each event, there is a vital statistics report, which is forwarded to the agency responsible for the compilation and production of vital statistics (United Nations, 2014, para. 576).
Estimation of completeness ratesThere are two approaches to estimating the completeness of civil registration: direct and indirect methods. The direct method entails matching registration records with records containing some or all of the same information from an independent source, such as civil registration records for other events, administrative and social records and censuses and surveys. Indirect methods include comparisons with data from other sources or other time periods, such as censuses and surveys (United Nations, 2014,, pp. 129-140). The methods described below for estimating completeness rates are indirect methods because they are not based on microdata.
The completeness rate is defined as the percentage of registered events of the total number of events. The number of registered events is the number recorded by the civil registration system, whereas the number of actual events has to be estimated on the basis of other data sources. Usually, the best source is the most recent population census. However, if it has been some time since this census took place and the population has grown significantly, the census numbers will be too low. In this case, the number of actual events should be estimated using population projections or by using information from demographic fertility and mortality surveys. Projections are usually made by the national statistics office (see box 24). It is often useful to estimate the completeness rates at subnational levels.
The completeness of registration of live births rates can be calculated by the following calculation:
(1)
Completeness rate for births= Number of registered birthswithin the year of occurenceEstimated number of livebirths within the year
×100
The numbers of registered births are those from the civil registration system and reported before the cut-off date, as explained in chapter 2. If a population census has been carried out recently, ideally in the same year as the data that are analysed, the data for total number of births can be used directly. Alternatively, if population estimates exist for the relevant year, these can be used. National figures are recommended, typically from the national statistics office, if available. The population projections from the United Nations Population Division are an alternative if there are no reliable national figures.
Similarly, completeness rates for deaths may be obtained by this calculation:
(2)
Completenss rate for deaths=Number of registered deaths within the year of occurenceEstimated number of deaths withinthe year
×100
The numbers of registered deaths are those from the civil registration system. The total number of deaths, as was specified for births, can either be obtained directly from the population census figures or from population projections. Box 24 provides a description of how these calculations can be made if the total number of deaths is unavailable or of poor quality. If age data are non-existent or poor, the total number of deaths may be estimated by multiplying the crude death rate by the total population size (and dividing by 1,000).
40
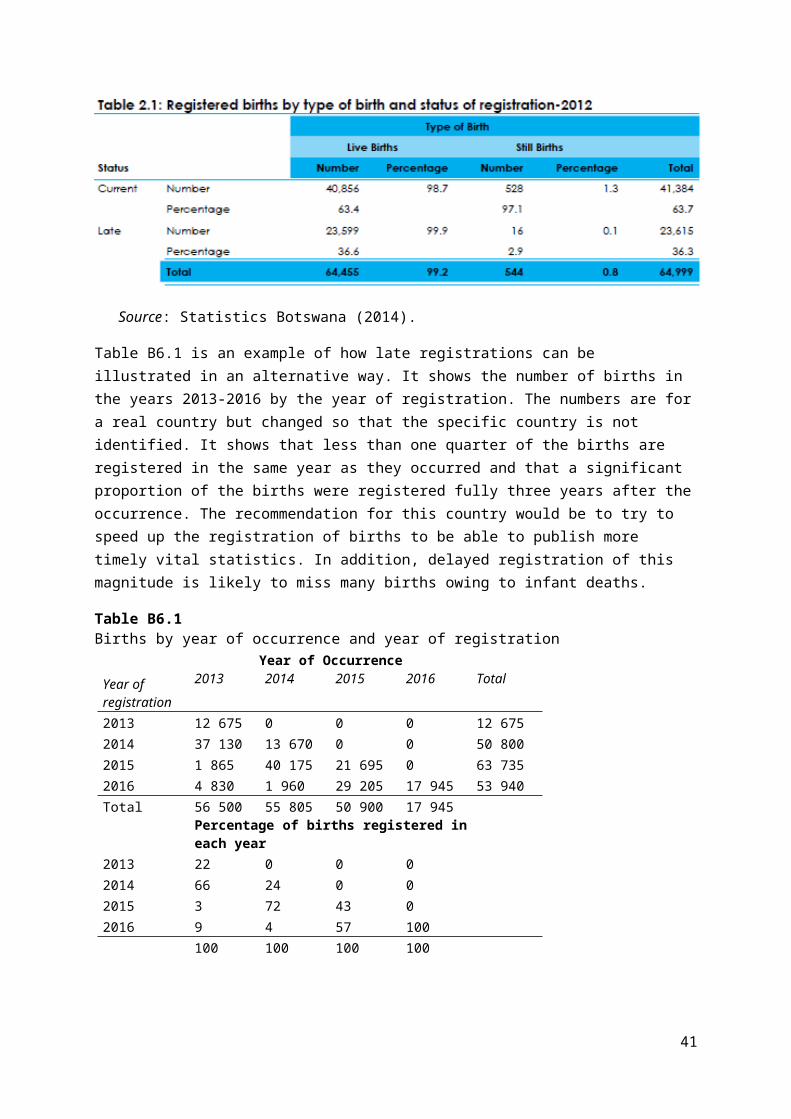
Use of other data sources to estimate completeness
Completeness rates have been described to show how they can be calculated from registration data. It is recommended that this be carried out whenever completeness is less than universal. However, if available, other data on completeness may also be presented. In many countries, completeness rates may be obtained from sample surveys, such as the United Nations Children’s Fund multiple indicator cluster survey and the demographic and health survey. Some of these surveys include questions on whether individuals have been registered with the civil registration authority, although the focus of interviews is often on mothers (or primary caregivers) of children under age 5. The completeness of birth registration for children under 5 years of age can be calculated as follows:
(3)(1)
Completeness rate for children under5=Number of childrenunder 5 years∈a given year whohad their birthregisteredEstimated number of childrenaged under five years old∈a given year
∗100
This survey-based methodology is normally unable to provide estimates of the completeness by region or other subgroups of the population because the sampled regional populations are usually too small. Moreover, such surveys are too expensive and complicated to be taken frequently. The data are usually often older than the data analysed in the vital statistics report. Lastly, only a small proportion of a population is interviewed in a sample survey, and the survey does not really reflect how well the civil registration system functions in practice. In addition, sample errors and question wording may influence the results. Another issue is that households are likely to overreport registration because they believe a birth notification form equals registration.
Other options include a comparison with administrative sources, such as lists from school districts. Another important data source is population censuses, which have historically not asked about whether household members are registered and possess a birth certificate, but this could possibly be done in the future (Economic and Social Commission for Asia and the Pacific, 2015). Countries such as Namibia and the United Republic of Tanzania have asked questions about deaths occurring in the household during the past 12 months and whether the death was registered. In a few countries, specific surveys are implemented to access the functioning of the civil registration system, including completeness rates. Nepal is currently doing such a survey and Cambodia was planning to do one in late 2016 or early 2017.
Completeness rate for the whole population
An interesting additional indicator is the birth registration completeness for the whole population. It can be calculated as follows:
(4)
Completeness rate for births ,whole population= Number of persons alive who had their birth registeredEstimated population¿¿100 ¿
41

Given that many countries have begun quite recently ton improve their birth registration, this completeness rate will usually be lower than if only children are included in the calculations. However, many countries now issue identification cards for the adult population, and because this often demands a birth certificate, the birth registration of the adult population is likely to increase over time.
The three completeness rates for birth are all used as targets for completeness of the civil registration system in the regional action framework for civil registration and vital statistics in the ESCAP region (Economic and Social Commission for Asia and the Pacific, 2015).
Presenting completeness rates
In this template, completeness rates are presented separately, before statistics on the vital events results are presented in the subsequent chapters. It is also a viable option to present completeness rates for each vital event together with the general vital event data in chapters 4 and 5.
End box 11.
3.2. Completeness12
In this section, the completeness rates of birth and death registration at the national and subnational levels should be presented. This is important for two reasons:
The rates alert the audience to discrepancies in completeness and provide a caution in the interpretation of statistics that are presented throughout the report
They provide an objective baseline that can be used to measure and evaluate future progress in completeness
Because the actual number of a vital event is usually not known, civil registration completeness needs to be calculated on the basis of projections or estimates of the actual number (see box 24 on how to calculate the estimates). It is particularly important to include estimates of the proportion of the total number of births (and deaths) that are registered in the country and in each region and local administration. These proportions are essential indicators of civil registration completeness. If the proportions are low, the vital statistics based on registrations are less useful for planning.
3.2.1. Completeness by groupThe calculation of completeness rates should be done for the country as a whole and preferably for all the vital events presented in the report. Other groupings should also be considered if available, namely, gender, age, regional, urban/rural, place of occurrence and place of registration.
However, it can be a challenge to get reliable and accurate denominator data at the regional level, especially if the census is not very recent. Moreover, subnational population projections tend to be quite inaccurate over time. Internal migration, for example, in particular rural-urban migration, is common in most countries but is not reported in most national registration systems. The estimated completeness rates may be influenced by unrecorded population changes caused by internal migration. This should be taken into account when the estimates are made.
The results can be shown using a table or a graph, such as table 3.1 for live births.
12 Most of this section is based on Civil Registration Department (2014) and on Economic and Social Commission for Asia and the Pacific (2015).
42

43

Table 3.1Number and share of registered live births by region
Number of live births registered
Share of live births registered
TotalRegion 1Region 2Region 3………Region N
Information on why there are differences between the various groups should be included, if available. For example, if there has been a campaign to improve birth registration in one region, this could be linked to the regional completeness rate. Does it look like the completeness rate in this region is significantly higher than in other comparable regions? Other interesting issues to discuss relate to regional differences. How remote do people live? How is the access to health services in the region? What is the general level of education?
The illustrations from India and South Africa in box 16 show how completeness can be presented.
Box 12. Examples of graphs and maps showing completeness of birth registration (GREEN BOX)
If possible, it would be useful to include a graph showing both the registered and expected number of live births, as in the example from Civil Registration Department (2014) (see figure B12.1)
Figure B12.1. Graph showing birth registration completeness in Kenya, 2010-2013
Source: Civil Registration Department (2014).
Figure B12.2. Map showing birth registration completeness in India, 2010
44

Source: Office of the Registrar-General of India (2013).
Figure B12.3. Map showing birth registration completeness in South Africa, 2014
Source: Statistics South Africa (2015a).
End box 12
If available, completeness rates for other subpopulations, including vulnerable groups, could also be estimated and presented. Typical examples of this could be the following:
Remote and hard-to-reach areas of the country Specific population groups (e.g., specific ethnic groups or refugees) Age of mother Previous number of births Level of education of mother and father
In order to estimate the levels of completeness for these subpopulations, data on the size of these subgroups are also needed, which is not always the case.
45

As emphasized earlier, it would improve the vital statistics report if the results were discussed and analysed and not merely presented. This is important because it will provide the civil registration administration and policymakers with information on which areas or groups need special attention in order to attain increased completeness.
3.2.2. Completeness rates over timeIf vital statistics reports have been published before or civil registration data are available for more than one year, the change in completeness over time should be presented and discussed, as shown in figure 3.5.
Table 3.2. Share of registered live births over time and by region
Share of live births registered
Year 1 Year 2 … Year N
Total
Region 1
Region 2
Region 3
…
Region N
Another aspect of completeness over time is linked to late registrations. In many countries, many births are not registered in the year of delivery, but are instead done one or more years later. It is therefore common that the completeness rates for children born in a specific year increases over time. If available and relevant, a table or graph could be included that shows the increase in completeness over time for births occurring in a specific time period. This can give decision makers an understanding of when children are registered and possibly take action to improve timely registration. There are many ways of displaying this. Box 6 provides an example in which the year of occurrence is tabulated against the year of registration. An alternative way is to present the data as shown in table 3.3. With this approach, regional differences in late registration would also be visualized.
Table 3.3. Number of births by year of registration and region
Share of live births registered
Year X Year X+1 … Year X+N
Total
Region 1
Region 2
46

…
Region N
Box 13. Tabulation plan (Blue box)One of the first steps when planning a vital statistics report is to make a tabulation plan. To make sure that the plan is realistic, it is useful to begin the planning by going through and checking that the most important variables are available for making tables. The United Nations Principles and Recommendations (2014) include an extensive list of key topics and themes that can be studied with civil registration data (see the list in annex I). It may also be useful to record the years for which the variables are available.13
The next step could be to go through the tables recommended in the United Nations Principles and Recommendations (2014) and other tables proposed in these guidelines. For each table, it should be checked if it can be made on the basis of data from the civil registration system or other data sources in the country. (Lists for each vital event are presented in annex II, in addition to a list of summary tables.) Most of the tables are taken from the Principles and Recommendations (Ibid.). The lists have been modified in part to ensure that the most important tables are included, dividing the tables into first and second priority tables. A set of tables on completeness of vital events registration and on vital events indicators has also been proposed.
Some of the tables should include time series for a few essential items, such as for the number of births by sex, preferably for as many years as possible (years XXXX- 20YY). In addition, there should be more detailed tables for the most recent year with available data (year 20YY), such as for the number of births for the most relevant regions in the country.
Place of usual residence is commonly considered to be the most important location variable. The number of administrative units to be included depends on the administrative structure of the civil registration system and the number of units. If the number of units is large, then a more detailed table may be included as an annex to the vital statistics report and/or a web table.
The choice of tables for a vital statistics report will depend on the availability if data, the complexity and resources for making them and which tables are considered important for the country by policy makers, planners and the general public.
Table B13.1 is an example of the beginning of a tabulation plan for births for a hypothetical country, based on annex II.
Table B13.1 Example of tabulation plan for live births
Table num-ber
Table no. in the United Nations Principles and Recommendations
Table content Pos-sible
Possible if civil registration data are com-bined with
Year(s)
13 These topics are defined and explained in more detail in the United Nations Principles and Recommendations, chap. III.D., pp. 24-56.
47
data from other sources
First priority tables4.1 IB-1 Total number of live births by sex, incl. sex
ratio at birth and site of deliveryYes 2005-
20154.2 ST-3 Live births by place of residence and urban–
rural residence of the motheraYes 2015
4.3 Crude birth rate Yes Population size from censuses and projections
2010-2014
4.4 LB-9 Live births by age of mother (15-19, 20-24 … 45-49)
Yes 2015
4.5 LB-1 Live births by place of occurrencea and sex of child
No
4.6 LB-2 Live births by place of occurrence and place of usual residence of mother
No
:a May also include the sex ratio at birth.
END BOX 13
3.3. Definitions and specificationsThis section could also be called metadata, or information on the data. It is important for users to know the national definition of vital events and related background variables of all involved in the registration and processing of vital events data. This needs to be clearly specified, either in general in an introductory chapter or for each of the vital events chapters, along with international definitions for comparison. The definitions and specifications are useful both for international stakeholders, given that it will clarify whether the data are comparable to data from other countries, and for national stakeholders in case there are different approaches nationally. The following are two examples:
Births: which births are included: live births or still births? If live births, is the international definition used or are there national amendments? What about foetal deaths?
The WHO definition of a live birth is as follows: “Live birth refers to the complete expulsion or extraction from its mother of a product of conception, irrespective of the duration of the pregnancy, which, after such separation, breathes or shows any other evidence of life - e.g. beating of the heart, pulsation of the umbilical cord or definite movement of voluntary muscles - whether or not the umbilical cord has been cut or the placenta is attached. Each product of such a birth is considered live born”.14
Regional: are the same definitions used for regional and local units by all government bodies? Is there official agreement on the borders of all regions in the country?
These questions might be especially relevant for smaller divisions. In addition, urban and rural births may be defined differently. If so, then how it is defined in the report, if used, should be specified.
14 See World Health Organization, “Health statistics and information systems”. Available from www.who.int/healthinfo/statistics/indmaternalmortality/en/.
48

Box 14. Presenting data (BLUE BOX)
In general, the vital statistics tables and graphs that can be produced depend on the information recorded by the local registration office and forwarded to the vital statistics compiling office, which is usually the central civil registration authority, the central statistics office or the Ministry of Health. This information is usually the same as the information on the registration form.
When presenting the data, efforts should be made to do it in a user-friendly manner, namely, in ways that are understandable to non-statisticians. Policymakers and others will, to a greater extent, understand and make use of the data if the tables and graphs do not contain too much information and if common disaggregations and rates or ratios are used. Attention should be paid to some key points. They may seem elementary, but mistakes are nevertheless very common.15
Including completeness rates where relevantIn most countries, especially those in Africa and Asia, not all vital events are registered. When presenting data on vital events, one needs to make sure that data are understood correctly. For example, if there is large variation in completeness rates between various regions or groups of the population, this may have an effect on the interpretation of the vital event figures.
Even though completeness rates have been presented in chapter 3, it is recommended that vital statistics report writers should also comment on the completeness rates in this and the following chapters.
Tables and graphsTables and graphs should not include too much information, given that this may make them difficult to understand. Readability and simplicity are important, especially for the general reader.
The tables and graphs should present the most factual picture of the relationships. In a graph, it is, in most cases, best to begin with 0 on the x or y axis if the range is numerical. If a smaller range is presented, this could give the audience the impression of a stronger change than is actually the case. It is also useful to include a separate column for missing and unknown values if their shares are a significant proportion of the total.
Figure B14.1. Birth registration figures for two regions, X axis beginning at zero
15 More tips and suggestions can be found in Statistics Norway (2009).
49

2010 2011 2012 2013 2014 20150
10000
20000
30000
40000
50000
60000
Region 1 Region 2
Regi
ster
ed b
irths
Figure B14.2 Birth registration figures for two regions, X axis beginning at 40 000
2010 2011 2012 2013 2014 201540000
42000
44000
46000
48000
50000
52000
54000
Region 1 Region 2
Regi
ster
ed b
irths
Figures B14.1 and B14.2 contain exactly the same data, but the X axes have different starting points. the first version (presented in figure B14.1) is strongly recommended, given that this gives a more realistic presentation of the development in registration figures over time. The second version (presented in figure B14.2) gives an exaggerated impression of substantial change over time, which is not really the case. If there is a good understanding of data and statistics, then two other alternatives are also possible: (a) to highlight a specific point, the vertical axis may begin at 0 but be broken by double slashes and move directly to 40,000; and (b), a log scale may be used to present widely disparate number son a single graph.
50
Percentage versus percentage pointWhen explaining change from one period to another, it is a very common mistake to use the percentage change when there is actually a change in percentage points. For example, If the registration completeness rate has increased from 60 per cent in one year to 70 per cent in another, there is a change of 10 percentage points, while the percentage change is approximately 17 per cent.
End box 14
51

Chapter 4. BirthsIn this chapter, data on registered live births should be presented. A combination of tables, graphs, maps and explanatory text will be useful for the audience. Linking to earlier chapters, especially if completeness rates are low, should also be considered.
The tables and graphs to be presented will naturally depend on the variables collected when registering a birth. Box 14 provides a short overview of which variables are considered most important.
Box 15. Key birth registration variables (BLUE BOX)The topics on live births to be presented in the vital statistics report are based on the information that is collected on births in the civil registration system. This usually includes the topics listed in annex I, which are taken from the United Nations Principles and Recommendations (2014, pp. 18-19), but numbered for these guidelines. The high-priority topics are indicated in bold, as in the Principles and Recommendations. However, some of the high-priority topics may be missing or too complicated to be included in an early vital statistics report, such as educational attainment, occupation and socioeconomic status of the parents. Accordingly, such information is rarely collected when a birth is registered.
In practice, individual-level information on the recommended topics is supplemented by other information required to permit identification of the persons and events under consideration, including registration serial number, place of registration, identification of the registrar, name and surname of the person or persons directly involved in the event, with personal identification number if available, and information on the characteristics of the informant.
Table B15.1 is an example showing the beginning of the list of birth registration variables for a hypothetical country, based on annex I.
Table B15.1. Example of birth registration variables
Num-ber
Topic Available from civil registration of births
Available from other sources
Not avail-able
Year(s) avail-able
(i) Characteristic of the eventa Date of occurrence Yes 2015
2015 Date of registration Yes
c Place of occurrence Yes 2015
d Locality of occurrence Yes 2015
e Urban/rural occurrence No
f Place of registration Yes 2015
gType of birth (i.e., single, twin, triplet, quadruplet or
higher-multiple delivery)Yes 2015
h Attendant at birth No
i Type of place of occurrence (hospital, home, etc.) Yes 2015
52

(ii) Characteristics of the newborna Sex Yes 2015
b Weight at birth No
:
Source: United Nations (2014, table III.1, pp. 18-19).
Many of these variables are usually available only for hospital births in health facilities. They are important for health purposes but not for civil birth registration, in particular attendant at birth, weight at birth, children born alive to mother during her entire lifetime, birth order or parity, foetal deaths to mother during her entire lifetime, date of last previous live birth and interval since last previous live birth.
The recommendation to register child born in wedlock (legitimacy status of the child) is problematic because it may be discriminatory. In many national civil registration systems, a child may be saddled for life with the label illegitimate.
End box 15.
When considering which tables on births to include in the vital statistics report, it is useful to look at the “Minimum list of tabulations” on live births in the United Nations Principles and Recommendations (2014), as shown in annex II. This box includes a long list of detailed tables on births. If possible, all these tables should be included in the report. However, as mentioned in the previous box, some of the variables may not be available for some countries, especially for births that occur outside the health facilities. Some tables are also less important than others. Consequently, we are proposing a set of tables that we consider to be the most essential, especially in the first vital statistics report(s) for a country. This set of essential tables is based on information usually available on birth notifications, registration sheets or birth registers. We have also considered the practice in countries in Africa and Asia that have already published vital statistics reports. Gradually, the number and detail of the tables can be expanded, depending on the capacity of the civil registration and vital statistics authorities, the availability and quality of the data and the needs of the country for planning, monitoring of the health sector, and other purposes.
It is important to make it clear in the vital statistics report what the chapter on births covers. This template is used to recommend that the chapter provide data on registered births. It is also important to emphasize that the chapter concern live births only, if this is the case. Unless most of the births are registered by medical institutions, still births are probably so seriously underreported that it would be of little value for statistics, but they should, at a minimum, be reported by sex, data, maternal age and location, if available.
53
The main indicator, the total number of registered live births, should be published for as many years in the past as possible. The vital statistics report could also present brief comments on the development of the number of registered live births in recent years. If possible, there could be an attempt to distinguish changes in this number that are due to changes in the registration completeness, the number of women between 15 and 49 years of age and the changing fertility level (total fertility rate). In addition to tables, graphs are an excellent way of communicating results.
As the list of tables recommended by the United Nations in annex II indicates, live births should be presented for various subgroups. It is recommended that the totals be divided into subgroups for only one subgroup in each table, given that the table might otherwise be too complicated and difficult to grasp for users. If the number of births in a subgroup is not known for all births, the number of unknowns (missing data) should be entered in a special column, marked Unknown, Other or Missing.
In the following section, more detail for some of the subgroupings are provided. The presentation of additional subgroups should be considered, depending on data availability and stakeholder interests.
Region (province, district or municipality, as appropriate)
The regional level to be chosen for tables and maps on regional division depends on the following:
Administrative structure of the country Number and size of the administrative units. The most common names for administrative
units in English are state, province, district, county and municipality. There may be special subdivisions in large cities
Availability of data and the general interest in regional data on live births. If there is a need to publish births for a large number of regional units, covering more than one page, the table could be put in an annex. Note that registration completeness may vary strongly between various regions. If possible, the registration completeness should be included, together with the number of live births
Tables could be made for one or more of three definitions of region of birth, namely, place of occurrence, place of usual resident of the mother and place of registration.
Place of residence is the most common definition when classifying births by place. Data on the number of births by place of usual residence are useful for studying the geographical distribution of birth. Birth rates, which can be calculated at subnational levels, are important for program planning, evaluation and research in many fields of application, such as health, education, population estimates and projection, and social and economic policy (United Nations, 2014, p. 28). It is usually more important to have information on the geographical distribution of where women giving birth usually live than where they happened to deliver or register the child.
However, it is also mentioned in United Nations (2014) that it may be useful to classify data on births by both place of occurrence and place of usual residence of the mother. This information may be used to see whether mothers are giving birth in the same civil division as that of their residence or in other geographical locations (Ibid., p. 28).
It should be noted that, in annex II, most tables on fertility relate to place of usual residence of the mother. However, many countries do not collect information on place of usual residence of the mother and, even if they do, they are not amenable to geographic coding and, hence, tabulation. In any case, it should always be specified when presenting a table or graph which variable has been
54

used for regional division. It may not be meaningful to compute fertility rates by place of occurrence, given that it is difficult to delineate and know the size of the population using the health facilities.
Table 4.1. Total number of live births by sex, including sex ratio at birth and site of delivery, 2012-2014
Total Health facility At home Other:
201220132014
Source: Civil registration data.
In this table, the place of occurrence is clearly presented. This is useful for evaluating the need to expand a medical institution in an area and for assessing infant and maternal mortality. If data are available for more than one year, it is useful to present this so that changes and trends over time become more visible. Graphs can also be considered in this case.
Table 4.2. Live births by place of residence, region and urban–rural residence of the mother 201x
Total Sex ratio CompletenessTotal
Region 1Region 2Region 3
:It should be specified how the births have been divided by regions and whether it is based on place of occurrence, place of registration or usual residence of the mother.
As shown in table 4.4, live births by region may be supplemented by other variables of interest, such as regional pattern in the sex ratio at birth registration completeness, if available. The table may also be combined with data on related variables, such as infant mortality.
Urban – ruralThe definition of urban and rural can vary and needs to be specified. It is most common to define urban and rural areas according to the administrative designation of some municipalities as cities, rather than on population size or density. Since the civil registration system is set up as a part of the administrative organization of the country, it is most likely that the classification of events as rural and urban will be linked to the existing administrative classification. There is usually little or no scope for the civil registration office or the national statistics office to redefine or reclassify events as rural and urban.
Table 4.3. Crude birth rate, 2012-2014
Total Urban Rural Not known:
201220132014
55

Given that this is a simple table, it would be useful to include numbers for as many years as possible to be able to study the time trends.
Gender Table 4.4 Registered live births by age of mother, 201x
Age Total15-19 (and below
15)20-2425-2930-3435-3940-4445+
TotalThe sex ratio at birth is calculated as the number of boys per 100 girls. This number is usually in the order of between 103 and 107 boys per 100 girls. Numbers very different from this range may indicate faulty registration procedures or gender-selective abortions. There may also be underregistration of girls (or boys) in some areas, although there is little evidence that this actually happens.
Birth indicatorsIf data are available, the vital statistics report should also present common birth-related indicators, such as crude birth rate, sex ratio at birth, low (or very low) birth weight (per cent) and pre-term live births (per cent). How they can be calculated is presented in box 15.
Box 16. Calculating birth indicators (Blue box)
Crude birth rate The Crude birth rate is the number of live births for a specific area during a specified period divided by the total population for that area (usually mid-year), multiplied by 1,000:
Total live births / Total population * 1,000
The crude birth rate (see also Box 24) is a basic measure of fertility. It is usually calculated for a calendar year. There are other fertility measures that are more specific to the population at risk and more comparable across time and geography, such as general fertility rate and total fertility rate.
Note: The crude birth rate is not the same as the pregnancy rate, which is the total number of pregnancies, including live births, induced abortions and foetal deaths, per 1,000 women between 15 and 44 years of age for a specified geographical area (country, state/province, county, etc.) during a specified time period. The pregnancy rate is rarely estimated.
The crude birth rate is affect by the age structure of the population, which may make comparisons over time and space misleading, but not as strongly as the crude death rate, as explained in box 19.
Sex ratio at birth
56

The sex ratio at birth is the number of male live births for a specific area during a specified period divided by the number of resident female live births for that area and period multiplied by 100:
# of male live births X 100# of female live births
The sex ratio at birth is an important demographic indicator on the distribution of boys and girls at birth. The sex ratio at birth outside the range of between 100 and 110 boys per 100 girls is an indication that there is either sex differences in the birth registration or that there are practices such as sex-selective abortions or infanticide. Figure 4.9 for India in 2010 shows that 16 per cent more male than female births and 40 per cent more male than female deaths were registered. There is therefore is a clear bias towards registering male events more frequently than female events.
The sex ratio at birth also affects some critical demographic measures, such as the number of years required for a population to double in size, given a rate of population growth, and the balance between men and women at the most common ages at marriage.
Low (or very low) birth weight (per cent)
The number of live births for a specific area during a specified period with a birth weight of less than 2,500 grams (1,500 for very low birth weight) grams divided by number of live births for that area and period multiplied by 100 to obtain a percentage:
# of resident live births < 2,500 grams X 100 # of resident live births
Low-birth weight births and very-low-birth-weight births are often associated with negative birth outcomes and poor health and may be an indicator of problems in access to quality health services and the need for prenatal care services.
Preterm live births (per cent:
The number of live births for a specific area during a specified period with a gestational age of less than 37 completed weeks16 divided by number of live births for that area and period multiplied by 100 to obtain a percentage:
# preterm (< 37 weeks) live births X 100 # of resident live births
This figure requires rather detailed information on how far along the mother is in the pregnancy when giving birth. The information is available in most high-income countries but not considered a necessity for all countries to present.
Age-specific birth rate
16 The definition of “pre term birth” varies from country to country.
57
The age-specific birth rate is the number of resident live births to women in a specific age group for a specific area during a specified period divided by the total population of women in the same age group for that area and period multiplied by 1,000 to obtain a rate:
# resident live births to women in a specific age group X 1,000 # of women in the same age group
The age-specific birth rate is usually calculated for 5-year age groups: 15 to 19 (may include below 15), 20 to 24, 25 to 29, 30 to 34, 35 to 39, 40 to 44 and 45 and older, but also for 1-year age groups if the data are available. The age pattern at birth is clearer if the 1-year age group is used.
General fertility rate
The general fertility rate is the number of resident live births for a specific area during a specified period divided by the female population age between 15 and 49 years (usually estimated at mid-year) for the same area and period multiplied by 1,000:
# of live births X 1,000 # of females between 15 and 49 years of age
The general fertility rate is easy to calculate and widely used because it matches often readily available numerator and denominator data in a broad age range that covers most of the female reproductive years. It therefore represents the population at a greater likelihood of giving birth. On the other hand, there is no intuitive interpretation of the level of the general fertility rate, such as for the total fertility rate.
Total fertility rate
The total fertility rate is the sum of the age-specific birth rates (usually for 5-year age groups between 15 and 49) for female residents of a specific area during a specified period multiplied by 5: (ΣASBR) x 5, where the age-specific birth rates are 5-year birth rates. It can also be calculated as the sum of 1-year age-specific birth rate for between 15 and49 years of age.
The total fertility rate is an estimate of the number of children a hypothetical cohort of 1,000 women in the specified population would bear if they all went through their childbearing years experiencing the same age-specific birth rates, as measured for a specified time period. The total fertility rate is probably the most commonly used standardized fertility measure because it is well suited for comparative purposes and is a comprehensive summary measure that is readily interpreted and understood. A disadvantage of total fertility rate is that it is a hypothetical measure. It measures the fertility level of a population during a given period, usually a calendar year. The actual number of children of a cohort of women requires many years of data to estimate. Another disadvantage of total fertility rate is that it assumes that no women dies before the end of the reproductive period (49 years).
END BOX 16.
Characteristics of the mother Many characteristics of the mother recommended in the United Nations Principles and Recommendations (2014) are rarely registered by civil registration, such as completed education, but if data are available, the educational level and the occupational status of the mother can be very useful information for policymakers.
58

The most commonly available information on the mother includes the age of the mother, her marital status and the number of previous live births.
As mentioned above, the marital status of the mother can be discriminatory, leading to a serious problem for a person who has been given the label “illegitimate”.
Table 4.5 Registered live births by age of mother, 201x
Total Urban Rural Age-specific fertility rates
10-1415-1920-2425-2930-3435-3940-4445-4950+
Not knownTotal
Age is usually defined as the age of the mother in completed years at the time of the delivery. Alternatively, age at the end of the year may be used. This is calculated as year of event (delivery) minus the mother’s year of birth.
Five-year age groups are the most common. One-year age groups may also be used. There are usually very few births below the age of 15 and above age 49, implying that these rows can usually be deleted. There are also commonly used indicators linked to the characteristics of the mother. These are age-specific fertility rate, general fertility rate and total fertility rate.
These indicators are important for several purposes, such as making population projections and for assessing the number of births by women in high-risk groups, that is, the youngest (under 20 years of age) and oldest (over 45). Box 16 specifies how these indicators can be calculated.
Box 17. Country examples of birth registration tables and graphs (GREEN BOX)The table and figures below provide examples of how birth statistics may be presented. Table B17.1 provides a summary of the most important birth statistics for Botswana in recent years, including births according to marital status, completeness rate and mean maternal age at birth.
Table B17.1. Summary statistics on births, Botswana, 2011-2014
59

Source: Botswana (2014).
Figure B17.1 is a line diagram with number of births according to registration status for South Africa from 1994 to 2014, including the number of late registered births. It can be seen that there is a downward trend in late registration. There should be an explanation for this decline: Is it because more people are aware of the need to register their child or are there other reasons? Why is the total number of registered births declining? Are there fewer births in total or are fewer people registering the births of their children? To address the last question one should look at completeness rates.
Figure B17.1 Birth registrations according to registration status in South Africa, 1994–2014
Source: Statistics South Africa (2015a).
Figure B17.2 is a bar diagram of the number of registered births in India from 1981 to 2010. It is interesting because it shows the development in registration rates. It would have been interesting to depict the completeness rate, namely, the share of births registered of the total number of births, with it.
Figure B17.2 Registered births in India, 1981-2010
60

(Per 100,000 births)
Source: Office of the Registrar-General of India (2013).
Figure B17.3 shows the share of male and female births registered in India. The figures are interesting because they show a clear gender difference in birth registration. It is, however not clear from the figure whether this is related to a difference in number of births or whether the share of male vital events is higher. Registration completeness rates for both sexes might therefore be added.
Figure B17.3 Distribution of registered births and deaths in India, 2010
(Per cent)
61

Source: Office of the Registrar-General of India (2013).
END BOX 16.
62

Chapter 5. DeathsIn this chapter, the available registration data on deaths should be presented. A combination of tables, graphs and explanatory text will be useful for the audience. The data to be presented will naturally depend on the variables collected and their quality. As a guide, variables that are recommended by the United Nations are presented for deaths and for foetal deaths in box 16.
Box 18. Key death registration variables (BLUE BOX)The topics on death to be investigated in the vital statistics report are based on the information that is collected on death in the civil registration system. This usually includes the topics listed in annex I, which are taken from the United Nations Principles and Recommendations (2014, pp. 20-21), and numbered for these guidelines. The high-priority topics are indicated by boldface, as in the Principles and Recommendations. However, some of the high-priority topics may be too complicated to be included in an early vital statistics report, such as educational attainment, occupation and socioeconomic status of the decedent, given that such information is rarely collected when a birth is registered.
In practice, information on the recommended topics are supplemented by other information required so as to permit identification of the persons and events under consideration, including registration serial number; place of registration; identification of the registrar; name and surname of the person or persons directly involved in the event, with personal identification number if available, and information on the characteristics of the informant.
Information on cause of death will be of good quality only if the cause of death has been certified according to the standards of the International Statistical Classification of Diseases and Related Health Problems.17
Deaths are usually under-registered, compared with births. This is, among other reasons, due to a lack of incentives for registering deaths and to more deaths occurring outside medical institutions. Knowledge of the number of deaths are, nevertheless, very important for monitoring health trends and health sector planning and for population projections. Unless the completeness is very high, completeness rates should be presented, together with the death registration figures, to enlighten the audience about the quality of the data presented.
Data on deaths from a comprehensive and well-functioning system is the preferred source of mortality estimates because it is cost-effective to collect the statistics and the analysis is direct, timely and can be tailored to any time period and to any administrative unit (Civil Registration Department, 2014). Other sources of death data, such as censuses and surveys, have serious limitations, including recall and sampling errors and the need to apply indirect methods. Censuses and surveys are also expensive to conduct and usually taken infrequently. Furthermore, detailed information on causes of death, including key disaggregations, cannot be obtained from such sources because of sample size limitations and the limitations of lay reporting for determining cause of death.
17 See World Health Organization, “Classifications”. Available from www.who.int/classifications/icd/en.
63

Given that cause of death is considered an important aspect of death registration, especially as a source for planning and policymaking, this template suggests a division between the presentation of statistics on deaths (chapter 5) and cause of death statistics (chapter 6). All countries should aim for the complete registration of all deaths and recording of minimum information, including the sex and age of the decedent, place and date of occurrence and usual residence.
The topics on deaths to be investigated in a vital statistics report are based on the information that is collected on deaths in the civil registration system. This usually includes the topics listed in annex I. The statistics on deaths should be presented in tables, graphs and maps in this chapter. In addition, the death registration form for the country should be annexed at the end of the report.
If data on causes of death are available and included in the vital statistics report, the completeness rates and quality of these data should be presented and assessed in this chapter.
When deciding which tables to present, just as for births, it us useful to look at the recommendations of the Statistical Division, which presents a minimum list of tabulations on deaths (United Nations, 2014, p. 158), as shown in annex II. Some of these tables, however, may be too extensive and complicated to make for some countries, especially in the first vital statistics report. For births, we are therefore proposing a few essential tables on registered deaths below.
Table 5.1 Registered deaths by age and gender, 201x
Total Male Female
- Neonatal (< 7 days)
- Late neotatal (7-28 days)
- Post neonatal (28-265 days)
0
1-4
5-9
10-14
15-19
20-24
…
…
95-99
100+
Not known
Total
Deaths by age and gender, as in table 5.1, are basic. They are needed for many purposes, including to study infant mortality and to make a life table. The age and sex distribution of deaths may also be shown in a graph.
Table 5.2. Number of registered deaths by place of death, 201x
64
Total Completeness Urban Rural Not known:
201220132014
This table is necessary for studying urban-rural differences in mortality, which would also require estimates of the population size in urban and rural areas.
Table 5.3 Registered deaths by region, 201x
Total Completeness Died in medical institution
Died elsewhere
Not known
TotalRegion 1Region 2Region 3
:This table is useful for studying regional mortality differences.
Table 5.4 Registered deaths by month of death, 201x
Total Male Female
January
February
March
April
May
June
July
August
September
October
November
December
Not known
Total
This table provides information on the seasonal pattern of deaths. Monthly data on total deaths by broad age groups, for example, children, adults and persons 65 years of age and older, can help to identify unusual seasonal patterns due, for example, to extreme climate conditions, especially for vulnerable groups such as older persons or younger children.18
Death indicatorsIn addition to the general presentation of registered deaths, there are a few rates and indicators that are often used and demanded both by national and international stakeholders. Many are also part of the Sustainable Development Goals presented in the introductory guidelines (chapter 4), such as:
18 See “European monitoring of excess mortality for public health action” for examples of charts. Available from www.euromomo.eu/.
65

Crude death rate Infant mortality rate Under five mortality rate Maternal mortality rate Age-specific mortality rates Death rates by age and sex (qx) Life expectancy at birth (e0)
It may be very demanding to calculate these indicators, both regarding data requirements and methodology. Some of them are dependent on cause of death information, such as the maternal mortality ratio. Box 18 provides short descriptions and how to calculate each of them. If available, these rates could be presented. However, if completeness rates are low and the quality of the rates uncertain, postponement of the publication of these rates until later, perhaps in a separate report, may be considered.
Again, it should be emphasized that, in settings with weak civil registration systems, the top priority is to collect and disseminate data on all deaths by age, sex, data of occurrence and location. The example from South African (see box 19 below) shows age- and sex-specific mortality rates that can track the decline in HIV-related mortality.
Box 19. Calculating death indicators Crude death rateThe crude death rateC is defined as the number of resident deaths for a specific area during a specified period divided by the total population (mid-year estimate) for the same area and period multiplied by 1,000
# of resident deaths X 1,000Total population The crude death rate is a very general indicator or index of the health status of a geographic area or population. This type of crude rate is, in general, not appropriate for a comparison of different populations or areas because of the significant effect of age on mortality and the highly different age distributions in different populations. Age-adjusted mortality (standardized death rates), or the life expectancy, should be used for comparative analysis.
The bar graph in figure B.19.1 shows the crude death rate for 12 countries at various income levels. It is expected that the crude death rate in the four high-income countries would be lower than in the other countries because their mortality level is lower, as measured by the life expectancy. This is, however, not the case, as demonstrated by the low levels of the crude death rate in countries such as Algeria, the Bolivarian Republic of Venezuela and Libya, which are middle-income and not low-income countries. The reason is that the number of deaths is strongly affected by the age structure of the population. Given that many low-income countries have very young populations owing to a lack of fertility decline, their crude death rate is low because relatively few people die in young ages. This is the case for Ghana and Eritrea, in particular. One way to solve this problem is to standardize the death rate, as shown below.
Figure B.19.1Crude death rate for selected countries, 2011(Number of deaths per 1,000)
66

0123456789
101112131415
Source: Centers for Disease Control and Prevention training course.
Standardized death rate The standardized death rate is the crude death rate of a population adjusted to a standard age distribution. It is calculated as a weighted average of the age-specific death rates of a given population. The weights are the age distribution of that population. Given that most causes of death vary significantly according to people’s age and sex, the use of standardized death rates improves comparability over time and between countries. The reason is that death rates can be measured independently of the age structure of populations in various times and countries (sex ratios are usually more stable).19
Age-specific death rateThe age-specific death rate is the number of deaths for a specific age or age group in a specific area during a specified period divided by the population of the same age or age group in the same area and period multiplied by 100,000 (or 1,000):
# of resident deaths in specified age or group X 100,000 Total population in same specified age or groupInfant mortality rateThe infant mortality rate is defined as the number of newborn dying before they reach 1 year of age for a specific area during a specified period divided by the number of resident live births for the same area/period multiplied by 1,000, or the probability of dying before age 1:
# of resident infant deaths X 1,000 # of resident live births
Figure B19.2
Infant mortality rate in Algeria, 1990-2015(Per cent)
19 See Eurostat, “Glossary: standardized death rate (SDR)”. Available from http://ec.europa.eu/eurostat/statistics-explained/index.php/Glossary:Standardised_death_rate. Methods for direct and indirect standardization are explained at http://papp.iussp.org/sessions/papp101_s06/PAPP101_s06_060_010.html.
67

Source: Office national des statistiques (2016).
Maternal mortality ratioThe maternal mortality ratio is the number of maternal deaths (the death of a woman while pregnant or within 42 days of termination of pregnancy, irrespective of the duration and site of the pregnancy, from any cause related to or aggravated by the pregnancy or its management but not from accidental or incidental causes) in a specific area during a specified period divided by the total number of live births for the same area and period multiplied by 100,000.
# of resident maternal deaths X 100,000 # of resident live births
The maternal mortality ratio is an indicator of Sustainable Development Goal 3 and is considered a primary and important indicator of an area’s overall health status or quality of life. The maternal mortality ratio can also be used as an indicator of access to prenatal and obstetrics care (where additional resources may be needed).
Because maternal deaths are rare in some countries, large samples would be needed to collect information on maternal mortality in surveys. Having access to this information through a register with the International Statistical Classification of Diseases and Related Health Problems coding of sufficient quality is therefore of great use.
Life expectancy at birth (e0) The life expectancy is most often referenced to as at birth and is derived using life table calculations, as described above, although such calculations allow for an estimation of life expectancy at various ages, as shown in table B18.1. The life expectancy at birth is a standardized summary measure sometimes used as an overall gauge of health based on a population’s mortality experience. Accordingly, it is an index of the level of mortality within a population and represents a hypothetical number of years a newborn would live, on average, if he or she experienced the prevailing level of mortality in each age group as he or she ages.
Table B19.1. Example of life table, abridged (i.e., for age groups)
68

Source: United Nations Population Fund life tables. Available from http://papp.iussp.org/sessions/papp101_s07/PAPP101_s07_030_010.html.
Figure B19.3 shows the life expectancy at birth for men and women in Norway since 1850. It exhibits several interesting developments, including the Spanish flu in 1918, the effects of World War Two on men and the catching up of male life expectancy in the past 30 years, which is due in part to changing smoking habits.
Figure B19.3 Life expectancy at birth for males and females sex in Norway, 1850-2015
1850 1870 1890 1910 1930 1950 1970 1990 2010 40
50
60
70
80
90
Women
Men
Age in years
69
Source: Statistics Norway statistics bank.
END BOX 18.
Box 20. Deaths by sex and age in South Africa (GREEN BOX)
Figure B20.1 shows the number of deaths in South Africa for the years 1997-2008. The well-known age pattern is clear, but it is not clear why the deaths increased in most age groups. The reason is probably an increase in the population size and not in the mortality. A figure showing the death rates would have illuminated this.
Figure B20.1 Example of age and sex specific mortality rates
Source: Statistics South Africa (2015b).
END BOX 19
70

Chapter 6. Causes of deathMany countries have poor or non-existent cause of death data. The main reason for this is that there is no system in place in which cause of death is determined for all deaths. This is especially the case for deaths occurring outside medical institutions. In several countries, however, such as Mongolia and Norway, deaths outside health facilities are examined by a person with medical training, who includes the cause of death in the death certificate.
Ideally, the cause of death is determined by a medical doctor who has been trained in the use of the international form of the death certificate (World Health Organization 1979, 2016). The immediate or precipitating cause and underlying causes are specified on a medical certificate which is made available for statistical analysis.
For public health purposes, it is the underlying cause of death that is of most value. Itis defined as “(a) the disease or injury which initiated the train of morbid events leading directly to death, or (b) the circumstances of the accident or violence which produced the fatal injury”.20 It is this underlying cause of death that is amenable to preventative public health interventions. Subsequently, a trained statistical clerk or nosologist should code cause of death on the death certificate in line with the International Classification of Diseases (ICD-10) (WHO 2010a).
Many deaths, however, occur outside the health system and far away from trained health personnel, which makes it difficult to apply this approach.
If no health personnel have examined the decedent during or after the death, a verbal autopsy can be used as an alternative approach to determine the cause of death. Persons who cared for the person prior to death can be interviewed using a standardized questionnaire developed by WHO. This information is later analysed by trained health personnel or computer algorithms to assign the probable cause of death. There are now efforts to expand this approach and link it to the civil registration system in countries where medical certificates are not common.
Currently, many causes of death are not registered, so data in many countries are incomplete. Nevertheless, with the same justification as for publishing incomplete data on births and deaths, publishing what is available on cause of death should be considered to be an important beginning. Publishing information on incomplete data might increase the focus on data quality and the need for improvements in the registration system.
Several countries have chosen to publish cause of death reports separately because the availability of data does not always concur with the availability of birth and death data. This is linked to differences in institutional arrangements and responsibilities. South Africa, for example, publishes statistics on deaths and cause of death together in a special report.21. The current version of this template and guideline does not cover this topic as thoroughly as births and deaths, but there are plans to improve this either in future version of in a separate guide and template on causes of death.
According to WHO (2010b):
20 See World Health Organization, “Mortality database”. Available from http://www.who.int/healthinfo/cod/en.21 See “Key findings P0309.3”, Statistics South Africa. Available from www.statssa.gov.za/?page_id=1856&PPN=P0309.3&SCH=6377.
71

A frequently used indicator of the quality of cause-of-death data is the percentage of all deaths for which the cause is classified as ill-defined (chapter XVIII of the ICD-10). Ill-defined causes are of no public health value. Also, where they are common, they will make the cause-of-death distribution unreliable, because the true causes of death are hidden and hence underestimated. Generally, it is often mentioned that the percentage of deaths for which the cause is ill-defined should be less than 10 per cent at ages 65 years and over, and less than 5 per cent at ages below 65 years. If the percentage of ill-defined causes has declined significantly, caution must be exercised when interpreting trends in specific causes (such as cancers or heart disease), because changes in death rates from these causes may be largely or entirely due to the redistribution effect from ill-defined to more-specific causes.
WHO has published several publications on cause of death statistics that should be consulted, including the International Statistical Classification of Diseases and Related Health Problems (World Health Organization, 2010a) Analysing mortality levels and causes of death (World Health Organization, 2011) and the application of ICD-10 for low-resource settings initial cause of death collection (World Health Organization, 2014a). Moreover, the training course on civil registration and vital statistics systems, developed by the international statistics programme of Centers for Disease Control and Prevention (2015), has several modules addressing cause-of-death statistics.
If causes-of-death statistics are to be included in the vital statistics report, there should be a presentation of issues and statistics such as the following:
System for classifying causes of death (preferably ICD-10) Reported causes of death Method of ascertaining the cause of death Broad groups of the underlying causes of death:
o communicable/perinatal/maternalo non-communicableo external causes
Deaths by cause, age and sex Major groups of causes of death according to the global burden of disease Broad groups of natural causes of death Non-natural causes of death
Box 21. Summary causes of death in from Kenya (GREEN BOX)As an example of a summary cause of death table in a vital statistics report, an excerpt from the Kenya vital statistics report for 2013 is included.
Table B21.1 The 10 leading causes of death in Kenya, 2013
72

Source: Civil Registration Department (2014).
If cause of death statistics are published, it is important to discuss the quality and completeness of the data. This is done in C:
The CRD collects information on causes of death recorded on Forms D1 and D2, medical certification and lay reporting of cause of death, respectively.
The monthly tally list has several limitations. First, the causes of death from both registration forms are tallied together, with no way to distinguish the lay-reported causes by assistant chiefs from those that are medically certified by clinicians. Second, the comprehensive list of possible causes on the tally sheet includes a total of 46 causes of deaths, including the category “other causes.” This list contains most of those 24 causes listed on the D2 form and some other causes. Again, the list of tallied causes of death is not a standard list, and it is not known how or why those causes were selected over others.
Kenya does not use medical certification widely, a conclusion based on a previous assessment that used 2011 information on ICD-10 certified and coded data from MOH. For example, only 1 to 2 per cent of health facilities (i.e., 46 out of a total of 3,412 health facilities that are responsible for notifying births and deaths to CROs) reported ICD-10 coded deaths [MEASURE Evaluation–PIMA and CRD, 2013]. This information shows that 9,497 ICD-10 certified and coded deaths were reported by these institutions in 2011, out of a total of 411,641 expected deaths (2 to 3 per cent of deaths).
Three points should be emphasized regarding the table on the 10 leading causes of death in Kenya, which underscore the need to improve cause of death statistics in Kenya further. These are the following:
The proportion of medically certified deaths is very low, at only 2-3 per cent The list of causes does not abide by any international list of aggregated causes of death There is a high proportion of non-specific causes, other causes and all other causes, which
add up to 41.3 per cent for both sexes
END BOX 21
73
Chapter 7. Marriage and divorceIn this chapter, statistics on marriage, divorce and other marital changes may be presented if data on such events are registered. A combination of tables, graphs and explanatory text will be useful. Linkages to earlier chapters, especially the one on completeness, should also be considered.
It may be useful to begin this section by mentioning how a marriage is defined. In the United Nations Principles and Recommendations (2014), a marriage defined as “the act, ceremony or process by which the legal relationship of spouses is constituted. The legality of the union may be established by civil, religious or other means as recognized by the laws of each country.” It is also stated in the document that “countries may wish to expand this definition to cover civil unions if they are registered” and that “it is necessary to take into account customary unions (which are legal and binding under customary law) and extralegal unions, known as de facto or consensual unions.”
Furthermore, a divorce is defined as “the final legal dissolution of a marriage, that is, that separation of spouses which confers on the parties the right to remarriage under civil, religious and/or other provisions, according to the laws of each country.”
A legal contract of marriage may be dissolved by the death of one of the spouses, a divorce decree or cancellation (annulment).
The tables and graphs to be presented on marriage and divorce will depend on the variables collected when registering a birth. Annex I provides an overview of the variables that are considered most important. If available, these variables should therefore be considered when presenting information. Annex II includes a list of tables recommended by the United Nations Principles and Recommendations (2014) and some tables of indicators.
Box 22.: Why marriage and divorce statistics? (blue box)Marriage and divorce are registered in many countries. They are important events in people’s lives. The registration of them is necessary to obtain certificates, which may be of great legal and human rights significance. Examples include property rights, inheritance, custody of children and the right to remarry. Women and children in families in which the spouses are not married, in particular, may be in a much weaker economic and legal position if one of the parents dies or if the non-marital union is split.
It is worth noting that the marriage institution and its importance vary from country to country. In the Scandinavian countries, for example, marriage is far less important than it used to be. It has become socially acceptable for couples to live together and have children without being married. Nevertheless, most couples are marrying sooner or later. In some countries, virtually everybody marries and non-married couples, especially their children, may be ostracized, whereas, in other countries, it is common not to marry and not being married does not carry any social stigma.
Many countries do not publish marriage and divorce statistics. The reasons for this can be a lack of availability of data if marriages and divorces are not registered or a lack of social significance of marriage.
74

END BOX 22.
Box 23.: Examples of tables and figures on marriage and divorce in Botswana (GREEN BOX)Below are some examples of marital tables and figures from Botswana, taken from Statistics Botswana (2016):, where more examples can be found.
Vital statistics reports for most countries do not include marriage and divorce. This is the case for countries such India, Kenya, Namibia and South Africa.
Figure B23.1 Total number of marriages registered in Botswana, 2005-2014
Source: Statistics Botswana (2016).
Figure B23.2. Registered marriages by month of registration in Botswana, 2014
(Per cent)
Source: Statistics Botswana (2016).
75

Table B23.3 Mean age at first marriage in Botswana, 2005-2014
Source: Statistics Botswana (2016).
End box 23
76

Chapter 8. Summary tablesAt the end of the vital statistics report, there may be a few summary tables that show the development of the major vital statistics indicators over time, for as many years as possible. In United Nations (2014, p. 159), a list of summary tables is proposed, which is also found in annex II.
The tables recommended by the United Nations are important and efforts should be made to include as many as possible. Data on some of these variables may, however, not be available at all or there may be serious underregistration, in particular of foetal deaths, infant deaths, marriages and divorces. If data are not available by place of residence, the numbers may be tabulated by place of occurrence or registration.
The most essential of these tables is the last one, ST-9 (see table 7.1).
Table 7.1 Time series of vital events, 201x
Year Live births Deaths Infant deaths Marriages Divorces:
201220132014
If there are data on internal or external migrations, they could be included in this table. Another essential summary table is one showing vital rates, based on the calculation explained in section 3.2 (see table 7.2).
Table 7.2. Time series of vital rates, 201x
Year Crude birth rate
Crude death rate
Population size
Population growth
:201220132014
To make this table, it is necessary to use denominators with counts or estimates of the population size. In section 3.2, an explanation is given of how this can be done from population censuses and population projections.
Box 24. Expected population size (BLUE BOX) If there are no available data on total births and deaths, estimates of the total population size are required to estimate the number of expected births or deaths and to estimate crude birth and death rates. The number of expected births or deaths may be calculated using either crude birth and death rates or age-specific birth and death rates. Age-specific rates yield more accurate estimates of expected events because they control for age. All the completeness rates should therefore preferably be generated using age-specific information.
77

Sex and age-specific birth and death rates may be estimated from the most recent census or from a sample survey, such as demographic and health surveys. If there are clear time trends, the rates should be projected. If no age-specific rates are available and there are no relevant data to estimate them, they may be taken from the database of United Nations Population Division.22
Estimates of the population size by age and sex may be taken from a population register, which relatively few countries have (see box 7), or more commonly from population projections, which are normally based on the most recent census. It should be noted that there are problems of declining accuracy of population estimates as one gets further away from the year of the most recent census. The reasons for this are primarily changing trends of fertility, mortality and migration rates, both at the national and regional levels. This is particularly true for small areas and is usually the reason why completeness rates for small areas may be greater than 100 per cent.
If reliable national population projections are not available, they may be taken from the database of United Nations Population Division.
Crude birth and death rates can be calculated in the following way:
(a) Crude birth rate = Estimated number of expected births / Total population x 1000;(b) Crude death rate = Estimated number of expected deaths / Total population x 1000.
Estimates of crude rates are of considerable interest in itself, given that they say something about fertility and mortality trends. These numbers may be included in the summary tables.
The expected numbers of births may be calculated using the most recent age-specific birth rates of women of reproductive age (between 15 and 49 years), multiplied by the corresponding projected female populations by age or by the crude birth rate multiplied by the total population size.
END BOX 24
22 Available from http://esa.un.org/unpd/wpp/DataQuery/.
78

References
Brunborg, Helge (2010). Vital statistics. Report from a mission to the National Statistical Institute of Mozambique. Report MZ:2010:13. Available from www.dst.dk/mozambique.
Centers for Disease Control and Prevention (2015). Training course on civil registration and vital statistics systems. International statistics programme. Available from www.cdc.gov/nchs/isp/isp_fetp.htm.
________ (2016). Deaths: Final Data for 2013. National Vital Statistics Reports, vol. 64, No. 2. Available from www.cdc.gov/nchs/data/nvsr/nvsr64/nvsr64_02.pdf.
Civil Registration Department (2014). Annual Vital Statistics Report, 2013. Civil Registration Department, Statistics Division. Nairobi: Government of Kenya.
Economic and Social Commission for Asia and the Pacific (2015). Guidelines for setting and monitoring the goals and targets of the regional action framework on civil registration and vital statistics in Asia and the Pacific. Available from www.unescap.org/resources/guidelines-setting-and-monitoring-goals-and-targets-regional-action-framework-civil-0.
Economic Commission for Africa (2015). Complete civil registration and vital statistics systems and their multisectoral services and linkages. Available from http://apai-crvs.org/.
Measure Evaluation Kenya Associate Award (2013). National Civil Registration and Vital Statistics System. Baseline Systems Assessment Report. Nairobi.
Office national des Statistiques (2016). Demographie Algerienne, 2015. No. 740. April 2016, www.ons.dz/IMG/pdf/Demographie2015.pdf.
Office of the Registrar-General of India (2013). Vital statistics of India based on the civil registration system, 2010. New Delhi. Available from www.censusindia.gov.in/2011-Common/vitalstatistics.html.
Statistics Botswana (2014). Vital statistics report 2012. Gaborone. Available from www.cso.gov.bw/images/vital_stats.pdf.
__________ (2016). Vital statistics report 2014. Gaborone. Available from www.cso.gov.bw/images/vital_stats.pdf.
Statistics Mauritius (2015). Digest of demographic statistics 2014. Port Louis. Available from http://statsmauritius.govmu.org/English/StatsbySubj/Documents/Digest/Digest%20of%20Demographic%20Statistics%202014final.pdf .
Statistics Norway (2009). User-friendly presentation of statistics. In English, French, Arabic, Russian and Portuguese. Available from www.ssb.no/en/omssb/samarbeid/internasjonalt-utviklingssamarbeid/a-handbook-on-dissemination-of-statistics.
______ (2014). Status analysis on civil registration and vital statistics (civil registration and vital statistics). Document 2014/41. Available from
79

www.ssb.no/befolkning/artikler-og-publikasjoner/status-analysis-on-civil-registration-and-vital-statistics-crvs.
Statistics South Africa (2015a). Recorded live births 2014. Statistical release P0305. Available from www.statssa.gov.za/?page_id=1854&PPN=P0305 .
__________ (2015b). Mortality and causes of death in South Africa, 2014: Findings from death notification. Statistical release P0309.3. Available from www.statssa.gov.za/publications/P03093/P030932014.pdf .
United Nations (1969). Methodology and Evaluation of Population Registers and Similar Systems. Studies in Methods, Series F, No. 15. Sales No. E.69.XVII.15. Available from http://unstats.un.org/unsd/publication/SeriesF/Seriesf_15e.pdf .
__________(2002). Handbooks, guidelines and training manuals on civil registration and vital statistics systems. Available from http://unstats.un.org/unsd/demographic/standmeth/handbooks/default.htm .
__________(2014). Principles and Recommendations for a Vital Statistics System. (210 Revision 3. Department of Economic and Social Affairs, Statistics Division Statistical Papers, Series M No. 19/Rev.3, New York. Available from http://unstats.un.org/unsd/Demographic/standmeth/principles/M19Rev3en.pdf .
__________ (2015). Transforming our world: the 2030 Agenda for Sustainable Development. General Assembly resolution 70/1. Available from https://documents-dds-ny.un.org/doc/UNDOC/GEN/N15/291/89/PDF/N1529189.pdf?OpenElement.
___________ (1979). Medical Certification of Cause of Death: Instructions for Physicians on Use of International Form of Medical Certificate of Cause of Death. Geneva. Available from http://apps.who.int/iris/bitstream/10665/40557/1/9241560622.pdf.
_______________ (2010a). International Statistical Classification of Diseases and Related Health Problems., Tenth revision. Geneva. Available from www.who.int/classifications/icd/en/ .
_______ (2010b). Improving the Quality and Use of Birth, Death and Cause-of-death Information: Guidance for a Standards-based Review of Country Practices. Geneva. www.who.int/healthinfo/tool_cod_2010.pdf .
_________ (2010c). Rapid Assessment of National Civil Registration and Vital Statistics Systems. Geneva. WHO/IER/HIS/STM/2010.1. Available from http://apps.who.int/iris/bitstream/10665/70470/1/WHO_IER_HSI_STM_2010.1_eng.pdf .
_________ (2011). Analysing mortality levels and causes of death (ANACoD). Geneva. Available from http://www.who.int/healthinfo/anacod/en/.
________ (2012). Strengthening Civil Registration and Vital Statistics for Births, Deaths and Causes of Death: Resource Kit. Geneva. Available from h http://apps.who.int/iris/bitstream/10665/78917/1/9789241504591_eng.pdf.
80
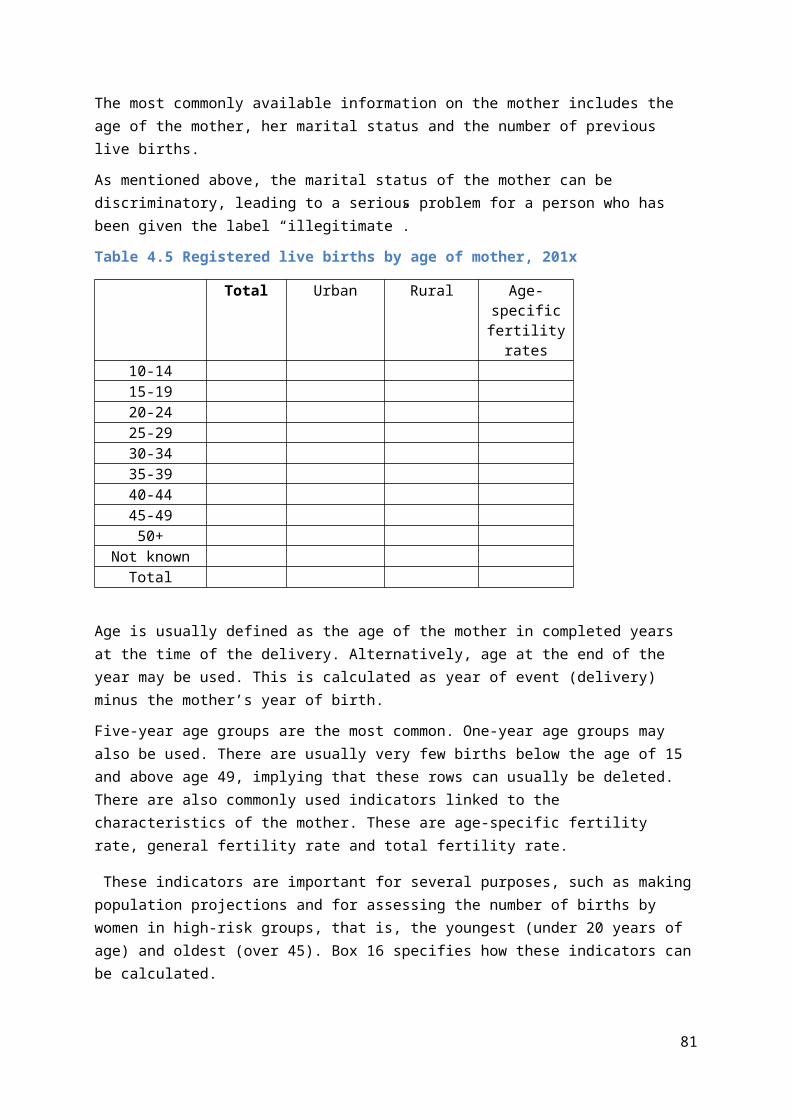
_________________ (2014a). Application of ICD-10 for low-resource settings initial cause of death collection. The startup mortality list (ICD-10-SMoL) V2.0, WHO/HIS/HSI/2014.6. Geneva. Available from www.who.int/healthinfo/civil_registration/ICD_10_SMoL.pdf?ua=1.
__________________ (2014b). Implementing basic checks on cause-of-death data: CodEdit tool. Available from http://www.who.int/healthinfo/codedit/en/.
_________________ (2014c) Improving mortality statistics through civil registration and vital statistics systems: strategies for country and partner support. Geneva. Available from http://www.who.int/healthinfo/civil_registration/CRVS_MortalityStats_Guidance_Nov2014.pdf.
_________________ (2016). Changes, vol. 2, ICD-10 2010-2016. Available from http://apps.who.int/classifications/icd10/files/ICD10Vol220162010Trackchanges.pdf?ua=1.
81

Annex I: Civil registration variables
Birth registration variables
Number
Topic Available from civil registration of birth
Available from other sources
Not available
Year(s) available
(i) Characteristic of the event
a Date of occurrence
b Date of registration
c Place of occurrence
d Locality of occurrence
e Urban/rural occurrence
f Place of registration
gType of birth (i.e., single, twin, triplet, quadruplet
or higher multiple delivery)
h Attendant at birth
i Type of place of occurrence (hospital, home, etc.)
(ii) Characteristics of the newborn
a Sex
b Weight at birth
(iii) Characteristics of the mother
a Date of birth
b Age
c Marital status
dChild born in wedlock (legitimacy status of the
child)
e Educational attainment
f Literacy status
g Ethnic and/or national group
h Citizenship
i Economic activity status
j Usual occupation
k Socioeconomic status
l Place of usual residence
m Locality of residence
n Urban/rural residence
o Duration of residence in usual place
p Place of previous residence
q Place/country of birth
r Migrant status
s Date of last menstrual cycle of the mother
t Gestational age
u Number of prenatal visits
v Month of pregnancy prenatal care began
82

wChildren born alive to mother during her entire
lifetime
x Birth order or parity
y Foetal deaths to mother during her entire lifetime
z Date of last previous live birth
aa Foetal deaths to mother during her entire lifetime
ab Date of last previous live birth
ac Interval since last previous live birth
ad Date of marriage
ae Duration of marriage
(iv) Characteristics of the father (if known)
a Date of birth
b Age
c Marital status
d Educational attainment
e Literacy status
f Ethnic and/or national group
g Citizenship
h Economic activity status
i Usual occupation
j Socioeconomic status
k Place of usual residence
l Locality of residence
m Urban/rural residence
(v)Characteristics of population at risk (see United Nations
(2014, p. 48)
Death registration variables Number Topic Available
from civil registration of births
Available from other sources
Not available
Year(s) available
(i) Characteristics of the event
a Date of occurrence
b Date of registration
c Place of occurrence
d Locality of occurrence
e Urban/rural occurrence
f Place of registration
g Cause of death
h Manner of death
iWhether autopsy findings were used to establish
cause of death
j
Death occurring during pregnancy, childbirth and puerperium (for females between 15 and 49 years of age)
k Certifier
l Type of certification
83
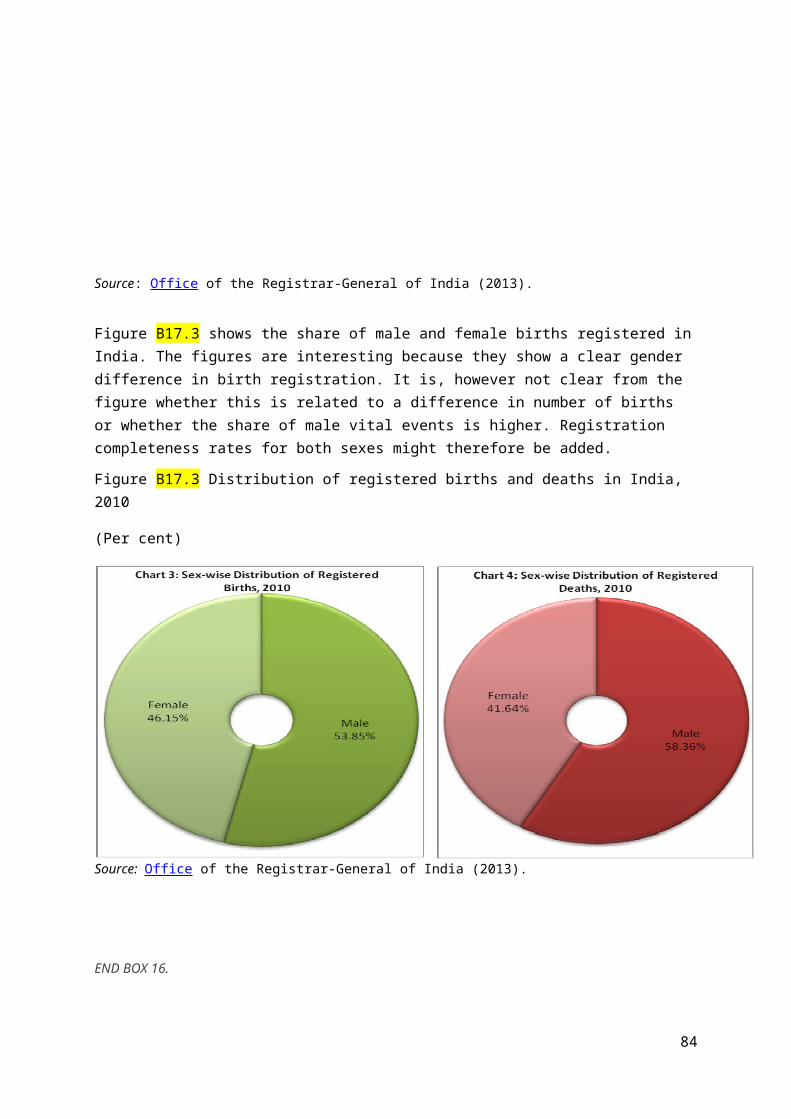
m Type of place of occurrence (hospital, home, etc.)
(ii) Characteristics of the decedent
a Date of birth
b Age
c Sex
d Marital status
e Educational attainment
f Literacy status
g Ethnic and/or national group
h Citizenship
i Economic activity status
j Usual occupation
k Socioeconomic status
lWhether birth was registered (for deaths under 1
year of age)
m Born in wedlock (for deaths under 1 year of age)
n Legitimacy status (for deaths under 1 year of age)
o Place of usual residence
pPlace of usual residence of the mother (for deaths
under 1 year of age)
q Locality of residence
r Urban/rural residence
s Duration of residence in usual (present) place
t Place of previous residence
u Place of birth
v Migrant status
(iii)Characteristics of population at risk (see United Nations
(2014, p. 48)
Foetal death registration variables Still births?
Number
Topic Available from civil registration of births
Available from other sources
Not available
Year(s) available
(i) Characteristics of the event
a Date of occurrence (of foetal delivery)
b Date of registration
c Place of occurrence
d Locality of occurrence
e Urban/rural occurrence
f Place of registration
gType of birth (i.e., single, twin, triplet, quadruplet,
or higher multiple delivery)
h Attendant at birth
i Certifier
j Type of certification
k Cause of foetal death
l Type of place of occurrence (hospital, home, etc.)
84
(ii) Characteristics of the foetus
n Sex
a Delivered in wedlock
b Legitimacy status
c Weight at delivery
d Date of last menstrual period of the mother
e Gestational age
(iii) Characteristics of the mother
a Date of birth
b Age
c Number of prenatal visits
dChildren born alive to mother during her entire
lifetime
e Birth order or parity
fChildren born to mother during her entire lifetime
and still living
g Foetal deaths to mother during her entire lifetime
h Date of last previous live birth
i Interval since last previous live birth
j Date of marriage
k Duration of marriage
l Educational attainment
m Literacy status
n Economic activity status
o Usual occupation
p Socioeconomic status
q Ethnic and/or national group
r Citizenship
s Place of usual residence
t Locality of residence
u Urban/rural residence
v Duration of residence in usual (present) place
x Place of previous residence
y Place of birth
z Migrant status
(iv) Characteristics of the father
a Date of birth
b Age
c Education attainment (30) ¦
d Literacy status (31) ¦
e Economic activity status (34) ¦
f Usual occupation (35) ¦
g Socioeconomic status
h Place of usual residence
i Locality of residence
j Urban/rural residence
k Duration of residence in usual (present) place
85
l Place of previous residence
m Place of birth
n Migrant status
o Ethnic and/or national group
p Citizenship
(v)Characteristics of population at risk (see United Nations
(2014, p. 48)
Marriage registration variables
Number
Topic Available from civil registration of marriages
Available from other sources
Not available
Year(s) available
(i) Characteristics of the event
a Date of occurrence (of foetal delivery)
b Date of registration
c Place of occurrence
d Locality of occurrence
e Urban/rural occurrence
f Place of registration
g Type of marriage
(ii) Characteristics of bride and groom (separately)
a Date of birth
b Age
c Marital status (previous)
d Number of previous marriages
e Marriage order
f Educational attainment
g Literacy status
h Economic activity status
i Usual occupation
j Socioeconomic status
k Ethnic and/or national group
l Citizenship
m Place of usual residence
n Locality of residence
o Urban/rural residence
p Duration of residence in usual (present) place
q Place of previous residence
r Place of birth
s Migrant status
(iii)
Characteristics of population at risk (see United Nations (2014, p. 48)
86
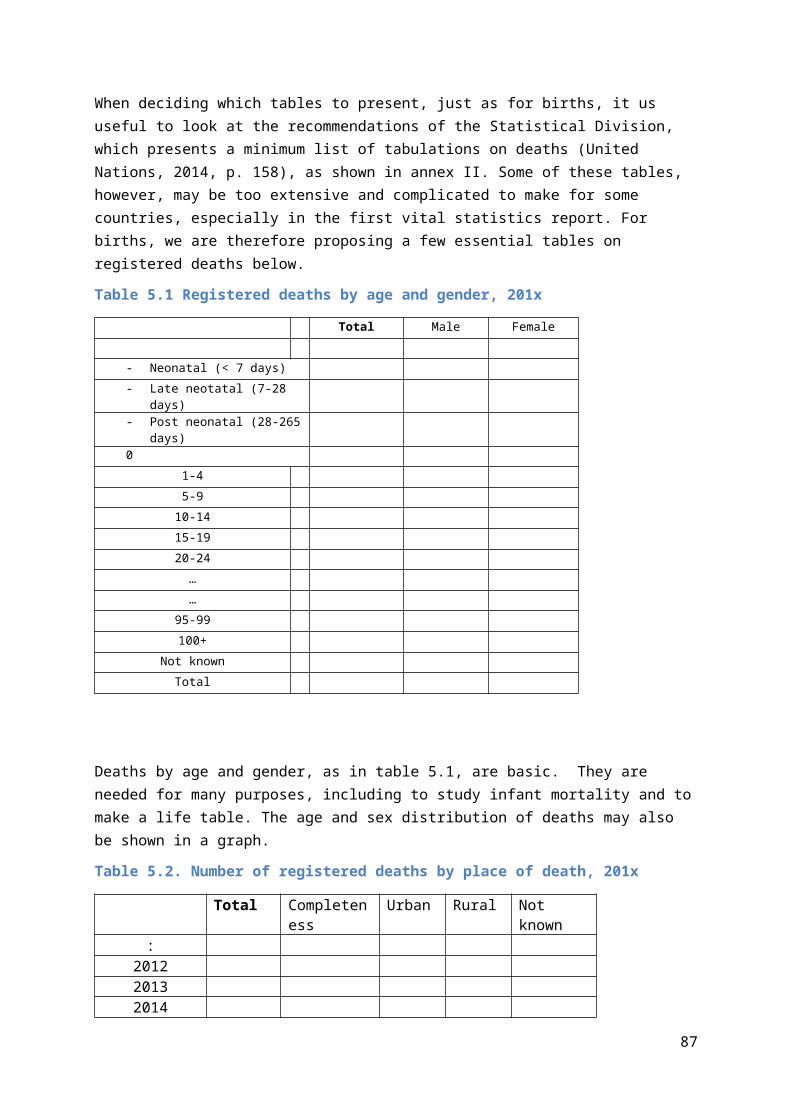
Divorce registration variables
Number
Topic Available from civil registration of divorces
Available from other sources
Not available
Year(s) available
(i) Characteristics of the event
a Date of occurrence
b Date of registration
c Place of occurrence
d Locality of occurrence
e Urban/rural occurrence
f Place of registration
(ii) Characteristics of divorcees (husband and wife separately)
a Date of birth
b Age
c Type of marriage being dissolved
d Number of dependent children of divorced persons
eNumber of children born alive to the marriage
being dissolved
f Date of marriage
g Duration of marriage
h Mode of dissolution of previous marriage
i Number of previous marriages
j Marriage order
k Educational attainment
l Literacy status
m Economic activity status
n Usual occupation
o Socioeconomic status
p Ethnic and/or national group
q Place of usual residence
r Locality of residence
s Urban/rural residence
t Duration of residence in usual (present) place
u Place of previous residence
v Place of birth
w Migrant status
x Place of occurrence of marriage being dissolved
(iii)Characteristics of population at risk (see United Nations
(2014, p. 48)
Source: United Nations (2014, table III.1, pp. 18-19).Note: definitions and specifications are presented in United Nations (2014, chap. III.D, pp. 24-48). Core topics are indicated by boldface (from United Nations (2014)).
87

Annex II: Tabulation planThis annex includes the tables recommended by the United Nations Principles and Recommendations (2014) and other tables proposed in these guidelines. It may be useful to go through these lists when making the tabulation plan and to include the years(s) for which the tables can (or should) be made. The choice and numbering of the tables is up to the country.
Place of usual residence is commonly considered to be the most important location variable. The number of administrative units to be included depends on the administrative structure of the civil registration system and the number of units. If the number of units is large, a more detailed table may be included as an annex to the vital statistics report and/or a web table. Table A2.1. Live births
Table num-ber
Num-ber in the United Nations Principles and Recommendations
Table content Pos-sible: Yes/ No
Possible if civil registration data are combined with data from other sources
Year(s)
First priority tables4.1 IB-1 Total number of live births by sex, incl. sex ratio at birth and
site of deliverya
4.2 ST-3 Live births by place of residence1 and urban–rural residence of the mothera
4.3 LB-9 Live births by age of mother (15-19, 20-24 … 45-49)4.4 LB-1 Live births by place of occurrence and sex of childa
4.5 LB-2 Live births by place of occurrence and place of usual residence of motherSecond priority tables
LB-3 Live births by place of registration, month of occurrence and month of registration
LB-9 Live births by place of usual residence and age of mother, sex of child and live-birth order
LB-11 Live births by place of birth, place of usual residence and age of mother
LB-13 Live births by place of occurrence, site of delivery and attendant at birth
LB-4 Live births by month, place of occurrence and place of usual residence of mother
LB-5 Live births by age, place of usual residence and marital status of mother
LB-6 Live births by age of fatherLB-7 Live births by place of usual residence, age and educational
attainment of motherLB-8 Live births by educational attainment and age of mother, and
88

live-birth orderLB-10 Live births by live-birth order and interval between last and
previous live births to motherLB-12 Live births by place of usual residence and age of mother and
legitimacy statusLB-14 Live births by site of delivery, attendant at birth and birth
weightLB-15 Live births by birth weight and place of usual residence and
educational attainment of motherLB-16 Live births by gestational age, place of usual residence of
mother and birth weightLB17- Live births by birth weight, place of usual residence of mother
and month in which prenatal care beganLB-18 Live births by age and place of usual residence of mother and
month in which prenatal care beganLB-19 Live births by live-birth order, place of usual residence of
mother and month in which prenatal care beganLB-20 Live births by place of usual residence of mother and
duration of residence at the LB-current usual residencea May also include the sex ratio at birth.
Table A2.2. Indicators of live births Table num-ber
Number in guidelines
Table content Pos-sible: yes/ no
Possible if civil registration data are combined with data from other sources
Year(s)
First priority tablesIB-1 Crude birth rateIB-2 Age-specific birth rates for 5-year age groupsIB-3 Total fertility rate
Second priority tablesIB-4 General fertility rateIB-5 Net reproduction rateIB-6 Mean (or median) age at childbearing IB-7 Mean (or median) age at first birthIB-8 Proportion of births born in marriageIB-9 Children ever born
Table A2.3. DeathsTable num-ber
Number in the United Nations Principles and Recommendations
Table content Pos-sible: yes/ no
Possible if civil registration data are combined with data from other sources
Year(s)
First priority tablesDE-1 Deaths by place of usual residence and sex of
decedentDE-2 Deaths by place of occurrence and place of usual
residence and sex of decedentDE-4 Deaths by place of registration, month of
occurrence and month of registrationDE-5 Deaths by place of occurrence and site of
occurrence
89
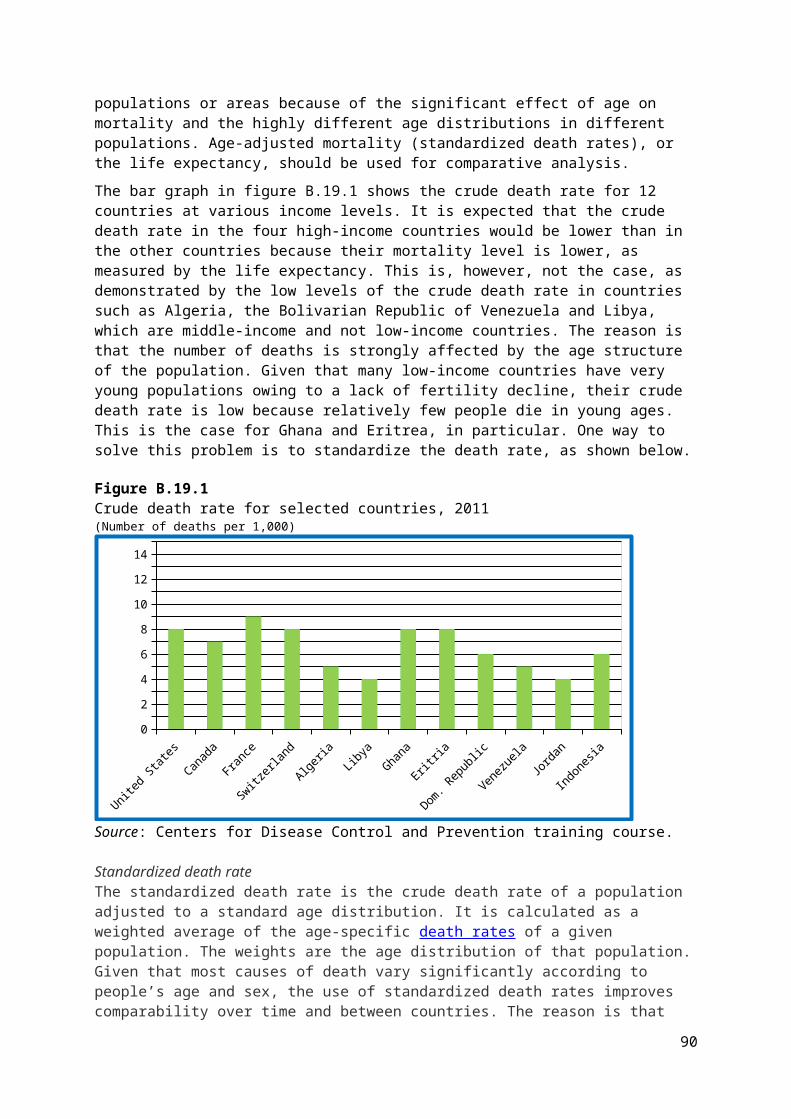
DE-6 Deaths by place of usual residence, age and sex of decedentSecond priority tables
DE-3 Deaths by month and place of occurrence and place of usual residence of decedent
DE-7 Deaths by age, sex, place of usual residence and marital status of decedent
DE-8 Deaths by place of usual residence, age, sex and educational attainment of decedent
DE-9 Deaths by sex, cause of death, place of usual residence and age of decedent
DE-10 Deaths by month of occurrence and cause of death
DE-11 Deaths by place of occurrence, sex of decedent and type of certification
DE-12 Maternal deaths by cause of death and age of woman
DE-13 Deaths by age and type of usual activity of decedent
Table A2.4. Indicators of deathsTable num-ber
Num-ber in the United Nations Principles and Recommendations
Table content Pos-sible: yes/ no
Possible if civil registration data are combined with data from other sources
Year(s)
First priority tablesID-1 Total number of deaths by sexID-2 Crude death rateID-3 Infant mortality rateID-4 Under-five mortality rateID-5 Maternal mortality rateID-6 Age-specific death rates (mx) for 5-year age groups by sexID-7 Life expectancy at birth (e0)
Second priority tablesID-8 Life table for each sex
Table A2.5. Marriage and divorceTable num-ber
Number in the United Nations Principles and Recommendations
Table content Pos-sible: yes/ no
Possible if civil registration data are combined with data from other sources
Year(s)
MA-1 Marriages by place of usual residence of groom
90

and month of occurrenceMA-2 Marriages by place of usual residence of groom
and age of bride and of groomMA-3 Marriages by age and previous marital status of
bride and of groomMA-4 Marriages by educational attainment of bride and
of groomMA-5 Marriages by occupation of bride and of groomDI-1 Divorces by place of usual residence of husbandDI-2 Divorces by age of husband and wifeDI-3 Divorces by duration of marriage and age of
husband and of wifeDI-4 Divorces by duration of marriage and number of
dependent childrenDI-5 Divorces by educational attainment of husband
and of wifeDI-6 Divorces by occupation of husband and of wifeDI-7 Divorces by number of previous marriages of
husband and of wifeST-7 Time series of marriages by place of usual
residence of groom (past 10 years)ST-8 Time series of divorces by place of usual residence
of husband (past 10 years)
Table A2.6. Indicators of marriages and divorcesTable num-ber
Number in guide-lines
Table content Pos-sible yes/ No
Possible if civil registration data are combined with data from other sources
Year(s)
First priority tablesMI-1 Crude marriage rate and crude divorce rateMI-2 Mean age at first marriageMI-3 Mean age at divorce
Second priority tablesMI-4 Proportion of marriages ending in divorce
Table A2.7. Summary tablesThe tables marked with a star may be more appropriate in the chapter on each vital event. Table num-ber
Num-ber in the United Nations Principles and Recommendations
Table content Pos-sible: yes/ no
Possible if civil registration data are combined with data from other sources
Year(s)
ST-1 Live births, deaths, infant deaths, foetal deaths, marriages
91
and divorces by place of usual residenceST-2 Crude birth rate, crude death rate, infant mortality rate by
sex, foetal mortality rate, crude marriage rate and crude divorce rate, by place of usual residence
ST-3 Time series of live births by place of usual residence of mother (past 10 years)*
ST-4 Time series of deaths by place of usual residence of decedent (past 10 years)*
ST-5 Time series of infant deaths by place of usual residence of mother (past 10 years)*
ST-6 Time series of foetal deaths by place of usual residence of mother (past 10 years)*
ST-7 Time series of marriages by place of usual residence of groom (past 10 years)*
ST-8 Time series of divorces by place of usual residence of husband (past 10 years)*
ST-9 Times series of vital events in the country (past 10 years)
92
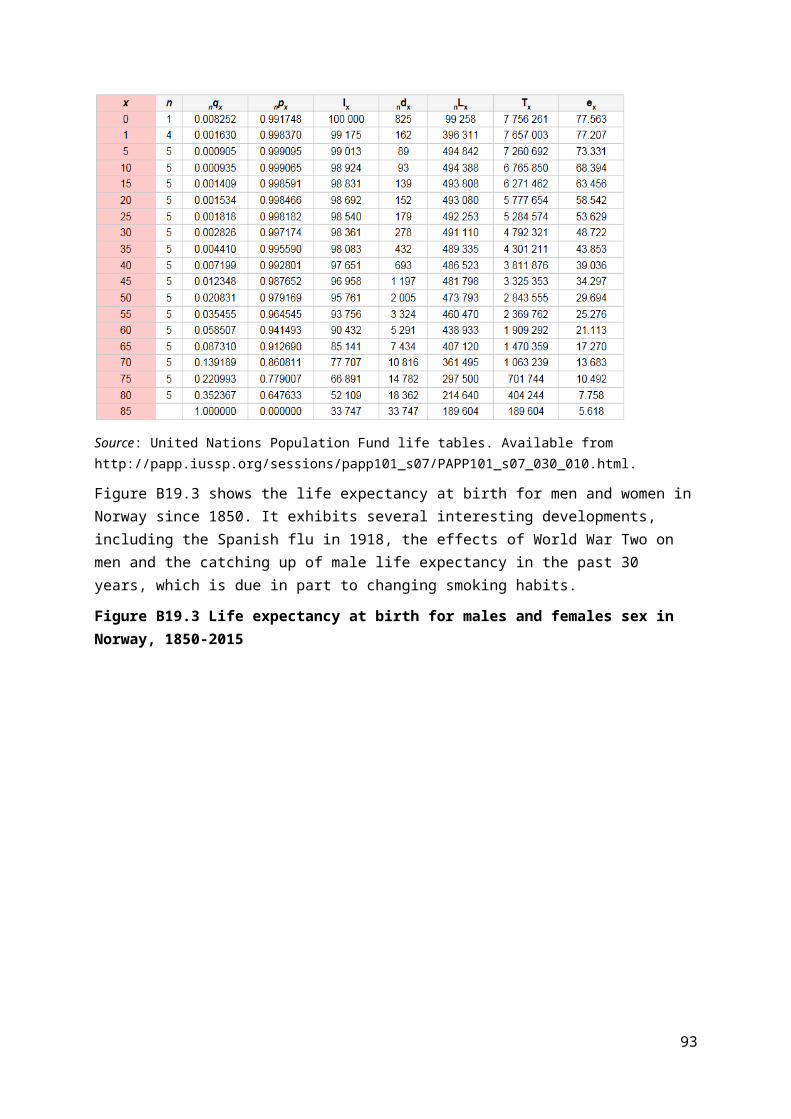
Annex III: Registration formsThe vital statistics report should attach the notification and registration forms for births and deaths and other relevant civil registration and vital statistics forms and documents, including forms for transferring aggregate data to the statistical office. The forms should be the original forms in the official language(s) of the country, with translations into English, if available.
93