PART OF AN ENVIRONMENTAL IMPACT ASSESSMENT FOR THE ... · PART OF AN ENVIRONMENTAL IMPACT...
32
TRAFFIC IMPACT ASSESSMENT PART OF AN ENVIRONMENTAL IMPACT ASSESSMENT FOR THE PROPOSED SKUKUZA SAFARI LODGE IN THE KRUGER NATIONAL PARK 6 November 2014 Report prepared by: Corli Havenga Transportation Engineers 91 Tinderwood Crescent Sand River Camp WITFONTEIN X25 PO Box 133, SERENGETI, 1642 Tel: +27 (011) 552 7271 Fax: +27(011) 552 7272 Cell: 083 284 2860 (Corli) Cell: 083 458 0066 (Cobus) E-mail: [email protected]
Transcript of PART OF AN ENVIRONMENTAL IMPACT ASSESSMENT FOR THE ... · PART OF AN ENVIRONMENTAL IMPACT...

TRAFFIC IMPACT ASSESSMENT PART OF AN ENVIRONMENTAL IMPACT ASSESSMENT
FOR THE PROPOSED SKUKUZA SAFARI LODGE
IN THE KRUGER NATIONAL PARK
6 November 2014
Report prepared by:
Corli Havenga Transportation Engineers 91 Tinderwood Crescent Sand River Camp W IT F O N TE I N X2 5 PO Box 133, SERENGETI, 1642
Tel: +27 (011) 552 7271 Fax: +27(011) 552 7272 Cell: 083 284 2860 (Corli) Cell: 083 458 0066 (Cobus)
E-mail: [email protected]

TRAFFIC IMPACT ASSESSMENT PART OF AN ENVIRONMENTAL IMPACT ASSESSMENT
FOR THE PROPOSED SKUKUZA SAFARI LODGE IN THE KRUGER NATIONAL PARK
CONTENTS Page
DECLARATION
1. BACKGROUND 1
2. METHODOLOGY 1
3. SITE LOCATION AND ACCESSIBILITY 1
4. EXISTING TRAFFIC DEMAND 2
5. TRIP GENERATION 15
6. TRIP DISTRIBUTION & BACKGROUND TRAFFIC GROWTH 15
7. ANALYSIS 16
8. CONCLUSION AND RECOMMENDATION 17
9. REFERENCES 18
ANNEXURE At the back of report
SKUKUZA CONFERENCE LODGE: LAYOUT MAP BY EXIGO3
SITE PLAN CONSEPT DESIGN GROUND FLOOR BY TOM HATTINGH ARCHITECTS
FIGURE 1: SITE LOCATION PLAN
GRAPHS

Member of SAACE Corli Havenga Pr Eng, B.Eng Civil M.Eng. Transportation Members Cobus Havenga Pr Eng. B.Eng Civil Hons. Eng. Transportation
CC Reg No 91/30938/23
91 Tinderwood Cresc Sand River Camp
W IT F O N TE I N X2 5 PO Box 133, SERENGETI, 1642
E-mail: [email protected]
Tel: +27011) 552 7271 Fax: +27(011) 552 7272
Cell: 083 284 2860 (Corli) Cell: 083 458 0066 (Cobus)
DECLARATION I certify that this TRAFFIC IMPACT ASSESSMENT: PART OF AN ENVIRONMENTAL IMPACT
ASSESSMENT FOR THE PROPOSED SKUKUZA SAFARI LODGE IN THE KRUGER NATIONAL
PARK was prepared by me and I have experience and training in the field of traffic and
transportation engineering.
Signed: ……………………… DATE: 6 NOVEMBER 2014
Name: Cobus Havenga Qualification: Pr Eng, B Eng Civil, Hons Transportation Engineering ECSA Registration Number: 970277 Company: Corli Havenga Transportation Engineers

1 Skukuza
PP20898
TRAFFIC IMPACT ASSESSMENT PART OF AN ENVIRONMENTAL IMPACT ASSESSMENT
FOR THE PROPOSED SKUKUZA SAFARI LODGE IN THE KRUGER NATIONAL PARK
1. BACKGROUND
This traffic impact assessment was done as part of the Environmental Impact Assessment for the development of the proposed Skukuza Safari Lodge within the existing Skukuza Rest Camp in the Kruger National Park. The proposed facility is planned to be located next to (just west of) the existing Conference Centre. The location of the proposed facility is indicated in the Skukuza Conference Lodge: Layout Map of Exigo
3, a
copy of which is presented in the Annexure. The proposed facility will comprise a 128-bedroom Safari Lodge; a copy of the Concept Design Site Plan is presented in the Annexure. Some existing staff accommodation (10 units) and 6 chalets will be removed to accommodate the new facility. New staff accommodation will be developed. Of the planned 128 staff members only 40 to 48 staff members will be accommodated in Skukuza, the rest will be transported by bus daily.
2. METHODOLOGY The normal methods used to measure the impact of a development on the road network are not really relevant for the roads within the Kruger National Park, because they measure the level of service at intersections during the peak traffic hours. The Kruger National Park measured congestion levels on different roads as part of a comprehensive Traffic Assessment
(1) done for the park in July 2008. Density was used as the measure using the following formula:
Density = 2,4*Hourly Traffic Volume/Average Speed
Initially a density threshold value of 2 vehicles per km was set as the norm. As part of the Traffic Assessment
(1) the then current densities were measured and the acceptable road congestion thresholds, as
perceived by visitors, were determined. Visitors indicated that they would be comfortable with congestion levels up to 7 or 8 vehicles/km. Based on the maximum acceptable number of vehicles at any sighting, a threshold value of 3 vehicles per kilometre was accepted. Based on the available data the following methodology was adopted:
Obtain gate entry data at all the southern gates. Obtain the vehicle count information done in 2008. Calibrate the vehicle count data with the gate entry data for the same dates. Use the calibration to convert the gate entry data into equivalent 12-hour count information. Determine the congestion levels of the respective roads for the years for which the gate entry
data are available. Determine the trip generation and distribution for the proposed Safari Lodge facility. Add the expected new trips to the existing (modelled) 12-hour counts. Determine the congestion levels of the respective roads that the proposed Safari Lodge will
impact.
3. SITE LOCATION AND ACCESSIBILTY The proposed new Safari Lodge will be located in the existing Skukuza camp as depicted in Figure 1. This Safari Lodge will specifically cater for the conference facility. We therefore expect the shortest routes to the

2 Skukuza
PP20898
facility to be the most popular routes. The following three roads are regarded as the most likely and popular to be used by Safari Lodge guests: Numbi Gate travelling along Road H1-1 to Skukuza Phabeni Gate travelling along Roads S1 and H11 to Skukuza Paul Kruger Gate travelling along Road H11 to Skukuza
4. EXISTING TRAFFIC DEMAND
4.1 Gate entry data We obtained gate entry data from the park dating back to 2007 up to the end of December 2012. In addition to these we were also given a copy of the Traffic Impact Study done for the Conference Facility
(2), dated May
2008 as well as the Traffic Assessment done for the Marula Region Strategic Environmental Assessment Kruger Park
(1), dated July 2008.
As part of the Traffic Assessment done for the Marula Region Strategic Environmental Assessment, various counting stations were set up in the southern region of the Kruger Park. The traffic counts done at the relevant counting stations were conducted during April 2008. From the gate entry data which we obtained from the Park, we extracted the data for April 2008. The graphs below depict the Kruger Park entries at the Numbi Gate, Phabeni Gate and the Paul Kruger Gate:
NUMBI GATE ENTRIES (APRIL 2008)
0
200
400
600
800
1000
01/0
4/2
008
03/0
4/2
008
05/0
4/2
008
07/0
4/2
008
09/0
4/2
008
11/0
4/2
008
13/0
4/2
008
15/0
4/2
008
17/0
4/2
008
19/0
4/2
008
21/0
4/2
008
23/0
4/2
008
25/0
4/2
008
27/0
4/2
008
29/0
4/2
008
Day of the month
Nu
mb
er
of
peo
ple
/day
Total Visitors
Day Visitors
Overnight Visitors
PHABENI GATE ENTRIES (APRIL 2008)
0200400600800
100012001400
01/0
4/2
008
03/0
4/2
008
05/0
4/2
008
07/0
4/2
008
09/0
4/2
008
11/0
4/2
008
13/0
4/2
008
15/0
4/2
008
17/0
4/2
008
19/0
4/2
008
21/0
4/2
008
23/0
4/2
008
25/0
4/2
008
27/0
4/2
008
29/0
4/2
008
Day of the month
Nu
mb
er
of
peo
ple
/day
Total Visitors
Day Visitors
Overnight Visitors

3 Skukuza
PP20898
KRUGER GATE ENTRIES (APRIL 2008)
0200400600800
10001200
01/0
4/2
008
03/0
4/2
008
05/0
4/2
008
07/0
4/2
008
09/0
4/2
008
11/0
4/2
008
13/0
4/2
008
15/0
4/2
008
17/0
4/2
008
19/0
4/2
008
21/0
4/2
008
23/0
4/2
008
25/0
4/2
008
27/0
4/2
008
29/0
4/2
008
Day of the month
Nu
mb
er
of
peo
ple
/day
Total Visitors
Day Visitors
Overnight Visitors
The highest numbers of visitors (approximate) per day recorded entering the Kruger Park during the month of April at the respective gates are summarised in Table 1 below.
YEAR HIGHEST NUMBERS OF VISITOR ENTRIES DURING APRIL
Numbi Phabeni Kruger
2007 1200 1500 1300
2008 900 1200 1100
2009 1200 800 1200
2010 1400 1400 1200
2011 1100 1200 1300
2012 900 1400 1200
Table 1: Highest numbers of visitors through the respective gates in April
Yearly graphs were compiled for 2011 and 2012 reflecting the gate entries at the respective southern gates to the Kruger Park. Copies of these graphs are presented in the Annexure. A set of graphs was also compiled reflecting the sum of the entries for both total vehicles entering the park per day as well as total visitors entering the park per day through the southern gates, (see Annexure).
4.2 Traffic counts The locality map indicating the counting stations extracted from the Traffic Assessment
(1) done for the Marula
Region Strategic Environmental Assessment is presented below.

4 Skukuza
PP20898
The traffic counts done at the relevant counting stations were done from 16 to 22 April 2008 for the “low season” and from 6 to 12 April 2008 for the “high season”. 4.3 Gate entry & traffic count comparison The eastbound vehicle count at Counting Station 4 was compared to the gate entry data of Numbi Gate for the respective days on which the counts were done. The eastbound vehicle count at Counting Station 1 was compared to the gate entry data of Phabeni Gate for the respective days on which the counts were done. The eastbound vehicle count at Counting Station 3 was compared to the gate entry data of Paul Kruger Gate for the respective days on which the counts were done. The results of these comparisons are presented below. Unfortunately only visitor (person) entries were recorded at the gates and not the number of vehicles entering.
NUMBI GATE ENTRIES
0
200
400
600
800
1000
16/04/2
008
17/04/2
008
18/04/2
008
19/04/2
008
20/04/2
008
21/04/2
008
22/04/2
008
Low Season
Nu
mb
er
of
peo
ple
or
veh
icle
s
Total Visitors
Day Visitors
Overnight Visitors
ST 4 Vehicles Eastbound

5 Skukuza
PP20898
NUMBI GATE ENTRIES
0100200300400500600700
06/04/2
008
07/04/2
008
08/04/2
008
09/04/2
008
10/04/2
008
11/04/2
008
12/04/2
008
High Season
Nu
mb
er
of
peo
ple
or
veh
icle
s
Total Visitors
Day Visitors
Overnight Visitors
ST 4 Vehicles Eastbound
PHABENI GATE ENTRIES
0100200300400500600700800
16/0
4/200
8
17/0
4/200
8
18/0
4/200
8
19/0
4/200
8
20/0
4/200
8
21/0
4/200
8
22/0
4/200
8
Low Season
Nu
mb
er o
f p
eop
le o
r
veh
icle
s Total Visitors
Day Visitors
Overnight Visitors
ST 1 Vehicles
Eastbound
PHABENI GATE ENTRIES
0
200
400
600
800
1000
06/0
4/200
8
07/0
4/200
8
08/0
4/200
8
09/0
4/200
8
10/0
4/200
8
11/0
4/200
8
12/0
4/200
8
High Season
Nu
mb
er o
f p
eop
le o
r
veh
icle
s Total Visitors
Day Visitors
Overnight Visitors
ST 1 Vehicles
Eastbound

6 Skukuza
PP20898
KRUGER GATE ENTRIES
0
100
200
300
400
500
16/0
4/200
8
17/0
4/200
8
18/0
4/200
8
19/0
4/200
8
20/0
4/200
8
21/0
4/200
8
22/0
4/200
8
Low Season
Nu
mb
er o
f p
eop
le o
r
veh
icle
s Total Visitors
Day Visitors
Overnight Visitors
ST 3 Vehicles
Eastbound
KRUGER GATE ENTRIES
0100200300400500600700
06/0
4/200
8
07/0
4/200
8
08/0
4/200
8
09/0
4/200
8
10/0
4/200
8
11/0
4/200
8
12/0
4/200
8
High Season
Nu
mb
er o
f p
eop
le o
r
veh
icle
s Total Visitors
Day Visitors
Overnight Visitors
ST 3 Vehicles
Eastbound
4.4 Vehicle occupancy data As part of the Traffic Assessment
(1) done for the Marula Region Strategic Environmental Assessment,
interviews were also conducted at four of the southern gates and four of the southern camps. As part of these interviews the number of vehicles together with the number of passengers per vehicle were recorded. Table 2 below presents the results.

7 Skukuza
PP20898
Location Season DirectionNumber of
vehicles
Number of
passengersOccupancy
Inbound 152 500 3.29
Outbound 238 631 2.65
Inbound 231 700 3.03
Outbound 149 562 3.77
Inbound 180 466 2.59
Outbound 227 653 2.88
Inbound 110 195 1.77
Outbound 65 99 1.52
Inbound 117 314 2.68
Outbound 66 205 3.11
Inbound 95 360 3.79
Outbound 107 446 4.17
Inbound 140 416 2.97
Outbound 170 508 2.99
Inbound 275 941 3.42
Outbound 243 776 3.19
Inbound 175 429 2.45
Outbound 207 624 3.01
Inbound 142 277 1.95
Outbound 91 124 1.36
Inbound 136 341 2.51
Outbound 79 225 2.85
Inbound 122 396 3.25
Outbound 120 374 3.12
Inbound 117 340 2.91
Outbound 132 324 2.45
Inbound 112 327 2.92
Outbound 122 402 3.30
Inbound 175 517 2.95
Outbound 250 808 3.23
Inbound 265 853 3.22
Outbound 213 561 2.63
Crocodile Bridge Gate
Malelane Gate
Numbi Gate
Kruger Gate
Lower Sabie Camp
Berg & Dal Camp
Pretoriuskop Camp
Skukuza Camp
Low
High
Low
High
Low
High
Low
High
Low
High
Low
High
Low
High
Low
High
Table 2: Average vehicle occupancy figures from interview data The Kruger Park started recording the number of vehicles entering through the various gates together with the number of visitors in 2011. The actual vehicle occupancy recorded for April 2011 and April 2012 is depicted in the graph below.
VEHICLE OCCUPANCY (2011 & 2012)
0.00
1.00
2.00
3.00
4.00
5.00
6.00
1 Apr
il
3 Apr
il
5 Apr
il
7 Apr
il
9 Apr
il
11 A
pril
13 A
pril
15 A
pril
17 A
pril
19 A
pril
21 A
pril
23 A
pril
25 A
pril
27 A
pril
29 A
pril
Day of the month
Nu
mb
er
of
pe
rso
ns
/ve
hic
le
Numbi 2011
Phabeni 2011
Kruger 2011
Numbi 2012
Phabeni 2012
Kruger 2012

8 Skukuza
PP20898
There were no data for 22 to 24 April 2012 for Phabeni Gate. The average vehicle occupancies recorded at the respective gates during April are presented in Table 3 below.
AVERAGE VEHICLE OCCUPANCY RECORDED (Persons/Vehicle)
YEAR NUMBI GATE PHABENI GATE PAUL KRUGER GATE
2011 3,65 3,24 2,86
2012 3,65 3,17 2,96
Table 3: Average vehicle occupancy figures recorded in April The average vehicle occupancies recorded at the respective gates for the full year are presented in Table 4 below.
AVERAGE VEHICLE OCCUPANCY RECORDED (Persons/Vehicle)
YEAR NUMBI GATE PHABENI GATE PAUL KRUGER GATE
2011 3,71 3,25 2,94
2012 3,84 3,40 2,93
Table 4: Average vehicle occupancy figures recorded in 2011 and 2012 4.5 Calibration A comparison between gate entry data (vehicles calculated from visitor [person] entries converted into vehicles by applying average vehicle occupancy figures) and the actual vehicle counts at the respective counting stations is depicted in the graphs below.
NUMBI GATE ENTRIES AND STATION 4 COUNT (APRIL 2008)
0
100
200
300
400
500
06/04/2
008
07/04/2
008
08/04/2
008
09/04/2
008
10/04/2
008
11/04/2
008
12/04/2
008
13/04/2
008
14/04/2
008
15/04/2
008
16/04/2
008
17/04/2
008
18/04/2
008
19/04/2
008
20/04/2
008
21/04/2
008
22/04/2
008
Day of the month
Nu
mb
er
of
veh
icle
s/d
ay
Vehicles through Gate
ST 4 Vehicles Eastbound
ST 4 Vehicles Westbound
ST 4 12-hour Count
PHABENI GATE ENTRIES AND STATION 1 COUNT (APRIL 2008)
0
100
200
300
400
500
06/04/2
008
07/04/2
008
08/04/2
008
09/04/2
008
10/04/2
008
11/04/2
008
12/04/2
008
13/04/2
008
14/04/2
008
15/04/2
008
16/04/2
008
17/04/2
008
18/04/2
008
19/04/2
008
20/04/2
008
21/04/2
008
22/04/2
008
Day of the month
Nu
mb
er
of
veh
icle
s/d
ay
Vehicles through Gate
ST 1 Vehicles Eastbound
ST 1 Vehicles Westbound
ST 1 12-hour Count

9 Skukuza
PP20898
KRUGER GATE ENTRIES AND STATION 3 COUNT (APRIL 2008)
0200400600800
10001200
06/04/2
008
07/04/2
008
08/04/2
008
09/04/2
008
10/04/2
008
11/04/2
008
12/04/2
008
13/04/2
008
14/04/2
008
15/04/2
008
16/04/2
008
17/04/2
008
18/04/2
008
19/04/2
008
20/04/2
008
21/04/2
008
22/04/2
008
Day of the month
Nu
mb
er
of
veh
icle
s/d
ay
Vehicles through Gate
ST 3 Vehicles Eastbound
ST 3 Vehicles Westbound
ST 3 12-hour Count
From the above it is clear that the gate entry data will give a good reflection of the actual number of vehicles on the respective roads (12-hour volumes) provided they are calibrated. The actual count at Counting Station 3 is substantially higher than the gate entries recorded, which is probably due to the many staff and delivery vehicles using this road (Paul Kruger Gate to Skukuza). The results of the calibration done for each gate are presented in the graphs below.
CALIBRATION CORRELATION NUMBI
0100200300400500600
06/0
4/2
008
08/0
4/2
008
10/0
4/2
008
12/0
4/2
008
14/0
4/2
008
16/0
4/2
008
18/0
4/2
008
20/0
4/2
008
22/0
4/2
008
Day of the month
Nu
mb
er
of
veh
icle
s/1
2
ho
urs
Vehicle calibrated 2-
way count at Gate
ST 4 12-hour count
CALIBRATION CORRELATION PHABENI
0
100
200
300
400
500
06/0
4/2
008
08/0
4/2
008
10/0
4/2
008
12/0
4/2
008
14/0
4/2
008
16/0
4/2
008
18/0
4/2
008
20/0
4/2
008
22/0
4/2
008
Day of the month
Nu
mb
er
of
veh
icle
s/1
2
ho
urs
Vehicle calibrated 2-
way count at Gate
ST 4 12-hour count
10 Skukuza
PP20898
CALIBRATION CORRELATION KRUGER
0200400600800
10001200
06/0
4/2
008
08/0
4/2
008
10/0
4/2
008
12/0
4/2
008
14/0
4/2
008
16/0
4/2
008
18/0
4/2
008
20/0
4/2
008
22/0
4/2
008
Day of the month
Nu
mb
er
of
veh
icle
s/1
2
ho
urs
Vehicle calibrated 2-
way count at Gate
ST 4 12-hour count
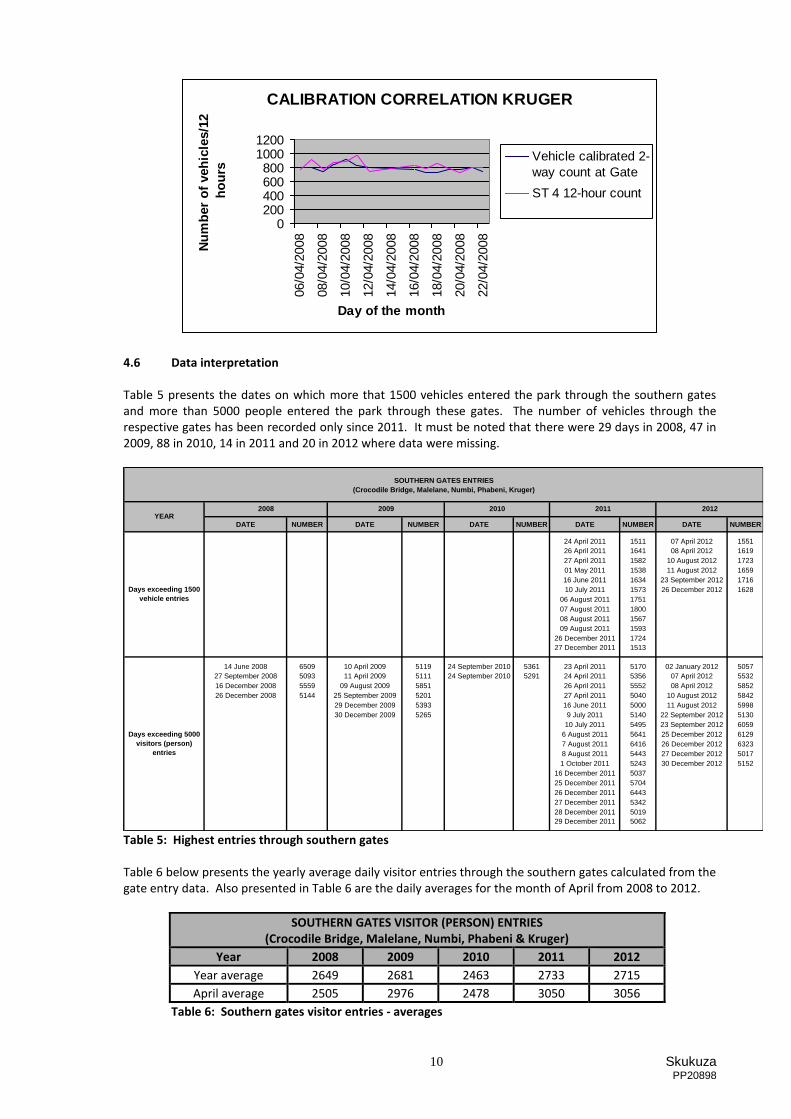
4.6 Data interpretation Table 5 presents the dates on which more that 1500 vehicles entered the park through the southern gates and more than 5000 people entered the park through these gates. The number of vehicles through the respective gates has been recorded only since 2011. It must be noted that there were 29 days in 2008, 47 in 2009, 88 in 2010, 14 in 2011 and 20 in 2012 where data were missing.
DATE NUMBER DATE NUMBER DATE NUMBER DATE NUMBER DATE NUMBER
24 April 2011 1511 07 April 2012 1551
26 April 2011 1641 08 April 2012 1619
27 April 2011 1582 10 August 2012 1723
01 May 2011 1538 11 August 2012 1659
16 June 2011 1634 23 September 2012 1716
10 July 2011 1573 26 December 2012 1628
06 August 2011 1751
07 August 2011 1800
08 August 2011 1567
09 August 2011 1593
26 December 2011 1724
27 December 2011 1513
14 June 2008 6509 10 April 2009 5119 24 September 2010 5361 23 April 2011 5170 02 January 2012 5057
27 September 2008 5093 11 April 2009 5111 24 September 2010 5291 24 April 2011 5356 07 April 2012 5532
16 December 2008 5559 09 August 2009 5851 26 April 2011 5552 08 April 2012 5852
26 December 2008 5144 25 September 2009 5201 27 April 2011 5040 10 August 2012 5842
29 December 2009 5393 16 June 2011 5000 11 August 2012 5998
30 December 2009 5265 9 July 2011 5140 22 September 2012 5130
10 July 2011 5495 23 September 2012 6059
6 August 2011 5641 25 December 2012 6129
7 August 2011 6416 26 December 2012 6323
8 August 2011 5443 27 December 2012 5017
1 October 2011 5243 30 December 2012 5152
16 December 2011 5037
25 December 2011 5704
26 December 2011 6443
27 December 2011 5342
28 December 2011 5019
29 December 2011 5062
2010 2011 2012
SOUTHERN GATES ENTRIES
(Crocodile Bridge, Malelane, Numbi, Phabeni, Kruger)
Days exceeding 1500
vehicle entries
Days exceeding 5000
visitors (person)
entries
2008 2009YEAR
Table 5: Highest entries through southern gates Table 6 below presents the yearly average daily visitor entries through the southern gates calculated from the gate entry data. Also presented in Table 6 are the daily averages for the month of April from 2008 to 2012.
SOUTHERN GATES VISITOR (PERSON) ENTRIES (Crocodile Bridge, Malelane, Numbi, Phabeni & Kruger)
Year 2008 2009 2010 2011 2012
Year average 2649 2681 2463 2733 2715
April average 2505 2976 2478 3050 3056
Table 6: Southern gates visitor entries - averages
11 Skukuza
PP20898
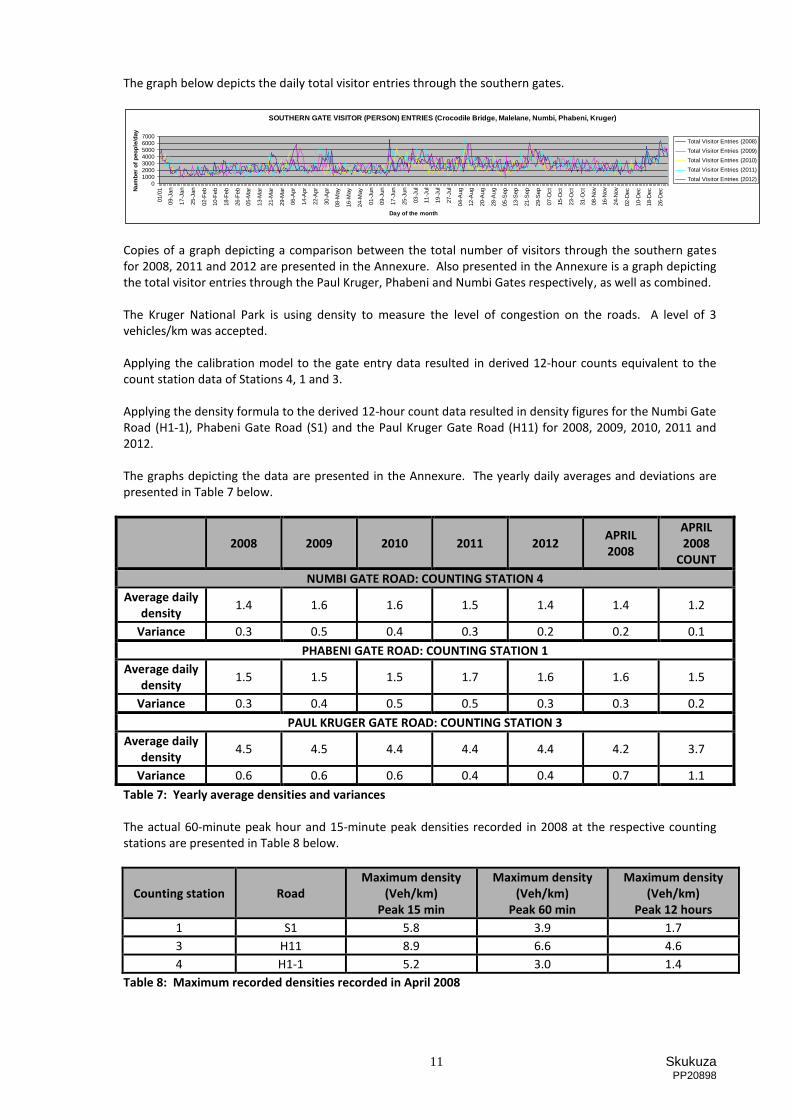
The graph below depicts the daily total visitor entries through the southern gates.
SOUTHERN GATE VISITOR (PERSON) ENTRIES (Crocodile Bridge, Malelane, Numbi, Phabeni, Kruger)
01000200030004000500060007000
01/0
1
09-J
an
17-J
an
25-J
an
02-F
eb
10-F
eb
18-F
eb
26-F
eb
05-M
ar
13-M
ar
21-M
ar
29-M
ar
06-A
pr
14-A
pr
22-A
pr
30-A
pr
08-M
ay
16-M
ay
24-M
ay
01-J
un
09-J
un
17-J
un
25-J
un
03-J
ul
11-J
ul
19-J
ul
27-J
ul
04-A
ug
12-A
ug
20-A
ug
28-A
ug
05-S
ep
13-S
ep
21-S
ep
29-S
ep
07-O
ct
15-O
ct
23-O
ct
31-O
ct
08-N
ov
16-N
ov
24-N
ov
02-D
ec
10-D
ec
18-D
ec
26-D
ec
Day of the month
Nu
mb
er
of
peo
ple
/day
Total Visitor Entries (2008)
Total Visitor Entries (2009)
Total Visitor Entries (2010)
Total Visitor Entries (2011)
Total Visitor Entries (2012)
Copies of a graph depicting a comparison between the total number of visitors through the southern gates for 2008, 2011 and 2012 are presented in the Annexure. Also presented in the Annexure is a graph depicting the total visitor entries through the Paul Kruger, Phabeni and Numbi Gates respectively, as well as combined. The Kruger National Park is using density to measure the level of congestion on the roads. A level of 3 vehicles/km was accepted. Applying the calibration model to the gate entry data resulted in derived 12-hour counts equivalent to the count station data of Stations 4, 1 and 3. Applying the density formula to the derived 12-hour count data resulted in density figures for the Numbi Gate Road (H1-1), Phabeni Gate Road (S1) and the Paul Kruger Gate Road (H11) for 2008, 2009, 2010, 2011 and 2012. The graphs depicting the data are presented in the Annexure. The yearly daily averages and deviations are presented in Table 7 below.
2008 2009 2010 2011 2012 APRIL 2008
APRIL 2008
COUNT
NUMBI GATE ROAD: COUNTING STATION 4
Average daily density
1.4 1.6 1.6 1.5 1.4 1.4 1.2
Variance 0.3 0.5 0.4 0.3 0.2 0.2 0.1
PHABENI GATE ROAD: COUNTING STATION 1
Average daily density
1.5 1.5 1.5 1.7 1.6 1.6 1.5
Variance 0.3 0.4 0.5 0.5 0.3 0.3 0.2
PAUL KRUGER GATE ROAD: COUNTING STATION 3
Average daily density
4.5 4.5 4.4 4.4 4.4 4.2 3.7
Variance 0.6 0.6 0.6 0.4 0.4 0.7 1.1
Table 7: Yearly average densities and variances The actual 60-minute peak hour and 15-minute peak densities recorded in 2008 at the respective counting stations are presented in Table 8 below.
Counting station Road Maximum density
(Veh/km) Peak 15 min
Maximum density (Veh/km)
Peak 60 min
Maximum density (Veh/km)
Peak 12 hours
1 S1 5.8 3.9 1.7
3 H11 8.9 6.6 4.6
4 H1-1 5.2 3.0 1.4
Table 8: Maximum recorded densities recorded in April 2008

12 Skukuza
PP20898
It must be noted that the density on the section of road just before entering Skukuza where the Paul Kruger Gate entries and the Phabeni Gate entries merge, will be higher. We expect the daily year average to be at least 6 vehicles/km. This is based on the sum of the separate volumes.
4.7 Peak hour data Per hour visitor entry data for 2012 were obtained for the southern gates. The data for the peak traffic days (see Table 5) were extracted to get an understanding on the expected peak arrival patterns at the various southern gates in terms of overnight visitors and day visitors. Graphs reflecting the entries per hour at the respective southern gates were compiled and are presented below.

13 Skukuza
PP20898

14 Skukuza
PP20898

15 Skukuza
PP20898
From these graphs it is clear that the Day Visitor entries through the gates show a distinct early morning peak hour. The entry of Overnight Visitors does not have a distinct early morning peak hour pattern and occurred in a more spread-out manner.
5. TRIP GENERATION The SA Trip Data Manual recommends a peak hour trip generation rate of 0,3 to 0,5 trips per room with splits of 60:40, 50:50 and 55:45 for hotels. This cannot be applied for the proposed Safari Lodge with a sleeping capacity of 272 people. Although the main purpose of the proposed Safari Lodge is to cater for conference delegates, it will probably also be utilised for normal Kruger Park visitors. Staff trips will at most be 2 busses in and 2 busses out per day. The use of the Safari Lodge to provide accommodation for conference delicates will in fact contribute to a reduction in traffic on the road network. At this stage some conference delegates stay outside the Kruger Park because of the lack of appropriate accommodation inside Skukuza, adding additional trips to the road network. At this stage conference delegates staying in Skukuza Camp, in most instances stay some distance from the conference facility. They travel from their accommodation to the venue. This results in the doubling of parking spaces to be provided in Skukuza Camp (at the accommodation and at the conference facility). The worst case traffic scenario will be during high peak periods where the Safari Lodge will be used to provide accommodation to visitors. The following assumptions are made: Average stay of 2 nights per room 1 trip (vehicle) per two beds An average stay of 2 nights in the Safari Lodge will result in an expected trip generation of 128 trips per day on one of the roads between the 3 respective gates serving the Kruger National Park and Skukuza Camp. The provision of additional accommodation in Skukuza Camp will also contribute to a slight increase in traffic on the roads surrounding the camp. This will be more so over peak times when the Safari Lodge will be used to provide additional accommodation in the Kruger Park. During normal operating times the Safari Lodge will tend to lower the number of vehicles currently on the roads, because conference delegates will not need to travel in and out of the park while attending a conference. We expect Safari Lodge guests to also make use of the airfield which the Kruger Park is planning to re-open. These guests will then use the OSV’s for game watching. We would also expect Safari Lodge guests to use buses. The Safari Lodge will be able to cater for international guests/tour groups. We therefore expect the traffic impact for game viewing on the popular game viewing routes around the Skukuza Camp to be limited.
6. TRIP DISTRIBUTION AND BACKGROUND TRAFFIC GROWTH The expected Safari Lodge guests can use any entrance gate to Skukuza Camp. The most likely/popular gates to be used will be Paul Kruger Gate, Numbi Gate and Phabeni Gate. In order to test the effect of the proposed Safari Lodge on the respective existing road densities, the following scenarios were tested: Scenario 1: All the Safari Lodge guests use the Numbi Gate Scenario 2: All the Safari Lodge guests use the Phabeni Gate Scenario 3: All the Safari Lodge guests use the Paul Kruger Gate Scenario 4: The Safari Lodge guests use all three of the above mentioned gates in equal numbers

16 Skukuza
PP20898
No background traffic growth needs to be applied because the Kruger Park limits the number of visitors to the park and no natural growth in numbers is allowed. Historic data also show no annual growth. The 2012 gate entry data are used as a basis to measure the impact of the proposed increase in vehicles on the road network.
7. ANALYSIS 7.1 Average daily densities The 2012 gate entry data are used as a basis to measure the impact of the proposed increase in vehicles on the road network. The 2012 densities on the respective access roads together with the expected road densities for the different scenarios are depicted in the graphs below.
NUMBI GATE ROAD DENSITIES
0.00
0.50
1.00
1.50
2.00
2.50
3.00
3.50
4.00
03/11/2011 23/12/2011 11/02/2012 01/04/2012 21/05/2012 10/07/2012 29/08/2012 18/10/2012 07/12/2012 26/01/2013
Day of the year
De
ns
ity
(v
eh
icle
s/k
m)
2012 Densities
Scenario 1 Densities
Scenario 4 Densities
PHABENI GATE ROAD DENSITIES
0.00
0.50
1.00
1.50
2.00
2.50
3.00
3.50
4.00
03/11/2011 23/12/2011 11/02/2012 01/04/2012 21/05/2012 10/07/2012 29/08/2012 18/10/2012 07/12/2012 26/01/2013
Day of the year
De
ns
ity
(v
eh
icle
s/k
m)
2012 Densities
Scenario 2 Densities
Scenario 4 Densities
KRUGER GATE ROAD DENSITIES
0.00
1.00
2.00
3.00
4.00
5.00
6.00
7.00
8.00
03/11/2011 23/12/2011 11/02/2012 01/04/2012 21/05/2012 10/07/2012 29/08/2012 18/10/2012 07/12/2012 26/01/2013
Day of the year
De
ns
ity
(v
eh
icle
s/k
m)
2012 Densities
Scenario 3 Densities
Scenario 4 Densities
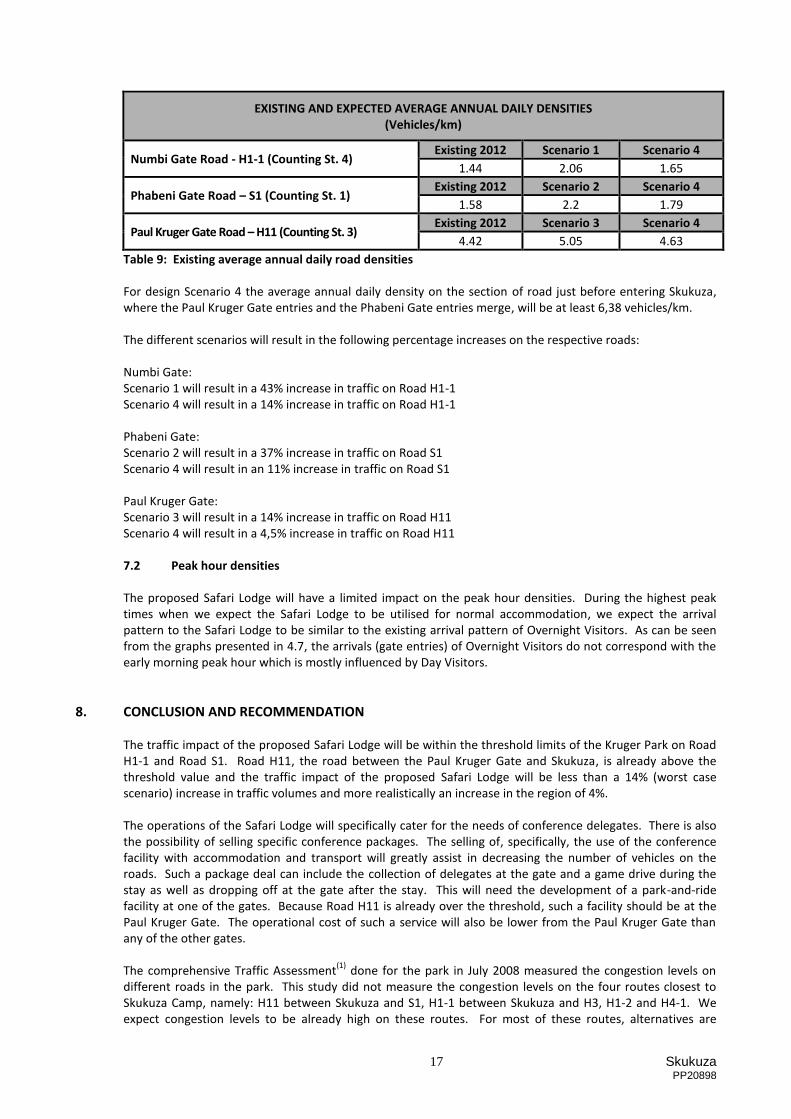
The respective average annual daily densities are presented in Table 9 below.
17 Skukuza
PP20898
EXISTING AND EXPECTED AVERAGE ANNUAL DAILY DENSITIES (Vehicles/km)
Numbi Gate Road - H1-1 (Counting St. 4) Existing 2012 Scenario 1 Scenario 4
1.44 2.06 1.65
Phabeni Gate Road – S1 (Counting St. 1) Existing 2012 Scenario 2 Scenario 4
1.58 2.2 1.79
Paul Kruger Gate Road – H11 (Counting St. 3) Existing 2012 Scenario 3 Scenario 4
4.42 5.05 4.63
Table 9: Existing average annual daily road densities For design Scenario 4 the average annual daily density on the section of road just before entering Skukuza, where the Paul Kruger Gate entries and the Phabeni Gate entries merge, will be at least 6,38 vehicles/km. The different scenarios will result in the following percentage increases on the respective roads: Numbi Gate: Scenario 1 will result in a 43% increase in traffic on Road H1-1 Scenario 4 will result in a 14% increase in traffic on Road H1-1 Phabeni Gate: Scenario 2 will result in a 37% increase in traffic on Road S1 Scenario 4 will result in an 11% increase in traffic on Road S1 Paul Kruger Gate: Scenario 3 will result in a 14% increase in traffic on Road H11 Scenario 4 will result in a 4,5% increase in traffic on Road H11 7.2 Peak hour densities The proposed Safari Lodge will have a limited impact on the peak hour densities. During the highest peak times when we expect the Safari Lodge to be utilised for normal accommodation, we expect the arrival pattern to the Safari Lodge to be similar to the existing arrival pattern of Overnight Visitors. As can be seen from the graphs presented in 4.7, the arrivals (gate entries) of Overnight Visitors do not correspond with the early morning peak hour which is mostly influenced by Day Visitors.
8. CONCLUSION AND RECOMMENDATION The traffic impact of the proposed Safari Lodge will be within the threshold limits of the Kruger Park on Road H1-1 and Road S1. Road H11, the road between the Paul Kruger Gate and Skukuza, is already above the threshold value and the traffic impact of the proposed Safari Lodge will be less than a 14% (worst case scenario) increase in traffic volumes and more realistically an increase in the region of 4%.
The operations of the Safari Lodge will specifically cater for the needs of conference delegates. There is also the possibility of selling specific conference packages. The selling of, specifically, the use of the conference facility with accommodation and transport will greatly assist in decreasing the number of vehicles on the roads. Such a package deal can include the collection of delegates at the gate and a game drive during the stay as well as dropping off at the gate after the stay. This will need the development of a park-and-ride facility at one of the gates. Because Road H11 is already over the threshold, such a facility should be at the Paul Kruger Gate. The operational cost of such a service will also be lower from the Paul Kruger Gate than any of the other gates. The comprehensive Traffic Assessment
(1) done for the park in July 2008 measured the congestion levels on
different roads in the park. This study did not measure the congestion levels on the four routes closest to Skukuza Camp, namely: H11 between Skukuza and S1, H1-1 between Skukuza and H3, H1-2 and H4-1. We expect congestion levels to be already high on these routes. For most of these routes, alternatives are

18 Skukuza
PP20898
available. The provision of an alternative route for Road H11 between Skukuza and Road S1 will assist in lowering congestion levels on this section and should be considered by the park authorities. The conference facility is already operational and because of the lack of sufficient accommodation within close proximity (walking distance), parking at the conference facility is a problem. Conference delegates currently travel from within the Skukuza Camp to the conference facility. This means the provision of double parking spaces; a parking space at the accommodation and a parking space at the conference facility. The location of the Safari Lodge next to the conference facility will assist with this. The Safari Lodge will not contribute significantly to current congestion levels on the roads in the park and can be supported from a traffic point of view. We recognise the fact that current congestion levels on roads close to Skukuza Camp are already higher than the threshold value of 3 vehicles/km. The following interventions should be considered to lower congestion levels on roads close to Skukuza Camp:
Park-and-ride facility at Paul Kruger Gate. Reducing the number of Day Visitors at Paul Kruger Gate. The provision of an alternative route for Road H11 between Skukuza and Road S1. The selling of package deals for the conference facility with accommodation and transport.
9. REFERENCES
(1) Trafftrans (Pty Ltd, Marula Region Strategic Environmental Assessment Kruger National Park, July 2008. (2) Endecon Ubuntu (Pty) Ltd Engineering Consultants, Traffic Impact Assessment Proposed Conference
Facility at Skukuza Rest Camp, May 2008.

ANNEXURE


ALL DRAWINGS AND DIMENSIONS MUST BE CORRELATEDBEFORE ANY MATERIALS ARE ORDERED OR BUILDING
WORK COMMENCES. ANY DIFFERENCES MUST BE BROUGHTTO THE ATTENTION OF THE ARCHITECT IMMEDIATELY.
COPYRIGHT IS RESERVED ON ALL DRAWINGS AND DESIGNS.
CONSTRUCTION DRAWINGS APPROVED:
______________________________________
Tom Hattingh Architects
______________________________________
H.O.D. – Technical services
______________________________________
Senior Manager – Civil and Building
______________________________________
Senior Manager – Electro Mechanical
SANPARKS KNP APPROVALREVISIONS:
TE
L:
013
-7528
239
FA
X:
0866
7166
06
EM
AIL
:
tom
arc
h@
iafr
ica.c
om
PO
Box
1914
6 N
ELS
PR
UIT
12
00
3
C
OM
BR
INK
A
VE
NU
E
0G�
fire stair
1
2
3
4
GR
OU
PV
EN
DIN
G
VE
ND
ING
fire
MA
KE
RO
AD
700
0mm
BOABAB
BOABAB
VE
ND
ING
ROCKY OUTCROP
VENDING
54 TABLES
ramp up
25x5 LAP POOL - 3 Lane
FAMILYFAMILYFAMILYFAMILYFAMILYFAMILYFAMILYFAMILYFAMILYFAMILY
HOUSEKEEPER
HOUSEKEEPER
EXISTING ROAD
EXISTING ROAD
EXISTING ROAD
EX
ISTIN
G R
OA
D
EX
ISTI
NG
RO
AD
EXISTING ROAD
EX
IST
ING
RO
AD
EXISTING ROAD
EXISTING ROAD
CONFERENCEPARKING AREA
CONFERENCEPARKING AREA
EXISTING ROAD
GYM
LADIES
GENTS
OF
FIC
E/S
TO
RE
Co
vere
d P
atio
UNIVERSALPARKING3 BAYS
3 BAYSUNIVERSAL
PARKING
UNIVERSALUNIVERSALUNIVERSALUNIVERSALUNIVERSALUNIVERSAL UNIVERSAL UNIVERSAL
UNIVERSAL UNIVERSALUNIVERSALSTDSTD
STDSTDSTDUNIVERSALUNIVERSAL UNIVERSAL
auto
sliderauto
slid
er
cant
i-sla
b
canti-slab above
auto
slid
er
auto
slider
ramp up
ramp up
ramp up
ICE
VE
ND
ING
?
PAVED OPEN ATRIUM
RETAINING WALL
RETAINING WALL
RE
TA
ININ
G W
ALL
RA
MP
UP
RA
MP
UP
fire
fire
fire
fire
fire
fire
fire
fire
fire
fire
fire
fire
6 66
6 6
6 66
Staff Canteen
Gents Changerm
50 lockers
bench
wc
wc
show
ers
show
ers
CONCRETE PAVERS
GAS FARM
COLD RM
FR
EE
ZE
R
COVERED DELIVERY PLATFORM / WALKWAY
store below stair
Ladies Changerm
50 lockers
bench
MECHANIVAL VENT
MECHANIVAL VENT
MECHANICALVENT
MECHANICALVENT
MECHANIVAL VENT
LAUNDRY
MECHANICALVENT
MECHANICAL VENT
BACK-OF-HOUSE418sqm
RA
MP
UP
RA
MP
UP
LUGGAGE RAMP UP
RA
MP
UP
RA
MP
UP
RAMP UP
RA
MP
UP
RAMP UP
RAMP UP
RA
MP
UP
VISUAL SCREEN VISUAL SCREEN
RAMP UP
RAMP U
P
STAIR UP
ST
AIR
UP
VE
ND
ING
fire
up
up
up
upup
up
up
up
up
up
up
up
up
up
upupup
up
up
up
up
RAMP UP
FIR
EE
SC
AP
E
up
RAMP UPup
VISUAL SCREENVISUAL SCREEN
BU
ILD N
EW
RA
MP
UP
BU
ILD N
EW
RA
MP
UP
slabover
slab over
VISUAL SCREENVISUAL SCREEN
RA
MP
UP
RA
MP
UP
VISUAL SCREEN
STAIRS
Landscaping
STAIRS
ST
AIR
S
STAIRS
FIRE STAIR
FIRE STAIR
FIRE STAIR
Landscaping Landscaping
Landscaping
PAVED WALKWAY PAVED WALKWAY PAVED WALKWAY - TO CONFERENCE CENTRE
NEW PAVED WALKWAY
PA
VE
D W
AL
KW
AY
- TO
CO
NF
ER
EN
CE
CE
NT
RE
PA
VE
D W
ALK
WA
Y -
TO
CO
NF
ER
EN
CE
CE
NT
RE
PEDESTRIAN
CROSSING TO
CONFERENCE
CENTRE
SO
RT
ING
WASH
IRON
ISS
UE
RE
CE
IVE
OFFICEstore
store
DRY
folding
fold
ing
folding
LINNEN STORE
CO
VE
RE
D W
ALK
WA
Y
CO
VE
RE
DW
AL
KW
AY
STOREBeer+Minerals
ST
OR
Ew
ine+
spir
itsOFFICEF+B
COVERED WALKWAY
Tech.Workshop
Tech. Store
OFFICE
AIR
CO
N
AIRCON
AIRCON
WET WASTEAIRCON
AIRCON
AIR
CO
N
AIRCON
AIRCON
AIRCON
AIRCON
AIRCON
AIRCON
HouseKeeping
HouseKeeping
VE
ND
ING
SERVICE SHAFTVENDING
Gen Admin
stationstrongroom
TVsecurity
1
2 1
Rooms DivManager
GM Office
Sales
switchb.
Reserv.
1Finance
F&BManager
F&
B O
ffice
1
2
TeaL G
store below stair
store belo
w stair
store below stair
store
below
stair
sewerduct
COVERED WALKWAYCOVERED WALKWAY
COVERED WALKWAY COVERED WALKWAY COVERED WALKWAY
COVERED WALKWAY
COVERED WALKWAY
CO
VE
RE
D W
AL
KW
AY
CO
VE
RE
D W
AL
KW
AY
COVERED WALKWAY
HouseKeeping
House Keeping
COVERED WALKWAY
spaceoffice
spaceoffice
GAME DRIVE GAME DRIVE
Game DrivePick Up Area
GA
ME
DR
IVE
project:
• SKUKUZA SAFARI LODGE •
date:
drawn:
scale:
checked:
job no:
dwg no:
rev no:
JAN 2014
TH
1:300
T.H.
000
S01-Rev9.GEN
009 (01-11-2014)
REMOVE THESE 3 BUNGALOWSCREATE NEW ROAD CIRCULATION
AND DROP-OFF / PICK-UP ZONEFOR GAME DRIVE VEHICLES
REMOVE THESE 2 BUNGALOWSNOISE FACTOR AT MAIN ENTRANCE
TOO CLOSE PROXIMITY TO ROAD
6 UNIVERSAL + 10 STD ROOMSDouble Storey
X-292 000
12 STD ROOMSDouble Storey
X-294 000
12 X STD ROOMSDouble Storey
X-295 000
4 SUITESDouble Storey
X-293 000
22 STD ROOMSDouble Storey
X-293 650
8 UNIVERSAL ROOMS14 STD ROOMS - Linked
Double StoreyX-290 650
20 FAMILY ROOMSDouble Storey
X-290 150
PORTE COCHEREX-290 700
Servery Area
DININGR
EC
EP
TIO
N
LADIES
GENTS
CO
NC
IER
GE
VA
LET
ENTRANCE
FUNCTIONPATIO
LOUNGE
16 STD ROOMSDouble Story
X-293 150
BUFFET
CO
CK
TA
IL BA
R
BAR
BOARDROOM
2
OPEN ATRIUMLANDSCAPED
292 300
UniversalWC
wcclean
LUGGAGESTORE
291 000
RAMP UP
RAMP UP
RA
MP
UP
292 530
292
000
293 000
292 500
291 000
291
000
291 500
290
500
290
50
0
290 000
292 530
293
50
0
293 500
293 500
293 000
293
000
292 450
292
350
LANDSCAPED EMBANKMENT - ENVIROWALL
291 800
292 530
292 530
292 000
292 000
293
000
293 000
294
000 4 SUITES
Double StoreyX-294 000
LANDSCAPINGFEATURE
LANDSCAPINGFEATURE
trolley parkingtrolley parking
trolley parking
293 500
295 000
LANDSCAPED EMBANKMENT - ENVIROWALL
292 000
292 000
292 000
LEVEL LANDSCAPING 290 300
291 800
293 000
292 200
293 500
LANDSCAPED EMBANKMENT - ENVIROWALL
293 300
LANDSCAPE
LANDSCAPED EMBANKMENT - ENVIROWALL
294 000
295 000
294 000
293 000
293 0
00
293 000
293 000
292 000
293 6
80
292 8
40
294 000
293 000
291 800
292 300
294 000
292 300
292
300
292
300
PA
VIN
GP
AV
ING
S��
291 800
COVERED LOUNGE PATIO
COVERED LOUNGE PATIO
LUGGAGESTORE
AC
TIV
E
INTERNET
BOARDROOM
1
acousticalstack divider292 530 292 530
292 530
292 5
30
292 450
292 350
292 350292 450
292 450
291 300
292 450
292 450
292
20
0
Se
rvic
eB
ar
covered walkway
covered walkway
ice +glasswash
servicebar
glas
s sl
ider
gla
ss s
lider
hot pass
cold
pa
ss
DISHWASH
COOKING AREA
COOKING AREA
POTWASH
dirt
ies
dro
p cold starter
cold prep
general prep
EquipmentStore
Chef Office
trollies
Reception
Personel
Payroll
Db
window
win
dow
BA
KE
RY
VacantStore?
Staff entrancesecurity?
Ladies
Gents
293
000
LEVEL LANDSCAPING
LEVEL LANDSCAPING
LEVEL LANDSCAPING
LEVEL LANDSCAPING LEVEL LANDSCAPING
LEVEL LANDSCAPING
LEVEL LANDSCAPING
LEVEL LANDSCAPING
LEVEL LANDSCAPING
LANDSCAPED EMBANKMENT - ENVIROWALL
LEVEL LANDSCAPING
LEVEL LANDSCAPING
292 000
291 000
290 900
291
50
0
291 500
290 000
LEVEL LANDSCAPING
LEVEL LANDSCAPING
293 000
292 000
291 800
291 800
292 000
290
900
KITCHEN
LANDSCAPED EMBANKMENT - ENVIROWALL
LANDSCAPED EMBANKMENT - ENVIROWALL
LEVEL LANDSCAPING
LEVEL LANDSCAPING
BU
ILD
ING
= 1
64 s
qm
under
roof
291 500
290 900
LEVEL LANDSCAPING
292 450
292 200
292 450
292 200
292 500
295 000
293 000
294 000
294 000 294 000
292 500
292 500
292 500 292 500
291 000
SpareOffice
292 530
294 000
292 500
292
50
0
292 300
TRAININGROOM
Bake
ryS
tore
Cleaner's roomsluice room
Equipment Store
BU
LKF
RE
EZ
ER
REFRIDGERATION PLANT
Glass Washwaste bins
SecurityOffice?
DRYSTORE
shop
front
292 530
general prep
canopy over
passage
passa
ge
whb
whb
292 200
292 500
295 000
4100x2600
5700x3000
6600x4000
1200mm CLEARVUE TYPE FENCE - Access control1200mm CLEARVUE TYPE FENCE - Access control
1200mm CLEARVUE TYPE FENCE - Access control
NEW SCREEN: VISUAL BARRIER
NEW SCREEN BARRIER
NEW SCREEN: VISUAL BARRIER
NEW LATH SCREEN BARRIER - 1800mm high
NE
W L
AT
H S
CR
EE
N B
AR
RIE
R -
180
0mm
hig
h
NE
W LA
TH
SC
RE
EN
BA
RR
IER
FE
NC
E
LAT
H S
CR
EE
N B
AR
RIE
R
EXISTINGBUNGALOW
EXISTINGBUNGALOW
EXISTINGBUNGALOW
EXISTINGBUNGALOW
EXISTINGBUNGALOW
EXISTINGBUNGALOW
EXISTINGBUNGALOW
COACH PARKING
NEW SCREEN: VISUAL BARRIER
NEW SCREEN: VISUAL BARRIER
NEW SCREEN: VISUAL BARRIER
PARKING - 14 CARS
DELIVERIESENTRY
PARKING - 100 CARS
DELIVERIESEXIT
EXISTINGBUILDING
DEMOLISH EXISTING BUILDINGCREATE STAFF PARKING AREA
24 CARPORTS
RELOCATE GYMCONVERT EXISTING
BUILDING INTONEW WORKSHOP
EXISTINGBUILDING
Existing Building
UP
GR
AD
E
EX
IST
ING
RO
AD
CONFERENCE CENTRE
RECEIVING + SERVICE YARD
RETAIN LOWER LEVEL YARD WITH NEW RETAINING WALL
REFUSE / EMPTIES / ETC
UPGRADE ROAD
WASTE SEPERATION BINS
NE
W C
UT
EM
BA
NK
ME
NT
NE
W C
UT
EM
BA
NK
ME
NT
NE
W R
ET
AIN
ING
WA
LL
NE
W R
ET
AIN
ING
WA
LL
NEW RETAINING WALL
paving to falls
pav
ing
to fa
lls
pav
ing
to fa
lls
DE
MO
LIS
H S
EC
TIO
NS
OF
EX
IST
ING
BU
ILD
ING
S T
O
CU
T P
LA
TF
OR
M A
T L
OW
ER
LE
VE
L F
OR
OU
TB
UIL
DIN
G
MAKE GOOD EXISTING BUILDING
RETAIN PARTOF EXISTINGBUILDING?
KE
EP
TH
IS S
EC
TIO
NO
F E
XIS
TIN
G B
UIL
DIN
G
MAKE GOOD EXISTING BUILDING
PROPOSED 128 BEDROOMSAFARI LODGE
SKUKUZAKRUGER NATIONAL PARK
CONCEPT DESIGN GROUND FLOOR
drawing:
• SITE PLAN •CONCEPT DESIGNGROUND FLOOR

FIGURE 1: SITE LOCATION PLAN
SCALE : N/A
TRAFFIC IMPACT ASSESSMENTSKUKUZA LODGE IN
KRUGER NATIONAL PARK
PP20902
The Site
3
1
4
1 2008 Counting Station

National Kruger Park entries through southern park gates:
CROCODILE BRIDGE GATE ENTRIES (2011)
0200400600800
1000120014001600
01/0
1/20
11
08/0
1/20
11
15/0
1/20
11
22/0
1/20
11
29/0
1/20
11
05/0
2/20
11
12/0
2/20
11
19/0
2/20
11
26/0
2/20
11
05/0
3/20
11
12/0
3/20
11
19/0
3/20
11
26/0
3/20
11
02/0
4/20
11
09/0
4/20
11
16/0
4/20
11
23/0
4/20
11
30/0
4/20
11
07/0
5/20
11
14/0
5/20
11
21/0
5/20
11
28/0
5/20
11
04/0
6/20
11
11/0
6/20
11
18/0
6/20
11
25/0
6/20
11
02/0
7/20
11
09/0
7/20
11
16/0
7/20
11
23/0
7/20
11
30/0
7/20
11
06/0
8/20
11
13/0
8/20
11
20/0
8/20
11
27/0
8/20
11
03/0
9/20
11
10/0
9/20
11
17/0
9/20
11
24/0
9/20
11
01/1
0/20
11
08/1
0/20
11
15/1
0/20
11
22/1
0/20
11
29/1
0/20
11
05/1
1/20
11
12/1
1/20
11
19/1
1/20
11
26/1
1/20
11
03/1
2/20
11
10/1
2/20
11
17/1
2/20
11
24/1
2/20
11
31/1
2/20
11
Day of the year
Num
ber
of p
eopl
e or
ve
hicl
es/d
ay VehiclesDay VisitorsOvernight Visitors
CROCODILE BRIDGE ENTRIES (2012)
0200400600800
100012001400160018002000
01/0
1/20
12
08/0
1/20
12
15/0
1/20
12
22/0
1/20
12
29/0
1/20
12
05/0
2/20
12
12/0
2/20
12
19/0
2/20
12
26/0
2/20
12
04/0
3/20
12
11/0
3/20
12
18/0
3/20
12
25/0
3/20
12
01/0
4/20
12
08/0
4/20
12
15/0
4/20
12
22/0
4/20
12
29/0
4/20
12
06/0
5/20
12
13/0
5/20
12
20/0
5/20
12
27/0
5/20
12
03/0
6/20
12
10/0
6/20
12
17/0
6/20
12
24/0
6/20
12
01/0
7/20
12
08/0
7/20
12
15/0
7/20
12
22/0
7/20
12
29/0
7/20
12
05/0
8/20
12
12/0
8/20
12
19/0
8/20
12
26/0
8/20
12
02/0
9/20
12
09/0
9/20
12
16/0
9/20
12
23/0
9/20
12
30/0
9/20
12
07/1
0/20
12
14/1
0/20
12
21/1
0/20
12
28/1
0/20
12
04/1
1/20
12
11/1
1/20
12
18/1
1/20
12
25/1
1/20
12
02/1
2/20
12
09/1
2/20
12
16/1
2/20
12
23/1
2/20
12
30/1
2/20
12
Day of the year
Num
ber
of p
eopl
e or
veh
icel
s/da
y
VehiclesDay VisitorsOvernight Visitors
MALELANE GATE ENTRIES (2011)
0200400600800
10001200
01/0
1/20
11
08/0
1/20
11
15/0
1/20
11
22/0
1/20
11
29/0
1/20
11
05/0
2/20
11
12/0
2/20
11
19/0
2/20
11
26/0
2/20
11
05/0
3/20
11
12/0
3/20
11
19/0
3/20
11
26/0
3/20
11
02/0
4/20
11
09/0
4/20
11
16/0
4/20
11
23/0
4/20
11
30/0
4/20
11
07/0
5/20
11
14/0
5/20
11
21/0
5/20
11
28/0
5/20
11
04/0
6/20
11
11/0
6/20
11
18/0
6/20
11
25/0
6/20
11
02/0
7/20
11
09/0
7/20
11
16/0
7/20
11
23/0
7/20
11
30/0
7/20
11
06/0
8/20
11
13/0
8/20
11
20/0
8/20
11
27/0
8/20
11
03/0
9/20
11
10/0
9/20
11
17/0
9/20
11
24/0
9/20
11
01/1
0/20
11
08/1
0/20
11
15/1
0/20
11
22/1
0/20
11
29/1
0/20
11
05/1
1/20
11
12/1
1/20
11
19/1
1/20
11
26/1
1/20
11
03/1
2/20
11
10/1
2/20
11
17/1
2/20
11
24/1
2/20
11
31/1
2/20
11
Day of the year
Num
ber
of p
eopl
e or
ve
hicl
es/d
ay VehiclesDay VisitorsOvernight Visitors

MALELANE GATE ENTRIES (2012)
0
200
400
600
800
1000
120001
/01/
2012
08/0
1/20
12
15/0
1/20
12
22/0
1/20
12
29/0
1/20
12
05/0
2/20
12
12/0
2/20
12
19/0
2/20
12
26/0
2/20
12
04/0
3/20
12
11/0
3/20
12
18/0
3/20
12
25/0
3/20
12
01/0
4/20
12
08/0
4/20
12
15/0
4/20
12
22/0
4/20
12
29/0
4/20
12
06/0
5/20
12
13/0
5/20
12
20/0
5/20
12
27/0
5/20
12
03/0
6/20
12
10/0
6/20
12
17/0
6/20
12
24/0
6/20
12
01/0
7/20
12
08/0
7/20
12
15/0
7/20
12
22/0
7/20
12
29/0
7/20
12
05/0
8/20
12
12/0
8/20
12
19/0
8/20
12
26/0
8/20
12
02/0
9/20
12
09/0
9/20
12
16/0
9/20
12
23/0
9/20
12
30/0
9/20
12
07/1
0/20
12
14/1
0/20
12
21/1
0/20
12
28/1
0/20
12
04/1
1/20
12
11/1
1/20
12
18/1
1/20
12
25/1
1/20
12
02/1
2/20
12
09/1
2/20
12
16/1
2/20
12
23/1
2/20
12
30/1
2/20
12
Day of the year
Num
ber
of p
eopl
e or
veh
icle
s/da
y
VehiclesDay VisitorsOvernight Visitors
NUMBI GATE ENTRIES (2011)
0200400600800
1000
01/0
1/20
11
08/0
1/20
11
15/0
1/20
11
22/0
1/20
11
29/0
1/20
11
05/0
2/20
11
12/0
2/20
11
19/0
2/20
11
26/0
2/20
11
05/0
3/20
11
12/0
3/20
11
19/0
3/20
11
26/0
3/20
11
02/0
4/20
11
09/0
4/20
11
16/0
4/20
11
23/0
4/20
11
30/0
4/20
11
07/0
5/20
11
14/0
5/20
11
21/0
5/20
11
28/0
5/20
11
04/0
6/20
11
11/0
6/20
11
18/0
6/20
11
25/0
6/20
11
02/0
7/20
11
09/0
7/20
11
16/0
7/20
11
23/0
7/20
11
30/0
7/20
11
06/0
8/20
11
13/0
8/20
11
20/0
8/20
11
27/0
8/20
11
03/0
9/20
11
10/0
9/20
11
17/0
9/20
11
24/0
9/20
11
01/1
0/20
11
08/1
0/20
11
15/1
0/20
11
22/1
0/20
11
29/1
0/20
11
05/1
1/20
11
12/1
1/20
11
19/1
1/20
11
26/1
1/20
11
03/1
2/20
11
10/1
2/20
11
17/1
2/20
11
24/1
2/20
11
31/1
2/20
11
Day of the year
Num
ber
of p
eopl
e or
ve
hicl
es/d
ay VehiclesDay VisitorsOvernight Visitors
NUMBI GATE ENTRIES (2012)
0100200300400500600700800900
01/0
1/20
12
08/0
1/20
12
15/0
1/20
12
22/0
1/20
12
29/0
1/20
12
05/0
2/20
12
12/0
2/20
12
19/0
2/20
12
26/0
2/20
12
04/0
3/20
12
11/0
3/20
12
18/0
3/20
12
25/0
3/20
12
01/0
4/20
12
08/0
4/20
12
15/0
4/20
12
22/0
4/20
12
29/0
4/20
12
06/0
5/20
12
13/0
5/20
12
20/0
5/20
12
27/0
5/20
12
03/0
6/20
12
10/0
6/20
12
17/0
6/20
12
24/0
6/20
12
01/0
7/20
12
08/0
7/20
12
15/0
7/20
12
22/0
7/20
12
29/0
7/20
12
05/0
8/20
12
12/0
8/20
12
19/0
8/20
12
26/0
8/20
12
02/0
9/20
12
09/0
9/20
12
16/0
9/20
12
23/0
9/20
12
30/0
9/20
12
07/1
0/20
12
14/1
0/20
12
21/1
0/20
12
28/1
0/20
12
04/1
1/20
12
11/1
1/20
12
18/1
1/20
12
25/1
1/20
12
02/1
2/20
12
09/1
2/20
12
16/1
2/20
12
23/1
2/20
12
30/1
2/20
12
Day of the year
Num
ber
of p
eopl
e or
veh
icle
s/da
y
VehiclesDay VisitorsOvernight Visitors

PHABENI GATE ENTRIES (2011)
0500
1000150020002500
01/0
1/20
11
08/0
1/20
11
15/0
1/20
11
22/0
1/20
11
29/0
1/20
11
05/0
2/20
11
12/0
2/20
11
19/0
2/20
11
26/0
2/20
11
05/0
3/20
11
12/0
3/20
11
19/0
3/20
11
26/0
3/20
11
02/0
4/20
11
09/0
4/20
11
16/0
4/20
11
23/0
4/20
11
30/0
4/20
11
07/0
5/20
11
14/0
5/20
11
21/0
5/20
11
28/0
5/20
11
04/0
6/20
11
11/0
6/20
11
18/0
6/20
11
25/0
6/20
11
02/0
7/20
11
09/0
7/20
11
16/0
7/20
11
23/0
7/20
11
30/0
7/20
11
06/0
8/20
11
13/0
8/20
11
20/0
8/20
11
27/0
8/20
11
03/0
9/20
11
10/0
9/20
11
17/0
9/20
11
24/0
9/20
11
01/1
0/20
11
08/1
0/20
11
15/1
0/20
11
22/1
0/20
11
29/1
0/20
11
05/1
1/20
11
12/1
1/20
11
19/1
1/20
11
26/1
1/20
11
03/1
2/20
11
10/1
2/20
11
17/1
2/20
11
24/1
2/20
11
31/1
2/20
11
Day of the year
Num
ber o
f peo
ple
or
vehi
cles
/day Vehicles
Day VisitorsOvernight Visitors
PHABENI GATE ENTRIES (2012)
0
200
400
600
800
1000
1200
01/0
1/20
12
08/0
1/20
12
15/0
1/20
12
22/0
1/20
12
29/0
1/20
12
05/0
2/20
12
12/0
2/20
12
19/0
2/20
12
26/0
2/20
12
04/0
3/20
12
11/0
3/20
12
18/0
3/20
12
25/0
3/20
12
01/0
4/20
12
08/0
4/20
12
15/0
4/20
12
22/0
4/20
12
29/0
4/20
12
06/0
5/20
12
13/0
5/20
12
20/0
5/20
12
27/0
5/20
12
03/0
6/20
12
10/0
6/20
12
17/0
6/20
12
24/0
6/20
12
01/0
7/20
12
08/0
7/20
12
15/0
7/20
12
22/0
7/20
12
29/0
7/20
12
05/0
8/20
12
12/0
8/20
12
19/0
8/20
12
26/0
8/20
12
02/0
9/20
12
09/0
9/20
12
16/0
9/20
12
23/0
9/20
12
30/0
9/20
12
07/1
0/20
12
14/1
0/20
12
21/1
0/20
12
28/1
0/20
12
04/1
1/20
12
11/1
1/20
12
18/1
1/20
12
25/1
1/20
12
02/1
2/20
12
09/1
2/20
12
16/1
2/20
12
23/1
2/20
12
30/1
2/20
12
Day of the year
Mum
ber
of p
eopl
e or
veh
icle
s/da
y
VehiclesDay VisitorsOvernight Visitors
KRUGER GATE ENTRIES (2011)
0200400600800
100012001400
01/0
1/20
11
08/0
1/20
11
15/0
1/20
11
22/0
1/20
11
29/0
1/20
11
05/0
2/20
11
12/0
2/20
11
19/0
2/20
11
26/0
2/20
11
05/0
3/20
11
12/0
3/20
11
19/0
3/20
11
26/0
3/20
11
02/0
4/20
11
09/0
4/20
11
16/0
4/20
11
23/0
4/20
11
30/0
4/20
11
07/0
5/20
11
14/0
5/20
11
21/0
5/20
11
28/0
5/20
11
04/0
6/20
11
11/0
6/20
11
18/0
6/20
11
25/0
6/20
11
02/0
7/20
11
09/0
7/20
11
16/0
7/20
11
23/0
7/20
11
30/0
7/20
11
06/0
8/20
11
13/0
8/20
11
20/0
8/20
11
27/0
8/20
11
03/0
9/20
11
10/0
9/20
11
17/0
9/20
11
24/0
9/20
11
01/1
0/20
11
08/1
0/20
11
15/1
0/20
11
22/1
0/20
11
29/1
0/20
11
05/1
1/20
11
12/1
1/20
11
19/1
1/20
11
26/1
1/20
11
03/1
2/20
11
10/1
2/20
11
17/1
2/20
11
24/1
2/20
11
31/1
2/20
11
Day of the year
Num
ber o
f peo
ple
or
vehi
cles
/day Vehicles
Day VisitorsOvernight Visitors

KRUGER GATE ENTRIES (2012)
0200400600800
10001200140016001800
01/0
1/20
12
08/0
1/20
12
15/0
1/20
12
22/0
1/20
12
29/0
1/20
12
05/0
2/20
12
12/0
2/20
12
19/0
2/20
12
26/0
2/20
12
04/0
3/20
12
11/0
3/20
12
18/0
3/20
12
25/0
3/20
12
01/0
4/20
12
08/0
4/20
12
15/0
4/20
12
22/0
4/20
12
29/0
4/20
12
06/0
5/20
12
13/0
5/20
12
20/0
5/20
12
27/0
5/20
12
03/0
6/20
12
10/0
6/20
12
17/0
6/20
12
24/0
6/20
12
01/0
7/20
12
08/0
7/20
12
15/0
7/20
12
22/0
7/20
12
29/0
7/20
12
05/0
8/20
12
12/0
8/20
12
19/0
8/20
12
26/0
8/20
12
02/0
9/20
12
09/0
9/20
12
16/0
9/20
12
23/0
9/20
12
30/0
9/20
12
07/1
0/20
12
14/1
0/20
12
21/1
0/20
12
28/1
0/20
12
04/1
1/20
12
11/1
1/20
12
18/1
1/20
12
25/1
1/20
12
02/1
2/20
12
09/1
2/20
12
16/1
2/20
12
23/1
2/20
12
30/1
2/20
12
Day of the year
Num
ber
of p
eopl
e or
veh
icle
s/da
y
VehiclesDay VisitorsOvernight Visitors

SOUTHERN GATES: VEHICLE ENTRIES TOTAL (2011)
0500
100015002000
01/0
1/20
11
08/0
1/20
11
15/0
1/20
11
22/0
1/20
11
29/0
1/20
11
05/0
2/20
11
12/0
2/20
11
19/0
2/20
11
26/0
2/20
11
05/0
3/20
11
12/0
3/20
11
19/0
3/20
11
26/0
3/20
11
02/0
4/20
11
09/0
4/20
11
16/0
4/20
11
23/0
4/20
11
30/0
4/20
11
07/0
5/20
11
14/0
5/20
11
21/0
5/20
11
28/0
5/20
11
04/0
6/20
11
11/0
6/20
11
18/0
6/20
11
25/0
6/20
11
02/0
7/20
11
09/0
7/20
11
16/0
7/20
11
23/0
7/20
11
30/0
7/20
11
06/0
8/20
11
13/0
8/20
11
20/0
8/20
11
27/0
8/20
11
03/0
9/20
11
10/0
9/20
11
17/0
9/20
11
24/0
9/20
11
01/1
0/20
11
08/1
0/20
11
15/1
0/20
11
22/1
0/20
11
29/1
0/20
11
05/1
1/20
11
12/1
1/20
11
19/1
1/20
11
26/1
1/20
11
03/1
2/20
11
10/1
2/20
11
17/1
2/20
11
24/1
2/20
11
31/1
2/20
11
Day of the year
Num
ber
of v
ehic
les/
day
Vehicles In
SOUTHERN GATES: VEHICLE ENTRIES TOTAL (2012)
0200400600800
100012001400160018002000
01/0
1/20
12
08/0
1/20
12
15/0
1/20
12
22/0
1/20
12
29/0
1/20
12
05/0
2/20
12
12/0
2/20
12
19/0
2/20
12
26/0
2/20
12
04/0
3/20
12
11/0
3/20
12
18/0
3/20
12
25/0
3/20
12
01/0
4/20
12
08/0
4/20
12
15/0
4/20
12
22/0
4/20
12
29/0
4/20
12
06/0
5/20
12
13/0
5/20
12
20/0
5/20
12
27/0
5/20
12
03/0
6/20
12
10/0
6/20
12
17/0
6/20
12
24/0
6/20
12
01/0
7/20
12
08/0
7/20
12
15/0
7/20
12
22/0
7/20
12
29/0
7/20
12
05/0
8/20
12
12/0
8/20
12
19/0
8/20
12
26/0
8/20
12
02/0
9/20
12
09/0
9/20
12
16/0
9/20
12
23/0
9/20
12
30/0
9/20
12
07/1
0/20
12
14/1
0/20
12
21/1
0/20
12
28/1
0/20
12
04/1
1/20
12
11/1
1/20
12
18/1
1/20
12
25/1
1/20
12
02/1
2/20
12
09/1
2/20
12
16/1
2/20
12
23/1
2/20
12
30/1
2/20
12
Day of the year
Num
ber
of v
ehic
les/
day
Vehicles In
SOUTERN GATES: VISITORS (PEOPLE) ENTRIES TOTAL (2011)
01000200030004000500060007000
01/0
1/20
11
08/0
1/20
11
15/0
1/20
11
22/0
1/20
11
29/0
1/20
11
05/0
2/20
11
12/0
2/20
11
19/0
2/20
11
26/0
2/20
11
05/0
3/20
11
12/0
3/20
11
19/0
3/20
11
26/0
3/20
11
02/0
4/20
11
09/0
4/20
11
16/0
4/20
11
23/0
4/20
11
30/0
4/20
11
07/0
5/20
11
14/0
5/20
11
21/0
5/20
11
28/0
5/20
11
04/0
6/20
11
11/0
6/20
11
18/0
6/20
11
25/0
6/20
11
02/0
7/20
11
09/0
7/20
11
16/0
7/20
11
23/0
7/20
11
30/0
7/20
11
06/0
8/20
11
13/0
8/20
11
20/0
8/20
11
27/0
8/20
11
03/0
9/20
11
10/0
9/20
11
17/0
9/20
11
24/0
9/20
11
01/1
0/20
11
08/1
0/20
11
15/1
0/20
11
22/1
0/20
11
29/1
0/20
11
05/1
1/20
11
12/1
1/20
11
19/1
1/20
11
26/1
1/20
11
03/1
2/20
11
10/1
2/20
11
17/1
2/20
11
24/1
2/20
11
31/1
2/20
11
Day of the year
Num
ber
of p
eopl
e/da
y
Total Visitors
SOUTHERN GATES: VISITORS (PEOPLE) ENTRIES TOTAL (2012)
0
1000
2000
3000
4000
5000
6000
7000
01/0
1/20
12
08/0
1/20
12
15/0
1/20
12
22/0
1/20
12
29/0
1/20
12
05/0
2/20
12
12/0
2/20
12
19/0
2/20
12
26/0
2/20
12
04/0
3/20
12
11/0
3/20
12
18/0
3/20
12
25/0
3/20
12
01/0
4/20
12
08/0
4/20
12
15/0
4/20
12
22/0
4/20
12
29/0
4/20
12
06/0
5/20
12
13/0
5/20
12
20/0
5/20
12
27/0
5/20
12
03/0
6/20
12
10/0
6/20
12
17/0
6/20
12
24/0
6/20
12
01/0
7/20
12
08/0
7/20
12
15/0
7/20
12
22/0
7/20
12
29/0
7/20
12
05/0
8/20
12
12/0
8/20
12
19/0
8/20
12
26/0
8/20
12
02/0
9/20
12
09/0
9/20
12
16/0
9/20
12
23/0
9/20
12
30/0
9/20
12
07/1
0/20
12
14/1
0/20
12
21/1
0/20
12
28/1
0/20
12
04/1
1/20
12
11/1
1/20
12
18/1
1/20
12
25/1
1/20
12
02/1
2/20
12
09/1
2/20
12
16/1
2/20
12
23/1
2/20
12
30/1
2/20
12
Day of the year
Num
ber o
f peo
ple/
day
Total Visitors

SOUTHERN GATES VISITORS (PERSON) ENTRIES: 2008, 2011 & 2012
01000200030004000500060007000
01/0
1/20
08
15/0
1/20
08
29/0
1/20
08
12/0
2/20
08
26/0
2/20
08
11/0
3/20
08
25/0
3/20
08
08/0
4/20
08
22/0
4/20
08
06/0
5/20
08
20/0
5/20
08
03/0
6/20
08
17/0
6/20
08
01/0
7/20
08
15/0
7/20
08
29/0
7/20
08
12/0
8/20
08
26/0
8/20
08
09/0
9/20
08
23/0
9/20
08
07/1
0/20
08
21/1
0/20
08
04/1
1/20
08
18/1
1/20
08
02/1
2/20
08
16/1
2/20
08
30/1
2/20
08
day of the year
Num
ber o
f peo
ple/
day
Total Visitor Entries (2008)Total Visitor Entries (2011)Total Visitor Entries (2012)
2008 GATE VISITOR ENTRIES
01000200030004000500060007000
01/0
1/20
08
15/0
1/20
08
29/0
1/20
08
12/0
2/20
08
26/0
2/20
08
11/0
3/20
08
25/0
3/20
08
08/0
4/20
08
22/0
4/20
08
06/0
5/20
08
20/0
5/20
08
03/0
6/20
08
17/0
6/20
08
01/0
7/20
08
15/0
7/20
08
29/0
7/20
08
12/0
8/20
08
26/0
8/20
08
09/0
9/20
08
23/0
9/20
08
07/1
0/20
08
21/1
0/20
08
04/1
1/20
08
18/1
1/20
08
02/1
2/20
08
16/1
2/20
08
30/1
2/20
08
Day of the year
Num
ber o
f vis
itors
/day
Total Southern Gate Visitor Entries Visitor Entries Kruger Visitor Entries PhabeniVisitor Entries NumbiTotal Visitor Entries Kruger, Phabeni & Numbi

NUMBI GATE ROAD DENSITIES
0.000.501.001.502.002.503.003.504.00
03-Nov-11 23-Dec-11 11-Feb-12 01-Apr-12 21-May-12 10-Jul-12 29-Aug-12 18-Oct-12 07-Dec-12 26-Jan-13
Day of the year
Den
sity
(veh
icle
s/km
)
Current densitiesDensity Scenario 1Density Scenario 4
PHABENI GATE ROAD DENSITIES
0.000.501.001.502.002.503.003.504.00
03-Nov-11 23-Dec-11 11-Feb-12 01-Apr-12 21-May-12 10-Jul-12 29-Aug-12 18-Oct-12 07-Dec-12 26-Jan-13
Day of the year
Den
sity
(veh
icle
s/km
)
Phabeni current densitiesDensity Scenario 2Density Scenario 4
KRUGER GATE ROAD DENSITIES
0.001.002.003.004.005.006.007.008.00
03-Nov-11 23-Dec-11 11-Feb-12 01-Apr-12 21-May-12 10-Jul-12 29-Aug-12 18-Oct-12 07-Dec-12 26-Jan-13
Day of the year
Den
sity
(veh
icle
s/km
)
Kruger current densitiesDensity Scenario 3Density Scenario 4