
Part II Lesson 10: Solar photovoltaics (PV) · It’s a Quantum World: ... Solar Cells Part II 11....
34
1.021, 3.021, 10.333, 22.00 : Introduction to Modeling and Simulation : Spring 2012 Part II – Quantum Mechanical Methods : Lecture 10 Solar PV Jeffrey C. Grossman Department of Materials Science and Engineering Massachusetts Institute of Technology
Transcript of Part II Lesson 10: Solar photovoltaics (PV) · It’s a Quantum World: ... Solar Cells Part II 11....
1.021, 3.021, 10.333, 22.00 : Introduction to Modeling and Simulation : Spring 2012
Part II – Quantum Mechanical Methods : Lecture 10
Solar PV
Jeffrey C. Grossman
Department of Materials Science and Engineering Massachusetts Institute of Technology
Part II Topics 1. It’s a Quantum World:The Theory of Quantum Mechanics
2. Quantum Mechanics: Practice Makes Perfect
3. From Many-Body to Single-Particle; Quantum Modeling of Molecules
4. Application of Quantum Modeling of Molecules: Solar Thermal Fuels
5. Application of Quantum Modeling of Molecules: Hydrogen Storage
6. From Atoms to Solids
7. Quantum Modeling of Solids: Basic Properties
8. Advanced Prop. of Materials:What else can we do?
9. Application of Quantum Modeling of Solids: Solar Cells Part I
10. Application of Quantum Modeling of Solids: Solar Cells Part II
11. Application of Quantum Modeling of Solids: Nanotechnology
Summary
•A bit of discussion of PSET 6
• Solar PV - More Motivation
• Solar PV - the viewpoint of the electron!
•How computational quantum mechanics can impact solar PV
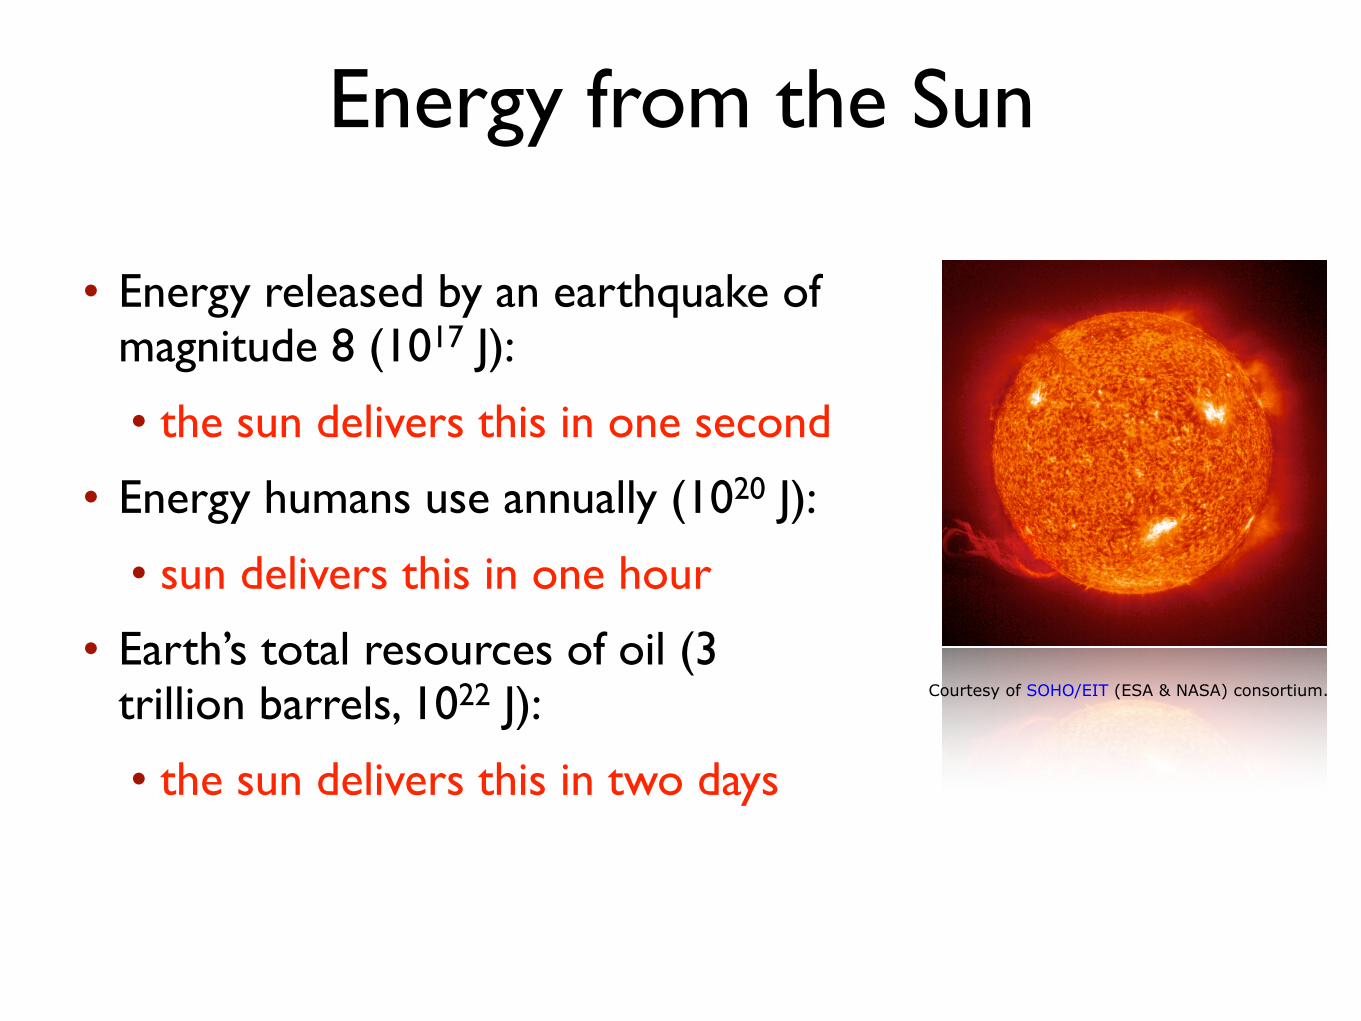
Energy from the Sun
• Energy released by an earthquake of magnitude 8 (1017 J):
• the sun delivers this in one second
• Energy humans use annually (1020 J):
• sun delivers this in one hour
• Earth’s total resources of oil (3 trillion barrels, 1022 J):
• the sun delivers this in two days
Courtesy of SOHO/EIT (ESA & NASA) consortium.
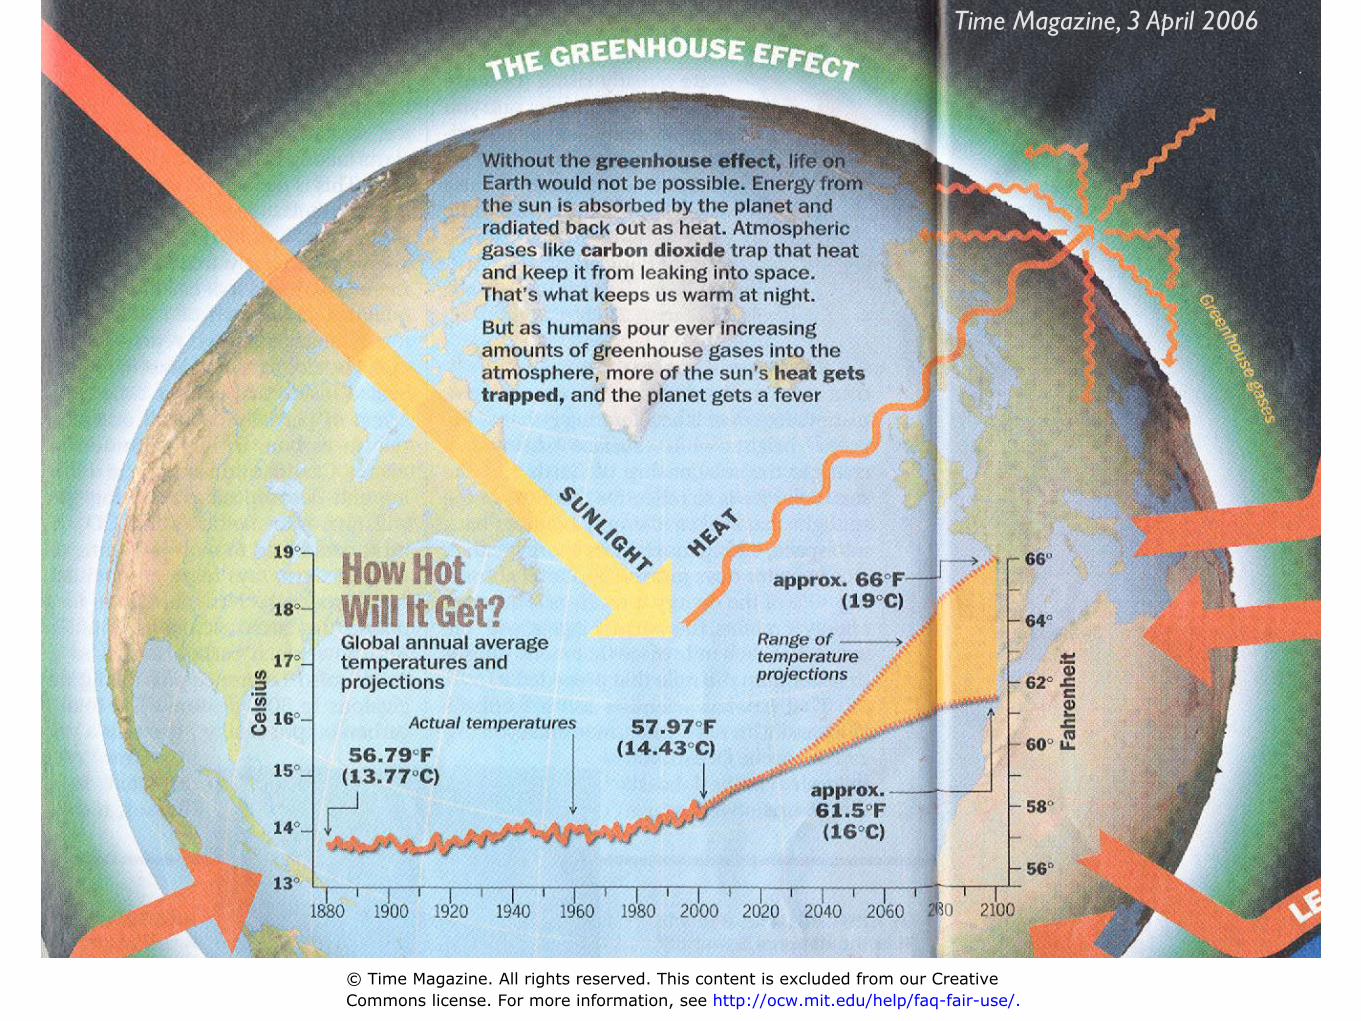
Time Magazine, 3 April 2006
© Time Magazine. All rights reserved. This content is excluded from our CreativeCommons license. For more information, see http://ocw.mit.edu/help/faq-fair-use/.
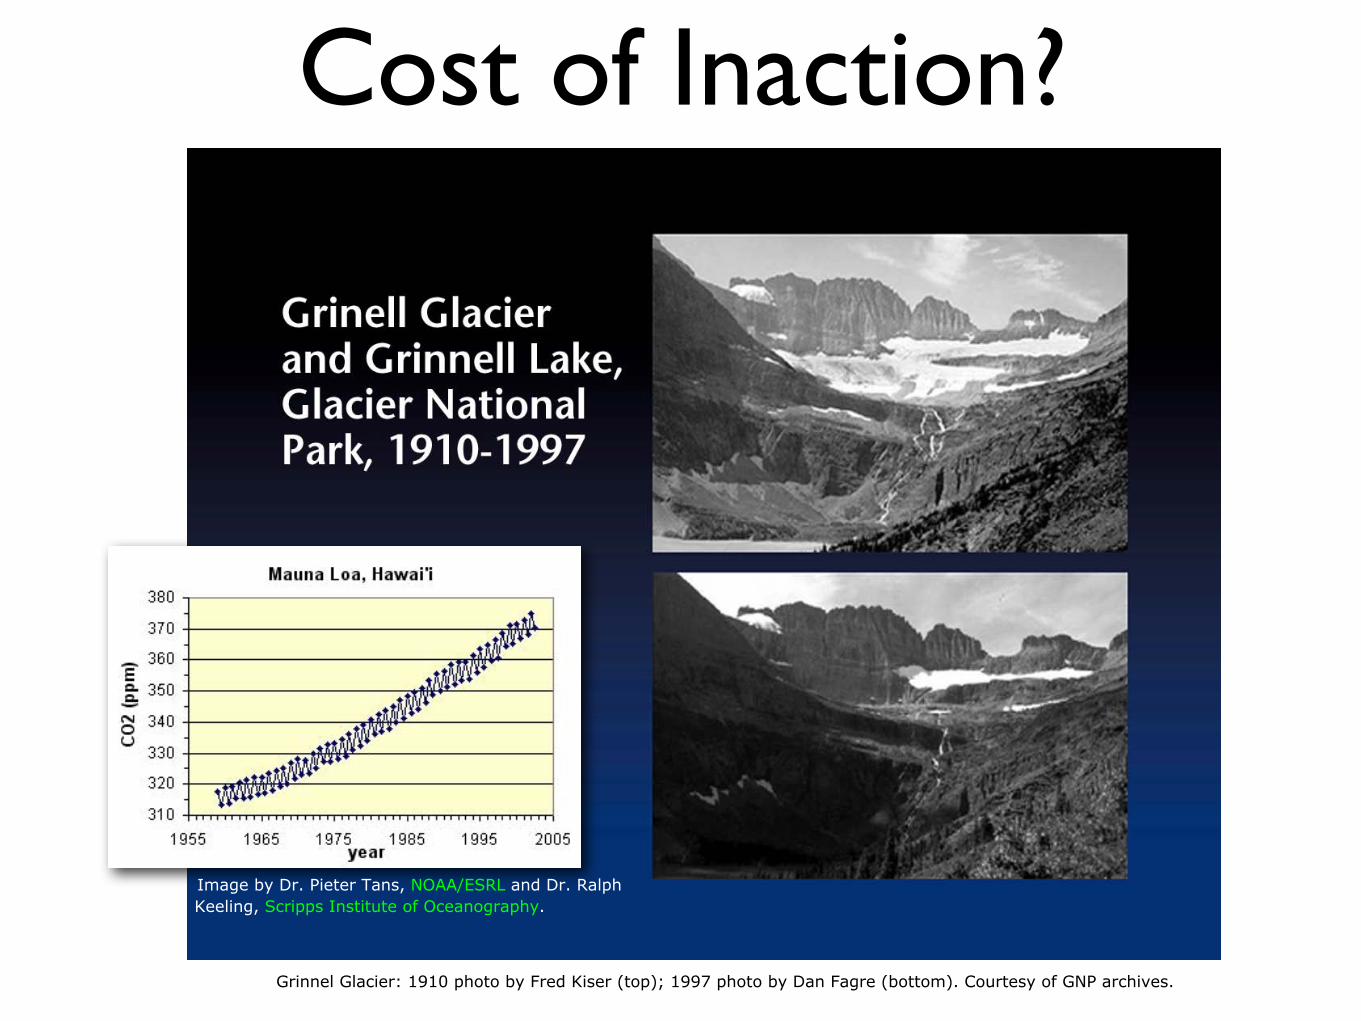
Cost of Inaction?
Image by Dr. Pieter Tans, NOAA/ESRL and Dr. Ralph Keeling, Scripps Institute of Oceanography.
Grinnel Glacier: 1910 photo by Fred Kiser (top); 1997 photo by Dan Fagre (bottom). Courtesy of GNP archives.
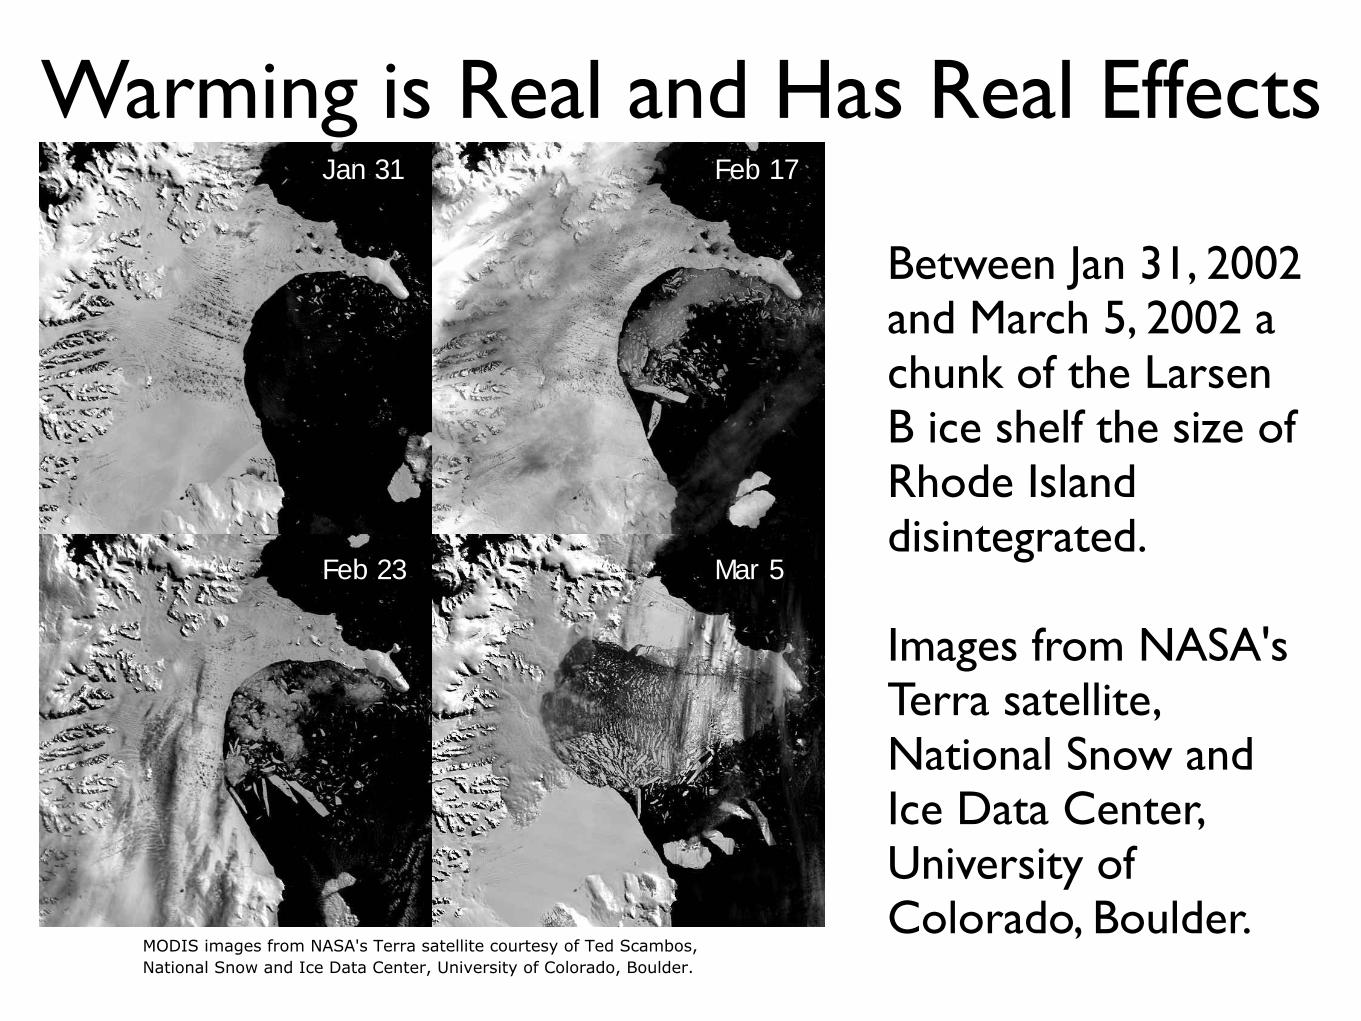
Warming is Real and Has Real Effects
Between Jan 31, 2002 and March 5, 2002 a chunk of the Larsen B ice shelf the size of Rhode Island disintegrated.
Images from NASA's Terra satellite, National Snow and Ice Data Center, University of Colorado, Boulder.
MODIS images from NASA's Terra satellite courtesy of Ted Scambos,National Snow and Ice Data Center, University of Colorado, Boulder.
Jan 31 Feb 17
Feb 23 Mar 5
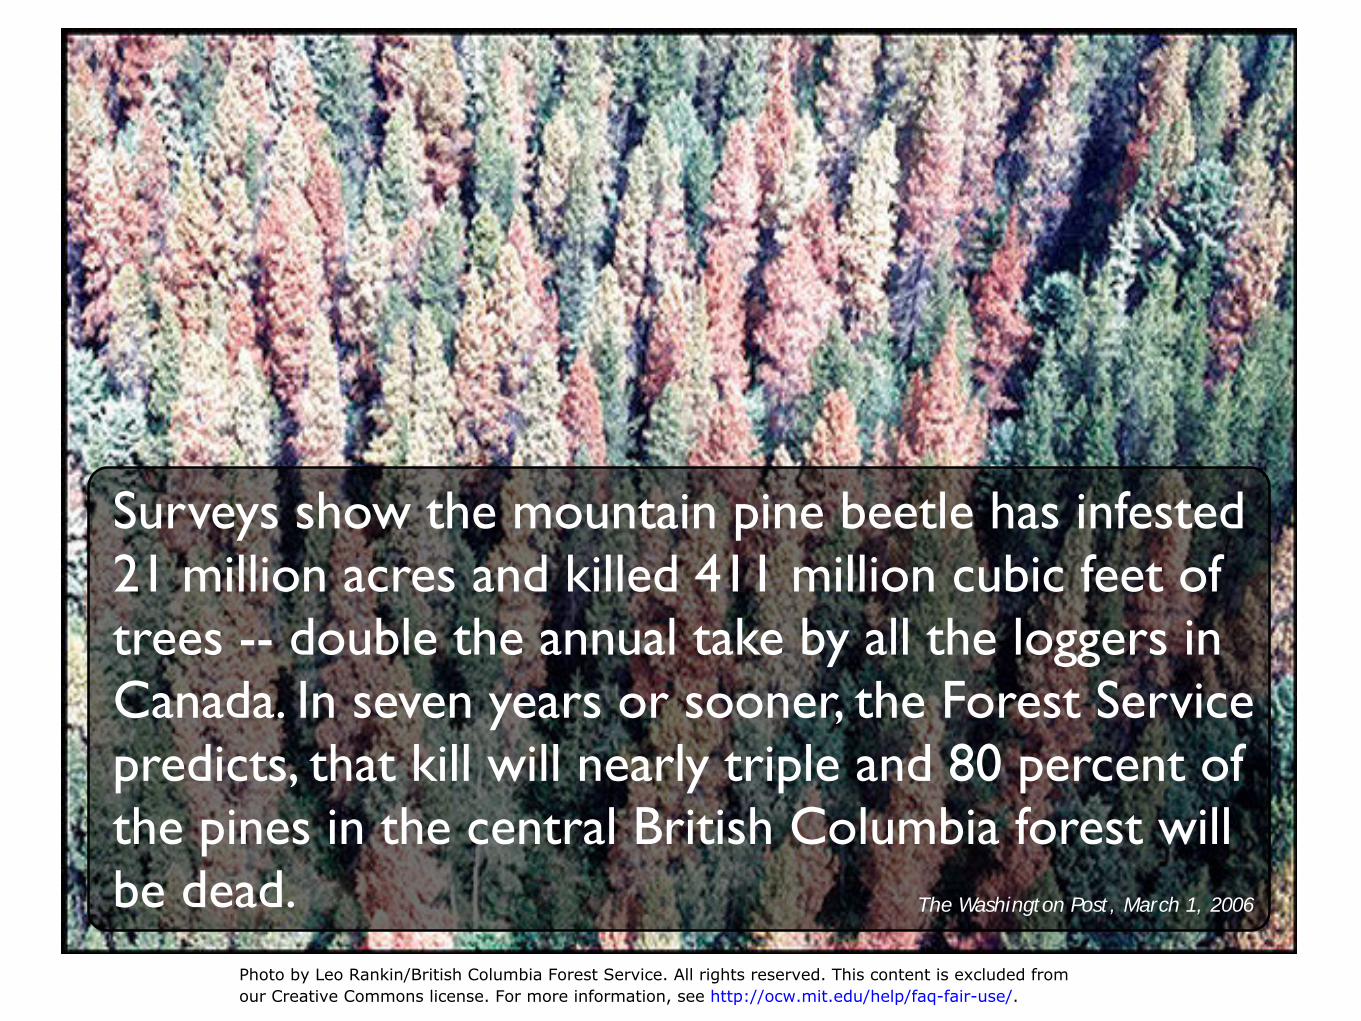
Surveys show the mountain pine beetle has infested 21 million acres and killed 411 million cubic feet of trees -- double the annual take by all the loggers in Canada. In seven years or sooner, the Forest Service predicts, that kill will nearly triple and 80 percent of the pines in the central British Columbia forest will be dead. The Washington Post, March 1, 2006
Photo by Leo Rankin/British Columbia Forest Service. All rights reserved. This content is excluded fromour Creative Commons license. For more information, see http://ocw.mit.edu/help/faq-fair-use/.
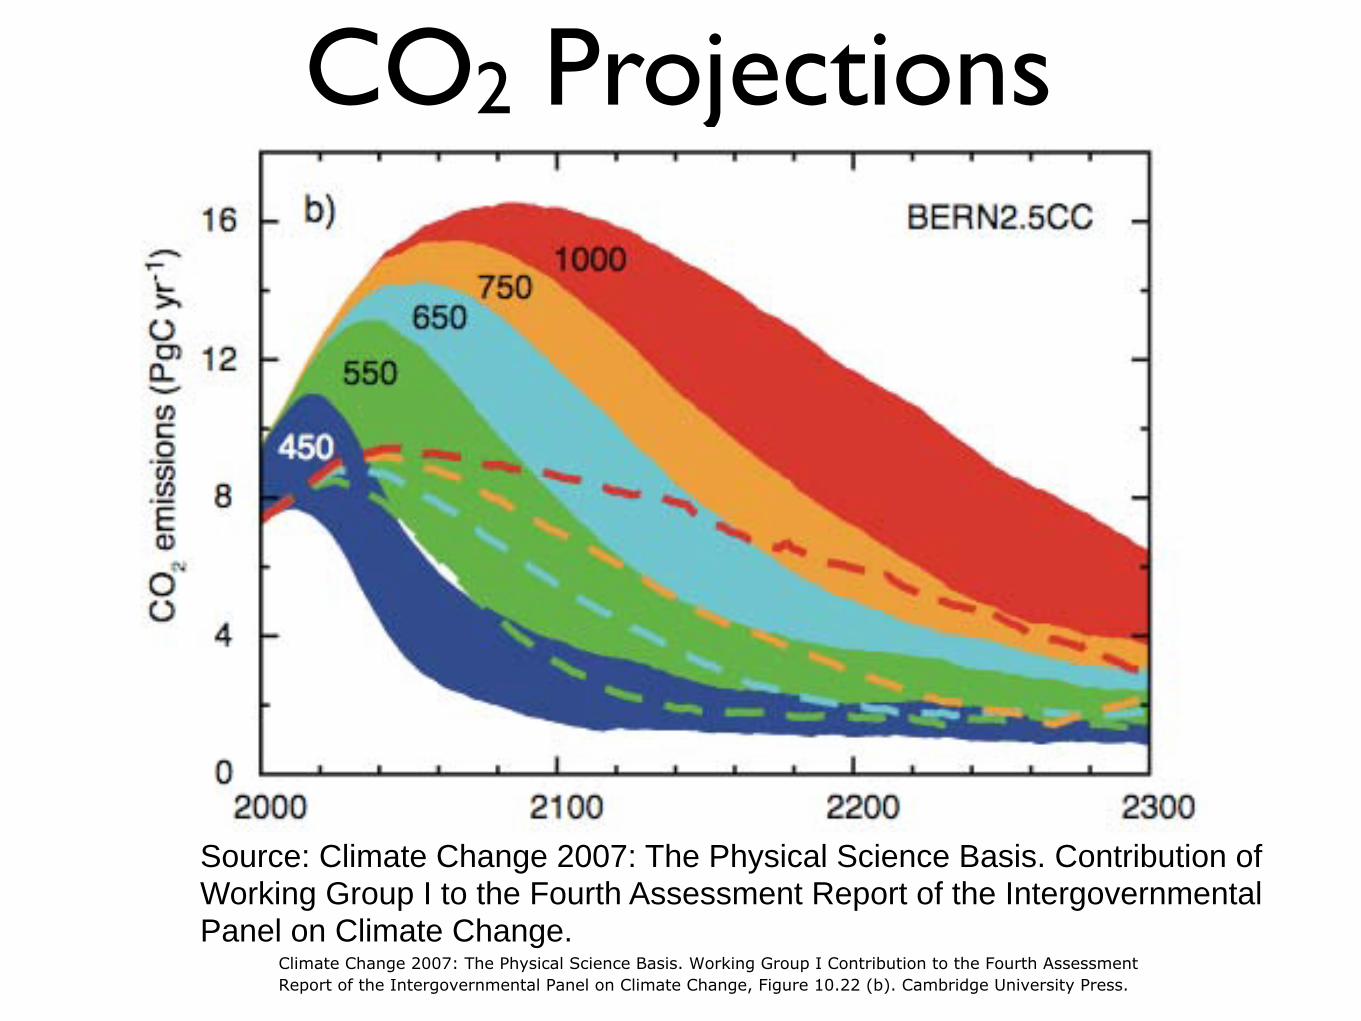
CO2 Projections
Source: Climate Change 2007: The Physical Science Basis. Contribution of Working Group I to the Fourth Assessment Report of the Intergovernmental Panel on Climate Change�
Climate Change 2007: The Physical Science Basis. Working Group I Contribution to the Fourth AssessmentReport of the Intergovernmental Panel on Climate Change, Figure 10.22 (b). Cambridge University Press.
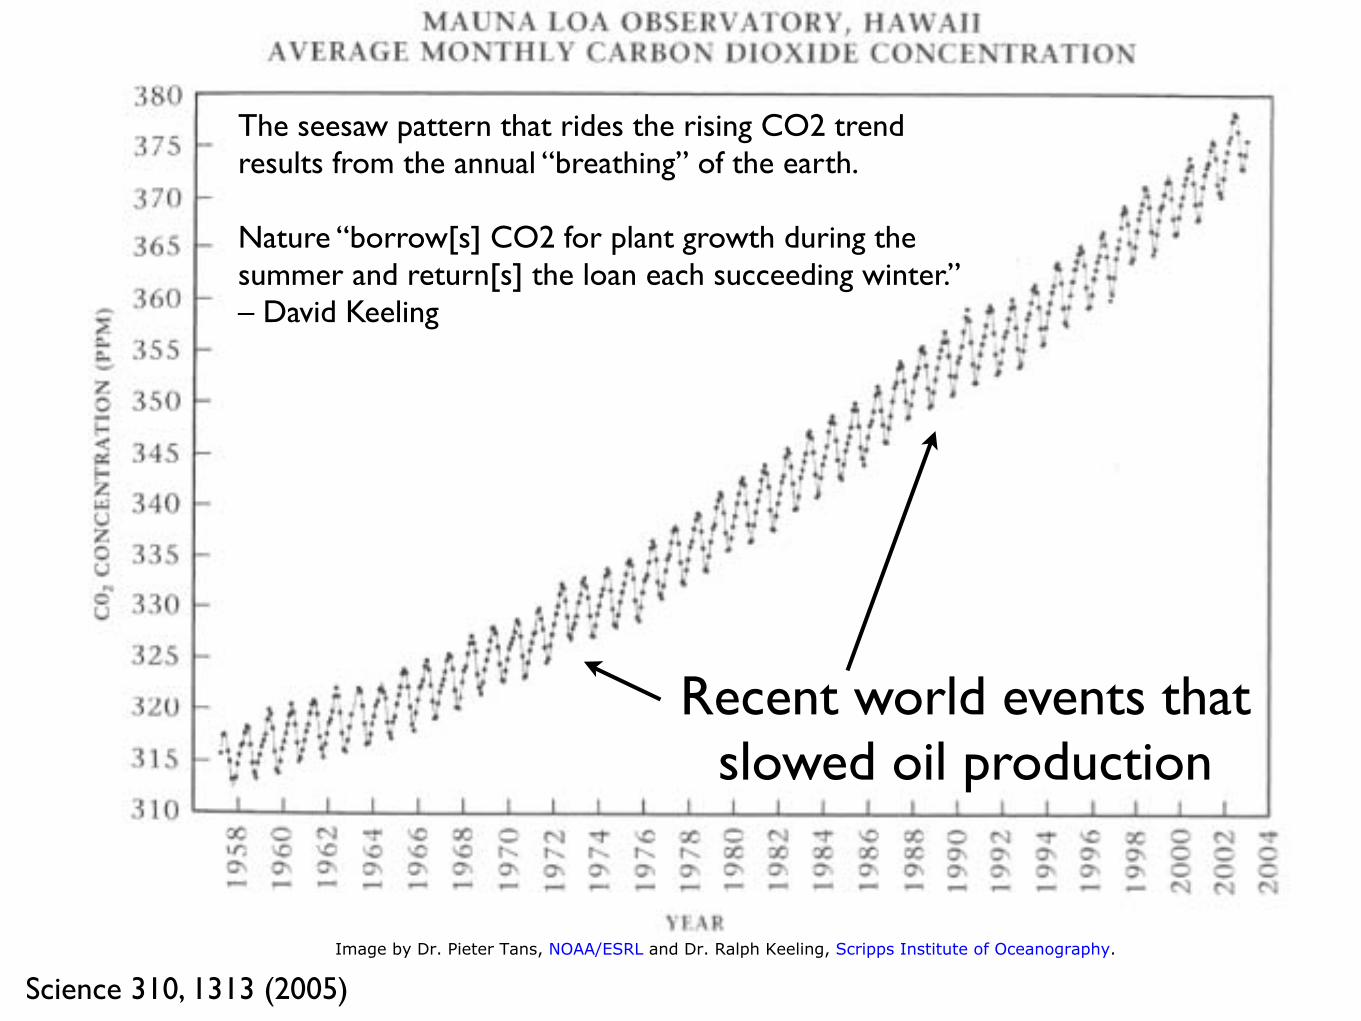
The seesaw pattern that rides the rising CO2 trend results from the annual “breathing” of the earth.
Nature “borrow[s] CO2 for plant growth during the summer and return[s] the loan each succeeding winter.” – David Keeling
Recent world events that slowed oil production
Science 310, 1313 (2005) Image by Dr. Pieter Tans, NOAA/ESRL and Dr. Ralph Keeling, Scripps Institute of Oceanography.
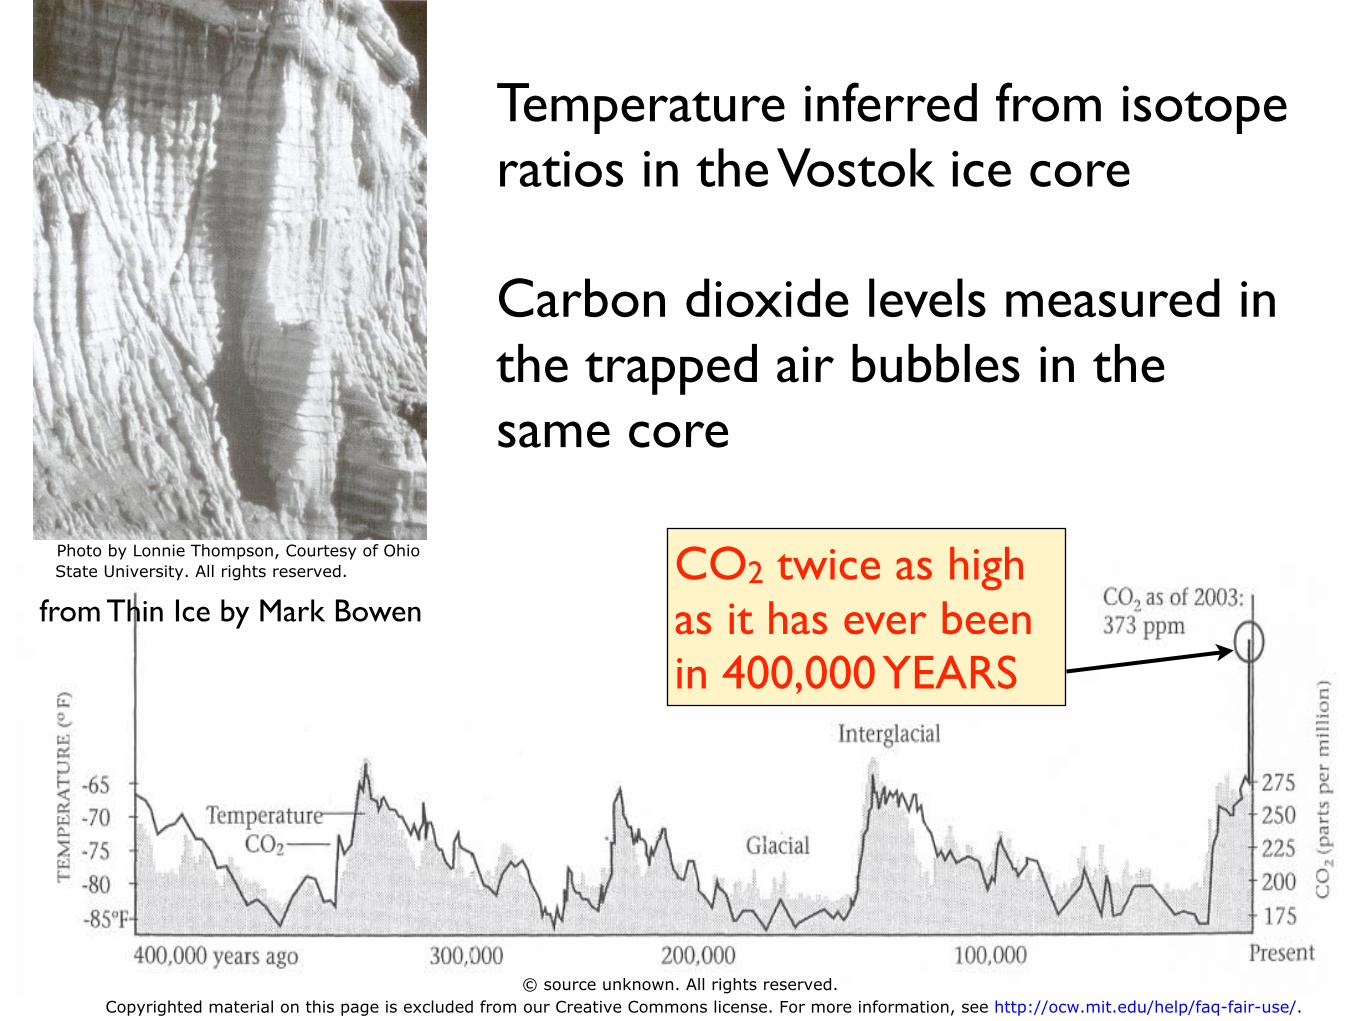
from Thin Ice by Mark Bowen
Temperature inferred from isotope ratios in the Vostok ice core
Carbon dioxide levels measured in the trapped air bubbles in the same core
CO2 twice as high as it has ever been in 400,000 YEARS
Photo by Lonnie Thompson, Courtesy of OhioState University. All rights reserved.
© source unknown. All rights reserved.Copyrighted material on this page is excluded from our Creative Commons license. For more information, see http://ocw.mit.edu/help/faq-fair-use/.
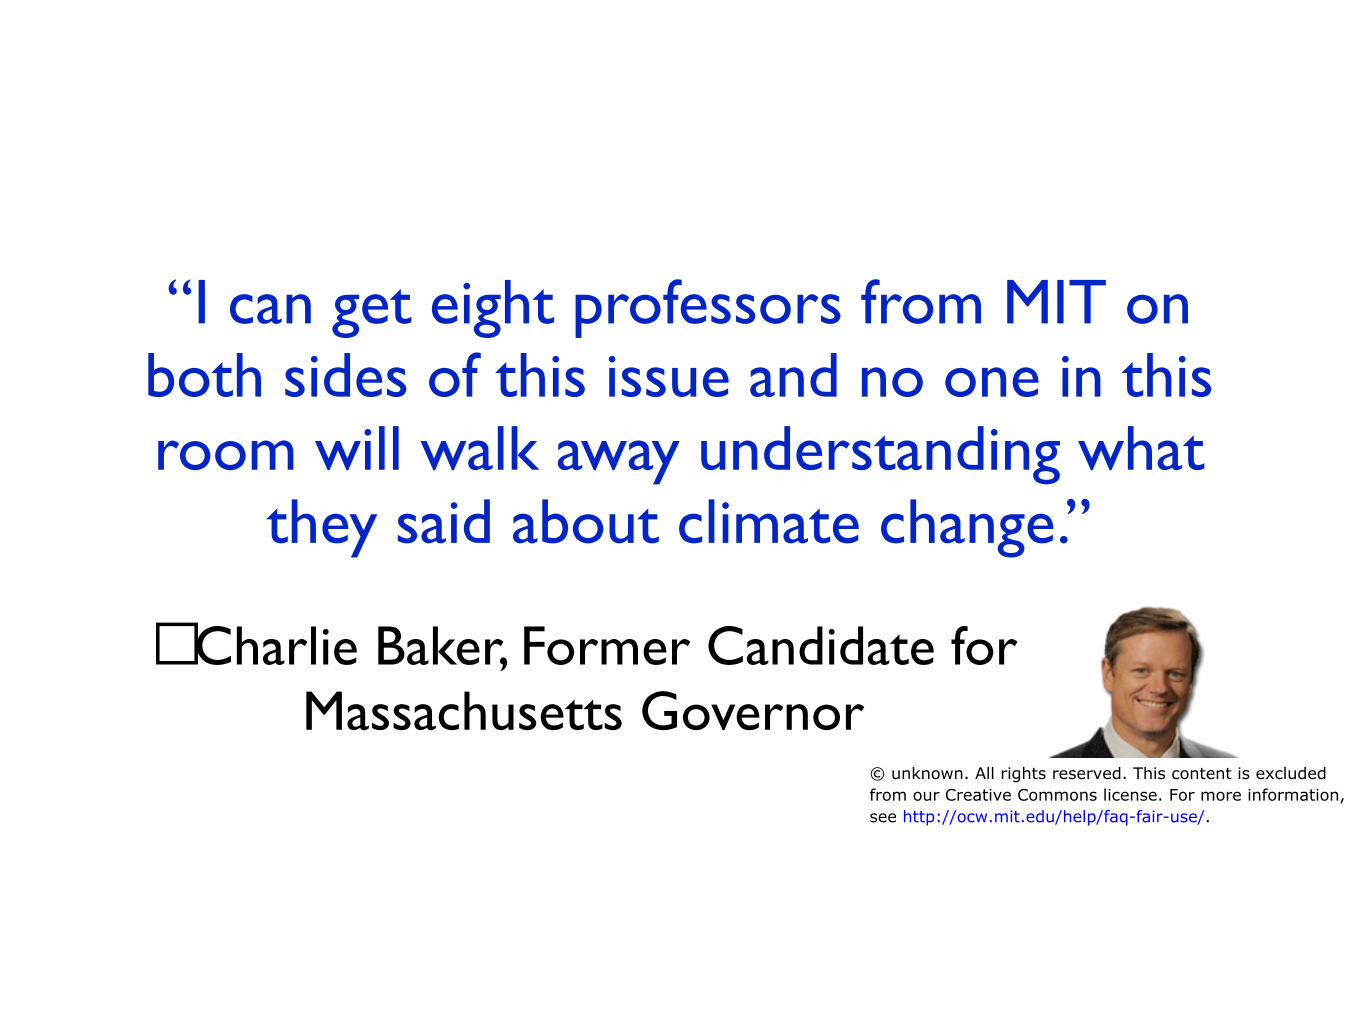
“I can get eight professors from MIT on both sides of this issue and no one in this room will walk away understanding what
they said about climate change.”
! Charlie Baker, Former Candidate for Massachusetts Governor
© unknown. All rights reserved. This content is excludedfrom our Creative Commons license. For more information, see http://ocw.mit.edu/help/faq-fair-use/.
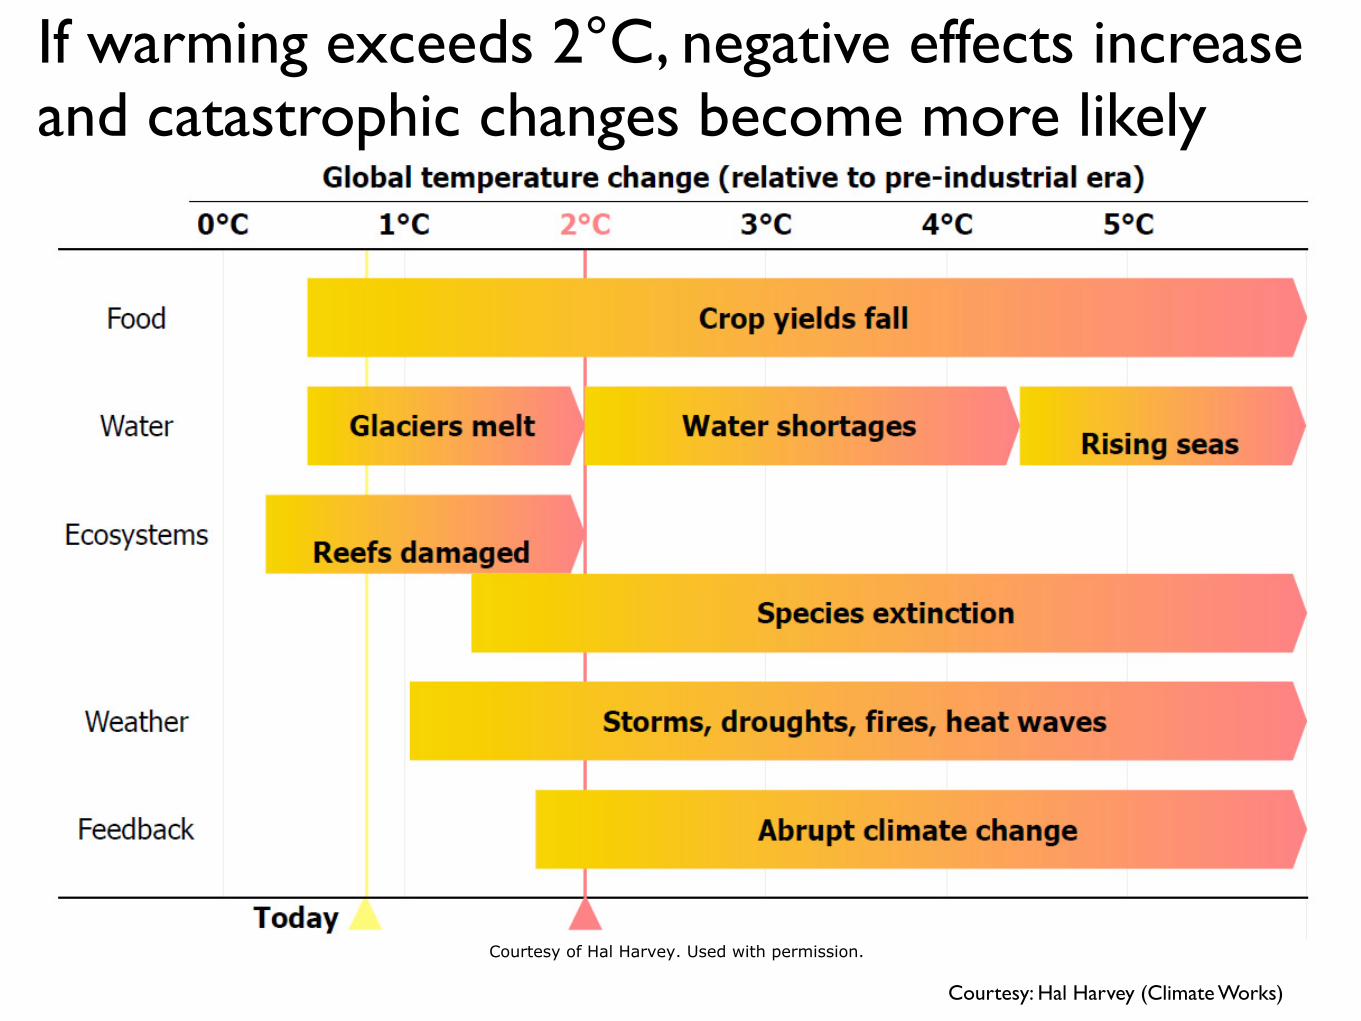
If warming exceeds 2°C, negative effects increase and catastrophic changes become more likely
Courtesy: Hal Harvey (Climate Works)
Courtesy of Hal Harvey. Used with permission.
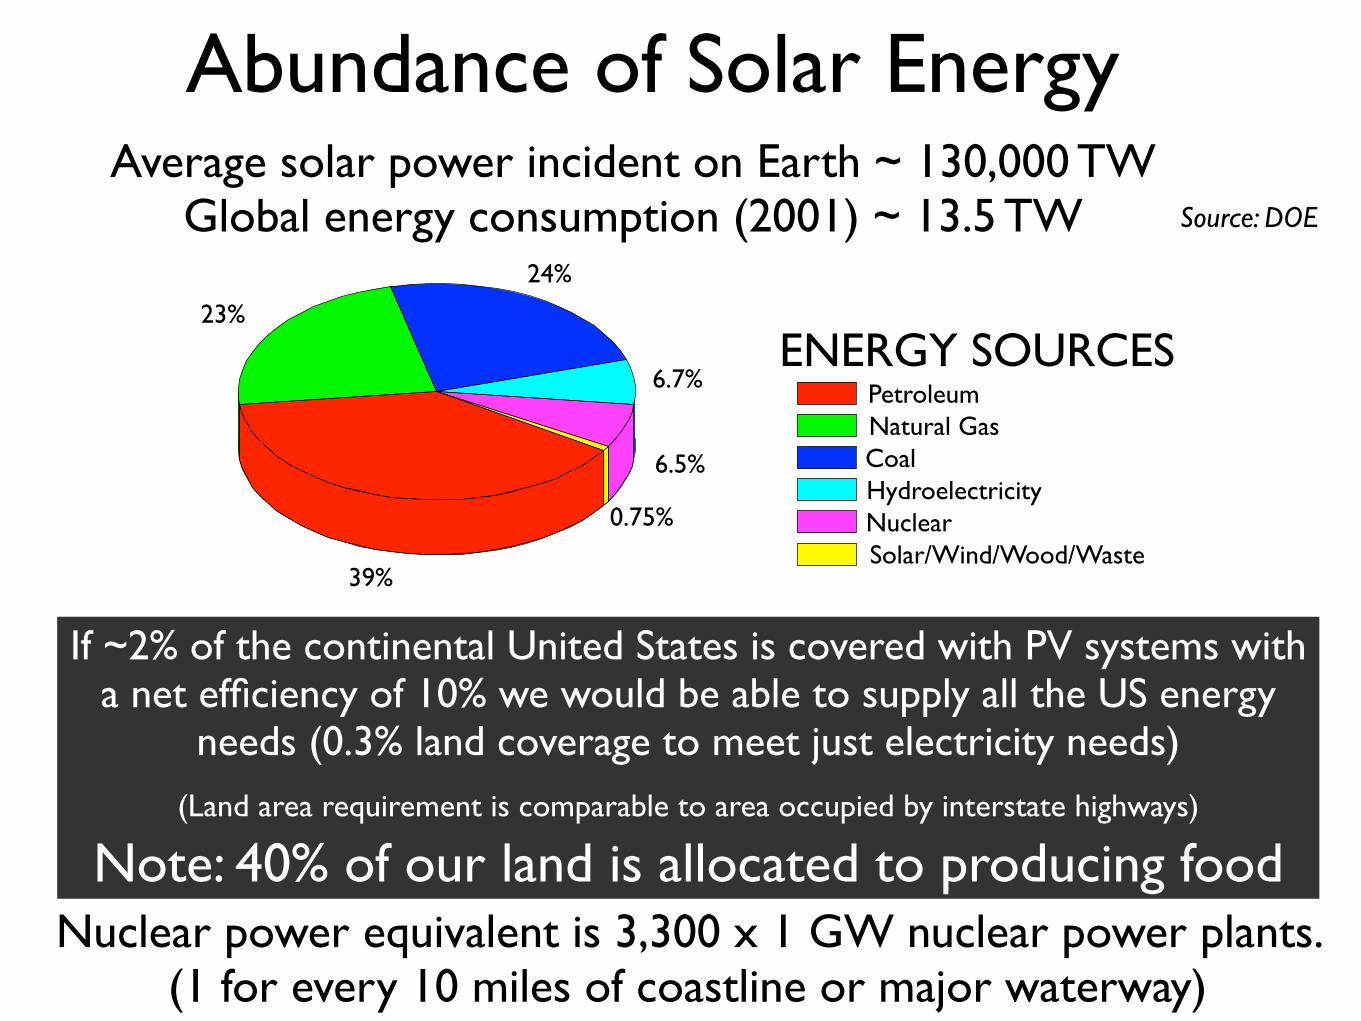
Abundance of Solar Energy Average solar power incident on Earth ~ 130,000 TW
Global energy consumption (2001) ~ 13.5 TW Source: DOE
24%
23%
ENERGY SOURCES 6.7% Petroleum
Natural Gas Coal6.5% Hydroelectricity
0.75% Nuclear Solar/Wind/Wood/Waste
39%
If ~2% of the continental United States is covered with PV systems with a net efficiency of 10% we would be able to supply all the US energy
needs (0.3% land coverage to meet just electricity needs) (Land area requirement is comparable to area occupied by interstate highways)
Note: 40% of our land is allocated to producing food Nuclear power equivalent is 3,300 x 1 GW nuclear power plants.
(1 for every 10 miles of coastline or major waterway)
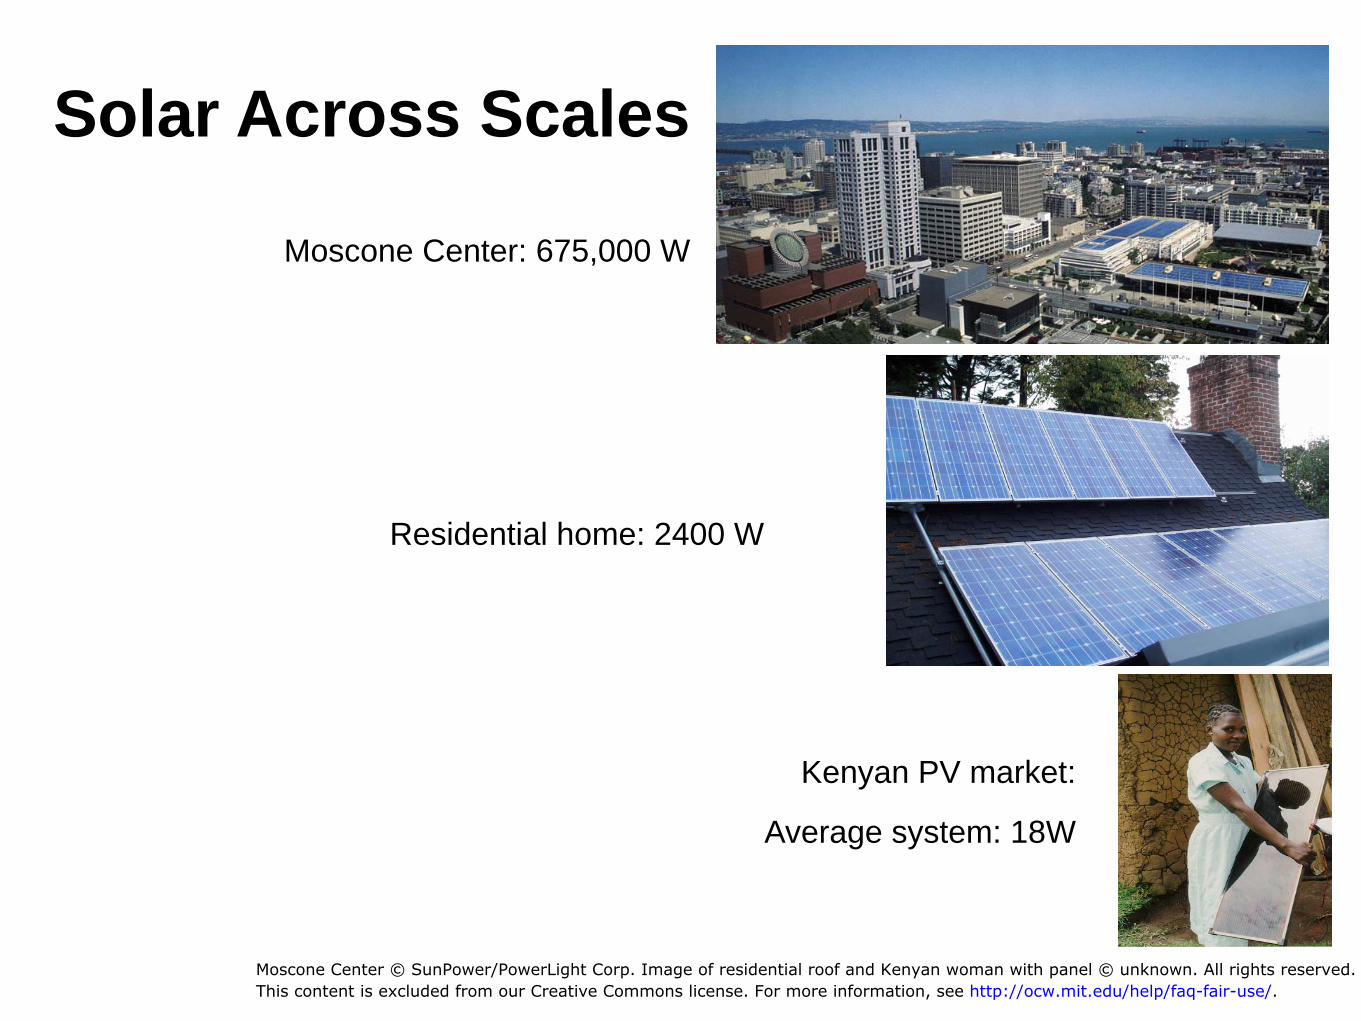
Solar Across Scales
Moscone Center: 675,000 W
Residential home: 2400 W
Kenyan PV market:
Average system: 18W
Moscone Center © SunPower/PowerLight Corp. Image of residential roof and Kenyan woman with panel © unknown. All rights reserved.This content is excluded from our Creative Commons license. For more information, see http://ocw.mit.edu/help/faq-fair-use/.
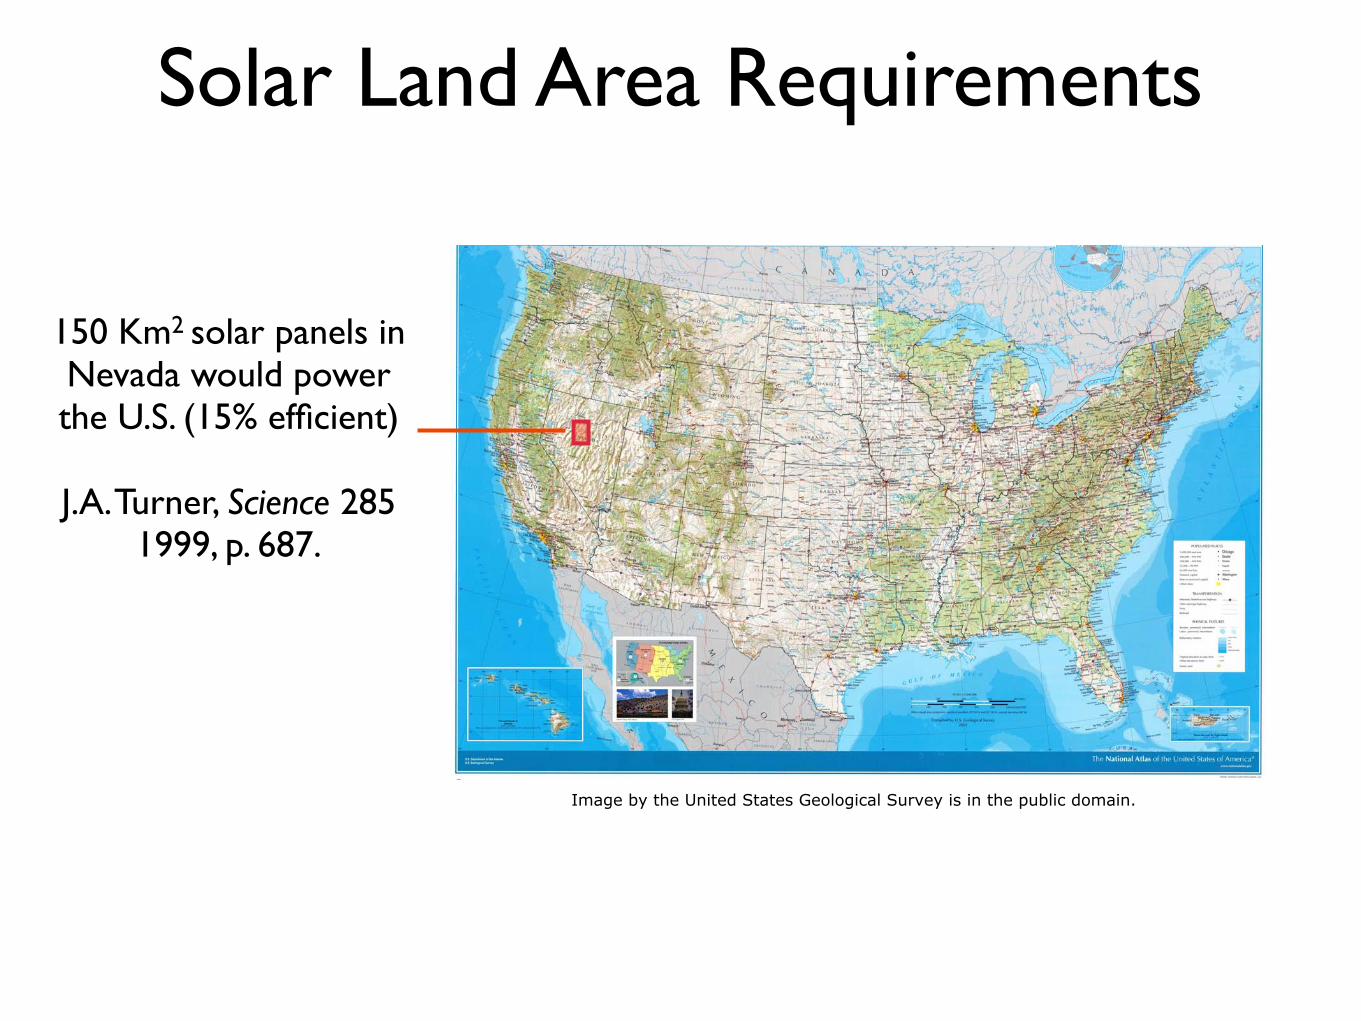
Solar Land Area Requirements
150 Km2 solar panels in Nevada would power the U.S. (15% efficient)
J.A.Turner, Science 285 1999, p. 687.
Image by the United States Geological Survey is in the public domain.
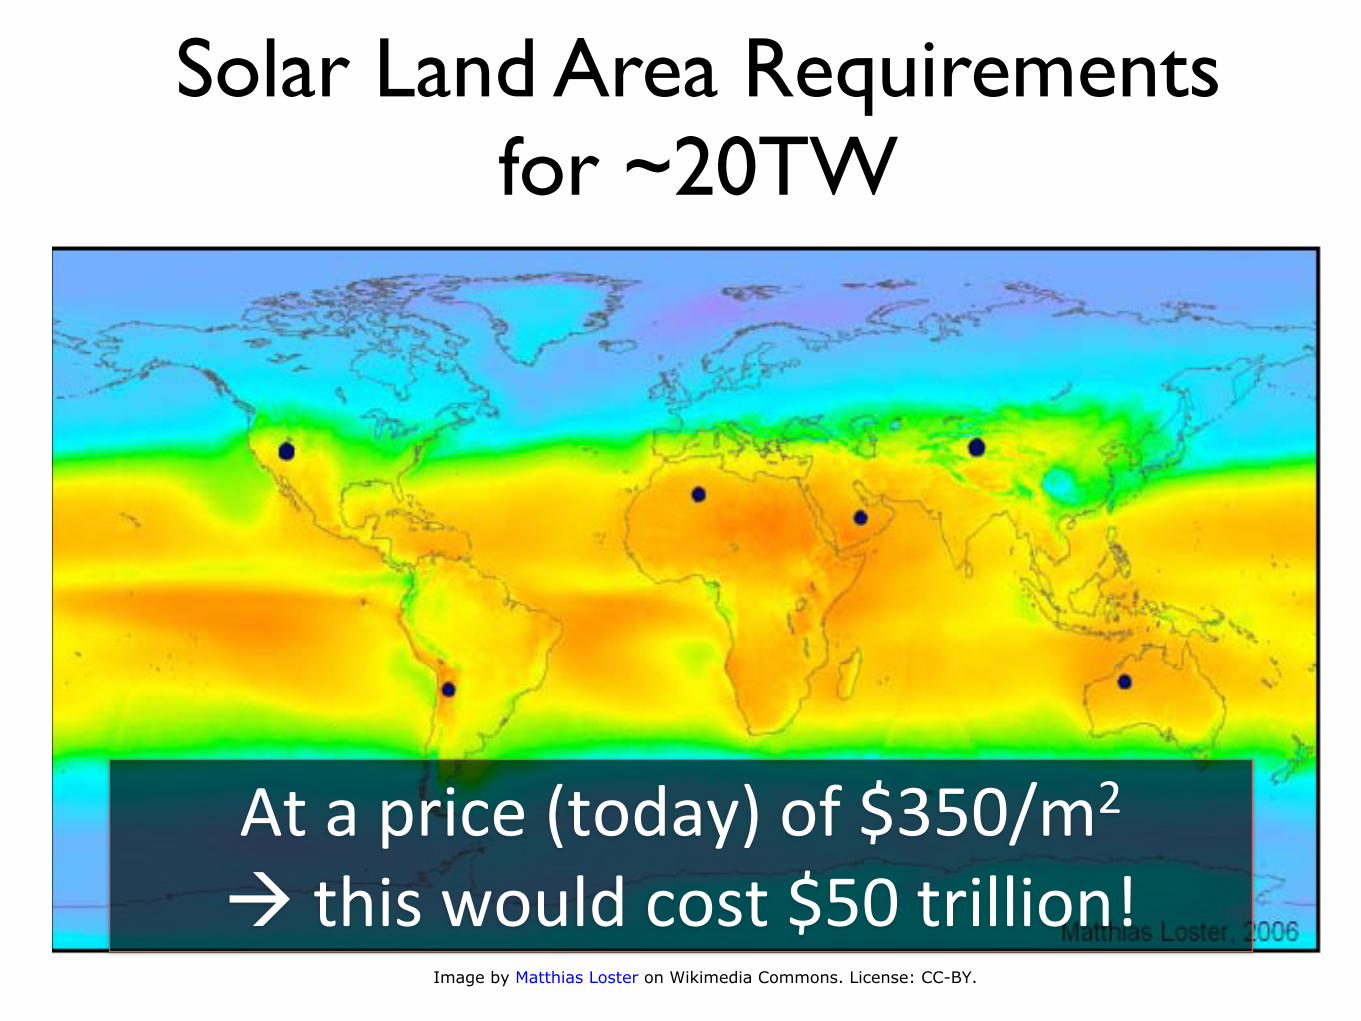
Solar Land Area Requirements for ~20TW
At a price (today) of $350/m2
à this would cost $50 trillion!Image by Matthias Loster on Wikimedia Commons. License: CC-BY.
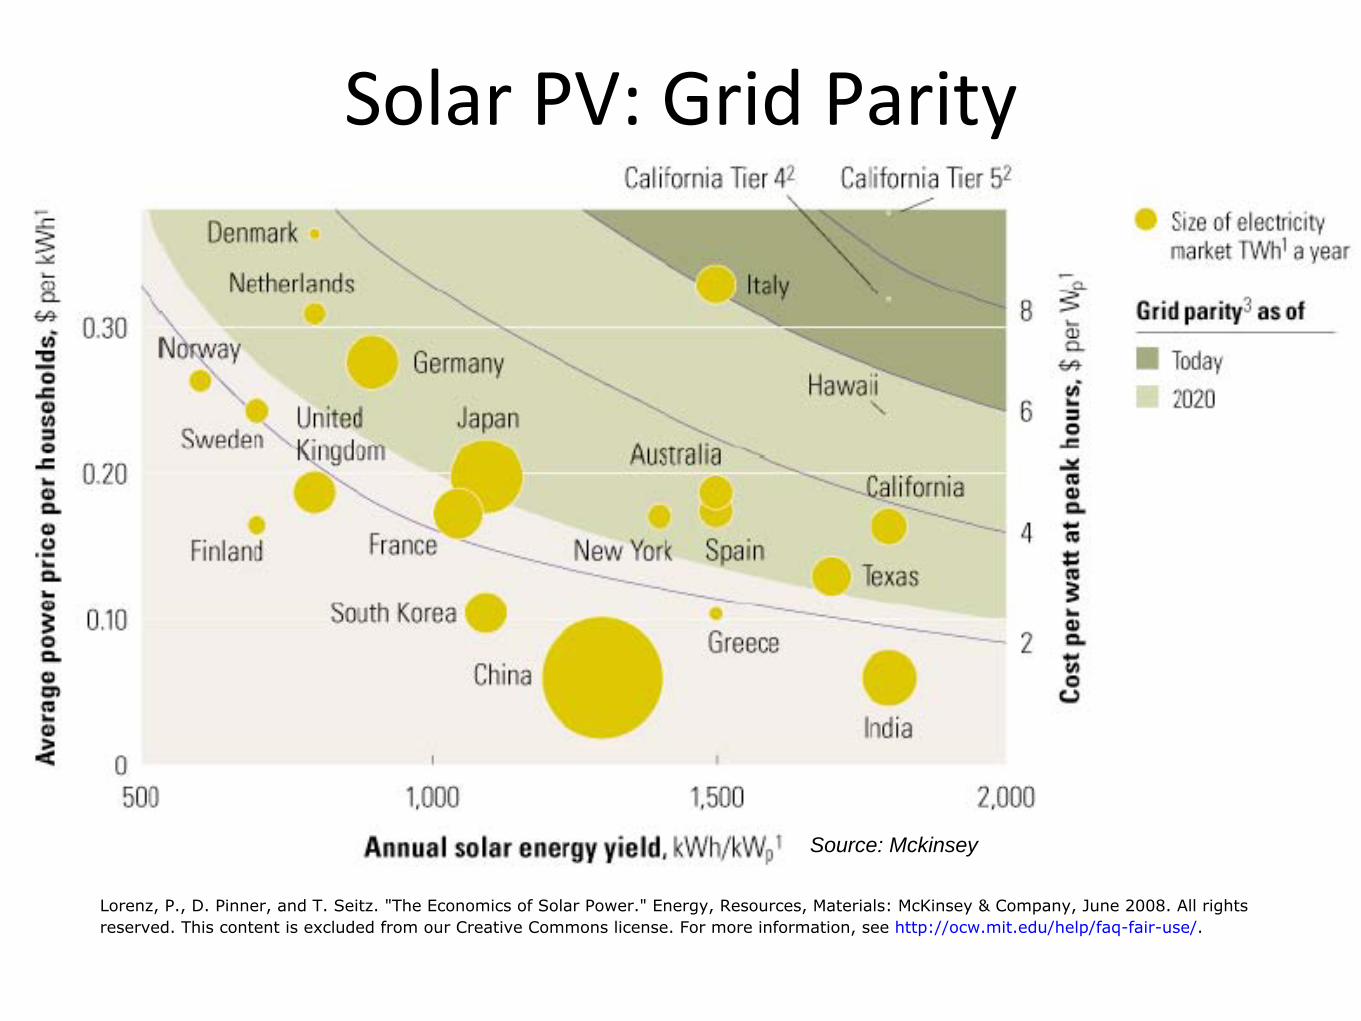
Solar PV: Grid Parity
Source: Mckinsey
Lorenz, P., D. Pinner, and T. Seitz. "The Economics of Solar Power." Energy, Resources, Materials: McKinsey & Company, June 2008. All rightsreserved. This content is excluded from our Creative Commons license. For more information, see http://ocw.mit.edu/help/faq-fair-use/.
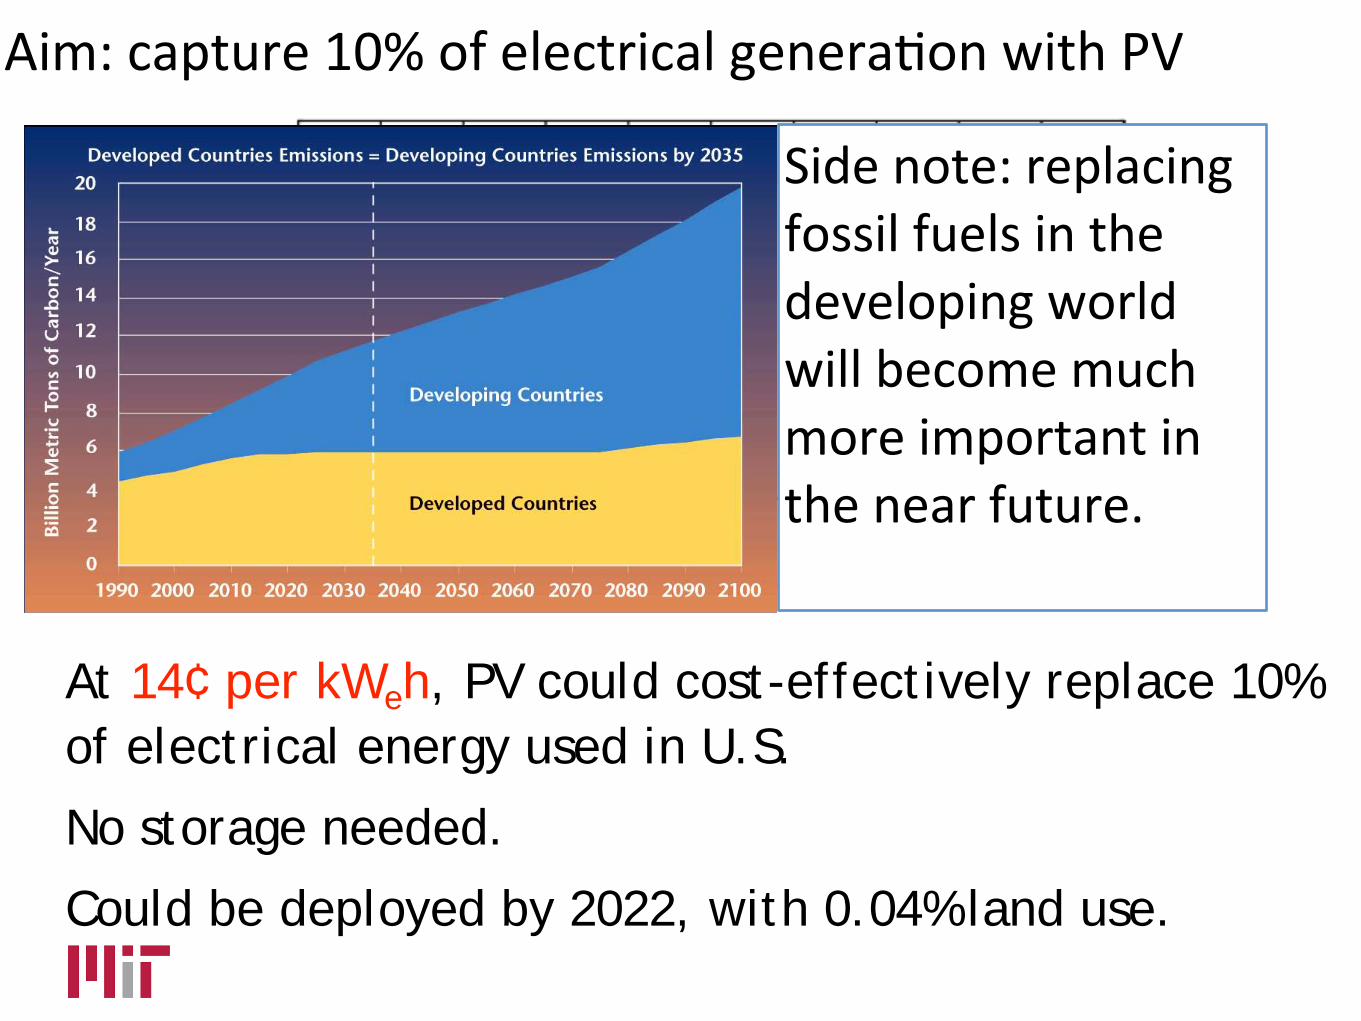
Aim: capture 10% of electrical genera;on with PV
14¢
Side note: replacing fossil fuels in the developing world will become much more important in the near future.
At 14¢ per kWeh, PV could cost-effectively replace 10% of electrical energy used in U.S.
No storage needed.
Could be deployed by 2022, with 0.04% land use.
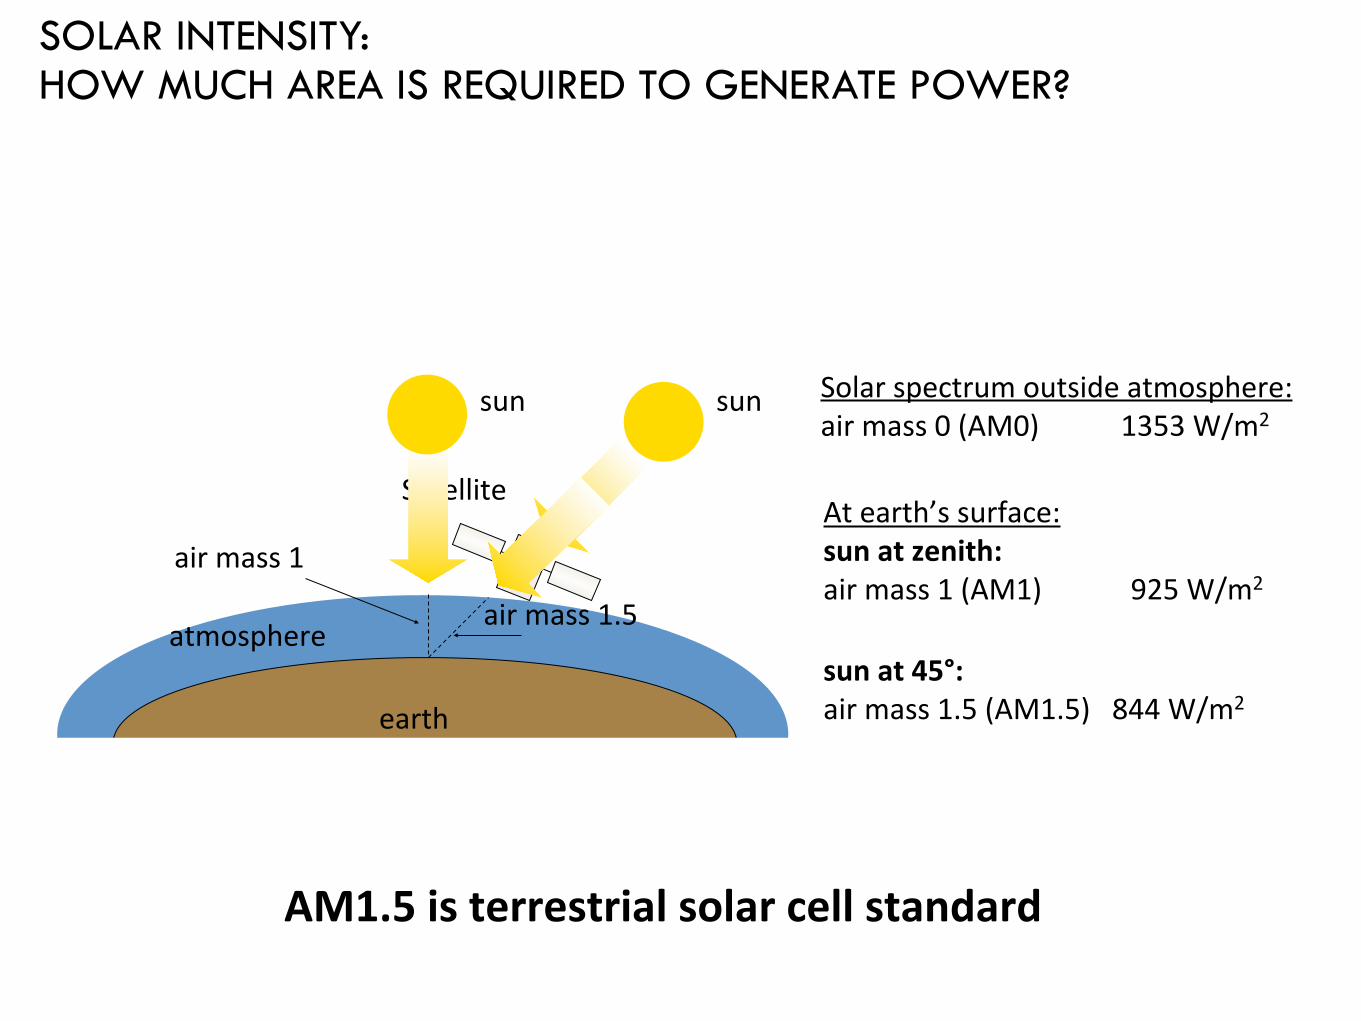
SOLAR INTENSITY: HOW MUCH AREA IS REQUIRED TO GENERATE POWER?
earth
sun
Satellite
atmosphere
sun
air mass 1
air mass 1.5
Solar spectrum outside atmosphere:air mass 0 (AM0) 1353 W/m 2
At earth’s surface: sun at zenith: air mass 1 (AM1) 925 W/m2
sun at 45°: air mass 1.5 (AM1.5) 844 W/m2
AM1.5 is terrestrial solar cell standard
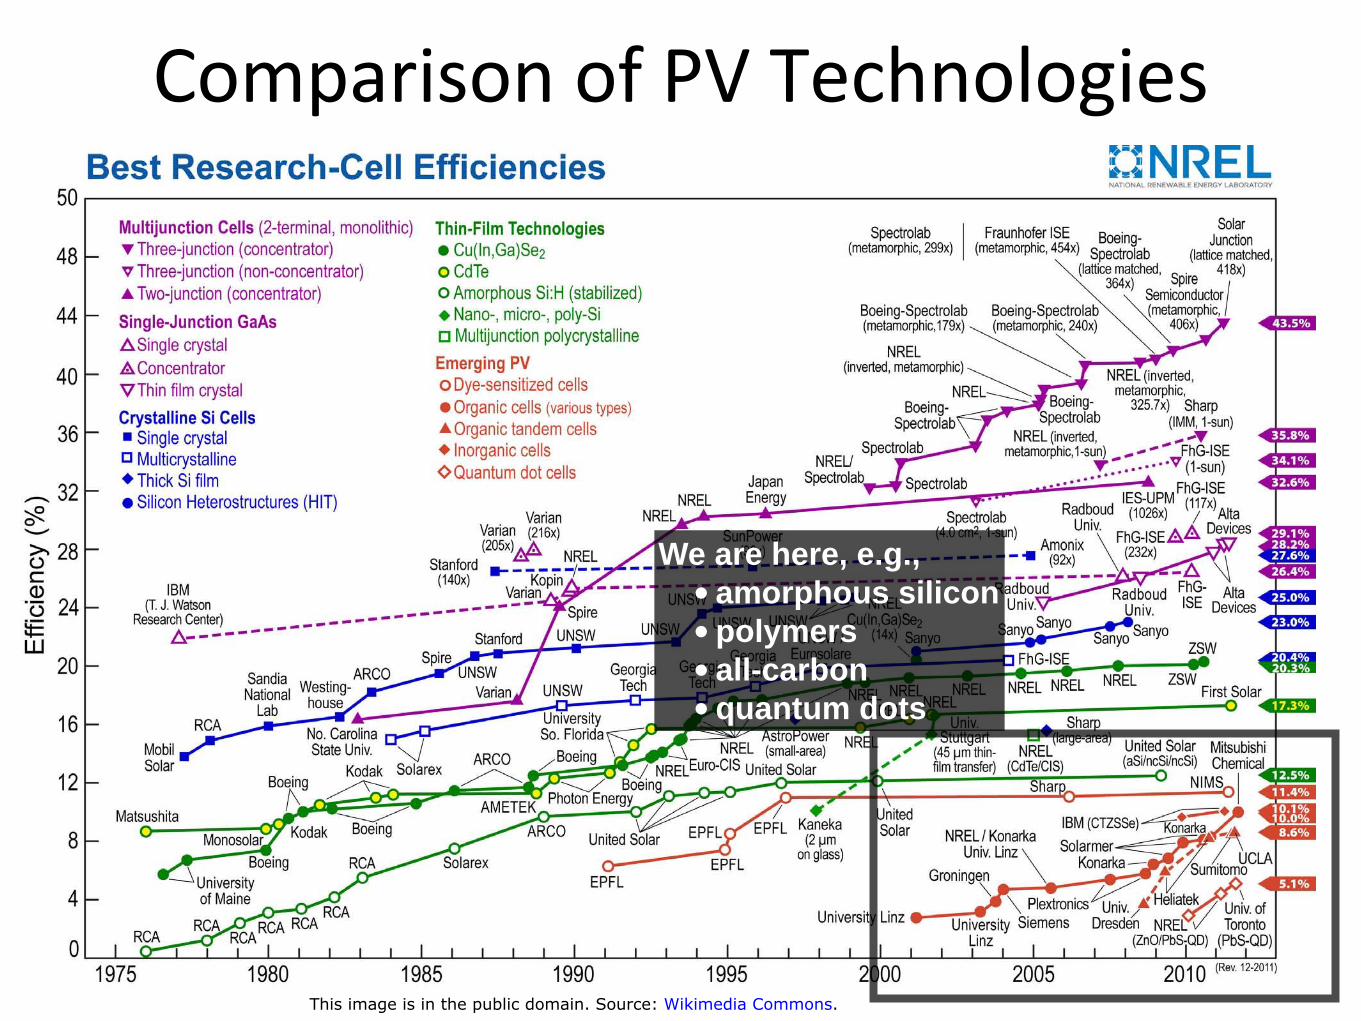
Comparison of PV Technologies
We are here, e.g.,• amorphous silicon• polymers• all-carbon• quantum dots
This image is in the public domain. Source: Wikimedia Commons.
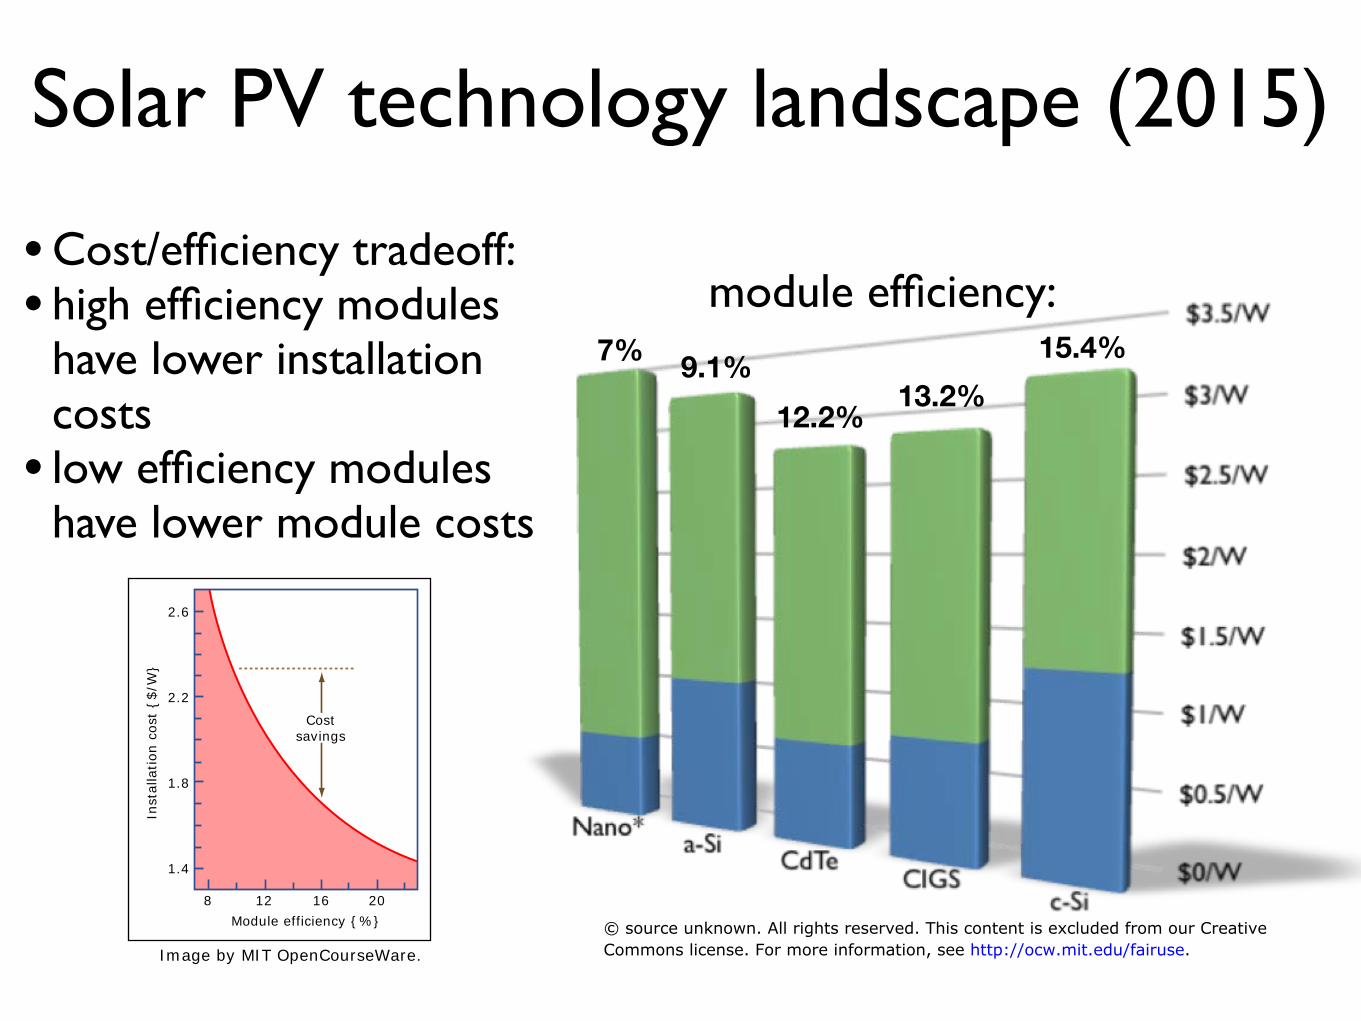
Solar PV technology landscape (2015)
• Cost/efficiency tradeoff:• high efficiency modules module efficiency:
have lower installation costs
• low efficiency modules have lower module costs
9.1% 7%
12.2% 13.2%
15.4%
© source unknown. All rights reserved. This content is excluded from our CreativeCommons license. For more information, see http://ocw.mit.edu/fairuse.
2.6
2.2
1.8
1.4
8 12 16 20
Inst
alla
tion c
ost
{$/W
}
Module efficiency {%}
Costsavings
Image by MIT OpenCourseWare.
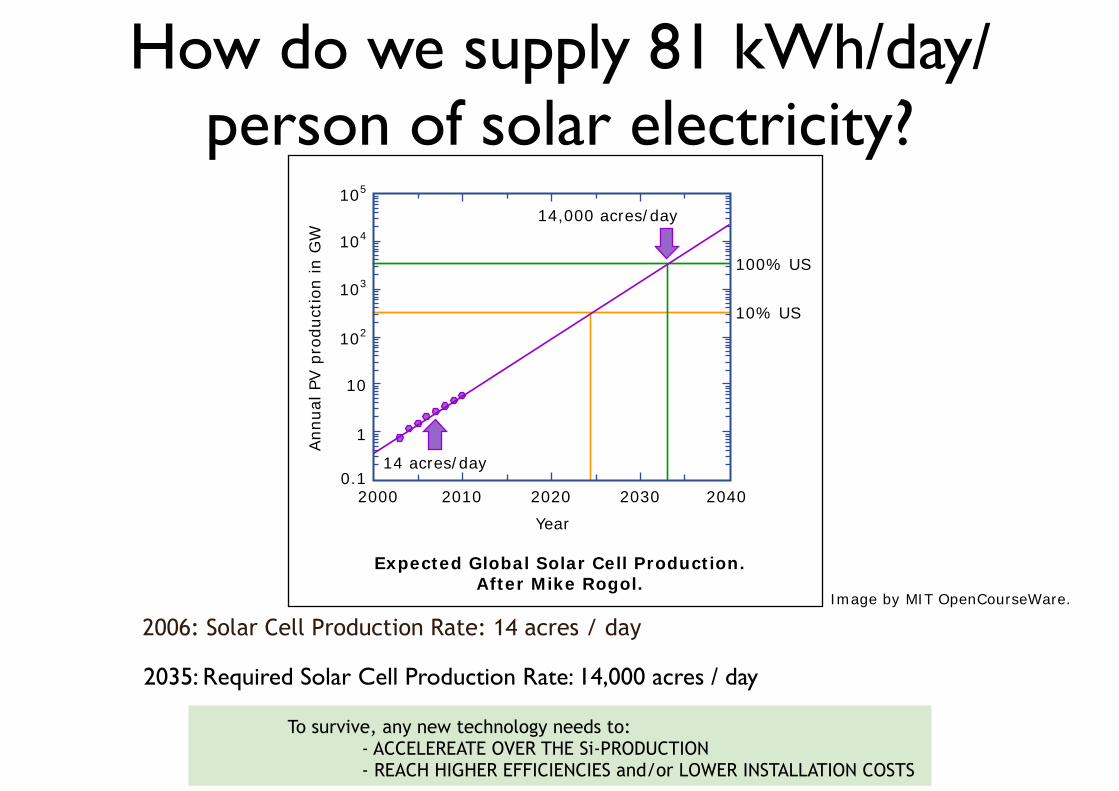
How do we supply 81 kWh/day/
2006: Solar Cell Production Rate: 14 acres / day
person of solar electricity?
2000 2010 2020 2030 2040
105
104
103
102
10
1
0.1
Annual
PV p
roduct
ion in G
W
Expected Global Solar Cell Production.After Mike Rogol.
Year
100% US
10% US
14,000 acres/day
14 acres/day
Image by MIT OpenCourseWare.
2035: Required Solar Cell Production Rate: 14,000 acres / day
To survive, any new technology needs to: - ACCELEREATE OVER THE Si-PRODUCTION - REACH HIGHER EFFICIENCIES and/or LOWER INSTALLATION COSTS
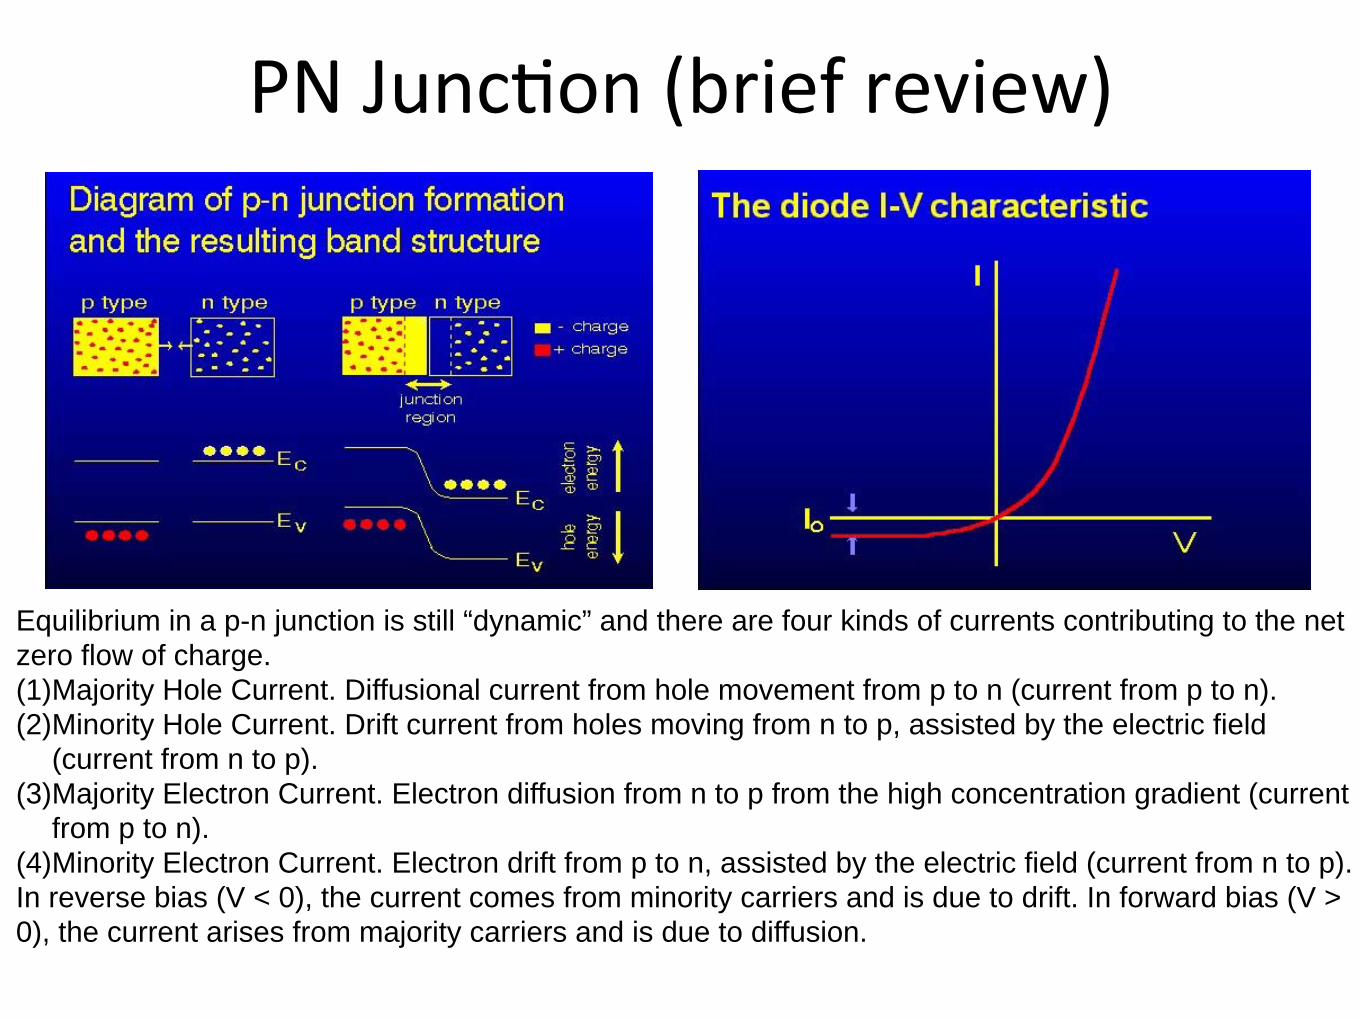
PN Junc;on (brief review)
Equilibrium in a p-n junction is still “dynamic” and there are four kinds of currents contributing to the net zero flow of charge. (1)Majority Hole Current. Diffusional current from hole movement from p to n (current from p to n).(2)Minority Hole Current. Drift current from holes moving from n to p, assisted by the electric field
(current from n to p).(3)Majority Electron Current. Electron diffusion from n to p from the high concentration gradient (current
from p to n).(4)Minority Electron Current. Electron drift from p to n, assisted by the electric field (current from n to p).In reverse bias (V < 0), the current comes from minority carriers and is due to drift. In forward bias (V > 0), the current arises from majority carriers and is due to diffusion.
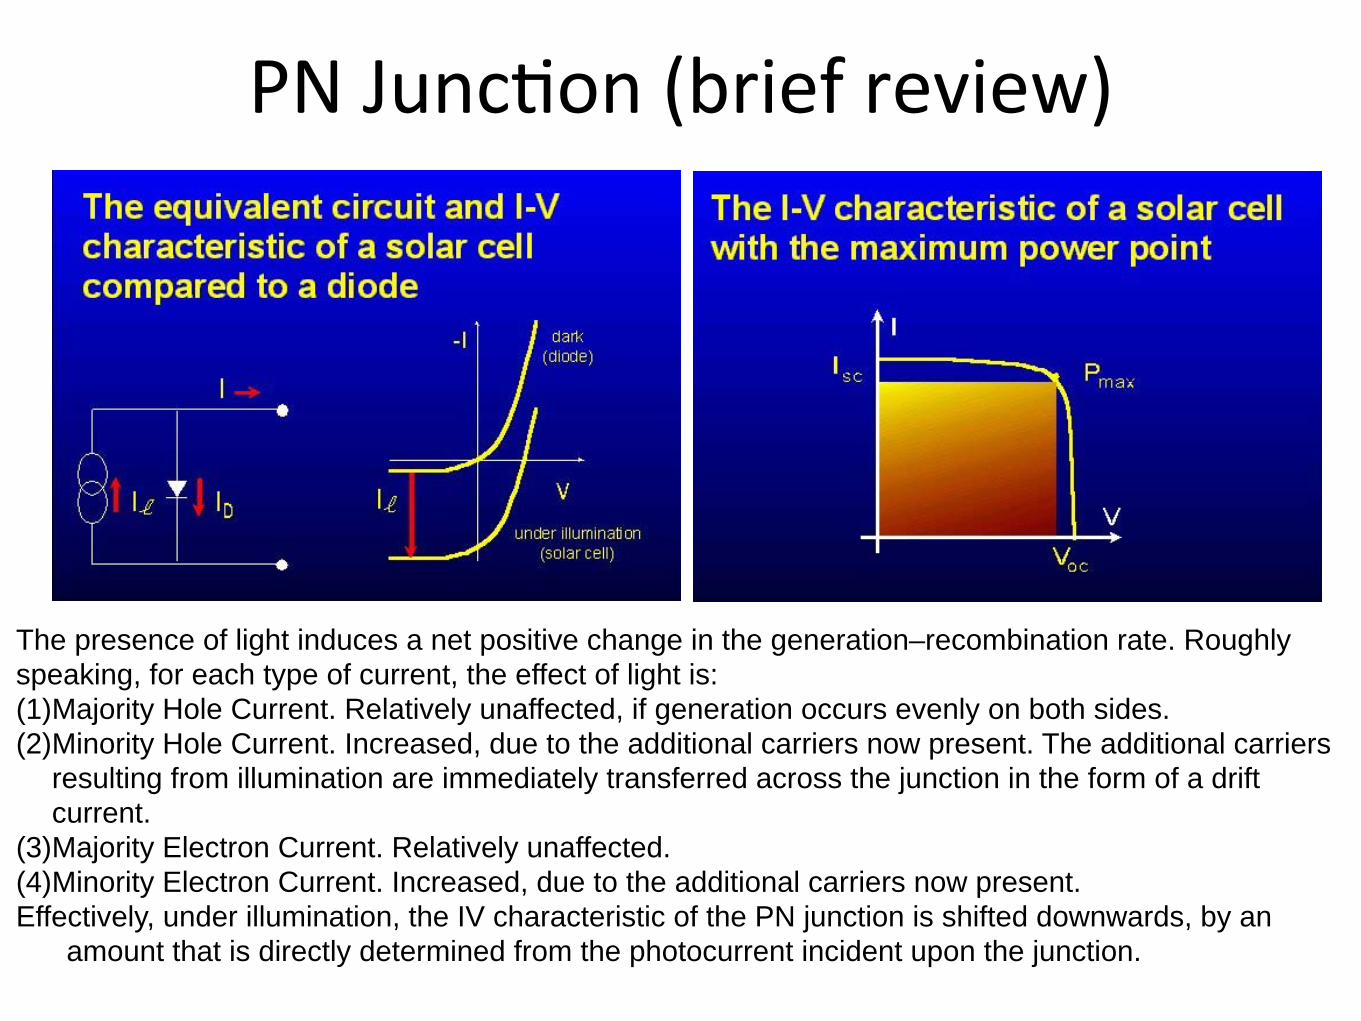
PN Junc;on (brief review)
The presence of light induces a net positive change in the generation–recombination rate. Roughly speaking, for each type of current, the effect of light is:(1)Majority Hole Current. Relatively unaffected, if generation occurs evenly on both sides.(2)Minority Hole Current. Increased, due to the additional carriers now present. The additional carriers
resulting from illumination are immediately transferred across the junction in the form of a drift current.
(3)Majority Electron Current. Relatively unaffected. (4)Minority Electron Current. Increased, due to the additional carriers now present. Effectively, under illumination, the IV characteristic of the PN junction is shifted downwards, by an
amount that is directly determined from the photocurrent incident upon the junction.
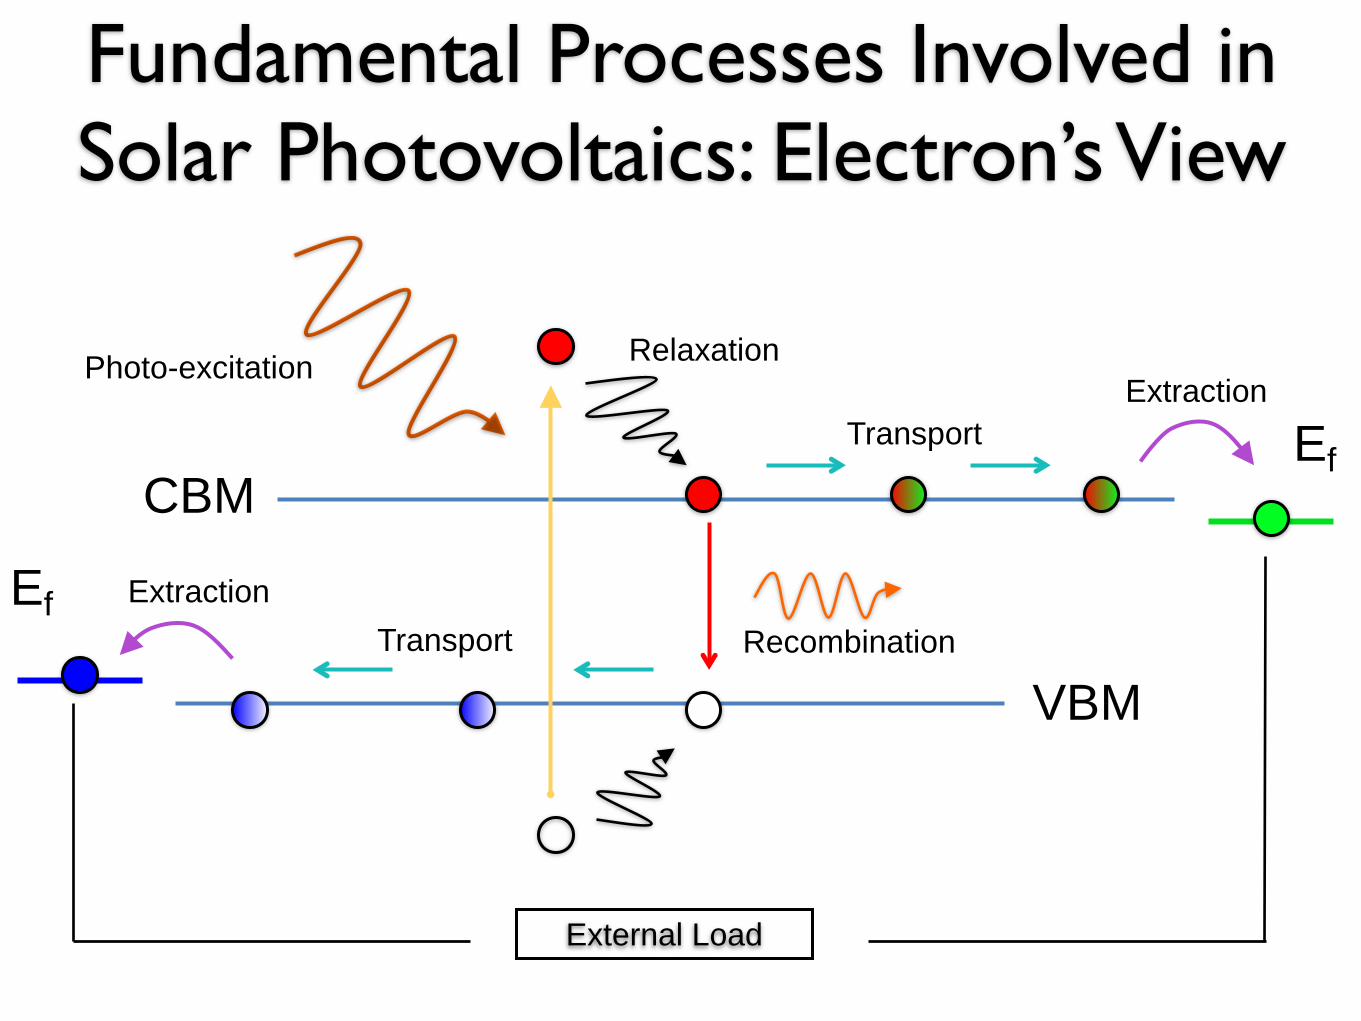
External Load
Ef
Ef
CBM
VBM
Photo-excitation Relaxation
Transport
Transport Recombination
Extraction
Extraction
Fundamental Processes Involved in Solar Photovoltaics: Electron’s View
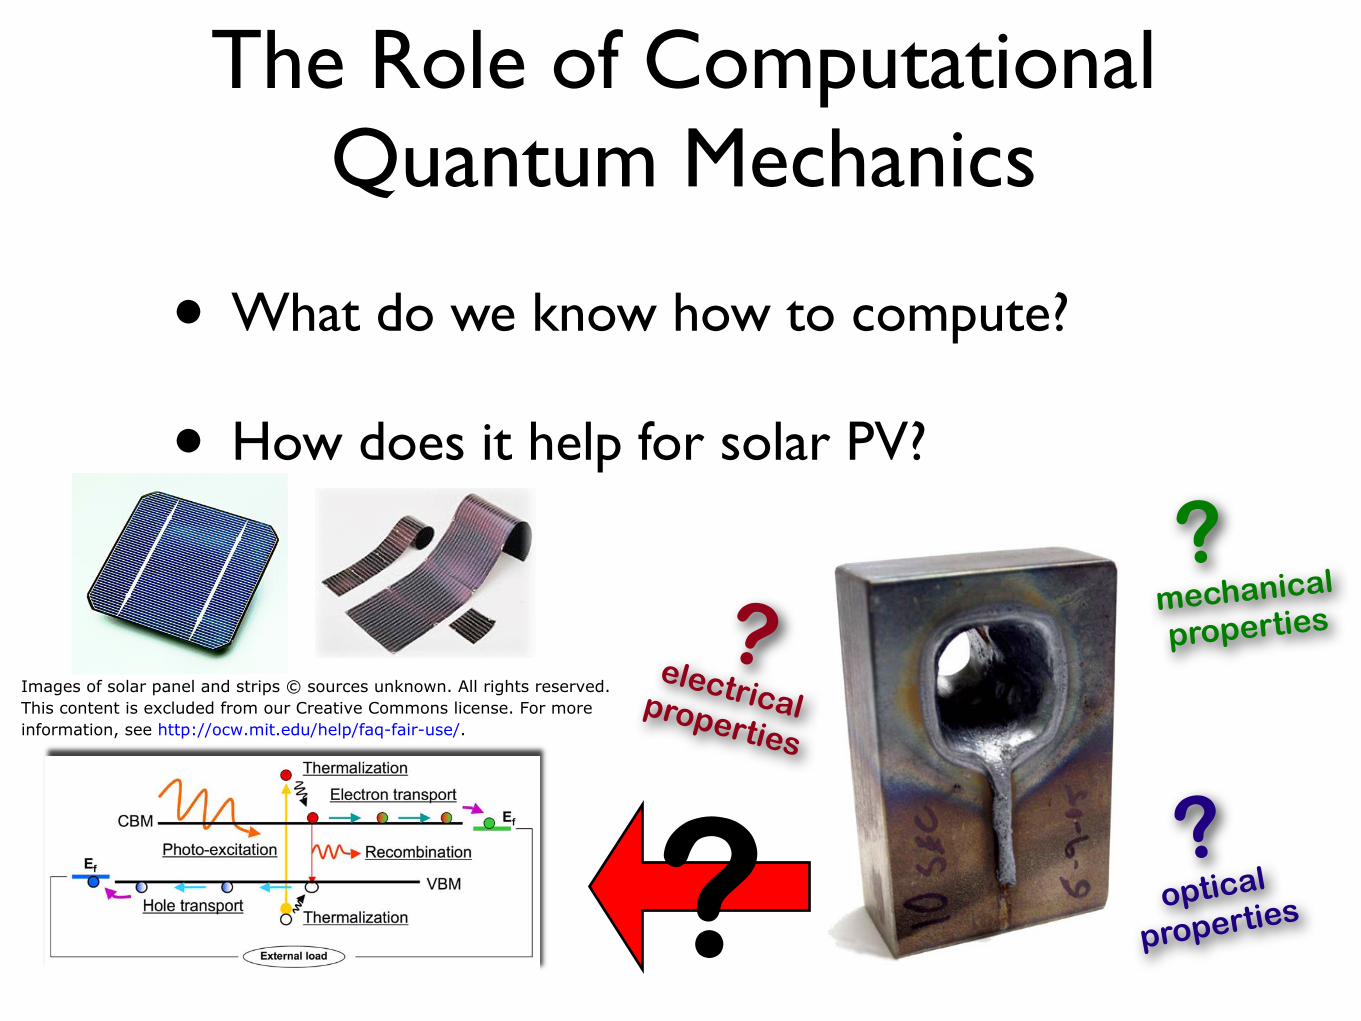
• What do we know how to compute?
• How does it help for solar PV?
The Role of Computational Quantum Mechanics
??
?
mechanical
properties
electricalproperties
optical
properties?
Images of solar panel and strips © sources unknown. All rights reserved.This content is excluded from our Creative Commons license. For moreinformation, see http://ocw.mit.edu/help/faq-fair-use/.
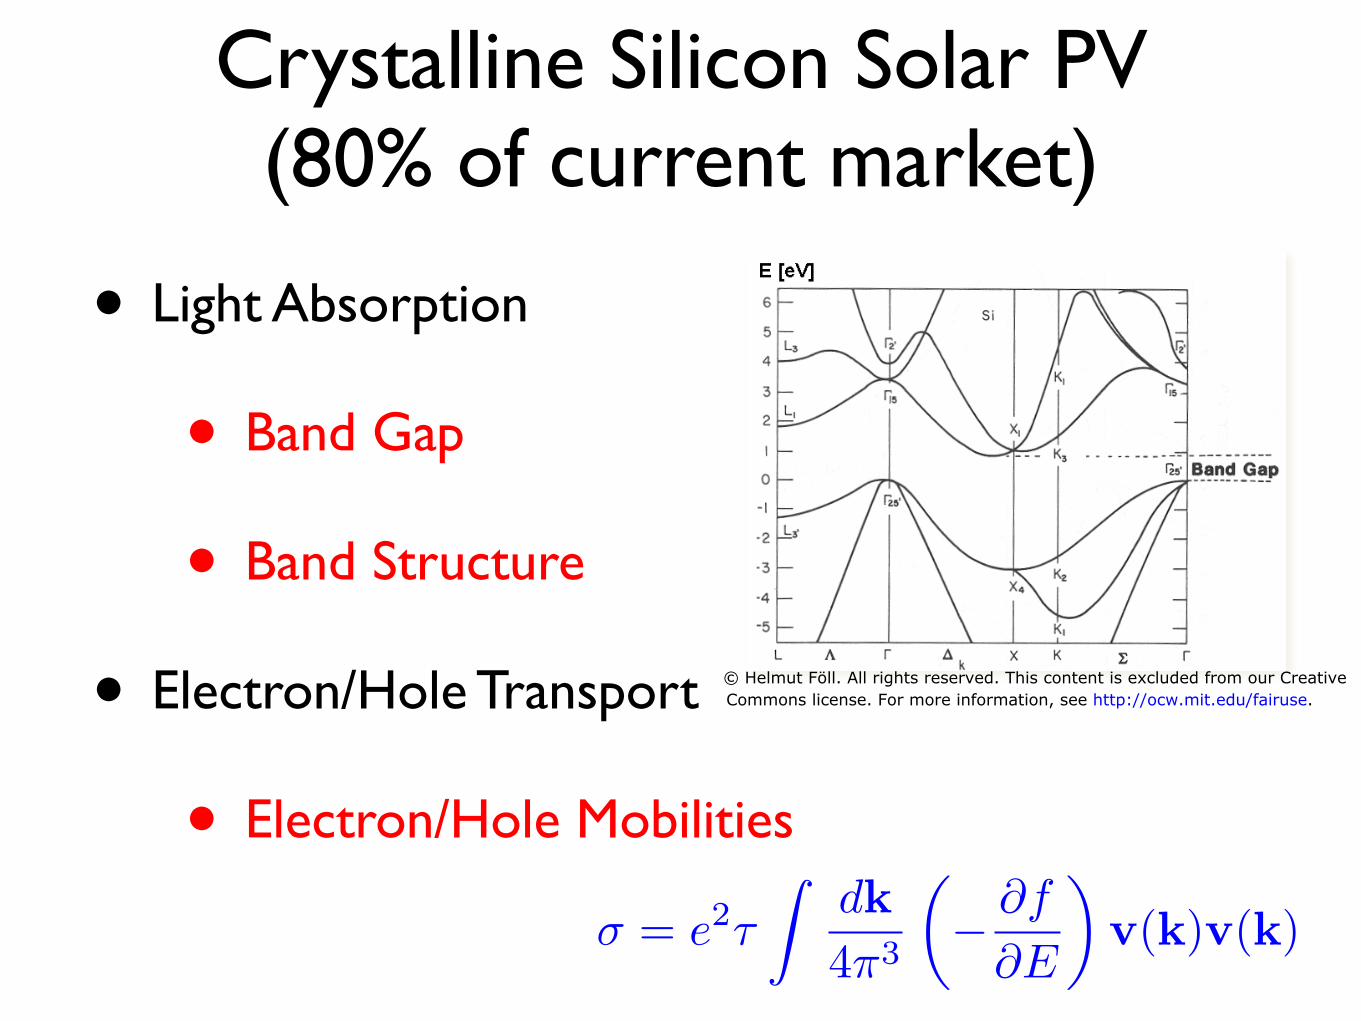
• Light Absorption
• Band Gap
• Band Structure
• Electron/Hole Transport
• Electron/Hole Mobilities
Crystalline Silicon Solar PV(80% of current market)
�d
= e2�
�k
4�3
��f��E
�v(k)v(k)
© Helmut Föll. All rights reserved. This content is excluded from our CreativeCommons license. For more information, see http://ocw.mit.edu/fairuse.
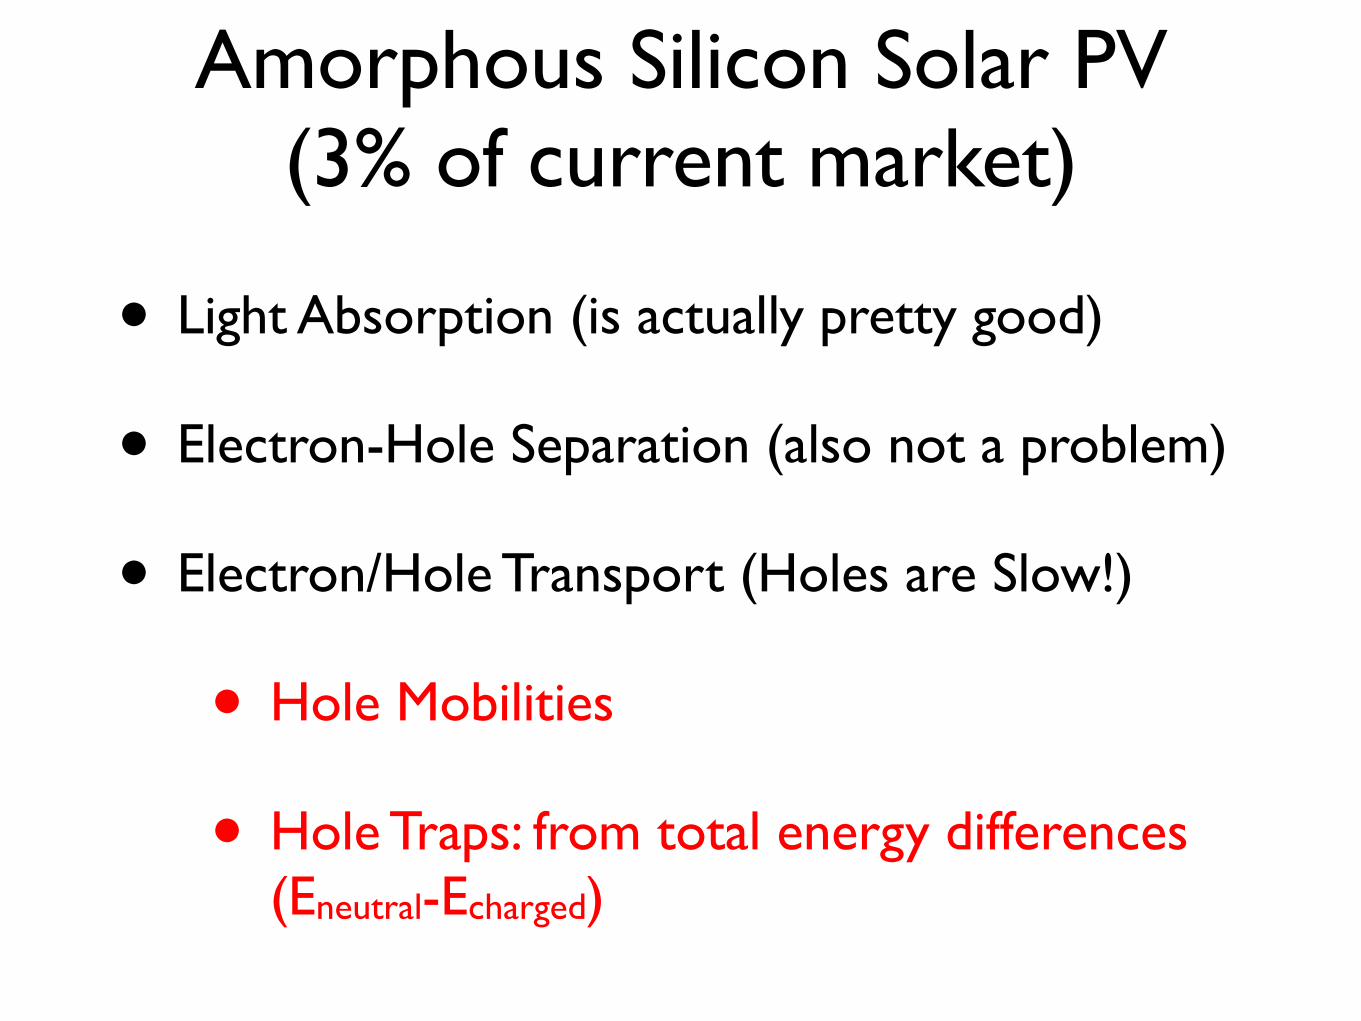
• Light Absorption (is actually pretty good)
• Electron-Hole Separation (also not a problem)
• Electron/Hole Transport (Holes are Slow!)
• Hole Mobilities
• Hole Traps: from total energy differences (Eneutral-Echarged)
Amorphous Silicon Solar PV(3% of current market)
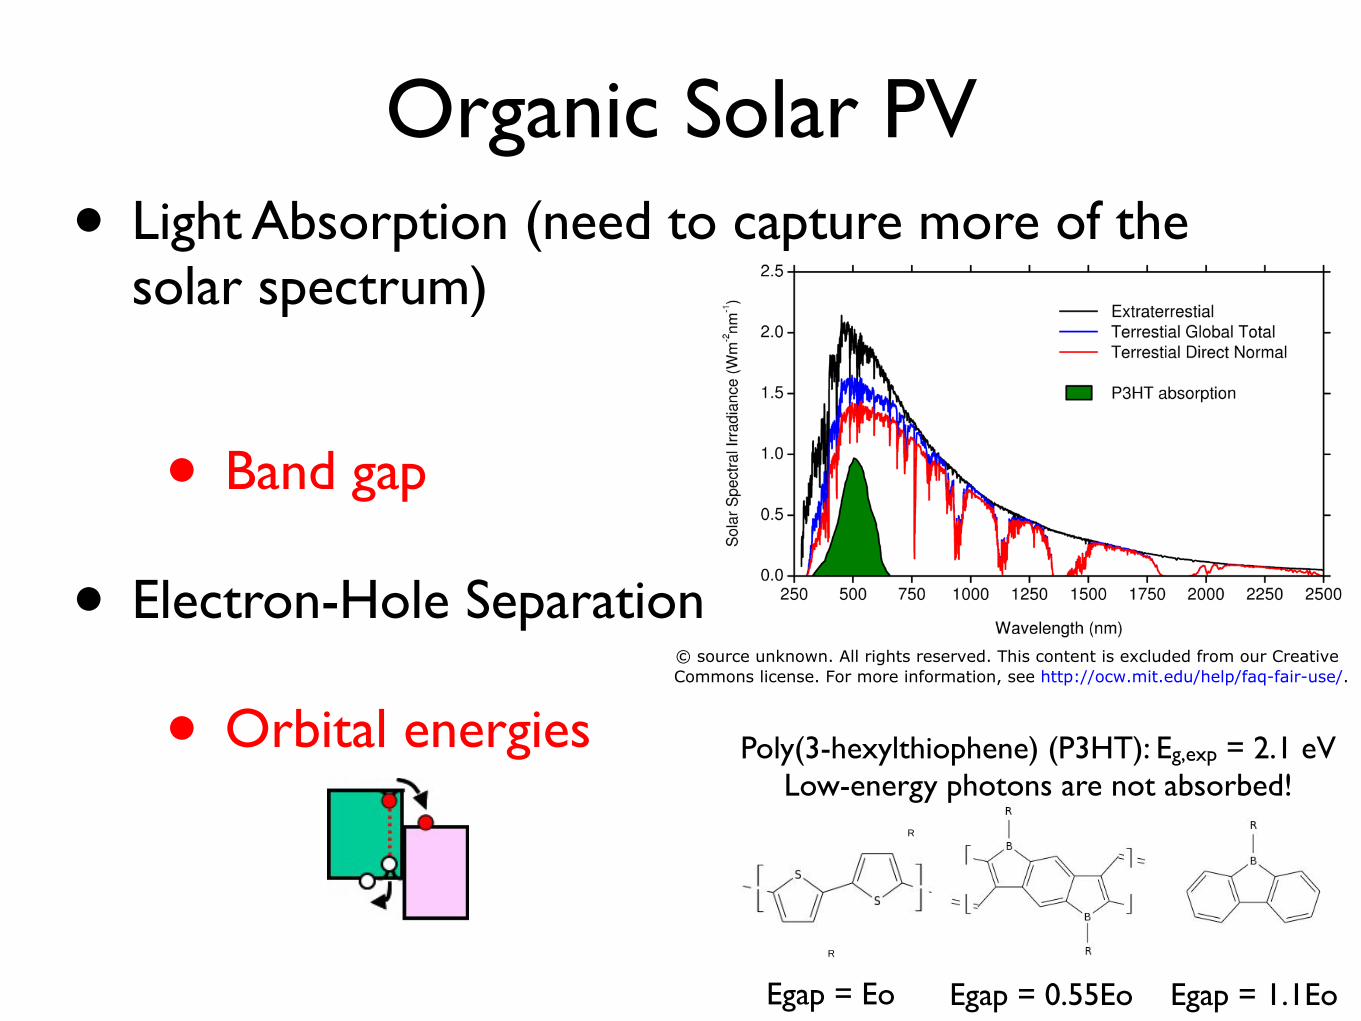
• Light Absorption (need to capture more of the solar spectrum)
• Band gap
• Electron-Hole Separation
• Orbital energies
Organic Solar PV
Poly(3-hexylthiophene) (P3HT): Eg,exp = 2.1 eVLow-energy photons are not absorbed!
R
R
Egap = Eo Egap = 0.55Eo Egap = 1.1Eo
© source unknown. All rights reserved. This content is excluded from our CreativeCommons license. For more information, see http://ocw.mit.edu/help/faq-fair-use/.
Dye Sensitized Solar PV
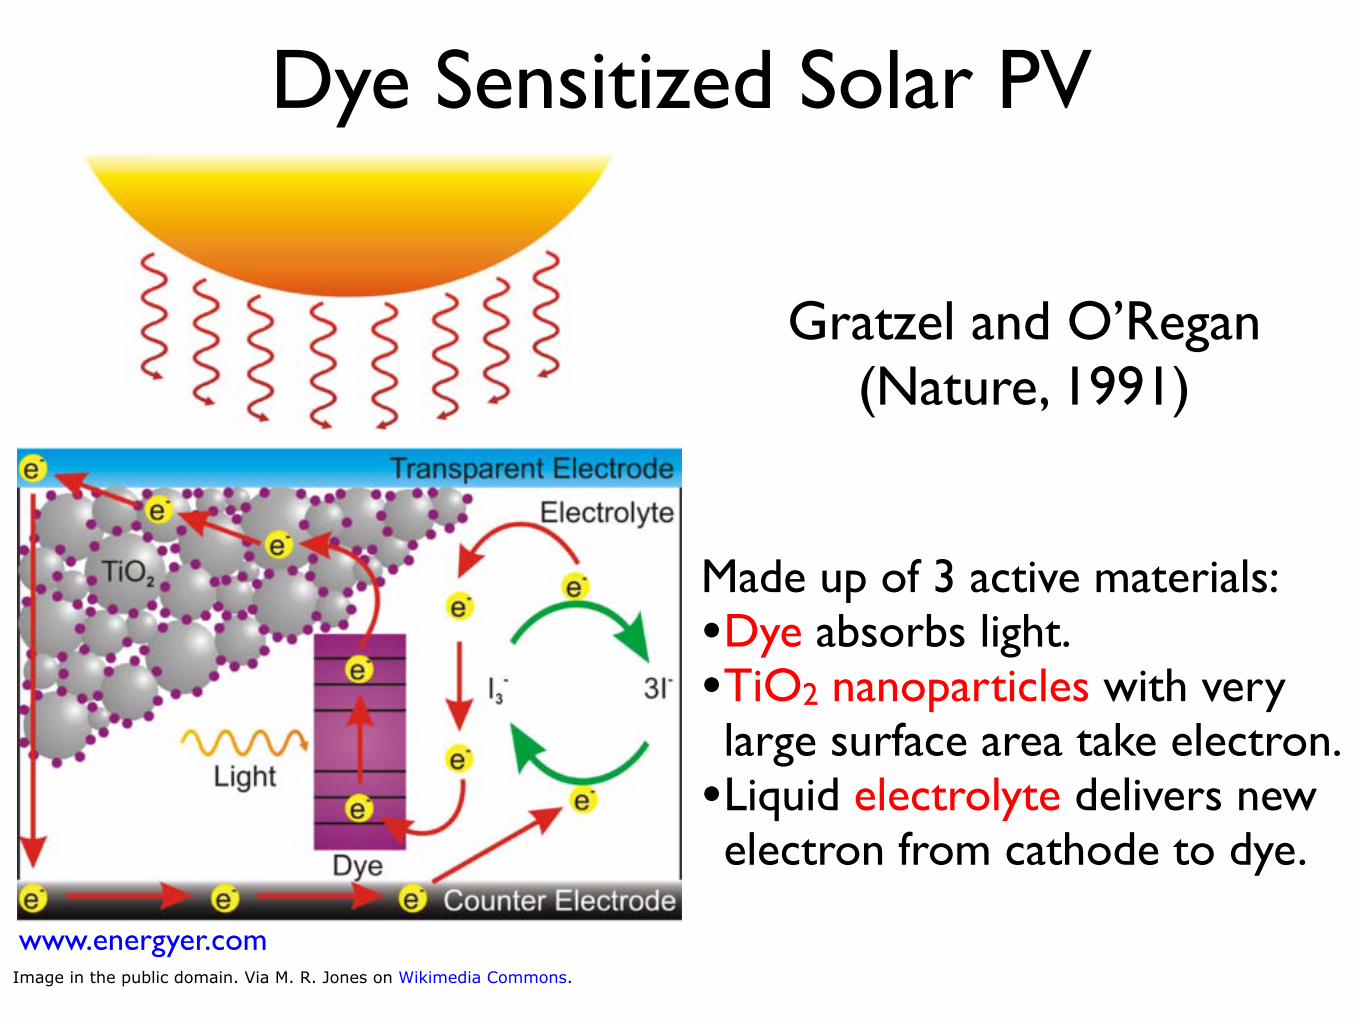
Gratzel and O’Regan (Nature, 1991)
Made up of 3 active materials: •Dye absorbs light.•TiO2 nanoparticles with very large surface area take electron.
•Liquid electrolyte delivers new electron from cathode to dye.
www.energyer.comImage in the public domain. Via M. R. Jones on Wikimedia Commons.
Dye Sensitized Solar PV
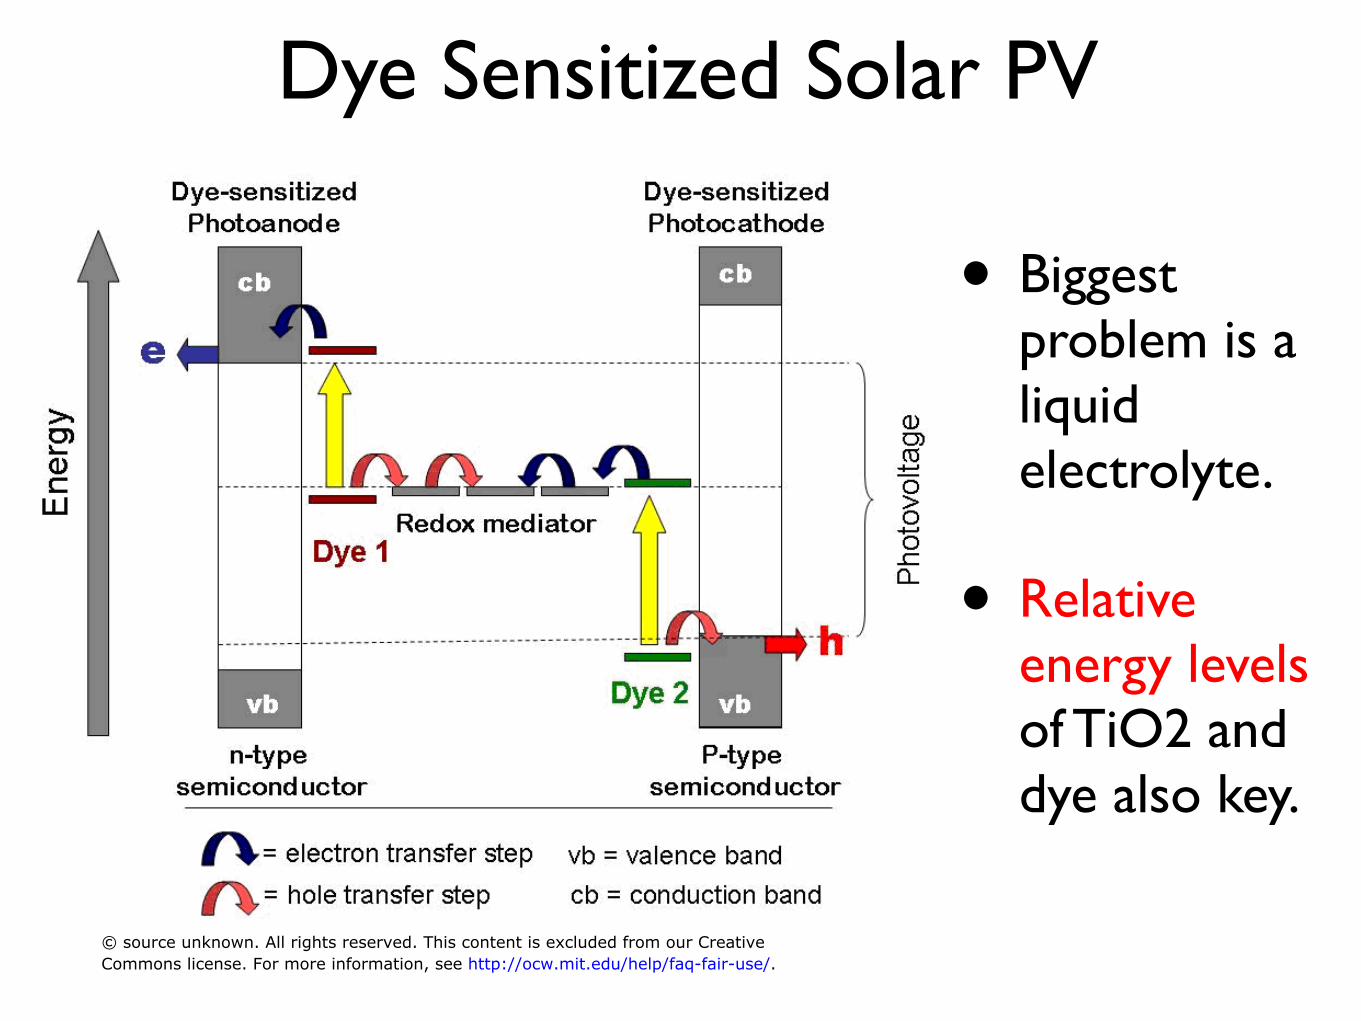
• Biggest problem is a liquid electrolyte.
• Relative energy levels of TiO2 and dye also key.
© source unknown. All rights reserved. This content is excluded from our CreativeCommons license. For more information, see http://ocw.mit.edu/help/faq-fair-use/.
• Energy is a Major Global Challenge
•The Sun has a Lot of it For Free but it’s Too Expensive to Utilize
•Computational Quantum Mechanics can Help us Understand and Predict PV New Materials
Summary

MIT OpenCourseWarehttp://ocw.mit.edu
3.021J / 1.021J / 10.333J / 18.361J / 22.00J Introduction to Modelling and SimulationSpring 2012 For information about citing these materials or our Terms of Use, visit: http://ocw.mit.edu/terms.


