PART II -...
61
46 | NBR Item 5 Market for Registrant’s Common Equity, Related Shareholder Matters and Issuer Purchases of Equity Securities Stock Performance Graph The following graph illustrates comparisons of five-year cumulative total returns among Nabors Industries Ltd., the S&P 500 Index and the Dow Jones Oil Equipment and Services Index. Total return assumes $100 invested on December 31, 2001 in shares of Nabors Industries Ltd., the S&P 500 Index, and the Dow Jones Oil Equipment and Services Index. It also assumes reinvestment of dividends and is calculated at the end of each calendar year, December 31, 2002 to December 31, 2006. PART II Nabors Industries Ltd. and Subsidiaries 2002 2003 2004 2005 2006 Nabors Industries Ltd. 103 121 149 221 173 S&P 500 Index 78 100 111 117 135 Dow Jones Oil Equipment and Services Index 92 106 143 217 246 300 250 200 150 100 50 0 Dec 01 Dec 02 Dec 03 Dec 04 Dec 05 Dec 06 Nabors Industries Ltd. S&P 500 Index Dow Jones Oil Equipment and Services Index $246 $173 $135
Transcript of PART II -...
46 | NBR
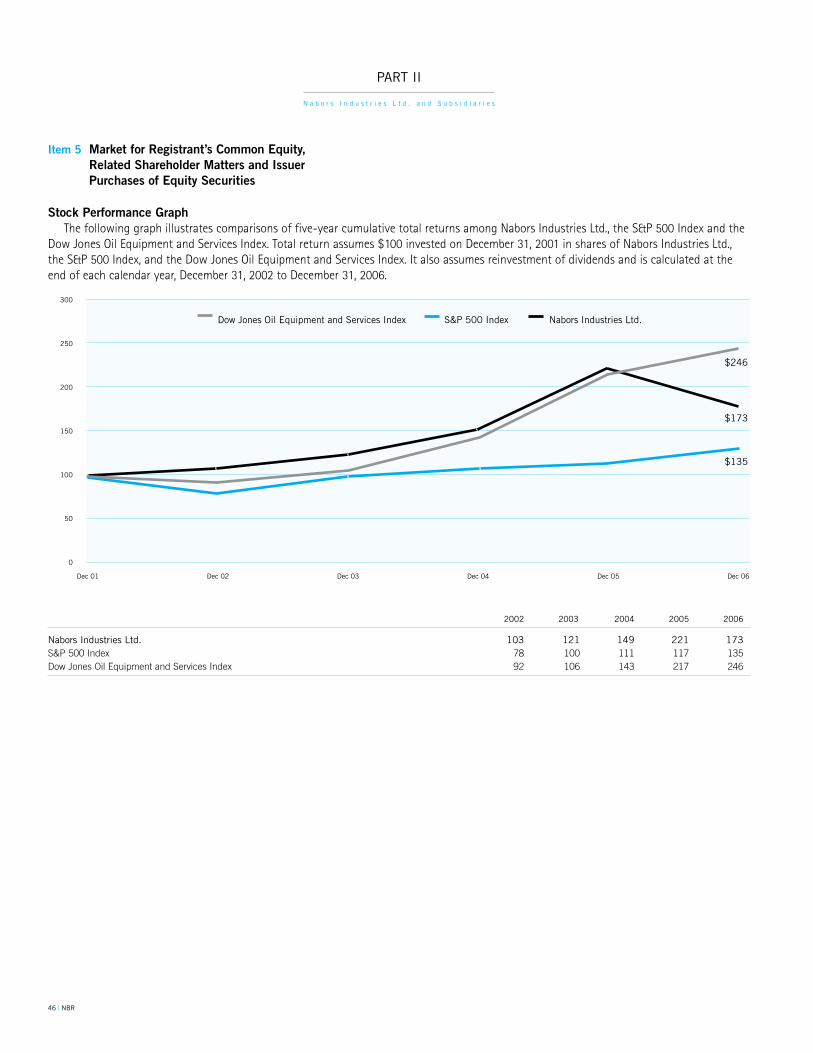
Item 5 Market for Registrant’s Common Equity, Related Shareholder Matters and Issuer Purchases of Equity Securities
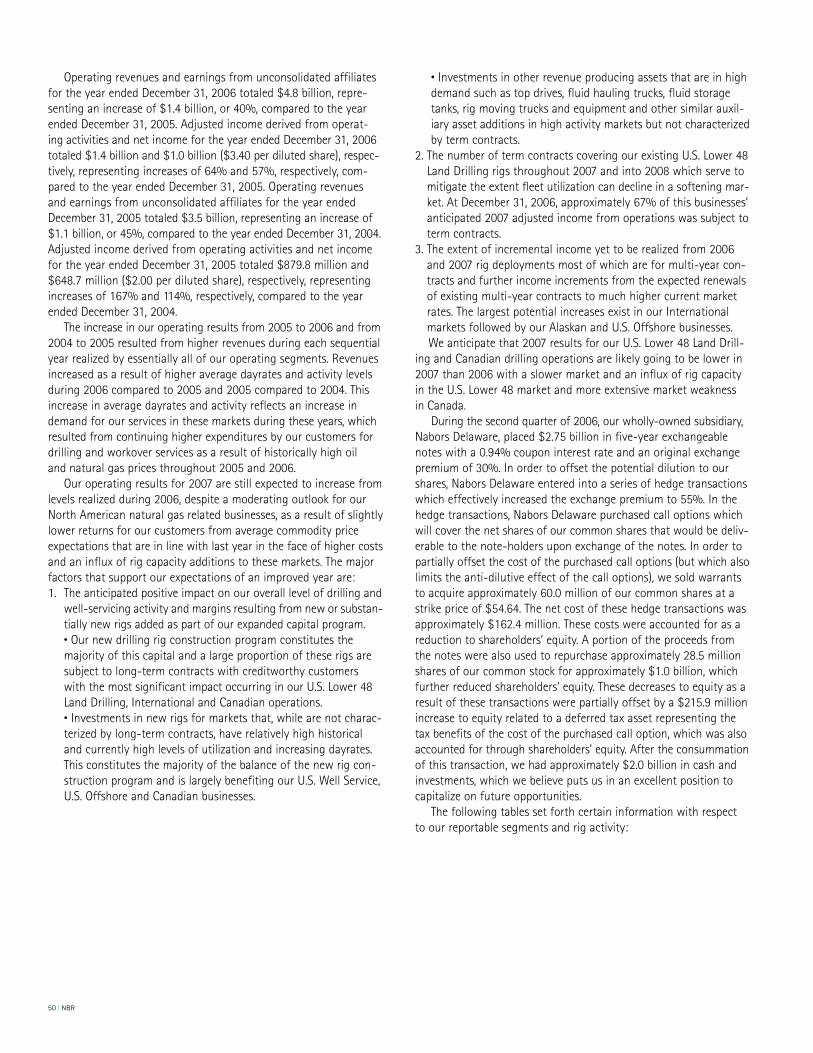
Stock Performance GraphThe following graph illustrates comparisons of five-year cumulative total returns among Nabors Industries Ltd., the S&P 500 Index and the
Dow Jones Oil Equipment and Services Index. Total return assumes $100 invested on December 31, 2001 in shares of Nabors Industries Ltd., the S&P 500 Index, and the Dow Jones Oil Equipment and Services Index. It also assumes reinvestment of dividends and is calculated at the end of each calendar year, December 31, 2002 to December 31, 2006.
PART II
N a b o r s I n d u s t r i e s L t d . a n d S u b s i d i a r i e s
2002 2003 2004 2005 2006
Nabors Industries Ltd. 103 121 149 221 173 S&P 500 Index 78 100 111 117 135 Dow Jones Oil Equipment and Services Index 92 106 143 217 246
300
250
200
150
100
50
0
Dec 01 Dec 02 Dec 03 Dec 04 Dec 05 Dec 06
Nabors Industries Ltd.S&P 500 IndexDow Jones Oil Equipment and Services Index
$246
$173
$135
NBR | 47
No common shares were repurchased during November or December 2006.
See Part III, Item 12. for a description of securities authorized or issuance under equity compensation plans.
II. Dividend PolicySee Part I – Item 1A – Risk Factors – We do not currently
intend to pay dividends.
III. Shareholder Matters Bermuda has exchange controls which apply to residents in
respect of the Bermudian dollar. As an exempt company, Nabors is considered to be nonresident for such controls; consequently, there are no Bermuda governmental restrictions on the Company’s ability to make transfers and carry out transactions in all other currencies, including currency of the United States.
There is no reciprocal tax treaty between Bermuda and the United States regarding withholding taxes. Under existing Bermuda law, there is no Bermuda income or withholding tax on dividends, if any, paid by Nabors to its shareholders. Furthermore, no Bermuda tax or other levy is payable on the sale or other transfer (including by gift or on the death of the shareholder) of Nabors common shares (other than by shareholders resident in Bermuda).
Total Number of Shares Approximate Dollar Value Purchased as Part of Shares that May Yet Period Total Number of Average Price of Publicly Announced Be Purchased Under the Shares Purchased Paid per Share Plans or Programs Plans or Programs(1)
(In thousands, except per share prices) October 1 – October 31, 2006 99 $ 29.44 99 $ 406,300
(1) In July 2006 our Board of Directors authorized a share repurchase program under which we may repurchase up to $500 million of our common shares in the open market or in privately negotiated transactions. This program supersedes and cancels our previous share repurchase program. Through December 31, 2006, approximately $93.7 million of our common shares had been repurchased under this program. As of December 31, 2006, we had $406.3 million of shares that still may be purchased under the July 2006 share repurchase program.
The following table provides information relating to Nabors’ repurchase of common shares during the fourth quarter of 2006:
I. Market and Share PricesOur common shares are traded on the New York Stock Exchange
under the symbol “NBR”. At December 31, 2006, there were approxi-mately 2,015 shareholders of record. We have not paid any cash dividends on our common shares since 1982. Nabors does not currently intend to pay any cash dividends on its common shares. However, we note that there have been recent positive industry trends and changes in tax law providing more favorable treatment of dividends. As a result, we can give no assurance that we will not reevaluate our position on dividends in the future.
On December 13, 2005, our Board of Directors approved a two-for-one stock split of our common shares to be effectuated in the form of a stock dividend. The stock dividend was distributed on April 17, 2006 to shareholders of record on March 31, 2006. For all balance sheets presented, capital in excess of par value was red-uced by $.2 million and common shares were increased by $.2 million.
The following table sets forth the reported high and low sales prices of our common shares as reported on the American Stock Exchange (through November 2, 2005) and the New York Stock Exchange (from November 3, 2005 through December 31, 2006) for the periods indicated.
Share Price
Calendar Year high Low
2005 First quarter $ 30.21 $ 23.10 Second quarter 31.03 25.38 Third quarter 36.95 29.99 Fourth quarter 39.94 29.80
2006 First quarter 41.35 31.36 Second quarter 40.71 29.75 Third quarter 36.04 28.35 Fourth quarter 34.62 27.26
48 | NBR
Operating Data(1) Year Ended December 31,
(In thousands, except per share amounts and ratio data) 2006 2005 2004 2003 2002
Revenues and other income:
Operating revenues $ 4,820,162 $ 3,459,908 $ 2,394,031 $ 1,880,003 $ 1,466,443
Earnings from unconsolidated affiliates 20,545 5,671 4,057 10,183 14,775
Investment income 102,007 85,430 50,064 33,813 36,961
Total revenues and other income 4,942,714 3,551,009 2,448,152 1,923,999 1,518,179
Costs and other deductions:
Direct costs 2,569,800 1,997,267 1,572,649 1,276,953 973,910
General and administrative expenses 420,854 249,973 195,388 165,403 141,895
Depreciation and amortization 371,127 291,638 254,939 226,528 187,665
Depletion 38,580 46,894 45,460 8,599 7,700
Interest expense 46,561 44,847 48,507 70,740 67,068
Losses (gains) on sales of long-lived assets, impairment charges and other expense (income), net 24,873 46,440 (4,629) 1,153 (833)
Total costs and other deductions 3,471,795 2,677,059 2,112,314 1,749,376 1,377,405
Income before income taxes 1,470,919 873,950 335,838 174,623 140,774
Income tax expense (benefit) 450,183 225,255 33,381 (17,605) 19,285
Net income $ 1,020,736 $ 648,695 $ 302,457 $ 192,228 $ 121,489
Earnings per share: Basic $ 3.52 $ 2.08 $ 1.02 $ .66 $ .42 Diluted $ 3.40 $ 2.00 $ .96 $ .62 $ .40
Weighted-average number of common shares outstanding: Basic 290,241 312,134 297,872 292,989 287,310 Diluted 299,827 324,378 328,060 313,794 299,993
Capital expenditures and acquisitions of businesses(2) $ 1,997,971 $ 1,003,269 $ 544,429 $ 353,138 $ 702,843
Interest coverage ratio(3) 39.2 : 1 26.1 : 1 13.1 : 1 6.3 : 1 5.5 : 1
Item 6 Selected Financial Data
Balance Sheet Data(1) As of December 31,
(In thousands, except ratio data) 2006 2005 2004 2003 2002
Cash and cash equivalents, and short-term and long-term investments $ 1,653,285 $ 1,646,327 $ 1,411,047 $ 1,579,090 $ 1,345,799
Working capital 1,650,496 1,264,852 821,120 1,529,691 1,077,602
Property, plant and equipment, net 5,410,101 3,886,924 3,275,495 2,990,792 2,801,067
Total assets 9,142,303 7,230,407 5,862,609 5,602,692 5,063,872
Long-term debt 4,004,074 1,251,751 1,201,686 1,985,553 1,614,656
Shareholders’ equity $ 3,536,653 $ 3,758,140 $ 2,929,393 $ 2,490,275 $ 2,158,455
Funded debt to capital ratio: Gross(4) 0.50 : 1 0.32 : 1 0.38 : 1 0.45 : 1 0.46 : 1 Net (5) 0.37 : 1 0.08 : 1 0.15 : 1 0.20 : 1 0.23 : 1
(1) Our acquisitions’ results of operations and financial position have been included beginning on the respective dates of acquisition and include Pragma Drilling Equipment Ltd. assets (May 2006), 1183011 Alberta Ltd. (January 2006), Sunset Well Service, Inc. (August 2005), Alexander Drilling, Inc. assets (June 2005), Phillips Trucking, Inc. assets (June 2005), Rocky Mountain Oil Tools, Inc. assets (March 2005), Ryan Energy Technologies, Inc. (October 2002) and Enserco Energy Service Company Inc. (April 2002).
(2) Represents capital expenditures and the portion of the purchase price of acquisitions allocated to fixed assets and goodwill based on their fair market value.(3) The interest coverage ratio is computed by calculating the sum of income before income taxes, interest expense, depreciation and amortization, and depletion expense less investment income and
then dividing by interest expense. This ratio is a method for calculating the amount of operating cash flows available to cover interest expense.(4) The gross funded debt to capital ratio is calculated by dividing funded debt by funded debt plus deferred tax liabilities net of deferred tax assets plus capital. Funded debt is defined as the sum of
(1) short-term borrowings, (2) current portion of long-term debt and (3) long-term debt. Capital is defined as shareholders’ equity.(5) The net funded debt to capital ratio is calculated by dividing net funded debt by net funded debt plus deferred tax liabilities net of deferred tax assets plus capital. Net funded debt is defined as
the sum of (1) short-term borrowings, (2) current portion of long-term debt and (3) long-term debt reduced by the sum of cash and cash equivalents and short-term and long-term investments. Capital is defined as shareholders’ equity.
NBR | 49
Item 7 Management’s Discussion and Analysis of Financial Condition and Results of Operations
Management OverviewThe following Management’s Discussion and Analysis of Finan-
cial Condition and Results of Operations is intended to help the reader understand the results of our operations and our financial condition. This information is provided as a supplement to, and should be read in conjunction with our consolidated financial statements and the accompanying notes to our consolidated financial statements.
Nabors is the largest land drilling contractor in the world. We conduct oil, gas and geothermal land drilling operations in the U.S. Lower 48 states, Alaska, Canada, South and Central America, the Middle East, the Far East and Africa. Nabors also is one of the largest land well-servicing and workover contractors in the United States and Canada and is a leading provider of offshore platform workover and drilling rigs in the United States and multi-ple international markets. To further supplement and complement our primary business, we offer a wide range of ancillary well-site services, including engineering, transportation, construction, main-tenance, well logging, directional drilling, rig instrumentation, data collection and other support services, in selected domestic and international markets. During the first quarter of 2006, we began to offer subcontracted logistics services for onshore drilling and
well-servicing operations in Canada using helicopter and fixed-winged aircraft. We have also made selective investments in oil and gas exploration, development and production activities.
The majority of our business is conducted through our various Contract Drilling operating segments, which include our drilling, workover and well-servicing operations, on land and offshore. Our oil and gas exploration, development and production operations are included in a category labeled Oil and Gas for segment reporting purposes. Our operating segments engaged in marine transportation and supply services, drilling technology and top drive manufacturing, directional drilling, rig instrumentation and software, and construc-tion and logistics operations are aggregated in a category labeled Other Operating Segments for segment reporting purposes.
Our businesses depend, to a large degree, on the level of spend-ing by oil and gas companies for exploration, development and production activities. Therefore, a sustained increase or decrease in the price of natural gas or oil, which could have a material impact on exploration, development and production activities, could also materially affect our financial position, results of operations and cash flows.
The magnitude of customer spending on new and existing wells is the primary driver of our business. The primary determinate of cus-tomer spending is the degree of their cash flow and earnings which are largely determined by natural gas prices in our U.S. Lower 48 Land Drilling, Canadian and U.S. Offshore (Gulf of Mexico) operations, while oil prices are the primary determinate in our Alaskan, Interna-tional and U.S. Land Well-servicing operations. The following table sets forth natural gas and oil price data per Bloomberg for the last three years:
Year Ended December 31, Increase/(Decrease)
2006 2005 2004 2006 to 2005 2005 to 2004
Commodity prices: Average Henry Hub natural gas spot price ($/million cubic feet (mcf)) $ 6.73 $ 8.89 $ 5.90 $ (2.16) (24%) $ 2.99 51%
Average West Texas intermediate crude oil spot price ($/barrel) $ 66.09 $ 56.59 $ 41.51 $ 9.50 17% $ 15.08 36%
50 | NBR
Operating revenues and earnings from unconsolidated affiliates for the year ended December 31, 2006 totaled $4.8 billion, repre-senting an increase of $1.4 billion, or 40%, compared to the year ended December 31, 2005. Adjusted income derived from operat-ing activities and net income for the year ended December 31, 2006 totaled $1.4 billion and $1.0 billion ($3.40 per diluted share), respec-tively, representing increases of 64% and 57%, respectively, com-pared to the year ended December 31, 2005. Operating revenues and earnings from unconsolidated affiliates for the year ended December 31, 2005 totaled $3.5 billion, representing an increase of $1.1 billion, or 45%, compared to the year ended December 31, 2004. Adjusted income derived from operating activities and net income for the year ended December 31, 2005 totaled $879.8 million and $648.7 million ($2.00 per diluted share), respectively, representing increases of 167% and 114%, respectively, compared to the year ended December 31, 2004.
The increase in our operating results from 2005 to 2006 and from 2004 to 2005 resulted from higher revenues during each sequential year realized by essentially all of our operating segments. Revenues increased as a result of higher average dayrates and activity levels during 2006 compared to 2005 and 2005 compared to 2004. This increase in average dayrates and activity reflects an increase in demand for our services in these markets during these years, which resulted from continuing higher expenditures by our customers for drilling and workover services as a result of historically high oil and natural gas prices throughout 2005 and 2006.
Our operating results for 2007 are still expected to increase from levels realized during 2006, despite a moderating outlook for our North American natural gas related businesses, as a result of slightly lower returns for our customers from average commodity price expectations that are in line with last year in the face of higher costs and an influx of rig capacity additions to these markets. The major factors that support our expectations of an improved year are:1. The anticipated positive impact on our overall level of drilling and
well-servicing activity and margins resulting from new or substan-tially new rigs added as part of our expanded capital program.
• Our new drilling rig construction program constitutes the majority of this capital and a large proportion of these rigs are subject to long-term contracts with creditworthy customers with the most significant impact occurring in our U.S. Lower 48 Land Drilling, International and Canadian operations.
• Investments in new rigs for markets that, while are not charac-terized by long-term contracts, have relatively high historical and currently high levels of utilization and increasing dayrates. This constitutes the majority of the balance of the new rig con-struction program and is largely benefiting our U.S. Well Service, U.S. Offshore and Canadian businesses.
• Investments in other revenue producing assets that are in high demand such as top drives, fluid hauling trucks, fluid storage tanks, rig moving trucks and equipment and other similar auxil-iary asset additions in high activity markets but not characterized by term contracts.
2. The number of term contracts covering our existing U.S. Lower 48 Land Drilling rigs throughout 2007 and into 2008 which serve to mitigate the extent fleet utilization can decline in a softening mar-ket. At December 31, 2006, approximately 67% of this businesses’ anticipated 2007 adjusted income from operations was subject to term contracts.
3. The extent of incremental income yet to be realized from 2006 and 2007 rig deployments most of which are for multi-year con-tracts and further income increments from the expected renewals of existing multi-year contracts to much higher current market rates. The largest potential increases exist in our International markets followed by our Alaskan and U.S. Offshore businesses.We anticipate that 2007 results for our U.S. Lower 48 Land Drill-
ing and Canadian drilling operations are likely going to be lower in 2007 than 2006 with a slower market and an influx of rig capacity in the U.S. Lower 48 market and more extensive market weakness in Canada.
During the second quarter of 2006, our wholly-owned subsidiary, Nabors Delaware, placed $2.75 billion in five-year exchangeable notes with a 0.94% coupon interest rate and an original exchange premium of 30%. In order to offset the potential dilution to our shares, Nabors Delaware entered into a series of hedge transactions which effectively increased the exchange premium to 55%. In the hedge transactions, Nabors Delaware purchased call options which will cover the net shares of our common shares that would be deliv-erable to the note-holders upon exchange of the notes. In order to partially offset the cost of the purchased call options (but which also limits the anti-dilutive effect of the call options), we sold warrants to acquire approximately 60.0 million of our common shares at a strike price of $54.64. The net cost of these hedge transactions was approximately $162.4 million. These costs were accounted for as a reduction to shareholders’ equity. A portion of the proceeds from the notes were also used to repurchase approximately 28.5 million shares of our common stock for approximately $1.0 billion, which further reduced shareholders’ equity. These decreases to equity as a result of these transactions were partially offset by a $215.9 million increase to equity related to a deferred tax asset representing the tax benefits of the cost of the purchased call option, which was also accounted for through shareholders’ equity. After the consummation of this transaction, we had approximately $2.0 billion in cash and investments, which we believe puts us in an excellent position to capitalize on future opportunities.
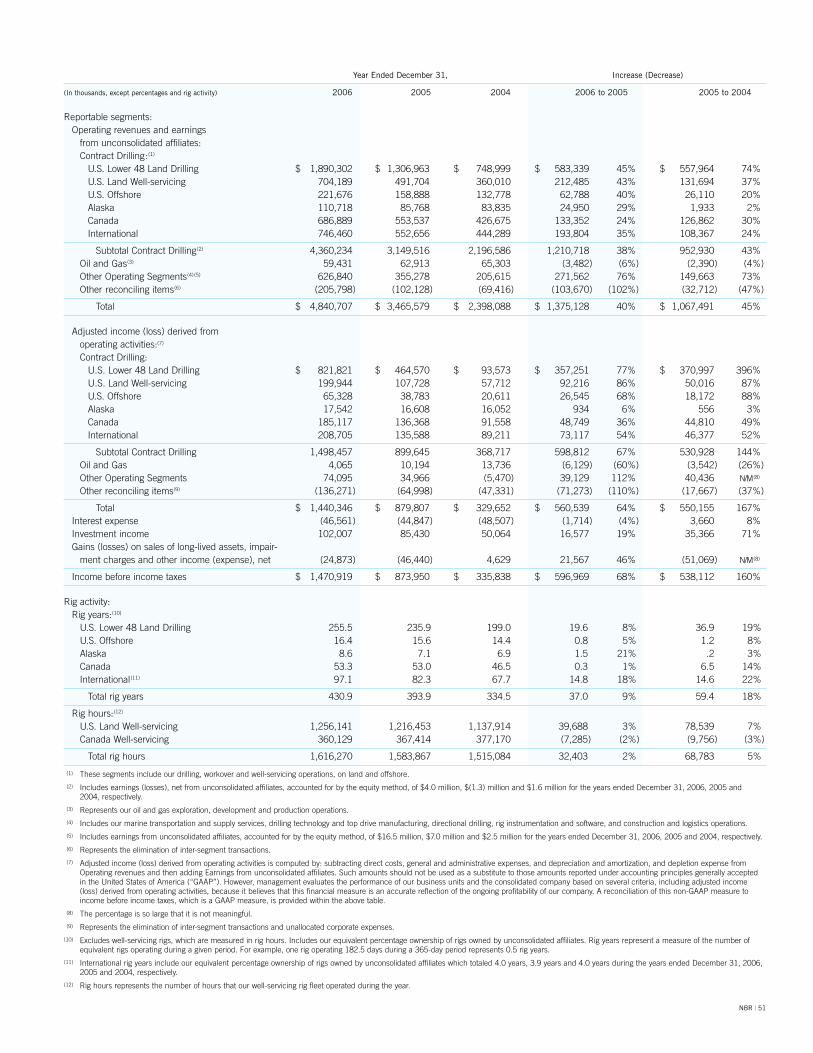
The following tables set forth certain information with respect to our reportable segments and rig activity:
NBR | 51
Year Ended December 31, Increase (Decrease)
( In thousands, except percentages and rig activity) 2006 2005 2004 2006 to 2005 2005 to 2004
Reportable segments: Operating revenues and earnings from unconsolidated affiliates: Contract Drilling:(1) U.S. Lower 48 Land Drilling $ 1,890,302 $ 1,306,963 $ 748,999 $ 583,339 45% $ 557,964 74% U.S. Land Well-servicing 704,189 491,704 360,010 212,485 43% 131,694 37% U.S. Offshore 221,676 158,888 132,778 62,788 40% 26,110 20% Alaska 110,718 85,768 83,835 24,950 29% 1,933 2% Canada 686,889 553,537 426,675 133,352 24% 126,862 30% International 746,460 552,656 444,289 193,804 35% 108,367 24%
Subtotal Contract Drilling(2) 4,360,234 3,149,516 2,196,586 1,210,718 38% 952,930 43% Oil and Gas(3) 59,431 62,913 65,303 (3,482) (6%) (2,390) (4%) Other Operating Segments(4)(5) 626,840 355,278 205,615 271,562 76% 149,663 73% Other reconciling items(6) (205,798) (102,128) (69,416) (103,670) (102%) (32,712) (47%)
Total $ 4,840,707 $ 3,465,579 $ 2,398,088 $ 1,375,128 40% $ 1,067,491 45%
Adjusted income (loss) derived from operating activities:(7) Contract Drilling: U.S. Lower 48 Land Drilling $ 821,821 $ 464,570 $ 93,573 $ 357,251 77% $ 370,997 396% U.S. Land Well-servicing 199,944 107,728 57,712 92,216 86% 50,016 87% U.S. Offshore 65,328 38,783 20,611 26,545 68% 18,172 88% Alaska 17,542 16,608 16,052 934 6% 556 3% Canada 185,117 136,368 91,558 48,749 36% 44,810 49% International 208,705 135,588 89,211 73,117 54% 46,377 52%
Subtotal Contract Drilling 1,498,457 899,645 368,717 598,812 67% 530,928 144% Oil and Gas 4,065 10,194 13,736 (6,129) (60%) (3,542) (26%) Other Operating Segments 74,095 34,966 (5,470) 39,129 112% 40,436 N/M(8)
Other reconciling items(9) (136,271) (64,998) (47,331) (71,273) (110%) (17,667) (37%)
Total $ 1,440,346 $ 879,807 $ 329,652 $ 560,539 64% $ 550,155 167% Interest expense (46,561) (44,847) (48,507) (1,714) (4%) 3,660 8% Investment income 102,007 85,430 50,064 16,577 19% 35,366 71% Gains (losses) on sales of long-lived assets, impair- ment charges and other income (expense), net (24,873) (46,440) 4,629 21,567 46% (51,069) N/M(8)
Income before income taxes $ 1,470,919 $ 873,950 $ 335,838 $ 596,969 68% $ 538,112 160%
Rig activity: Rig years:(10) U.S. Lower 48 Land Drilling 255.5 235.9 199.0 19.6 8% 36.9 19% U.S. Offshore 16.4 15.6 14.4 0.8 5% 1.2 8% Alaska 8.6 7.1 6.9 1.5 21% .2 3% Canada 53.3 53.0 46.5 0.3 1% 6.5 14% International(11) 97.1 82.3 67.7 14.8 18% 14.6 22%
Total rig years 430.9 393.9 334.5 37.0 9% 59.4 18%
Rig hours:(12) U.S. Land Well-servicing 1,256,141 1,216,453 1,137,914 39,688 3% 78,539 7% Canada Well-servicing 360,129 367,414 377,170 (7,285) (2%) (9,756) (3%)
Total rig hours 1,616,270 1,583,867 1,515,084 32,403 2% 68,783 5%
(1) These segments include our drilling, workover and well-servicing operations, on land and offshore. (2) Includes earnings (losses), net from unconsolidated affiliates, accounted for by the equity method, of $4.0 million, $(1.3) million and $1.6 million for the years ended December 31, 2006, 2005 and
2004, respectively. (3) Represents our oil and gas exploration, development and production operations. (4) Includes our marine transportation and supply services, drilling technology and top drive manufacturing, directional drilling, rig instrumentation and software, and construction and logistics operations. (5) Includes earnings from unconsolidated affiliates, accounted for by the equity method, of $16.5 million, $7.0 million and $2.5 million for the years ended December 31, 2006, 2005 and 2004, respectively. (6) Represents the elimination of inter-segment transactions. (7) Adjusted income (loss) derived from operating activities is computed by: subtracting direct costs, general and administrative expenses, and depreciation and amortization, and depletion expense from
Operating revenues and then adding Earnings from unconsolidated affiliates. Such amounts should not be used as a substitute to those amounts reported under accounting principles generally accepted in the United States of America (“GAAP”). However, management evaluates the performance of our business units and the consolidated company based on several criteria, including adjusted income (loss) derived from operating activities, because it believes that this financial measure is an accurate reflection of the ongoing profitability of our company. A reconciliation of this non-GAAP measure to income before income taxes, which is a GAAP measure, is provided within the above table.
(8) The percentage is so large that it is not meaningful. (9) Represents the elimination of inter-segment transactions and unallocated corporate expenses.(10) Excludes well-servicing rigs, which are measured in rig hours. Includes our equivalent percentage ownership of rigs owned by unconsolidated affiliates. Rig years represent a measure of the number of
equivalent rigs operating during a given period. For example, one rig operating 182.5 days during a 365-day period represents 0.5 rig years. (11) International rig years include our equivalent percentage ownership of rigs owned by unconsolidated affiliates which totaled 4.0 years, 3.9 years and 4.0 years during the years ended December 31, 2006,
2005 and 2004, respectively.(12) Rig hours represents the number of hours that our well-servicing rig fleet operated during the year.
52 | NBR
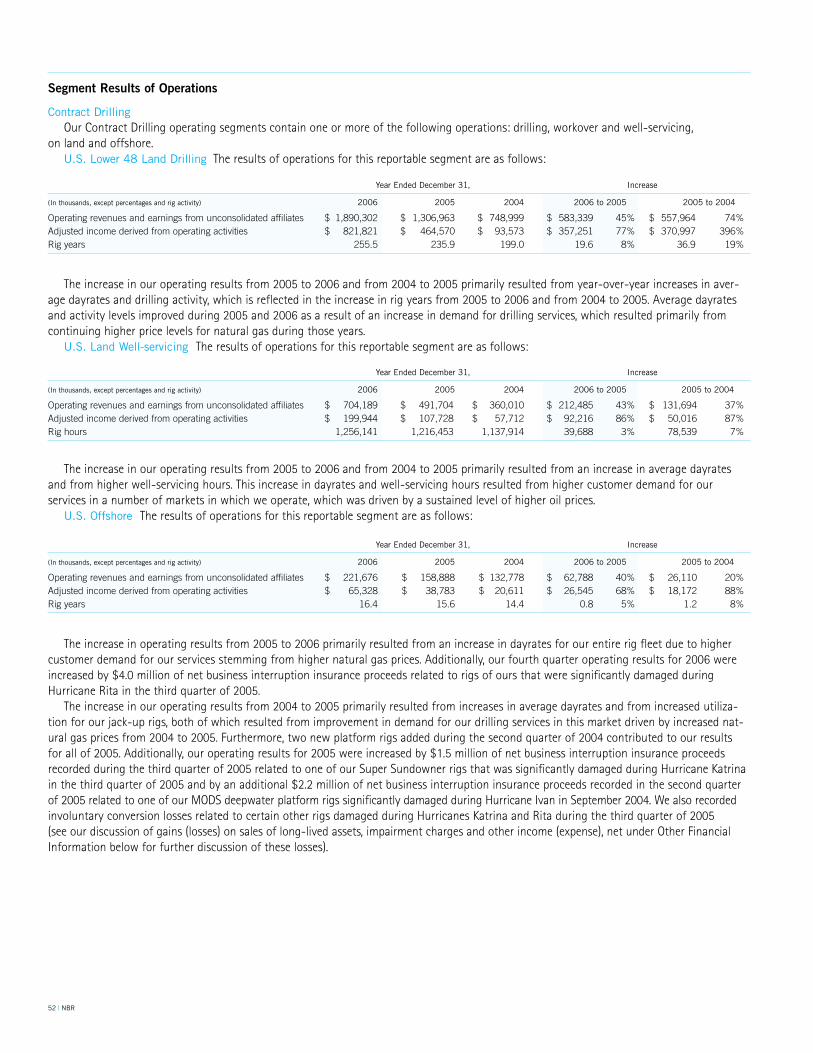
The increase in operating results from 2005 to 2006 primarily resulted from an increase in dayrates for our entire rig fleet due to higher customer demand for our services stemming from higher natural gas prices. Additionally, our fourth quarter operating results for 2006 were increased by $4.0 million of net business interruption insurance proceeds related to rigs of ours that were significantly damaged during Hurricane Rita in the third quarter of 2005.
The increase in our operating results from 2004 to 2005 primarily resulted from increases in average dayrates and from increased utiliza-tion for our jack-up rigs, both of which resulted from improvement in demand for our drilling services in this market driven by increased nat-ural gas prices from 2004 to 2005. Furthermore, two new platform rigs added during the second quarter of 2004 contributed to our results for all of 2005. Additionally, our operating results for 2005 were increased by $1.5 million of net business interruption insurance proceeds recorded during the third quarter of 2005 related to one of our Super Sundowner rigs that was significantly damaged during Hurricane Katrina in the third quarter of 2005 and by an additional $2.2 million of net business interruption insurance proceeds recorded in the second quarter of 2005 related to one of our MODS deepwater platform rigs significantly damaged during Hurricane Ivan in September 2004. We also recorded involuntary conversion losses related to certain other rigs damaged during Hurricanes Katrina and Rita during the third quarter of 2005 (see our discussion of gains (losses) on sales of long-lived assets, impairment charges and other income (expense), net under Other Financial Information below for further discussion of these losses).
The increase in our operating results from 2005 to 2006 and from 2004 to 2005 primarily resulted from year-over-year increases in aver-age dayrates and drilling activity, which is reflected in the increase in rig years from 2005 to 2006 and from 2004 to 2005. Average dayrates and activity levels improved during 2005 and 2006 as a result of an increase in demand for drilling services, which resulted primarily from continuing higher price levels for natural gas during those years.
U.S. Land Well-servicing The results of operations for this reportable segment are as follows:
The increase in our operating results from 2005 to 2006 and from 2004 to 2005 primarily resulted from an increase in average dayrates and from higher well-servicing hours. This increase in dayrates and well-servicing hours resulted from higher customer demand for our services in a number of markets in which we operate, which was driven by a sustained level of higher oil prices.
U.S. Offshore The results of operations for this reportable segment are as follows:
Year Ended December 31, Increase
( In thousands, except percentages and rig activity) 2006 2005 2004 2006 to 2005 2005 to 2004
Operating revenues and earnings from unconsolidated affiliates $ 704,189 $ 491,704 $ 360,010 $ 212,485 43% $ 131,694 37% Adjusted income derived from operating activities $ 199,944 $ 107,728 $ 57,712 $ 92,216 86% $ 50,016 87% Rig hours 1,256,141 1,216,453 1,137,914 39,688 3% 78,539 7%
Year Ended December 31, Increase
( In thousands, except percentages and rig activity) 2006 2005 2004 2006 to 2005 2005 to 2004
Operating revenues and earnings from unconsolidated affiliates $ 221,676 $ 158,888 $ 132,778 $ 62,788 40% $ 26,110 20%Adjusted income derived from operating activities $ 65,328 $ 38,783 $ 20,611 $ 26,545 68% $ 18,172 88%Rig years 16.4 15.6 14.4 0.8 5% 1.2 8%
Segment Results of Operations
Contract Drilling Our Contract Drilling operating segments contain one or more of the following operations: drilling, workover and well-servicing,
on land and offshore. U.S. Lower 48 Land Drilling The results of operations for this reportable segment are as follows:
Year Ended December 31, Increase
( In thousands, except percentages and rig activity) 2006 2005 2004 2006 to 2005 2005 to 2004
Operating revenues and earnings from unconsolidated affiliates $ 1,890,302 $ 1,306,963 $ 748,999 $ 583,339 45% $ 557,964 74% Adjusted income derived from operating activities $ 821,821 $ 464,570 $ 93,573 $ 357,251 77% $ 370,997 396% Rig years 255.5 235.9 199.0 19.6 8% 36.9 19%
NBR | 53
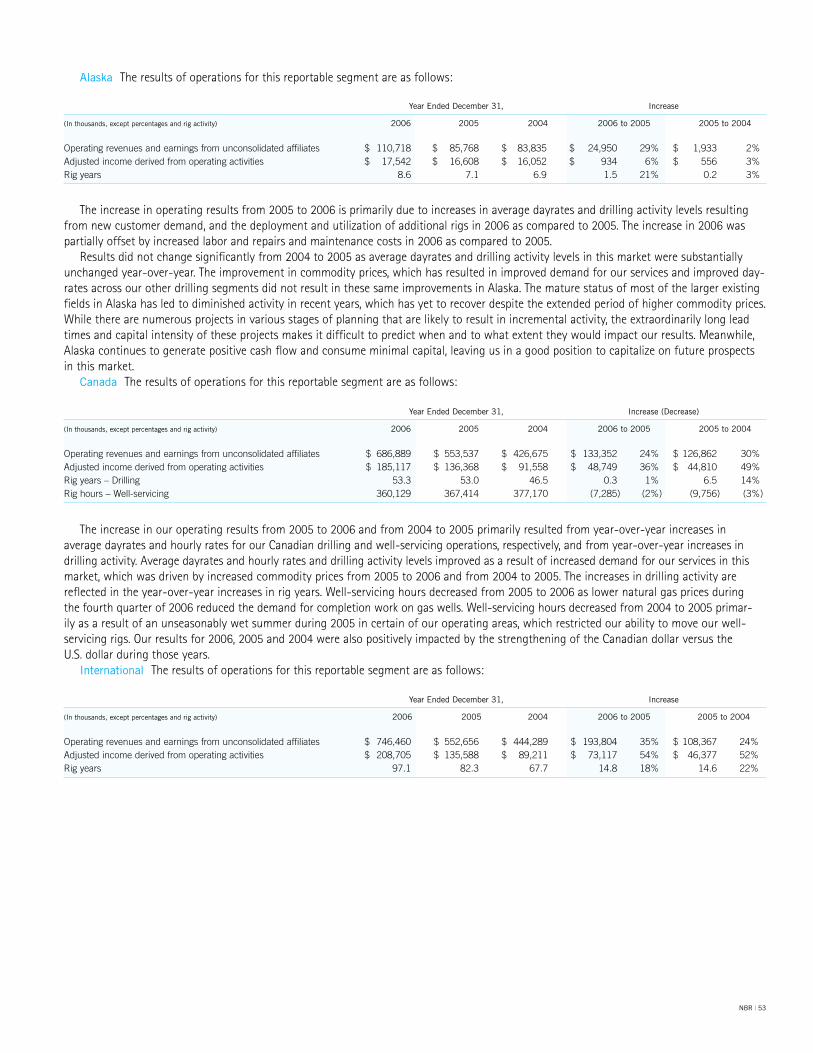
The increase in our operating results from 2005 to 2006 and from 2004 to 2005 primarily resulted from year-over-year increases in average dayrates and hourly rates for our Canadian drilling and well-servicing operations, respectively, and from year-over-year increases in drilling activity. Average dayrates and hourly rates and drilling activity levels improved as a result of increased demand for our services in this market, which was driven by increased commodity prices from 2005 to 2006 and from 2004 to 2005. The increases in drilling activity are reflected in the year-over-year increases in rig years. Well-servicing hours decreased from 2005 to 2006 as lower natural gas prices during the fourth quarter of 2006 reduced the demand for completion work on gas wells. Well-servicing hours decreased from 2004 to 2005 primar- ily as a result of an unseasonably wet summer during 2005 in certain of our operating areas, which restricted our ability to move our well- servicing rigs. Our results for 2006, 2005 and 2004 were also positively impacted by the strengthening of the Canadian dollar versus the U.S. dollar during those years.
International The results of operations for this reportable segment are as follows:
Alaska The results of operations for this reportable segment are as follows:
The increase in operating results from 2005 to 2006 is primarily due to increases in average dayrates and drilling activity levels resulting from new customer demand, and the deployment and utilization of additional rigs in 2006 as compared to 2005. The increase in 2006 was partially offset by increased labor and repairs and maintenance costs in 2006 as compared to 2005.
Results did not change significantly from 2004 to 2005 as average dayrates and drilling activity levels in this market were substantially unchanged year-over-year. The improvement in commodity prices, which has resulted in improved demand for our services and improved day-rates across our other drilling segments did not result in these same improvements in Alaska. The mature status of most of the larger existing fields in Alaska has led to diminished activity in recent years, which has yet to recover despite the extended period of higher commodity prices. While there are numerous projects in various stages of planning that are likely to result in incremental activity, the extraordinarily long lead times and capital intensity of these projects makes it difficult to predict when and to what extent they would impact our results. Meanwhile, Alaska continues to generate positive cash flow and consume minimal capital, leaving us in a good position to capitalize on future prospects in this market.
Canada The results of operations for this reportable segment are as follows:
Year Ended December 31, Increase
( In thousands, except percentages and rig activity) 2006 2005 2004 2006 to 2005 2005 to 2004
Operating revenues and earnings from unconsolidated affiliates $ 110,718 $ 85,768 $ 83,835 $ 24,950 29% $ 1,933 2% Adjusted income derived from operating activities $ 17,542 $ 16,608 $ 16,052 $ 934 6% $ 556 3% Rig years 8.6 7.1 6.9 1.5 21% 0.2 3%
Year Ended December 31, Increase (Decrease)
( In thousands, except percentages and rig activity) 2006 2005 2004 2006 to 2005 2005 to 2004
Operating revenues and earnings from unconsolidated affiliates $ 686,889 $ 553,537 $ 426,675 $ 133,352 24% $ 126,862 30% Adjusted income derived from operating activities $ 185,117 $ 136,368 $ 91,558 $ 48,749 36% $ 44,810 49% Rig years – Drilling 53.3 53.0 46.5 0.3 1% 6.5 14% Rig hours – Well-servicing 360,129 367,414 377,170 (7,285) (2%) (9,756) (3%)
Year Ended December 31, Increase
( In thousands, except percentages and rig activity) 2006 2005 2004 2006 to 2005 2005 to 2004
Operating revenues and earnings from unconsolidated affiliates $ 746,460 $ 552,656 $ 444,289 $ 193,804 35% $ 108,367 24% Adjusted income derived from operating activities $ 208,705 $ 135,588 $ 89,211 $ 73,117 54% $ 46,377 52% Rig years 97.1 82.3 67.7 14.8 18% 14.6 22%
54 | NBR
The increase in operating results from 2005 to 2006 primarily resulted from an increase in operations in Africa, Saudi Arabia, New Zealand, Colombia and Mexico, resulting from improved demand for our services and improved dayrates in these markets which is reflected in the increase in rig years from 2005 to 2006. Average dayrates and activity levels improved during 2005 and 2006 as a result of an increase in demand for drilling services, which resulted primarily from continuing higher price levels for oil during 2006.
The increase in our operating results from 2004 to 2005 primarily resulted from an increase in operations in South and Central America (primarily in Mexico, Colombia, Venezuela and Ecuador) and in the Middle East (primarily in Saudi Arabia, the United Arab Emirates and Qatar) resulting from improved demand for our services and improved dayrates in these markets during 2005 compared to 2004, and from a full year of results in 2005 from our accommodation units added to certain of our markets in the Middle East during mid-2004.
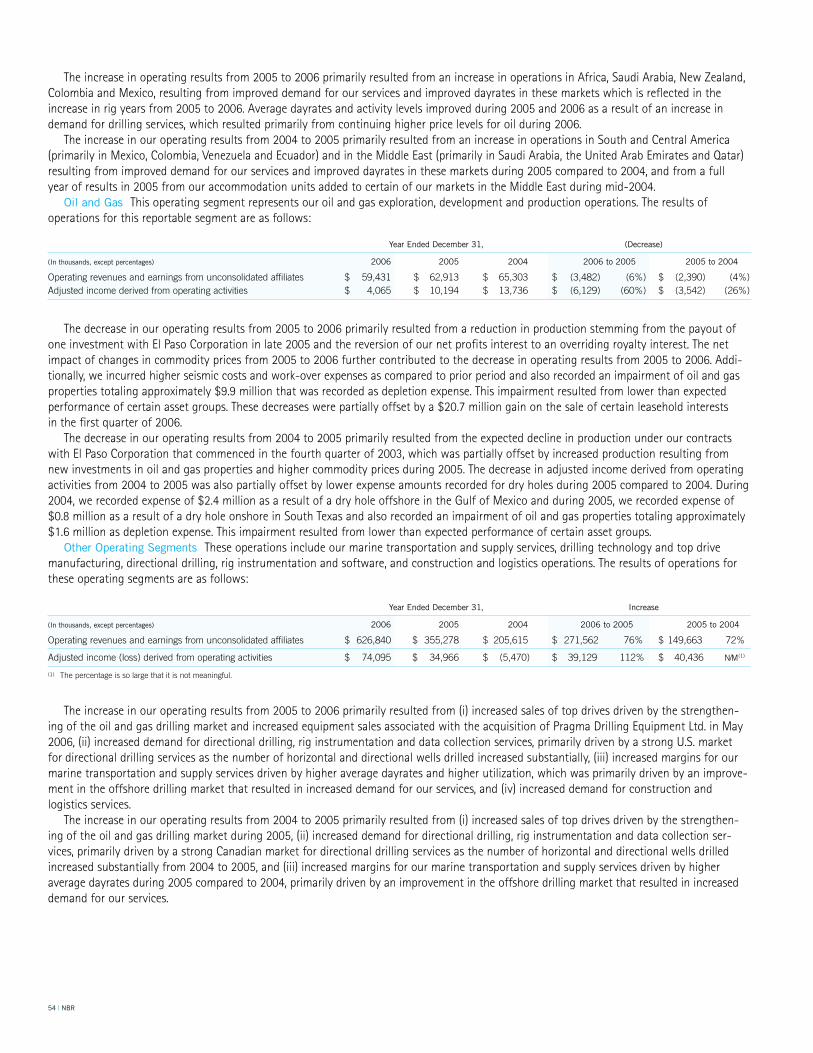
Oil and Gas This operating segment represents our oil and gas exploration, development and production operations. The results of operations for this reportable segment are as follows:
The increase in our operating results from 2005 to 2006 primarily resulted from (i) increased sales of top drives driven by the strengthen-ing of the oil and gas drilling market and increased equipment sales associated with the acquisition of Pragma Drilling Equipment Ltd. in May 2006, (ii) increased demand for directional drilling, rig instrumentation and data collection services, primarily driven by a strong U.S. market for directional drilling services as the number of horizontal and directional wells drilled increased substantially, (iii) increased margins for our marine transportation and supply services driven by higher average dayrates and higher utilization, which was primarily driven by an improve-ment in the offshore drilling market that resulted in increased demand for our services, and (iv) increased demand for construction and logistics services.
The increase in our operating results from 2004 to 2005 primarily resulted from (i) increased sales of top drives driven by the strengthen-ing of the oil and gas drilling market during 2005, (ii) increased demand for directional drilling, rig instrumentation and data collection ser-vices, primarily driven by a strong Canadian market for directional drilling services as the number of horizontal and directional wells drilled increased substantially from 2004 to 2005, and (iii) increased margins for our marine transportation and supply services driven by higher average dayrates during 2005 compared to 2004, primarily driven by an improvement in the offshore drilling market that resulted in increased demand for our services.
The decrease in our operating results from 2005 to 2006 primarily resulted from a reduction in production stemming from the payout of one investment with El Paso Corporation in late 2005 and the reversion of our net profits interest to an overriding royalty interest. The net impact of changes in commodity prices from 2005 to 2006 further contributed to the decrease in operating results from 2005 to 2006. Addi-tionally, we incurred higher seismic costs and work-over expenses as compared to prior period and also recorded an impairment of oil and gas properties totaling approximately $9.9 million that was recorded as depletion expense. This impairment resulted from lower than expected performance of certain asset groups. These decreases were partially offset by a $20.7 million gain on the sale of certain leasehold interests in the first quarter of 2006.
The decrease in our operating results from 2004 to 2005 primarily resulted from the expected decline in production under our contracts with El Paso Corporation that commenced in the fourth quarter of 2003, which was partially offset by increased production resulting from new investments in oil and gas properties and higher commodity prices during 2005. The decrease in adjusted income derived from operating activities from 2004 to 2005 was also partially offset by lower expense amounts recorded for dry holes during 2005 compared to 2004. During 2004, we recorded expense of $2.4 million as a result of a dry hole offshore in the Gulf of Mexico and during 2005, we recorded expense of $0.8 million as a result of a dry hole onshore in South Texas and also recorded an impairment of oil and gas properties totaling approximately $1.6 million as depletion expense. This impairment resulted from lower than expected performance of certain asset groups.
Other Operating Segments These operations include our marine transportation and supply services, drilling technology and top drive manufacturing, directional drilling, rig instrumentation and software, and construction and logistics operations. The results of operations for these operating segments are as follows:
Year Ended December 31, (Decrease)
( In thousands, except percentages) 2006 2005 2004 2006 to 2005 2005 to 2004
Operating revenues and earnings from unconsolidated affiliates $ 59,431 $ 62,913 $ 65,303 $ (3,482) (6%) $ (2,390) (4%) Adjusted income derived from operating activities $ 4,065 $ 10,194 $ 13,736 $ (6,129) (60%) $ (3,542) (26%)
Year Ended December 31, Increase
( In thousands, except percentages) 2006 2005 2004 2006 to 2005 2005 to 2004
Operating revenues and earnings from unconsolidated affiliates $ 626,840 $ 355,278 $ 205,615 $ 271,562 76% $ 149,663 72%
Adjusted income (loss) derived from operating activities $ 74,095 $ 34,966 $ (5,470) $ 39,129 112% $ 40,436 N/M(1)
(1) The percentage is so large that it is not meaningful.
NBR | 55
Other Financial Information
General and administrative expenses
Year Ended December 31, Increase (Decrease)
( In thousands, except percentages) 2006 2005 2004 2006 to 2005 2005 to 2004
General and administrative expenses $ 420,854 $ 249,973 $ 195,388 $ 170,881 68% $ 54,585 28% General and administrative expenses as a percentage of operating revenues 8.7% 7.2% 8.2% 1.5% 21% (1.0%) (12%)
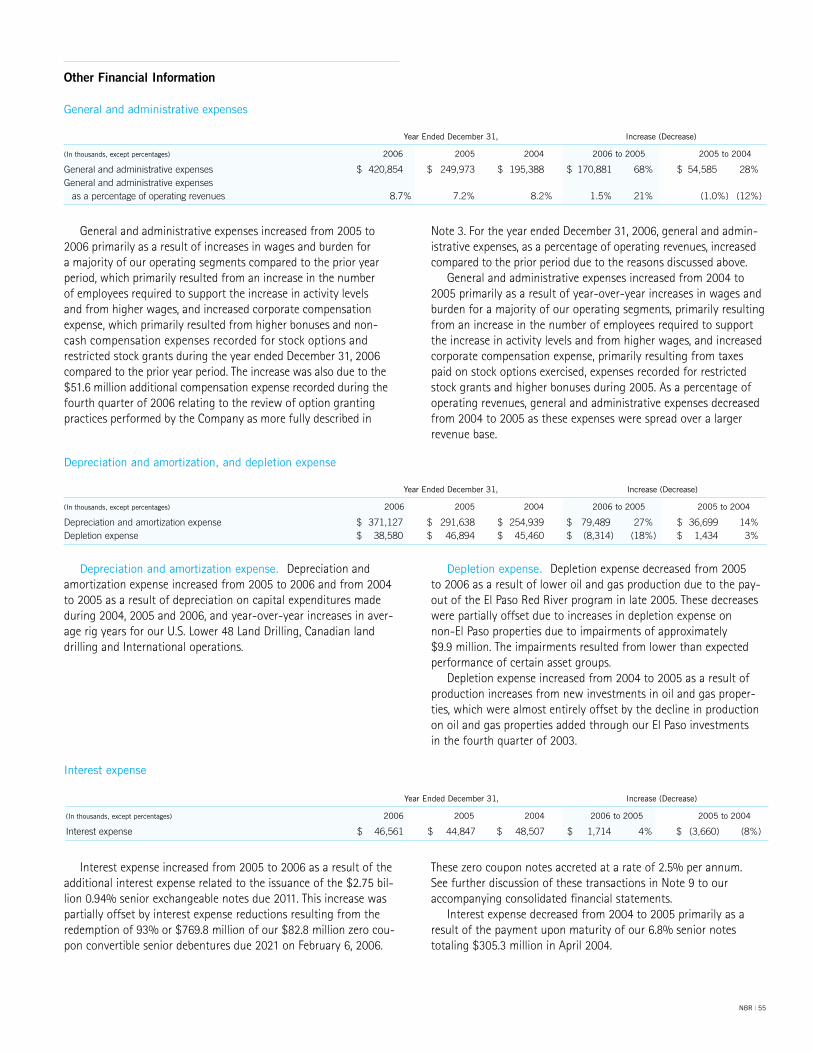
General and administrative expenses increased from 2005 to 2006 primarily as a result of increases in wages and burden for a majority of our operating segments compared to the prior year period, which primarily resulted from an increase in the number of employees required to support the increase in activity levels and from higher wages, and increased corporate compensation expense, which primarily resulted from higher bonuses and non-cash compensation expenses recorded for stock options and restricted stock grants during the year ended December 31, 2006 compared to the prior year period. The increase was also due to the $51.6 million additional compensation expense recorded during the fourth quarter of 2006 relating to the review of option granting practices performed by the Company as more fully described in
Note 3. For the year ended December 31, 2006, general and admin-istrative expenses, as a percentage of operating revenues, increased compared to the prior period due to the reasons discussed above.
General and administrative expenses increased from 2004 to 2005 primarily as a result of year-over-year increases in wages and burden for a majority of our operating segments, primarily resulting from an increase in the number of employees required to support the increase in activity levels and from higher wages, and increased corporate compensation expense, primarily resulting from taxes paid on stock options exercised, expenses recorded for restricted stock grants and higher bonuses during 2005. As a percentage of operating revenues, general and administrative expenses decreased from 2004 to 2005 as these expenses were spread over a larger revenue base.
Depreciation and amortization, and depletion expense
Year Ended December 31, Increase (Decrease)
( In thousands, except percentages) 2006 2005 2004 2006 to 2005 2005 to 2004
Depreciation and amortization expense $ 371,127 $ 291,638 $ 254,939 $ 79,489 27% $ 36,699 14%Depletion expense $ 38,580 $ 46,894 $ 45,460 $ (8,314) (18%) $ 1,434 3%
Depreciation and amortization expense. Depreciation and amortization expense increased from 2005 to 2006 and from 2004 to 2005 as a result of depreciation on capital expenditures made during 2004, 2005 and 2006, and year-over-year increases in aver-age rig years for our U.S. Lower 48 Land Drilling, Canadian land drilling and International operations.
Depletion expense. Depletion expense decreased from 2005 to 2006 as a result of lower oil and gas production due to the pay-out of the El Paso Red River program in late 2005. These decreases were partially offset due to increases in depletion expense on non-El Paso properties due to impairments of approximately $9.9 million. The impairments resulted from lower than expected performance of certain asset groups.
Depletion expense increased from 2004 to 2005 as a result of production increases from new investments in oil and gas proper-ties, which were almost entirely offset by the decline in production on oil and gas properties added through our El Paso investments in the fourth quarter of 2003.
Interest expense
Year Ended December 31, Increase (Decrease)
( In thousands, except percentages) 2006 2005 2004 2006 to 2005 2005 to 2004
Interest expense $ 46,561 $ 44,847 $ 48,507 $ 1,714 4% $ (3,660) (8%)
Interest expense increased from 2005 to 2006 as a result of the additional interest expense related to the issuance of the $2.75 bil-lion 0.94% senior exchangeable notes due 2011. This increase was partially offset by interest expense reductions resulting from the redemption of 93% or $769.8 million of our $82.8 million zero cou-pon convertible senior debentures due 2021 on February 6, 2006.
These zero coupon notes accreted at a rate of 2.5% per annum. See further discussion of these transactions in Note 9 to our accompanying consolidated financial statements.
Interest expense decreased from 2004 to 2005 primarily as a result of the payment upon maturity of our 6.8% senior notes totaling $305.3 million in April 2004.
56 | NBR
Year Ended December 31, Increase (Decrease)
( In thousands, except percentages) 2006 2005 2004 2006 to 2005 2005 to 2004
Gains (losses) on sales of long-lived assets, impairment charges and other income (expense), net $ (24,873) $ (46,440) $ 4,629 $ 21,567 46% $ (51,069) N/M(1)
(1) The percentage is so large that it is not meaningful.
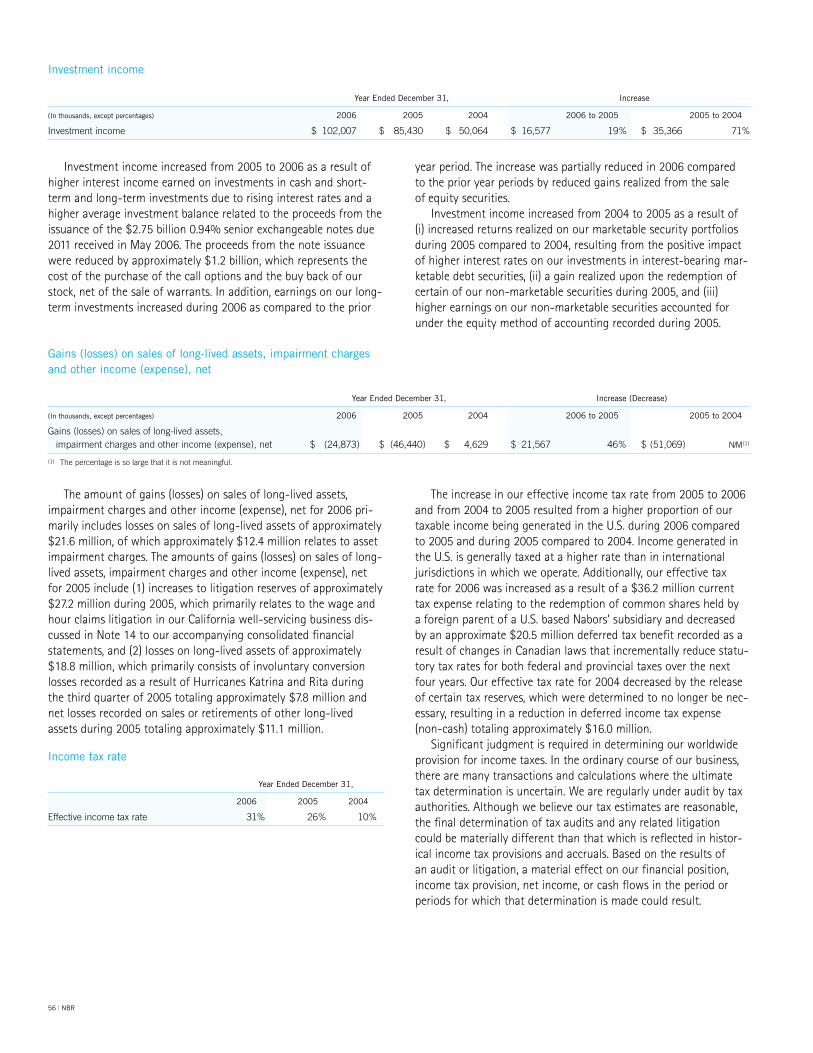
Gains (losses) on sales of long-lived assets, impairment charges and other income (expense), net
The amount of gains (losses) on sales of long-lived assets, impairment charges and other income (expense), net for 2006 pri-marily includes losses on sales of long-lived assets of approximately $21.6 million, of which approximately $12.4 million relates to asset impairment charges. The amounts of gains (losses) on sales of long-lived assets, impairment charges and other income (expense), net for 2005 include (1) increases to litigation reserves of approximately $27.2 million during 2005, which primarily relates to the wage and hour claims litigation in our California well-servicing business dis-cussed in Note 14 to our accompanying consolidated financial statements, and (2) losses on long-lived assets of approximately $18.8 million, which primarily consists of involuntary conversion losses recorded as a result of Hurricanes Katrina and Rita during the third quarter of 2005 totaling approximately $7.8 million and net losses recorded on sales or retirements of other long-lived assets during 2005 totaling approximately $11.1 million.
Income tax rate
Year Ended December 31,
2006 2005 2004
Effective income tax rate 31% 26% 10%
The increase in our effective income tax rate from 2005 to 2006 and from 2004 to 2005 resulted from a higher proportion of our taxable income being generated in the U.S. during 2006 compared to 2005 and during 2005 compared to 2004. Income generated in the U.S. is generally taxed at a higher rate than in international jurisdictions in which we operate. Additionally, our effective tax rate for 2006 was increased as a result of a $36.2 million current tax expense relating to the redemption of common shares held by a foreign parent of a U.S. based Nabors’ subsidiary and decreased by an approximate $20.5 million deferred tax benefit recorded as a result of changes in Canadian laws that incrementally reduce statu-tory tax rates for both federal and provincial taxes over the next four years. Our effective tax rate for 2004 decreased by the release of certain tax reserves, which were determined to no longer be nec-essary, resulting in a reduction in deferred income tax expense (non-cash) totaling approximately $16.0 million.
Significant judgment is required in determining our worldwide provision for income taxes. In the ordinary course of our business, there are many transactions and calculations where the ultimate tax determination is uncertain. We are regularly under audit by tax authorities. Although we believe our tax estimates are reasonable, the final determination of tax audits and any related litigation could be materially different than that which is reflected in histor- ical income tax provisions and accruals. Based on the results of an audit or litigation, a material effect on our financial position, income tax provision, net income, or cash flows in the period or periods for which that determination is made could result.
Investment income
Investment income increased from 2005 to 2006 as a result of higher interest income earned on investments in cash and short-term and long-term investments due to rising interest rates and a higher average investment balance related to the proceeds from the issuance of the $2.75 billion 0.94% senior exchangeable notes due 2011 received in May 2006. The proceeds from the note issuance were reduced by approximately $1.2 billion, which represents the cost of the purchase of the call options and the buy back of our stock, net of the sale of warrants. In addition, earnings on our long-term investments increased during 2006 as compared to the prior
year period. The increase was partially reduced in 2006 compared to the prior year periods by reduced gains realized from the sale of equity securities.
Investment income increased from 2004 to 2005 as a result of (i) increased returns realized on our marketable security portfolios during 2005 compared to 2004, resulting from the positive impact of higher interest rates on our investments in interest-bearing mar-ketable debt securities, (ii) a gain realized upon the redemption of certain of our non-marketable securities during 2005, and (iii) higher earnings on our non-marketable securities accounted for under the equity method of accounting recorded during 2005.
Year Ended December 31, Increase
( In thousands, except percentages) 2006 2005 2004 2006 to 2005 2005 to 2004
Investment income $ 102,007 $ 85,430 $ 50,064 $ 16,577 19% $ 35,366 71%
NBR | 57
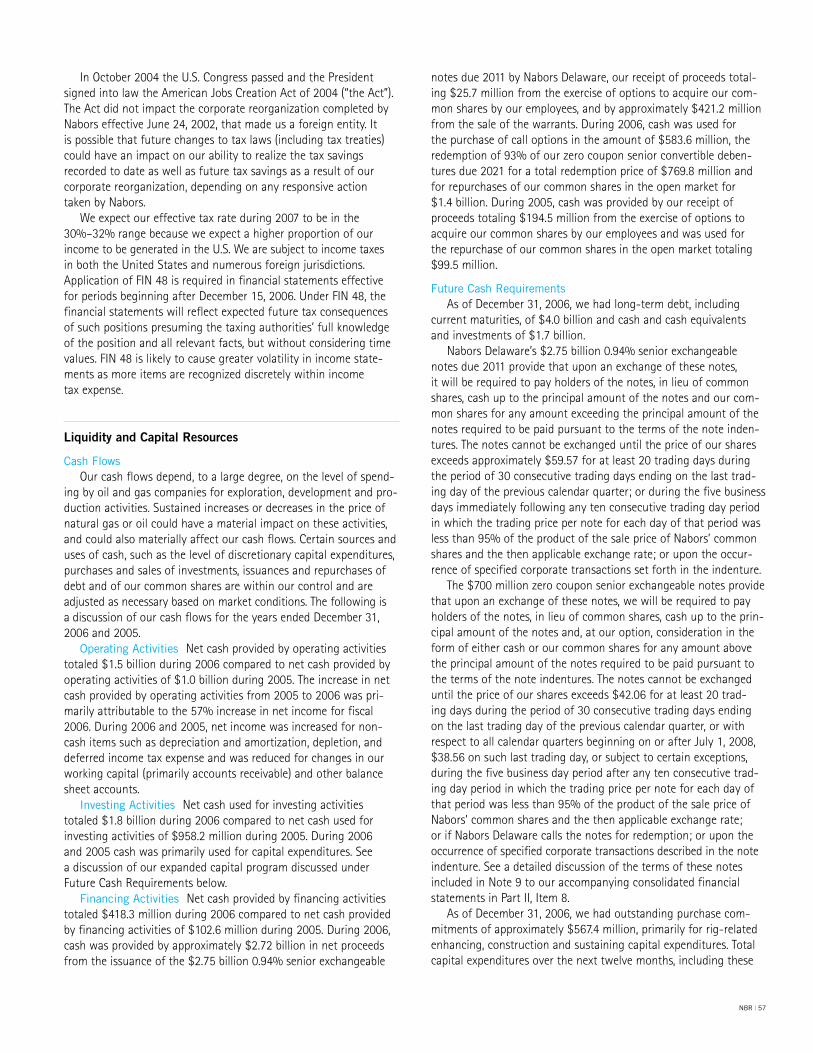
In October 2004 the U.S. Congress passed and the President signed into law the American Jobs Creation Act of 2004 (“the Act”). The Act did not impact the corporate reorganization completed by Nabors effective June 24, 2002, that made us a foreign entity. It is possible that future changes to tax laws (including tax treaties) could have an impact on our ability to realize the tax savings recorded to date as well as future tax savings as a result of our corporate reorganization, depending on any responsive action taken by Nabors.
We expect our effective tax rate during 2007 to be in the 30%–32% range because we expect a higher proportion of our income to be generated in the U.S. We are subject to income taxes in both the United States and numerous foreign jurisdictions. Application of FIN 48 is required in financial statements effective for periods beginning after December 15, 2006. Under FIN 48, the financial statements will reflect expected future tax consequences of such positions presuming the taxing authorities’ full knowledge of the position and all relevant facts, but without considering time values. FIN 48 is likely to cause greater volatility in income state-ments as more items are recognized discretely within income tax expense.
Liquidity and Capital Resources
Cash FlowsOur cash flows depend, to a large degree, on the level of spend-
ing by oil and gas companies for exploration, development and pro-duction activities. Sustained increases or decreases in the price of natural gas or oil could have a material impact on these activities, and could also materially affect our cash flows. Certain sources and uses of cash, such as the level of discretionary capital expenditures, purchases and sales of investments, issuances and repurchases of debt and of our common shares are within our control and are adjusted as necessary based on market conditions. The following is a discussion of our cash flows for the years ended December 31, 2006 and 2005.
Operating Activities Net cash provided by operating activities totaled $1.5 billion during 2006 compared to net cash provided by operating activities of $1.0 billion during 2005. The increase in net cash provided by operating activities from 2005 to 2006 was pri-marily attributable to the 57% increase in net income for fiscal 2006. During 2006 and 2005, net income was increased for non-cash items such as depreciation and amortization, depletion, and deferred income tax expense and was reduced for changes in our working capital (primarily accounts receivable) and other balance sheet accounts.
Investing Activities Net cash used for investing activities totaled $1.8 billion during 2006 compared to net cash used for investing activities of $958.2 million during 2005. During 2006 and 2005 cash was primarily used for capital expenditures. See a discussion of our expanded capital program discussed under Future Cash Requirements below.
Financing Activities Net cash provided by financing activities totaled $418.3 million during 2006 compared to net cash provided by financing activities of $102.6 million during 2005. During 2006, cash was provided by approximately $2.72 billion in net proceeds from the issuance of the $2.75 billion 0.94% senior exchangeable
notes due 2011 by Nabors Delaware, our receipt of proceeds total-ing $25.7 million from the exercise of options to acquire our com-mon shares by our employees, and by approximately $421.2 million from the sale of the warrants. During 2006, cash was used for the purchase of call options in the amount of $583.6 million, the redemption of 93% of our zero coupon senior convertible deben-tures due 2021 for a total redemption price of $769.8 million and for repurchases of our common shares in the open market for $1.4 billion. During 2005, cash was provided by our receipt of proceeds totaling $194.5 million from the exercise of options to acquire our common shares by our employees and was used for the repurchase of our common shares in the open market totaling $99.5 million.
Future Cash RequirementsAs of December 31, 2006, we had long-term debt, including
current maturities, of $4.0 billion and cash and cash equivalents and investments of $1.7 billion.
Nabors Delaware’s $2.75 billion 0.94% senior exchangeable notes due 2011 provide that upon an exchange of these notes, it will be required to pay holders of the notes, in lieu of common shares, cash up to the principal amount of the notes and our com-mon shares for any amount exceeding the principal amount of the notes required to be paid pursuant to the terms of the note inden-tures. The notes cannot be exchanged until the price of our shares exceeds approximately $59.57 for at least 20 trading days during the period of 30 consecutive trading days ending on the last trad-ing day of the previous calendar quarter; or during the five business days immediately following any ten consecutive trading day period in which the trading price per note for each day of that period was less than 95% of the product of the sale price of Nabors’ common shares and the then applicable exchange rate; or upon the occur-rence of specified corporate transactions set forth in the indenture.
The $700 million zero coupon senior exchangeable notes provide that upon an exchange of these notes, we will be required to pay holders of the notes, in lieu of common shares, cash up to the prin-cipal amount of the notes and, at our option, consideration in the form of either cash or our common shares for any amount above the principal amount of the notes required to be paid pursuant to the terms of the note indentures. The notes cannot be exchanged until the price of our shares exceeds $42.06 for at least 20 trad- ing days during the period of 30 consecutive trading days ending on the last trading day of the previous calendar quarter, or with respect to all calendar quarters beginning on or after July 1, 2008, $38.56 on such last trading day, or subject to certain exceptions, during the five business day period after any ten consecutive trad-ing day period in which the trading price per note for each day of that period was less than 95% of the product of the sale price of Nabors’ common shares and the then applicable exchange rate; or if Nabors Delaware calls the notes for redemption; or upon the occurrence of specified corporate transactions described in the note indenture. See a detailed discussion of the terms of these notes included in Note 9 to our accompanying consolidated financial statements in Part II, Item 8.
As of December 31, 2006, we had outstanding purchase com-mitments of approximately $567.4 million, primarily for rig-related enhancing, construction and sustaining capital expenditures. Total capital expenditures over the next twelve months, including these
58 | NBR
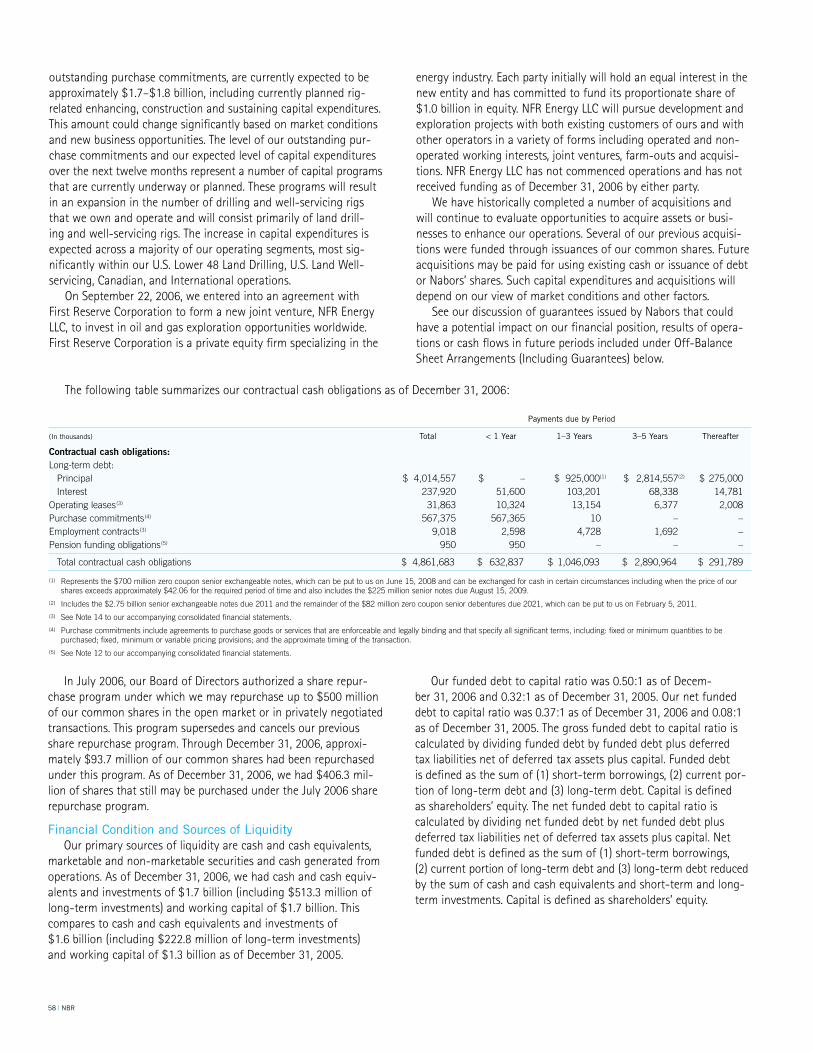
Payments due by Period
(In thousands) Total < 1 Year 1–3 Years 3–5 Years Thereafter
Contractual cash obligations: Long-term debt: Principal $ 4,014,557 $ – $ 925,000(1) $ 2,814,557(2) $ 275,000 Interest 237,920 51,600 103,201 68,338 14,781 Operating leases(3) 31,863 10,324 13,154 6,377 2,008 Purchase commitments(4) 567,375 567,365 10 – – Employment contracts(3) 9,018 2,598 4,728 1,692 – Pension funding obligations(5) 950 950 – – –
Total contractual cash obligations $ 4,861,683 $ 632,837 $ 1,046,093 $ 2,890,964 $ 291,789
(1) Represents the $700 million zero coupon senior exchangeable notes, which can be put to us on June 15, 2008 and can be exchanged for cash in certain circumstances including when the price of our shares exceeds approximately $42.06 for the required period of time and also includes the $225 million senior notes due August 15, 2009.
(2) Includes the $2.75 billion senior exchangeable notes due 2011 and the remainder of the $82 million zero coupon senior debentures due 2021, which can be put to us on February 5, 2011.(3) See Note 14 to our accompanying consolidated financial statements.(4) Purchase commitments include agreements to purchase goods or services that are enforceable and legally binding and that specify all significant terms, including: fixed or minimum quantities to be
purchased; fixed, minimum or variable pricing provisions; and the approximate timing of the transaction.(5) See Note 12 to our accompanying consolidated financial statements.
outstanding purchase commitments, are currently expected to be approximately $1.7–$1.8 billion, including currently planned rig-related enhancing, construction and sustaining capital expenditures. This amount could change significantly based on market conditions and new business opportunities. The level of our outstanding pur-chase commitments and our expected level of capital expenditures over the next twelve months represent a number of capital programs that are currently underway or planned. These programs will result in an expansion in the number of drilling and well-servicing rigs that we own and operate and will consist primarily of land drill-ing and well-servicing rigs. The increase in capital expenditures is expected across a majority of our operating segments, most sig-nificantly within our U.S. Lower 48 Land Drilling, U.S. Land Well- servicing, Canadian, and International operations.
On September 22, 2006, we entered into an agreement with First Reserve Corporation to form a new joint venture, NFR Energy LLC, to invest in oil and gas exploration opportunities worldwide. First Reserve Corporation is a private equity firm specializing in the
energy industry. Each party initially will hold an equal interest in the new entity and has committed to fund its proportionate share of $1.0 billion in equity. NFR Energy LLC will pursue development and exploration projects with both existing customers of ours and with other operators in a variety of forms including operated and non-operated working interests, joint ventures, farm-outs and acquisi-tions. NFR Energy LLC has not commenced operations and has not received funding as of December 31, 2006 by either party.
We have historically completed a number of acquisitions and will continue to evaluate opportunities to acquire assets or busi-nesses to enhance our operations. Several of our previous acquisi-tions were funded through issuances of our common shares. Future acquisitions may be paid for using existing cash or issuance of debt or Nabors’ shares. Such capital expenditures and acquisitions will depend on our view of market conditions and other factors.
See our discussion of guarantees issued by Nabors that could have a potential impact on our financial position, results of opera-tions or cash flows in future periods included under Off-Balance Sheet Arrangements (Including Guarantees) below.
The following table summarizes our contractual cash obligations as of December 31, 2006:
In July 2006, our Board of Directors authorized a share repur-chase program under which we may repurchase up to $500 million of our common shares in the open market or in privately negotiated transactions. This program supersedes and cancels our previous share repurchase program. Through December 31, 2006, approxi-mately $93.7 million of our common shares had been repurchased under this program. As of December 31, 2006, we had $406.3 mil-lion of shares that still may be purchased under the July 2006 share repurchase program.
Financial Condition and Sources of LiquidityOur primary sources of liquidity are cash and cash equivalents,
marketable and non-marketable securities and cash generated from operations. As of December 31, 2006, we had cash and cash equiv-alents and investments of $1.7 billion (including $513.3 million of long-term investments) and working capital of $1.7 billion. This compares to cash and cash equivalents and investments of $1.6 billion (including $222.8 million of long-term investments) and working capital of $1.3 billion as of December 31, 2005.
Our funded debt to capital ratio was 0.50:1 as of Decem- ber 31, 2006 and 0.32:1 as of December 31, 2005. Our net funded debt to capital ratio was 0.37:1 as of December 31, 2006 and 0.08:1 as of December 31, 2005. The gross funded debt to capital ratio is calculated by dividing funded debt by funded debt plus deferred tax liabilities net of deferred tax assets plus capital. Funded debt is defined as the sum of (1) short-term borrowings, (2) current por-tion of long-term debt and (3) long-term debt. Capital is defined as shareholders’ equity. The net funded debt to capital ratio is calculated by dividing net funded debt by net funded debt plus deferred tax liabilities net of deferred tax assets plus capital. Net funded debt is defined as the sum of (1) short-term borrowings, (2) current portion of long-term debt and (3) long-term debt reduced by the sum of cash and cash equivalents and short-term and long-term investments. Capital is defined as shareholders’ equity.
NBR | 59
Both of these ratios are a method for calculating the amount of leverage a company has in relation to its capital. Long-term invest-ments consist of investments in overseas funds investing primar- ily in a variety of public and private U.S. and non-U.S. securities (including asset-backed securities and mortgage-backed securities, global structured asset securitizations, whole loan mortgages, and participations in whole loans and whole loan mortgages). These investments are classified as non-marketable, because they do not have published fair values. Our interest coverage ratio was 39.2:1 as of December 31, 2006, compared to 26.1:1 as of December 31, 2005. The interest coverage ratio is computed by calculating the sum of income before income taxes, interest expense, depreciation and amortization, and depletion expense less investment income and then dividing by interest expense. This ratio is a method for calculating the amount of operating cash flows available to cover interest expense.
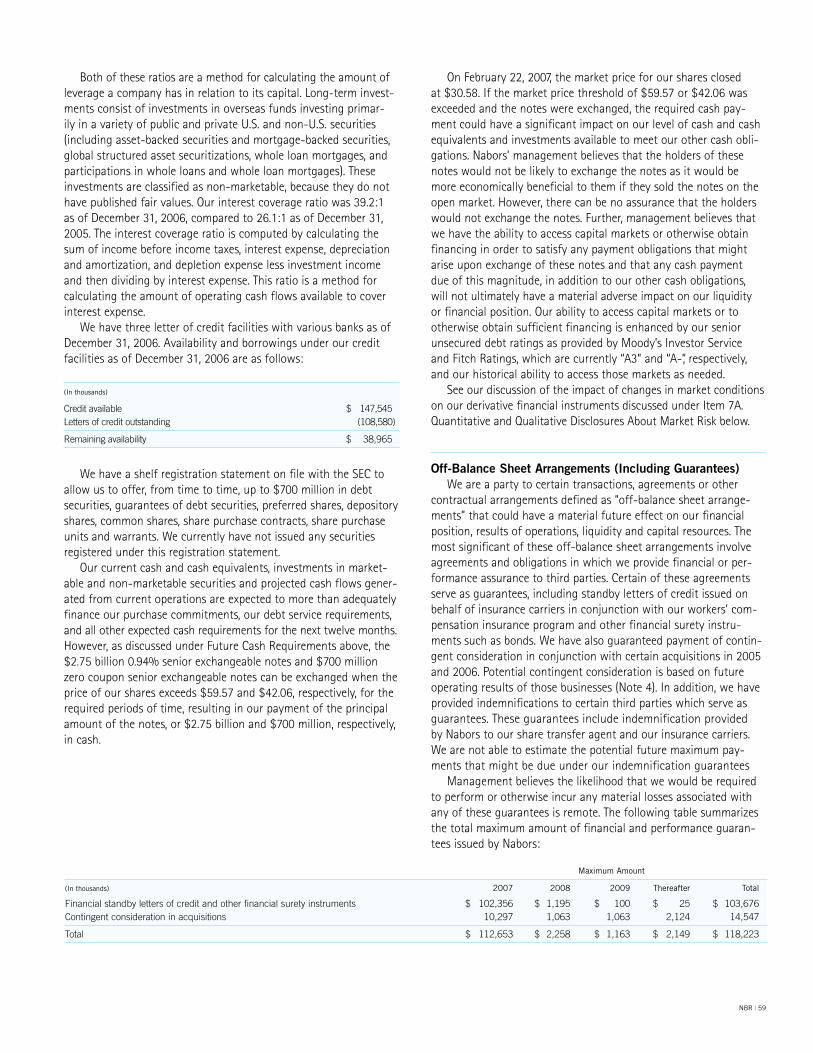
We have three letter of credit facilities with various banks as of December 31, 2006. Availability and borrowings under our credit facilities as of December 31, 2006 are as follows:
(In thousands)
Credit available $ 147,545 Letters of credit outstanding (108,580)
Remaining availability $ 38,965
We have a shelf registration statement on file with the SEC to allow us to offer, from time to time, up to $700 million in debt securities, guarantees of debt securities, preferred shares, depository shares, common shares, share purchase contracts, share purchase units and warrants. We currently have not issued any securities registered under this registration statement.
Our current cash and cash equivalents, investments in market-able and non-marketable securities and projected cash flows gener-ated from current operations are expected to more than adequately finance our purchase commitments, our debt service requirements, and all other expected cash requirements for the next twelve months. However, as discussed under Future Cash Requirements above, the $2.75 billion 0.94% senior exchangeable notes and $700 million zero coupon senior exchangeable notes can be exchanged when the price of our shares exceeds $59.57 and $42.06, respectively, for the required periods of time, resulting in our payment of the principal amount of the notes, or $2.75 billion and $700 million, respectively, in cash.
On February 22, 2007, the market price for our shares closed at $30.58. If the market price threshold of $59.57 or $42.06 was exceeded and the notes were exchanged, the required cash pay-ment could have a significant impact on our level of cash and cash equivalents and investments available to meet our other cash obli-gations. Nabors’ management believes that the holders of these notes would not be likely to exchange the notes as it would be more economically beneficial to them if they sold the notes on the open market. However, there can be no assurance that the holders would not exchange the notes. Further, management believes that we have the ability to access capital markets or otherwise obtain financing in order to satisfy any payment obligations that might arise upon exchange of these notes and that any cash payment due of this magnitude, in addition to our other cash obligations, will not ultimately have a material adverse impact on our liquidity or financial position. Our ability to access capital markets or to otherwise obtain sufficient financing is enhanced by our senior unsecured debt ratings as provided by Moody’s Investor Service and Fitch Ratings, which are currently “A3” and “A-”, respectively, and our historical ability to access those markets as needed.
See our discussion of the impact of changes in market conditions on our derivative financial instruments discussed under Item 7A. Quantitative and Qualitative Disclosures About Market Risk below.
Off-Balance Sheet Arrangements (Including Guarantees)We are a party to certain transactions, agreements or other
contractual arrangements defined as “off-balance sheet arrange-ments” that could have a material future effect on our financial position, results of operations, liquidity and capital resources. The most significant of these off-balance sheet arrangements involve agreements and obligations in which we provide financial or per-formance assurance to third parties. Certain of these agreements serve as guarantees, including standby letters of credit issued on behalf of insurance carriers in conjunction with our workers’ com-pensation insurance program and other financial surety instru-ments such as bonds. We have also guaranteed payment of contin-gent consideration in conjunction with certain acquisitions in 2005 and 2006. Potential contingent consideration is based on future operating results of those businesses (Note 4). In addition, we have provided indemnifications to certain third parties which serve as guarantees. These guarantees include indemnification provided by Nabors to our share transfer agent and our insurance carriers. We are not able to estimate the potential future maximum pay-ments that might be due under our indemnification guarantees
Management believes the likelihood that we would be required to perform or otherwise incur any material losses associated with any of these guarantees is remote. The following table summarizes the total maximum amount of financial and performance guaran-tees issued by Nabors:
Maximum Amount
(In thousands) 2007 2008 2009 Thereafter Total
Financial standby letters of credit and other financial surety instruments $ 102,356 $ 1,195 $ 100 $ 25 $ 103,676 Contingent consideration in acquisitions 10,297 1,063 1,063 2,124 14,547
Total $ 112,653 $ 2,258 $ 1,163 $ 2,149 $ 118,223
60 | NBR
Other Matters
Recent Legislation, Coast Guard Regulations and ActionsOur Sea Mar division time charters supply vessels to offshore
operators in U.S. waters. The vessels are owned by one of our financing company subsidiaries, but are operated and managed by a U.S. citizen-controlled company pursuant to long-term bareboat charters. As a result of recent legislation, beginning in August 2007, Sea Mar will no longer be able to use this arrangement to qualify vessels for employment in the U.S. coastwise trade. Accordingly, we will be required to restructure the arrangement, redeploy the vessels outside the United States, or sell the vessels by no later than such time.
As of December 31, 2006, the net assets of Sea Mar totaled approximately $154.4 million. During 2006, Sea Mar had income before income taxes totaling $43.3 million.
Recent Accounting PronouncementsIn June 2006, the Financial Accounting Standards Board (“FASB”)
issued Interpretation No. 48 (“FIN 48”), “Accounting for Uncertainty in Income Taxes,” which prescribes a comprehensive model for how a company should recognize, measure, present and disclose in its financial statements uncertain tax positions that the company has taken or expects to take on a tax return. Under FIN 48, the financial statements will reflect expected future tax consequences of such positions presuming the taxing authorities’ full knowledge of the position and all relevant facts, but without considering time values. FIN 48 is likely to cause greater volatility in income statements as more items are recognized discretely within income tax expense. Application of FIN 48 is required in financial statements effective for periods beginning after December 15, 2006. FIN 48 revises disclo-sure requirements and will require an annual tabular roll-forward of unrecognized tax benefits. We expect to adopt FIN 48 beginning January 1, 2007. We are currently evaluating the impact that this interpretation may have on our consolidated financial statements. Any adjustment required as a result of the adoption of FIN 48, which may be material, will be recorded to retained earnings.
In September 2006, the FASB issued Statement of Financial Accounting Standards (“SFAS”) No. 157, “Fair Value Measurements.” This statement establishes a framework for measuring fair value in generally accepted accounting principles and expands disclosures about fair value measurements. SFAS 157 is effective for financial statements issued for fiscal years beginning after November 15, 2007, and interim periods within those fiscal years. The provisions of SFAS 157 should be applied prospectively as of the beginning of the fiscal year in which SFAS 157 is initially applied, except in limited circumstances. We expect to adopt SFAS 157 beginning Jan-uary 1, 2008. We are currently evaluating the impact that this pro-nouncement may have on our consolidated financial statements.
In September 2006, the FASB issued SFAS No. 158, “Employers’ Accounting for Defined Benefit Pension and Other Postretirement Plans — an amendment of FASB Statements No. 87, 88, 106 and 132(R).” This statement requires companies to recognize a net lia-bility or asset to report the funded status of their defined benefit pension and other postretirement benefit plans in its statement of financial position and to recognize changes in that funded status in the year in which the changes occur through comprehensive
income. SFAS 158 is required to be applied in financial statements effected for periods ending after December 15, 2006. The adoption of SFAS 158 did not have a material impact on our consolidated results of operations or financial condition.
In February 2007, the FASB issued SFAS No. 159, “The Fair Value Option for Financial Assets and Financial Liabilities — Including an amendment of FASB Statement No. 115.” This statement permits entities to choose to measure many financial instruments and cer-tain other items at fair value that are not currently required to be measured at fair value and establishes presentation and disclosure requirements designed to facilitate comparisons between entities that choose different measurement attributes for similar types of assets and liabilities. SFAS 159 is effective as of the beginning of an entity’s first fiscal year that begins after November 15, 2007. Early adoption is permitted as of the beginning of a fiscal year that begins on or before November 15, 2007, provided the entity also elects to apply the provisions of SFAS No. 157. We expect to adopt SFAS 159 beginning January 1, 2008. We are currently evaluating the impact that this pronouncement may have on our consolidated financial statements.
The Company has several stock-based employee compensation plans, which are more fully described in Note 3 to our accompany-ing consolidated financial statements. Prior to January 1, 2006, we accounted for awards granted under those plans following the rec-ognition and measurement principles of Accounting Principles Bul-letin Opinion No. 25, “Accounting for Stock Issued to Employees,” (“APB 25”) and related interpretations. Under APB 25, no compen-sation expense is recognized when the option price is equal to the market price of the underlying stock on the date of award. We gen-erally did not recognize compensation expense in connection with stock option awards to employees, directors and officers under our plans. See Note 3 and Item 3. Legal Proceedings. Under the provi-sions of FASB Statement of Financial Accounting Standards No. 123, “Accounting for Stock-Based Compensation,” (“SFAS 123”), the pro forma effects on income for stock options were instead disclosed in a footnote to the financial statements. Compensation expense was recorded in the income statement for restricted stock awards over the vesting period of the award.
Effective January 1, 2006, we adopted the fair value recognition provisions of FASB Statement of Financial Accounting Standards No. 123(R), “Share-Based Payment,” (“SFAS 123-R”), using the modi-fied prospective application method. Under this transition method, the Company will record compensation expense for all stock option awards granted after the date of adoption and for the unvested portion of previously granted stock option awards that remain out-standing at the date of adoption. The amount of compensation cost recognized was based on the grant-date fair value estimated in accordance with the original provisions of SFAS No. 123. Results for prior periods have not been restated.
As a result of adopting SFAS 123-R on January 1, 2006, Nabors’ income before income taxes and net income for the year ended December 31, 2006 was $16.6 million, and $12.4 million lower, respectively, than if we had continued to account for share-based compensation under APB 25. Basic and diluted earnings per share were $.04 and $.05 lower, respectively, for the year ended Decem-ber 31, 2006 as a result of adopting SFAS 123-R. See the disclosures required upon adoption of SFAS 123-R in Note 3 to our accompa-nying consolidated financial statements.
NBR | 61
Related Party TransactionsPursuant to his employment agreement entered into in Octo-
ber 1996, we provided an unsecured, non-interest bearing loan of approximately $2.9 million to Nabors’ Deputy Chairman, President and Chief Operating Officer. The loan was repaid to the Company on October 8, 2006.
Pursuant to their employment agreements, Nabors and its Chairman and Chief Executive Officer, Deputy Chairman, President and Chief Operating Officer, and certain other key employees entered into split-dollar life insurance agreements pursuant to which we paid a portion of the premiums under life insurance policies with respect to these individuals and, in certain instances, members of their families. Under these agreements, we are reim-bursed for such premiums upon the occurrence of specified events, including the death of an insured individual. Any recovery of pre-miums paid by Nabors could potentially be limited to the cash sur-render value of these policies under certain circumstances. As such, the values of these policies are recorded at their respective cash surrender values in our consolidated balance sheets. We have made premium payments to date totaling $11.2 million related to these policies. The cash surrender value of these policies of approximately $10.3 million and $10.1 million is included in other long-term assets in our consolidated balance sheets as of December 31, 2006 and 2005, respectively.
Under the Sarbanes-Oxley Act of 2002, the payment of premi-ums by Nabors under the agreements with our Chairman and Chief Executive Officer and with our Deputy Chairman, President and Chief Operating Officer may be deemed to be prohibited loans by us to these individuals. We have paid no premiums related to our agreements with these individuals since the adoption of the Sarbanes-Oxley Act and have postponed premium payments related to our agreements with these individuals.
In the ordinary course of business, we enter into various rig leases, rig transportation and related oilfield services agreements with our Alaskan and Saudi Arabian unconsolidated affiliates at market prices. Revenues from business transactions with these affiliated entities totaled $99.2 million, $82.3 million and $63.2 mil-lion for the years ended December 31, 2006, 2005 and 2004, respec-tively. Expenses from business transactions with these affiliated entities totaled $4.7 million, $4.0 million and $3.3 million for the years ended December 31, 2006, 2005 and 2004, respectively. Addi-tionally, we had accounts receivable from these affiliated entities of $41.2 million and $33.1 million as of December 31, 2006 and 2005, respectively. We had accounts payable to these affiliated entities of $0.3 million and $2.2 million as of December 31, 2006 and 2005, respectively, and long-term payables with these affiliated entities of $6.6 million and $5.8 million as of December 31, 2006 and 2005, respectively, which is included in other long-term liabilities.
Additionally, we own certain marine vessels that are chartered under a bareboat charter arrangement to Sea Mar Management LLC, an entity in which we own a 25% interest. Under the require-ments of FASB Interpretation No. 46R this entity was consolidated by Nabors beginning in 2004.
During the fourth quarter of 2006, the Company entered into a transaction with Shona Energy Company, LLC (“Shona”), a company in which Mr. Payne, an outside director of the Company, is the Chairman and Chief Executive Officer. Pursuant to the transaction,
a subsidiary of the Company acquired and holds a minority interest of less than 20% of the issued and outstanding common shares of Shona in exchange for certain rights derived from an oil and gas concession held by that subsidiary.
Critical Accounting EstimatesThe preparation of our financial statements in conformity with
GAAP requires management to make certain estimates and assump-tions. These estimates and assumptions affect the reported amounts of assets and liabilities, the disclosures of contingent assets and lia-bilities at the balance sheet date and the amounts of revenues and expenses recognized during the reporting period. We analyze our estimates based on our historical experience and various other assumptions that we believe to be reasonable under the circum-stances. However, actual results could differ from such estimates. The following is a discussion of our critical accounting estimates. Management considers an accounting estimate to be critical if:• it requires assumptions to be made that were uncertain at the time the estimate was made; and
• changes in the estimate or different estimates that could have been selected could have a material impact on our consolidated financial position or results of operations.
For a summary of all of our significant accounting policies, see Note 2 to the accompanying consolidated financial statements.
Depreciation of Property, Plant and Equipment The drilling, workover and well-servicing industries are very capital intensive. Property, plant and equipment represented 59% of our total assets as of December 31, 2006, and depreciation constituted 11% of our total costs and other deductions for the year ended December 31, 2006.
Depreciation for our primary operating assets, drilling and workover rigs, is calculated based on the units-of-production method over an approximate 4,900-day period, with the exception of our jack-up rigs which are depreciated over an 8,030-day period, after provision for salvage value. When our drilling and workover rigs are not operating, a depreciation charge is provided using the straight-line method over an assumed depreciable life of 20 years, with the exception of our jack-up rigs, where a 30-year depreciable life is used.
Depreciation on our buildings, well-servicing rigs, oilfield hauling and mobile equipment, marine transportation and supply vessels, aircraft equipment, and other machinery and equipment is com-puted using the straight-line method over the estimated useful life of the asset after provision for salvage value (buildings — 10 to 30 years; well-servicing rigs — 3 to 15 years; marine transportation and supply vessels — 10 to 25 years; aircraft equipment — 5 to 20 years; oilfield hauling and mobile equipment and other machinery and equipment — 3 to 10 years).
These depreciation periods and the salvage values of our prop-erty, plant and equipment were determined through an analysis of the useful lives of our assets and based on our experience with the salvage values of these assets. Periodically, we review our depreci-ation periods and salvage values for reasonableness given current conditions. Depreciation of property, plant and equipment is there-fore based upon estimates of the useful lives and salvage value of those assets. Estimation of these items requires significant management judgment. Accordingly, management believes that accounting estimates related to depreciation expense recorded on property, plant and equipment are critical.
62 | NBR
There have been no factors related to the performance of our portfolio of assets, changes in technology or other factors that indi-cate that these lives do not continue to be appropriate. Accordingly, for the years ended December 31, 2006, 2005 and 2004, no signifi-cant changes have been made to the depreciation rates applied to property, plant and equipment, the underlying assumptions related to estimates of depreciation, or the methodology applied. However, certain events could occur that would materially affect our estimates and assumptions related to depreciation. Unforeseen changes in operations or technology could substantially alter management’s assumptions regarding our ability to realize the return on our investment in operating assets and therefore affect the useful lives and salvage values of our assets.
Impairment of Long-Lived Assets As discussed above, the drill-ing, workover and well-servicing industries are very capital inten-sive, which is evident in the fact that our property, plant and equip-ment represented 59% of our total assets as of December 31, 2006. Other long-lived assets subject to impairment consist primarily of goodwill, which represented 4% of our total assets as of Decem- ber 31, 2006. We review our long-lived assets for impairment when events or changes in circumstances indicate that the carry-ing amounts of such assets may not be recoverable. In addition, we review goodwill and intangible assets with indefinite lives for impairment annually, as required by SFAS No. 142, “Goodwill and Other Intangible Assets.” An impairment loss is recorded in the period in which it is determined that the carrying amount of the long-lived asset is not recoverable. Such determination requires us to make judgments regarding long-term forecasts of future reve-nues and costs related to the assets subject to review in order to determine the future cash flows associated with the asset or, in the case of goodwill, our reporting units. These long-term forecasts are uncertain in that they require assumptions about demand for our products and services, future market conditions, technological advances in the industry, and changes in regulations governing the industry. Significant and unanticipated changes to the assumptions could require a provision for impairment in a future period. As the determination of whether impairment charges should be recorded on our long-lived assets is subject to significant management judg-ment and an impairment of these assets could result in a material charge on our consolidated statements of income, management believes that accounting estimates related to impairment of long-lived assets are critical.
Assumptions made in the determination of future cash flows are made with the involvement of management personnel at the opera-tional level where the most specific knowledge of market conditions and other operating factors exists. For the years ended December 31, 2006, 2005 and 2004, no significant changes have been made to the methodology utilized to determine future cash flows.
Given the nature of the evaluation of future cash flows and the application to specific assets and specific times, it is not possible to reasonably quantify the impact of changes in these assumptions.
Income Taxes Deferred taxes represent a substantial liability for Nabors. For financial reporting purposes, management determines our current tax liability as well as those taxes incurred as a result of current operations yet deferred until future periods. In accordance with the liability method of accounting for income taxes as speci-fied in SFAS No. 109, “Accounting for Income Taxes,” the provision
for income taxes is the sum of income taxes both currently payable and deferred. Currently payable taxes represent the liability related to our income tax return for the current year while the net deferred tax expense or benefit represents the change in the balance of deferred tax assets or liabilities reported on our consolidated balance sheets. The tax effects of unrealized gains and losses on investments and derivative financial instruments are recorded through accumulated other comprehensive income (loss) within shareholders’ equity. The changes in deferred tax assets or liabilities are determined based upon changes in differences between the basis of assets and liabilities for financial reporting purposes and the basis of assets and liabilities for tax purposes as measured by the enacted tax rates that management estimates will be in effect when these differences reverse. In addition to estimating the future tax rates applicable to the reversal of tax differences, management must also make certain assumptions regarding whether tax differ-ences are permanent or temporary, management must estimate the timing of their reversal, and whether taxable operating income in future periods will be sufficient to fully recognize any gross deferred tax assets. Valuation allowances are established to reduce deferred tax assets when it is more likely than not that some por-tion or all of the deferred tax assets will not be realized. In deter-mining the need for valuation allowances, management has consid-ered and made judgments and estimates regarding estimated future taxable income and ongoing prudent and feasible tax planning strategies. These judgments and estimates are made for each tax jurisdiction in which we operate as the calculation of deferred taxes is completed at that level. Further, under U.S. federal tax law, the amount and availability of loss carryforwards (and certain other tax attributes) are subject to a variety of interpretations and restrictive tests applicable to Nabors and our subsidiaries. The utilization of such carryforwards could be limited or effectively lost upon certain changes in ownership. Accordingly, although we believe substantial loss carryforwards are available to us, no assurance can be given concerning the realization of such loss carryforwards, or whether or not such loss carryforwards will be available in the future. These loss carryforwards are also considered in our calculation of taxes for each jurisdiction in which we operate. Additionally, we record reserves for uncertain tax positions which are subject to a signifi-cant level of management judgment related to the ultimate resolu-tion of those tax positions. Accordingly, management believes that the estimate related to the provision for income taxes is critical to our results of operations. We have received notifications from the IRS on various matters as a result of IRS audits of certain tax years. See Item 1A. Risk Factors — We may have additional tax liabilities and Note 10 under Item 8. Financial Statements and Supplementary Data for additional discussion.
We are subject to income taxes in both the United States and numerous foreign jurisdictions. Significant judgment is required in determining our worldwide provision for income taxes. In the ordi-nary course of our business, there are many transactions and calcu-lations where the ultimate tax determination is uncertain. We are regularly under audit by tax authorities. Although we believe our tax estimates are reasonable, the final determination of tax audits and any related litigation could be materially different than that which is reflected in historical income tax provisions and accruals. Based on the results of an audit or litigation, a material effect on
NBR | 63
our financial position, income tax provision, net income, or cash flows in the period or periods for which that determination is made could result.
For the years ended December 31, 2006, 2005 and 2004, man-agement made no material changes in its assumptions regarding the determination of the provision for income taxes. However, cer-tain events could occur that would materially affect management’s estimates and assumptions regarding the deferred portion of our income tax provision, including estimates of future tax rates appli-cable to the reversal of tax differences, the classification of tim- ing differences as temporary or permanent, reserves recorded for uncertain tax positions, and any valuation allowance recorded as a reduction to our deferred tax assets. Management’s assumptions related to the preparation of our income tax provision have histor-ically proved to be reasonable in light of the ultimate amount of tax liability due in all taxing jurisdictions.
For the year ended December 31, 2006, our provision for income taxes was $450.2 million, consisting of $231.9 million of current tax expense and $218.3 million of deferred tax expense. Changes in management’s estimates and assumptions regarding the tax rate applied to deferred tax assets and liabilities, the ability to realize the value of deferred tax assets, or the timing of the reversal of tax basis differences could potentially impact the provision for income taxes. Changes in these assumptions could potentially change the effective tax rate. A 1% change in the effective tax rate from 31% to 32% would increase the current year income tax provision by approximately $14.7 million.
Self-Insurance Reserves Our operations are subject to many hazards inherent in the drilling, workover and well-servicing industries, including blowouts, cratering, explosions, fires, loss of well control, loss of hole, damaged or lost drilling equipment and damage or loss from inclement weather or natural disasters. Any of these hazards could result in personal injury or death, damage to or destruction of equipment and facilities, suspension of opera-tions, environmental damage and damage to the property of others. Generally, drilling contracts provide for the division of responsibilities between a drilling company and its customer, and we seek to obtain indemnification from our customers by contract for certain of these risks. To the extent that we are unable to trans-fer such risks to customers by contract or indemnification agree-ments, we seek protection through insurance. However, there is no assurance that such insurance or indemnification agreements will adequately protect us against liability from all of the consequences of the hazards described above. Moreover, our insurance coverage generally provides that we assume a portion of the risk in the form of a deductible or self-insured retention.
Based on the risks discussed above, it is necessary for us to estimate the level of our liability related to insurance and record reserves for these amounts in our consolidated financial statements. Reserves related to self-insurance are based on the facts and circum-stances specific to the claims and our past experience with similar claims. The actual outcome of self-insured claims could differ signifi-cantly from estimated amounts. We maintain actuarially-determined accruals in our consolidated balance sheets to cover self-insurance retentions for workers’ compensation, employers’ liability, general liability and automobile liability claims. These accruals are based
on certain assumptions developed utilizing historical data to project future losses. Loss estimates in the calculation of these accruals are adjusted based upon actual claim settlements and reported claims. These loss estimates and accruals recorded in our financial state-ments for claims have historically been reasonable in light of the actual amount of claims paid.
As the determination of our liability for self-insured claims is subject to significant management judgment and in certain instances is based on actuarially estimated and calculated amounts, and such liabilities could be material in nature, management believes that accounting estimates related to self-insurance reserves are critical.
For the years ended December 31, 2006, 2005 and 2004, no significant changes have been made to the methodology utilized to estimate insurance reserves. For purposes of earnings sensitiv- ity analysis, if the December 31, 2006 reserves for insurance were adjusted (increased or decreased) by 10%, total costs and other deductions would have changed by $13.0 million, or 0.4%.
Fair Value of Assets Acquired and Liabilities Assumed We have completed a number of acquisitions in recent years as dis-cussed in Note 4 to our accompanying consolidated financial state-ments. In conjunction with our accounting for these acquisitions, it was necessary for us to estimate the values of the assets acquired and liabilities assumed in the various business combinations, which involved the use of various assumptions. These estimates may be affected by such factors as changing market conditions, technolog-ical advances in the industry or changes in regulations governing the industry. The most significant assumptions, and the ones requir-ing the most judgment, involve the estimated fair values of prop-erty, plant and equipment, and the resulting amount of goodwill, if any. Unforeseen changes in operations or technology could sub-stantially alter management’s assumptions and could result in lower estimates of values of acquired assets or of future cash flows. This could result in impairment charges being recorded in our consoli-dated statements of income. As the determination of the fair value of assets acquired and liabilities assumed is subject to significant management judgment and a change in purchase price allocations could result in a material difference in amounts recorded in our consolidated financial statements, management believes that accounting estimates related to the valuation of assets acquired and liabilities assumed are critical.
The determination of the fair value of assets and liabilities are based on the market for the assets and the settlement value of the liabilities. These estimates are made by management based on our experience with similar assets and liabilities. For the years ended December 31, 2006, 2005 and 2004, no significant changes have been made to the methodology utilized to value assets acquired or liabilities assumed. As we have not recorded any significant impairment charges on property, plant and equipment or goodwill in any of the years ended December 31, 2006, 2005 and 2004, our estimates of the fair values of assets acquired and liabilities assumed have proved to be reliable.
Given the nature of the evaluation of the fair value of assets acquired and liabilities assumed and the application to specific assets and liabilities, it is not possible to reasonably quantify the impact of changes in these assumptions.
64 | NBR
Share-Based Compensation We have typically compensated our executives and employees through the awarding of stock options. Based on the requirements of SFAS 123(R), which we adopted on January 1, 2006, we account for stock option awards in 2006 using a fair-value based method, resulting in compensation expense for stock option awards being recorded in our consolidated statements of income. Additionally, under the provisions of SFAS No. 148, “Accounting for Stock-Based Compensation — an Amendment to FAS 123,” we are currently required to disclose the effect on our net income and earnings per share as if we had applied the fair value recognition provisions of SFAS 123 to the periods presented in our consolidated statements of income, for the years ended December 31, 2005 and 2004. This tabular disclosure is included in Note 3 to our accompanying consolidated financial statements. Determining the fair value of stock-based awards at the grant date requires judgment, including estimating the expected term of stock options, the expected volatility of our stock and expected dividends. In addition, judgment is also required in estimating the amount of stock-based awards that are expected to be forfeited. As the determination of these vari-ous assumptions is subject to significant management judgment and different assumptions could result in material differences in amounts recorded in our consolidated financial statements begin-ning in the first quarter of 2006 and in our disclosure presented in the footnotes to our accompanying consolidated financial state-ments for the years ended December 31, 2005, 2004 and 2003, management believes that accounting estimates related to the valuation of stock options are critical.
The assumptions used to estimate the fair market value of our stock options are based on historical and expected performance of our common shares in the open market, expectations with regard to the pattern with which our employees will exercise their options and the likelihood that dividends will be paid to holders of our common shares. For the years ended December 31, 2006, 2005 and 2004, no significant changes have been made to the methodology utilized to determine the assumptions used in these calculations.
Item 7A Quantitative and Qualitative Disclosures About Market Risk
We may be exposed to certain market risks arising from the use of financial instruments in the ordinary course of business. This risk arises primarily as a result of potential changes in the fair market value of financial instruments that would result from adverse fluctuations in foreign currency exchange rates, credit risk, interest rates, and marketable and non-marketable security prices as discussed below.
Foreign Currency Risk We operate in a number of international areas and are involved in transactions denominated in currencies other than U.S. dollars, which exposes us to foreign exchange rate risk. The most significant exposures arise in connection with our operations in Canada, which usually are substantially unhedged.
At various times, we utilize local currency borrowings (foreign currency-denominated debt), the payment structure of customer contracts and foreign exchange contracts to selectively hedge our exposure to exchange rate fluctuations in connection with mone-tary assets, liabilities, cash flows and commitments denominated in certain foreign currencies. A foreign exchange contract is a foreign
currency transaction, defined as an agreement to exchange differ-ent currencies at a given future date and at a specified rate. A hypothetical 10% decrease in the value of all our foreign currencies relative to the U.S. dollar as of December 31, 2006 would result in a $9.1 million decrease in the fair value of our net monetary assets denominated in currencies other than U.S. dollars.
Credit Risk Our financial instruments that potentially subject us to concentrations of credit risk consist primarily of cash equiva-lents, investments and marketable and non-marketable securities, accounts receivable and our range cap and floor derivative instru-ments. Cash equivalents such as deposits and temporary cash investments are held by major banks or investment firms. Our investments in marketable and non-marketable securities are man-aged within established guidelines which limit the amounts that may be invested with any one issuer and which provide guidance as to issuer credit quality. We believe that the credit risk in such instruments is minimal. In addition, our trade receivables are with a variety of U.S., international and foreign-country national oil and gas companies. Management considers this credit risk to be limited due to the financial resources of these companies. We perform ongoing credit evaluations of our customers and we generally do not require material collateral. However, we do occasionally require prepayment of amounts from customers whose creditworthiness is in question prior to provision of services to those customers. We maintain reserves for potential credit losses, and such losses have been within management’s expectations.
Interest Rate, and Marketable and Non-marketable Security Price Risk Our financial instruments that are potentially sensitive to changes in interest rates include the $2.75 billion 0.94% senior exchangeable notes due 2011, our $82.8 million zero coupon con-vertible senior debentures, our $700 million zero coupon senior exchangeable notes, our 4.875% and 5.375% senior notes, our range cap and floor derivative instruments, our investments in debt secu-rities (including corporate, asset-backed, U.S. Government, Gov-ernment agencies, foreign government, mortgage-backed debt and mortgage-CMO debt securities) and our investments in overseas funds investing primarily in a variety of public and private U.S. and non-U.S. securities (including asset-backed securities and mort-gage-backed securities, global structured asset securitizations, whole loan mortgages, and participations in whole loans and whole loan mortgages), which are classified as non-marketable securities.
We may utilize derivative financial instruments that are intended to manage our exposure to interest rate risks. We account for deriva-tive financial instruments under SFAS No. 133, “Accounting for Deriv-ative Instruments and Hedging Activities,” SFAS No. 138, “Accounting for Certain Derivative Instruments and Certain Hedging Activities,” and SFAS No. 149, “Amendment of Statement 133 on Derivative Instruments and Hedging Activities,” (collectively, “SFAS 133, as amended”). The use of derivative financial instruments could expose us to further credit risk and market risk. Credit risk in this context is the failure of a counterparty to perform under the terms of the derivative contract. When the fair value of a derivative contract is positive, the counterparty would owe us, which can create credit risk for us. When the fair value of a derivative contract is negative, we would owe the counterparty, and therefore, we would not be

NBR | 65
exposed to credit risk. We attempt to minimize credit risk in deriva-tive instruments by entering into transactions with major financial institutions that have a significant asset base. Market risk related to derivatives is the adverse effect to the value of a financial instru-ment that results from changes in interest rates. We try to manage market risk associated with interest-rate contracts by establishing and monitoring parameters that limit the type and degree of mar-ket risk that we undertake.
Our $700 million zero coupon senior exchangeable notes include a contingent interest provision, discussed under Liquidity and Capi-tal Resources above, which qualifies as an embedded derivative under SFAS 133, as amended. This embedded derivative is required to be separated from the notes and valued at its fair value at the incep-tion of the note indenture. Any subsequent change in fair value of this embedded derivative would be recorded in our consolidated statements of income. The fair value of the contingent interest pro-vision at inception of the note indenture was nominal. In addition, there was no significant change in the fair value of this embedded derivative through December 31, 2006, resulting in no impact on our consolidated statements of income for the year ended Decem-ber 31, 2006.
On October 21, 2002, we entered into an interest rate swap transaction with a third-party financial institution to hedge our exposure to changes in the fair value of $200 million of our fixed rate 5.375% senior notes due 2012, which has been designated as a fair value hedge under SFAS 133, as amended. Additionally, on October 21, 2002, we purchased a LIBOR range cap and sold a
LIBOR floor, in the form of a cashless collar, with the same third-party financial institution with the intention of mitigating and managing our exposure to changes in the three-month U.S. dollar LIBOR rate. This transaction does not qualify for hedge accounting treatment under SFAS 133, as amended, and any change in the cumulative fair value of this transaction is reflected as a gain or loss in our consolidated statements of income. In June 2004 we unwound $100 million of the $200 million range cap and floor derivative instrument. During the fourth quarter of 2005, we unwound the interest rate swap resulting in a loss of $2.7 million, which has been deferred and will be recognized as an increase to interest expense over the remaining life of our 5.375% senior notes due 2012. During the years ended December 31, 2005 and 2004, we recorded interest savings related to our interest rate swap agreement accounted for as a fair value hedge of $2.7 million and $6.5 million, respectively, which served to reduce interest expense.
The fair value of our range cap and floor transaction is recorded as a derivative asset, included in other long-term assets, and totaled approximately $2.3 million and $1.5 million as of December 31, 2006 and 2005, respectively. We recorded gains of approximately $1.4 million, $1.1 million and $2.4 million for the years ended December 31, 2006, 2005 and 2004, respectively, related to this derivative instrument; such amounts are included in losses (gains) on sales of long-lived assets, impairment charges and other expense (income), net in our consolidated statements of income.
A hypothetical 10% adverse shift in quoted interest rates as of December 31, 2006 would decrease the fair value of our range cap and floor derivative instrument by approximately $1.0 million.
December 31,
(In thousands, except interest rates) 2006 2005
Effective Effective Interest Carrying Interest Carrying Rate Value Fair Value Rate Value Fair Value
$2.75 billion 0.94% senior exchangeable notes due May 2011 1.09% $ 2,750,000 $ 2,628,725 – $ – $ –$700 million zero coupon senior exchangeable notes due June 2023 0.32% 700,000 730,380 0% 700,000 826,7005.375% senior notes due August 2012 5.67%(1) 271,470(2) 270,545 4.52%(1) 270,844(2) 278,2854.875% senior notes due August 2009 5.09% 224,296 221,749 5.00% 224,030 224,730 $82.8 million zero coupon convertible senior debentures due February 2021 2.94%(3)
58,308 50,354 2.5%(3) 824,789 822,497
$ 4,004,074 $ 3,901,753 $ 2,019,663 $ 2,152,212
(1) Includes the effect of interest savings realized from the interest rate swap executed on October 21, 2002.(2) Includes $2.7 million as of December 31, 2005 related to the unamortized loss on the interest rate swap that was unwound during the fourth quarter of 2005 and $4.6 million as of December 31, 2004
related to the fair value of the interest rate swap.(3) Represents the rate at which accretion of the original discount at issuance of these debentures is charged to interest expense.
Fair Value of Financial Instruments The fair value of our fixed rate long-term debt is estimated based on quoted market prices or prices quoted from third-party financial institutions. The carrying and fair values of our long-term debt, including the current portion, are as follows:
66 | NBR
Our investments in marketable debt securities listed in the above table and a portion of our investment in non-marketable securities are sensitive to changes in interest rates. Additionally, our investment portfolio of marketable debt and equity securities, which are carried at fair value, expose us to price risk. A hypothetical 10% decrease in the market prices for all marketable securities as of December 31, 2006 would decrease the fair value of our available-for-sale securities by $43.9 million.
Item 8 Financial Statements and Supplementary Data
Index Page No.
Management’s Report on Internal Control Over Financial Reporting 67
Report of Independent Registered Public Accounting Firm 68
Consolidated Balance Sheets as of December 31, 2006 and 2005 69
Consolidated Statements of Income for the Years Ended December 31, 2006, 2005 and 2004 70
Consolidated Statements of Cash Flows for the Years Ended December 31, 2006, 2005 and 2004 71
Consolidated Statements of Changes in Shareholders’ Equity for the Years Ended December 31, 2006, 2005 and 2004 72
Notes to Consolidated Financial Statements 75
December 31,
(In thousands, except interest rates) 2006 2005
Weighted- Weighted- Average Life Average Life Fair Value Interest Rates (Years) Fair Value Interest Rates (Years)
Cash and cash equivalents $ 700,549 4.12%–5.37% 0.1 $ 565,001 2.87%–4.44% .1Available-for-sale marketable equity securities 117,220 N/A N/A 99,216 N/A N/A
Marketable debt securities: Commercial paper and CDs 16,778 5.04%–5.69% .3 269,053 3.91%–4.74% .3 Corporate debt securities 131,079 4.86%–5.76% 1.0 276,755 1.58%–4.91% .9 Government agencies debt securities 61,318 5.05%–5.76% .7 47,139 1.25%–4.19% .5Mortgage-backed debt securities 1,373 5.20%–5.69% 1.4 – – –Mortgage-CMO debt securities 49,629 4.99%–5.98% 1.0 5,081 3.89%–5.00% 1.2 Asset-backed debt securities 62,070 4.60%–5.83% 1.0 161,280 1.68%–4.62% .9Non-marketable securities 513,269 N/A N/A 235,641 N/A N/A
$ 1,653,285 $ 1,659,166
The fair values of our cash equivalents, trade receivables and trade payables approximate their carrying values due to the short-term nature of these instruments. Our cash and cash equivalents and short-term and long-term investments are included in the table below.
NBR | 67
MANAGEMENT’S REPORT ON INTERNAL CONTROL OVER FINANCIAL REPORTING
N a b o r s I n d u s t r i e s L t d . a n d S u b s i d i a r i e s
Management is responsible for establishing and maintaining adequate internal control over financial reporting. Our internal control over financial reporting is a process designed to provide reasonable assurance regarding the reliability of financial reporting and the preparation of financial statements for external purposes in accordance with generally accepted accounting principles. Our internal control over financial reporting includes those policies and procedures that (i) pertain to the maintenance of records that, in reasonable detail, accurately and fairly reflect the transactions and dispositions of the assets of the Company; (ii) provide reasonable assurance that transactions are recorded as necessary to permit preparation of financial statements in accordance with generally accepted accounting principles, and that receipts and expenditures of the Company are being made only in accordance with authoriza-tions of management and directors of the Company; and (iii) pro-vide reasonable assurance regarding prevention or timely detection of unauthorized acquisition, use, or disposition of the Company’s assets that could have a material effect on the financial statements.
Internal control over financial reporting cannot provide absolute assurance of achieving financial reporting objectives because of its inherent limitations. Internal control over financial reporting is a process that involves human diligence and compliance and is subject
to lapses in judgment and breakdowns resulting from human failures. Internal control over financial reporting also can be circumvented by collusion or improper management override. Because of such limitations, there is a risk that material misstatements may not be prevented or detected on a timely basis by internal control over financial reporting. However, these inherent limitations are known features of the financial reporting process. Therefore, it is possible to design into the process safeguards to reduce, though not elimi-nate, this risk.
Management conducted an evaluation of the effectiveness of the Company’s internal control over financial reporting based on the framework in Internal Control — Integrated Framework issued by the Committee of Sponsoring Organizations of the Treadway Commis-sion (COSO). Based on this evaluation, management concluded that the Company’s internal control over financial reporting was effective as of December 31, 2006. Management’s assessment of the effective-ness of the Company’s internal control over financial reporting as of December 31, 2006 has been audited by PricewaterhouseCoopers LLP, an independent registered public accounting firm, as stated in their report included herein which expresses an unqualified opinion on management’s assessment of the effectiveness of internal control over financial reporting as of December 31, 2006.
68 | NBR
To the Shareholders and Board of Directors of Nabors Industries Ltd.:
We have completed integrated audits of Nabors Industries Ltd.’s consolidated financial statements and of its internal control over financial reporting as of December 31, 2006, in accordance with the standards of the Public Company Accounting Oversight Board (United States). Our opinions, based on our audits, are presented below.
Consolidated financial statementsIn our opinion, the accompanying consolidated balance sheets
and the related consolidated statements of income, of cash flows and of changes in shareholders’ equity present fairly, in all material respects, the financial position of Nabors Industries Ltd. and its sub-sidiaries at December 31, 2006 and 2005, and the results of their operations and their cash flows for each of the three years in the period ended December 31, 2006 in conformity with accounting principles generally accepted in the United States of America. These financial statements are the responsibility of the Company’s manage-ment. Our responsibility is to express an opinion on these financial statements based on our audits. We conducted our audits of these statements in accordance with the standards of the Public Company Accounting Oversight Board (United States). Those standards require that we plan and perform the audit to obtain reasonable assurance about whether the financial statements are free of material misstate-ment. An audit of financial statements includes examining, on a test basis, evidence supporting the amounts and disclosures in the financial statements, assessing the accounting principles used and significant estimates made by management, and evaluating the overall financial statement presentation. We believe that our audits provide a reasonable basis for our opinion.
As discussed in Note 3 to the consolidated financial statements, effective January 1, 2006, the Company adopted the provisions of Statement of Financial Accounting Standards No. 123(R), “Share-Based Payment,” using the modified prospective application method.
Internal control over financial reportingAlso, in our opinion, management’s assessment, included in the
accompanying Management’s Report on Internal Control Over Finan-cial Reporting, that the Company maintained effective internal con-trol over financial reporting as of December 31, 2006 based on criteria established in Internal Control – Integrated Framework issued by the Committee of Sponsoring Organizations of the Treadway Com-mission (COSO), is fairly stated, in all material respects, based on those criteria. Furthermore, in our opinion, the Company main-tained, in all material respects, effective internal control over finan-cial reporting as of December 31, 2006, based on criteria established in Internal Control – Integrated Framework issued by the COSO. The Company’s management is responsible for maintaining effective
internal control over financial reporting and for its assessment of the effectiveness of internal control over financial reporting. Our responsibility is to express opinions on management’s assessment and on the effectiveness of the Company’s internal control over financial reporting based on our audit. We conducted our audit of internal control over financial reporting in accordance with the standards of the Public Company Accounting Oversight Board (United States). Those standards require that we plan and perform the audit to obtain reasonable assurance about whether effective internal control over financial reporting was maintained in all mate-rial respects. An audit of internal control over financial reporting includes obtaining an understanding of internal control over financial reporting, evaluating management’s assessment, testing and evaluating the design and operating effectiveness of internal control, and performing such other procedures as we consider necessary in the circumstances. We believe that our audit provides a reasonable basis for our opinions.
A company’s internal control over financial reporting is a process designed to provide reasonable assurance regarding the reliability of financial reporting and the preparation of financial statements for external purposes in accordance with generally accepted account-ing principles. A company’s internal control over financial reporting includes those policies and procedures that (i) pertain to the main-tenance of records that, in reasonable detail, accurately and fairly reflect the transactions and dispositions of the assets of the company; (ii) provide reasonable assurance that transactions are recorded as necessary to permit preparation of financial statements in accordance with generally accepted accounting principles, and that receipts and expenditures of the company are being made only in accordance with authorizations of management and directors of the company; and (iii) provide reasonable assurance regarding prevention or timely detection of unauthorized acquisition, use, or disposition of the company’s assets that could have a material effect on the financial statements.
Because of its inherent limitations, internal control over financial reporting may not prevent or detect misstatements. Also, projections of any evaluation of effectiveness to future periods are subject to the risk that controls may become inadequate because of changes in conditions, or that the degree of compliance with the policies or procedures may deteriorate.
/s/ PRICEWATERHOUSECOOPERS LLP
Houston, TexasMarch 1, 2007
REPORT OF INDEPENDENT REGISTERED PUBLIC ACCOUNTING FIRM
N a b o r s I n d u s t r i e s L t d . a n d S u b s i d i a r i e s
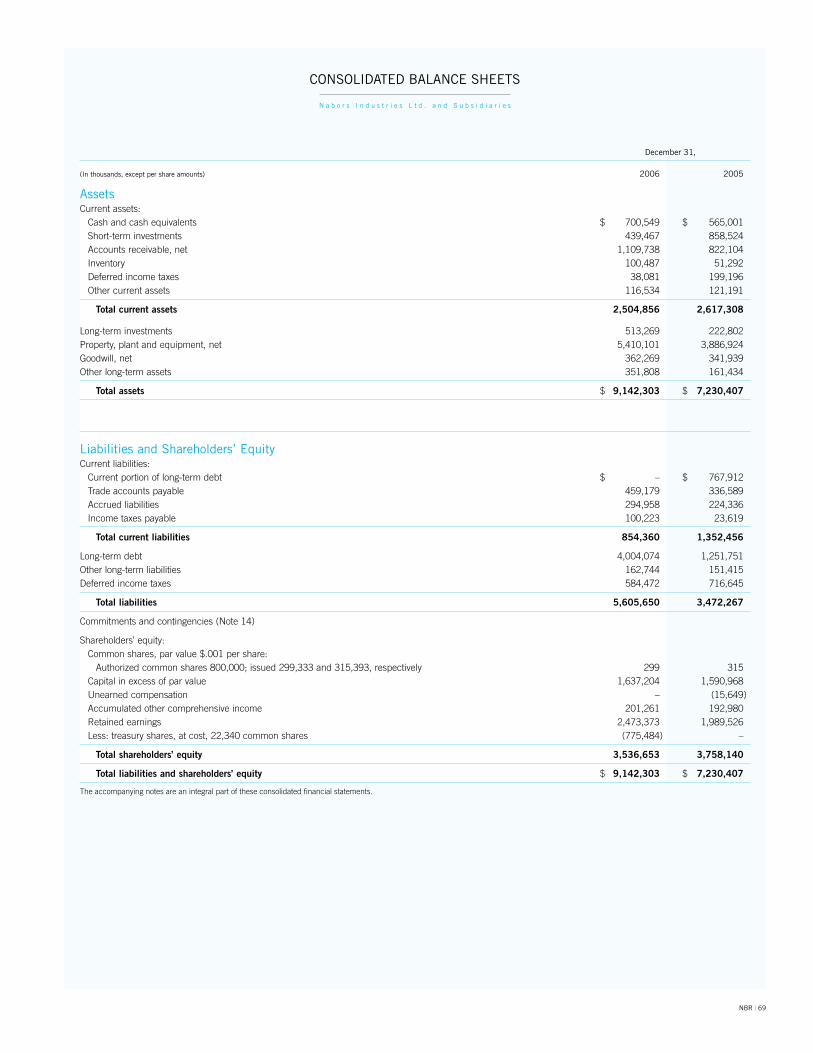
NBR | 69
CoNsolidated BalaNCe sheets
N a b o r s i n d u s t r i e s l t d . a n d s u b s i d i a r i e s
december 31,
(in thousands, except per share amounts) 2006 2005
assets Current assets: Cash and cash equivalents $ 700,549 $ 565,001 Short-term investments 439,467 858,524 Accounts receivable, net 1,109,738 822,104 Inventory 100,487 51,292 Deferred income taxes 38,081 199,196 Other current assets 116,534 121,191
Total current assets 2,504,856 2,617,308
Long-term investments 513,269 222,802 Property, plant and equipment, net 5,410,101 3,886,924 Goodwill, net 362,269 341,939 Other long-term assets 351,808 161,434
Total assets $ 9,142,303 $ 7,230,407
liabilities and shareholders’ equity Current liabilities: Current portion of long-term debt $ – $ 767,912 Trade accounts payable 459,179 336,589 Accrued liabilities 294,958 224,336 Income taxes payable 100,223 23,619
Total current liabilities 854,360 1,352,456
Long-term debt 4,004,074 1,251,751 Other long-term liabilities 162,744 151,415 Deferred income taxes 584,472 716,645
Total liabilities 5,605,650 3,472,267
Commitments and contingencies (Note 14)
Shareholders’ equity: Common shares, par value $.001 per share: Authorized common shares 800,000; issued 299,333 and 315,393, respectively 299 315 Capital in excess of par value 1,637,204 1,590,968 Unearned compensation – (15,649) Accumulated other comprehensive income 201,261 192,980 Retained earnings 2,473,373 1,989,526 Less: treasury shares, at cost, 22,340 common shares (775,484) –
Total shareholders’ equity 3,536,653 3,758,140
Total liabilities and shareholders’ equity $ 9,142,303 $ 7,230,407
The accompanying notes are an integral part of these consolidated financial statements.
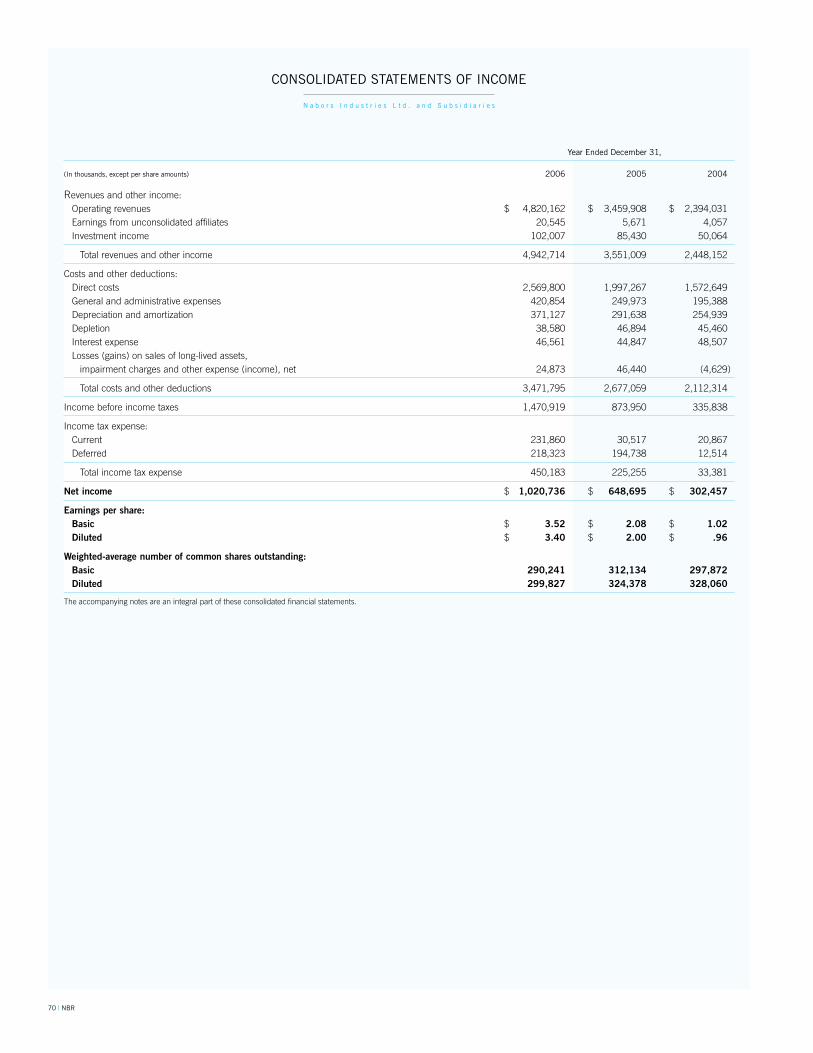
70 | NBR
Year ended december 31,
(in thousands, except per share amounts) 2006 2005 2004
Revenues and other income: Operating revenues $ 4,820,162 $ 3,459,908 $ 2,394,031 Earnings from unconsolidated affiliates 20,545 5,671 4,057 Investment income 102,007 85,430 50,064
Total revenues and other income 4,942,714 3,551,009 2,448,152
Costs and other deductions: Direct costs 2,569,800 1,997,267 1,572,649 General and administrative expenses 420,854 249,973 195,388 Depreciation and amortization 371,127 291,638 254,939 Depletion 38,580 46,894 45,460 Interest expense 46,561 44,847 48,507 Losses (gains) on sales of long-lived assets, impairment charges and other expense (income), net 24,873 46,440 (4,629)
Total costs and other deductions 3,471,795 2,677,059 2,112,314
Income before income taxes 1,470,919 873,950 335,838
Income tax expense: Current 231,860 30,517 20,867 Deferred 218,323 194,738 12,514
Total income tax expense 450,183 225,255 33,381
Net income $ 1,020,736 $ 648,695 $ 302,457
Earnings per share: Basic $ 3.52 $ 2.08 $ 1.02 Diluted $ 3.40 $ 2.00 $ .96
Weighted-average number of common shares outstanding: Basic 290,241 312,134 297,872 Diluted 299,827 324,378 328,060
The accompanying notes are an integral part of these consolidated financial statements.
CoNsolidated statemeNts of iNCome
N a b o r s i n d u s t r i e s l t d . a n d s u b s i d i a r i e s
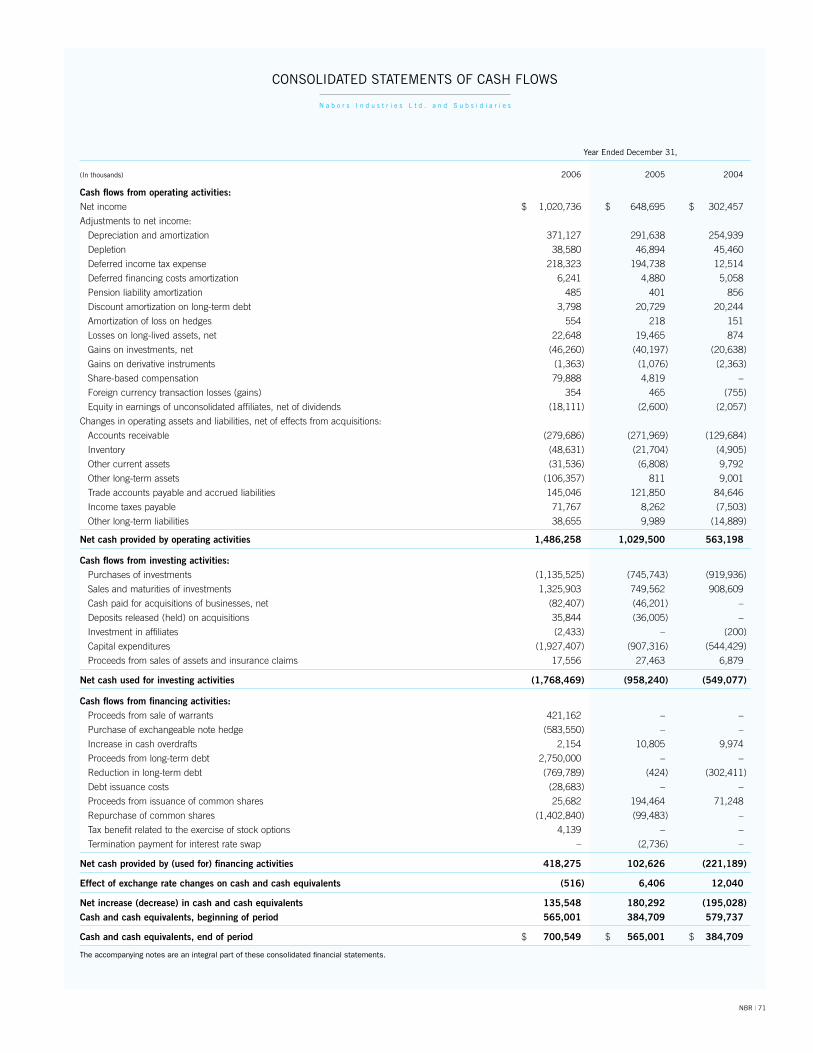
NBR | 71
Year ended december 31,
(in thousands) 2006 2005 2004
Cash flows from operating activities:Net income $ 1,020,736 $ 648,695 $ 302,457
Adjustments to net income:
Depreciation and amortization 371,127 291,638 254,939
Depletion 38,580 46,894 45,460
Deferred income tax expense 218,323 194,738 12,514
Deferred financing costs amortization 6,241 4,880 5,058
Pension liability amortization 485 401 856
Discount amortization on long-term debt 3,798 20,729 20,244
Amortization of loss on hedges 554 218 151
Losses on long-lived assets, net 22,648 19,465 874
Gains on investments, net (46,260) (40,197) (20,638)
Gains on derivative instruments (1,363) (1,076) (2,363)
Share-based compensation 79,888 4,819 –
Foreign currency transaction losses (gains) 354 465 (755)
Equity in earnings of unconsolidated affiliates, net of dividends (18,111) (2,600) (2,057)
Changes in operating assets and liabilities, net of effects from acquisitions:
Accounts receivable (279,686) (271,969) (129,684)
Inventory (48,631) (21,704) (4,905)
Other current assets (31,536) (6,808) 9,792
Other long-term assets (106,357) 811 9,001
Trade accounts payable and accrued liabilities 145,046 121,850 84,646
Income taxes payable 71,767 8,262 (7,503)
Other long-term liabilities 38,655 9,989 (14,889)
Net cash provided by operating activities 1,486,258 1,029,500 563,198
Cash flows from investing activities: Purchases of investments (1,135,525) (745,743) (919,936)
Sales and maturities of investments 1,325,903 749,562 908,609
Cash paid for acquisitions of businesses, net (82,407) (46,201) –
Deposits released (held) on acquisitions 35,844 (36,005) –
Investment in affiliates (2,433) – (200)
Capital expenditures (1,927,407) (907,316) (544,429)
Proceeds from sales of assets and insurance claims 17,556 27,463 6,879
Net cash used for investing activities (1,768,469) (958,240) (549,077)
Cash flows from financing activities: Proceeds from sale of warrants 421,162 – –
Purchase of exchangeable note hedge (583,550) – –
Increase in cash overdrafts 2,154 10,805 9,974
Proceeds from long-term debt 2,750,000 – –
Reduction in long-term debt (769,789) (424) (302,411)
Debt issuance costs (28,683) – –
Proceeds from issuance of common shares 25,682 194,464 71,248
Repurchase of common shares (1,402,840) (99,483) –
Tax benefit related to the exercise of stock options 4,139 – –
Termination payment for interest rate swap – (2,736) –
Net cash provided by (used for) financing activities 418,275 102,626 (221,189)
Effect of exchange rate changes on cash and cash equivalents (516) 6,406 12,040
Net increase (decrease) in cash and cash equivalents 135,548 180,292 (195,028) Cash and cash equivalents, beginning of period 565,001 384,709 579,737
Cash and cash equivalents, end of period $ 700,549 $ 565,001 $ 384,709
The accompanying notes are an integral part of these consolidated financial statements.
CoNsolidated statemeNts of Cash flows
N a b o r s i n d u s t r i e s l t d . a n d s u b s i d i a r i e s
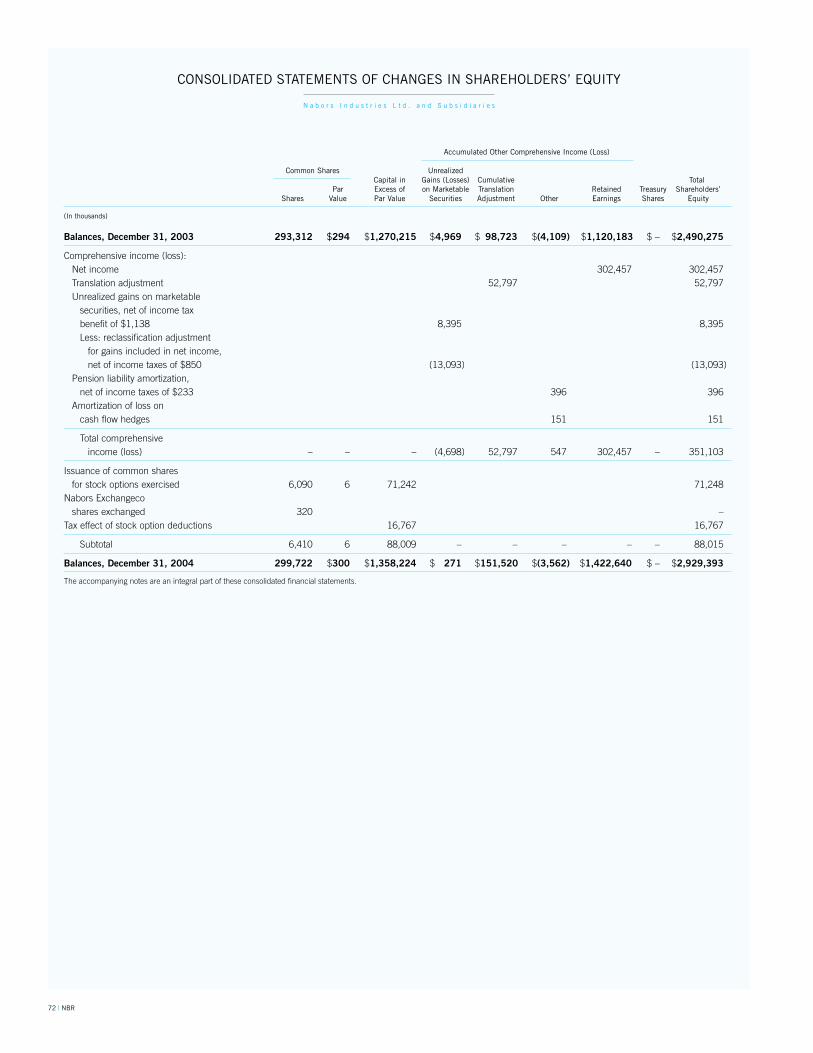
72 | NBR
CoNsolidated statemeNts of ChaNges iN shaReholdeRs’ equitY
N a b o r s i n d u s t r i e s l t d . a n d s u b s i d i a r i e s
accumulated other Comprehensive income (loss)
Common shares unrealized Capital in gains (losses) Cumulative total Par excess of on marketable translation Retained treasury shareholders’ shares Value Par Value securities adjustment other earnings shares equity
(in thousands)
Balances, December 31, 2003 293,312 $294 $1,270,215 $ 4,969 $ 98,723 $(4,109) $1,120,183 $ – $2,490,275
Comprehensive income (loss): Net income 302,457 302,457 Translation adjustment 52,797 52,797 Unrealized gains on marketable securities, net of income tax benefit of $1,138 8,395 8,395 Less: reclassification adjustment for gains included in net income, net of income taxes of $850 (13,093) (13,093) Pension liability amortization, net of income taxes of $233 396 396 Amortization of loss on cash flow hedges 151 151
Total comprehensive income (loss) – – – (4,698) 52,797 547 302,457 – 351,103
Issuance of common shares for stock options exercised 6,090 6 71,242 71,248 Nabors Exchangeco shares exchanged 320 – Tax effect of stock option deductions 16,767 16,767
Subtotal 6,410 6 88,009 – – – – – 88,015
Balances, December 31, 2004 299,722 $300 $1,358,224 $ 271 $151,520 $(3,562) $1,422,640 $ – $2,929,393
The accompanying notes are an integral part of these consolidated financial statements.
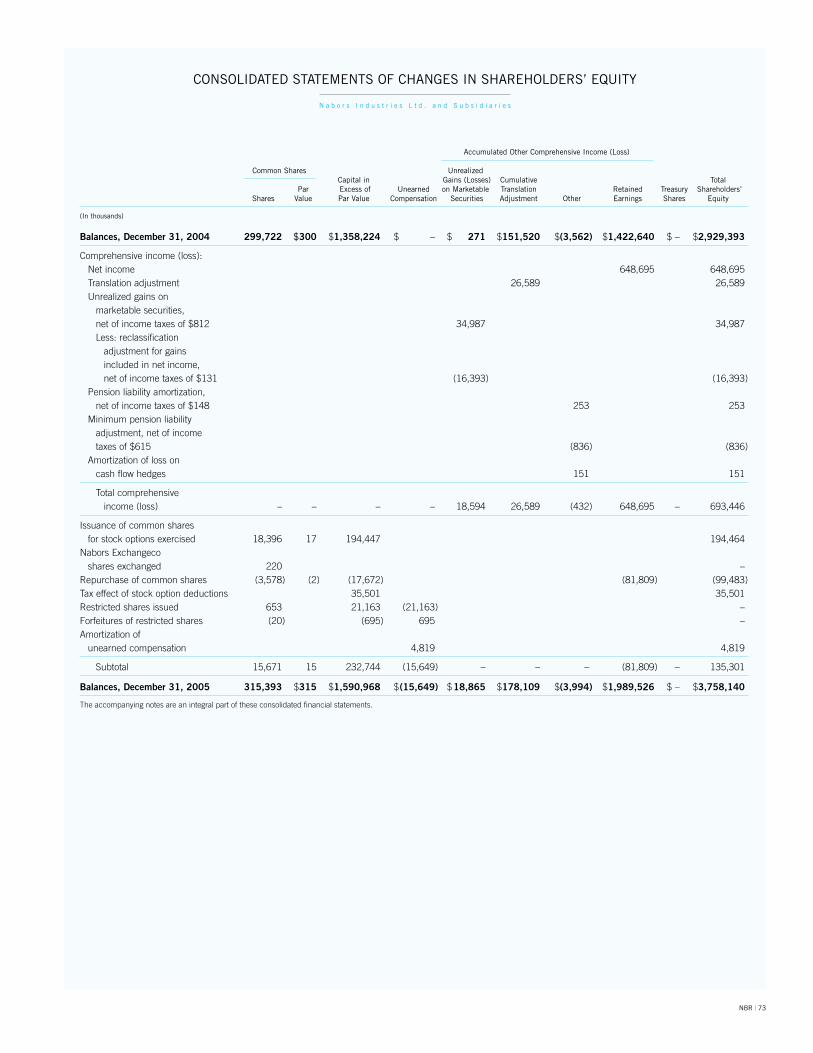
NBR | 73
accumulated other Comprehensive income (loss)
Common shares unrealized Capital in gains (losses) Cumulative total Par excess of unearned on marketable translation Retained treasury shareholders’ shares Value Par Value Compensation securities adjustment other earnings shares equity
(in thousands)
Balances, December 31, 2004 299,722 $300 $1,358,224 $ – $ 271 $151,520 $(3,562) $1,422,640 $ – $2,929,393
Comprehensive income (loss): Net income 648,695 648,695 Translation adjustment 26,589 26,589 Unrealized gains on marketable securities, net of income taxes of $812 34,987 34,987 Less: reclassification adjustment for gains included in net income, net of income taxes of $131 (16,393) (16,393) Pension liability amortization, net of income taxes of $148 253 253 Minimum pension liability adjustment, net of income taxes of $615 (836) (836) Amortization of loss on cash flow hedges 151 151
Total comprehensive income (loss) – – – – 18,594 26,589 (432) 648,695 – 693,446
Issuance of common shares for stock options exercised 18,396 17 194,447 194,464 Nabors Exchangeco shares exchanged 220 – Repurchase of common shares (3,578) (2) (17,672) (81,809) (99,483) Tax effect of stock option deductions 35,501 35,501 Restricted shares issued 653 21,163 (21,163) – Forfeitures of restricted shares (20) (695) 695 – Amortization of unearned compensation 4,819 4,819
Subtotal 15,671 15 232,744 (15,649) – – – (81,809) – 135,301
Balances, December 31, 2005 315,393 $315 $1,590,968 $ (15,649) $ 18,865 $178,109 $(3,994) $1,989,526 $ – $3,758,140
The accompanying notes are an integral part of these consolidated financial statements.
CoNsolidated statemeNts of ChaNges iN shaReholdeRs’ equitY
N a b o r s i n d u s t r i e s l t d . a n d s u b s i d i a r i e s
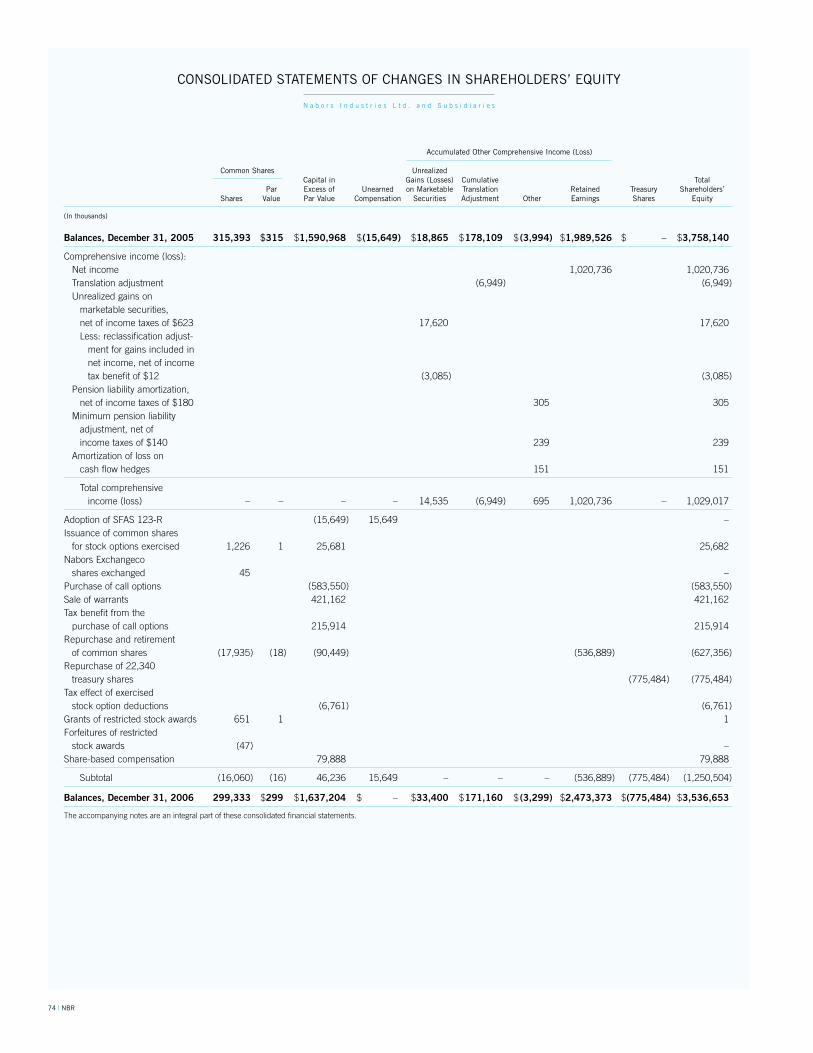
74 | NBR
accumulated other Comprehensive income (loss)
Common shares unrealized Capital in gains (losses) Cumulative total Par excess of unearned on marketable translation Retained treasury shareholders’ shares Value Par Value Compensation securities adjustment other earnings shares equity
(in thousands)
Balances, December 31, 2005 315,393 $315 $ 1,590,968 $ (15,649) $ 18,865 $ 178,109 $ (3,994) $ 1,989,526 $ – $ 3,758,140
Comprehensive income (loss): Net income 1,020,736 1,020,736 Translation adjustment (6,949) (6,949) Unrealized gains on marketable securities, net of income taxes of $623 17,620 17,620 Less: reclassification adjust- ment for gains included in net income, net of income tax benefit of $12 (3,085) (3,085) Pension liability amortization, net of income taxes of $180 305 305 Minimum pension liability adjustment, net of income taxes of $140 239 239 Amortization of loss on cash flow hedges 151 151
Total comprehensive income (loss) – – – – 14,535 (6,949) 695 1,020,736 – 1,029,017
Adoption of SFAS 123-R (15,649) 15,649 – Issuance of common shares for stock options exercised 1,226 1 25,681 25,682 Nabors Exchangeco shares exchanged 45 – Purchase of call options (583,550) (583,550) Sale of warrants 421,162 421,162 Tax benefit from the purchase of call options 215,914 215,914 Repurchase and retirement of common shares (17,935) (18) (90,449) (536,889) (627,356) Repurchase of 22,340 treasury shares (775,484) (775,484) Tax effect of exercised stock option deductions (6,761) (6,761) Grants of restricted stock awards 651 1 1 Forfeitures of restricted stock awards (47) – Share-based compensation 79,888 79,888
Subtotal (16,060) (16) 46,236 15,649 – – – (536,889) (775,484) (1,250,504)
Balances, December 31, 2006 299,333 $299 $ 1,637,204 $ – $ 33,400 $ 171,160 $ (3,299) $ 2,473,373 $ (775,484) $ 3,536,653
The accompanying notes are an integral part of these consolidated financial statements.
CoNsolidated statemeNts of ChaNges iN shaReholdeRs’ equitY
N a b o r s i n d u s t r i e s l t d . a n d s u b s i d i a r i e s
NBR | 75
1 NatureofOperationsandBasisofPresentation
Nabors is the largest land drilling contractor in the world, with approximately 615 land drilling rigs. We conduct oil, gas and geo-thermal land drilling operations in the U.S. Lower 48 states, Alaska, Canada, South and Central America, the Middle East, the Far East and Africa. We are also one of the largest land well-servicing and work-over contractors in the United States and Canada. We own approxi-mately 610 land workover and well-servicing rigs in the United States, primarily in the southwestern and western United States, and approx-imately 190 land workover and well-servicing rigs in Canada. Nabors is a leading provider of offshore platform workover and drilling rigs, and owns 48 platform, 19 jack-up units and five barge rigs in the United States and multiple international markets. These rigs provide well-servicing, workover and drilling services. We have a 50% own-ership interest in a joint venture in Saudi Arabia, which owns 18 rigs. We also offer a wide range of ancillary well-site services, including engineering, transportation, construction, maintenance, well logging, directional drilling, rig instrumentation, data collection and other support services in selected domestic and international markets. We time charter a fleet of 29 marine transportation and supply vessels, which provide transportation of drilling materials, supplies and crews for offshore operations. During the first quarter of 2006 we began to offer subcontracted logistics services for onshore drilling and well-servicing operations in Canada using helicopters and fixed-winged aircraft. We manufacture and lease or sell top drives for a broad range of drilling applications, directional drilling systems, rig instrumen-tation and data collection equipment, pipeline handling equipment and rig reporting software. We also have made selective investments in oil and gas exploration, development and production activities.
The majority of our business is conducted through our various Contract Drilling operating segments, which include our drilling, workover and well-servicing operations, on land and offshore. Our oil and gas exploration, development and production operations are included in a category labeled Oil and Gas for segment reporting purposes. Our operating segments engaged in marine transporta-tion and supply services, drilling technology and top drive manufac-turing, directional drilling, rig instrumentation and software, and construction and logistics operations are aggregated in a category labeled Other Operating Segments for segment reporting purposes.
Our Sea Mar division time charters supply vessels to offshore operators in U.S. waters. The vessels are owned by one of our financing company subsidiaries, but are operated and managed by a U.S. citizen-controlled company pursuant to long-term bareboat charters. As a result of recent legislation, beginning in August 2007, Sea Mar will no longer be able to use this arrangement to qualify vessels for employment in the U.S. coastwise trade. Accordingly, we will be required to restructure the arrangement, redeploy the vessels outside the U.S., or sell the vessels by no later than such time.
The accompanying consolidated financial statements and related footnotes are presented in accordance with accounting principles generally accepted in the United States of America (“GAAP”). Certain reclassifications have been made to prior periods to conform to the current period presentation, with no effect on our consolidated finan-cial position, results of operations or cash flows.
On December 15, 2005, our Board of Directors approved a two-for-one stock split of our common shares to be effectuated in the form of a stock dividend. The stock dividend was distributed on April 17, 2006 to shareholders of record on March 31, 2006. All com-mon share, per share, stock option and restricted stock amounts included in the accompanying Consolidated Financial Statements and related notes have been restated to reflect the effect of the stock split.
2 SummaryofSignificantAccountingPolicies
Principles of ConsolidationOur consolidated financial statements include the accounts of
Nabors, all majority-owned subsidiaries, and all non-majority owned subsidiaries required to be consolidated under Financial Accounting Standards Board (“FASB”) Interpretation No. 46(R), “Consolidation of Variable Interest Entities, an interpretation of ARB No. 51” (“FIN 46R”), which are not material to our financial position, results of operations or cash flows. All significant intercompany accounts and transac-tions are eliminated in consolidation.
Investments in operating entities where we have the ability to exert significant influence, but where we do not control their operat-ing and financial policies, are accounted for using the equity method. Our share of the net income of these entities is recorded as Earn-ings from unconsolidated affiliates in our consolidated statements of income, and our investment in these entities is carried as a single amount in our consolidated balance sheets. Investments in net assets of unconsolidated affiliates accounted for using the equity method totaled $98.0 million and $71.2 million as of December 31, 2006 and 2005, respectively, and are included in other long-term assets in our consolidated balance sheets. Similarly, investments in certain offshore funds classified as non-marketable are accounted for using the equity method of accounting based on our ownership interest in each fund. Our share of the gains and losses of these funds is recorded in investment income in our consolidated statements of income, and our investments in these funds are included in long-term investments in our consolidated balance sheets.
Cash and Cash EquivalentsCash and cash equivalents include demand deposits and various
other short-term investments with original maturities of three months or less.
NotEs to CoNsolidatEd fiNaNCial statEmENts
N a B o R s i N d u s t R i E s l t d . a N d s u B s i d i a R i E s
76 | NBR
investmentsMarketable securities consist of equity securities, certificates
of deposit, corporate debt securities, U.S. Government debt securi-ties, Government agencies debt securities, foreign government debt securities, mortgage-backed debt securities and asset-backed debt securities. Securities classified as available-for-sale or trading are stated at fair value. Unrealized holding gains and temporary losses for available-for-sale securities are excluded from earnings and, until realized, are reported net of taxes in a separate component of shareholders’ equity. Other than temporary losses are included in earnings. Unrealized and realized gains and losses on securities classified as trading are reported in earnings currently.
In computing realized gains and losses on the sale of equity securities, the specific identification method is used. In accordance with this method, the cost of the equity securities sold is determined using the specific cost of the security when originally purchased.
We are also invested in overseas funds investing primarily in a variety of public and private U.S. and non-U.S. securities (includ-ing asset-backed securities and mortgage-backed securities, global structured asset securitizations, whole loan mortgages, and partic-ipations in whole loans and whole loan mortgages). These invest-ments are classified as non-marketable, because they do not have published fair values. We account for these funds under the equity method of accounting based on our percentage ownership interest and recognize gains or losses, as investment income, on a quarterly basis based on changes in the net asset value of our investment.
inventoryInventory is stated at the lower of cost or market. Cost is deter-
mined using the first-in, first-out (“FIFO”) method and includes the cost of materials, labor and manufacturing overhead.
Property, Plant and EquipmentProperty, plant and equipment, including renewals and better-
ments, are stated at cost, while maintenance and repairs are expensed currently. Interest costs applicable to the construction of qualifying assets are capitalized as a component of the cost of such assets. We provide for the depreciation of our drilling and workover rigs using the units-of-production method over an approximate 4,900-day period, with the exception of our jack-up rigs which are depre-ciated over an 8,030-day period, after provision for salvage value. When our drilling and workover rigs are not operating, a depre-ciation charge is provided using the straight-line method over an assumed depreciable life of 20 years, with the exception of our jack-up rigs, where a 30-year depreciable life is used.
Depreciation on our buildings, well-servicing rigs, oilfield hauling and mobile equipment, marine transportation and supply vessels, aircraft equipment, and other machinery and equipment is computed using the straight-line method over the estimated useful life of the asset after provision for salvage value (buildings — 10 to 30 years; well-servicing rigs — 3 to 15 years; marine transportation and sup-ply vessels — 10 to 25 years; aircraft equipment — 5 to 20 years; oilfield hauling and mobile equipment and other machinery and equipment — 3 to 10 years). Amortization of capitalized leases is included in depreciation and amortization expense. Upon retirement
or other disposal of fixed assets, the cost and related accumulated depreciation are removed from the respective accounts and any gains or losses are included in our results of operations.
We review our assets for impairment when events or changes in circumstances indicate that the net book value of property, plant and equipment may not be recovered over its remaining service life. Provisions for asset impairment are charged to income when the sum of estimated future cash flows, on an undiscounted basis, is less than the asset’s net book value. Impairment charges are recorded using discounted cash flows which requires the estimation of dayrates and utilization, and such estimates can change based on market conditions, technological advances in the industry or changes in regulations governing the industry. We recorded impair-ment charges of approximately $12.4 million in 2006 related to asset retirements (Note 16). Impairment charges are included in losses (gains) on sales of long-lived assets, impairment charges and other expense (income), net in the consolidated statements of income. There were no impairment charges related to assets held for use recorded by Nabors in 2005 or 2004. Damage incurred to certain of our rigs during Hurricanes Katrina and Rita in the third quarter of 2005 resulted in a reduction in the carrying value of certain of our assets of approximately $13.1 million. This reduction in carrying value of our assets was partially offset by an amount of proceeds expected to be received from insurance, which is recorded as an insurance receivable and included in other current assets in our consolidated balance sheets as of December 31, 2005. The net involuntary conversion loss recognized during 2005 resulting from these hurricanes totaling $7.8 million is included in losses (gains) on long-lived assets, impairment charges and other expense (income), net in our consolidated statements of income.
oil and Gas PropertiesWe follow the successful efforts method of accounting for our
oil and gas activities. Under the successful efforts method, lease acquisition costs and all development costs are capitalized. Proved oil and gas properties are reviewed when circumstances suggest the need for such a review and, if required, the proved properties are written down to their estimated fair value. Unproved properties are reviewed quarterly to determine if there has been impairment of the carrying value, with any such impairment charged to expense in that period. We recorded impairment charges of approximately $9.9 million and $1.6 million during 2006 and 2005, respectively, related to our oil and gas properties. There were no impairment charges related to our oil and gas properties in 2004. Estimated fair value includes the estimated present value of all reasonably expected future production, prices, and costs. Exploratory drilling costs are capitalized until the results are determined. If proved reserves are not discovered, the exploratory drilling costs are expensed. Interest costs related to financing major oil and gas projects in progress are capitalized until the projects are evaluated or until the projects are substantially complete and ready for their intended use if the proj-ects are evaluated as successful. Other exploratory costs are expensed as incurred. Our provision for depletion is based on the capitalized costs as determined above and is determined on a property-by-property basis using the units-of-production method, with costs being amortized over proved developed reserves.
NBR | 77
GoodwillGoodwill represents the cost in excess of fair value of the net assets of companies acquired. We review goodwill and intangible assets with
indefinite lives for impairment annually. The change in the carrying amount of goodwill for our various Contract Drilling segments and our Other Operating Segments for the years ended December 31, 2006 and 2005 is as follows:
(in thousands) Balance as of acquisitions and Cumulative translation Balance as of december 31, 2004 Purchase Price adjustments adjustment december 31, 2005
ContractDrilling: U.S.Lower48LandDrilling $ 29,976 $ 178 $ – $ 30,154 U.S.LandWell-servicing 43,741 7,045 – 50,786 U.S.Offshore 18,003 – – 18,003 Alaska 19,995 – – 19,995 Canada 149,497 – 5,055 154,552 International 18,983 – – 18,983
SubtotalContractDrilling 280,195 7,223 5,055 292,473OtherOperatingSegments 47,030 2,331 105 49,466
Total $ 327,225 $ 9,554 $ 5,160 $ 341,939
(in thousands) Balance as of acquisitions and Cumulative translation Balance as of december 31, 2005 Purchase Price adjustments adjustment december 31, 2006
ContractDrilling: U.S.Lower48LandDrilling $ 30,154 $ – $ – $ 30,154 U.S.LandWell-servicing 50,786 53 – 50,839 U.S.Offshore 18,003 – – 18,003 Alaska 19,995 – – 19,995 Canada 154,552 – (395) 154,157 International 18,983 – – 18,983
SubtotalContractDrilling 292,473 53 (395) 292,131OtherOperatingSegments 49,466 20,815 (143) 70,138
Total $ 341,939 $ 20,868 $ (538) $ 362,269
Our Oil and Gas segment does not have any goodwill. Goodwill totaling approximately $9.5 million is expected to be deductible for tax purposes.
derivative financial instrumentsWe record derivative financial instruments (including certain
derivative instruments embedded in other contracts) in our con-solidated balance sheets at fair value as either assets or liabilities. The accounting for changes in the fair value of a derivative instru-ment depends on the intended use of the derivative and the result-ing designation, which is established at the inception of a derivative. Accounting for derivatives qualifying as fair value hedges allows a derivative’s gains and losses to offset related results on the hedged item in the statement of income. For derivative instruments desig-nated as cash flow hedges, changes in fair value, to the extent the hedge is effective, are recognized in other comprehensive income until the hedged item is recognized in earnings. Hedge effective-ness is measured quarterly based on the relative cumulative changes in fair value between the derivative contract and the hedged item over time. Any change in fair value resulting from ineffectiveness is recognized immediately in earnings. Any change in fair value of derivative financial instruments that are speculative in nature and do not qualify for hedge accounting treatment is also recognized immediately in earnings. Proceeds received upon termination of derivative financial instruments qualifying as fair value hedges are deferred and amortized into income over the remaining life of the hedged item using the effective interest rate method.
litigation and insurance ReservesWe estimate our reserves related to litigation and insurance
based on the facts and circumstances specific to the litigation and insurance claims and our past experience with similar claims. We maintain actuarially-determined accruals in our consolidated balance sheets to cover self-insurance retentions (Note 14). We estimate the range of our liability related to pending litigation when we believe the amount and range of loss can be estimated. We record our best estimate of a loss when the loss is considered probable. When a liability is probable and there is a range of estimated loss with no best estimate in the range, we record the minimum estimated liability related to the lawsuits or claims. As additional information becomes available, we assess the potential liability related to our pending litigation and claims and revise our estimates.
Revenue RecognitionWe recognize revenues and costs on daywork contracts daily
as the work progresses. For certain contracts, we receive lump-sum payments for the mobilization of rigs and other drilling equipment. Deferred fees related to mobilization periods are recognized over the term of the related drilling contract. Costs incurred to relocate rigs and other drilling equipment to areas in which a contract has not been secured are expensed as incurred. We defer recognition of revenue on amounts received from customers for prepayment of services until those services are provided.
We recognize revenue for top drives and instrumentation systems we manufacture when the earnings process is complete. This gener-ally occurs when products have been shipped, title and risk of loss have been transferred, collectibility is probable, and pricing is fixed and determinable.
78 | NBR
We recognize, as operating revenue, proceeds from business interruption insurance claims in the period that the applicable proof of loss documentation is received. Proceeds from casualty insurance settlements in excess of the carrying value of damaged assets are recognized in losses (gains) on sales of long-lived assets, impair-ment charges and other expense (income), net in the period that the applicable proof of loss documentation is received.
We recognize reimbursements received for out-of-pocket expenses incurred as revenues and account for out-of-pocket expenses as direct costs.
We recognize revenue on our interests in oil and gas properties as production occurs and title passes.
income taxesWe are a Bermuda-exempt company and are not subject to
income taxes in Bermuda. Consequently, income taxes have been provided based on the tax laws and rates in effect in the countries in which our operations are conducted and income is earned. The income taxes in these jurisdictions vary substantially. Our effective tax rate for financial statement purposes will continue to fluctu-ate from year to year as our operations are conducted in different taxing jurisdictions.
For U.S. and other foreign jurisdiction income tax purposes, we have net operating and other loss carryforwards that we are required to assess annually for potential valuation allowances. We consider the sufficiency of existing temporary differences and expected future earnings levels in determining the amount, if any, of valuation allowance required against such carryforwards and against deferred tax assets.
We do not provide for U.S. or foreign income or withholding taxes on unremitted earnings of all U.S. and certain foreign entities, as these earnings are considered permanently reinvested. Unremitted earnings, representing tax basis accumulated earnings and profits, totaled approximately $397.5 million, $303.5 million and $289.9 mil-lion as of December 31, 2006, 2005 and 2004, respectively. It is not practicable to estimate the amount of deferred income taxes asso-ciated with these unremitted earnings.
In circumstances where our drilling rigs and other assets are operating in certain foreign taxing jurisdictions, and it is expected that we will redeploy such assets before they give rise to future tax consequences, we do not recognize any deferred tax liabilities on the earnings from these assets.
Nabors realizes an income tax benefit associated with certain stock options issued under its stock option plans. This benefit, which is not reflected in our consolidated income statements, results in a reduction in income taxes payable and an increase in capital in excess of par value.
foreign Currency translationFor certain of our foreign subsidiaries, such as those in Canada
and Argentina, the local currency is the functional currency, and therefore translation gains or losses associated with foreign-denominated monetary accounts are accumulated in a separate section of shareholders’ equity. For our other international sub-sidiaries, the U.S. dollar is the functional currency, and therefore local currency transaction gains and losses, arising from remeasure-ment of payables and receivables denominated in local currency, are included in our consolidated statements of income.
share-Based CompensationPrior to January 1, 2006, we accounted for awards granted
under our stock-based employee compensation plans following the recognition and measurement principles of Accounting Principles Bulletin Opinion No. 25, “Accounting for Stock Issued to Employees,” (“APB 25”) and related interpretations. Under APB 25, no compen-sation expense is recognized when the option price is equal to the market price of the underlying stock on the date of award. We gen-erally did not recognize compensation expense in connection with stock option awards to employees, directors and officers under our plans. See Note 3. Under the provisions of SFAS 123, the pro forma effects on income for stock options were instead disclosed in a footnote to the financial statements. Compensation expense was recorded in the income statement for restricted stock awards over the vesting period of the award.
Effective January 1, 2006, we adopted the fair value recognition provisions of SFAS No. 123(R), “Share-Based Payment,” (“SFAS 123-R”), using the modified prospective application method. Under this tran-sition method, the Company will record compensation expense for all stock option awards granted after the date of adoption and for the unvested portion of previously granted stock option awards that remain outstanding at the date of adoption. The amount of compensation cost recognized was based on the grant-date fair value estimated in accordance with the original provisions of SFAS No. 123. Results for prior periods have not been restated.
Cash flowsWe treat the redemption price, including accrued original issue
discount, on our convertible debt instruments as a financing activity for purposes of reporting cash flows in our consolidated statements of cash flows.
use of EstimatesThe preparation of financial statements in conformity with GAAP
requires management to make certain estimates and assumptions. These estimates and assumptions affect the reported amounts of assets and liabilities, the disclosures of contingent assets and lia-bilities at the balance sheet date and the amounts of revenues and expenses recognized during the reporting period. Actual results could differ from such estimates. Areas where critical accounting estimates are made by management include:
• depreciation and amortization of property, plant and equipment
• impairment of long-lived assets • income taxes • litigation and insurance reserves • fair value of assets acquired and liabilities assumed • share-based compensation
Recent accounting PronouncementsIn June 2006 the FASB issued Interpretation No. 48 (“FIN 48”),
“Accounting for Uncertainty in Income Taxes,” which prescribes a comprehensive model for how a company should recognize, mea-sure, present and disclose in its financial statements uncertain tax positions that the company has taken or expects to take on a tax return. Under FIN 48, the financial statements will reflect expected future tax consequences of such positions presuming the taxing authorities’ full knowledge of the position and all relevant facts, but without considering time values. FIN 48 is likely to cause greater volatility in income statements as more items are recognized
NBR | 79
discretely within income tax expense. Application of FIN 48 is required in financial statements effective for periods beginning after December 15, 2006. FIN 48 revises disclosure requirements and will require an annual tabular roll-forward of unrecognized tax benefits. We expect to adopt FIN 48 beginning January 1, 2007. We are currently evaluating the impact that this interpretation may have on our consolidated financial statements. Any adjust-ment required as a result of the adoption of FIN 48, which may be material, will be recorded to retained earnings.
In September 2006 the FASB issued SFAS No. 157, “Fair Value Measurements.” This statement establishes a framework for mea-suring fair value in generally accepted accounting principles and expands disclosures about fair value measurements. SFAS 157 is effective for financial statements issued for fiscal years beginning after November 15, 2007, and interim periods within those fiscal years. The provisions of SFAS 157 should be applied prospectively as of the beginning of the fiscal year in which SFAS 157 is ini- tially applied, except in limited circumstances. We expect to adopt SFAS 157 beginning January 1, 2008. We are currently evaluating the impact that this pronouncement may have on our consolidated financial statements.
In September 2006 the FASB issued SFAS No. 158, “Employers’ Accounting for Defined Benefit Pension and Other Postretirement Plans — an amendment of FASB Statements No. 87, 88, 106 and 132(R).” This statement requires companies to recognize a net lia-bility or asset to report the funded status of their defined benefit pension and other postretirement benefit plans in its statement of financial position and to recognize changes in that funded status in the year in which the changes occur through comprehensive income. SFAS 158 is required to be applied in financial statements effected for periods ending after December 15, 2006. The adoption of SFAS 158 did not have a material impact on our consolidated results of operations or financial condition.
In February 2007, the FASB issued SFAS No. 159, “The Fair Value Option for Financial Assets and Financial Liabilities — Including an amendment of FASB Statement No. 115.” This statement permits entities to choose to measure many financial instruments and cer-tain other items at fair value that are not currently required to be measured at fair value and establishes presentation and disclosure requirements designed to facilitate comparisons between entities that choose different measurement attributes for similar types of assets and liabilities. SFAS 159 is effective as of the beginning of an entity’s first fiscal year that begins after November 15, 2007. Early adoption is permitted as of the beginning of a fiscal year that begins on or before November 15, 2007, provided the entity also elects to apply the provisions of SFAS No. 157. We expect to adopt SFAS 159 beginning January 1, 2008. We are currently evaluating the impact that this pronouncement may have on our consolidated financial statements.
3 Share-BasedCompensation
The Company disclosed in a press release issued on Decem- ber 27, 2006, that it was initiating a voluntary further review of its option granting practices. The Company voluntarily contacted the SEC on December 27, 2006, and informed them of the review.
The staff of the SEC informed the Company in a letter dated December 28, 2006, that it had initiated an informal inquiry into the Company’s option award practices. The Company has been and will continue to cooperate fully with the SEC inquiry.
The voluntary review, which is now complete, was overseen by a committee consisting of all of the Company’s nonemployee directors. The committee engaged outside legal counsel, which in turn engaged a forensic accounting expert to assist with the review (the “Review Team”). The scope of the review included the grant-ing of and accounting for certain employee equity awards to both the senior executives of the Company and other employees from 1988 through 2006. The Review Team made no finding of fraud or intentional wrongdoing.
The Review Team identified certain employee stock option awards for which the Company had historically used an incorrect “measurement date” in determining the amount of compensation expense to be recognized for such employee stock option awards. The Review Team determined that the use of these incorrect measure-ment dates resulted primarily from incomplete granting actions as of the previously used measurement dates. With respect to awards made to certain senior executives, the Review Team found that the appropriate measurement date for certain awards made on Janu-ary 4, 1991 should have been March 5, 1991; the appropriate mea-surement date for certain December 4, 1995 awards should have been January 8, 1996; the appropriate measurement date for certain other December 4, 1995 awards should have been January 18, 1996; the appropriate measurement date for certain December 12, 1996 awards should have been December 13, 1996; and the appropriate measurement date for certain July 22, 1997 awards should have been August 5, 1997. The aggregate effect of these measurement date differences results in additional compensation expense which should have been recognized in the amount of $17.8 million over the vesting period of the respective options.
With respect to certain annual and other incentive awards made to other employees, the Review Team found that there were numer-ous instances where changes were made to awards following the date of the meeting of the Compensation Committee. In numerous instances, there was insufficient or inconclusive documentation to determine the date on which awards made to those employees became final and were no longer subject to change. Accordingly, unless documentation demonstrated that a different measurement date was appropriate, the Company used the date on which annual bonuses were paid to employees as the revised measurement date for accounting purposes because such date would represent a date on which the Company could conclude awards to employees would have been finalized. The aggregate effect of these measurement date differences results in additional compensation expense which should have been recognized in the amount of $33.8 million over the vesting period of the respective options or restricted stock. The Company has notified the Internal Revenue Service of its intent to participate in the program set forth in Announcement 2007–18, Compliance Resolution Program for Employees Other than Corpo-rate Insiders for Additional 2006 Taxes Arising Under 409A due to the Exercise of Stock Rights. The cost to the Company for participa-tion in this compliance program will be approximately $3.9 million and will be recorded as an expense during the first quarter of 2007.

80 | NBR
The aggregate impact of the additional compensation expense, recorded as general and administrative expense, related to the new measurement dates was $51.6 million on a pre-tax basis, $38.3 mil-lion net of tax, or $.13 per diluted share, which was recorded as a non-cash charge during the fourth quarter of 2006.
The Company has determined that no restatement of its histori-cal financial statements is necessary, because the effects of the revised measurement dates for the awards granted would not be material in any fiscal year. If a stock-based compensation charge had been taken as a result of the revised measurement dates, the net income of the Company for fiscal years 1991 through 2006 would have been reduced by $38.3 million in total. There would be no impact on revenue or cash flow from operations as a result of using the revised measurement dates. The impact on net income in individual fiscal years would have been as follows: fiscal 1991 ($.7 million); fiscal 1992 ($1.0 million); fiscal 1993 ($1.0 million); fiscal 1994 ($1.0 million); fiscal 1995 ($.3 million); fiscal 1996 ($2.1 million); fiscal 1997 (period ending September 30) ($9.5 million); fiscal 1997 (three-month period ending December 31) ($.3 million); fiscal 1998 ($1.4 million); fiscal 1999 ($1.9 million); fiscal 2000 ($2.7 million); fiscal 2001 ($2.0 million); fiscal 2002 ($4.0 million); fiscal 2003 ($3.8 million); fiscal 2004 ($2.9 million); fiscal 2005 ($3.0 million); and fiscal 2006 ($.7 million).
As a result of adopting SFAS 123-R on January 1, 2006, Nabors’ income before income taxes and net income for the year ended December 31, 2006, were $16.6 million and $12.4 million lower, respectively, than if we had continued to account for share-based
compensation under APB 25. Basic and diluted earnings per share were $.04 and $.05 lower, respectively, for the year ended Decem-ber 31, 2006, as a result of adopting SFAS 123-R.
Compensation expense related to awards of restricted stock was recognized before the adoption of SFAS 123-R. Compensation expense for restricted stock totaled $11.8 million and $4.8 million for the years ended December 31, 2006 and 2005, respectively, and is included in direct costs and general and administrative expenses in our consolidated statements of income. Total stock-based com-pensation expense, which includes both stock options and restricted stock totaled $79.9 million for the year ended December 31, 2006. Stock-based compensation expense has been allocated to our various operating segments (Note 18).
Prior to adoption of SFAS 123-R, Nabors presented all tax benefits of deductions resulting from the exercise of options as operating cash flows in the Consolidated Statements of Cash Flows. SFAS 123-R requires the cash flows resulting from tax deductions in excess of the compensation cost recognized for those options (excess tax benefits) to be classified as financing cash flows. The actual tax benefit realized from options exercised during the year ended December 31, 2006 was $5.2 million.
Under the provisions of SFAS 123-R, the recognition of unearned compensation, a contra-equity account representing the amount of unrecognized restricted stock compensation expense, is no longer required. Therefore, in the first quarter of 2006 the unearned com-pensation amount that was included in our December 31, 2005 consolidated balance sheet in the amount of $15.6 million was reduced to zero with a corresponding decrease to capital in excess of par value.
Prior Period Pro forma PresentationUnder the modified prospective application method, results for prior periods have not been restated to reflect the effects of implementing
SFAS 123-R. The following pro forma information, as required by SFAS No. 148 “Accounting for Stock-Based Compensation — an Amendment to FAS 123,” is presented for comparative purposes and illustrates the effect on our net income and earnings per share as if we had applied the provisions of SFAS 123-R effective January 1, 2005:
Year Ended december 31,
(in thousands, except per share amounts) 2005 2004
Netincome,asreported $ 648,695 $ 302,457Add:Stock-basedcompensationexpense,relatingtorestrictedstockawards,includedinreportednetincome,netofrelatedtaxeffects 3,635 –Deduct:Totalstock-basedemployeecompensationexpensedeterminedunderthefairvaluemethodforallawards,netofrelatedtaxeffects (72,281) (22,530)
Proformanetincome–basic 580,049 279,927
Add:Interestexpenseonassumedconversionofourzerocouponconvertible/exchangeableseniordebentures/notes,netoftax – 12,438
Adjustedproformanetincome–diluted $ 580,049 $ 292,365
Earningspershare: Basic–asreported $ 2.08 $ 1.02
Basic–proforma $ 1.86 $ .94
Diluted–asreported $ 2.00 $ .96
Diluted–proforma $ 1.79 $ .89
NBR | 81
stock option PlansAs of December 31, 2006, we have several stock option plans
under which options to purchase Nabors common shares may be granted to key officers, directors and managerial employees of Nabors and its subsidiaries. Options granted under the plans generally are at prices equal to the fair market value of the shares on the date of the grant. Options granted under the plans generally are exercisable in varying cumulative periodic installments after one year. In the case of certain key executives, options granted under the plans are subject to accelerated vesting related to targeted common share prices, or may vest immediately on the grant date. Options granted under the plans cannot be exercised more than ten years from the date of grant. Options to purchase 9.9 million and 11.8 million Nabors common shares remained available for grant as of December 31, 2006 and 2005, respectively. Of the common shares available for grant as of December 31, 2006, approximately 8.9 million of these shares are also available for issuance in the form of restricted shares.
The fair value of each option award is estimated on the date of grant using the Black-Scholes option-pricing model that uses the assumptions for the risk-free interest rate, volatility, dividend yield and the expected term of the options. The risk-free interest rate is based on the U.S. Treasury yield curve in effect at the time of grant for a period equal to the expected term of the option. Expected volatilities are based on implied volatilities from traded
options on the Nabors’ common shares, historical volatility of Nabors’ common shares, and other factors. We do not assume any dividend yield, as the Company does not pay dividends. We use historical data to estimate the expected term of the options and employee terminations within the option-pricing model; separate groups of employees that have similar historical exercise behavior are considered separately for valuation purposes. The expected term of the options represents the period of time that the options granted are expected to be outstanding.
We also consider an estimated forfeiture rate for these option awards, and we only recognize compensation cost for those shares that are expected to vest, on a straight-line basis over the requisite service period of the award, which is generally the vesting term of three to four years. The forfeiture rate is based on historical exper-ience. Estimated forfeitures have been adjusted to reflect actual forfeitures during 2006.
There were no stock options granted, and as a result, no fair value determinations were made during the year ended December 31, 2006. For stock options granted during the years ended December 31, 2005 and 2004, respectively, the following weighted-average assumptions were utilized: risk-free interest rates of 4.13% and 2.49%; volatility of 29.50% and 31.00%; dividend yield of 0.0% for both periods; and expected life of 3.4 years and 4.0 years. Stock option transactions under the Company’s various stock-based employee compensation plans are presented below:
Weighted-average Weighted-average Remaining aggregate Options shares Exercise Price Contractual term intrinsic Value(in thousands, except exercise price)
OptionsoutstandingasofDecember31,2005 38,559 $ 21.87 Granted – – Exercised (1,226) 20.95 Forfeited (161) 22.53
OptionsoutstandingasofDecember31,2006 37,172 21.89 4.94years $ 318,928
OptionsexercisableasofDecember31,2006 34,302 21.85 4.76years $ 297,665
Of the options outstanding, 34.3 million, 31.5 million and 38.0 million were exercisable at weighted-average exercise prices of $21.85, $22.03 and $14.53, as of December 31, 2006, 2005 and 2004, respectively. The weighted-average grant-date fair value of options granted during the years ended December 31, 2005 and 2004 was $9.21, and $6.72, respectively. There were no options granted during the year ended December 31, 2006.
A summary of our nonvested stock options as of December 31, 2006, and the changes during the year then ended is presented below:
Weighted- average Grant-date NonvestedStockOptions outstanding fair Value(in thousands, except fair values)
NonvestedasofDecember31,2005 7,051 $ 7.17 Granted – – Vested (4,056) 7.32 Forfeited (125) 7.10
NonvestedasofDecember31,2006 2,870 $ 6.95
The total intrinsic value of options exercised during the years ended December 31, 2006, 2005 and 2004 was $17.8 mil-lion, $336.1 million and $72.4 million, respectively. The total fair value of options vested during the years ended Decem- ber 31, 2006, 2005 and 2004 was $30.1 million, $102.9 million and $27.0 million, respectively.
As of December 31, 2006, there was $6.9 million of total future compensation cost related to nonvested options. That cost is expected to be recognized over a weighted-average period of less than one year. We expect substantially all of the nonvested options to vest.
Restricted stock and Restricted stock unitsOur stock compensation plans allow grants of restricted stock.
Restricted stock is issued on the grant date, but is restricted as to transferability. Restricted stock vests in varying periodic installments ranging from 3 to 4 years.
82 | NBR
A summary of our restricted stock as of December 31, 2006, and the changes during the year ended is presented below:
Weighted- average Grant-date RestrictedStock outstanding fair Value(in thousands, except fair values)
NonvestedasofDecember31,2005 710 $ 28.86 Granted 764 32.92 Vested (142) 28.71 Forfeited (58) 30.57
NonvestedasofDecember31,2006 1,274 $ 31.14
The fair value of restricted stock vested during the year ended December 31, 2006 is $4.8 million. There was not any restricted stock that vested during the year ended December 31, 2005. See Note 11.
As of December 31, 2006, there was $26.1 million of total future compensation cost related to nonvested restricted stock awards. That cost is expected to be recognized over a weighted-average period of 1.2 years. We expect substantially all of the nonvested restricted stock awards to vest.
During February 2007, the Company awarded 699,637 and 464,085 shares of restricted stock to its Chairman and Chief Execu-tive Officer; and its Deputy Chairman, President and Chief Operating Officer, respectively. These awards had an aggregate value at the date of grant of $35.2 million and vest over a period of three years.
4 Acquisitions
On January 3, 2006, we completed an acquisition of 1183011 Alberta Ltd., a wholly-owned subsidiary of Airborne Energy Solu-tions Ltd., through the purchase of all common shares outstanding for cash for a total purchase price of Cdn. $41.7 million (U.S. $35.8 mil-lion). In addition, we assumed debt, net of working capital, totaling approximately Cdn. $10.0 million (U.S. $8.6 million). Nabors Blue Sky Ltd. (formerly 1183011 Alberta Ltd.) owns 42 helicopters and fixed-wing aircraft and owns and operates a fleet of heliportable well-service equipment. The purchase price has been allocated based on final valuations of the fair value of assets acquired and liabil-ities assumed as of the acquisition date and resulted in goodwill of approximately U.S. $18.8 million.
On May 31, 2006, we completed an acquisition of Pragma Drilling Equipment Ltd.’s business, which manufactures catwalks, iron rough-necks and other related oilfield equipment, through an asset purchase consisting primarily of intellectual property for a total purchase price of Cdn. $36.5 million (U.S. $33.1 million). Additional cash purchase consideration, up to a maximum of Cdn. $12 million (U.S. $10.3 mil-lion), will be due if certain specified financial performance targets are achieved over a one-year period commencing on June 30, 2006. The purchase price has been allocated based on preliminary estimates of the fair market value of assets acquired and liabilities assumed as of the acquisition date and resulted in goodwill of approximately U.S. $2.1 million. The purchase price allocation is subject to adjust-ments as additional information becomes available and will be finalized by March 31, 2007. Any contingent consideration payable in the future will be recorded as goodwill.
5 CashandCashEquivalentsandInvestments
Certain information related to our cash and cash equivalents and investments in marketable securities follows:
december 31,
(in thousands) 2006 2005
Gross unrealized Gross unrealized Gross unrealized Gross unrealized fair Value Holding Gains Holding losses fair Value Holding Gains Holding losses
Cashandcashequivalents $ 700,549 $ – $ – $ 565,001 $ – $ –
Available-for-salemarketableequitysecurities 117,220 38,197 (1,740) 99,216 21,912 (642)
Marketabledebtsecurities: CommercialpaperandCDs 16,778 – (6) 269,053 – (24) Corporatedebtsecurities 131,079 154 – 276,755 – (414) Governmentagenciesdebtsecurities 61,318 106 – 47,139 – (290) Mortgage-backeddebtsecurities 1,373 5 – – – – Mortgage-CMOdebtsecurities 49,629 19 – 5,081 – (43) Asset-backeddebtsecurities 62,070 – (9) 161,280 – (89)
Totalmarketabledebtsecurities $ 322,247 $ 284 $ (15) $ 759,308 $ – $ (860)
NBR | 83
Our cash and cash equivalents, short-term and long-term investments consist of the following:
december 31,
(in thousands) 2006 2005
Cashandcashequivalents $ 700,549 $ 565,001Short-terminvestments: Available-for-salemarketableequitysecurities 117,220 99,216 Marketabledebtsecurities 322,247 759,308 Non-marketablesecurities – –
Totalshort-terminvestments 439,467 858,524Long-terminvestmentsin non-marketablesecurities 513,269 222,802
Totalcashandcashequivalents andinvestments $ 1,653,285 $ 1,646,327
The estimated fair values of our corporate, U.S. Government, Government agencies, mortgage-backed, mortgage-CMO and asset-backed debt securities at December 31, 2006, by contractual maturity, are shown below. Expected maturities will differ from contractual maturities because the issuers of the securities may have the right to repay obligations without prepayment penalties and we may elect to sell the securities prior to the maturity date (Note 2).
Estimated fair Value
(in thousands) 2006
Marketabledebtsecurities: Dueinoneyearorless $ 143,782 Dueafteroneyearthroughfiveyears 178,465
$ 322,247
Certain information regarding our marketable debt and equity securities is presented below:
Year Ended december 31,
(in thousands) 2006 2005 2004
Available-for-sale: Proceedsfromsales andmaturities $ 1,324,882 $ 688,275 $ 838,816 Realizedgains, netofrealizedlosses 3,073 16,524 13,943
6 Property,PlantandEquipment
The major components of our property, plant and equipment are as follows:
december 31,
(in thousands) 2006 2005
Land $ 29,065 $ 22,413Buildings 74,048 40,271Drilling,workoverandwell-servicing rigs,andrelatedequipment 5,749,260 4,565,792Marinetransportationandsupplyvessels 156,593 152,167Oilfieldhaulingandmobileequipment 383,387 237,303Othermachineryandequipment 71,095 36,323Oilandgasproperties 344,423 195,146Constructioninprocess(1) 625,719 332,779
7,433,590 5,582,194Less:accumulateddepreciation andamortization (1,868,075) (1,578,506) accumulateddepletionon oilandgasproperties (155,414) (116,764)
$5,410,101 $ 3,886,924
(1) Relatestoamountscapitalizedforneworsubstantiallynewdrilling,workoverandwell-servicingrigsthatwereunderconstructionandhadnotyetbeenplacedinserviceasofDecember31,2006or2005.
Repair and maintenance expense included in direct costs in our consolidated statements of income totaled $410.6 million, $327.5 million and $253.0 million for the years ended Decem- ber 31, 2006, 2005 and 2004, respectively.
Interest costs of $9.5 million, $4.2 million and $1.9 million were capitalized during the years ended December 31, 2006, 2005 and 2004, respectively.
7 InvestmentsinUnconsolidatedAffiliates
Our principal operations accounted for using the equity method include a construction operation (50% ownership) and a logistics operation (50% ownership) in Alaska, and drilling and workover oper-ations located in Saudi Arabia (50% ownership). These unconsolidated affiliates are integral to our operations in those locations. See Note 13 for a discussion of transactions with these related parties.
Combined condensed financial data for investments in unconsol-idated affiliates accounted for using the equity method of account-ing is summarized as follows:
december 31,
(in thousands) 2006 2005
Currentassets $ 154,136 $ 105,073Long-termassets 182,310 155,104Currentliabilities 91,815 67,954Long-termliabilities 49,340 40,201
Year Ended december 31,
(in thousands) 2006 2005 2004
Grossrevenues $ 486,347 $ 346,127 $ 256,303Grossmargin 85,700 46,722 33,911Netincome 45,123 16,119 14,184Nabors’earningsfrom unconsolidatedaffiliates 20,545 5,671 4,057
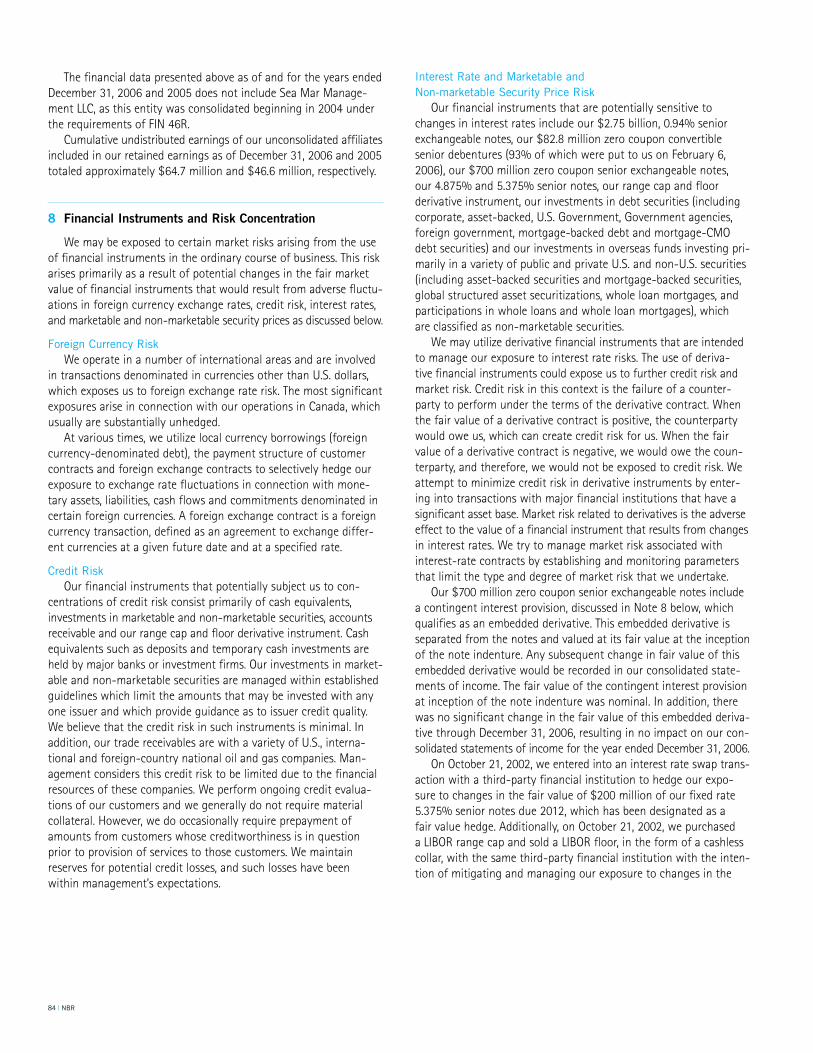
84 | NBR
The financial data presented above as of and for the years ended December 31, 2006 and 2005 does not include Sea Mar Manage-ment LLC, as this entity was consolidated beginning in 2004 under the requirements of FIN 46R.
Cumulative undistributed earnings of our unconsolidated affiliates included in our retained earnings as of December 31, 2006 and 2005 totaled approximately $64.7 million and $46.6 million, respectively.
8 FinancialInstrumentsandRiskConcentration
We may be exposed to certain market risks arising from the use of financial instruments in the ordinary course of business. This risk arises primarily as a result of potential changes in the fair market value of financial instruments that would result from adverse fluctu-ations in foreign currency exchange rates, credit risk, interest rates, and marketable and non-marketable security prices as discussed below.
foreign Currency RiskWe operate in a number of international areas and are involved
in transactions denominated in currencies other than U.S. dollars, which exposes us to foreign exchange rate risk. The most significant exposures arise in connection with our operations in Canada, which usually are substantially unhedged.
At various times, we utilize local currency borrowings (foreign currency-denominated debt), the payment structure of customer contracts and foreign exchange contracts to selectively hedge our exposure to exchange rate fluctuations in connection with mone-tary assets, liabilities, cash flows and commitments denominated in certain foreign currencies. A foreign exchange contract is a foreign currency transaction, defined as an agreement to exchange differ-ent currencies at a given future date and at a specified rate.
Credit RiskOur financial instruments that potentially subject us to con-
centrations of credit risk consist primarily of cash equivalents, investments in marketable and non-marketable securities, accounts receivable and our range cap and floor derivative instrument. Cash equivalents such as deposits and temporary cash investments are held by major banks or investment firms. Our investments in market-able and non-marketable securities are managed within established guidelines which limit the amounts that may be invested with any one issuer and which provide guidance as to issuer credit quality. We believe that the credit risk in such instruments is minimal. In addition, our trade receivables are with a variety of U.S., interna-tional and foreign-country national oil and gas companies. Man-agement considers this credit risk to be limited due to the financial resources of these companies. We perform ongoing credit evalua-tions of our customers and we generally do not require material collateral. However, we do occasionally require prepayment of amounts from customers whose creditworthiness is in question prior to provision of services to those customers. We maintain reserves for potential credit losses, and such losses have been within management’s expectations.
interest Rate and marketable and Non-marketable security Price Risk
Our financial instruments that are potentially sensitive to changes in interest rates include our $2.75 billion, 0.94% senior exchangeable notes, our $82.8 million zero coupon convertible senior debentures (93% of which were put to us on February 6, 2006), our $700 million zero coupon senior exchangeable notes, our 4.875% and 5.375% senior notes, our range cap and floor derivative instrument, our investments in debt securities (including corporate, asset-backed, U.S. Government, Government agencies, foreign government, mortgage-backed debt and mortgage-CMO debt securities) and our investments in overseas funds investing pri-marily in a variety of public and private U.S. and non-U.S. securities (including asset-backed securities and mortgage-backed securities, global structured asset securitizations, whole loan mortgages, and participations in whole loans and whole loan mortgages), which are classified as non-marketable securities.
We may utilize derivative financial instruments that are intended to manage our exposure to interest rate risks. The use of deriva-tive financial instruments could expose us to further credit risk and market risk. Credit risk in this context is the failure of a counter-party to perform under the terms of the derivative contract. When the fair value of a derivative contract is positive, the counterparty would owe us, which can create credit risk for us. When the fair value of a derivative contract is negative, we would owe the coun-terparty, and therefore, we would not be exposed to credit risk. We attempt to minimize credit risk in derivative instruments by enter-ing into transactions with major financial institutions that have a significant asset base. Market risk related to derivatives is the adverse effect to the value of a financial instrument that results from changes in interest rates. We try to manage market risk associated with interest-rate contracts by establishing and monitoring parameters that limit the type and degree of market risk that we undertake.
Our $700 million zero coupon senior exchangeable notes include a contingent interest provision, discussed in Note 8 below, which qualifies as an embedded derivative. This embedded derivative is separated from the notes and valued at its fair value at the inception of the note indenture. Any subsequent change in fair value of this embedded derivative would be recorded in our consolidated state-ments of income. The fair value of the contingent interest provision at inception of the note indenture was nominal. In addition, there was no significant change in the fair value of this embedded deriva-tive through December 31, 2006, resulting in no impact on our con-solidated statements of income for the year ended December 31, 2006.
On October 21, 2002, we entered into an interest rate swap trans-action with a third-party financial institution to hedge our expo-sure to changes in the fair value of $200 million of our fixed rate 5.375% senior notes due 2012, which has been designated as a fair value hedge. Additionally, on October 21, 2002, we purchased a LIBOR range cap and sold a LIBOR floor, in the form of a cashless collar, with the same third-party financial institution with the inten-tion of mitigating and managing our exposure to changes in the
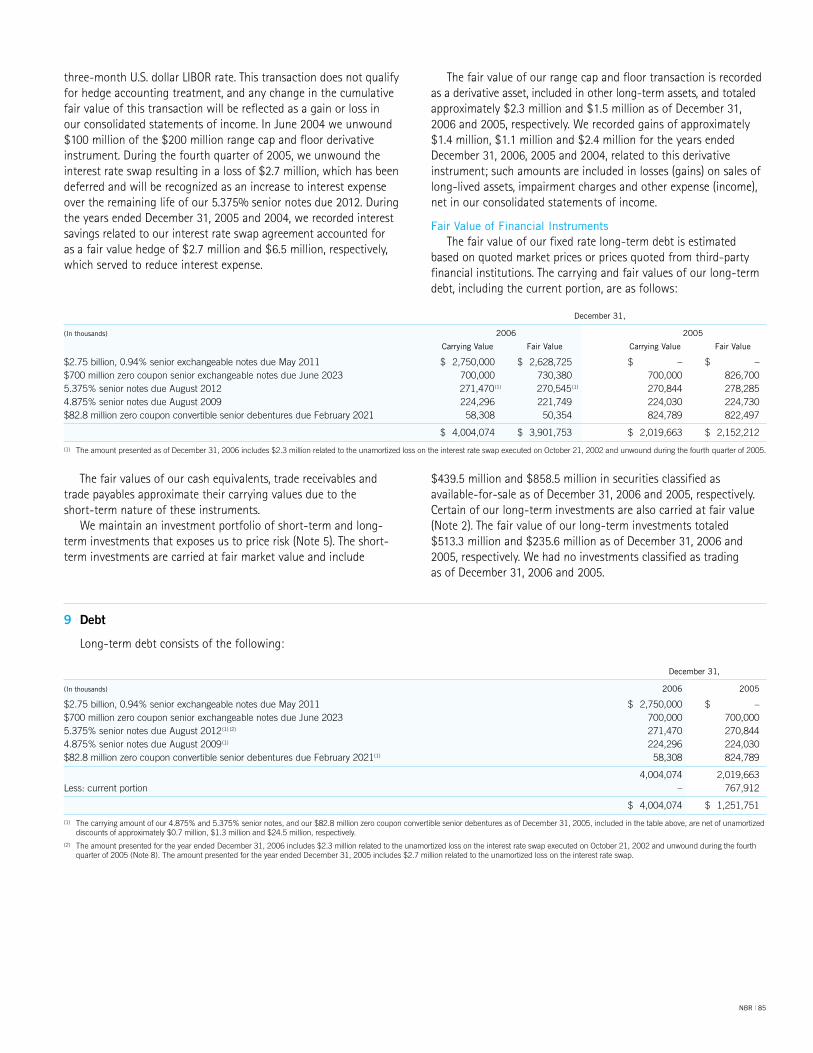
NBR | 85
three-month U.S. dollar LIBOR rate. This transaction does not qualify for hedge accounting treatment, and any change in the cumulative fair value of this transaction will be reflected as a gain or loss in our consolidated statements of income. In June 2004 we unwound $100 million of the $200 million range cap and floor derivative instrument. During the fourth quarter of 2005, we unwound the interest rate swap resulting in a loss of $2.7 million, which has been deferred and will be recognized as an increase to interest expense over the remaining life of our 5.375% senior notes due 2012. During the years ended December 31, 2005 and 2004, we recorded interest savings related to our interest rate swap agreement accounted for as a fair value hedge of $2.7 million and $6.5 million, respectively, which served to reduce interest expense.
The fair value of our range cap and floor transaction is recorded as a derivative asset, included in other long-term assets, and totaled approximately $2.3 million and $1.5 million as of December 31, 2006 and 2005, respectively. We recorded gains of approximately $1.4 million, $1.1 million and $2.4 million for the years ended December 31, 2006, 2005 and 2004, related to this derivative instrument; such amounts are included in losses (gains) on sales of long-lived assets, impairment charges and other expense (income), net in our consolidated statements of income.
fair Value of financial instrumentsThe fair value of our fixed rate long-term debt is estimated
based on quoted market prices or prices quoted from third-party financial institutions. The carrying and fair values of our long-term debt, including the current portion, are as follows:
december 31,
(in thousands) 2006 2005
Carrying Value fair Value Carrying Value fair Value
$2.75billion,0.94%seniorexchangeablenotesdueMay2011 $ 2,750,000 $ 2,628,725 $ – $ –$700millionzerocouponseniorexchangeablenotesdueJune2023 700,000 730,380 700,000 826,7005.375%seniornotesdueAugust2012 271,470(1) 270,545(1) 270,844 278,2854.875%seniornotesdueAugust2009 224,296 221,749 224,030 224,730$82.8millionzerocouponconvertibleseniordebenturesdueFebruary2021 58,308 50,354 824,789 822,497
$ 4,004,074 $ 3,901,753 $ 2,019,663 $ 2,152,212
(1) TheamountpresentedasofDecember31,2006includes$2.3millionrelatedtotheunamortizedlossontheinterestrateswapexecutedonOctober21,2002andunwoundduringthefourthquarterof2005.
december 31,
(in thousands) 2006 2005
$2.75billion,0.94%seniorexchangeablenotesdueMay2011 $ 2,750,000 $ –$700millionzerocouponseniorexchangeablenotesdueJune2023 700,000 700,0005.375%seniornotesdueAugust2012(1) (2) 271,470 270,8444.875%seniornotesdueAugust2009(1) 224,296 224,030$82.8millionzerocouponconvertibleseniordebenturesdueFebruary2021(1) 58,308 824,789
4,004,074 2,019,663Less:currentportion – 767,912
$ 4,004,074 $ 1,251,751
(1) Thecarryingamountofour4.875%and5.375%seniornotes,andour$82.8millionzerocouponconvertibleseniordebenturesasofDecember31,2005,includedinthetableabove,arenetofunamortizeddiscountsofapproximately$0.7million,$1.3millionand$24.5million,respectively.
(2) TheamountpresentedfortheyearendedDecember31,2006includes$2.3millionrelatedtotheunamortizedlossontheinterestrateswapexecutedonOctober21,2002andunwoundduringthefourthquarterof2005(Note8).TheamountpresentedfortheyearendedDecember31,2005includes$2.7millionrelatedtotheunamortizedlossontheinterestrateswap.
The fair values of our cash equivalents, trade receivables and trade payables approximate their carrying values due to the short-term nature of these instruments.
We maintain an investment portfolio of short-term and long-term investments that exposes us to price risk (Note 5). The short-term investments are carried at fair market value and include
$439.5 million and $858.5 million in securities classified as available-for-sale as of December 31, 2006 and 2005, respectively. Certain of our long-term investments are also carried at fair value (Note 2). The fair value of our long-term investments totaled $513.3 million and $235.6 million as of December 31, 2006 and 2005, respectively. We had no investments classified as trading as of December 31, 2006 and 2005.
9 Debt
Long-term debt consists of the following:
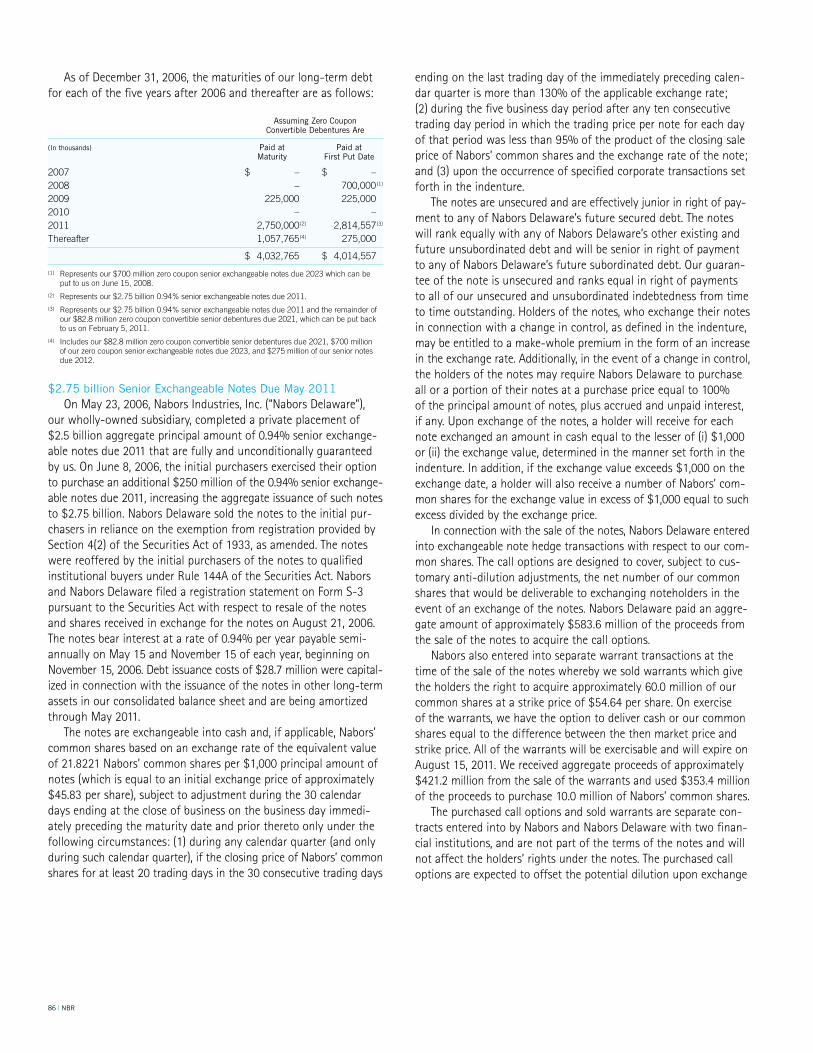
86 | NBR
As of December 31, 2006, the maturities of our long-term debt for each of the five years after 2006 and thereafter are as follows:
assuming Zero Coupon Convertible debentures are
(in thousands) Paid at Paid at maturity first Put date
2007 $ – $ –2008 – 700,000(1)
2009 225,000 225,0002010 – –2011 2,750,000(2) 2,814,557(3)
Thereafter 1,057,765(4) 275,000
$ 4,032,765 $ 4,014,557
(1) Representsour$700millionzerocouponseniorexchangeablenotesdue2023whichcanbeputtousonJune15,2008.
(2) Representsour$2.75billion0.94%seniorexchangeablenotesdue2011.(3) Representsour$2.75billion0.94%seniorexchangeablenotesdue2011andtheremainderof
our$82.8millionzerocouponconvertibleseniordebenturesdue2021,whichcanbeputbacktousonFebruary5,2011.
(4) Includesour$82.8millionzerocouponconvertibleseniordebenturesdue2021,$700millionofourzerocouponseniorexchangeablenotesdue2023,and$275millionofourseniornotesdue2012.
$2.75 billion senior Exchangeable Notes due may 2011 On May 23, 2006, Nabors Industries, Inc. (“Nabors Delaware”),
our wholly-owned subsidiary, completed a private placement of $2.5 billion aggregate principal amount of 0.94% senior exchange-able notes due 2011 that are fully and unconditionally guaranteed by us. On June 8, 2006, the initial purchasers exercised their option to purchase an additional $250 million of the 0.94% senior exchange-able notes due 2011, increasing the aggregate issuance of such notes to $2.75 billion. Nabors Delaware sold the notes to the initial pur-chasers in reliance on the exemption from registration provided by Section 4(2) of the Securities Act of 1933, as amended. The notes were reoffered by the initial purchasers of the notes to qualified institutional buyers under Rule 144A of the Securities Act. Nabors and Nabors Delaware filed a registration statement on Form S-3 pursuant to the Securities Act with respect to resale of the notes and shares received in exchange for the notes on August 21, 2006. The notes bear interest at a rate of 0.94% per year payable semi-annually on May 15 and November 15 of each year, beginning on November 15, 2006. Debt issuance costs of $28.7 million were capital-ized in connection with the issuance of the notes in other long-term assets in our consolidated balance sheet and are being amortized through May 2011.
The notes are exchangeable into cash and, if applicable, Nabors’ common shares based on an exchange rate of the equivalent value of 21.8221 Nabors’ common shares per $1,000 principal amount of notes (which is equal to an initial exchange price of approximately $45.83 per share), subject to adjustment during the 30 calendar days ending at the close of business on the business day immedi-ately preceding the maturity date and prior thereto only under the following circumstances: (1) during any calendar quarter (and only during such calendar quarter), if the closing price of Nabors’ common shares for at least 20 trading days in the 30 consecutive trading days
ending on the last trading day of the immediately preceding calen-dar quarter is more than 130% of the applicable exchange rate; (2) during the five business day period after any ten consecutive trading day period in which the trading price per note for each day of that period was less than 95% of the product of the closing sale price of Nabors’ common shares and the exchange rate of the note; and (3) upon the occurrence of specified corporate transactions set forth in the indenture.
The notes are unsecured and are effectively junior in right of pay-ment to any of Nabors Delaware’s future secured debt. The notes will rank equally with any of Nabors Delaware’s other existing and future unsubordinated debt and will be senior in right of payment to any of Nabors Delaware’s future subordinated debt. Our guaran-tee of the note is unsecured and ranks equal in right of payments to all of our unsecured and unsubordinated indebtedness from time to time outstanding. Holders of the notes, who exchange their notes in connection with a change in control, as defined in the indenture, may be entitled to a make-whole premium in the form of an increase in the exchange rate. Additionally, in the event of a change in control, the holders of the notes may require Nabors Delaware to purchase all or a portion of their notes at a purchase price equal to 100% of the principal amount of notes, plus accrued and unpaid interest, if any. Upon exchange of the notes, a holder will receive for each note exchanged an amount in cash equal to the lesser of (i) $1,000 or (ii) the exchange value, determined in the manner set forth in the indenture. In addition, if the exchange value exceeds $1,000 on the exchange date, a holder will also receive a number of Nabors’ com-mon shares for the exchange value in excess of $1,000 equal to such excess divided by the exchange price.
In connection with the sale of the notes, Nabors Delaware entered into exchangeable note hedge transactions with respect to our com-mon shares. The call options are designed to cover, subject to cus-tomary anti-dilution adjustments, the net number of our common shares that would be deliverable to exchanging noteholders in the event of an exchange of the notes. Nabors Delaware paid an aggre-gate amount of approximately $583.6 million of the proceeds from the sale of the notes to acquire the call options.
Nabors also entered into separate warrant transactions at the time of the sale of the notes whereby we sold warrants which give the holders the right to acquire approximately 60.0 million of our common shares at a strike price of $54.64 per share. On exercise of the warrants, we have the option to deliver cash or our common shares equal to the difference between the then market price and strike price. All of the warrants will be exercisable and will expire on August 15, 2011. We received aggregate proceeds of approximately $421.2 million from the sale of the warrants and used $353.4 million of the proceeds to purchase 10.0 million of Nabors’ common shares.
The purchased call options and sold warrants are separate con-tracts entered into by Nabors and Nabors Delaware with two finan-cial institutions, and are not part of the terms of the notes and will not affect the holders’ rights under the notes. The purchased call options are expected to offset the potential dilution upon exchange
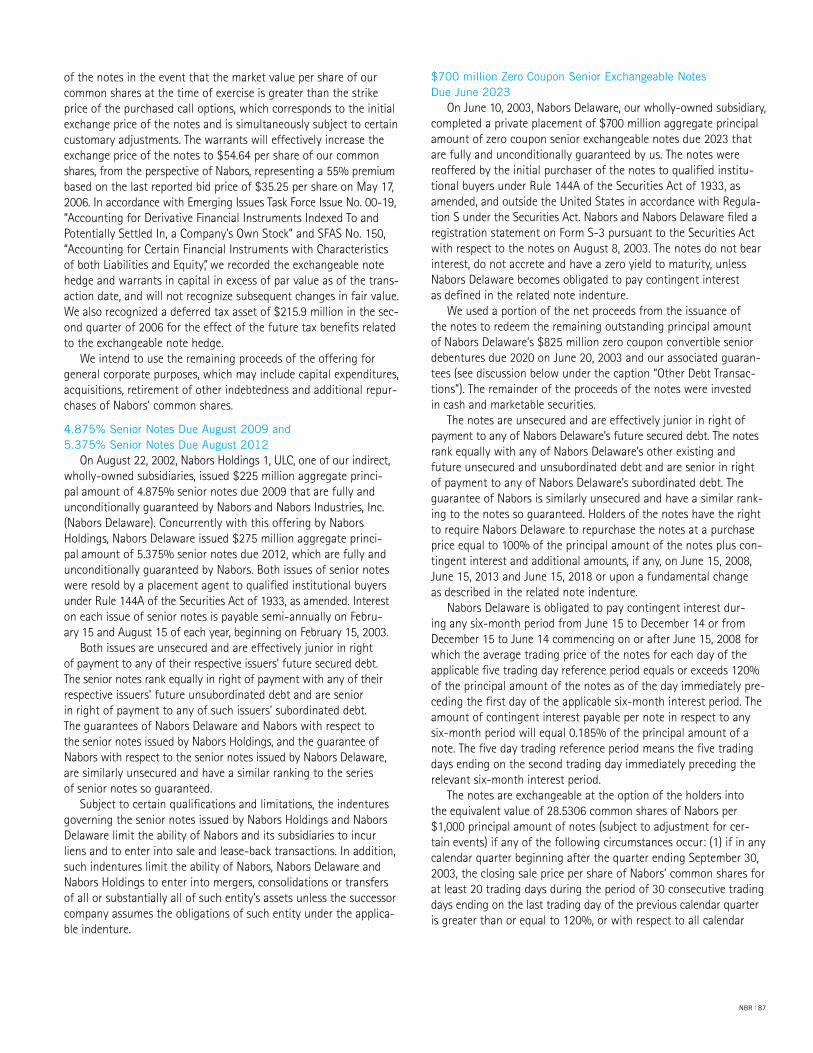
NBR | 87
of the notes in the event that the market value per share of our common shares at the time of exercise is greater than the strike price of the purchased call options, which corresponds to the initial exchange price of the notes and is simultaneously subject to certain customary adjustments. The warrants will effectively increase the exchange price of the notes to $54.64 per share of our common shares, from the perspective of Nabors, representing a 55% premium based on the last reported bid price of $35.25 per share on May 17, 2006. In accordance with Emerging Issues Task Force Issue No. 00-19, “Accounting for Derivative Financial Instruments Indexed To and Potentially Settled In, a Company’s Own Stock” and SFAS No. 150, “Accounting for Certain Financial Instruments with Characteristics of both Liabilities and Equity”, we recorded the exchangeable note hedge and warrants in capital in excess of par value as of the trans-action date, and will not recognize subsequent changes in fair value. We also recognized a deferred tax asset of $215.9 million in the sec-ond quarter of 2006 for the effect of the future tax benefits related to the exchangeable note hedge.
We intend to use the remaining proceeds of the offering for general corporate purposes, which may include capital expenditures, acquisitions, retirement of other indebtedness and additional repur-chases of Nabors’ common shares.
4.875% senior Notes due august 2009 and 5.375% senior Notes due august 2012
On August 22, 2002, Nabors Holdings 1, ULC, one of our indirect, wholly-owned subsidiaries, issued $225 million aggregate princi-pal amount of 4.875% senior notes due 2009 that are fully and unconditionally guaranteed by Nabors and Nabors Industries, Inc. (Nabors Delaware). Concurrently with this offering by Nabors Holdings, Nabors Delaware issued $275 million aggregate princi-pal amount of 5.375% senior notes due 2012, which are fully and unconditionally guaranteed by Nabors. Both issues of senior notes were resold by a placement agent to qualified institutional buyers under Rule 144A of the Securities Act of 1933, as amended. Interest on each issue of senior notes is payable semi-annually on Febru-ary 15 and August 15 of each year, beginning on February 15, 2003.
Both issues are unsecured and are effectively junior in right of payment to any of their respective issuers’ future secured debt. The senior notes rank equally in right of payment with any of their respective issuers’ future unsubordinated debt and are senior in right of payment to any of such issuers’ subordinated debt. The guarantees of Nabors Delaware and Nabors with respect to the senior notes issued by Nabors Holdings, and the guarantee of Nabors with respect to the senior notes issued by Nabors Delaware, are similarly unsecured and have a similar ranking to the series of senior notes so guaranteed.
Subject to certain qualifications and limitations, the indentures governing the senior notes issued by Nabors Holdings and Nabors Delaware limit the ability of Nabors and its subsidiaries to incur liens and to enter into sale and lease-back transactions. In addition, such indentures limit the ability of Nabors, Nabors Delaware and Nabors Holdings to enter into mergers, consolidations or transfers of all or substantially all of such entity’s assets unless the successor company assumes the obligations of such entity under the applica-ble indenture.
$700 million Zero Coupon senior Exchangeable Notes due June 2023
On June 10, 2003, Nabors Delaware, our wholly-owned subsidiary, completed a private placement of $700 million aggregate principal amount of zero coupon senior exchangeable notes due 2023 that are fully and unconditionally guaranteed by us. The notes were reoffered by the initial purchaser of the notes to qualified institu-tional buyers under Rule 144A of the Securities Act of 1933, as amended, and outside the United States in accordance with Regula-tion S under the Securities Act. Nabors and Nabors Delaware filed a registration statement on Form S-3 pursuant to the Securities Act with respect to the notes on August 8, 2003. The notes do not bear interest, do not accrete and have a zero yield to maturity, unless Nabors Delaware becomes obligated to pay contingent interest as defined in the related note indenture.
We used a portion of the net proceeds from the issuance of the notes to redeem the remaining outstanding principal amount of Nabors Delaware’s $825 million zero coupon convertible senior debentures due 2020 on June 20, 2003 and our associated guaran-tees (see discussion below under the caption “Other Debt Transac-tions”). The remainder of the proceeds of the notes were invested in cash and marketable securities.
The notes are unsecured and are effectively junior in right of payment to any of Nabors Delaware’s future secured debt. The notes rank equally with any of Nabors Delaware’s other existing and future unsecured and unsubordinated debt and are senior in right of payment to any of Nabors Delaware’s subordinated debt. The guarantee of Nabors is similarly unsecured and have a similar rank-ing to the notes so guaranteed. Holders of the notes have the right to require Nabors Delaware to repurchase the notes at a purchase price equal to 100% of the principal amount of the notes plus con-tingent interest and additional amounts, if any, on June 15, 2008, June 15, 2013 and June 15, 2018 or upon a fundamental change as described in the related note indenture.
Nabors Delaware is obligated to pay contingent interest dur-ing any six-month period from June 15 to December 14 or from December 15 to June 14 commencing on or after June 15, 2008 for which the average trading price of the notes for each day of the applicable five trading day reference period equals or exceeds 120% of the principal amount of the notes as of the day immediately pre-ceding the first day of the applicable six-month interest period. The amount of contingent interest payable per note in respect to any six-month period will equal 0.185% of the principal amount of a note. The five day trading reference period means the five trading days ending on the second trading day immediately preceding the relevant six-month interest period.
The notes are exchangeable at the option of the holders into the equivalent value of 28.5306 common shares of Nabors per $1,000 principal amount of notes (subject to adjustment for cer-tain events) if any of the following circumstances occur: (1) if in any calendar quarter beginning after the quarter ending September 30, 2003, the closing sale price per share of Nabors’ common shares for at least 20 trading days during the period of 30 consecutive trading days ending on the last trading day of the previous calendar quarter is greater than or equal to 120%, or with respect to all calendar
88 | NBR
quarters beginning on or after July 1, 2008, 110%, of the applicable exchange price per share of the Nabors’ common shares on such last trading day (the initial exchange price per share is $35.05 and is subject to adjustment for certain events detailed in the note indenture; 120% of this initial price per share is $42.06 and 110% of this initial price per share is $38.56), (2) subject to certain excep-tions, during the five business day period after any ten consecutive trading day period in which the trading price per $1,000 principal amount of notes for each day of such ten trading day period was less than 95% of the product of the closing sale price of Nabors’ common shares and the exchange rate of such note, (3) if Nabors Delaware calls the notes for redemption, or (4) upon the occurrence of specified corporate transactions described in the note indenture. See the discussion below related to the method of settlement required upon exchange of these notes. The $700 million notes can be put to us on June 15, 2008, June 15, 2013 and June 15, 2018, for a purchase price equal to 100% of the principal amount of the notes plus con-tingent interest and additional amounts, if any.
In October 2004 we executed a supplemental indenture relating to our $700 million zero coupon senior exchangeable notes provid-ing that upon an exchange of these notes, we will in all circumstances, except when we are in default under the indenture, elect to pay holders of these debt instruments, in lieu of common shares, cash up to the principal amount of the instruments and, at our option, consideration in the form of either cash or our common shares for any amount above the principal amount of the instruments required to be paid pursuant to the terms of the indenture. Additionally, the supplemental indenture provides that if the instruments are put to us at various dates commencing June 15, 2008, we will in all circumstances elect to pay holders of these debt instruments cash upon such repurchase. The number of common shares that will be issued, if we choose to deliver common shares for any amount due to the holders of the notes above the principal amount of the notes, will be equal to the amount due in excess of the principal amount of the notes divided by the market price of our common shares. For these purposes, the market price means the average of the sale prices of our common shares for the five trading day period ending on the third business day prior to the applicable purchase date.
In December 2004, we concluded an offer to exchange Series B of our $700 million zero coupon senior exchangeable notes due 2023 for our existing $700 million zero coupon senior exchangeable notes. This exchange of shares removed the obligation under these notes where we would be required to issue shares upon conversion when we are in default under the indenture related to the notes. Series B of our $700 million zero coupon senior exchangeable notes have substantially similar terms to our existing $700 million zero coupon senior exchangeable notes as supplemented, except that, in addi-tion to the elimination of the default language discussed above, the Series B exchanged notes contain additional anti-dilution protection for cash dividends and tender or exchange offers for our common shares at above-market prices, and provide for payment of a make-whole premium in certain circumstances upon exchange in con-nection with certain fundamental changes involving Nabors. The
exchange resulted in an aggregate principal amount of $699.9 mil-lion of Series B of our $700 million zero coupon senior exchange-able notes being issued to those holders of the original series of $700 million zero coupon senior exchangeable notes, leaving $.1 million of the original series of notes outstanding as of December 31, 2006.
$82.8 million Zero Coupon Convertible senior debentures due february 2021
On February 6, 2006, we redeemed 93% of our $1.2 billion zero coupon senior convertible debentures due 2021 for a total redemp-tion price of $769.8 million; an amount equal to the issue price of $679.9 million plus accrued original issue discount of $89.9 mil-lion to the date of repurchase (resulting in a remaining outstand-ing balance for our zero coupon senior convertible debentures of approximately $82.8 million as of December 31, 2006). We treat the redemption price, including accrued original discount, on our con-vertible debt instruments as a financing activity for purposes of reporting cash flows in our consolidated statements of cash flows.
The original principal amount of these debentures upon issuance was $1.381 billion, of which $180.8 million had been redeemed prior to 2005. The original issue price of these debentures is $608.41 per $1,000 principal amount at maturity. The yield to maturity is 2.5% compounded semi-annually with no periodic cash payments of interest. At the holder’s option, the remaining deben-tures may be put to us on February 5, 2011. Additionally, at the holder’s option, the remaining debentures may be converted, at any time prior to maturity or their earlier redemption, into the equiva-lent value of 14.149 common shares per $1,000 principal amount at maturity. The conversion rate is subject to adjustment under for-mulae set forth in the indenture in certain events, including: (1) the issuance of Nabors’ common shares as a dividend or distribution of common shares; (2) certain subdivisions and combinations of the common shares; (3) the issuance to all holders of common shares of certain rights or warrants to purchase common shares; (4) the distribution of common shares, other than Nabors’ common shares to Nabors’ shareholders, or evidences of Nabors’ indebtedness or of assets; and (5) distribution consisting of cash, excluding any quarterly cash dividend on the common shares to the extent that the aggre-gate cash dividend per common share in any quarter does not exceed certain amounts. See the discussion below related to the method of settlement required upon conversion of these debentures.
In October 2004 we executed a supplemental indenture (similar to the supplemental indenture for our $700 million zero coupon senior exchangeable notes discussed above) relating to our $82.8 mil-lion zero coupon convertible senior debentures providing that upon a conversion of these convertible debt instruments, we would in all circumstances, except when we are in default under the indenture, elect to pay holders of these debt instruments, in lieu of common shares, cash up to the principal amount of the instruments and, at our option, consideration in the form of either cash or our common shares for any amount above the principal amount of the instruments required to be paid pursuant to the terms of the indenture. Addition-ally, the supplemental indenture provided that if the instruments were put to us at various dates commencing February 5, 2006, we will in all circumstances elect to pay holders of these debt instru-ments cash upon such repurchase.
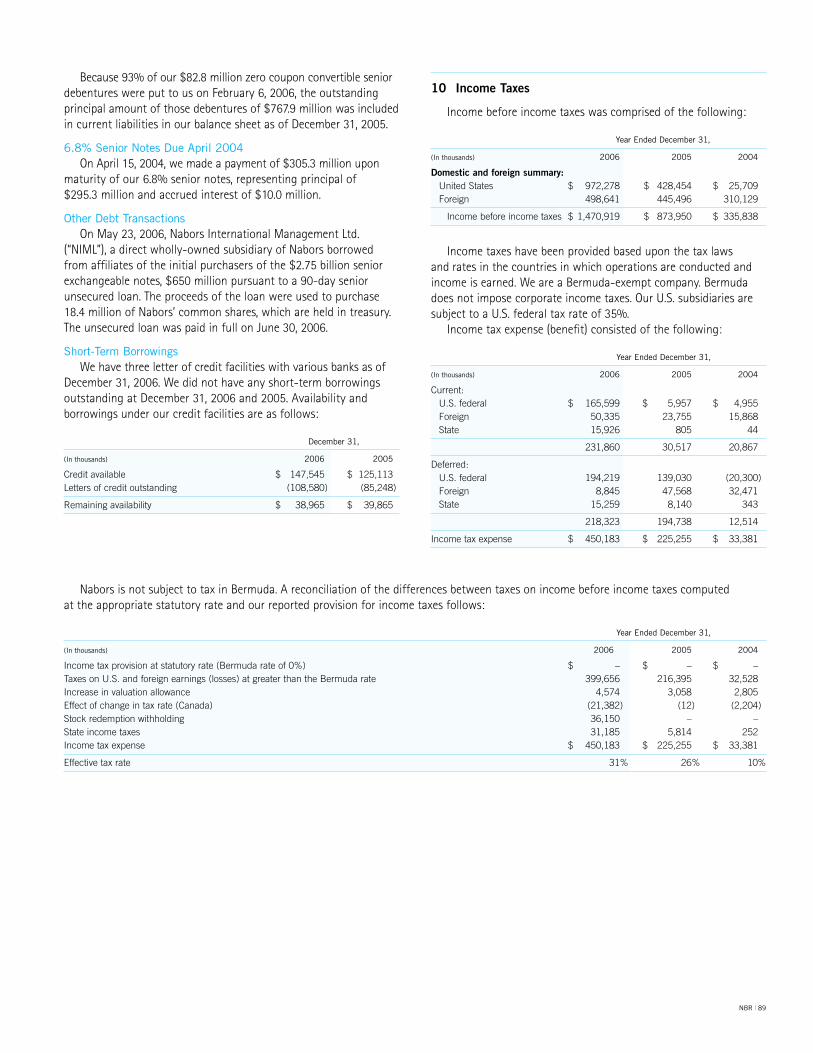
NBR | 89
Year Ended december 31,
(in thousands) 2006 2005 2004
Incometaxprovisionatstatutoryrate(Bermudarateof0%) $ – $ – $ –TaxesonU.S.andforeignearnings(losses)atgreaterthantheBermudarate 399,656 216,395 32,528Increaseinvaluationallowance 4,574 3,058 2,805Effectofchangeintaxrate(Canada) (21,382) (12) (2,204)Stockredemptionwithholding 36,150 – –Stateincometaxes 31,185 5,814 252Incometaxexpense $ 450,183 $ 225,255 $ 33,381
Effectivetaxrate 31% 26% 10%
Because 93% of our $82.8 million zero coupon convertible senior debentures were put to us on February 6, 2006, the outstanding principal amount of those debentures of $767.9 million was included in current liabilities in our balance sheet as of December 31, 2005.
6.8% senior Notes due april 2004 On April 15, 2004, we made a payment of $305.3 million upon
maturity of our 6.8% senior notes, representing principal of $295.3 million and accrued interest of $10.0 million.
other debt transactionsOn May 23, 2006, Nabors International Management Ltd.
(“NIML”), a direct wholly-owned subsidiary of Nabors borrowed from affiliates of the initial purchasers of the $2.75 billion senior exchangeable notes, $650 million pursuant to a 90-day senior unsecured loan. The proceeds of the loan were used to purchase 18.4 million of Nabors’ common shares, which are held in treasury. The unsecured loan was paid in full on June 30, 2006.
short-term BorrowingsWe have three letter of credit facilities with various banks as of
December 31, 2006. We did not have any short-term borrowings outstanding at December 31, 2006 and 2005. Availability and borrowings under our credit facilities are as follows:
december 31,
(in thousands) 2006 2005
Creditavailable $ 147,545 $ 125,113Lettersofcreditoutstanding (108,580) (85,248)
Remainingavailability $ 38,965 $ 39,865
10 IncomeTaxes
Income before income taxes was comprised of the following:
Year Ended december 31,
(in thousands) 2006 2005 2004
Domesticandforeignsummary: UnitedStates $ 972,278 $ 428,454 $ 25,709 Foreign 498,641 445,496 310,129
Incomebeforeincometaxes $ 1,470,919 $ 873,950 $ 335,838
Income taxes have been provided based upon the tax laws and rates in the countries in which operations are conducted and income is earned. We are a Bermuda-exempt company. Bermuda does not impose corporate income taxes. Our U.S. subsidiaries are subject to a U.S. federal tax rate of 35%.
Income tax expense (benefit) consisted of the following:
Year Ended december 31,
(in thousands) 2006 2005 2004
Current: U.S.federal $ 165,599 $ 5,957 $ 4,955 Foreign 50,335 23,755 15,868 State 15,926 805 44
231,860 30,517 20,867
Deferred: U.S.federal 194,219 139,030 (20,300) Foreign 8,845 47,568 32,471 State 15,259 8,140 343
218,323 194,738 12,514
Incometaxexpense $ 450,183 $ 225,255 $ 33,381
Nabors is not subject to tax in Bermuda. A reconciliation of the differences between taxes on income before income taxes computed at the appropriate statutory rate and our reported provision for income taxes follows:
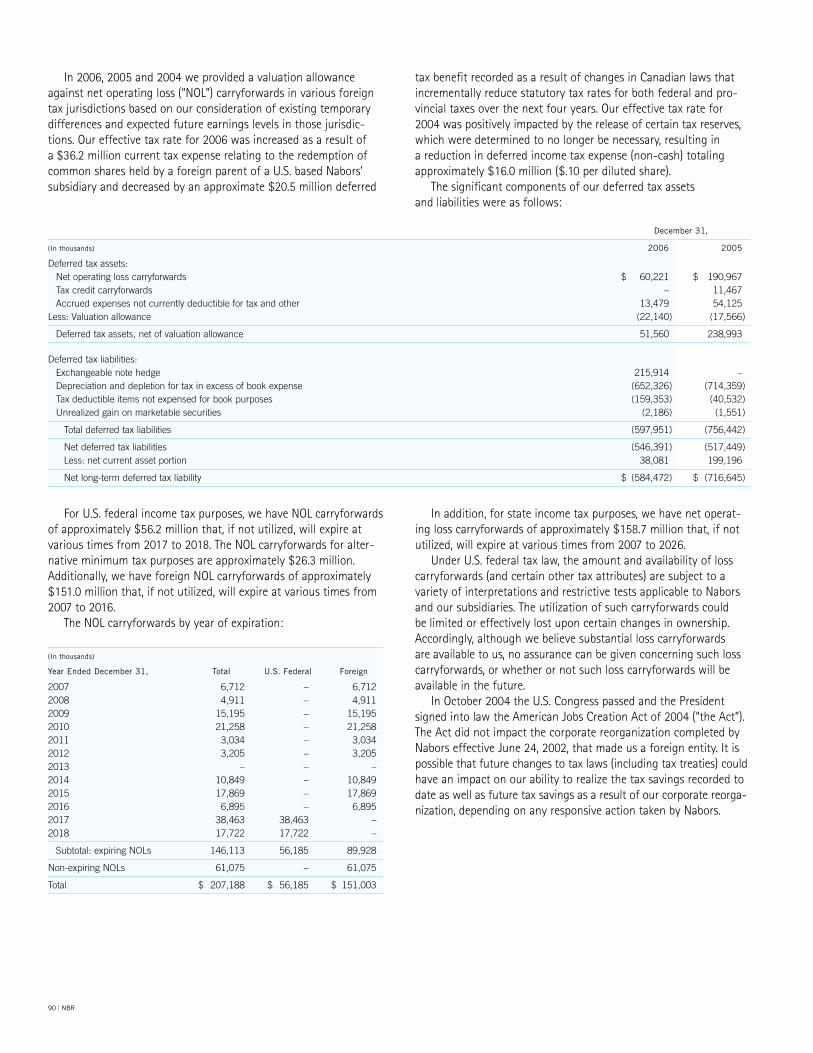
90 | NBR
For U.S. federal income tax purposes, we have NOL carryforwards of approximately $56.2 million that, if not utilized, will expire at various times from 2017 to 2018. The NOL carryforwards for alter-native minimum tax purposes are approximately $26.3 million. Additionally, we have foreign NOL carryforwards of approximately $151.0 million that, if not utilized, will expire at various times from 2007 to 2016.
The NOL carryforwards by year of expiration:
(in thousands)
Year Ended december 31, total u.s. federal foreign
2007 6,712 – 6,7122008 4,911 – 4,9112009 15,195 – 15,1952010 21,258 – 21,2582011 3,034 – 3,0342012 3,205 – 3,2052013 – – –2014 10,849 – 10,8492015 17,869 – 17,8692016 6,895 – 6,8952017 38,463 38,463 –2018 17,722 17,722 –
Subtotal:expiringNOLs 146,113 56,185 89,928
Non-expiringNOLs 61,075 – 61,075
Total $ 207,188 $ 56,185 $ 151,003
In addition, for state income tax purposes, we have net operat-ing loss carryforwards of approximately $158.7 million that, if not utilized, will expire at various times from 2007 to 2026.
Under U.S. federal tax law, the amount and availability of loss carryforwards (and certain other tax attributes) are subject to a variety of interpretations and restrictive tests applicable to Nabors and our subsidiaries. The utilization of such carryforwards could be limited or effectively lost upon certain changes in ownership. Accordingly, although we believe substantial loss carryforwards are available to us, no assurance can be given concerning such loss carryforwards, or whether or not such loss carryforwards will be available in the future.
In October 2004 the U.S. Congress passed and the President signed into law the American Jobs Creation Act of 2004 (“the Act”). The Act did not impact the corporate reorganization completed by Nabors effective June 24, 2002, that made us a foreign entity. It is possible that future changes to tax laws (including tax treaties) could have an impact on our ability to realize the tax savings recorded to date as well as future tax savings as a result of our corporate reorga-nization, depending on any responsive action taken by Nabors.
december 31,
(in thousands) 2006 2005
Deferredtaxassets: Netoperatinglosscarryforwards $ 60,221 $ 190,967 Taxcreditcarryforwards – 11,467 Accruedexpensesnotcurrentlydeductiblefortaxandother 13,479 54,125Less:Valuationallowance (22,140) (17,566)
Deferredtaxassets,netofvaluationallowance 51,560 238,993
Deferredtaxliabilities: Exchangeablenotehedge 215,914 – Depreciationanddepletionfortaxinexcessofbookexpense (652,326) (714,359) Taxdeductibleitemsnotexpensedforbookpurposes (159,353) (40,532) Unrealizedgainonmarketablesecurities (2,186) (1,551)
Totaldeferredtaxliabilities (597,951) (756,442)
Netdeferredtaxliabilities (546,391) (517,449) Less:netcurrentassetportion 38,081 199,196
Netlong-termdeferredtaxliability $ (584,472) $ (716,645)
In 2006, 2005 and 2004 we provided a valuation allowance against net operating loss (“NOL”) carryforwards in various foreign tax jurisdictions based on our consideration of existing temporary differences and expected future earnings levels in those jurisdic-tions. Our effective tax rate for 2006 was increased as a result of a $36.2 million current tax expense relating to the redemption of common shares held by a foreign parent of a U.S. based Nabors’ subsidiary and decreased by an approximate $20.5 million deferred
tax benefit recorded as a result of changes in Canadian laws that incrementally reduce statutory tax rates for both federal and pro-vincial taxes over the next four years. Our effective tax rate for 2004 was positively impacted by the release of certain tax reserves, which were determined to no longer be necessary, resulting in a reduction in deferred income tax expense (non-cash) totaling approximately $16.0 million ($.10 per diluted share).
The significant components of our deferred tax assets and liabilities were as follows:
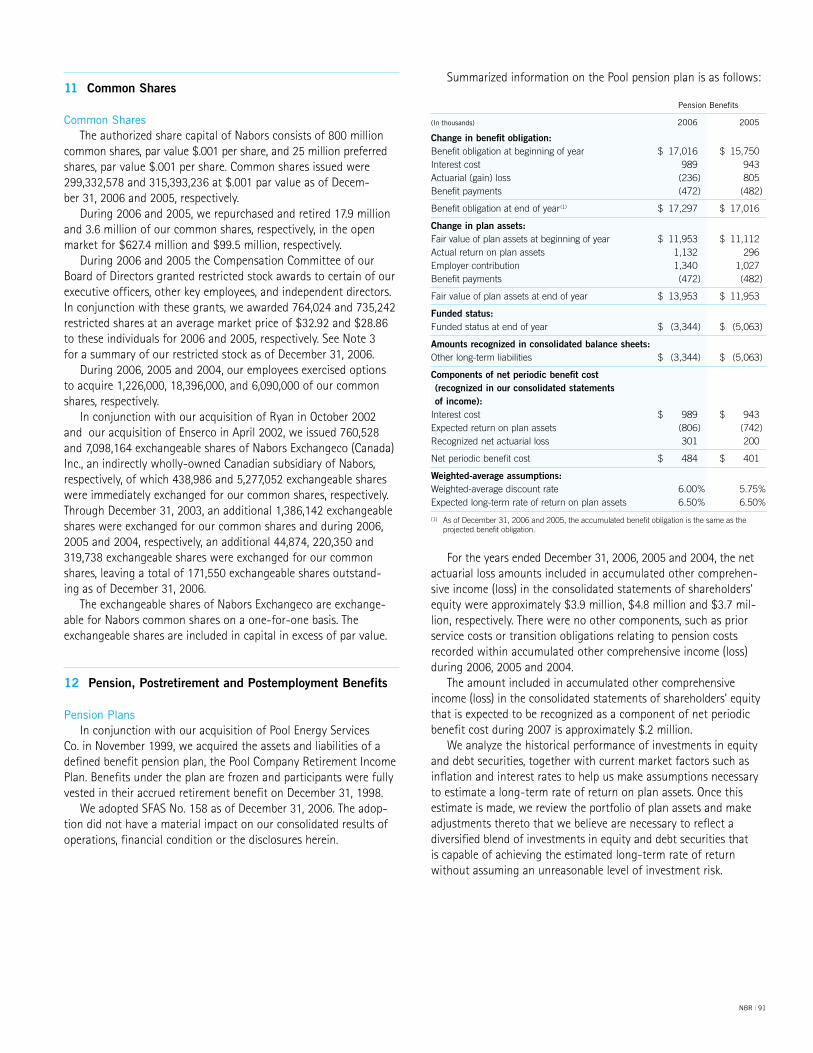
NBR | 91
11 CommonShares
Common sharesThe authorized share capital of Nabors consists of 800 million
common shares, par value $.001 per share, and 25 million preferred shares, par value $.001 per share. Common shares issued were 299,332,578 and 315,393,236 at $.001 par value as of Decem- ber 31, 2006 and 2005, respectively.
During 2006 and 2005, we repurchased and retired 17.9 million and 3.6 million of our common shares, respectively, in the open market for $627.4 million and $99.5 million, respectively.
During 2006 and 2005 the Compensation Committee of our Board of Directors granted restricted stock awards to certain of our executive officers, other key employees, and independent directors. In conjunction with these grants, we awarded 764,024 and 735,242 restricted shares at an average market price of $32.92 and $28.86 to these individuals for 2006 and 2005, respectively. See Note 3 for a summary of our restricted stock as of December 31, 2006.
During 2006, 2005 and 2004, our employees exercised options to acquire 1,226,000, 18,396,000, and 6,090,000 of our common shares, respectively.
In conjunction with our acquisition of Ryan in October 2002 and our acquisition of Enserco in April 2002, we issued 760,528 and 7,098,164 exchangeable shares of Nabors Exchangeco (Canada) Inc., an indirectly wholly-owned Canadian subsidiary of Nabors, respectively, of which 438,986 and 5,277,052 exchangeable shares were immediately exchanged for our common shares, respectively. Through December 31, 2003, an additional 1,386,142 exchangeable shares were exchanged for our common shares and during 2006, 2005 and 2004, respectively, an additional 44,874, 220,350 and 319,738 exchangeable shares were exchanged for our common shares, leaving a total of 171,550 exchangeable shares outstand-ing as of December 31, 2006.
The exchangeable shares of Nabors Exchangeco are exchange-able for Nabors common shares on a one-for-one basis. The exchangeable shares are included in capital in excess of par value.
12 Pension,PostretirementandPostemploymentBenefits
Pension PlansIn conjunction with our acquisition of Pool Energy Services
Co. in November 1999, we acquired the assets and liabilities of a defined benefit pension plan, the Pool Company Retirement Income Plan. Benefits under the plan are frozen and participants were fully vested in their accrued retirement benefit on December 31, 1998.
We adopted SFAS No. 158 as of December 31, 2006. The adop-tion did not have a material impact on our consolidated results of operations, financial condition or the disclosures herein.
Summarized information on the Pool pension plan is as follows:
Pension Benefits
(in thousands) 2006 2005
Changeinbenefitobligation:Benefitobligationatbeginningofyear $ 17,016 $ 15,750Interestcost 989 943Actuarial(gain)loss (236) 805Benefitpayments (472) (482)
Benefitobligationatendofyear(1) $ 17,297 $ 17,016
Changeinplanassets:Fairvalueofplanassetsatbeginningofyear $ 11,953 $ 11,112Actualreturnonplanassets 1,132 296Employercontribution 1,340 1,027Benefitpayments (472) (482)
Fairvalueofplanassetsatendofyear $ 13,953 $ 11,953
Fundedstatus:Fundedstatusatendofyear $ (3,344) $ (5,063)
Amountsrecognizedinconsolidatedbalancesheets:Otherlong-termliabilities $ (3,344) $ (5,063)
Componentsofnetperiodicbenefitcost (recognizedinourconsolidatedstatementsofincome):Interestcost $ 989 $ 943Expectedreturnonplanassets (806) (742)Recognizednetactuarialloss 301 200
Netperiodicbenefitcost $ 484 $ 401
Weighted-averageassumptions:Weighted-averagediscountrate 6.00% 5.75%Expectedlong-termrateofreturnonplanassets 6.50% 6.50%
(1) AsofDecember31,2006and2005,theaccumulatedbenefitobligationisthesameastheprojectedbenefitobligation.
For the years ended December 31, 2006, 2005 and 2004, the net actuarial loss amounts included in accumulated other comprehen-sive income (loss) in the consolidated statements of shareholders’ equity were approximately $3.9 million, $4.8 million and $3.7 mil-lion, respectively. There were no other components, such as prior service costs or transition obligations relating to pension costs recorded within accumulated other comprehensive income (loss) during 2006, 2005 and 2004.
The amount included in accumulated other comprehensive income (loss) in the consolidated statements of shareholders’ equity that is expected to be recognized as a component of net periodic benefit cost during 2007 is approximately $.2 million.
We analyze the historical performance of investments in equity and debt securities, together with current market factors such as inflation and interest rates to help us make assumptions necessary to estimate a long-term rate of return on plan assets. Once this estimate is made, we review the portfolio of plan assets and make adjustments thereto that we believe are necessary to reflect a diversified blend of investments in equity and debt securities that is capable of achieving the estimated long-term rate of return without assuming an unreasonable level of investment risk.
92 | NBR
The measurement date used to determine pension measurements for the plan is December 31.
Our weighted-average asset allocations as of December 31, 2006 and 2005, by asset category are as follows:
Pension Benefits
2006 2005
Equitysecurities 55% 57%Debtsecurities 45% 41%Other – 2%
Total 100% 100%
We invest plan assets based on a total return on investment approach, pursuant to which the plan assets include a diversified blend of investments in equity and debt securities toward a goal of maximizing the long-term rate of return without assuming an unreasonable level of investment risk. We determine the level of risk based on an analysis of plan liabilities, the extent to which the value of the plan assets satisfies the plan liabilities and our financial condition. Our investment policy includes target allocations approx-imating 55% investment in equity securities and 45% investment in debt securities. The equity portion of the plan assets represents growth and value stocks of small, medium and large companies. We measure and monitor the investment risk of the plan assets both on a quarterly basis and annually when we assess plan liabilities.
We expect to contribute approximately $1.0 million to the Pool pension plan in 2007. This is based on the sum of (1) the minimum contribution for the 2006 plan year that will be made in 2007 and (2) the estimated minimum required quarterly contributions for the 2007 plan year. We made contributions to the Pool pension plan in 2006 and 2005 totaling $1.3 million and $1.0 million, respectively.
As of December 31, 2006, we expect that benefits to be paid in each of the next five fiscal years after 2006 and in the aggregate for the five fiscal years thereafter will be as follows:
(in thousands)
2007 $ 5052008 5562009 5992010 6362011 7012012–2016 4,929
Certain of Nabors’ employees are covered by defined contribu-tion plans. Our contributions to the plans are based on employee contributions and totaled $12.0 million and $9.0 million for the years ended December 31, 2006 and 2005, respectively. Nabors does not provide postemployment benefits to its employees.
Postretirement Benefits other than PensionsPrior to the date of our acquisition, Pool provided certain post-
retirement healthcare and life insurance benefits to eligible retirees who had attained specific age and years of service requirements. Nabors terminated this plan at the date of acquisition (Novem-ber 24, 1999). A liability of approximately $.2 million and $.3 million is recorded in our consolidated balance sheets as of December 31, 2006 and 2005, respectively, to cover the estimated costs of bene-ficiaries covered by the plan at the date of acquisition.
13 RelatedPartyTransactions
Pursuant to his employment agreement entered into in Octo-ber 1996, we provided an unsecured, non-interest bearing loan of approximately $2.9 million to Nabors’ Deputy Chairman, President and Chief Operating Officer. The loan was repaid to the Company on October 8, 2006.
Pursuant to their employment agreements, Nabors and its Chairman and Chief Executive Officer, Deputy Chairman, President and Chief Operating Officer, and certain other key employees entered into split-dollar life insurance agreements pursuant to which we pay a portion of the premiums under life insurance policies with respect to these individuals and, in certain instances, members of their families. Under these agreements, we are reimbursed for such premiums upon the occurrence of specified events, including the death of an insured individual. Any recovery of premiums paid by Nabors could potentially be limited to the cash surrender value of these policies under certain circumstances. As such, the values of these policies are recorded at their respective cash surrender values in our consolidated balance sheets. We have made premium payments to date totaling $11.2 million related to these policies. The cash sur-render value of these policies of approximately $10.3 million and $10.1 million is included in other long-term assets in our consolidated balance sheets as of December 31, 2006 and 2005, respectively.
Under the Sarbanes-Oxley Act of 2002, the payment of premi-ums by Nabors under the agreements with our Chairman and Chief Executive Officer and with our Deputy Chairman, President and Chief Operating Officer may be deemed to be prohibited loans by us to these individuals. We have paid no premiums related to our agree-ments with these individuals since the adoption of the Sarbanes-Oxley Act and have postponed premium payments related to our agreements with these individuals.
In the ordinary course of business, we enter into various rig leases, rig transportation and related oilfield services agreements with our Alaskan and Saudi Arabian unconsolidated affiliates at market prices. Revenues from business transactions with these affiliated entities totaled $99.2 million, $82.3 million and $63.2 million for the years ended December 31, 2006, 2005 and 2004, respectively. Expenses from business transactions with these affiliated entities totaled $4.7 mil-lion, $4.0 million and $3.3 million for the years ended December 31, 2006, 2005 and 2004, respectively. Additionally, we had accounts receivable from these affiliated entities of $41.2 million and $33.1 mil-lion as of December 31, 2006 and 2005, respectively. We had accounts payable to these affiliated entities of $0.3 million and $2.2 million as of December 31, 2006 and 2005, respectively, and long-term pay-ables with these affiliated entities of $6.6 million and $5.8 million as of December 31, 2006 and 2005, respectively, which is included in other long-term liabilities.

NBR | 93
Additionally, we own certain marine vessels that are chartered under a bareboat charter arrangement to Sea Mar Management LLC, an entity in which we own a 25% interest. Under the requirements of FIN 46R, this entity was consolidated by Nabors beginning in 2004.
During the fourth quarter of 2006, the Company entered into a transaction with Shona Energy Company, LLC (“Shona”), a com-pany in which Mr. Payne, an outside director of the Company, is the Chairman and Chief Executive Officer. Pursuant to the transaction, a subsidiary of the Company acquired and holds a minority interest of less than 20% of the issued and outstanding common shares of Shona in exchange for certain rights derived from an oil and gas concession held by that subsidiary.
14 CommitmentsandContingencies
Commitments
operating leasesNabors and its subsidiaries occupy various facilities and lease
certain equipment under various lease agreements. The minimum rental commitments under non-cancelable operating leases, with lease terms in excess of one year subsequent to December 31, 2006, are as follows:
(in thousands)
2007 $ 10,3242008 8,8672009 4,2872010 3,4862011 2,891Thereafter 2,008
$ 31,863
The above amounts do not include property taxes, insurance or normal maintenance that the lessees are required to pay. Rental expense relating to operating leases with terms greater than 30 days amounted to $21.6 million, $20.1 million and $19.2 million for the years ended December 31, 2006, 2005 and 2004, respectively.
Employment ContractsWe have entered into employment contracts with certain of our
employees. Our minimum salary and bonus obligations under these contracts as of December 31, 2006 are as follows:
(in thousands)
2007 $ 2,5982008 2,4072009 2,3202010 1,6932011andthereafter –
$ 9,018
Nabors’ Chairman and Chief Executive Officer, Eugene M. Isenberg, and its Deputy Chairman, President and Chief Operating Officer, Anthony G. Petrello, have employment agreements which were amended and restated effective October 1, 1996 and which currently are due to expire on September 30, 2010.
Mr. Isenberg’s employment agreement was originally negotiated with a creditors committee in 1987 in connection with the reor-ganization proceedings of Anglo Energy, Inc., which subsequently changed its name to Nabors. These contractual arrangements sub-sequently were approved by the various constituencies in those reorganization proceedings, including equity and debt holders, and confirmed by the United States Bankruptcy Court.
Mr. Petrello’s employment agreement was first entered into effective October 1, 1991. Mr. Petrello’s employment agreement was agreed upon as part of arm’s length negotiations with the Board before he joined Nabors in October 1991, and was reviewed and approved by the Compensation Committee of the Board and the full Board of Directors at that time.
The employment agreements for Messrs. Isenberg and Petrello were amended in 1994 and 1996. These amendments were approved by the Compensation Committee of the Board and the full Board of Directors at that time.
The employment agreements provide for an initial term of five years with an evergreen provision which automatically extended the agreement for an additional one-year term on each anniversary date, unless Nabors provided notice to the contrary ten days prior to such anniversary. The Board of Directors in March 2006 exercised its election to fix the expiration date of the employment agreements for Messrs. Isenberg and Petrello, and accordingly, these agreements will expire at the end of their current term at September 30, 2010.
In addition to a base salary, the employment agreements pro-vide for annual cash bonuses in an amount equal to 6% and 2%, for Messrs. Isenberg and Petrello, respectively, of Nabors’ net cash flow (as defined in the respective employment agreements) in excess of 15% of the average shareholders’ equity for each fiscal year. (Mr. Isenberg’s cash bonus formula originally was set at 10% in excess of a 10% return on shareholders’ equity and he has vol-untarily reduced it over time to its 6% in excess of 15% level.) Mr. Petrello’s bonus is subject to a minimum of $700,000 per year. In 16 of the last 17 years, Mr. Isenberg has agreed voluntarily to accept a lower annual cash bonus (i.e., an amount lower than the amount provided for under his employment agreement) in light of his overall compensation package. Mr. Petrello has agreed volun-tarily to accept a lower annual cash bonus (i.e., an amount lower than the amount provided for under his employment agreement) in light of his overall compensation package in 13 of the last 16 years.
Mr. Isenberg voluntarily agreed to amend his employment agree-ment in March 2006 (the “2006 Amendment”). Under the 2006 Amendment, Mr. Isenberg agreed to reduce the annual cash bonus to an amount equal to 3% of Nabors’ net cash flow (as defined in his employment agreement) in excess of 15% of the average share-holders’ equity for 2006. For 2007 through the expiration date of the employment agreement, the annual cash bonus will return to 6% of Nabors’ net cash flow in excess of 15% of the average shareholders’ equity for each fiscal year.
For 2006, the annual cash bonuses for Messrs. Isenberg and Petrello pursuant to the formula described in their employment agree-ments were $43.2 million and $28.7 million, respectively. In light of their overall compensation package including significant restricted stock awards (see Note 3), they agreed to accept cash bonuses in the amount of $22.0 million and $14.6 million, respectively.
94 | NBR
Messrs. Isenberg and Petrello also are eligible for awards under Nabors’ equity plans and may participate in annual long-term incentive programs and pension and welfare plans, on the same basis as other executives; and may receive special bonuses from time to time as determined by the Board.
termination in the event of death, disability, or termination without cause In the event that either Mr. Isenberg’s or Mr. Petrello’s employment agreement is terminated (i) upon death or disability (as defined in the respective employment agreements), (ii) by Nabors prior to the expiration date of the employment agreement for any reason other than for Cause (as defined in the respective employment agreements) or (iii) by either individual for Constructive Termination Without Cause (as defined in the respective employment agreements), each would be entitled to receive within 30 days of the triggering event (a) all base salary which would have been payable through the expiration date of the contract or three times his then current base salary, whichever is greater; plus (b) the greater of (i) all annual cash bonuses which would have been payable through the expiration date; (ii) three times the highest bonus (including the imputed value of grants of stock awards and stock options), paid during the last three fiscal years prior to termination; or (iii) three times the highest annual cash bonus payable for each of the three previous fiscal years prior to termination, regardless of whether the amount was paid. In computing any amount due under (b)(i) and (iii) above, the cal-culation is made without regard to the 2006 Amendment reduc-ing Mr. Isenberg’s bonus percentage as described above. If, by way of example, these provisions had applied at December 31, 2006, Mr. Isenberg would have been entitled to a payment of approxi-mately $329 million, subject to a “true-up” equal to the amount of cash bonus he would have earned under the formula during the remaining term of the agreement, based upon actual results, but would not be less than approximately $264 million. Similarly, with respect to Mr. Petrello, had these provisions applied at December 31, 2006, Mr. Petrello would have been entitled to a payment of approx-imately $112 million, subject to a “true-up” equal to the amount of cash bonus he would have earned under the formula during the remaining term of the agreement, based upon actual results, but would not be less than approximately $103 million. These payment amounts are based on historical data and are not intended to be estimates of future payments required under the agreements. Depending upon future operating results, the true-up could result in the payment of amounts which are significantly higher. In addi-tion, the affected individual is entitled to receive (a) any unvested restricted stock outstanding, which shall immediately and fully vest; (b) any unvested outstanding stock options, which shall immediately and fully vest; (c) any amounts earned, accrued or owing to the exec-utive but not yet paid (including executive benefits, life insurance, disability benefits and reimbursement of expenses and perquisites), which shall be continued through the later of the expiration date or three years after the termination date; (d) continued participation in medical, dental and life insurance coverage until the executive receives equivalent benefits or coverage through a subsequent employer or until the death of the executive or his spouse, which-ever is later; and (e) any other or additional benefits in accordance with applicable plans and programs of Nabors. For Mr. Isenberg, as of December 31, 2006, the value of unvested restricted stock was approximately $9.9 million and the value of in-the-money unvested stock options was approximately $4.3 million. For Mr. Petrello, as of December 31, 2006, the value of unvested restricted stock was
approximately $5.0 million and the value of in-the-money unvested stock options was approximately $2.2 million. Estimates of the cash value of Nabors’ obligations to Messrs. Isenberg and Petrello under (c), (d) and (e) above are included in the payment amounts above.
The Board of Directors in March 2006 exercised its election to fix the expiration date of the employment agreements for Messrs. Isenberg and Petrello. Messrs. Isenberg and Petrello have informed the Board of Directors that they have reserved their rights under their employment agreements with respect to the notice setting the expiration dates of their employment agreements, including whether such notice could trigger an acceleration of certain payments pursuant to their employment agreements.
termination in the event of a Change in Control In the event that Messrs. Isenberg’s or Petrello’s termination of employment is related to a Change in Control (as defined in their respective employment agreements), they would be entitled to receive a cash amount equal to the greater of (a) one dollar less than the amount that would constitute an “excess parachute payment” as defined in Section 280G of the Internal Revenue Code, or (b) the cash amount that would be due in the event of a termination without cause, as described above. If, by way of example, there was a change of con-trol event that applied on December 31, 2006, then the payments to Messrs. Isenberg and Petrello would be approximately $329 million and $112 million, respectively. These payment amounts are based on historical data and are not intended to be estimates of future payments required under the agreements. Depending upon future operating results, the true-up could result in the payment of amounts which are significantly higher. In addition, they would receive (a) any unvested restricted stock outstanding, which shall immediately and fully vest; (b) any unvested outstanding stock options, which shall immediately and fully vest; (c) any amounts earned, accrued or owing to the executive but not yet paid (includ-ing executive benefits, life insurance, disability benefits and reim-bursement of expenses and perquisites), which shall be continued through the later of the expiration date or three years after the ter-mination date; (d) continued participation in medical, dental and life insurance coverage until the executive receives equivalent bene-fits or coverage through a subsequent employer or until the death of the executive or his spouse, whichever is later; and (e) any other or additional benefits in accordance with applicable plans and pro-grams of Nabors. For Mr. Isenberg, as of December 31, 2006, the value of unvested restricted stock was approximately $9.9 million and the value of in-the-money unvested stock options was approxi-mately $4.3 million. For Mr. Petrello, as of December 31, 2006, the value of unvested restricted stock was approximately $5.0 million and the value of in-the-money unvested stock options was approxi-mately $2.2 million. The cash value of Nabors’ obligations to Messrs. Isenberg and Petrello under (c), (d) and (e) above are included in the payment amounts above. Also, they would receive additional stock options immediately exercisable for five years to acquire a number of shares of common stock equal to the highest number of options granted during any fiscal year in the previous three fiscal years, at an option exercise price equal to the average closing price during the 20 trading days prior to the event which resulted in the change of control. If, by way of example, there was a change of control event that applied at December 31, 2006, Mr. Isenberg would have received 3,366,666 options valued at approximately $36 million and Mr. Petrello would have received 1,683,332 options valued at approximately $18 million, in each case based upon a Black-Scholes
NBR | 95
analysis. Finally, in the event that an excise tax was applicable, they would receive a gross-up payment to make them whole with respect to any excise taxes imposed by Section 4999 of the Internal Revenue Code. With respect to the preceding sentence, by way of example, if there was a change of control event that applied on December 31, 2006, and assuming that the excise tax were appli-cable to the transaction, then the additional payments to Messrs. Isenberg and Petrello for the gross-up would be up to approxi-mately $146 million and $51 million, respectively.
other obligations In addition to salary and bonus, each of Messrs. Isenberg and Petrello receive group life insurance at an amount at least equal to three times their respective base salaries, various split-dollar life insurance policies, reimbursement of expenses, various perquisites and a personal umbrella insurance policy in the amount of $5 million. Premiums payable under the split dollar life insurance policies were suspended as a result of the adoption of the Sarbanes-Oxley Act of 2002.
New Joint VentureOn September 22, 2006, we entered into an agreement with First
Reserve Corporation to form a new joint venture, NFR Energy LLC, to invest in oil and gas exploitation opportunities worldwide. First Reserve Corporation is a private equity firm specializing in the energy industry. Each party initially will hold an equal interest in the new entity and has committed to fund its proportionate share of $1.0 billion in equity. NFR Energy LLC will pursue development and exploration projects with both existing customers of ours and with other operators in a variety of forms including operated and non-operated working interests, joint ventures, farm-outs and acquisitions. NFR Energy LLC has not commenced operations and has not received funding as of December 31, 2006 by either party.
Contingencies
income tax ContingenciesWe are subject to income taxes in both the United States and
numerous foreign jurisdictions. Significant judgment is required in determining our worldwide provision for income taxes. In the ordi-nary course of our business, there are many transactions and cal-culations where the ultimate tax determination is uncertain. We are regularly under audit by tax authorities. Although we believe our tax estimates are reasonable, the final determination of tax audits and any related litigation could be materially different than that which is reflected in historical income tax provisions and accruals. Based on the results of an audit or litigation, a material effect on our financial position, income tax provision, net income, or cash flows in the period or periods for which that determination is made could result.
It is possible that future changes to tax laws (including tax treaties) could have an impact on our ability to realize the tax savings recorded to date as well as future tax savings as a result of our corporate reorganization, depending on any responsive action taken by us.
On May 31, 2006, Nabors International Finance Inc. (“NIFI”), a wholly-owned U.S. subsidiary of Nabors, received from the U.S. Internal Revenue Service (the “IRS”) two Notices of Proposed Adjustment (“NOPA”) in connection with an audit of NIFI for tax years 2002 and 2003. One NOPA proposes to deny a deduction of $85.1 million in interest expense in our 2002 tax year relating to intercompany indebtedness incurred in connection with our inver-sion transaction in June 2002 whereby we were reorganized as a Bermuda company. The second NOPA proposes to deny a deduction of $207.6 million in the same item of interest expense in our 2003 tax year. On August 9, 2006, NIFI received a Revenue Agent Report, asserting the adjustments relating to the two NOPAs referred to above. On September 18, 2006, NIFI filed a protest with the IRS related to the two adjustments and we intend to contest the IRS position vigorously. We previously had obtained advice from our tax advisors that the deduction of such amounts was appropriate and more recently that the position of the IRS lacks merit. At the end of 2003 the Company paid off approximately one-half of the inter-company indebtedness incurred in connection with the inversion. It is likely that the IRS will propose the disallowance of these deductions upon audit of NIFI’s 2004, 2005 and 2006 tax years. We currently have not recorded any reserves for such proposed adjustments.
On September 14, 2006, Nabors Drilling International Limited (“NDIL”), a wholly-owned Bermuda subsidiary of Nabors, received a Notice of Assessment (the “Notice”) from the Mexican Servicio de Administracion Tributaria (the “SAT”) in connection with the audit of NDIL’s Mexican branch for tax year 2003. The Notice proposes to deny a depreciation expense deduction that relates to drilling rigs operating in Mexico in 2003, as well as a deduction for payments made to an affiliated company for the provision of labor services in Mexico. The amount assessed by the SAT is approximately $19.8 mil-lion (including interest and penalties). Nabors and its tax advisors previously concluded that the deduction of said amounts was appro-priate and more recently that the position of the SAT lacks merit. Nabors has not recorded any reserves for the adjustments proposed by the SAT. NDIL’s Mexican branch took similar deductions for depre-ciation and labor expenses in 2004, 2005 and 2006. It is likely that the SAT will propose the disallowance of these deductions upon audit of NDIL’s Mexican branch’s 2004, 2005 and 2006 tax years.
self-insurance accrualsWe are self-insured for certain losses relating to workers’ compen-
sation, employers’ liability, general liability, automobile liability and property damage. Effective April 1, 2006, with our insurance renewal, certain changes have been made to our insurance coverage increas-ing our self-insured retentions. Our domestic workers’ compensation program continues to be subject to a $1.0 million per occurrence deductible. Employers’ liability and Jones Act cases are subject to a $2.0 million deductible. Automobile liability continues at a $.5 mil-lion deductible. We are assuming an additional $3.0 million corridor deductible for domestic workers’ compensation claims. General liability claims continue to be subject to a $5.0 million deductible. However, as a result of insurance market conditions following Hur-ricanes Katrina and Rita, we are now subject to higher deductibles for removal of wreckage and debris and collision liability claims depending on the insured value of the individual rigs.
96 | NBR
In addition, we are subject to a $1.0 million deductible for all land rigs except for those located in Alaska, and a $5.0 million deductible for all our Alaska and offshore rigs with the exception of the Pool Arabia rigs, which are subject to a $2.5 million deduct-ible. This applies to all kinds of risks of physical damage except for named windstorms in the U.S. Gulf of Mexico. The deductible for named windstorms in the U.S. Gulf of Mexico is $25.0 million per occurrence. Also, the maximum coverage for named windstorms in the U.S. Gulf of Mexico is $50.0 million in this policy year.
Political risk insurance is procured for select operations in South America, Africa, the Middle East and Asia. Losses are sub-ject to a $0.25 million deductible, except for Colombia, which is subject to a $0.5 million deductible. There is no assurance that such coverage will adequately protect Nabors against liability from all potential consequences.
As of December 31, 2006 and 2005, our self-insurance accruals totaled $129.7 million and $116.7 million, respectively, and our related insurance recoveries/receivables were $7.5 million and $8.0 million, respectively.
litigationNabors and its subsidiaries are defendants or otherwise involved
in a number of lawsuits in the ordinary course of business. We esti-mate the range of our liability related to pending litigation when we believe the amount and range of loss can be estimated. We record our best estimate of a loss when the loss is considered probable. When a liability is probable and there is a range of estimated loss with no best estimate in the range, we record the minimum estimated liability related to the lawsuits or claims. As additional information becomes available, we assess the potential liability related to our pending litigation and claims and revise our estimates. Due to uncer-tainties related to the resolution of lawsuits and claims, the ultimate outcome may differ from our estimates. In the opinion of manage-ment and based on liability accruals provided, our ultimate exposure with respect to these pending lawsuits and claims is not expected to have a material adverse effect on our consolidated financial posi-tion or cash flows, although they could have a material adverse effect on our results of operations for a particular reporting period.
During the quarter ended June 30, 2006, we settled a lawsuit involving wage and hour claims relating primarily to meal periods and travel time of current and former rig-based employees in our California well-servicing business. Those claims were heard by an arbitrator during the fourth quarter of 2005. On February 6, 2006, we received an interim award against us in the amount of $25.6 mil-lion (plus attorney’s fees and costs), which was accrued for in our consolidated statements of income for the year ended December 31, 2005. As a result of subsequent proceedings and the settlement, the final award was $24.3 million, which was paid during May 2006.
Additionally, on December 22, 2005, we received a grand jury subpoena from the United States Attorney’s Office in Anchorage, Alaska, seeking documents and information relating to an alleged spill, discharge, overflow or cleanup of drilling mud or sludge involving one of our rigs during March 2003. We are cooperating with the authorities in this matter.
On February 6, 2007, a purported shareholder derivative action entitled Kenneth H. Karstedt v. Eugene M. Isenberg, et al was filed in the United States District Court for the Southern District of Texas against the Company’s officers and directors, and against the Com-pany as a nominal defendant. The complaint alleges that stock options were priced retroactively and were improperly accounted for, and alleges various causes of action based on that assertion. The com-plaint seeks, among other things, payment by the defendants to the Company of damages allegedly suffered by it and disgorgement of profits. The ultimate outcome of this matter cannot be determined at this time. See Note 3 for further discussion relating to the stock option review performed by the Company.
In a letter dated December 28, 2006, the SEC staff advised us that it had commenced an informal inquiry regarding our stock option grants and related practices, procedures and accounting. We are cooperating with this inquiry. A more detailed discussion of this matter is contained in Note 3. It is not possible at this early stage to predict the likely outcome of this inquiry or whether the SEC staff will take a position contrary to the Company’s position, but it is pos-sible the ultimate result of the inquiry could have an adverse effect on us, our consolidated financial position, results of operations and cash flows.
GuaranteesWe enter into various agreements and obligations providing
financial or performance assurance to third parties. Certain of these agreements serve as guarantees, including standby letters of credit issued on behalf of insurance carriers in conjunction with our work-ers’ compensation insurance program and other financial surety instruments such as bonds. We have also guaranteed payment of contingent consideration in conjunction with certain acquisitions in 2005 and 2006. Potential contingent consideration is based on future operating results of those businesses. In addition, we have provided indemnifications to certain third parties which serve as guarantees. These guarantees include indemnification provided by Nabors to our share transfer agent and our insurance carriers. We are not able to estimate the potential future maximum payments that might be due under our indemnification guarantees.
Management believes the likelihood that we would be required to perform or otherwise incur any material losses associated with any of these guarantees is remote. The following table summarizes the total maximum amount of financial and performance guarantees issued by Nabors:
maximum amount
(in thousands) 2007 2008 2009 thereafter total
Financialstandbylettersofcreditandotherfinancialsuretyinstruments $ 102,356 $ 1,195 $ 100 $ 25 $103,676Contingentconsiderationinacquisition 10,297 1,063 1,063 2,124 14,547
Total $ 112,653 $ 2,258 $ 1,163 $ 2,149 $118,223
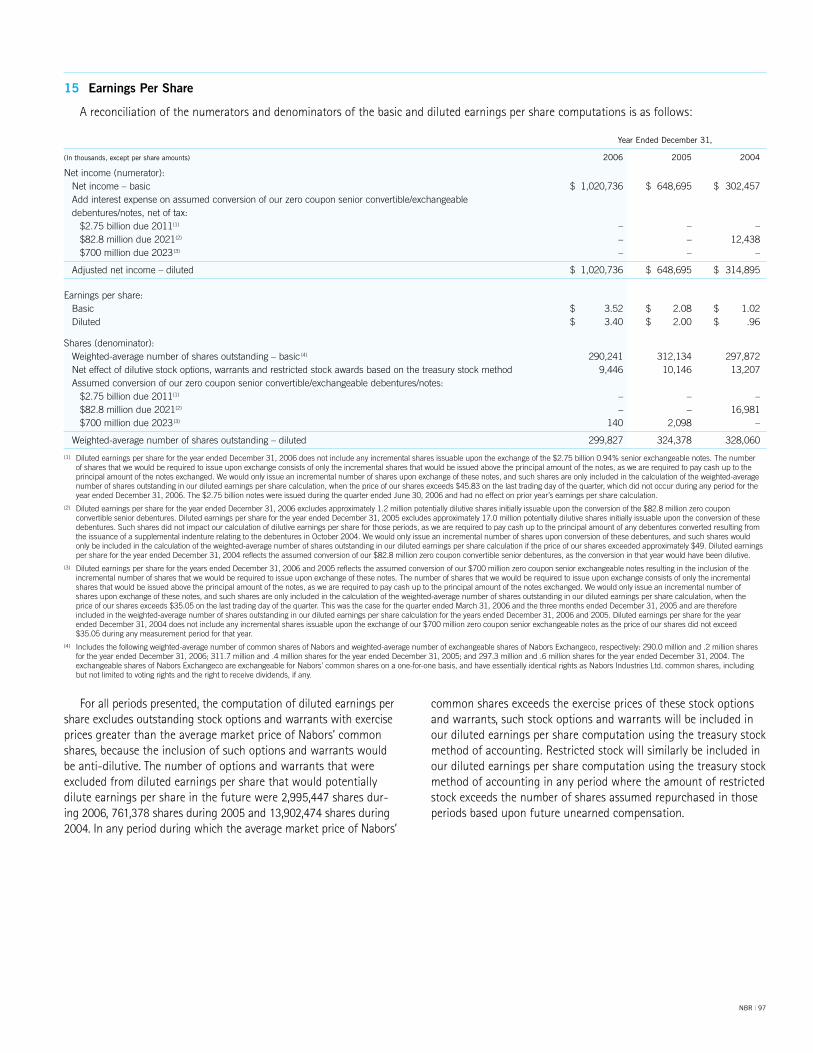
NBR | 97
15 EarningsPerShare
A reconciliation of the numerators and denominators of the basic and diluted earnings per share computations is as follows:
Year Ended december 31,
(in thousands, except per share amounts) 2006 2005 2004
Netincome(numerator): Netincome–basic $ 1,020,736 $ 648,695 $ 302,457 Addinterestexpenseonassumedconversionofourzerocouponseniorconvertible/exchangeable debentures/notes,netoftax: $2.75billiondue2011(1) – – – $82.8milliondue2021(2) – – 12,438 $700milliondue2023(3) – – –
Adjustednetincome–diluted $ 1,020,736 $ 648,695 $ 314,895
Earningspershare: Basic $ 3.52 $ 2.08 $ 1.02 Diluted $ 3.40 $ 2.00 $ .96
Shares(denominator): Weighted-averagenumberofsharesoutstanding–basic (4) 290,241 312,134 297,872 Neteffectofdilutivestockoptions,warrantsandrestrictedstockawardsbasedonthetreasurystockmethod 9,446 10,146 13,207 Assumedconversionofourzerocouponseniorconvertible/exchangeabledebentures/notes: $2.75billiondue2011(1) – – – $82.8milliondue2021(2) – – 16,981 $700milliondue2023(3) 140 2,098 –
Weighted-averagenumberofsharesoutstanding–diluted 299,827 324,378 328,060
(1) DilutedearningspersharefortheyearendedDecember31,2006doesnotincludeanyincrementalsharesissuableupontheexchangeofthe$2.75billion0.94%seniorexchangeablenotes.Thenumberofsharesthatwewouldberequiredtoissueuponexchangeconsistsofonlytheincrementalsharesthatwouldbeissuedabovetheprincipalamountofthenotes,aswearerequiredtopaycashuptotheprincipalamountofthenotesexchanged.Wewouldonlyissueanincrementalnumberofsharesuponexchangeofthesenotes,andsuchsharesareonlyincludedinthecalculationoftheweighted-averagenumberofsharesoutstandinginourdilutedearningspersharecalculation,whenthepriceofoursharesexceeds$45.83onthelasttradingdayofthequarter,whichdidnotoccurduringanyperiodfortheyearendedDecember31,2006.The$2.75billionnoteswereissuedduringthequarterendedJune30,2006andhadnoeffectonprioryear’searningspersharecalculation.
(2) DilutedearningspersharefortheyearendedDecember31,2006excludesapproximately1.2millionpotentiallydilutivesharesinitiallyissuableupontheconversionofthe$82.8millionzerocouponconvertibleseniordebentures.DilutedearningspersharefortheyearendedDecember31,2005excludesapproximately17.0millionpotentiallydilutivesharesinitiallyissuableupontheconversionofthesedebentures.Suchsharesdidnotimpactourcalculationofdilutiveearningspershareforthoseperiods,aswearerequiredtopaycashuptotheprincipalamountofanydebenturesconvertedresultingfromtheissuanceofasupplementalindenturerelatingtothedebenturesinOctober2004.Wewouldonlyissueanincrementalnumberofsharesuponconversionofthesedebentures,andsuchshareswouldonlybeincludedinthecalculationoftheweighted-averagenumberofsharesoutstandinginourdilutedearningspersharecalculationifthepriceofoursharesexceededapproximately$49.DilutedearningspersharefortheyearendedDecember31,2004reflectstheassumedconversionofour$82.8millionzerocouponconvertibleseniordebentures,astheconversioninthatyearwouldhavebeendilutive.
(3) DilutedearningspersharefortheyearsendedDecember31,2006and2005reflectstheassumedconversionofour$700millionzerocouponseniorexchangeablenotesresultingintheinclusionoftheincrementalnumberofsharesthatwewouldberequiredtoissueuponexchangeofthesenotes.Thenumberofsharesthatwewouldberequiredtoissueuponexchangeconsistsofonlytheincrementalsharesthatwouldbeissuedabovetheprincipalamountofthenotes,aswearerequiredtopaycashuptotheprincipalamountofthenotesexchanged.Wewouldonlyissueanincrementalnumberofsharesuponexchangeofthesenotes,andsuchsharesareonlyincludedinthecalculationoftheweighted-averagenumberofsharesoutstandinginourdilutedearningspersharecalculation,whenthepriceofoursharesexceeds$35.05onthelasttradingdayofthequarter.ThiswasthecaseforthequarterendedMarch31,2006andthethreemonthsendedDecember31,2005andarethereforeincludedintheweighted-averagenumberofsharesoutstandinginourdilutedearningspersharecalculationfortheyearsendedDecember31,2006and2005.DilutedearningspersharefortheyearendedDecember31,2004doesnotincludeanyincrementalsharesissuableupontheexchangeofour$700millionzerocouponseniorexchangeablenotesasthepriceofoursharesdidnotexceed$35.05duringanymeasurementperiodforthatyear.
(4) Includesthefollowingweighted-averagenumberofcommonsharesofNaborsandweighted-averagenumberofexchangeablesharesofNaborsExchangeco,respectively:290.0millionand.2millionsharesfortheyearendedDecember31,2006;311.7millionand.4millionsharesfortheyearendedDecember31,2005;and297.3millionand.6millionsharesfortheyearendedDecember31,2004.TheexchangeablesharesofNaborsExchangecoareexchangeableforNabors’commonsharesonaone-for-onebasis,andhaveessentiallyidenticalrightsasNaborsIndustriesLtd.commonshares,includingbutnotlimitedtovotingrightsandtherighttoreceivedividends,ifany.
For all periods presented, the computation of diluted earnings per share excludes outstanding stock options and warrants with exercise prices greater than the average market price of Nabors’ common shares, because the inclusion of such options and warrants would be anti-dilutive. The number of options and warrants that were excluded from diluted earnings per share that would potentially dilute earnings per share in the future were 2,995,447 shares dur-ing 2006, 761,378 shares during 2005 and 13,902,474 shares during 2004. In any period during which the average market price of Nabors’
common shares exceeds the exercise prices of these stock options and warrants, such stock options and warrants will be included in our diluted earnings per share computation using the treasury stock method of accounting. Restricted stock will similarly be included in our diluted earnings per share computation using the treasury stock method of accounting in any period where the amount of restricted stock exceeds the number of shares assumed repurchased in those periods based upon future unearned compensation.

98 | NBR
16 SupplementalBalanceSheet,IncomeStatement andCashFlowInformation
Accounts receivable is net of an allowance for doubtful accounts of $14.9 million and $11.4 million as of December 31, 2006 and 2005, respectively.
Accrued liabilities include the following:
december 31,
(in thousands) 2006 2005
Accruedcompensation $ 136,276 $ 88,071Deferredrevenue 65,747 19,542Workers’compensationliabilities 28,032 37,458Interestpayable 13,024 9,728Litigationreserves 4,536 30,182(1)
Otheraccruedliabilities 47,343 39,355
$ 294,958 $ 224,336
(1) Thisamountprimarilyrelatestoaninterimjudgmentreceivedagainstusintheamountof$25.6millionrelatedtoaclass-actionarbitrationhearingregardingcompensationissuesbroughtonbehalfoffieldemployeesforourwell-servicingunitoperationsinCalifornia(Note14).
Investment income includes the following:
Year Ended december 31,
(in thousands) 2006 2005 2004
Interestincome $ 54,606 $ 41,415 $ 22,572Gainsonmarketableandnon- marketablesecurities,net 46,260 43,007 20,638Dividendandother investmentincome 1,141 1,008 6,854
$102,007 $ 85,430 $ 50,064
Losses (gains) on sales of long-lived assets, impairment charges and other expense (income), net includes the following:
Year Ended december 31,
(in thousands) 2006 2005 2004
Losses(gains)onsales, retirementsandinvoluntary conversionsoflong-livedassets $ 21,579(3) $ 18,831(1) $ 874Litigationreserves 2,217 27,195(2) (1,601)Foreigncurrencytransaction losses(gains) 380 465 (755)(Gains)lossesonderivative instruments (1,361) (1,078) (2,363)Other 2,058 1,027 (784)
$ 24,873 $ 46,440 $ (4,629)
(1) ThisamountincludesinvoluntaryconversionlossesrecordedasaresultofHurricanesKatrinaandRitaduringthethirdquarterof2005ofapproximately$7.8million,netofexpectedinsuranceproceeds.
(2) Thisamountprimarilyrelatestoaninterimjudgmentreceivedagainstusintheamountof$25.6millionrelatedtoaclass-actionarbitrationhearingregardingcompensationissuesbroughtonbehalfoffieldemployeesforourwell-servicingunitoperationsinCalifornia(Note14).
(3) Thisamountincludes$12.4millioninimpairmentchargesrelatedtoassetretirementsduring2006.Therewerenoassetimpairmentsrecordedduring2005and2004.
Supplemental cash flow information for the years ended December 31, 2006, 2005 and 2004 is as follows:
Year Ended december 31,
(in thousands) 2006 2005 2004
Cashpaidforincometaxes $ 157,209 $ 25,480 $ 29,306Cashpaidforinterest,netof capitalizedinterest 28,605 28,507 27,899Acquisitionsofbusinesses: Fairvalueofassetsacquired 79,070 38,682 – Goodwill 20,815 9,554 – Liabilitiesassumedorcreated (17,293) (2,035) – Commonstockofacquired companypreviouslyowned – – – Equityconsiderationissued – – –
Cashpaidforacquisitions ofbusinesses 82,592 46,201 –Cashacquiredinacquisitions ofbusinesses (185) – –
Cashpaidforacquisitions ofbusinesses,net $ 82,407 $ 46,201 $ –
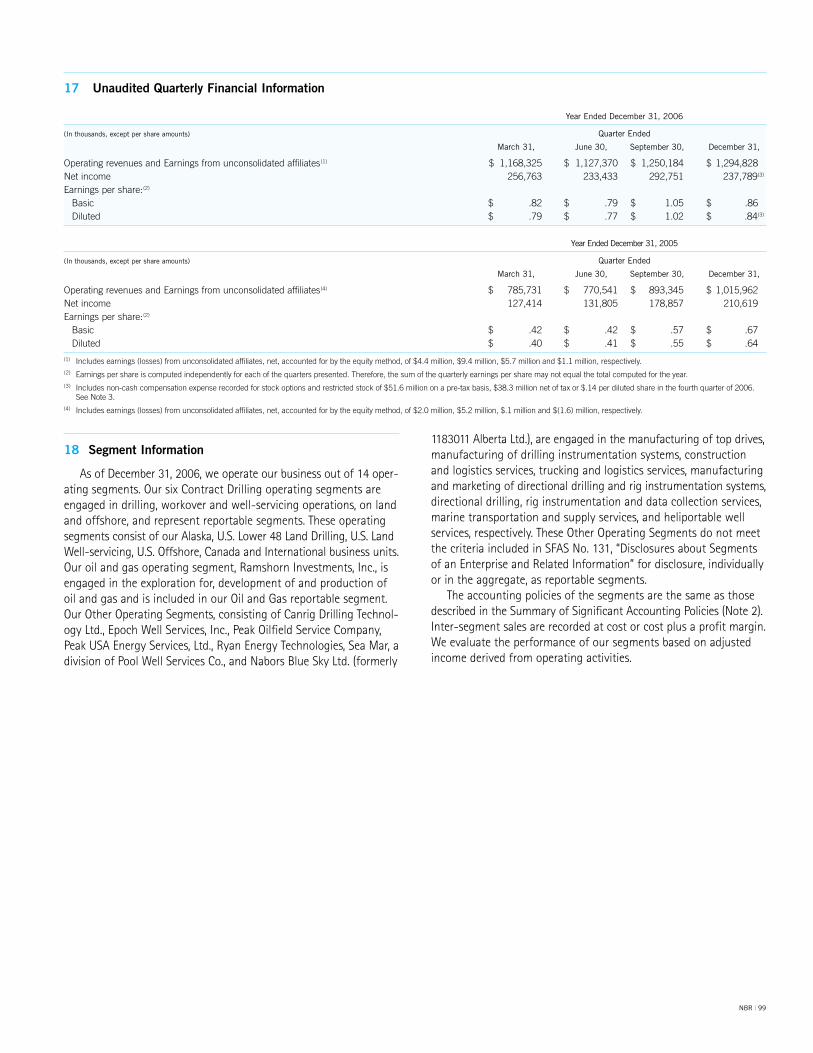
NBR | 99
17 UnauditedQuarterlyFinancialInformation
18 SegmentInformation
As of December 31, 2006, we operate our business out of 14 oper-ating segments. Our six Contract Drilling operating segments are engaged in drilling, workover and well-servicing operations, on land and offshore, and represent reportable segments. These operating segments consist of our Alaska, U.S. Lower 48 Land Drilling, U.S. Land Well-servicing, U.S. Offshore, Canada and International business units. Our oil and gas operating segment, Ramshorn Investments, Inc., is engaged in the exploration for, development of and production of oil and gas and is included in our Oil and Gas reportable segment. Our Other Operating Segments, consisting of Canrig Drilling Technol-ogy Ltd., Epoch Well Services, Inc., Peak Oilfield Service Company, Peak USA Energy Services, Ltd., Ryan Energy Technologies, Sea Mar, a division of Pool Well Services Co., and Nabors Blue Sky Ltd. (formerly
1183011 Alberta Ltd.), are engaged in the manufacturing of top drives, manufacturing of drilling instrumentation systems, construction and logistics services, trucking and logistics services, manufacturing and marketing of directional drilling and rig instrumentation systems, directional drilling, rig instrumentation and data collection services, marine transportation and supply services, and heliportable well services, respectively. These Other Operating Segments do not meet the criteria included in SFAS No. 131, “Disclosures about Segments of an Enterprise and Related Information” for disclosure, individually or in the aggregate, as reportable segments.
The accounting policies of the segments are the same as those described in the Summary of Significant Accounting Policies (Note 2). Inter-segment sales are recorded at cost or cost plus a profit margin. We evaluate the performance of our segments based on adjusted income derived from operating activities.
Year Ended december 31, 2006
(in thousands, except per share amounts) Quarter Ended
march 31, June 30, september 30, december 31,
OperatingrevenuesandEarningsfromunconsolidatedaffiliates(1) $ 1,168,325 $ 1,127,370 $ 1,250,184 $ 1,294,828Netincome 256,763 233,433 292,751 237,789(3)
Earningspershare:(2) Basic $ .82 $ .79 $ 1.05 $ .86 Diluted $ .79 $ .77 $ 1.02 $ .84(3)
Year Ended december 31, 2005
(in thousands, except per share amounts) Quarter Ended
march 31, June 30, september 30, december 31,
OperatingrevenuesandEarningsfromunconsolidatedaffiliates(4) $ 785,731 $ 770,541 $ 893,345 $ 1,015,962Netincome 127,414 131,805 178,857 210,619Earningspershare:(2) Basic $ .42 $ .42 $ .57 $ .67 Diluted $ .40 $ .41 $ .55 $ .64
(1) Includesearnings(losses)fromunconsolidatedaffiliates,net,accountedforbytheequitymethod,of$4.4million,$9.4million,$5.7millionand$1.1million,respectively.(2) Earningspershareiscomputedindependentlyforeachofthequarterspresented.Therefore,thesumofthequarterlyearningspersharemaynotequalthetotalcomputedfortheyear.(3) Includesnon-cashcompensationexpenserecordedforstockoptionsandrestrictedstockof$51.6milliononapre-taxbasis,$38.3millionnetoftaxor$.14perdilutedshareinthefourthquarterof2006.
SeeNote3.(4) Includesearnings(losses)fromunconsolidatedaffiliates,net,accountedforbytheequitymethod,of$2.0million,$5.2million,$.1millionand$(1.6)million,respectively.
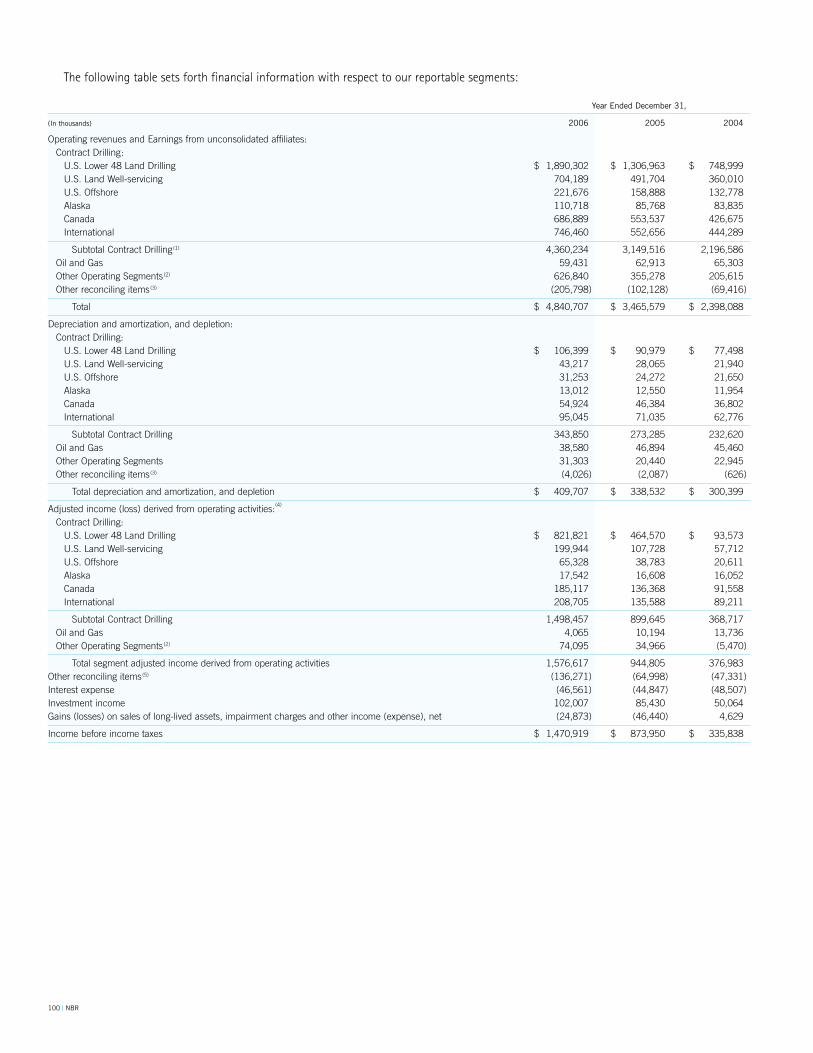
100 | NBR
The following table sets forth financial information with respect to our reportable segments:
Year Ended december 31,
(in thousands) 2006 2005 2004
OperatingrevenuesandEarningsfromunconsolidatedaffiliates: ContractDrilling: U.S.Lower48LandDrilling $ 1,890,302 $ 1,306,963 $ 748,999 U.S.LandWell-servicing 704,189 491,704 360,010 U.S.Offshore 221,676 158,888 132,778 Alaska 110,718 85,768 83,835 Canada 686,889 553,537 426,675 International 746,460 552,656 444,289
SubtotalContractDrilling(1) 4,360,234 3,149,516 2,196,586 OilandGas 59,431 62,913 65,303 OtherOperatingSegments(2) 626,840 355,278 205,615 Otherreconcilingitems(3) (205,798) (102,128) (69,416)
Total $ 4,840,707 $ 3,465,579 $ 2,398,088
Depreciationandamortization,anddepletion: ContractDrilling: U.S.Lower48LandDrilling $ 106,399 $ 90,979 $ 77,498 U.S.LandWell-servicing 43,217 28,065 21,940 U.S.Offshore 31,253 24,272 21,650 Alaska 13,012 12,550 11,954 Canada 54,924 46,384 36,802 International 95,045 71,035 62,776
SubtotalContractDrilling 343,850 273,285 232,620 OilandGas 38,580 46,894 45,460 OtherOperatingSegments 31,303 20,440 22,945 Otherreconcilingitems(3) (4,026) (2,087) (626)
Totaldepreciationandamortization,anddepletion $ 409,707 $ 338,532 $ 300,399
Adjustedincome(loss)derivedfromoperatingactivities:(4)
ContractDrilling: U.S.Lower48LandDrilling $ 821,821 $ 464,570 $ 93,573 U.S.LandWell-servicing 199,944 107,728 57,712 U.S.Offshore 65,328 38,783 20,611 Alaska 17,542 16,608 16,052 Canada 185,117 136,368 91,558 International 208,705 135,588 89,211
SubtotalContractDrilling 1,498,457 899,645 368,717 OilandGas 4,065 10,194 13,736 OtherOperatingSegments(2) 74,095 34,966 (5,470)
Totalsegmentadjustedincomederivedfromoperatingactivities 1,576,617 944,805 376,983Otherreconcilingitems(5) (136,271) (64,998) (47,331)Interestexpense (46,561) (44,847) (48,507)Investmentincome 102,007 85,430 50,064Gains(losses)onsalesoflong-livedassets,impairmentchargesandotherincome(expense),net (24,873) (46,440) 4,629
Incomebeforeincometaxes $ 1,470,919 $ 873,950 $ 335,838
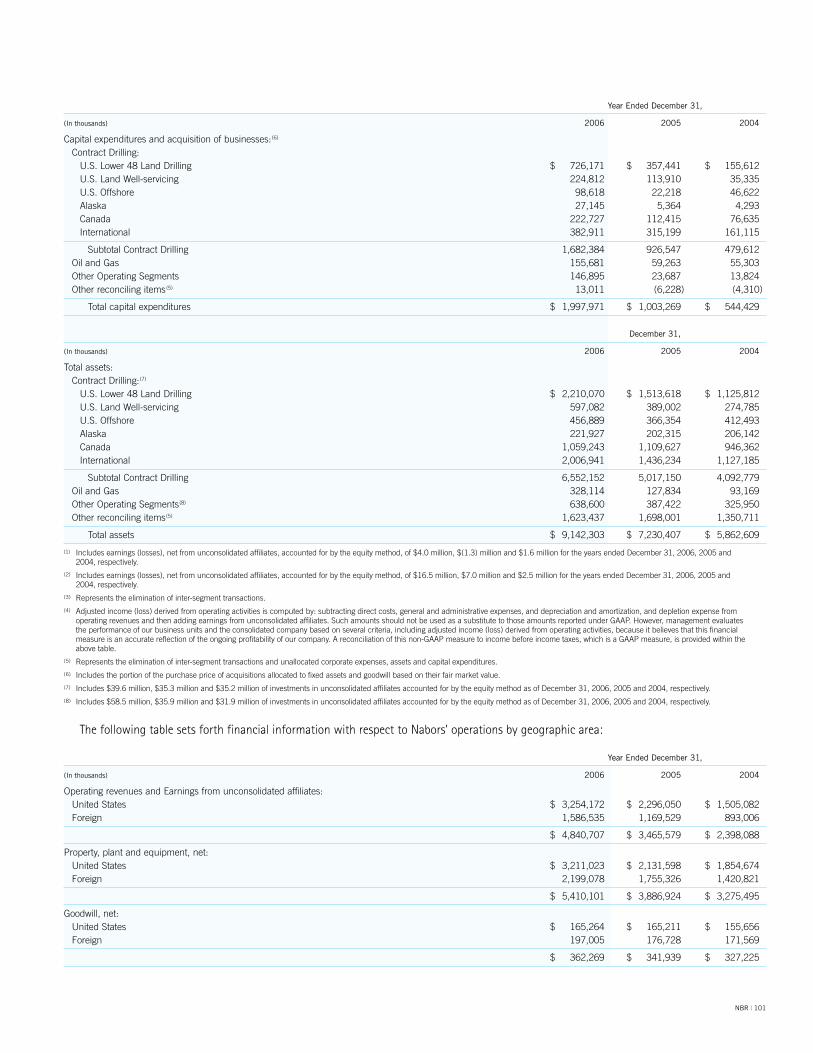
NBR | 101
Year Ended december 31,
(in thousands) 2006 2005 2004
Capitalexpendituresandacquisitionofbusinesses:(6) ContractDrilling: U.S.Lower48LandDrilling $ 726,171 $ 357,441 $ 155,612 U.S.LandWell-servicing 224,812 113,910 35,335 U.S.Offshore 98,618 22,218 46,622 Alaska 27,145 5,364 4,293 Canada 222,727 112,415 76,635 International 382,911 315,199 161,115
SubtotalContractDrilling 1,682,384 926,547 479,612 OilandGas 155,681 59,263 55,303 OtherOperatingSegments 146,895 23,687 13,824 Otherreconcilingitems(5) 13,011 (6,228) (4,310)
Totalcapitalexpenditures $ 1,997,971 $ 1,003,269 $ 544,429
december 31,
(in thousands) 2006 2005 2004
Totalassets: ContractDrilling:(7) U.S.Lower48LandDrilling $ 2,210,070 $ 1,513,618 $ 1,125,812 U.S.LandWell-servicing 597,082 389,002 274,785 U.S.Offshore 456,889 366,354 412,493 Alaska 221,927 202,315 206,142 Canada 1,059,243 1,109,627 946,362 International 2,006,941 1,436,234 1,127,185
SubtotalContractDrilling 6,552,152 5,017,150 4,092,779 OilandGas 328,114 127,834 93,169 OtherOperatingSegments(8) 638,600 387,422 325,950 Otherreconcilingitems(5) 1,623,437 1,698,001 1,350,711
Totalassets $ 9,142,303 $ 7,230,407 $ 5,862,609
(1) Includesearnings(losses),netfromunconsolidatedaffiliates,accountedforbytheequitymethod,of$4.0million,$(1.3)millionand$1.6millionfortheyearsendedDecember31,2006,2005and2004,respectively.
(2) Includesearnings(losses),netfromunconsolidatedaffiliates,accountedforbytheequitymethod,of$16.5million,$7.0millionand$2.5millionfortheyearsendedDecember31,2006,2005and2004,respectively.
(3) Representstheeliminationofinter-segmenttransactions.(4) Adjustedincome(loss)derivedfromoperatingactivitiesiscomputedby:subtractingdirectcosts,generalandadministrativeexpenses,anddepreciationandamortization,anddepletionexpensefrom
operatingrevenuesandthenaddingearningsfromunconsolidatedaffiliates.SuchamountsshouldnotbeusedasasubstitutetothoseamountsreportedunderGAAP.However,managementevaluatestheperformanceofourbusinessunitsandtheconsolidatedcompanybasedonseveralcriteria,includingadjustedincome(loss)derivedfromoperatingactivities,becauseitbelievesthatthisfinancialmeasureisanaccuratereflectionoftheongoingprofitabilityofourcompany.Areconciliationofthisnon-GAAPmeasuretoincomebeforeincometaxes,whichisaGAAPmeasure,isprovidedwithintheabovetable.
(5) Representstheeliminationofinter-segmenttransactionsandunallocatedcorporateexpenses,assetsandcapitalexpenditures.(6) Includestheportionofthepurchasepriceofacquisitionsallocatedtofixedassetsandgoodwillbasedontheirfairmarketvalue.(7) Includes$39.6million,$35.3millionand$35.2millionofinvestmentsinunconsolidatedaffiliatesaccountedforbytheequitymethodasofDecember31,2006,2005and2004,respectively.(8) Includes$58.5million,$35.9millionand$31.9millionofinvestmentsinunconsolidatedaffiliatesaccountedforbytheequitymethodasofDecember31,2006,2005and2004,respectively.
The following table sets forth financial information with respect to Nabors’ operations by geographic area:
Year Ended december 31,
(in thousands) 2006 2005 2004
OperatingrevenuesandEarningsfromunconsolidatedaffiliates: UnitedStates $ 3,254,172 $ 2,296,050 $ 1,505,082 Foreign 1,586,535 1,169,529 893,006
$ 4,840,707 $ 3,465,579 $ 2,398,088
Property,plantandequipment,net: UnitedStates $ 3,211,023 $ 2,131,598 $ 1,854,674 Foreign 2,199,078 1,755,326 1,420,821
$ 5,410,101 $ 3,886,924 $ 3,275,495
Goodwill,net: UnitedStates $ 165,264 $ 165,211 $ 155,656 Foreign 197,005 176,728 171,569
$ 362,269 $ 341,939 $ 327,225

102 | NBR
19 CondensedConsolidatingFinancialInformation
Nabors has fully and unconditionally guaranteed all of the issued public debt securities of Nabors Delaware, and Nabors and Nabors Delaware have fully and unconditionally guaranteed the $225 million 4.875% senior notes due 2009 issued by Nabors Holdings 1, ULC, our indirect subsidiary.
The following condensed consolidating financial information is included so that separate financial statements of Nabors Delaware and Nabors Holdings are not required to be filed with the SEC. The condensed consolidating financial statements present investments in both consolidated and unconsolidated affiliates using the equity method of accounting.
The following condensed consolidating financial information presents: condensed consolidating balance sheets as of Decem-ber 31, 2006 and 2005, statements of income and cash flows for each of the three years in the period ended December 31, 2006 of (a) Nabors, parent/guarantor, (b) Nabors Delaware, issuer of public debt securities guaranteed by Nabors and guarantor of the $225 mil-lion 4.875% senior notes issued by Nabors Holdings, (c) Nabors Holdings, issuer of the $225 million 4.875% senior notes, (d) the non-guarantor subsidiaries, (e) consolidating adjustments neces-sary to consolidate Nabors and its subsidiaries and (f) Nabors on a consolidated basis.
CondensedConsolidatingBalanceSheets december 31, 2006
(in thousands) Nabors Nabors Nabors other (Parent/ delaware Holdings subsidiaries Consolidating Consolidated Guarantor) (issuer/Guarantor) (issuer) (Non-Guarantors) adjustments total
assets Currentassets: Cashandcashequivalents $ 14,874 $ 2,394 $ 8 $ 683,273 $ – $ 700,549 Short-terminvestments – – – 439,467 – 439,467 Accountsreceivable,net – – – 1,109,738 – 1,109,738 Inventory – – – 100,487 – 100,487 Deferredincometaxes – – – 38,081 – 38,081 Othercurrentassets 162 1,103 376 114,893 – 116,534
Totalcurrentassets 15,036 3,497 384 2,485,939 – 2,504,856
Long-terminvestments – – – 513,269 – 513,269Property,plantandequipment,net – – – 5,410,101 – 5,410,101Goodwill,net – – – 362,269 – 362,269Intercompanyreceivables 343,644 1,151,556 – 19,944 (1,515,144) –Investmentsinaffiliates 3,184,303 3,748,626 286,818 1,318,478 (8,440,176) 98,049Otherlong-termassets – 249,040 608 220,025 (215,914) 253,759
Totalassets $ 3,542,983 $ 5,152,719 $ 287,810 $ 10,330,025 $ (10,171,234) $ 9,142,303
liabilities and shareholders’ Equity Currentliabilities: Currentportionoflong-termdebt $ – $ – $ – $ – $ – $ – Tradeaccountspayable 35 22 – 459,122 – 459,179 Accruedliabilities 6,295 8,870 4,151 275,642 – 294,958 Incometaxespayable – 81,429 1,792 17,002 – 100,223
Totalcurrentliabilities 6,330 90,321 5,943 751,766 – 854,360
Long-termdebt – 3,779,778 224,296 – – 4,004,074Otherlong-termliabilities – – – 162,744 – 162,744Deferredincometaxes – 50,696 – 749,690 (215,914) 584,472Intercompanypayable – – 3,733 1,511,411 (1,515,144) –
Totalliabilities 6,330 3,920,795 233,972 3,175,611 (1,731,058) 5,605,650
Shareholders’equity 3,536,653 1,231,924 53,838 7,154,414 (8,440,176) 3,536,653
Totalliabilitiesandshareholders’equity $ 3,542,983 $ 5,152,719 $ 287,810 $ 10,330,025 $ (10,171,234) $ 9,142,303
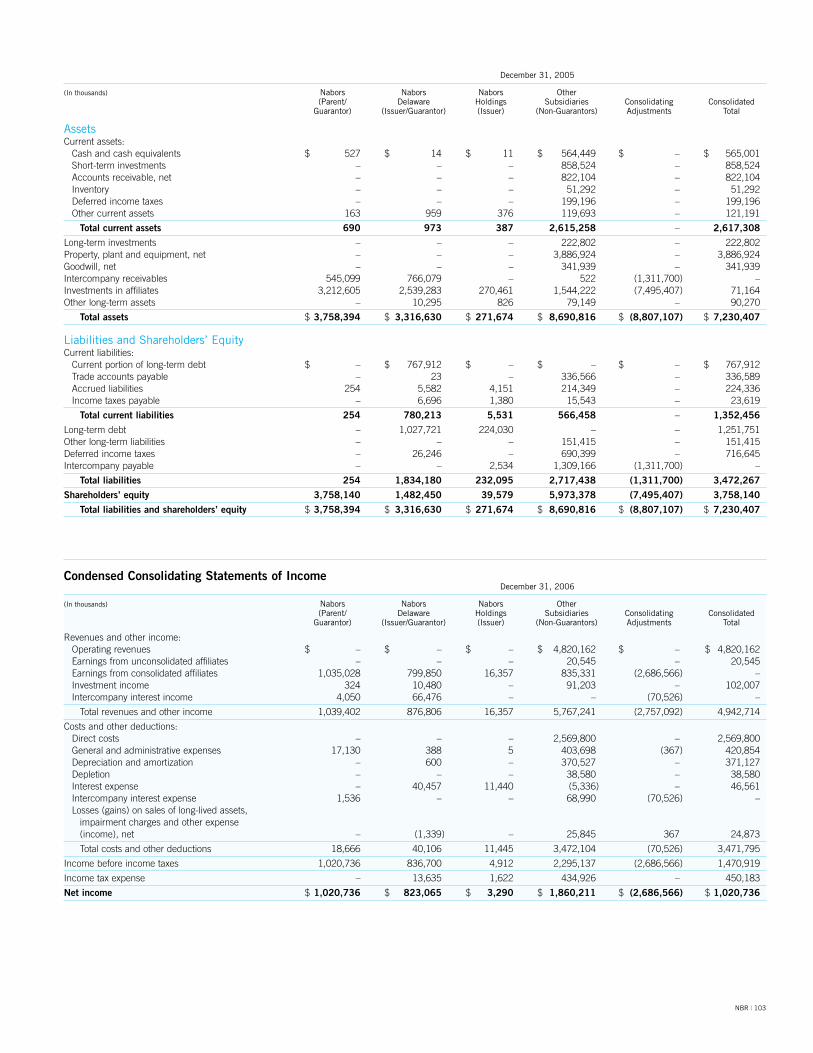
NBR | 103
december 31, 2005
(in thousands) Nabors Nabors Nabors other (Parent/ delaware Holdings subsidiaries Consolidating Consolidated Guarantor) (issuer/Guarantor) (issuer) (Non-Guarantors) adjustments total
assets Currentassets: Cashandcashequivalents $ 527 $ 14 $ 11 $ 564,449 $ – $ 565,001 Short-terminvestments – – – 858,524 – 858,524 Accountsreceivable,net – – – 822,104 – 822,104 Inventory – – – 51,292 – 51,292 Deferredincometaxes – – – 199,196 – 199,196 Othercurrentassets 163 959 376 119,693 – 121,191
Totalcurrentassets 690 973 387 2,615,258 – 2,617,308
Long-terminvestments – – – 222,802 – 222,802Property,plantandequipment,net – – – 3,886,924 – 3,886,924Goodwill,net – – – 341,939 – 341,939Intercompanyreceivables 545,099 766,079 – 522 (1,311,700) –Investmentsinaffiliates 3,212,605 2,539,283 270,461 1,544,222 (7,495,407) 71,164Otherlong-termassets – 10,295 826 79,149 – 90,270
Totalassets $3,758,394 $ 3,316,630 $ 271,674 $ 8,690,816 $ (8,807,107) $ 7,230,407
liabilities and shareholders’ Equity Currentliabilities: Currentportionoflong-termdebt $ – $ 767,912 $ – $ – $ – $ 767,912 Tradeaccountspayable – 23 – 336,566 – 336,589 Accruedliabilities 254 5,582 4,151 214,349 – 224,336 Incometaxespayable – 6,696 1,380 15,543 – 23,619
Totalcurrentliabilities 254 780,213 5,531 566,458 – 1,352,456
Long-termdebt – 1,027,721 224,030 – – 1,251,751Otherlong-termliabilities – – – 151,415 – 151,415Deferredincometaxes – 26,246 – 690,399 – 716,645Intercompanypayable – – 2,534 1,309,166 (1,311,700) –
Totalliabilities 254 1,834,180 232,095 2,717,438 (1,311,700) 3,472,267
Shareholders’equity 3,758,140 1,482,450 39,579 5,973,378 (7,495,407) 3,758,140
Totalliabilitiesandshareholders’equity $3,758,394 $ 3,316,630 $ 271,674 $ 8,690,816 $ (8,807,107) $ 7,230,407
CondensedConsolidatingStatementsofIncome december 31, 2006
(in thousands) Nabors Nabors Nabors other (Parent/ delaware Holdings subsidiaries Consolidating Consolidated Guarantor) (issuer/Guarantor) (issuer) (Non-Guarantors) adjustments total
Revenuesandotherincome: Operatingrevenues $ – $ – $ – $ 4,820,162 $ – $ 4,820,162 Earningsfromunconsolidatedaffiliates – – – 20,545 – 20,545 Earningsfromconsolidatedaffiliates 1,035,028 799,850 16,357 835,331 (2,686,566) – Investmentincome 324 10,480 – 91,203 – 102,007 Intercompanyinterestincome 4,050 66,476 – – (70,526) –
Totalrevenuesandotherincome 1,039,402 876,806 16,357 5,767,241 (2,757,092) 4,942,714
Costsandotherdeductions: Directcosts – – – 2,569,800 – 2,569,800 Generalandadministrativeexpenses 17,130 388 5 403,698 (367) 420,854 Depreciationandamortization – 600 – 370,527 – 371,127 Depletion – – – 38,580 – 38,580 Interestexpense – 40,457 11,440 (5,336) – 46,561 Intercompanyinterestexpense 1,536 – – 68,990 (70,526) – Losses(gains)onsalesoflong-livedassets, impairmentchargesandotherexpense (income),net – (1,339) – 25,845 367 24,873
Totalcostsandotherdeductions 18,666 40,106 11,445 3,472,104 (70,526) 3,471,795
Incomebeforeincometaxes 1,020,736 836,700 4,912 2,295,137 (2,686,566) 1,470,919
Incometaxexpense – 13,635 1,622 434,926 – 450,183
Netincome $1,020,736 $ 823,065 $ 3,290 $ 1,860,211 $ (2,686,566) $1,020,736
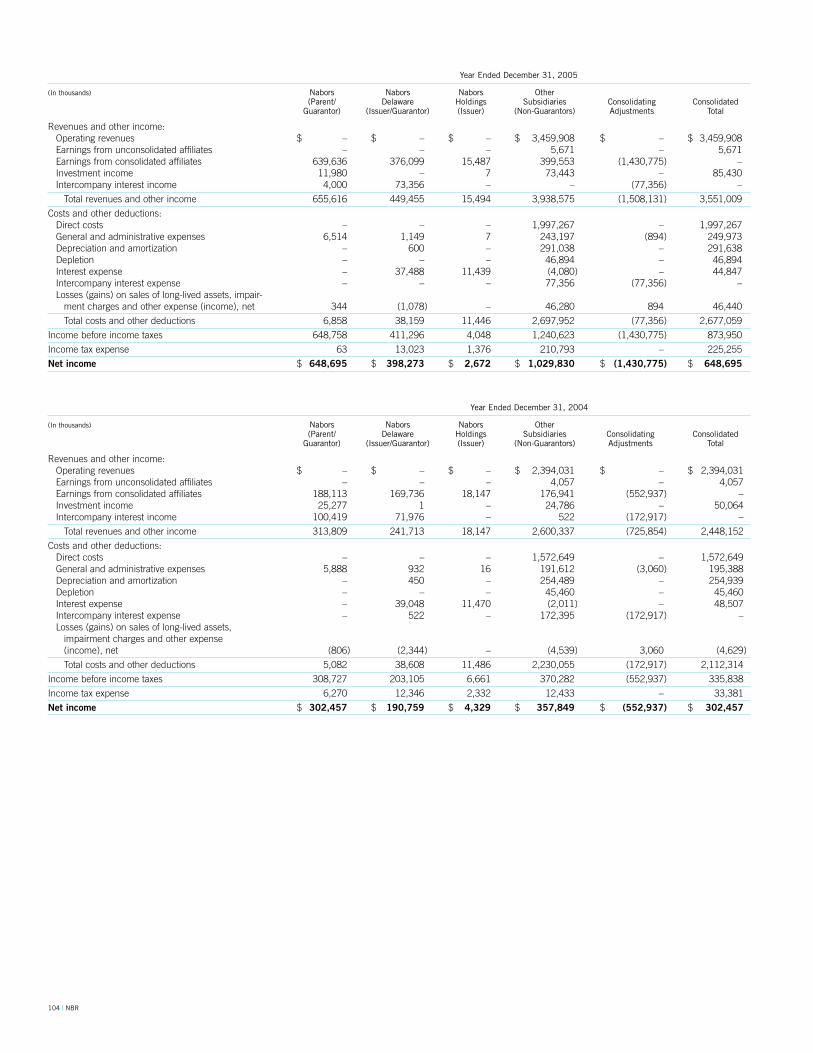
104 | NBR
Year Ended december 31, 2005
(in thousands) Nabors Nabors Nabors other (Parent/ delaware Holdings subsidiaries Consolidating Consolidated Guarantor) (issuer/Guarantor) (issuer) (Non-Guarantors) adjustments total
Revenuesandotherincome: Operatingrevenues $ – $ – $ – $ 3,459,908 $ – $ 3,459,908 Earningsfromunconsolidatedaffiliates – – – 5,671 – 5,671 Earningsfromconsolidatedaffiliates 639,636 376,099 15,487 399,553 (1,430,775) – Investmentincome 11,980 – 7 73,443 – 85,430 Intercompanyinterestincome 4,000 73,356 – – (77,356) –
Totalrevenuesandotherincome 655,616 449,455 15,494 3,938,575 (1,508,131) 3,551,009
Costsandotherdeductions: Directcosts – – – 1,997,267 – 1,997,267 Generalandadministrativeexpenses 6,514 1,149 7 243,197 (894) 249,973 Depreciationandamortization – 600 – 291,038 – 291,638 Depletion – – – 46,894 – 46,894 Interestexpense – 37,488 11,439 (4,080) – 44,847 Intercompanyinterestexpense – – – 77,356 (77,356) – Losses(gains)onsalesoflong-livedassets,impair- mentchargesandotherexpense(income),net 344 (1,078) – 46,280 894 46,440
Totalcostsandotherdeductions 6,858 38,159 11,446 2,697,952 (77,356) 2,677,059
Incomebeforeincometaxes 648,758 411,296 4,048 1,240,623 (1,430,775) 873,950
Incometaxexpense 63 13,023 1,376 210,793 – 225,255
Netincome $ 648,695 $ 398,273 $ 2,672 $ 1,029,830 $ (1,430,775) $ 648,695
Year Ended december 31, 2004
(in thousands) Nabors Nabors Nabors other (Parent/ delaware Holdings subsidiaries Consolidating Consolidated Guarantor) (issuer/Guarantor) (issuer) (Non-Guarantors) adjustments total
Revenuesandotherincome: Operatingrevenues $ – $ – $ – $ 2,394,031 $ – $ 2,394,031 Earningsfromunconsolidatedaffiliates – – – 4,057 – 4,057 Earningsfromconsolidatedaffiliates 188,113 169,736 18,147 176,941 (552,937) – Investmentincome 25,277 1 – 24,786 – 50,064 Intercompanyinterestincome 100,419 71,976 – 522 (172,917) –
Totalrevenuesandotherincome 313,809 241,713 18,147 2,600,337 (725,854) 2,448,152
Costsandotherdeductions: Directcosts – – – 1,572,649 – 1,572,649 Generalandadministrativeexpenses 5,888 932 16 191,612 (3,060) 195,388 Depreciationandamortization – 450 – 254,489 – 254,939 Depletion – – – 45,460 – 45,460 Interestexpense – 39,048 11,470 (2,011) – 48,507 Intercompanyinterestexpense – 522 – 172,395 (172,917) – Losses(gains)onsalesoflong-livedassets, impairmentchargesandotherexpense (income),net (806) (2,344) – (4,539) 3,060 (4,629)
Totalcostsandotherdeductions 5,082 38,608 11,486 2,230,055 (172,917) 2,112,314
Incomebeforeincometaxes 308,727 203,105 6,661 370,282 (552,937) 335,838
Incometaxexpense 6,270 12,346 2,332 12,433 – 33,381
Netincome $ 302,457 $ 190,759 $ 4,329 $ 357,849 $ (552,937) $ 302,457
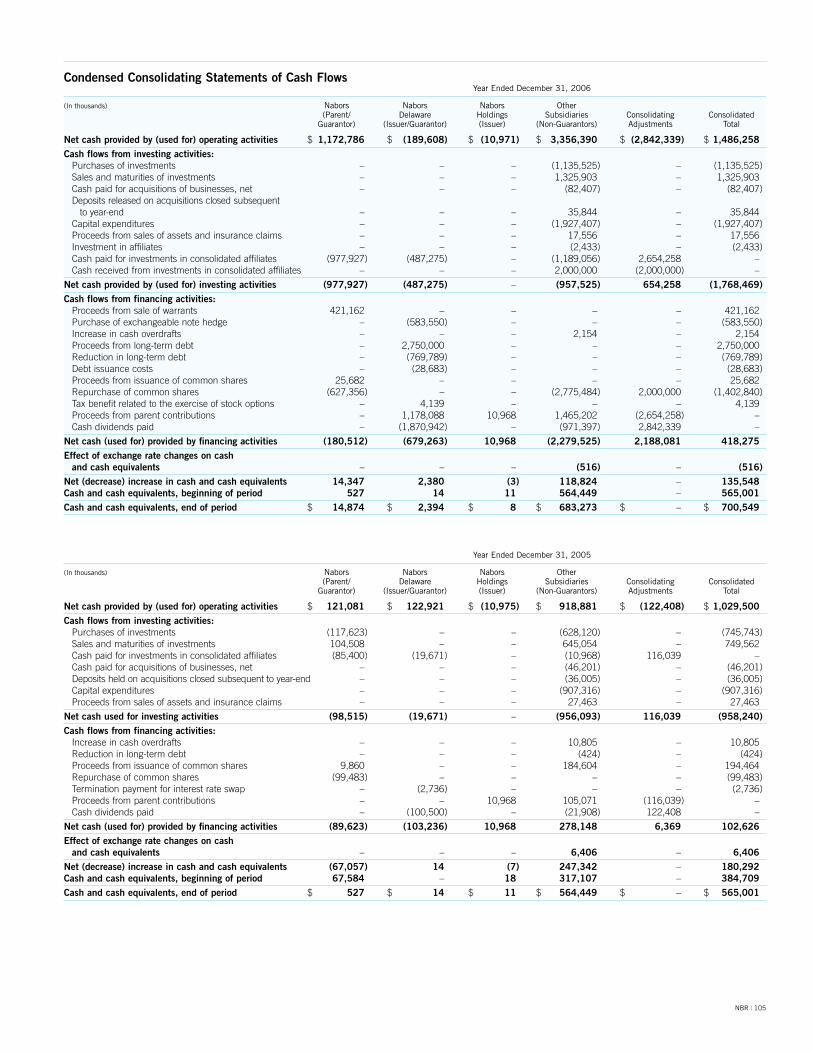
NBR | 105
CondensedConsolidatingStatementsofCashFlows Year Ended december 31, 2006
(in thousands) Nabors Nabors Nabors other (Parent/ delaware Holdings subsidiaries Consolidating Consolidated Guarantor) (issuer/Guarantor) (issuer) (Non-Guarantors) adjustments total
Netcashprovidedby(usedfor)operatingactivities $ 1,172,786 $ (189,608) $ (10,971) $ 3,356,390 $ (2,842,339) $1,486,258Cashflowsfrominvestingactivities: Purchasesofinvestments – – – (1,135,525) – (1,135,525) Salesandmaturitiesofinvestments – – – 1,325,903 – 1,325,903 Cashpaidforacquisitionsofbusinesses,net – – – (82,407) – (82,407) Depositsreleasedonacquisitionsclosedsubsequent toyear-end – – – 35,844 – 35,844 Capitalexpenditures – – – (1,927,407) – (1,927,407) Proceedsfromsalesofassetsandinsuranceclaims – – – 17,556 – 17,556 Investmentinaffiliates – – – (2,433) – (2,433) Cashpaidforinvestmentsinconsolidatedaffiliates (977,927) (487,275) – (1,189,056) 2,654,258 – Cashreceivedfrominvestmentsinconsolidatedaffiliates – – – 2,000,000 (2,000,000) –
Netcashprovidedby(usedfor)investingactivities (977,927) (487,275) – (957,525) 654,258 (1,768,469)Cashflowsfromfinancingactivities: Proceedsfromsaleofwarrants 421,162 – – – – 421,162 Purchaseofexchangeablenotehedge – (583,550) – – – (583,550) Increaseincashoverdrafts – – – 2,154 – 2,154 Proceedsfromlong-termdebt – 2,750,000 – – – 2,750,000 Reductioninlong-termdebt – (769,789) – – – (769,789) Debtissuancecosts – (28,683) – – – (28,683) Proceedsfromissuanceofcommonshares 25,682 – – – – 25,682 Repurchaseofcommonshares (627,356) – – (2,775,484) 2,000,000 (1,402,840) Taxbenefitrelatedtotheexerciseofstockoptions – 4,139 – – – 4,139 Proceedsfromparentcontributions – 1,178,088 10,968 1,465,202 (2,654,258) – Cashdividendspaid – (1,870,942) – (971,397) 2,842,339 –
Netcash(usedfor)providedbyfinancingactivities (180,512) (679,263) 10,968 (2,279,525) 2,188,081 418,275Effectofexchangeratechangesoncash andcashequivalents – – – (516) – (516)Net(decrease)increaseincashandcashequivalents 14,347 2,380 (3) 118,824 – 135,548Cashandcashequivalents,beginningofperiod 527 14 11 564,449 – 565,001Cashandcashequivalents,endofperiod $ 14,874 $ 2,394 $ 8 $ 683,273 $ – $ 700,549
Year Ended december 31, 2005
(in thousands) Nabors Nabors Nabors other (Parent/ delaware Holdings subsidiaries Consolidating Consolidated Guarantor) (issuer/Guarantor) (issuer) (Non-Guarantors) adjustments total
Netcashprovidedby(usedfor)operatingactivities $ 121,081 $ 122,921 $ (10,975) $ 918,881 $ (122,408) $1,029,500Cashflowsfrominvestingactivities: Purchasesofinvestments (117,623) – – (628,120) – (745,743) Salesandmaturitiesofinvestments 104,508 – – 645,054 – 749,562 Cashpaidforinvestmentsinconsolidatedaffiliates (85,400) (19,671) – (10,968) 116,039 – Cashpaidforacquisitionsofbusinesses,net – – – (46,201) – (46,201) Depositsheldonacquisitionsclosedsubsequenttoyear-end – – – (36,005) – (36,005) Capitalexpenditures – – – (907,316) – (907,316) Proceedsfromsalesofassetsandinsuranceclaims – – – 27,463 – 27,463
Netcashusedforinvestingactivities (98,515) (19,671) – (956,093) 116,039 (958,240)Cashflowsfromfinancingactivities: Increaseincashoverdrafts – – – 10,805 – 10,805 Reductioninlong-termdebt – – – (424) – (424) Proceedsfromissuanceofcommonshares 9,860 – – 184,604 – 194,464 Repurchaseofcommonshares (99,483) – – – – (99,483) Terminationpaymentforinterestrateswap – (2,736) – – – (2,736) Proceedsfromparentcontributions – – 10,968 105,071 (116,039) – Cashdividendspaid – (100,500) – (21,908) 122,408 –
Netcash(usedfor)providedbyfinancingactivities (89,623) (103,236) 10,968 278,148 6,369 102,626Effectofexchangeratechangesoncash andcashequivalents – – – 6,406 – 6,406Net(decrease)increaseincashandcashequivalents (67,057) 14 (7) 247,342 – 180,292Cashandcashequivalents,beginningofperiod 67,584 – 18 317,107 – 384,709Cashandcashequivalents,endofperiod $ 527 $ 14 $ 11 $ 564,449 $ – $ 565,001
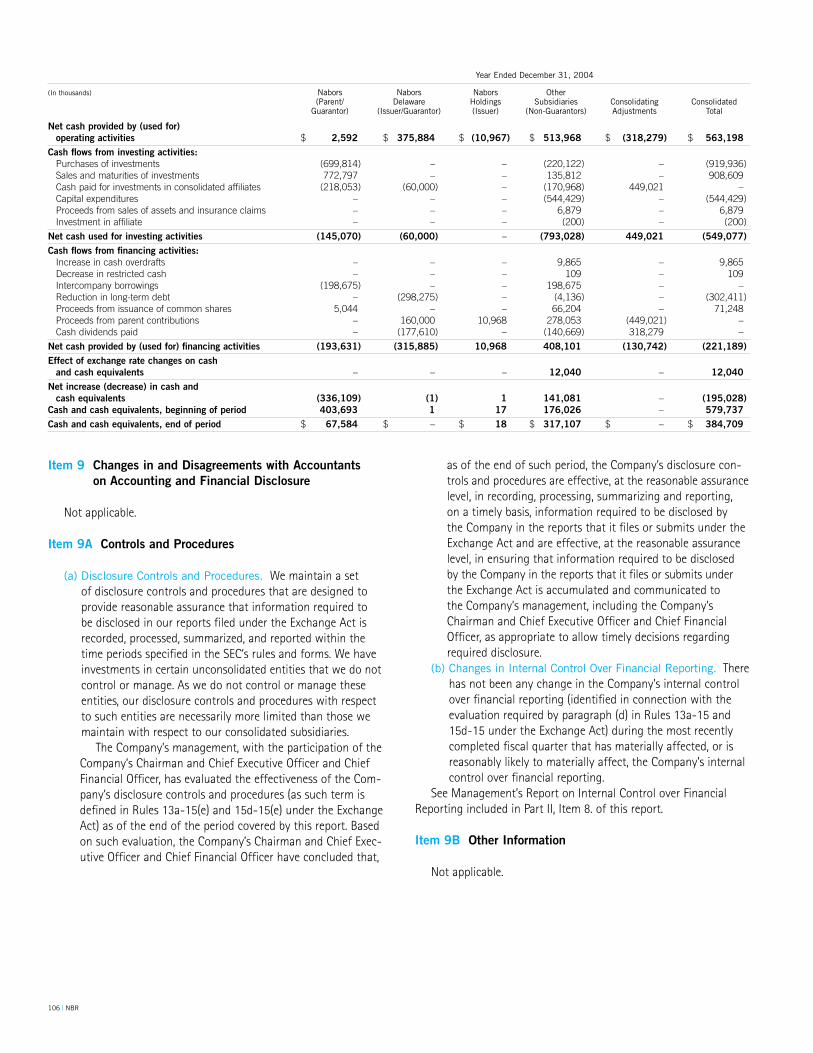
106 | NBR
Year Ended december 31, 2004
(in thousands) Nabors Nabors Nabors other (Parent/ delaware Holdings subsidiaries Consolidating Consolidated Guarantor) (issuer/Guarantor) (issuer) (Non-Guarantors) adjustments total
Netcashprovidedby(usedfor) operatingactivities $ 2,592 $ 375,884 $ (10,967) $ 513,968 $ (318,279) $ 563,198Cashflowsfrominvestingactivities: Purchasesofinvestments (699,814) – – (220,122) – (919,936) Salesandmaturitiesofinvestments 772,797 – – 135,812 – 908,609 Cashpaidforinvestmentsinconsolidatedaffiliates (218,053) (60,000) – (170,968) 449,021 – Capitalexpenditures – – – (544,429) – (544,429) Proceedsfromsalesofassetsandinsuranceclaims – – – 6,879 – 6,879 Investmentinaffiliate – – – (200) – (200)
Netcashusedforinvestingactivities (145,070) (60,000) – (793,028) 449,021 (549,077)Cashflowsfromfinancingactivities: Increaseincashoverdrafts – – – 9,865 – 9,865 Decreaseinrestrictedcash – – – 109 – 109 Intercompanyborrowings (198,675) – – 198,675 – – Reductioninlong-termdebt – (298,275) – (4,136) – (302,411) Proceedsfromissuanceofcommonshares 5,044 – – 66,204 – 71,248 Proceedsfromparentcontributions – 160,000 10,968 278,053 (449,021) – Cashdividendspaid – (177,610) – (140,669) 318,279 –
Netcashprovidedby(usedfor)financingactivities (193,631) (315,885) 10,968 408,101 (130,742) (221,189)Effectofexchangeratechangesoncash andcashequivalents – – – 12,040 – 12,040Netincrease(decrease)incashand cashequivalents (336,109) (1) 1 141,081 – (195,028)Cashandcashequivalents,beginningofperiod 403,693 1 17 176,026 – 579,737Cashandcashequivalents,endofperiod $ 67,584 $ – $ 18 $ 317,107 $ – $ 384,709
Item9ChangesinandDisagreementswithAccountantsonAccountingandFinancialDisclosure
Not applicable.
Item9AControlsandProcedures
(a) disclosure Controls and Procedures. We maintain a set of disclosure controls and procedures that are designed to provide reasonable assurance that information required to be disclosed in our reports filed under the Exchange Act is recorded, processed, summarized, and reported within the time periods specified in the SEC’s rules and forms. We have investments in certain unconsolidated entities that we do not control or manage. As we do not control or manage these entities, our disclosure controls and procedures with respect to such entities are necessarily more limited than those we maintain with respect to our consolidated subsidiaries.
The Company’s management, with the participation of the Company’s Chairman and Chief Executive Officer and Chief Financial Officer, has evaluated the effectiveness of the Com-pany’s disclosure controls and procedures (as such term is defined in Rules 13a-15(e) and 15d-15(e) under the Exchange Act) as of the end of the period covered by this report. Based on such evaluation, the Company’s Chairman and Chief Exec-utive Officer and Chief Financial Officer have concluded that,
as of the end of such period, the Company’s disclosure con-trols and procedures are effective, at the reasonable assurance level, in recording, processing, summarizing and reporting, on a timely basis, information required to be disclosed by the Company in the reports that it files or submits under the Exchange Act and are effective, at the reasonable assurance level, in ensuring that information required to be disclosed by the Company in the reports that it files or submits under the Exchange Act is accumulated and communicated to the Company’s management, including the Company’s Chairman and Chief Executive Officer and Chief Financial Officer, as appropriate to allow timely decisions regarding required disclosure.
(b) Changes in internal Control over financial Reporting. There has not been any change in the Company’s internal control over financial reporting (identified in connection with the evaluation required by paragraph (d) in Rules 13a-15 and 15d-15 under the Exchange Act) during the most recently completed fiscal quarter that has materially affected, or is reasonably likely to materially affect, the Company’s internal control over financial reporting.
See Management’s Report on Internal Control over Financial Reporting included in Part II, Item 8. of this report.
Item9BOtherInformation
Not applicable.