
PART I - Value Line
83
PART I The Value Line Mutual Fund Survey
Transcript of PART I - Value Line
PART I
The Value LineMutual Fund Survey
RATINGS & REPORTS
THE VALUE LINEMUTUAL FUND SURVEY
Value Line’s flagship publication, The Value Line Investment Survey, wascreated almost 70 years ago to help investors in their quest to achieve superiorreturns from investments in common stocks. Backed by disciplined, objectiveanalytical methodologies that have proven themselves since 1931, as well asinput from a staff of more than 100 professional securities analysts, statisti-cians, economists, and others, Value Line helps close to 500,000 readers makebetter investment decisions.
The Value Line Mutual Fund Survey brings to the analysis of mutual funds thesame principles and commitment to high-quality research. After all, mutualfunds are simply another means by which investors seek to meet their financialgoals. Moreover, since a mutual fund consists of a collection of individualsecurities, the exhaustive research Value Line conducts on some 1,700 compa-nies enables our research analysts to gain unique insight into what determinesthe performance of a mutual fund.
The Value Line Mutual Fund Survey has one overriding goal: to provide thesubscriber with as much timely, relevant information as possible in an easy-to-read format. The information we present is divided into two parts: the “Ratings& Reports” section, which presents full-page profiles on nearly 700 equitymutual funds, condensed coverage on an additional 730 equity funds and, inEdition 8, abbreviated coverage of over 500 bond mutual funds; and the“Performance & Index” section, which offers advice, commentary, and in-sights on important investment trends affecting mutual funds, as well asupdated performance statistics on 2,000 funds. Complete descriptions of thesesections follow.
“Ratings & Reports” consists of eight separate Editions, seven of which containThe full-page profiles on roughly 100 mutual funds and condensed coverageof another 112, and the eighth, abbreviated coverage on over 500 bond funds.The fund profiles are arranged by investment objective to facilitate the user’scomparison of one fund with others having similar objectives and policies. Oneof the eight Editions is updated and mailed to subscribers every three weeksand performance statistics also are provided every three weeks in the “Perfor-mance & Index” section.
Subscribers also receive two Supplemental Editions, each provided annually.The first presents analyses of 100 of the largest mutual fund families. The fund-family analyses offer a convenient framework for investors to evaluate fundsin another context: the organization behind the fund. Different families canhave different areas of focus or expertise, varying levels of in-house researchsupport, and a specific management culture. These factors are relevant butlargely unrecognized in evaluating mutual funds. The fund-family analysesalso show investors the various types of funds each family offers, funds thefamily has introduced in the past year and a half, and historical informationabout the family’s top-performing funds broken out into six broad investmentcategories. This information is especially useful for investors who want tobuild a well-rounded portfolio within one organization. In addition, the familyanalyses present the average ranks of the family’s funds across six broadcategories.
The theme of the second special supplemental issue changes with each cycle.Each Edition, however, serves as a forum for our analysts to highlight indi-

USER'S GUIDE 3
vidual funds, discuss and/or explain current events in the financial industry,or to provide more indepth thoughts and analysis of themes facing investors.We believe this is yet another opportunity to educate our subscribers in orderto help them make more-informed decisions.
For the convenience of subscribers, Value Line provides a large, three-postbinder for the eight individual Editions and special supplements with specificfiling instructions.
The illustration below indicates how the “Ratings & Reports” sections arearranged:
EQUITY FUNDS
Editions 1 through 7
General Equity Specialty EquityAggressive Growth Energy/Natural ResourcesGrowth Financial ServicesGrowth/Income HealthIncome OtherSmall Company Precious Metals
Real EstateInternational Equity TechnologyEurope Equity UtilitiesForeign EquityGlobal Equity Partial EquityPacific Equity Asset Allocation
BalancedConvertibleFlexible
FIXED INCOME FUNDS
Edition 8
Taxable Fixed Income Tax-Free Fixed IncomeCorporate—High Yield Municipal—CaliforniaCorporate—High Quality Municipal—NationalDiversified Bond Municipal—New YorkGovernment Municipal—Single StateGovernment—MortgageInternational Bond
SUPPLEMENTAL REPORTS
Fund Families Supplement
Special Supplement
Funds are categorizedin The Value Line MutualFund Survey by their statedinvestment objectivesand policies.
March 14, 2000 THE VALUE LINE MUTUAL FUND SURVEY Page 7
Total ReturnValue Line Rankings Through 1/31/00
Annualized Owner-Inv. NAV 5 Yr. Growth Trailing ship
Page Fund Name Obj./Peer 03/01/00 Overall Risk Persistence YTD 3 Mos 6 Mos 12 Mos 3 Yrs 5 Yrs 10 Yrs Yield Costs
Total ReturnValue Line Rankings Through 1/31/00
Annualized Owner-Inv. NAV 5 Yr. Growth Trailing ship
Page Fund Name Obj./Peer 03/01/00 Overall Risk Persistence YTD 3 Mos 6 Mos 12 Mos 3 Yrs 5 Yrs 10 Yrs Yield Costs
1411 59 Wall St European Equity Fund EU 41.41 3 3 3 -5.6 11.4 13.1 14.4 18.5 18.3 — 0.0 $1751 59 Wall St Pacific Basin Equity Fd PB 48.45 3 4 � 3 -1.9 25.7 34.9 108.9 26.0 20.0 — 4.5 $$
I AAL Bond Fund A CG/IT 9.38 4 3 3 -0.3 -0.6 0.5 -2.5 4.2 5.8 6.6 5.8 $$ 161 AAL Capital Growth Fund A GR/LB 36.68 2 3 1 -5.1 2.1 5.3 10.9 23.2 25.4 17.2 0.2 $$
I AAL Equity Income Fund A GI/LB 13.86 4 2 3 -3.1 -1.3 -3.8 0.4 11.3 12.6 — 1.1 $$ I AAL Municipal Bond Fund A MB/LT 10.35 4 4 2 -0.8 -0.8 -4.7 -7.6 2.9 5.6 6.2 4.9 $$
1851 AARP Balanced Stock & Bond Fund BA 18.73 3 1 3 -1.9 -0.8 -3.1 1.6 8.5 12.8 — 3.3 $ 162 AARP Capital Growth Fund GR/LG 69.68 1 3 1 -4.7 9.7 18.1 23.8 26.1 27.4 17.1 0.0 $
P3 AARP Global Growth Fund GL 21.23 3 2 - -5.2 9.3 7.3 15.6 14.6 — — 0.2 $$ I AARP GNMA & US Treasury Fund GM 14.31 3 2 3 -0.7 -1.2 0.8 -0.7 4.6 6.0 6.6 6.5 $
606 AARP Growth & Income Fund GI/LB 47.56 3 2 3 -2.2 0.1 -3.4 7.0 12.0 18.2 14.8 2.0 $ I AARP High Quality Short Term Bond CG/ST 15.61 2 2 3 0.1 1.0 1.9 1.8 5.1 6.6 7.1 5.7 $ I AARP Insured Tax Free General Bond MB/IS 17.36 3 3 3 -0.6 0.0 -1.4 -4.0 3.7 5.5 6.5 4.9 $
1501 AARP International Stock Fund FO 23.75 - - - -7.8 13.9 24.6 29.1 — — — 0.5 $$1752 ABN AMRO Asian Tigers Fund Comn ShsPB/NJ 10.69 4 5 4 -3.0 19.8 16.8 61.4 -4.2 4.5 — 0.0 $$1852 ABN AMRO Balanced Fund Comn Shs BA 11.30 3 2 3 -3.3 0.5 1.8 4.8 11.6 14.5 — 1.8 $
I ABN AMRO Fixed Income Comn Shs CG 9.53 3 3 3 -0.5 -1.2 -0.1 -3.0 4.3 6.4 — 6.0 $ 163 ABN AMRO Growth Fund Comn Shs GR/LB 17.48 3 3 2 -5.8 2.6 6.0 4.5 17.4 22.2 — 0.0 $
1434 ABN AMRO Intl Equity Comn Shs FO 24.51 3 3 � 3 -8.3 14.0 21.6 27.3 20.0 17.5 — 0.0 $$ I ABN AMRO Intl Fixed Income Comn Shs IB/GL 9.28 5 5 5 -3.8 -5.7 -4.8 -12.2 -0.4 3.0 — 0.7 $$
1435 ABN AMRO Latin American Comn Shs FO/LA 15.03 4 5 - -6.5 35.3 38.3 98.1 8.3 — — 0.1 $$ 164 ABN AMRO Value Fund Comn Shs GR/LV 11.43 3 3 3 -5.5 -1.1 -4.8 1.7 11.1 17.3 — 1.0 $ 165 Accessor Growth Fund Adv GR/LG 33.70 � 2 3 1 -6.8 5.1 10.7 9.3 28.9 29.2 — 0.0 $
1436 Accessor International Equity Adv FO 21.34 � 3 3 3 -8.4 15.1 20.4 32.4 20.7 18.0 — 0.0 $$ I Accessor Mortgage Securities Adv GM 11.93 1 2 � 1 -0.7 -1.1 1.1 -0.1 5.2 6.9 — 6.1 $
969 Accessor Small to Midcap Fund Adv SC/SB 30.67 � 2 3 1 -4.5 9.3 14.2 23.9 23.2 26.0 — 0.0 $$ 828 Accessor Value Fund IN/LV 18.53 3 3 2 -4.8 -3.8 -6.4 0.8 13.1 19.8 — 0.8 $ 970 Acorn Fund SC/SB 19.58 2 3 � 2 -2.4 15.5 14.9 30.2 18.5 21.1 17.6 0.4 $
1437 Acorn International Fund FO 41.67 2 3 3 -0.4 35.3 47.6 74.5 26.3 23.2 — 0.6 $ 166 Addison Capital Shares GR/VL 23.59 5 � 2 3 -5.2 -5.8 -8.6 -8.7 3.9 14.9 11.6 0.4 $$ I Advantus Bond Fund A CG 9.46 3 3 3 -0.2 -0.9 0.0 -3.5 4.0 6.4 7.2 5.5 $$$
167 Advantus Cornerstone Fund A GR/VL 14.46 4 2 3 -1.7 -2.1 -4.6 -0.1 4.7 15.4 — 0.8 $$$ 501 Advantus Horizon Fund A GR/LG 32.48 2 3 2 -5.1 9.2 14.5 14.5 24.5 24.5 17.7 0.0 $$$ I Advantus Mortgage Secs Income A GM 10.09 1 2 1 -0.1 -0.5 1.0 0.7 5.8 7.4 7.5 6.5 $$
1811 Advantus Spectrum Fund A AA 19.88 3 2 3 -3.3 6.1 9.4 8.9 16.2 16.9 12.9 1.6 $$$1812 Aetna Ascent Fund I AA 12.96 3 2 3 -2.9 6.4 5.0 10.5 11.0 16.3 — 1.7 $$1901 Aetna Balanced Fund I BA 13.81 3 1 3 -3.0 3.2 4.9 6.4 14.1 17.2 — 2.3 $
I Aetna Bond Fund I CG 9.80 3 3 3 -0.5 -1.0 0.3 -2.2 4.8 6.6 — 5.7 $1813 Aetna Crossroads Fund I AA 12.26 3 1 � 4 -2.7 4.0 3.2 6.6 8.8 13.5 — 2.4 $$ 607 Aetna Growth & Income I GI/LB 14.54 3 3 � 2 -4.8 3.5 4.4 7.4 17.1 23.1 — 0.5 $ 168 Aetna Growth Fund I GR/GW 23.97 2 3 1 -4.5 12.2 14.6 21.6 26.7 29.0 — 0.0 $
1438 Aetna International Fund I FO 18.23 2 3 � 2 -3.6 24.4 28.0 43.4 24.7 22.6 — 0.0 $$ P6 Aetna Legacy Fund I AA 10.75 3 1 5 -2.1 2.4 2.3 4.5 7.6 11.3 — 2.8 $$ 971 Aetna Small Company Fund A SC/SV 19.18 3 3 3 2.6 24.1 24.2 33.5 20.6 24.1 — 0.1 $$$
1853 AHA Balanced Portfolio BA 12.99 3 2 3 -3.4 4.4 4.4 9.7 14.1 17.8 13.2 2.4 $
59-AI
INDEX TO MUTUAL FUNDS 1 2 3 4 5 6 7 8
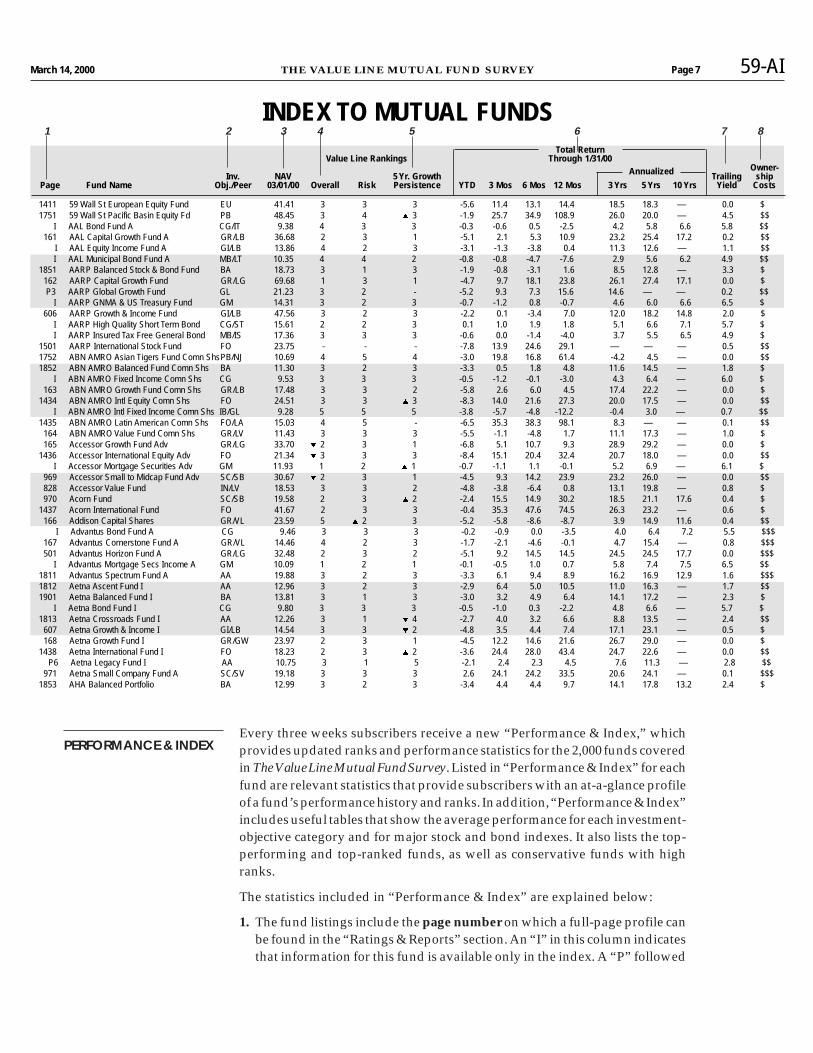
Every three weeks subscribers receive a new “Performance & Index,” whichprovides updated ranks and performance statistics for the 2,000 funds coveredin The Value Line Mutual Fund Survey. Listed in “Performance & Index” for eachfund are relevant statistics that provide subscribers with an at-a-glance profileof a fund’s performance history and ranks. In addition, “Performance & Index”includes useful tables that show the average performance for each investment-objective category and for major stock and bond indexes. It also lists the top-performing and top-ranked funds, as well as conservative funds with highranks.
The statistics included in “Performance & Index” are explained below:
1. The fund listings include the page number on which a full-page profile canbe found in the “Ratings & Reports” section. An “I” in this column indicatesthat information for this fund is available only in the index. A “P” followed
PERFORMANCE & INDEX

USER'S GUIDE 5
by a number means that coverage of the fund is pending and will beavailable in the edition listed.
2. Value Line groups each fund into one of 31 different Investment Objectivecategories based on its investment practices and stated goals. A two-lettercode denotes each fund’s objective. These codes are explained on page 6 ofeach “Performance & Index,” and the objective groups are described inmore detail in pages 7 through 10 of this manual.
3. The fund’s NAV, or net asset value (price) per share, is listed as of the dateindicated at the top of the column.
4. The fund’s Overall and Risk ranks are listed. A detailed explanation of theValue Line Ranking System can be found on pages 11-12 of this manual. Achange in either the Overall or the Risk rank is indicated with an up or downarrow ( ▲ or ▼ ) next to the new ranking. These arrows enable subscribersto spot quickly those funds that are rising or falling in rank.
5. Five-Year Growth Persistence is a measurement of how consistently thefund outperformed its investment-objective group over the last five years.Growth Persistence rewards a fund for its consistency of positive relativeperformance, but not for the degree to which it outperformed, and is one ofthe measures used to calculate the Overall rank. A more detailed explana-tion of Growth Persistence can be found on page 22 of this manual.
6. The fund’s Performance History is listed for the trailing year-to-date, three-month, six-month, one-, three-, five-, and 10-year periods, as of the dateindicated at the top of these columns. For periods of up to one year, figuresare expressed as the total return for that period; for periods of over one year,figures are expressed as average annualized rates of return. A dash indi-cates that the fund does not have sufficient performance history for that timeperiod.
7. Yield is the total of the fund’s income received from investments that is paidout to its shareholders, expressed as a percentage of a share. Value Linecalculates yield by dividing the total dividends paid per share during thetrailing 12 months by the fund’s public offering price (NAV).
8. Ownership Cost measures the maximum costs an investor would incur inowning a fund for three years, including fund management fees and otherexpenses, 12b-1 fees, and applicable sales charges. These are combined toproduce a raw number, and the funds are then ranked and divided intothree groups. The least-expensive third are indicated with a $, the middle-third with $$, and the most-expensive third with $$$. By combining all costsassociated with owning fund shares, the Ownership Cost measure providesa useful screening tool for investors to quickly assess a variety of fees andexpenses across a range of investment candidates.
The “Performance & Index” section complements the “Ratings & Reports”section. Both offer a wealth of information on the funds covered in The ValueLine Mutual Fund Survey. The summary, tabular presentation in the “Perfor-mance & Index” section, however, enables investors to compare informationon a large number of funds at once, making it easy to spot suitable candidates.It is then a simple matter of turning to the full-page profile for more extensiveand detailed information on a specific fund.
The importance of differentcomponents of OwnershipCost varies depending on thelength of time money is investedin a mutual fund. For example,sales loads are relatively largeone-time charges and are thusan important consideration forshorter-term investments.Expense ratios (including 12b-1fees) represent annual chargesand are thus a more importantconsideration for longer-terminvesting.

160
80
20
10
40
81.50
1.00.90
Rising Line − Stronger Than Objective
Declining Line − Weaker Than Objective
Total ReturnPerformance of $10K InvestmentInitial Investment 12/31/87: $10,000.Value at 4/30/02: $50,624.FundS&P500▼Manager Change▲Major Policy ChangeBottom Graph is Relative Strength ofFund Versus Objective.Recession occurred 6/30/1990—3/31/1991.
SCUDDER CAPITAL GROWTH FUND AARP ACGFX Growth LG 0.0% 41.34 1250.8
3(Average)
3(Average Risk)
6.0%
Fund Obj. S&P 500Bear 8/00 - 9/01 -42.4% -35.4% -30.7%Bull 9/98 - 8/00 +83.9% +69.3% +52.7%Bear 6/98 - 9/98 -15.4% -13.8% -9.9%
Address: Two International Place, Boston, MA 02110Advisor: Zurich Scudder InvestmentsSub-Advisor: NoneWeb Site: www.scudder.com
# Shareholders: 120,927Fiscal Year-End: SeptemberMin. Initial Invest: $1,000Min. Subsequent Invest: $50Min. IRA Invest: $500Telephone Exchanges: YesTel. Redemption: Yes
Telephone: 800 728-3337Began Operations: 11/30/84# Funds in Family: 36Syst. Withdrawal: YesAuto. Investing: YesLast Capital Gain: 12/20/01Dividends Paid: Annually
Port. Rel.As of 3/31/02 % S&P500Consumer Durables ▼ 1.2 0.21Energy ▲ 6.6 0.97Finance ▲17.4 0.91Industrial Cyclical ▲ 4.6 0.62Non-Durable ▼ 7.8 0.75Retail Trade ▲ 8.3 1.00Health ▼19.3 1.46Services ▼ 2.0 0.98Technology ▲29.1 1.23Utilities ▲ 0.6 0.17
As of 5/31/02
Stock 97Preferreds -Cash 3Convts. -Bonds -Other -%Foreign -%Hedged -
# Stocks 58
As of 3/31/02 Port. Avg. % Stock Rel. S&P 500 Rel. Obj.
Price/Earnings 32.12 81 1.18 1.15Price/Book 6.24 96 1.19 1.275-Yr.Earn.Growth % 18.12 84 1.15 1.05Avg.Mkt.Cap.($Mil.) 114,126 100 1.13 1.97
Top 20 Equity Holdings VL Shares Value %NetAs of 3/31/02 Rank* Held ($000) Assets
MICROSOFT CORPORATION 3 1279700 77179 4.34PFIZER INCORPORATED 3 1764025 70102 3.94INTEL CORPORATION 3 2242580 68197 3.84GENERAL ELECTRIC COMPANY 3 1733800 64931 3.65WAL MART STORES INCORPORATED 3 1041900 63858 3.59INTL BUSINESS MACHINES 4 551400 57346 3.23JOHNSON & JOHNSON 3 861300 55941 3.15AMERICAN INTL GROUP INC 3 740030 53386 3.00CITIGROUP INCORPORATED 3 986766 48865 2.75TENET HEALTHCARE CORP 3 700300 46934 2.64APPLIED MATERIALS INC 3 1721400 46710 2.63TARGET CORPORATION 2 969200 41792 2.35HOME DEPOT INCORPORATED 2 845600 41105 2.31ABBOTT LABORATORIES 3 751100 39508 2.22SCHLUMBERGER LIMITED - 645700 37980 2.14COLGATE PALMOLIVE COMPANY 3 648000 37033 2.08OMNICOM GROUP INCORPORATED 3 366700 34616 1.95PEPSICO INCORPORATED 3 657100 33841 1.90CISCO SYSTEMS INCORPORATED 3 1984800 33603 1.89TEXAS INSTRUMENTS INC 3 998700 33057 1.86*Latest available Timeliness ™ rank from Value Line Investment Survey.
William F. Gadsden 12/94 0.1
■4
TAX STATUS 3/31/02
Unrealized Apprec. % 7
Year 1st Q 2nd Q 3rd Q 4th Q
1998 13.5 2.5 -15.4 25.81999 4.3 6.9 -2.4 24.52000 3.0 0.1 -1.9 -11.42001 -17.8 6.0 -20.6 14.92002 -1.2 -- -- --
1988 1989 1990 1991 1992 1993 1994 1995 1996 1997 1998 1999 2000 2001 4/02 HISTORICAL ARRAY24.72 30.83 23.57 31.94 32.09 34.24 30.15 38.46 42.07 52.11 57.63 72.55 57.37 45.64 41.34 Bid Price (NAV)
0.09 0.19 0.59 0.23 0.14 0.05 0.01 0.39 0.41 0.31 0.24 0.04 0.00 0.00 0.00 Dividends ($)0.35 0.57 2.32 0.69 0.42 0.13 0.03 1.00 0.89 0.54 0.37 0.04 0.00 0.00 0.00 12-Mo. Div. Yield (%)0.42 1.93 1.79 0.94 1.21 2.90 0.64 0.51 3.99 4.31 6.55 5.40 7.71 0.02 0.00 Cap. Gains ($)1.23 1.16 1.11 1.17 1.13 1.05 .97 .95 .90 .92 .87 .91 .90 .88 .86 Expense Ratio (%)0.88 0.84 0.81 0.86 0.85 0.85 0.79 0.79 0.62 0.65 0.60 0.65 0.66 0.57 0.59 Exp.Ratio Rel. to Obj.
45 64 83 100 89 101 80 98 69 39 53 68 66 35 14 Turnover (%)91.1 180.3 160.1 242.2 424.4 682.5 631.6 709.2 877.2 1217.9 1550.2 1735.0 2115.4 1430.4 1250.8 Net Assets ($Mil.)27.3 33.5 -15.8 40.5 4.7 16.0 -10.0 30.5 20.6 35.1 23.7 35.4 -10.3 -20.4 -9.4 Total Return (%)10.5 2.0 -12.6 10.0 -3.1 5.9 -11.4 -7.0 -2.7 1.7 -4.8 14.4 -1.2 -8.3 -3.6 +/- S&P 500 (%)12.7 7.3 -11.0 4.8 -3.4 4.5 -7.4 1.0 2.1 11.3 6.0 8.9 -5.9 -5.8 -4.5 +/- to Obj. (%)13.2 2.4 -13.6 -4.1 -1.2 5.9 -9.3 -3.8 1.5 10.4 -6.2 2.9 3.0 1.3 -0.6 +/- to Peer (%)
■1 ■2 ■5 ■2 ■4 ■2 ■5 ■3 ■3 ■1 ■3 ■2 ■4 ■4 ■4 Quintile Perf. Rel. to Obj.
PERFORMANCE (4/30/02)
Value Est. Taxes ValueTotal +/- % +/- % Percentile +/- % $10,000 on $10,000 $10,000
Return* S&P 500 Obj. Rank Obj. Peer Investment Investment +$100/Mo.
3 MONTHS -8.2 -3.8 -5.2 86 -1.5 9,178 - 9,3656 MONTHS -1.3 -3.6 -5.9 82 -1.2 9,867 1 10,3271 YEAR -21.2 -8.6 -8.5 80 -1.5 7,879 1 8,8843 YEAR -6.0 -0.1 -3.2 63 2.7 8,311 454 11,0365 YEAR 6.0 -1.5 -1.1 62 0.7 13,351 1,264 18,50010 YEAR 10.1 -2.2 0.0 59 0.1 26,093 3,252 43,50115 YEAR 10.4 -1.5 0.4 56 0.0 44,216 6,278 82,86320 YEAR - - - - - - - -* Annualized for three years and beyond.
Fund Obj.Beta 1.24 1.03Alpha 2.9 3.8R2 92 86Std. Dev. 21.66 22.03
1 (best) to 5 (worst) Fund Obj.Overall 3.9 3.6Risk 3.8 3.6Growth 10Yr. 3.0 2.8Persistence 5Yr. 3.1 3.3
1Yr. 4.3 3.7
LOAD-ADJ RET 4/02
10 YEAR 10.1%5 YEAR 6.0%1 YEAR -21.2%Since inception 12.4%
Management Fee 0.58%
12b-1 Fee NoneRed. Fee None
Sales Load Pct.Maximum Noneat $25K Noneat $100K Noneat $500K NoneMinimum None
Recent Developments and StrategiesScudder Capital Growth Fund declined by
more than 9% during the four-month periodthroughApril, lagging the Growth objective groupand, to a lesser degree, its Large-Cap Growth-style peers. Performance was hindered by a siz-able position in technology stocks (over 29% ofassets), several of which floundered as businessescontinued to temper their consumption within thearena. Elsewhere, the fund was hurt by an over-19%-of-assets position in health care, where anumber of major drug stocks buckled under theweight of patent expirations, delays in FDA ap-provals, and a surge in generic competition. Inspite of recent disappointments within the indus-try, manager William Gadsden remains bullish onpharmaceuticals, asserting that a strongpipelineofnew drugs will enable the area to rebound in themonths ahead. On a positive note Gadsden’s de-cision to avoid the out-of-favor telecommunica-tions sector proved beneficial in the term.
Management StyleThe fund aims to provide capital appreciation.
Gadsdenutilizesagrowth-oriented,bottom-upap-proach in selecting stocks. He concentrates on
reducingshare-pricevolatility, emphasizing large-cap holdings. Firms are rated for fundamentalquality and competitive position within their in-dustries, and the top 50% of these are thenscreened again for relative valuation. These com-panies are then placed into an ‘‘investment uni-verse,’’from which management makes its invest-ment selections. Stocks with high market expecta-tions are generally avoided because of theirpotentially higher volatility. Gadsden willeliminate an issue when the company’s quality orcompetitive position has deteriorated, or if it ap-pears to become overvalued.
ConclusionAlthough recent performance has been weak,
the fund has slightly outperformed both theGrowth objective group and its Large-CapGrowth-style peers on a trailing basis sinceGadsden assumed the managerial reins in late-1994. Volatility is marginally below the group’saverage. Risk-conscious investors desiring capitalappreciation should find the offering attractive.The AARP-shares are available only to AARPmembers, but retail-share classes are also offered.Brendan Moroney June 18, 2002
THE VALUE LINE MUTUAL FUND SURVEY OBJECTIVE PEER DIV YLD NAV TNA(Mil) VALUELINE
OVERALL RANK RISK RANK 5-YR RETURN
(Annualized)
PAST MARKET CYCLE PERFORMANCE
FUND INFORMATION
PORTFOLIO INFORMATION
SECTOR WEIGHTINGS COMPOSITION %
STATISTICS
PORTFOLIO HOLDINGS
PORT. MGR. %RATING
Style/Perf. QuintileLarge
Cap.
SmallCap.
Value Growth
QUARTERLY TOTAL RETURN (%)
ISSUE DATE6/18/02
EXPENSE STRUCTURE
MPT vs. S&P 500
RANKINGS
© 2002, Value Line Publishing, Inc. All rights reserved. Factual material is obtained from sources believed to be reliable and is provided without warranties of any kind. THE PUBLISHER IS NOTRESPONSIBLE FOR ANY ERRORS OR OMISSIONS HEREIN. This publication is strictly for subscriber’s own, non-commercial, internal use. No part of it may be reproduced, resold, stored or transmittedin any printed, electronic or other form, or used for generating or marketing any printed or electronic publication, service or product. All investors must read applicable prospectuses before investing.
To subscribe call 1-800-833-0046.
10. Performance Graph11. Load-adjusted Return12. Expense Structure13. Relative Performance Graph14. Historical Array15. Modern Portfolio Theory (MPT)16. Rankings17. Performance18. Analyst Commentary
Index To Page Contents
THE VALUE LINE PAGE(FULL COVERAGE)
1
2
3
4
5
6789
18
17
16
15
14
13
12
11
10
1. Name /Objective Group/Peer Group/Dividend Yield/NAV/TNA
2. Ranks / Five-Year Return3. Past Market Cycle (PMC) Performance4. Fund Information5. Portfolio Information6. Portfolio Manager7. Tax Status (Unrealized Appreciation)8. Management Style9. Quarterly Total Return

USER'S GUIDE 7
THE VALUE LINE PAGEIn the front of every “Performance & Index” section is a five-page sectioncovering investment trends and ideas. This provides articles on currentinvestment topics, fund news and developments, featured fund highlights,and, from Value Line’s Equity Research Department, perspective on thecurrent economic outlook and specific investment advice. The latter is in-tended to help investors make decisions concerning their portfolios.
A sample page of “Ratings & Reports” for funds receiving full-page coverageis shown on the previous page. It contains a tremendous amount of informa-tion — one reason why the Value Line format is so effective and popular withinvestors. With all the essential information on a single page, investors haveat their fingertips everything they need to make an informed mutual fundinvestment decision.
The full-page layout is designed to present information in a logical, conciseand easy-to-use manner. Below we describe each item on the page.
1. NAME / OBJECTIVE GROUP/ DIVIDEND YIELD / NAV / TNA
A. Name
The name of the fund and its ticker symbol.
B. Objective Group
Funds in the Value Line universe are divided among 31 investmentobjectives, which fall into six investment-objective categories, as follows:
General Equity — 5 objective groups
Aggressive Growth (AG) - Invests predominantly in higher-risk com-mon stocks or has a stated policy of maximum growth without regardto income or time horizon.
Growth (GR) - Pursues long-term growth via common stocks, usuallywith income as a secondary objective.
Growth/Income (GI) - Places equal emphasis on capital growth andcurrent income or growth of income, mainly through investment incommon stocks.
Income (IN) — Seeks income primarily through investment in commonstocks. Growth may or may not be a secondary objective.
Small Company (SC) - Stated policy is to invest primarily in commonstocks of companies with market capitalization of less than $2 billion.
Specialty Equity — 8 objective groups
Energy/Natural Resources (EN) - Stated policy is to invest at least50% of assets in common stocks of energy and/or natural-resourcescompanies.
Financial Services (FS) - Stated policy is to invest at least 50% of assetsin common stocks of financial-services and related companies.
Health (HL) - Stated policy is to invest at least 50% of assets in companiesprimarily engaged in health-care and related businesses.
Other (OT) - Stated policy is to invest at least 50% of assets in stocks of
1

companies in a specific sector for which no other category is defined.
Precious Metals (PM) - Stated policy is to invest at least 50% of assets ingold and/or precious-metals stocks or bullion.
Real Estate (RE) - Stated policy is to invest at least 30% of assets in realestate or related companies, including real estate investment trusts(REITs).
Technology (TC) - Stated policy is to invest at least 50% of assets in stocksof companies that develop or are expected to benefit from advancedtechnologies.
Utilities (UT) - Stated policy is to invest at least 50% of assets in utilitiessecurities, including telephone or cable-television companies.
International Equity — 4 objective groups
Europe Equity (EU) - Invests at least 50% of net assets in equity securitiesof European companies.
Foreign Equity (FO) - Invests at least 50% of assets in common stocks ofnon-U.S. companies.
Global Equity (GL) - Invests in common stocks of both U.S. and foreigncompanies.
Pacific Equity (PB) - Invests at least 50% of assets in equity securities ofPacific Basin (including Japanese) companies.
Partial Equity — 4 objective groups
Asset Allocation (AA) - Uses optimization or asset-allocation model todetermine most favorable allocation among asset classes, usually inpursuit of total return. Often exhibits characteristics similar to those ofBalanced funds (see below).
Balanced (BA) - Committed to maintaining a balance between stocks andbonds. Must have a stated policy to invest at least 25% of assets inbonds at all times. Stated objectives must be growth, income, andpreservation of capital.
Convertible (CV) - Invests mainly in actual or synthetic convertiblesecurities. Objectives may range from growth to income.
Flexible (FL) - May invest in stocks, bonds, or cash to any degree, usuallyin pursuit of income or total return.
In addition, funds within particular investment objectives often share an evenmore specific investment focus within the context of their larger objectivegroup. These funds have been grouped into more-specialized peer groupswithin specific investment objectives—with the exception of domestic Gen-eral Equity funds, where peer groups can actually include funds from anyGeneral Equity investment objective. Listed below are all objective groupsthat contain peer groups:

USER'S GUIDE 9
Objective Group Peer Group Peer Code
Aggressive Growth Growth-Style GWLarge-Cap Blend LBLarge-Cap Growth LGLarge-Cap Value LVSmall-Cap Blend SBSmall-Cap Growth SGSmall-Cap Value SVValue-Style VL
Asset Allocation Global GL
Balanced Global GL
Foreign Equity Emerging Markets EMLatin America LA
Growth Growth-Style GWLarge-Cap Blend LBLarge-Cap Growth LGLarge-Cap Value LVSmall-Cap Blend SBSmall-Cap Growth SGSmall-Cap Value SVValue-Style VL
Growth/Income Large-Cap Blend LBLarge-Cap Growth LGLarge-Cap Value LVSmall-Cap Blend SBSmall-Cap Value SVValue-Style VL
Income Large-Cap Blend LBLarge-Cap Value LVValue-Style VL
Pacific Equity Japan JPNon-Japan NJ
Small Company Growth-Style GW
Small-Cap Blend SBSmall-Cap Growth SGSmall-Cap Value SVValue-Style VL
Utilities Global GL
Peer Group Definitions
Emerging Markets - Invests at least 50% of assets in common stocks ofcompanies located in countries with developing economies (as opposed tothose with more-stable or mature economies, such as Japan or most Euro-pean countries).
Global - Invests in securities (stocks, bonds, or both depending upon the fund’sobjective) issued in both the U.S. and in foreign companies.
Growth-Style- Invests primarily in “growth” stocks, or those whose prices areexpected to rise due to anticipated growth in the companies’ revenues andearnings, with no great bias toward either large or small companies.
Japan - Invests at least 50% of assets in common stocks of Japanese companies.
Large-Cap Blend - Invests primarily in large companies (generally those withmarket capitalizations exceeding $10 billion), with no notable bias towardseither growth or value stocks.
Large-Cap Growth - Invests primarily in large companies (generally thosewith market capitalizations exceeding $10 billion), with a focus on growthstocks.
Large-Cap Value - Invests primarily in large companies (generally those withmarket capitalizations exceeding $10 billion), with a focus on value stocks.
Latin America - Invests at least 50% of assets in common stocks of LatinAmerican companies.
Non-Japan - Invests at least 50% of assets in the equity of Pacific Basin(excluding Japanese) companies.
Small-Cap Blend - Invests primarily in small companies (generally those withmarket capitalizations not exceeding $2 billion), with no notable biastowards either growth or value stocks.
Small-Cap Growth - Invests primarily in small companies (generally thosewith market capitalizations not exceeding $2 billion), with a focus ongrowth stocks.
Small-Cap Value - Invests primarily in small companies (generally those withmarket capitalizations not exceeding $2 billion), with a focus on valuestocks.
Value-Style - Invests primarily in “value” stocks, or those whose prices areregarded as undervalued relative to current earnings, revenues, or assets,with no bias toward either large or small companies.
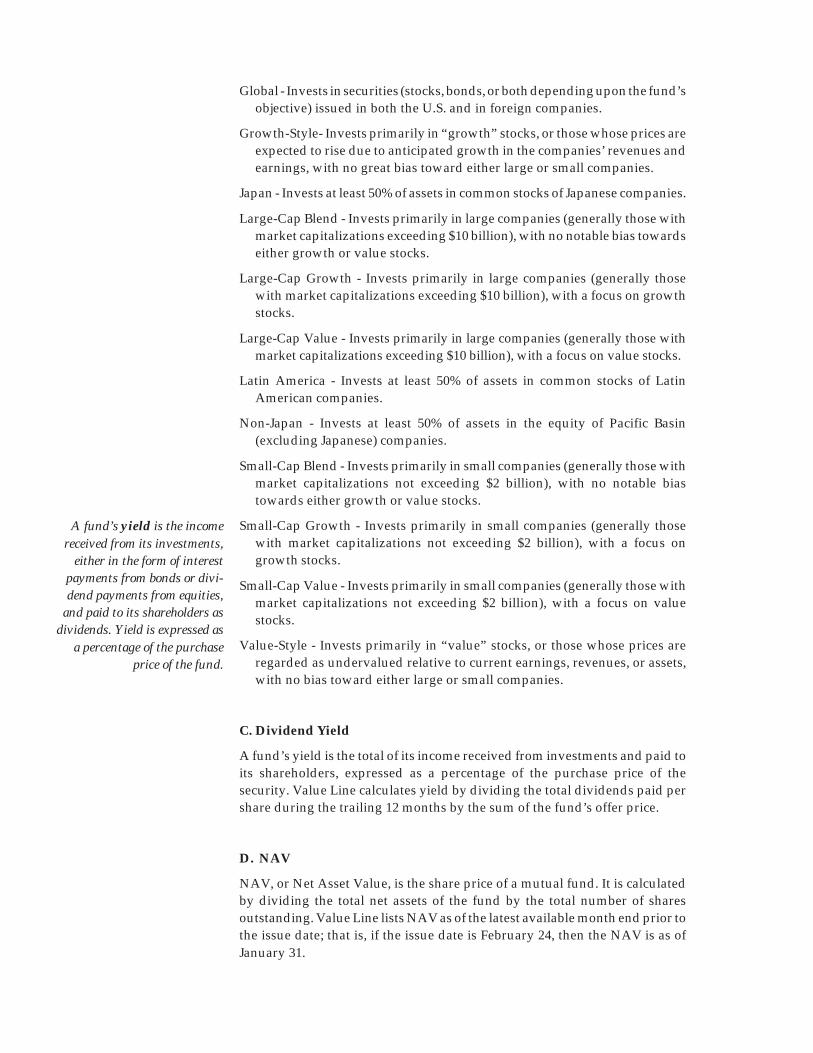
C. Dividend Yield
A fund’s yield is the total of its income received from investments and paid toits shareholders, expressed as a percentage of the purchase price of thesecurity. Value Line calculates yield by dividing the total dividends paid pershare during the trailing 12 months by the sum of the fund’s offer price.
D. NAV
NAV, or Net Asset Value, is the share price of a mutual fund. It is calculatedby dividing the total net assets of the fund by the total number of sharesoutstanding. Value Line lists NAV as of the latest available month end prior tothe issue date; that is, if the issue date is February 24, then the NAV is as ofJanuary 31.
A fund’s yield is the incomereceived from its investments,
either in the form of interestpayments from bonds or divi-dend payments from equities,
and paid to its shareholders asdividends. Yield is expressed as
a percentage of the purchaseprice of the fund.

USER'S GUIDE 11
An investor purchasing shares of a fund with a front-end sales charge will paya higher price—the offer price—which is calculated by dividing the amountinvested by the actual number of shares purchased. For example, a personinvesting $1,000 in a fund with a 5% load and NAV of $10 actually invests only$950. He or she receives 95 shares and thus pays an offer price of $1,000 ÷ 95or $10.53.
E. Total Net Assets (TNA)
The asset figure shown reflects total net assets at current market value lessliabilities.
2. RANKS / FIVE-YEAR RETURN
A. Ranks
Rankings are useful because they bring together important performance andrisk statistics into a single measure, facilitating comparisons across a broaduniverse of funds.
Rankings that are either too broad or too specific in their groupings can bedeceptive; over the long run, for example, an aggressive growth fund willtypically outperform a municipal bond fund. If these two are ranked againsteach other, the rankings will not reflect that they have entirely differentportfolios and investment objectives. On the other hand, if a small group offunds, such as precious-metals funds, was ranked independently, these rankingswould not reflect the historically weak performance or high volatility inherentin this group relative to the broader market.
Many other qualities of mutual funds come into play on the level of theindividual investor: income requirements, time horizons, taxes, etc. These andother factors fall outside the realm of rankings, and an investor must considerthem as well in order to make an informed decision.
Value Line uses a dual ranking system whereby each fund receives an OverallRank, measuring various performance criteria taking risk into account, and aRisk Rank, to show the total level of risk the fund has assumed. Funds areranked from 1 to 5, with 1 being the highest Overall Rank (the best risk-adjustedperformance) and the best Risk Rank (the least risky).
Overall Ranks are calculated separately for each of three broad categories:equity and partial-equity funds, taxable fixed-income funds, and municipalbond (tax-free) funds. Value Line calculates Overall Ranks on the basis of threecritical factors: five- and one-year persistence of relative growth in fundreturns, and three-year risk-adjusted performance. Growth Persistence, shownindividually in the Rankings box on the page (middle right side), is a propri-etary Value Line measure that rewards funds for the consistency with whichthey outperform their broader universe of equity, taxable fixed-income, ormunicipal bond funds. Funds are rewarded only for the consistency withwhich they outperform, not for the magnitude of the outperformance (seeSection 16 for a more detailed explanation of Growth Persistence). The three-year risk-adjusted performance is calculated by dividing a fund’s three-yeartotal return by its standard deviation. These three measures are combined intoa total score, and the funds are then ranked from 1 (Highest) to 5 (Lowest).
2
Risk Ranks are calculated for each of two broad categories: equity and partial-equity funds, and taxable and tax-exempt fixed-income funds. The ranks arebased on standard deviation, a measure of a fund’s volatility (see Section 14 fora more detailed explanation of standard deviation). Value Line uses a three-year period for this calculation, which provides enough data for reliablemeasurement without overweighting data that are too old to be relevant.Standard deviation measures the variation of a fund’s returns, exclusive of anyother factors. It is, therefore, a more reliable indicator of a fund’s risk than otherstatistics, such as beta, which measures the sensitivity of a fund against anindependent index such as the S&P 500. Standard deviation accounts for bothpositive and negative returns equally and thus gives an indication of thepotential swings in a fund’s performance. Because it makes no distinctionbetween upside and downside volatility, standard deviation will tend to givea more conservative indication of the risk a fund has historically incurred.
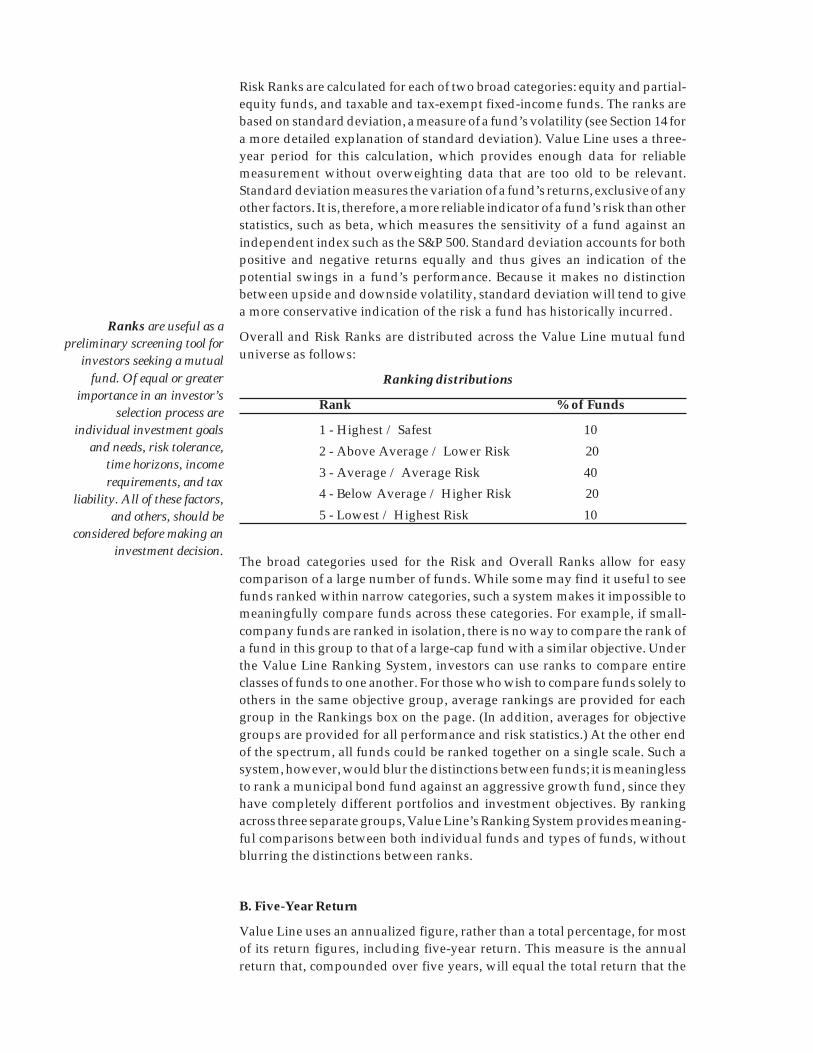
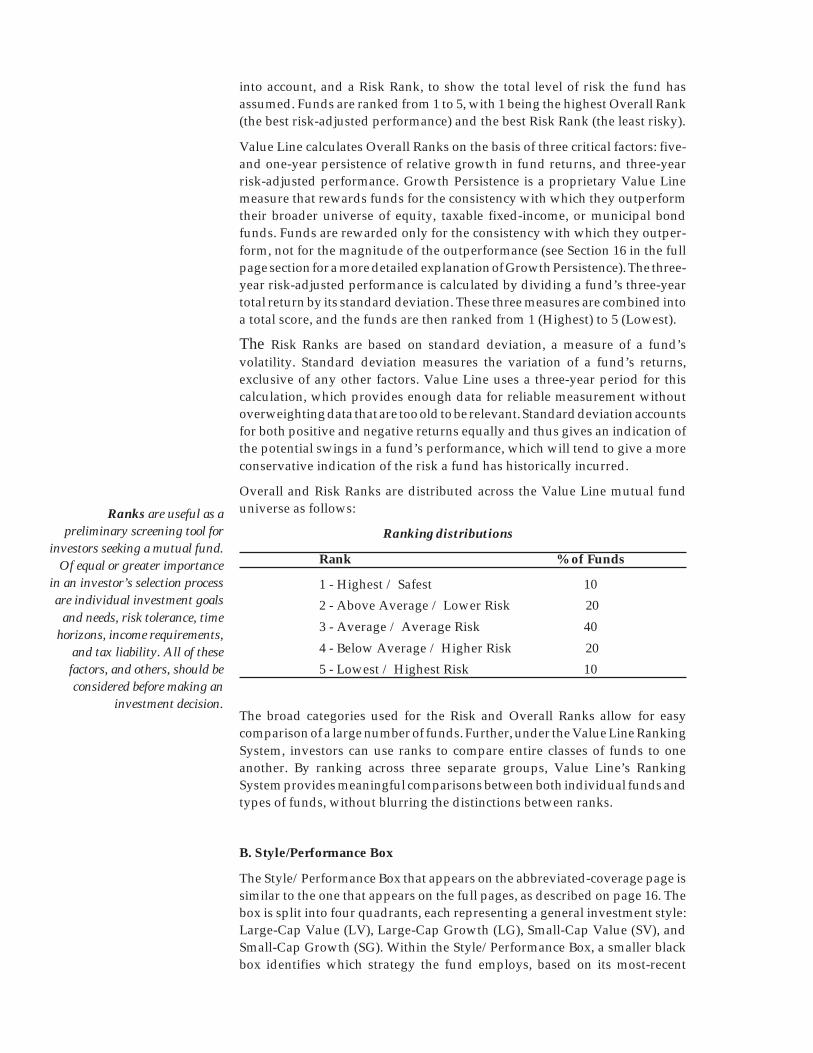
Overall and Risk Ranks are distributed across the Value Line mutual funduniverse as follows:
Ranking distributions
Rank % of Funds
1 - Highest / Safest 10
2 - Above Average / Lower Risk 20
3 - Average / Average Risk 40
4 - Below Average / Higher Risk 20
5 - Lowest / Highest Risk 10
The broad categories used for the Risk and Overall Ranks allow for easycomparison of a large number of funds. While some may find it useful to seefunds ranked within narrow categories, such a system makes it impossible tomeaningfully compare funds across these categories. For example, if small-company funds are ranked in isolation, there is no way to compare the rank ofa fund in this group to that of a large-cap fund with a similar objective. Underthe Value Line Ranking System, investors can use ranks to compare entireclasses of funds to one another. For those who wish to compare funds solely toothers in the same objective group, average rankings are provided for eachgroup in the Rankings box on the page. (In addition, averages for objectivegroups are provided for all performance and risk statistics.) At the other endof the spectrum, all funds could be ranked together on a single scale. Such asystem, however, would blur the distinctions between funds; it is meaninglessto rank a municipal bond fund against an aggressive growth fund, since theyhave completely different portfolios and investment objectives. By rankingacross three separate groups, Value Line’s Ranking System provides meaning-ful comparisons between both individual funds and types of funds, withoutblurring the distinctions between ranks.
B. Five-Year Return
Value Line uses an annualized figure, rather than a total percentage, for mostof its return figures, including five-year return. This measure is the annualreturn that, compounded over five years, will equal the total return that the
Ranks are useful as apreliminary screening tool for
investors seeking a mutualfund. Of equal or greater
importance in an investor’sselection process are
individual investment goalsand needs, risk tolerance,
time horizons, incomerequirements, and tax
liability. All of these factors,and others, should be
considered before making aninvestment decision.
USER'S GUIDE 13
fund produced over the last five years. For example, a fund that has gained 50%over the last five years will show a compound annual return of 8.3%, not 10%which is the average annual return.
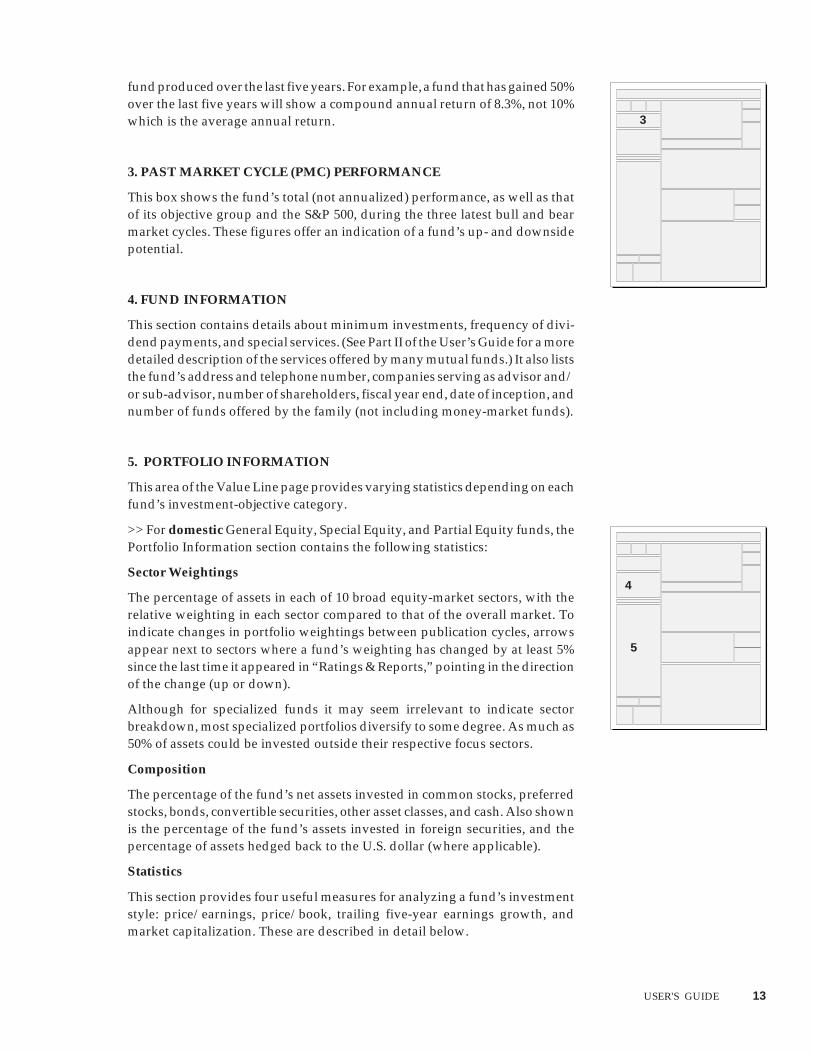
3. PAST MARKET CYCLE (PMC) PERFORMANCE
This box shows the fund’s total (not annualized) performance, as well as thatof its objective group and the S&P 500, during the three latest bull and bearmarket cycles. These figures offer an indication of a fund’s up- and downsidepotential.
4. FUND INFORMATION
This section contains details about minimum investments, frequency of divi-dend payments, and special services. (See Part II of the User’s Guide for a moredetailed description of the services offered by many mutual funds.) It also liststhe fund’s address and telephone number, companies serving as advisor and/or sub-advisor, number of shareholders, fiscal year end, date of inception, andnumber of funds offered by the family (not including money-market funds).
5. PORTFOLIO INFORMATION
This area of the Value Line page provides varying statistics depending on eachfund’s investment-objective category.
>> For domestic General Equity, Special Equity, and Partial Equity funds, thePortfolio Information section contains the following statistics:
Sector Weightings
The percentage of assets in each of 10 broad equity-market sectors, with therelative weighting in each sector compared to that of the overall market. Toindicate changes in portfolio weightings between publication cycles, arrowsappear next to sectors where a fund’s weighting has changed by at least 5%since the last time it appeared in “Ratings & Reports,” pointing in the directionof the change (up or down).
Although for specialized funds it may seem irrelevant to indicate sectorbreakdown, most specialized portfolios diversify to some degree. As much as50% of assets could be invested outside their respective focus sectors.
Composition
The percentage of the fund’s net assets invested in common stocks, preferredstocks, bonds, convertible securities, other asset classes, and cash. Also shownis the percentage of the fund’s assets invested in foreign securities, and thepercentage of assets hedged back to the U.S. dollar (where applicable).
Statistics
This section provides four useful measures for analyzing a fund’s investmentstyle: price/earnings, price/book, trailing five-year earnings growth, andmarket capitalization. These are described in detail below.
3
4
5

The figures are derived by computing the dollar-weighted average of thefund’s underlying equity holdings. A weighted average provides the bestindication of how a fund can be expected to behave in regard to these measures.Because the statistics are not always available or meaningful for all of a fund’sunderlying holdings, the “percentage of stocks” column indicates the percent-age of the fund’s equity holdings for which statistics were available.
a. Price / Earnings (P/E) Ratio
The price of a stock divided by its annual earnings per share. Value Linelists a fund’s dollar-weighted average trailing P/E ratio, using currentprices and reported earnings from the latest year.
b. Price / Book (P/B) Ratio
A ratio of the price of a stock to its company’s book value per share. Stocksof companies that are older, slower-growing, or depressed in pricebecause of poor current earnings performance generally sell at low P/Bratios. Value Line shows the dollar-weighted average P/B of the fund’sunderlying holdings.
Together, these two ratios measure how much investors are paying for acompany’s earning power. Higher multiples indicate higher expecta-tions for a company’s future earnings growth. Hence, stocks with highermultiples relative to the overall market are known as growth stocks.These usually fast-growing companies are riskier than companies withlower multiples, because a failure to meet earnings expectations cansometimes result in sharp declines in the stock price. Stocks with lowermultiples are generally known as value stocks and tend to be shares ofmore-stable companies in mature or slow-growing industries or compa-nies that have fallen out of favor. Value Line uses these two ratios tomeasure an equity fund’s Management Style (Section 8).
c. Five-Year Earnings Growth
The trailing five-year average annual earnings-per-share growth of allstocks currently held by the fund. This figure offers insight into the fundmanagement’s emphasis on the historical earnings-growth record of itsindividual holdings.
d. Weighted-Average Market Capitalization
Market capitalization is the value of a corporation as measured bymultiplying the number of common shares outstanding by the currentmarket price of a share.
The figure used by Value Line weights the market capitalization of eachof the fund’s equity holdings according to the amount the fund hasinvested in each, resulting in an accurate measure of how the fund’sportfolio can be expected to behave from a market capitalization stand-point. For example, if a fund invests in three companies with marketcapitalizations of $10 billion, $2 billion, and $100 million, and has 90% ofits assets in the largest, with 10% equally split between the other two, itsweighted average market capitalization is $8.3 billion, as opposed to amedian figure of only $2 billion.
Price/earnings andprice/book ratios are a useful
tool in measuring a fund’spotential volatility. Generally,
funds with highermultiples are more volatile than
those with lowermultiples.

USER'S GUIDE 15
The Management Style Box (Section 8) uses the market-capitalizationfigure to indicate the fund’s bias toward small or large companies.
Portfolio Holdings
The 20 largest equity holdings of the fund, including the latest availableTimeliness™ Rank from The Value Line Investment Survey. In addition, thesection lists the number of shares held of each stock, the holding’s currentmarket value, and its percentage of the fund’s total net assets.
>> For International Equity funds (Europe, Foreign, Global, and Pacific), thePortfolio Information section contains the following information:
Country Weightings
Countries in which the fund is invested are listed in order of the size of thefund’s position.
Composition
Percentage of the fund’s assets invested in common stocks, preferred stocks,bonds, convertible securities, other asset categories, and cash. Also shown isthe percentage of the fund’s assets invested in foreign securities, and thepercentage of assets hedged back to the U.S. dollar.
6. PORTFOLIO MANAGER
The name of each Fund Manager and the year the manager or managers begantheir tenure are provided for all funds. The length of time a manager has beenwith a fund increases or decreases the relevance of the fund’s historicalperformance.
A change in management can have a significant impact on a fund’s style andperformance. Thus, it is very pertinent and useful to measure a manager’seffectiveness in rewarding shareholders for the risks incurred by the fundduring his or her tenure. Value Line’s Manager Ratings, provided only forequity and partial-equity funds, measure the risk-adjusted performance of afund’s management relative to the fund’s objective or peer group (these groupsare defined in Section 1 above, on page 7). This performance rating is based onthe manager’s “value added” while with the fund—that is, the differencebetween a manager’s actual average annual return while at the fund and the“expected” return as determined by the level of risk assumed relative to thefund’s brethren.
In calculating Manager Ratings, risk is measured by the standard deviation ofmonthly returns since the manager took over the fund, expressed as a ratio tothe standard deviation of the fund’s objective group for the same period (afteradjusting for the risk-free rate of return on a U.S. Treasury bill).
Once the fund’s relative risk is measured, it is used to calculate the annualizedreturn that would be “expected” when assuming such a risk level within theobjective group. This “expected” return is subtracted from the fund’s actualaverage annual return, and the resulting figure can be considered the manager’s“value added” while with the fund. If a manager has been in place for less than
6
The Value Line Timeliness™Rank measures probable priceperformance during the next sixto 12 months on an easy-to-understand scale from 1(Highest) to 5 (Lowest). Thecomponents of the RankingSystem are the long-term trendof earnings and prices, recentearnings and price momentum,and, finally, earnings surprise.

two years, no value added is calculated. In addition, the measurement periodextends back only to the point when the objective (or peer) group contained atleast five funds.
7. TAX STATUS (UNREALIZED APPRECIATION)
The percentage of a fund’s current net assets that represent gains or losses onsecurities held. This is calculated by dividing the difference between thecurrent market value of the fund’s portfolio holdings and their cost at the timeof purchase by the fund’s current total net assets. If and when these gains arerealized through the sale of appreciated securities for a profit, the proceedsmust be distributed to shareholders as taxable capital gains.
8. MANAGEMENT STYLE
The Management Style box is a representation of the characteristics of a fund’ssecurities. The vertical axis represents market capitalization of equities inwhich the fund invests; the horizontal axis reflects the value-growth con-tinuum as measured by the overall price/earnings and price/book ratios of theportfolio’s securities. Lower price/earnings and price/book ratios are valuecharacteristics, while higher ratios are growth characteristics. For purposes ofcalculating the value-growth score, both of these ratios are calculated on arelative basis—whereby 1.00 equals the average for all equity funds—thenweighted so that price/book counts for two-thirds of the final score. Theuniverse of all equity funds is then divided into four equal groups on the basisof these scores. The vertical axis, representing market capitalization, alsocontains four positions. The bottom row, denoting the smallest market capitali-zation, includes portfolios whose weighted-average market cap is under $1billion. The next row includes funds with average-weighted market caps of $1billion to $5 billion; the third, those with market caps of $5 billion to $10 billion;and the top row represents portfolios with weighted-average market capsgreater than $10 billion.
The number inside the box represents the fund’s quintile ranking, based on itsperformance over the trailing 12 months versus the universe of funds that fallinto the same Management Style square. The choice of 12-month performancerepresents a balance: a longer period would be less relevant given the rate atwhich style boxes change, while a period of less than one year is not longenough to provide a meaningful basis of comparison. A dash in the style boxindicates that there are not sufficient meaningful statistics for the fund’sholdings with which to judge its relative performance.
In essence, this Ranking compares a fund to a peer group based solely onmanagement style. Peer groups are more commonly defined by the statedinvestment objectives of the funds. By providing this added performancedimension to style analysis, investors are able to move beyond simply identi-fying a particular management style and make meaningful assessments as tohow well that style is being implemented.
78
The numeral in theManagement Style box
indicates how the fund hasperformed over the last 12
months compared to all otherfunds that fall in the samemanagement style square.

USER'S GUIDE 17
9. QUARTERLY TOTAL RETURN
Quarterly total returns are shown here for the past five years, for each calendarquarter. This information demonstrates how a fund’s return varies fromquarter to quarter, and provides an indicator of the fund’s volatility.
10. PERFORMANCE GRAPH
This graph illustrates the results of a $10,000 investment over the last 15 years (orover the life of the fund if it has a shorter history), assuming reinvestment ofcapital gains and income dividends. For comparative purposes, results are alsoshown for the relevant index. Results are plotted monthly. The current value ofthe initial $10,000 investment in the fund is also listed in the Total Return inset.
For funds with a front-end sales load, the investment is assumed to be made atthe current sales charge. These data enable an investor considering a load fundto evaluate the effects of the sales charge on an actual investment, as comparedto a relevant index, over a long time period. Historical performance dataexcluding sales charges are available as well, in the Performance box (seeSection 17).
In addition, the Performance Graph includes down-pointing arrows to indi-cate when new managers took over the administration of the fund, whichprovides an additional indication of how a particular manager may havecontributed to a fund’s performance. Up-pointing arrows are also included toshow dates when a fund underwent a major policy shift, such as a dramaticshift in its investment objective.
11. LOAD-ADJUSTED RETURNS
This box displays a fund’s annualized load-adjusted returns for the past one,five, and 10 years, as well as since the fund’s inception, assuming all invest-ments were made with the maximum front-end sales charge, as well as anyapplicable redemption fees or deferred sales changes. As with the Perfor-mance Graph (see Section 10), these returns allow an investor to consider theimpact of a fund’s load on its overall performance, especially by comparingload-adjusted returns to returns that exclude sales charge as shown in thePerformance box (see Section 17).
12. EXPENSE STRUCTURE
This section provides a breakdown of the major expenses and fees charged bya fund, as described below (several of these elements are provided for bondfunds in the Shareholder Information Box).
A. Management Fee
The annual percentage of fund assets paid to the fund’s investment manageras compensation for managing the fund. Often this fee is graded; that is, thepercentage fee is reduced in steps on assets in excess of various breakpoints.The maximum percentage is listed first, with the minimum graded fee (ifapplicable) shown below it. Generally, management fees will not exceed 1%of total net assets.
1211
9
10

B. 12b-1 Fee
Many mutual funds charge a “distribution fee” in order to help paypromotional and distribution costs. This fee is deducted from the fund’s netassets, so the share price already reflects any 12b-1 charges. By law, annual12b-1 fees may not exceed 1% of total net assets.
C. Redemption Fee
Some mutual funds charge a redemption fee. The most common is acontingent deferred sales charge, also known as a back-end load. A back-end load is an alternative to a load fund’s typical front-end sales charge andis one method used by mutual funds to encourage longer-term financialcommitment. An investor pays no sales charge when initially purchasingshares, but rather pays a charge when redeeming them. These redemptioncharges are highest during the first year, and typically decline by onepercentage point per year thereafter, so that investors holding shares longenough pay no fee at all. A small number of funds charge a simple flatredemption fee, usually 1% or less, designed to discourage market timers.Often these lower, flat fees are only in effect for one year or less followingthe initial purchase.
D.Sales Load
A charge levied on initial purchases of shares used to pay a commission tothe selling broker. Sales loads are typically graded based on the amount ofmoney invested: the greater the amount invested, the lower the percentagecharge on the purchase.
Front-end loads often have differing breakpoints for their sales charges. Inorder to maintain continuity and enable comparison of sales charges amongload funds, Value Line lists each fund’s sales charge at the same fivepredetermined investment amounts. These amounts may or may not corre-spond to a fund’s actual breakpoints.
13. RELATIVE PERFORMANCE GRAPH
This graph shows the fund’s performance relative to its investment-objectivepeer group on a cumulative basis over the past 15 years (or over the life of thefund if it has a shorter history). The graph illustrates at a glance how well thefund has done over time compared to its peers. A rising curve indicates that afund outperformed its objective group during that period, while a decliningcurve reflects underperformance.
Value Line derives the Relative Performance graph from monthly perfor-mance data for the fund and its objective group. The curve compares the fund’srelative performance for the current month with its relative performance forthe preceding month, resulting in a slope that reflects changes in relativeperformance over time.
14. HISTORICAL ARRAY
This section of the Value Line page provides historical statistical informationpertaining to the fund and to its objective group, peer group, and relevantindex for the preceding 15 years, or for the life of the fund if it is a younger
13
14
Management and distributionfees are included in a fund’s
expense ratio, along withvarious other expenses incurred
by the fund, and are leviedannually. Sales loads and
redemption fees represent one-time charges levied either at thetime of purchase or when shares
are redeemed.
USER'S GUIDE 19
portfolio. Data shown for prior years are based on the calendar year, with theexception of the expense ratio, portfolio turnover, and net assets prior to 1993,which are based on the fund’s fiscal year, and year-to-date dividend yield,which is based on dividends distributed over the past 12 months.
A. Bid Price / NAV
The Net Asset Value or share price of the fund is calculated by dividing thetotal net assets of the fund by the total number of shares outstanding. ValueLine lists the NAV as of the calendar year end for prior years and as of themost recent month-end prior to the issue date for the current year.
B. Dividends
The total dollar amount of income dividends per share declared by the fundfor each calendar year, or for the year to date in the case of the current year.
C. 12-Month Dividend Yield
A fund’s yield is the total of its income received from investments and paidto its shareholders over the trailing 12 months, expressed as a percentage ofthe year-end price of the security. Value Line calculates yield by dividing thetotal dividends paid each year by the sum of the fund’s offer price (NAV).
SEC yield, a yield calculation created by the Securities and ExchangeCommission to standardize yield quotes, is provided only for bond funds.This calculation utilizes the fund’s net investment income over the last 30days, but eliminates income derived from such sources as capital gains andoptions writing. The formula uses the fund’s offer price at the end of the 30-day period, accounts for all fund expenses during this period, and alsoadjusts income from premium or discounted bonds to reflect the amortiza-tion of said bonds.
D. Capital Gains
The total dollar amount of annual capital gains per share paid to sharehold-ers. Funds are required to distribute any gains realized from the sale ofsecurities at least once a year. Unrealized capital gains are listed as apercentage of total net assets in the Tax Status section of the Value Line page(Section 7). If and when capital gains are realized through the sale ofsecurities, they will be distributed to shareholders as taxable capital gains.
E. Expense Ratio
The total expenses incurred by the fund, including management fees,distribution (12b-1) fees, and administrative fees, expressed as a percentageof average net assets.
F. Expense Ratio Relative to Objective Group
Because expenses cut directly into a fund’s yield and therefore its totalreturn, they can have a significant effect on funds that would otherwiseperform identically. For this reason, a fund’s expense ratio is listed relativeto that of its Objective group as a whole. The Objective group average isdeemed to equal 1.00. A figure greater than 1.00 signifies higher-than-average expenses, while a figure below 1.00 represents proportionatelylower expenses.

G. Turnover
A fund’s turnover percentage measures the rate at which its holdings aresold and replaced. Value Line shows turnover rates for each fiscal year, aswell as an annualized rate, where available, for the current year.
Turnover levels are an indication of management style; low turnover (under40%) suggests a more value-oriented, buy-and-hold approach, while higherturnover percentages may indicate a shorter investment horizon and a moreaggressive style. High turnover also tends to more readily generate taxablegains.
H. Net Assets
The total net assets is the value of securities owned, plus receivables, less anyliabilities.
I. Total Return
A fund’s total return is the percentage increase in the value of a shareholder’sinvestment, assuming all dividend and capital-gain distributions werereinvested in additional shares of the fund. Total return is shown for eachcalendar year, or for the year to date in the current year.
J. +/- Relevant Index
For comparative purposes, the difference between the fund’s total returnand that of the relevant index is shown for each calendar year, and for theyear to date for the current year. The difference is expressed in percentagepoints, so that if the fund gained 10.2% and the index gained 8.0%, thedifference would be 2.2%.
For all domestic General Equity, Specialty Equity, and Partial Equityfunds the index used is Standard & Poor’s 500 Stock Index (S&P 500), whichreflects the movements of a broad-based composite of widely held indus-trial, transportation, financial, and utility stocks.
For all Foreign Equity funds, the index used is Morgan Stanley CapitalInternational’s Europe, Australasia, Far East Index (EAFE), a broad-basedindex of stocks that measures the performance of the equity markets inEurope, Australia, and the Far East. This index was initially established in1970 to provide comparative performance data; its performance recordassumes reinvestment of dividends. For all Global Equity funds, the indexused is Morgan Stanley Capital International’s World Index, which includesthe Americas as well as those areas included in the EAFE index.
For all Europe Equity funds, the index used is the Morgan Stanley EuropeanIndex.
For all Pacific Equity funds, the index used is the Morgan Stanley PacificIndex.
For all taxable fixed-income funds, excluding International Bond andCorporate High-Yield funds, the index used is the Lehman Brothers Aggre-gate Bond Index, a proprietary index of Lehman Brothers, Inc., that encom-passes the Lehman Brothers Government/Corporate Index, Mortgage-Backed Securities Index, and Asset-Backed Securities Index.
For all International Bond funds, the index used is the Salomon Brothers

USER'S GUIDE 21
World Bond Index, a proprietary index of Salomon Brothers that encom-passes foreign government fixed-income markets.
For all Corporate High-Yield funds, the index used is the Lehman BrothersHigh Yield Bond Index.
For all Municipal Bond funds, the index used is the Lehman BrothersMunicipal Bond Index, a proprietary index of Lehman Brothers, Inc., thatincludes municipal issues nationwide.
K. +/- Objective Group
To allow for meaningful comparisons among like funds, the differencebetween the fund’s total return and that of its investment-objective peergroup (as defined in the Objective Group box at the top of each page, to theright of the fund name) is shown, expressed in percentage points.
L. +/- Peer
For funds that also belong to a more specialized Peer group within aninvestment-objective group (or across a set of Objective groups—see Section1. B, page 9), the difference between the fund’s total return and that of itsPeer group is shown, expressed in percentage points. A fund’s Peer group(if any) is indicated by the two-character code that appears in the PeerGroup box at the top of the page. Definitions for these codes are listed inSection 1. B above, and on page six of the “Performance & Index” section.
M. Quintile Performance Relative to Objective Group
Unlike the Overall and Risk Ranks, the Performance Quintiles are deriveddirectly from the fund’s performance relative to its Objective group for a givenyear, with no other factors taken into account. The top-performing fifth of theObjective group receives a ranking of 1; the next 20% receives a 2, and so forth.The Performance Quintiles are a valuable measure of a fund’s performanceeach year relative to its peers. They can be used to quickly identify bothhistorical and emerging trends in a fund’s performance.
15. MODERN PORTFOLIO THEORY (MPT)
MPT statistics are useful in quantifying a fund’s risk and reward and thecorrelation between its performance and the performance of the broadermarket as measured by the S&P 500 Index for equity funds, the LehmanBrothers Aggregate Bond Index for taxable bond funds, and the LehmanBrothers Municipal Bond Index for tax-free bond funds. These statisticsprovide a technical profile of the fund’s historical performance, and since theyalso indicate its relationship with the broader market, they can be used toforecast how the fund might perform under various market environments.Value Line calculates all MPT statistics using the prior 36 monthly returns.
A. Beta
Beta measures a fund’s sensitivity to market fluctuations; that is, it measureshow far the fund has historically moved relative to similar moves in theindex, discounting the risk-free rate of return of a three-month Treasury bill.For example, if a fund has a beta of 1.00, then it can be expected to move onepercent for every one-percent move in the index. If a fund has a beta of 2.00,
15

it can be expected to move two percent for every one-percent move in theindex.
B. Alpha
Alpha measures a fund’s risk-adjusted performance. That is, it measures afund’s performance taking into account its beta, or sensitivity to the index,and the risk-free rate of return of a three-month Treasury bill. For example,if a fund has a beta of 1.5, it would be expected to gain 15% when the indexgains 10%. If, however, the fund actually gains 20%, this excess returnrepresents the fund’s alpha. Value Line expresses alpha as an annualizedfigure.
C. R-Squared
R-squared measures the correlation between a fund’s performance and thatof the broader market as measured by an appropriate index. In other words,it measures how reliable the fund’s beta is in judging its market sensitivity.For example, if a fund has an R-squared of 100, then it can be expected toperform exactly in line with its beta, based on historical performance. An R-squared of zero, on the other hand, indicates that the fund’s beta measure-ment is irrelevant to its actual performance.
D. Standard Deviation
Standard deviation measures the variability of a fund’s returns. The figureindicates the number of percentage points above or below the fund’saverage annual return within which any given annual return can be ex-pected to fall two-thirds of the time. For example, if a fund has an averageannual return of 10% and an annual standard deviation of 10, then two-thirds of the time the fund’s annual return can be expected to fall between0% and 20%. Value Line calculates a fund’s standard deviation usingmonthly performance data for the trailing three years, but expresses theresult on a more-relevant annual basis. Standard deviation is also used incalculating the fund’s Risk Rank (see Section 2, page 12, above, for a detailedexplanation of the Value Line ranks.)
16. RANKINGS
The Rankings section of the Value Line page lists the fund’s Overall and RiskRanks as well as the average Overall and Risk ranks for its investment-objective group. The number to the right of the decimal represents the fund’sor Objective group’s decile rank versus other funds with the same broad rank.For example, a fund with an Overall Rank of 3.9 is in the bottom decile of allRank-3 funds, while a fund with a rank of 3.0 is in the top-tenth of all Rank-3funds. The ranks correspond to those shown at the top of the page. A moredetailed explanation of Value Line’s rank calculations can be found in Section2 (page 12) above.
Growth Persistence is a measure of how consistently a fund has outperformedthe broad equity and partial-equity group. Value Line’s calculation of GrowthPersistence rewards a fund only for its consistency of outperformance; themeasure does not take into account the degree of outperformance. The calcu-lation produces a raw number; this number is then ranked against those of thebroad group in order to derive a comparative ranking that is useful in
16
USER'S GUIDE 23
measuring a fund’s historical record of relative performance. The GrowthPersistence figures are also a component of Value Line’s Overall Ranks.
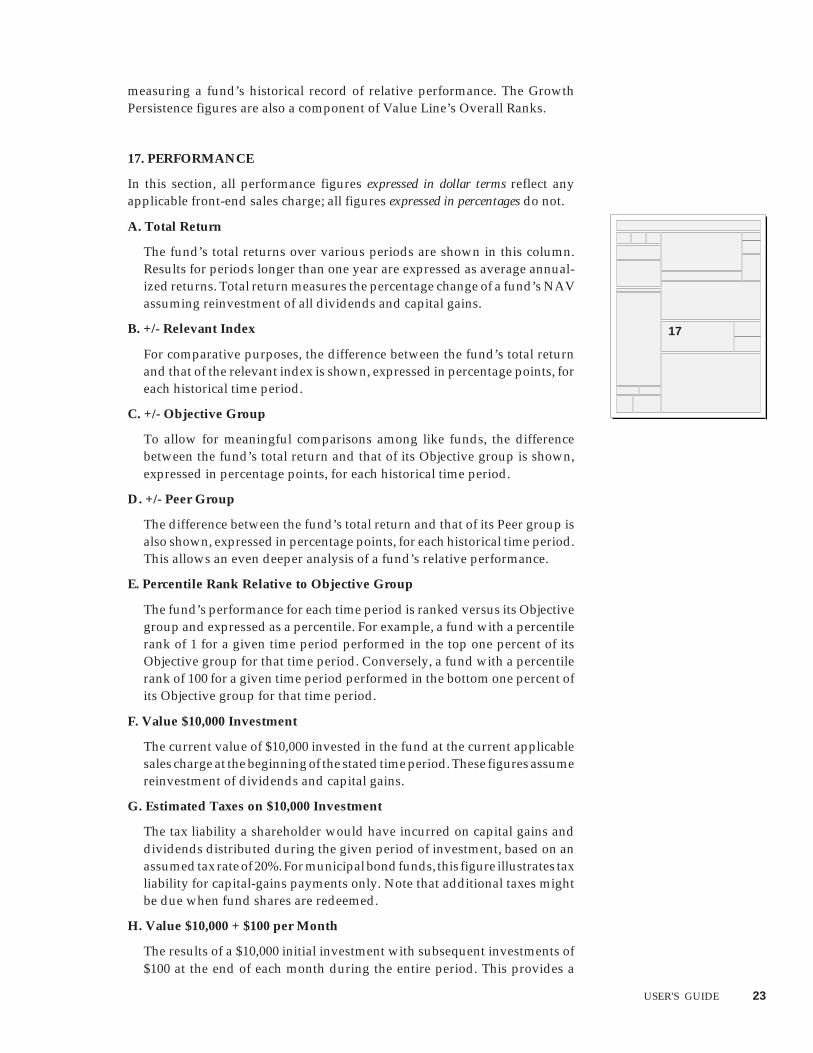
17. PERFORMANCE
In this section, all performance figures expressed in dollar terms reflect anyapplicable front-end sales charge; all figures expressed in percentages do not.
A. Total Return
The fund’s total returns over various periods are shown in this column.Results for periods longer than one year are expressed as average annual-ized returns. Total return measures the percentage change of a fund’s NAVassuming reinvestment of all dividends and capital gains.
B. +/- Relevant Index
For comparative purposes, the difference between the fund’s total returnand that of the relevant index is shown, expressed in percentage points, foreach historical time period.
C. +/- Objective Group
To allow for meaningful comparisons among like funds, the differencebetween the fund’s total return and that of its Objective group is shown,expressed in percentage points, for each historical time period.
D. +/- Peer Group
The difference between the fund’s total return and that of its Peer group isalso shown, expressed in percentage points, for each historical time period.This allows an even deeper analysis of a fund’s relative performance.
E. Percentile Rank Relative to Objective Group
The fund’s performance for each time period is ranked versus its Objectivegroup and expressed as a percentile. For example, a fund with a percentilerank of 1 for a given time period performed in the top one percent of itsObjective group for that time period. Conversely, a fund with a percentilerank of 100 for a given time period performed in the bottom one percent ofits Objective group for that time period.
F. Value $10,000 Investment
The current value of $10,000 invested in the fund at the current applicablesales charge at the beginning of the stated time period. These figures assumereinvestment of dividends and capital gains.
G. Estimated Taxes on $10,000 Investment
The tax liability a shareholder would have incurred on capital gains anddividends distributed during the given period of investment, based on anassumed tax rate of 20%. For municipal bond funds, this figure illustrates taxliability for capital-gains payments only. Note that additional taxes mightbe due when fund shares are redeemed.
H. Value $10,000 + $100 per Month
The results of a $10,000 initial investment with subsequent investments of$100 at the end of each month during the entire period. This provides a
17

relevant illustration of dollar-cost averaging; since volatile funds some-times see their performance amplified under such a program, these resultsshould be considered carefully by investors contemplating such a program.See Part II for a more detailed explanation of this strategy.
18. ANALYST COMMENTARY
A concise, 50-line report on the fund’s performance, management approach,current strategies, and future prospects, based on research by Value Line’steam of mutual fund analysts. For bond funds, the text is limited to a briefdiscussion of management’s investment approach.
18

USER'S GUIDE 25
In order to provide you with coverage on as many funds as possible, 730 equityfunds and roughly 400 fixed income funds receive abbreviated coverage. Theabbreviated reviews of equity funds appear on the last 28 pages of Editions 1through 7, and comprise our entire bond issue, Edition 8.
Abbreviated Equity Coverage
The abbreviated equity reviews are concise and mostly quantitative, yet stillallow readers to make informed decisions when selecting mutual funds.
1) NAME/ADDRESS/TICKER
The name of the fund, the fund family’s contact information and the fund’sticker.
2) OBJECTIVE/PEER GROUP
The fund’s objective group and, where appropriate, peer group.
3) RANKS/STYLE BOX
A. Ranks
Value Line's dual ranking system is also applied to the Abbreviated Reviews,including an Overall Rank, measuring various performance criteria taking risk
THE ABBREVIATED VALUELINE PAGES
ADVANTUS HORIZON FUND A ADIOX400 Robert Street North, St. Paul, MN 55101 800 665-6005 www.advantusfunds.com
Growth/LG5
(Lowest)
4(Higher Risk)
LV LG
SV SG
■3
Began Operations: 5/3/85Net Assets ($Mil.): 21.8Max. Load: 5.50%Max. 12-b1 Fee: 0.25%1st Yr. Red. Fee: NoneExpense Ratio: 1.35Min. Initial Invest: $250Min. Subsequent Invest: $25Min. IRA Invest: $250Telephone Exchanges: YesSyst. Withdrawal: YesAuto. Investing: YesLast Capital Gain: 12/1/0012-Mo. Div. Yield: 0.0%Manager: Thomas A. Gunderson 9/96Manager: Allen D.Steinkopf 5/00Manager Rating: -3.5
PERFORMANCE (8/31/02)Value Est. Taxes Value
Total +/- % +/- % Percentile +/- % $10,000 on $10,000 $10,000Return S&P 500 Obj. Rank Obj. Peer Investment Investment +$100/Mo.
3 MONTHS -13.7 0.1 1.7 29 1.4 8,156 - 8,3406 MONTHS -18.2 -1.6 -1.4 62 0.8 7,731 - 8,1501 YEAR -19.8 -1.8 -0.6 53 2.6 7,582 - 8,4643 YEAR -19.1 -8.7 -10.4 92 -4.8 4,996 410 7,1155 YEAR -4.0 -5.7 -4.1 85 -2.4 7,690 1,105 11,25110 YEAR 4.9 -5.5 -3.3 91 -3.2 15,252 3,194 25,930
Fund Obj.Beta 1.43 1.05Alpha -2.1 2.9R2 80 87Std. Dev. 27.51 22.48
SECTORS (Port. %) (6/30/02)
Consumer Dur. 2.2 Retail Trade 13.9Energy 2.8 Health 16.3Finance 17.5 Services 3.1Industrial Cyc. 5.6 Technology 18.5Non-Durable 11.3 Utilities -
As of 6/30/02 Port. Avg.Price/Earnings 29.10Price/Book 6.345-Yr.Earn.Growth % 17.28Avg.Mkt.Cap.($Mil.) 91,999
The fund’s objective is long-term growth through in-vestment in the stocks of mid- to large-size domesticcompanies. The fund normally invests in commonstocks, but up to 20% of its assets may be weightedin preferred stocks, convertible securities, corporatedebt, and cash. In structuring the portfolio, manage-ment uses a primarily bottom-up approach, looking forliquid companies that dominate their particular sector.The fund seeks offerings with above-average earningsgrowth over a three- to five-year period, solid returnson equity, and expanding margins. It will also focuson a company’s management, balance sheet, andfuture-growth strategies. Although management keepsan eye on its S&P 500 Index benchmark, it does notpeg the fund’s sector weightings to it.
OVERALL RANK RISK RANKINV. OBJECTIVE
SHAREHOLDER INFORMATION
MPT vs. S&P500 STATISTICS
1
5
3
2
4
6
7
8
9
into account, and a Risk Rank, to show the total level of risk the fund hasassumed. Funds are ranked from 1 to 5, with 1 being the highest Overall Rank(the best risk-adjusted performance) and the best Risk Rank (the least risky).
Value Line calculates Overall Ranks on the basis of three critical factors: five-and one-year persistence of relative growth in fund returns, and three-yearrisk-adjusted performance. Growth Persistence is a proprietary Value Linemeasure that rewards funds for the consistency with which they outperformtheir broader universe of equity, taxable fixed-income, or municipal bondfunds. Funds are rewarded only for the consistency with which they outper-form, not for the magnitude of the outperformance (see Section 16 in the fullpage section for a more detailed explanation of Growth Persistence). The three-year risk-adjusted performance is calculated by dividing a fund’s three-yeartotal return by its standard deviation. These three measures are combined intoa total score, and the funds are then ranked from 1 (Highest) to 5 (Lowest).
The Risk Ranks are based on standard deviation, a measure of a fund’svolatility. Standard deviation measures the variation of a fund’s returns,exclusive of any other factors. Value Line uses a three-year period for thiscalculation, which provides enough data for reliable measurement withoutoverweighting data that are too old to be relevant. Standard deviation accountsfor both positive and negative returns equally and thus gives an indication ofthe potential swings in a fund’s performance, which will tend to give a moreconservative indication of the risk a fund has historically incurred.
Overall and Risk Ranks are distributed across the Value Line mutual funduniverse as follows:
Ranking distributions
Rank % of Funds
1 - Highest / Safest 10
2 - Above Average / Lower Risk 20
3 - Average / Average Risk 40
4 - Below Average / Higher Risk 20
5 - Lowest / Highest Risk 10
The broad categories used for the Risk and Overall Ranks allow for easycomparison of a large number of funds. Further, under the Value Line RankingSystem, investors can use ranks to compare entire classes of funds to oneanother. By ranking across three separate groups, Value Line’s RankingSystem provides meaningful comparisons between both individual funds andtypes of funds, without blurring the distinctions between ranks.
B. Style/Performance Box
The Style/Performance Box that appears on the abbreviated-coverage page issimilar to the one that appears on the full pages, as described on page 16. Thebox is split into four quadrants, each representing a general investment style:Large-Cap Value (LV), Large-Cap Growth (LG), Small-Cap Value (SV), andSmall-Cap Growth (SG). Within the Style/Performance Box, a smaller blackbox identifies which strategy the fund employs, based on its most-recent
Ranks are useful as apreliminary screening tool for
investors seeking a mutual fund.Of equal or greater importance
in an investor’s selection processare individual investment goals
and needs, risk tolerance, timehorizons, income requirements,
and tax liability. All of thesefactors, and others, should beconsidered before making an
investment decision.

USER'S GUIDE 27
holdings. Many of these markers also contain a number (1 to 5), ranking thefund’s performance relative to all other funds whose marker is in the identicalposition. If, there are not enough meaningful statistics on which to base thisrank using the previous 12-months’ holdings, this rank is omitted.
4) MANAGEMENT STYLE
This section, authored by Value Line’s analyst team, details management’sgoals, processes, and investment requirements/restrictions.
5) EXPENSES/PORTFOLIO INFORMATION
This section provides a breakdown of the major expenses and fees charged bya fund, as described below (several of these elements are provided for bondfunds in the Shareholder Information Box).
A. 12b-1 Fee
Many mutual funds charge a “distribution fee” in order to help paypromotional and distribution costs. This fee is deducted from the fund’s netassets, so the share price already reflects any 12b-1 charges. By law, annual12b-1 fees may not exceed 1% of total net assets.
B. Redemption Fee
Some mutual funds charge a redemption fee. The most common is acontingent deferred sales charge, also known as a back-end load. A back-end load is an alternative to a load fund’s typical front-end sales charge andis one method used by mutual funds to encourage longer-term financialcommitment. An investor pays no sales charge when initially purchasingshares, but rather pays a charge when redeeming them. These redemptioncharges are highest during the first year, and typically decline by onepercentage point per year thereafter, so that investors holding shares longenough pay no fee at all. A small number of funds charge a simple flatredemption fee, usually 1% or less, designed to discourage market timers.Often these lower, flat fees are only in effect for one year or less followingthe initial purchase.
C. Sales Load
A charge levied on initial purchases of shares used to pay a commission tothe selling broker. Sales loads are typically graded based on the amount ofmoney invested: the greater the amount invested, the lower the percentagecharge on the purchase.
D.Other Data
Reading a prospectus in its entirety is essential before making any invest-ment, but this section highlights some additional important characteristics:
1) Minimum initial, subsequent and IRA investment requirements.
2) Exchange and withdrawal privileges.
3) Fiscal year-end.
4) Portfolio manager/manager rating
The name of each Fund Manager and the year the manager or managersbegan their tenure are provided for all funds. The length of time a manager
A study done by Value Line onfixed-income funds found thatperformance variation in thesefunds is sufficiently narrow thathigher or lower expenses directlycorrelate to leading or laggingrelative performance.

has been with a fund increases or decreases the relevance of the fund’shistorical performance.
Value Line’s Manager Ratings, provided only for equity and partial-equityfunds, measure the risk-adjusted performance of a fund’s managementrelative to the fund’s objective or peer group. This performance rating isbased on the manager’s “value added” while with the fund—that is, thedifference between a manager’s actual average annual return while at thefund and the “expected” return as determined by the level of risk assumedrelative to the fund’s brethren.
In calculating Manager Ratings, risk is measured by the standard deviationof monthly returns since the manager took over the fund, expressed as aratio to the standard deviation of the fund’s objective group for the sameperiod (after adjusting for the risk-free rate of return on a U.S. Treasury bill).
Once the fund’s relative risk is measured, it is used to calculate the annual-ized return that would be “expected” when assuming such a risk levelwithin the objective group. This “expected” return is subtracted from thefund’s actual average annual return, and the resulting figure can be consid-ered the manager’s “value added” while with the fund. If a manager hasbeen in place for less than two years, no value added is calculated. Inaddition, the measurement period extends back only to the point when theobjective (or peer) group contained at least five funds.
5) Last capital gain: the most recent date on which the fund paid a capital gain to shareholders.
6) Fund inception date: the day on which the fund began opperations.
6) PERFORMANCE
In this section, all performance figures expressed in dollar terms reflect anyapplicable front-end sales charge; all figures expressed in percentages do not.
A. Total Return
The fund’s total returns over various periods are shown in this column.Results for periods longer than one year are expressed as average annual-ized returns. Total return measures the percentage change of a fund’s NAVassuming reinvestment of all dividends and capital gains.
B. +/- Relevant Index
The difference between the fund’s total return and that of the relevant indexis shown, expressed in percentage points, for each historical time period.
C. +/- Objective Group
The difference between the fund’s total return and that of its Objectivegroup is shown, expressed in percentage points, for each historical timeperiod.

USER'S GUIDE 29
D. +/- Peer Group
The difference between the fund’s total return and that of its Peer group isalso shown, expressed in percentage points, for each historical time period.This allows an even deeper analysis of a fund’s relative performance.
E. Percentile Rank Relative to Objective Group
The fund’s performance for each time period is ranked versus its Objectivegroup and expressed as a percentile.
F. Value $10,000 Investment
The current value of $10,000 invested in the fund at the current applicablesales charge at the beginning of the stated time period. These figures assumereinvestment of dividends and capital gains.
G. Estimated Taxes on $10,000 Investment
The tax liability a shareholder would have incurred on capital gains anddividends distributed during the given period of investment, based on anassumed tax rate of 20%. For municipal bond funds, this figure illustrates taxliability for capital-gains payments only. Note that additional taxes mightbe due when fund shares are redeemed.
H. Value $10,000 + $100 per Month
The results of a $10,000 initial investment with subsequent investments of$100 at the end of each month during the entire period.
7) MODERN PORTFOLIO THEORY/STATISTICS
These statistics provide a technical profile of the fund’s historical performance,and since they also indicate its relationship with the broader market, they canbe used to forecast how the fund might perform under various marketenvironments. Value Line calculates all MPT statistics using the prior 36monthly returns.
A. Beta
Beta measures a fund’s sensitivity to market fluctuations; that is, it measureshow far the fund has historically moved relative to similar moves in theindex, discounting the risk-free rate of return of a three-month Treasury bill.For example, if a fund has a beta of 1.00, then it can be expected to move onepercent for every one-percent move in the index. If a fund has a beta of 2.00,it can be expected to move two percent for every one-percent move in theindex.
B. Alpha
Alpha measures a fund’s risk-adjusted performance. That is, it measures afund’s performance taking into account its beta, or sensitivity to the index,and the risk-free rate of return of a three-month Treasury bill. For example,if a fund has a beta of 1.5, it would be expected to gain 15% when the indexgains 10%. If, however, the fund actually gains 20%, this excess returnrepresents the fund’s alpha. Value Line expresses alpha as an annualizedfigure.

C. R-Squared
R-squared measures the correlation between a fund’s performance and thatof the broader market as measured by an appropriate index. In other words,it measures how reliable the fund’s beta is in judging its market sensitivity.For example, if a fund has an R-squared of 100, then it can be expected toperform exactly in line with its beta, based on historical performance. An R-squared of zero, on the other hand, indicates that the fund’s beta measure-ment is irrelevant to its actual performance.
D. Standard Deviation
Standard deviation measures the variability of a fund’s returns. The figureindicates the number of percentage points above or below the fund’saverage annual return within which any given annual return can be ex-pected to fall two-thirds of the time.
8) Sector Weightings
The percentage of assets in each of 10 broad equity-market sectors. Althoughfor specialized funds it may seem irrelevant to indicate sector breakdown,most specialized portfolios diversify to some degree. As much as 50% of assetscould be invested outside their respective focus sectors.
9) Statistics
This section provides four useful measures for analyzing a fund’s investmentstyle: price/earnings, price/book, trailing five-year earnings growth, andmarket capitalization. These are described in detail below.
The figures are derived by computing the dollar-weighted average of thefund’s underlying equity holdings. A weighted average provides the bestindication of how a fund can be expected to behave in regard to these measures.Because the statistics are not always available or meaningful for all of a fund’sunderlying holdings, the “percentage of stocks” column indicates the percent-age of the fund’s equity holdings for which statistics were available.
A. Price / Earnings (P/E) Ratio
The price of a stock divided by its annual earnings per share. Value Linelists a fund’s dollar-weighted average trailing P/E ratio, using currentprices and reported earnings from the latest year.
B. Price / Book (P/B) Ratio
A ratio of the price of a stock to its company’s book value per share. Stocksof companies that are older, slower-growing, or depressed in pricebecause of poor current earnings performance generally sell at low P/Bvalue. Value Line shows the dollar-weighted average P/B of the fund’sunderlying holdings.
C. Five-Year Earnings Growth
The trailing five-year average annual earnings-per-share growth of allstocks currently held by the fund. This figure offers insight into the fundmanagement’s emphasis on the historical earnings-growth record of itsindividual holdings.
USER'S GUIDE 31
D. Weighted-Average Market Capitalization
Market capitalization is the value of a corporation as measured bymultiplying the number of common shares outstanding by the currentmarket price of a share.
The figure used by Value Line weights the market capitalization of eachof the fund’s equity holdings according to the amount the fund hasinvested in each, resulting in an accurate measure of how the fund’sportfolio can be expected to behave from a market capitalization stand-point. For example, if a fund invests in three companies with marketcapitalizations of $10 billion, $2 billion, and $100 million, and has 90% ofits assets in the largest, with 10% equally split between the other two, itsweighted average market capitalization is $8.3 billion, as opposed to amedian figure of only $2 billion.
The Management Style Box (Section 8) uses the market-capitalizationfigure to indicate the fund’s bias toward small or large companies.
The reviews of bond funds have been consolidated into this format because ofthe similarities between many offerings. As such, we believe the informationwe have provided help investors to differentiate between offerings, thushelping you make better decisions. As with our equity coverage, bond fundsare broken into Objective Groups and, where appropriate, Peer Groups.
The components of the abbreviated bond pages are similar to those on the full-page equity reviews, with bond-specific information substituted for items thatrelate more to equity offerings.
1) NAME/ADDRESS
The name of the fund and the fund family’s contact information.
2) OBJECTIVE GROUP
Taxable Fixed Income — 6 objective groups
Corporate-High Yield (CH) - Invests specifically in lower-rated corpo-rate bonds in pursuit of high current income. Some have secondaryobjective of growth.
Corporate-High Quality (CG) - Invests in corporate fixed-income secu-rities in pursuit of current income.
Diversified Bond (DB) - Invests in a mix of corporate and governmentfixed-income securities in pursuit of current income.
Government (GS) - Invests at least 75% of assets in U.S. Government andagency securities.
Government-Mortgage (GM) - Invests at least 75% of assets in mort-gage-backed securities such as GNMA, FNMA, and FHLMC issues.
International Bond (IB) - Invests in foreign and U.S. bonds or exclusivelyin foreign fixed-income securities in pursuit of current income.
Tax-Free Fixed Income — 4 objective groups
Muni California (MC) - Invests at least 75% of assets in municipal
FIXED INCOME FUNDS

securities in pursuit of income that is exempt from both federal andCalifornia state income taxes.
Muni National (MB) - Invests at least 75% of assets in municipalsecurities in pursuit of income that is exempt from federal incometaxes.
Muni New York (MY) - Invests at least 75% of assets in municipalsecurities in pursuit of income that is exempt from both federal andNew York state income taxes.
Muni Single State (MS) - Invests at least 75% of assets in municipalsecurities in pursuit of income that is exempt from federal and specificstate income taxes.
DELAWARE NATL HIGH YLD MUNI A1818 Market St, Philadelphia, PA 19103 800 362-3863
Muni National/HY3
(Average)
3(Average Risk)
4.9%Div Yield: 5.4%SEC Yield: 4.94Max. Load: 3.75%Max. 12b-1 Fee: 0.25%1st Yr. Red. Fee: NoneMin. Initial Invest: $1,000Min. Subsequent Invest: $100Min. IRA Invest: N/ATelephone Exchanges: YesTel. Redemption: YesSyst. Withdrawal: YesAuto. Investing: YesLast Capital Gain: 11/23/98Fiscal Year End: JuneBegan Operations: 9/22/86Port. Mgr: Mitchell L. Conery 5/97Port. Mgr: Patrick P. Coyne 5/97Net Assets ($Mil.): 68.1
PERFORMANCE (3/31/02)Value Est. Taxes Value
Total +/- % +/- % Percentile +/- % $10,000 on $10,000 $10,000Return LEH MUNI Obj. Rank Obj. Peer Investment Investment +$100/Mo.
3 MONTHS 0.9 -0.1 0.2 32 0.3 9,708 - 9,9006 MONTHS 1.0 0.6 1.1 6 1.1 9,716 - 10,1991 YEAR 4.1 0.3 1.2 11 1.2 10,020 - 11,0913 YEAR 2.6 -2.5 -0.6 78 1.4 10,399 - 14,0055 YEAR 4.9 -1.6 0.2 50 1.1 12,214 5 18,48310 YEAR 6.4 -0.4 1.0 13 1.1 17,947 42 32,998
As of 12/31/01
Bond 99 Stock -Pfd. - Convts. -Cash 1 Other -Fgn. - Hedged -
As of 12/31/01
AAA - BBB -AA - BB&Below 100%A - NonRated -
Avg Quality Less Than BBB
As of 12/31/01 Port. Avg.Avg. Duration 7.0 YrsAvg. Maturity 12.7 YrsAvg. Coupon -%
Fund Obj.Beta 0.76 0.93Alpha -2.2 -1.8R2 72 96Std. Dev. 3.50 4.03
The fund seeks a high level of current income, ex-empt from federal income tax, by investing at least65% of net assets in medium- and lower-grademunicipal obligations. Although management may ad-just the portfolio’s maturity as it believes is necessary,the fund’s maturity tends to range from 10 to 25years. Employing a bottom-up approach, the co-managers evaluate securities for credit worthiness, callpotential, and yield potential over their possible aver-age lives. Management will not typically allocate over25% to any one sector. It will maintain a Ba/BB-equivalency as a floor for selection, while keeping theportfolio’s average credit quality at Baa/BBB.
OVERALL RANK RISK RANK 5-YR RETURN
(Annualized)
INV. OBJECTIVE
SHAREHOLDER INFORMATION
COMPOSITION % QUALITY STATISTICS MPT vs. LEH AGI
1
5
3
2
4
6
7
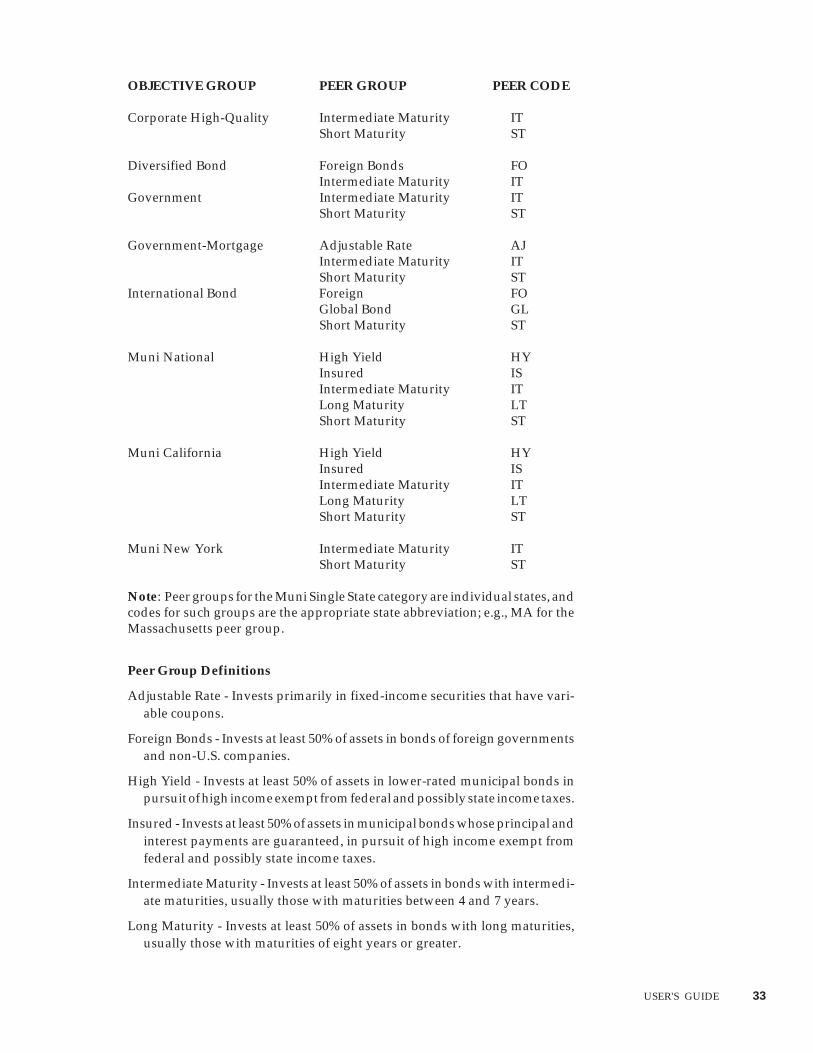
USER'S GUIDE 33
OBJECTIVE GROUP PEER GROUP PEER CODE
Corporate High-Quality Intermediate Maturity ITShort Maturity ST
Diversified Bond Foreign Bonds FOIntermediate Maturity IT
Government Intermediate Maturity ITShort Maturity ST
Government-Mortgage Adjustable Rate AJIntermediate Maturity ITShort Maturity ST
International Bond Foreign FOGlobal Bond GLShort Maturity ST
Muni National High Yield HYInsured ISIntermediate Maturity ITLong Maturity LTShort Maturity ST
Muni California High Yield HYInsured ISIntermediate Maturity ITLong Maturity LTShort Maturity ST
Muni New York Intermediate Maturity ITShort Maturity ST
Note: Peer groups for the Muni Single State category are individual states, andcodes for such groups are the appropriate state abbreviation; e.g., MA for theMassachusetts peer group.
Peer Group Definitions
Adjustable Rate - Invests primarily in fixed-income securities that have vari-able coupons.
Foreign Bonds - Invests at least 50% of assets in bonds of foreign governmentsand non-U.S. companies.
High Yield - Invests at least 50% of assets in lower-rated municipal bonds inpursuit of high income exempt from federal and possibly state income taxes.
Insured - Invests at least 50% of assets in municipal bonds whose principal andinterest payments are guaranteed, in pursuit of high income exempt fromfederal and possibly state income taxes.
Intermediate Maturity - Invests at least 50% of assets in bonds with intermedi-ate maturities, usually those with maturities between 4 and 7 years.
Long Maturity - Invests at least 50% of assets in bonds with long maturities,usually those with maturities of eight years or greater.
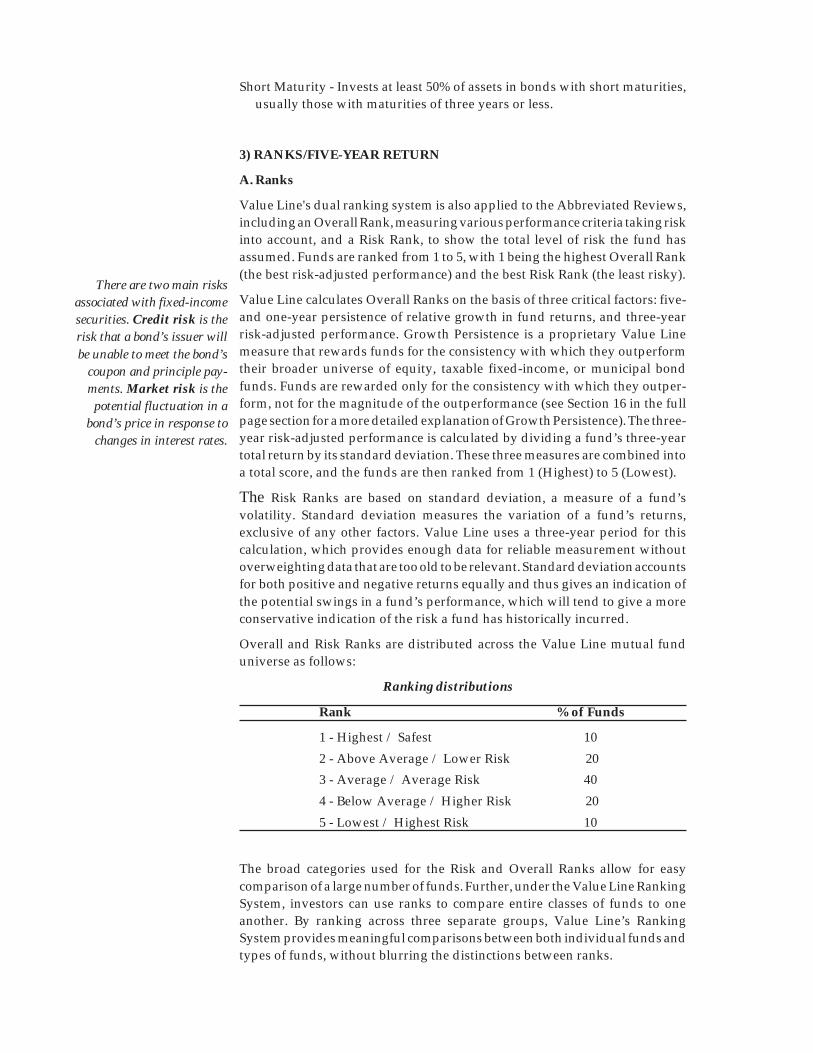
Short Maturity - Invests at least 50% of assets in bonds with short maturities,usually those with maturities of three years or less.
3) RANKS/FIVE-YEAR RETURN
A. Ranks
Value Line's dual ranking system is also applied to the Abbreviated Reviews,including an Overall Rank, measuring various performance criteria taking riskinto account, and a Risk Rank, to show the total level of risk the fund hasassumed. Funds are ranked from 1 to 5, with 1 being the highest Overall Rank(the best risk-adjusted performance) and the best Risk Rank (the least risky).
Value Line calculates Overall Ranks on the basis of three critical factors: five-and one-year persistence of relative growth in fund returns, and three-yearrisk-adjusted performance. Growth Persistence is a proprietary Value Linemeasure that rewards funds for the consistency with which they outperformtheir broader universe of equity, taxable fixed-income, or municipal bondfunds. Funds are rewarded only for the consistency with which they outper-form, not for the magnitude of the outperformance (see Section 16 in the fullpage section for a more detailed explanation of Growth Persistence). The three-year risk-adjusted performance is calculated by dividing a fund’s three-yeartotal return by its standard deviation. These three measures are combined intoa total score, and the funds are then ranked from 1 (Highest) to 5 (Lowest).
The Risk Ranks are based on standard deviation, a measure of a fund’svolatility. Standard deviation measures the variation of a fund’s returns,exclusive of any other factors. Value Line uses a three-year period for thiscalculation, which provides enough data for reliable measurement withoutoverweighting data that are too old to be relevant. Standard deviation accountsfor both positive and negative returns equally and thus gives an indication ofthe potential swings in a fund’s performance, which will tend to give a moreconservative indication of the risk a fund has historically incurred.
Overall and Risk Ranks are distributed across the Value Line mutual funduniverse as follows:
Ranking distributions
Rank % of Funds
1 - Highest / Safest 10
2 - Above Average / Lower Risk 20
3 - Average / Average Risk 40
4 - Below Average / Higher Risk 20
5 - Lowest / Highest Risk 10
The broad categories used for the Risk and Overall Ranks allow for easycomparison of a large number of funds. Further, under the Value Line RankingSystem, investors can use ranks to compare entire classes of funds to oneanother. By ranking across three separate groups, Value Line’s RankingSystem provides meaningful comparisons between both individual funds andtypes of funds, without blurring the distinctions between ranks.
There are two main risksassociated with fixed-incomesecurities. Credit risk is therisk that a bond’s issuer willbe unable to meet the bond’s
coupon and principle pay-ments. Market risk is the
potential fluctuation in abond’s price in response to
changes in interest rates.

USER'S GUIDE 35
B. Five-Year Return
Value Line uses an annualized figure, rather than a total percentage, for mostof its return figures, including five-year return. This measure is the annualreturn that, compounded over five years, will equal the total return that thefund produced over the last five years. For example, a fund that has gained 50%over the last five years will show an annual return of 8.3%, not 10% as some maybelieve.
4) MAGEMENT STYLE
This section authored by Value Line’s analyst team, details management’sgoals, processes and investment requirements/restrictions.
5) EXPENSES/FUND INFORMATION/YIELDS
A. Management Fee
The annual percentage of fund assets paid to the fund’s investment manageras compensation for managing the fund.
B. 12b-1 Fee
Many mutual funds charge a “distribution fee” in order to help paypromotional and distribution costs. By law, annual 12b-1 fees may notexceed 1% of total net assets.
C. Redemption Fee
Redemption charges are normally highest during the first year, and typi-cally decline by one percentage point per year thereafter, so that investorsholding shares long enough pay no fee at all. A small number of fundscharge a simple flat redemption fee, usually 1% or less, designed to discour-age market timers. Often these lower, flat fees are only in effect for one yearor less following the initial purchase.
D.Sales Load
A charge levied on initial purchases of shares used to pay a commission tothe selling broker. Sales loads are typically graded based on the amount ofmoney invested: the greater the amount invested, the lower the percentagecharge on the purchase.
E. Other Data
Reading a prospectus in its entirety is essential before making any investment,but we have highlighted some important characteristics:
1) Minimum initial, subsequent and IRA investment requirements.
2) Exchange and withdrawal privileges.
3) Fiscal year-end.
4) Portfolio manager.
The name of each Fund Manager and the year the manager or managers begantheir tenure are provided for all funds. The length of time a manager has beenwith a fund increases or decreases the relevance of the fund’s historicalperformance.

5) Last capital gain.
6) Fund inception date.
7) Dividend Yield and SEC Yield.
As bond-fund investors usually require income from their fund, we provideboth the fund’s dividend and SEC yields. A fund’s dividend yield is the total ofits income received from investments and paid to its shareholders over thetrailing 12 months, expressed as a percentage of the year-end price of thesecurity. Value Line calculates yield by dividing the total dividends paid eachyear by the sum of the fund’s offer price (NAV).
SEC yield, a yield calculation created by the Securities and Exchange Commis-sion to standardize yield quotes, is provided only for bond funds. Thiscalculation utilizes the fund’s net investment income over the last 30 days, buteliminates income derived from such sources as capital gains and optionswriting. The formula uses the fund’s offer price at the end of the 30-day period,accounts for all fund expenses during this period, and also adjusts income frompremium or discounted bonds to reflect the amortization of said bonds.
6) PERFORMANCE
In this section, all performance figures expressed in dollar terms reflect anyapplicable front-end sales charge; all figures expressed in percentages do not.
A. Total Return
The fund’s total returns over various periods are shown in this column.Results for periods longer than one year are expressed as average annual-ized returns.
B. +/- Relevant Index
For comparative purposes, the difference between the fund’s total returnand that of the relevant index is shown, expressed in percentage points, foreach historical time period.
C. +/- Objective Group
The difference between the fund’s total return and that of its Objectivegroup is shown, expressed in percentage points, for each historical timeperiod.
D. +/- Peer Group
The difference between the fund’s total return and that of its Peer group isalso shown, expressed in percentage points, for each historical time period.
E. Percentile Rank Relative to Objective Group
The fund’s performance for each time period is ranked versus its Objectivegroup and expressed as a percentile. For example, a fund with a percentilerank of 1 for a given time period performed in the top one percent of itsObjective group for that time period. Conversely, a fund with a percentilerank of 100 for a given time period performed in the bottom one percent ofits Objective group for that time period.
A fund’s yield is the incomereceived from its investments,
either in the form of interestpayments from bonds or divi-dend payments from equities,
and paid to its shareholders asdividends. Yield is expressed as
a percentage of the purchaseprice of the fund.

USER'S GUIDE 37
F. Value $10,000 Investment
The current value of $10,000 invested in the fund at the current applicablesales charge at the beginning of the stated time period. These figures assumereinvestment of dividends and capital gains.
G. Estimated Taxes on $10,000 Investment
The tax liability a shareholder would have incurred on capital gains anddividends distributed during the given period of investment, based on anassumed tax rate of 20%. For municipal bond funds, this figure illustrates taxliability for capital-gains payments only. Note that additional taxes mightbe due when fund shares are redeemed.
H. Value $10,000 + $100 per Month
The results of a $10,000 initial investment with subsequent investments of$100 at the end of each month during the entire period. This provides arelevant illustration of dollar-cost averaging; since volatile funds some-times see their performance amplified under such a program, these resultsshould be considered carefully by investors contemplating such a program.See Part II for a more detailed explanation of this strategy.
7) COMPOSITION/QUALITY/STATISTICS/MODERN PORTFOLIOTHEORY
Composition
Percentage of the fund’s assets invested in common stocks, preferred stocks,bonds, convertible securities, other asset categories, and cash. Also shown isthe percentage of the fund’s assets invested in foreign securities, and thepercentage of assets hedged back to the U.S. dollar.
Quality
The percentage of the fund’s assets invested in each of six credit-quality levelsis shown, along with the average quality of the fund’s fixed-income holdings.The ratings listed correspond to those used by Standard & Poor’s ratingservice.
Although fixed-income investments tend to be more stable than equities, thereare risks involved that investors must be aware of before buying a bond fund.One is credit risk, which can be assessed by examining a fund’s credit-qualitybreakdown and average credit quality. This measures the likelihood that abond’s issuers will be able to meet the coupon and principal payments. A ratingof AAA, the highest quality, is reserved for the financially strongest corporateissuers. U.S. Government-backed securities are also considered to be ratedAAA. Issues rated BBB or higher are generally regarded as investment-gradesecurities, indicating that the bond holder can expect with a fair degree ofcertainty that the bond’s payments will be made. Issues rated below BBB areknown as high-yield or “junk” bonds, because their issuers are not as finan-cially secure and there is a greater chance that payment obligations will not bemet. In return for higher credit risk, lower-rated bonds offer a higher couponyield (the dividends paid out as interest expressed as a percentage of a bond’spar value).
Another risk associated with fixed-income securities is interest-rate or marketrisk. Because the interest or dividend payments on a fixed-income security areset for the life of the security, the market price of the security will fluctuate inresponse to changes in interest rates. For example, if interest rates increase,then the price of a bond will fall, because its fixed payments will be lower thanthose of another bond being issued at current, higher rates. Generally, thelonger the remaining maturity of a bond, the more sensitive it will be tointerest-rate fluctuations. (A widely-used measure of a bond’s interest-ratesensitivity is duration, explained in detail below in the Statistics section.)Another component of a bond that determines its rate sensitivity is its coupon.Generally, a bond with a higher coupon will be less vulnerable to interest-ratefluctuations, because its high payments will still be relatively attractive in theface of higher rates. The 30-year Treasury bond is used as a benchmark forinterest rates, since its maturity is the longest among such securities commonlyavailable, and, having relatively low coupon payments because of its guaran-teed status, it is most sensitive to interest-rate fluctuations.
Statistics
This section provides three useful measures for analyzing a bond fund’smarket risk: modified duration, average maturity, and average coupon. Thesefigures reflect the dollar-weighted average of the fund’s underlying fixed-income holdings as reported to Value Line by the funds. The statistics aredescribed below:
a. Average Duration
A bond’s duration is a comprehensive measure of its price sensitivity tointerest-rate fluctuations. Duration takes into account the two opposingfactors of a bond: its price sensitivity as a result of the time until itsmaturity, and the value of reinvesting its interim coupon payments atvarying market interest rates. For example, falling interest rates willincrease a bond’s price but lessen the value of reinvested coupon pay-ments, because reinvestments must now be made at lower interest rates.On the other hand, rising interest rates will lower a bond’s price butincrease the value of reinvested coupon payments, because they can beinvested at higher current interest rates. The point in time in the bond’slife when these two opposing factors exactly offset each other is thebond’s duration. Consequently, the fund’s maturity, as well as its couponrate, directly affect its actual price sensitivity. A zero-coupon bond, forinstance, has a duration equal to its maturity, since it pays no interimincome, while a bond with a coupon rate that is higher than the prevailingmarket rate will have a duration considerably less than its maturity.
In essence, duration provides a more complete measure of interest-ratesensitivity than maturity because it accounts for the time value of abond’s interim coupon payments as well as its final principal repayment.The longer a bond’s duration, the more its price will fluctuate wheninterest rates move. As a rule of thumb, the duration indicates the numberof percentage points a price of a bond can be expected to gain or lose foreach one-percent change in interest rates.
Modified duration takes into account the fact that, though the durationmeasure produces a direct (straight) relationship between interest ratesand bond prices, in reality this relationship is not a straight line; in the
Duration functions much likebeta for equities in that it mea-
sures a bond’s pricesensitivity to interest-ratechanges. That is, a bond’s
duration indicates how far thebond’s price may move in reac-
tion to a one-percentchange in interest rates.
USER'S GUIDE 39
case of more dramatic interest-rate moves (more than 100 basis points),prices will tend to rise more when rates fall than prices will fall when ratesrise the same amount.
b. Average Maturity
A fund’s average maturity is the dollar-weighted average of the maturi-ties of its fixed-income holdings. Maturity represents the date on whicha bond’s principal is due to be repaid. In general, longer-maturity bondsare more sensitive to interest-rate changes because they have longerdurations.
c. Average Coupon
A fund’s average coupon is the dollar-weighted average of the couponrates of its underlying fixed-income securities. Like maturity, a bond’scoupon rate is a partial measure of its interest-rate sensitivity; higher-coupon bonds are less price sensitive because their higher paymentsremain relatively attractive in the face of rising interest rates.
The remaining page elements apply predominantly to equity and mixed-equity funds, except where noted.
d) MODERN PORTFOLIO THEORY (MPT)
MPT statistics are useful in quantifying a fund’s risk and reward and thecorrelation between its performance and the performance of the broadermarket as measured by the S&P 500 Index for equity funds, the LehmanBrothers Aggregate Bond Index for taxable bond funds, and the LehmanBrothers Municipal Bond Index for tax-free bond funds. These statisticsprovide a technical profile of the fund’s historical performance. Value Linecalculates all MPT statistics using the prior 36 monthly returns.
A. Beta
Beta measures a fund’s sensitivity to market fluctuations; that is, it measureshow far the fund has historically moved relative to similar moves in theindex, discounting the risk-free rate of return of a three-month Treasury bill.For example, if a fund has a beta of 1.00, then it can be expected to move onepercent for every one-percent move in the index. If a fund has a beta of 2.00,it can be expected to move two percent for every one-percent move in theindex.
B. Alpha
Alpha measures a fund’s risk-adjusted performance. That is, it measures afund’s performance taking into account its beta, or sensitivity to the index,and the risk-free rate of return of a three-month Treasury bill. For example,if a fund has a beta of 1.5, it would be expected to gain 15% when the indexgains 10%. If, however, the fund actually gains 20%, this excess returnrepresents the fund’s alpha. Value Line expresses alpha as an annualizedfigure.
C. R-Squared
R-squared measures the correlation between a fund’s performance and thatof the broader market as measured by an appropriate index. In other words,

it measures how reliable the fund’s beta is in judging its market sensitivity.For example, if a fund has an R-squared of 100, then it can be expected toperform exactly in line with its beta, based on historical performance. An R-squared of zero, on the other hand, indicates that the fund’s beta measure-ment is irrelevant to its actual performance.
D. Standard Deviation
Standard deviation measures the variability of a fund’s returns. The figureindicates the number of percentage points above or below the fund’saverage annual return within which any given annual return can be ex-pected to fall two-thirds of the time. For example, if a fund has an averageannual return of 10% and an annual standard deviation of 10, then two-thirds of the time the fund’s annual return can be expected to fall between0% and 20%. Value Line calculates a fund’s standard deviation usingmonthly performance data for the trailing three years, but expresses theresult on a more-relevant annual basis. Standard deviation is also used incalculating the fund’s Risk Rank (see Section 2, page 12, above, for a detailedexplanation of the Value Line ranks.)

USER'S GUIDE 41
PART II
Investing inMutual Funds
A fund essentially represents a pool of investors who combine their money andcollectively hire professional management to make investment decisions.Legally, it is a corporation, or trust, whose sole purpose is the investment of itsshareholders’ assets. Investments are spread over a variety of securities(equity, fixed-income, or a combination of the two) and are managed in pursuitof specific, predetermined investment objectives. Unlike a stock, which has afixed number of shares, most mutual funds stand ready to issue and redeemshares continuously. This feature gives the fund “open end” status. Thus,individuals can make investments and withdrawals easily.
Mutual funds are very tightly regulated by the U.S. government. Theseregulations provide more investor safeguards than for any other type ofinvestment. As a result, the mutual fund industry has built a solid reputationthat has helped to fuel its phenomenal growth.
Popular in England more than 100 years ago, the first mutual funds beganoperating in the United States in the 1920s. Currently, there are well over10,000 mutual funds that are publicly offered in the United States. Bond andmoney market funds currently account for about 50% of total mutual fundassets, with equity-oriented funds comprising the other 50%.
Most mutual funds offer a wide variety of shareholder services that facilitatepurchasing and redeeming shares and tracking investments. Several of theseservices are predicated on linking the investor’s bank account with a fundaccount. Automatic Investing is one such service; it enables an investor tomake single or periodic purchases of fund shares using preauthorized bankdrafts drawn against his or her personal checking or savings account. Anothersuch service is Telephone Redemption, through which an investor can liqui-date shares by phone and have the proceeds mailed in the form of a check ordeposited automatically in his or her bank account.
A third popular service is Automatic Dividend Reinvestment. Under thisprogram, investors purchase additional shares whenever income and capitalgains distributions are paid by the fund. With such reinvestment the initialmutual fund investment compounds over time.
Retirement Plans, including IRAs, Keoghs, and 401(k)s, are offered by mostmajor mutual fund companies as another popular service. As a redemption orretirement program, an investor can initiate a Systematic Withdrawal Plan toredeem a number of shares or withdraw a specified sum of money each monthor quarter to provide steady income.
Understanding the forces that drive the performance of mutual funds is aprerequisite to investing wisely in them. For equity funds, the performance ofthe stock market is paramount. The price of stocks, of course, is influenced asmuch by investors’ perceptions as by such quantifiable factors as earnings anddividend growth or the vagaries of the economy.
HOW FUNDS WORK
SPECIAL SERVICES
FACTORS INFLUENCINGFUND PERFORMANCE

USER'S GUIDE 43
Within subsets of the equity universe, factors influencing performance varywidely. For specialty or so-called sector funds, the performance and economicfundamentals underlying the particular sector(s) in which the fund invests arecritical. For international funds, currency exchange rates can have a profoundeffect on a portfolio’s performance: A rising dollar will depress the value of afund’s foreign investments in U.S.-dollar terms, while a falling dollar can resultin a windfall to an international fund investor. Some international fundsemploy hedging strategies to reduce currency risk.
Bond-fund investors must be aware of two major factors that drive theperformance of bonds: interest rates and credit quality. As interest rates rise,bond prices fall, and vice versa. The share prices of bond funds holding longer-maturity issues tend to rise and fall more sharply as interest rates change, whilethose with shorter maturities tend to be less volatile. Similarly, bond fundsholding issues of higher credit quality tend to be less sensitive to changes in theeconomy than those holding lower-quality bonds.
The purpose of financial planning is to build and preserve wealth. Investing isonly one part of an overall financial plan. Other aspects include insurancecoverage, tax planning, retirement planning, and estate planning. Investingencompasses all means by which one accumulates assets, and in investmentplanning one must consider all asset categories: a home or other real estate,tangibles such as collectibles or gold and jewelry, the cash value of anyinsurance policies, social security benefits and the value of other retirementplans, savings accounts, and traditional financial investments such as stocks,bonds, and mutual funds. Factors that will affect an investment programinclude one’s family situation, age, tax status, income requirements, andspecific financial goals.
In the sections that follow, we will provide a framework for individuals tobegin building an overall financial strategy and investment plan, focusing onmutual funds that are appropriate for implementing such a plan.
Before an investor can consider long-term financial goals, it is essential that heor she establish minimal protection against financial emergency. Most finan-cial planners recommend keeping an adequate cash reserve in highly safe,liquid investments, such as a savings account or money market fund. (Al-though most investments can be converted to cash, doing so on short noticecould result in losses.) The amount of money to set aside varies according toindividual circumstances; a rule of thumb is six months’ living expenses.
Once adequate reserves are established, an investor needs to consider and planfor specific goals. For a young couple these may include marriage, children, orpurchasing a home. Couples with children may wish to prepare for collegeexpenses. Older couples or individuals will want to prepare for retirement. Inrealizing any of these goals, mutual fund accumulation plans are especiallyhelpful, since they encourage regular, disciplined saving. Though individuals’situations and life experiences vary, most investors’ lifetimes can be dividedinto four broad phases: early years, family years, pre-retirement, and retire-ment. Below we provide general descriptions of each stage. We recommendthat each investor consider how his or her situation relates to these and begin
DEVELOPING AFINANCIAL PLAN
Different risks are involvedwith investment in differentasset classes, and should beconsidered before making aninvestment decision.
IDENTIFYING GOALS

USING VALUE LINETO ASSEMBLE
A FUND PORTFOLIO
to formulate financial goals in as broad a context as possible.
The early years encompass the period from when an individual starts his or herfirst job until marriage and family responsibilities and expenses begin to domi-nate. Many young people fail to recognize the importance of saving during thisperiod because there are so many short-term pleasures to be pursued and desiresto be satisfied. Reasonable goals during this period might include saving topurchase a car or home or to start a family. Young people often incur low livingexpenses and, in the case of many couples, benefit from two incomes. Most haveno major responsibilities. These circumstances are ideal for beginning a serious,long-term investment program. Perhaps most important is the very long timehorizon of young investors, so that even small, regular investments have anexcellent opportunity to grow significantly. Young individuals and couples alsocan afford to assume above-average risk, since they have ample time to recoupany temporary losses.
During the years in which one’s family is growing, other financial concernsoften take precedence over regular saving and investing. Supporting a com-fortable lifestyle for a spouse and children, protecting the family should anincome earner die or become disabled, and preparing for the children’s collegecosts are important during this period. Because time still is on the side of theinvestor during these high-expense years, it is important to continue to saveand invest regularly, even in small amounts. Building retirement assets throughan IRA or pension plan is also very important at this time. As long as adequatecash reserves are maintained, investors can afford to take above-average risksduring these years—particularly with retirement-plan assets—in pursuit oflong-term growth.
The pre-retirement period is critically important for consolidating retirementgoals. For many “empty nesters” the mortgage is paid, and family income is ata peak. Now is a good time to accumulate additional financial resources forretirement. As retirement nears, however, there is less time to make up forinvestment losses. Accordingly, individuals in this phase need to graduallyreduce their risk exposure.
To a large degree, foresight and diligence during the first three phases of one’sinvestment “life” lead to financial independence in retirement—the finalphase. During retirement, the overriding concern is income, since the payoutsfrom a pension plan and social security are substantially less, in most instances,than the income earned from employment. Conservative, income-producinginvestments are highly appropriate at this stage since losses can directly impactone’s standard of living, and there is little time to recoup any losses. For thosewho are wealthy beyond what they require to maintain a comfortable standardof living, estate planning is an important consideration. Trusts can protect thevalue of an estate from taxes while preserving the individual’s control overinvestment decisions.
The Value Line Mutual Fund Survey can be a vital tool in developing andmaintaining a portfolio of mutual funds. Once investors have determined theirfinancial goals, it is time to focus on identifying the kinds of funds that will helpto realize those goals. This selection process begins by evaluating risk and byunderstanding how to control it.
At each stage in a person’slife, he or she will have
varying investment needs,and an investment portfolio
should evolve over time tomeet these changing needs.

USER'S GUIDE 45
Value Line recognizes that the evaluation of any investment begins with anassessment of risk. Investors must consider their tolerance for risk and weighit against the desire to achieve a specific financial goal. Identifying risk, whichcan be defined as the uncertainty of achieving a desired return, is difficult. Aninvestor seeking a higher return must be willing to tolerate a higher level of riskin order to have a chance of achieving that desired return. By contrast, someonewilling to accept a lower rate of return has a higher probability of achieving hisor her objective. A key aspect to evaluating risk is the investor’s time horizon.Investors with long horizons can afford to assume a higher level of risk, sincethere is a greater chance that, over time, the investment will pay off. Investorswith shorter horizons should choose lower- risk investments, since they maynot be able to wait out a period of weak investment performance.
There are two types of risk: market risk and unique risk. Market risk is thedegree to which a security’s behavior is related to the overall behavior of themarket. If a stock fund behaves in a fashion similar to the overall stock market,it is said to have a high degree of market risk. If the market declines, there is astrong likelihood that the fund’s value will decline as well. Unique riskpertains only to a particular security. It is independent of changes in the stockmarket. For a bond, credit risk is unique risk, since a bond’s credit rating issolely a function of the issuer’s financial condition. In assessing the level of riskthat is acceptable, investors must consider their investment portfolio in itsentirety and understand that the risk of certain types of investments can bereduced, even significantly, through diversification.
Asset allocation, at its simplest, means diversification of financial investmentsamong stocks, bonds, and cash. At a more sophisticated level, asset allocationinvolves trying to squeeze the greatest potential return out of a given level ofrisk. Given a choice between assets, an investor stands to realize the greatestreturn by choosing, to the exclusion of all others, the asset expected to performbest. Diversification automatically dilutes the potential return. But becausesome assets typically rise when others fall, it is possible to diversify amongasset classes in such a way as to lower the potential risk by a greater amountthan one has lowered the potential return. This concept of portfolio optimiza-tion captures the essence of what all investors are trying to accomplish: gettingthe highest potential return within the limits of acceptable risk.
Differences of opinion abound concerning how to determine the percentage ofassets that should be invested in stocks, bonds, and cash, respectively. Perhapsthe simplest rule of thumb is this: The percentage of assets in bonds and cashcombined should equal the investor’s age. The remainder should be in commonstocks. This oversimplification is intended only to illustrate the conventionalwisdom: A young investor seeks growth, primarily through stocks, while anolder investor requires stability and the income generated by a larger percentageof assets in bonds and cash. Clearly, individual preferences and circumstancesmust be the determining factors in making asset allocation decisions.
Investors seeking guidance in building a diversified portfolio will find a helpfulform in Part III of this Subscriber's Guide. The “Investor Profile Questionnaire”poses a series of questions intended to identify the investor’s appropriate levelof risk, based on his or her individual circumstances. Completing the worksheet
Diversification enables aninvestor to lower overall riskby offsetting the potentialrisks associated with eachspecific asset class.
EVALUATING RISK
CONTROLLING RISKTHROUGH OPTIMIZATION
DETERMINING THEPORTFOLIO MIX

results in assignment to one of nine investor profiles. Each profile includessample recommendations for the percentage of assets in one’s portfolio thatshould be invested in each of 10 asset classes (an asset class is a group of securitieswith similar performance and risk characteristics, such as small-capitalizationgrowth stocks). These asset classes encompass various types of domestic andinternational stocks and bonds, and also correspond to specific peer and sub-peer groups defined in Part 1, section 1. B on page 7.
By varying exposure to different asset classes, investors can create and modifytheir portfolios to obtain the exact risk/reward profile that meets their financialgoals. However, readers should note that the investor profiles contain onlysample recommendations, and these should be modified to account for eachinvestor’s particular circumstances and preferences.
For some people, selecting individual funds is the most difficult aspect ofmutual fund investing. But for those who approach investing in a diligent andthorough manner—first evaluating their circumstances and goals, then assess-ing risk tolerance, and finally determining desirable portfolio allocations—thefinal step of selecting funds is far less difficult. The reason is simple: Investorstoo impatient to make an adequate assessment of their overall financialposition will unwittingly try to make up for this deficiency in their fundselections. If they can simply find the “perfect” fund, then they assume thatother considerations won’t matter. The problem, of course, is that the definitionof a perfect fund is subjective; it depends on the goals and profile of eachindividual. Therefore, investors who have a clear picture of their goals willalways find it far easier to identify appropriate funds.
We recommend that once investors have identified appropriate fund catego-ries, they begin by using the Value Line Mutual Fund Ranking System tonarrow the field. Since investment always begins with risk, investors shouldfirst look at funds whose Risk Ranks meet their criteria, then focus on thosewith the highest Overall Rank. At that point more detailed research is requiredto make the final selections. We suggest taking into consideration a combina-tion of factors, including a fund’s long-term track record, consistency ofmanagement, and the reputation and the organization of the fund family.Although different traits are desirable in different situations, most investorswill do well to emphasize consistency of returns as the framework of highlyranked funds.
Once funds have been selected, a disciplined, regular investment program isan ideal way to build wealth. Dollar-cost averaging, one of the most widelyused systematic investment programs, involves investing a fixed sum ofmoney at regular intervals, regardless of how the market is performing. Withdollar-cost averaging an investor will purchase more shares at lower pricesand fewer shares at higher prices. The result is a lower average cost per share.The following example illustrates how dollar-cost averaging works.
Assumption: John Q. Investor has $10,000 to invest. He chooses the aggressiveGo-Go Growth Fund. He is concerned, however, that if the market is near a tophe could suffer substantial near-term losses, so he decides that instead ofinvesting a lump sum, he will invest $2,000 each quarter over the next five
The Value Line MutualFund Ranking System
provides investors with auseful starting point in the
process of selecting amutual fund investment.
CHOOSINGINDIVIDUAL FUNDS
DOLLAR-COSTAVERAGING

USER'S GUIDE 47
quarters. His results are shown below.
Go-Go Fund Amount Shares TotalShare Price Invested Purchased Value
Quarter 1 $ 10 $ 2,000 200 $ 2,000
Quarter 2 $ 11 $ 2,000 181.8 $ 4,200
Quarter 3 $ 7 $ 2,000 285.7 $ 4,673
Quarter 4 $ 8 $ 2,000 250 $ 7,340
Quarter 5 $ 11 $ 2,000 181.8 $12,092
Average Go-Go Fund Share Price $9.40
Average Share Price Paid by Investor $9.096
Go-Go Fund Total Return +10.0%
Total Return for Investor +20.9%
As shown in the above example, market declines can actually benefit theinvestor who dollar-cost averages. However, considerable fortitude is re-quired to maintain this strategy in the face of market declines.
Mutual fund shares are sold in two ways: directly or through a sales force.Those sold directly usually carry no sales charge and are known as “no-load”funds. Those sold through a sales force usually charge a commission or load.Load funds can be further subdivided into two groups: those charging a front-end load and those charging a back-end load.
A “front-end” load results in a deduction from the initial investment. By law,no fund may charge a front-end load of more than 8.5%. Such loads average 5%for stock funds and about 4% for bond funds. A back-end load (also known asa contingent deferred sales charge) applies if shares are redeemed within acertain period of time, usually five years. Such charges decline over time. Forexample, a back-end load may start at 5% during the first year and decline byone percentage point each year, so that the charge is eliminated after five years.Back-end loads often are accompanied by 12b-1 fees.
Named for the SEC Rule that authorizes them, 12b-1 fees are charged yearly,ostensibly to help promote the fund, thereby increasing its assets and loweringexpenses. In reality, the fee has become part of the overall sales-chargestructure of many load funds.
Mutual fund sales charges are regulated and cannot exceed specified amounts.These rules vary depending on certain fund circumstances, but in no case (asindicated above) may a front-end load exceed 8.5%. The ceiling on 12b-1 fees is0.75%, with an additional 0.25% service fee permitted for funds offering certainshareholder services. Excluding funds that charge only a front-end load, mutualfund sales charges may not exceed 7.25% over the life of an investment.
Dollar-cost averaging enablesan investor to increasepotential returns from morevolatile investments.
LOAD FEES AND EXPENSES

In order to accommodate the greatest number of potential investors, manyfunds offer separate classes of shares, each carrying different load structures.The most common convention is to classify shares offered with a front-end loadas “Class A shares,” and shares with a back-end load as “Class B shares.”
In some cases, shares purchased with a back-end load “convert” to the shareclass corresponding to purchases made with a front-end load after a certainperiod of time (generally six to eight years after purchase). The benefit of this“conversion” feature is that once the back-end shares convert, the 12b-1 fee isreduced or even eliminated.
A fund’s performance figures and NAVs will be different for different shareclasses. The Value Line Mutual Fund Survey generally provides data for theoldest share class; or, if the share classes began at the same time, the class withthe greater net assets is shown.
Created and run usually by discount brokerages—sometimes those which areaffiliates or subsidiaries of mutual fund companies—fund supermarkets si-multaneously offer for purchase a large number of funds, numbering from thehundreds to the thousands, from a variety of fund companies. They alsoinclude the benefit of consolidated statements and record-keeping, which canbe difficult if one owns many funds from different fund families, and hencereceives paperwork from multiple fund companies.
Investors should be careful when buying funds through a fund supermarket.Such supermarkets are part of brokerage houses, and brokers often chargetheir own transaction fees to process orders to purchase mutual fund shares;hence, buying a load fund through a fund supermarket, for which a brokercharges a transaction fee, can be particularly expensive. However, many fundsupermarkets offer funds for which they do not charge transaction fees—known as “NTF” funds—which are often no-load funds as well. Yet even forno transaction fee, no-load funds, fund supermarkets are still compensated fortheir services by the funds themselves. In addition, the broker may also chargean annual fee for maintaining a customer’s account.
If a load fund offers more than one share class, which one should an investorchoose? The answer depends on a number of factors, including the specificsales, redemption, and 12b-1 charges, the redemption fee schedule for theback-end load shares, and whether (and, if so, when) back-end shares convertto front-end shares. Although it may be tempting to believe that the back-endload arrangement is always preferable (since there will be no sales charge if theshares are held to the conversion date), in reality the back-end shares are oftenmore expensive in the long run, since the ongoing 12b-1 fees are so muchhigher.
By law, a fund’s prospectus must provide a hypothetical example of theexpenses incurred for each share class over a period of time. By comparing therelative expenses and fees and taking into consideration how long the investorplans to hold the shares, he or she can determine the appropriate share class topurchase.
CHOOSING THE RIGHTCLASS OF SHARES
FUNDS OFFERINGMULTIPLE SHARE CLASSES
FUND SUPERMARKETS
USER'S GUIDE 49
The question of differences in performance of load and no-load funds has beenstudied and argued over decades. Most analyses have shown little or nodifference in performance, while some recent studies have indicated a slightadvantage for load funds. It is argued that this advantage is a result of betterresearch and management at load groups. More likely, however, it is becauseload fund families tend to have larger individual funds because of extensivesales efforts and, therefore, lower average expenses. The argument is of littleconsequence, in any event, since any advantage enjoyed by load funds isusually eliminated once sales charges are deducted.
The important question is not whether load funds outperform no-load fundsbut rather what a sales load buys an investor. The answer in most cases is thata load pays for advice from a financial planner or broker on such matters aswhich funds to own, when to buy, when to sell, and how to plan for taxes. Aninvestor should evaluate his or her need for such services before decidingwhether to invest in load or no-load funds.
Mutual fund expenses are measured as a ratio of operating expenses to averagenet assets. Such expenses include a fund’s administrative and managementcosts but exclude portfolio transaction costs. Annual expenses typically rangebetween 1.0% and 2% for stock funds and from 0.5% to 1.0% percent for bondfunds. However, these expenses can range from zero (with managementabsorbing them) to 5% or more for very small funds.
Expenses always impact a fund’s performance, since they are deducted fromshare values. For equity funds, the impact is generally less significant, sinceinvestment decisions are usually the major determinant of performance, andthere is sufficient opportunity for profitable investment decisions to dwarf theeffect of expenses. But for bond funds, whose returns fall within a narrowerrange, expenses can make a substantial difference. Bond fund expenses are ofparticular concern to investors seeking income, since the expenses are takenfirst from income and thereby reduce a fund’s yield.
Several factors may make selling a fund appropriate. A change in managementmay be a reason to sell. In situations where management has changed it isimportant, however, to assess the likelihood that the fund will continue in thesame manner as in the past. Such an evaluation begins with determiningwhether the fund was managed by a group or by an individual, how muchautonomy management is given, and the degree to which investment decisionsare prescribed by the fund’s prospectus or other internal charters, systems, ormethods. In some respects fund management systems can be compared tothose adopted in preparing meals at restaurants. At one eatery, a star chefcooks up specialties each night according to his or her whims, while at another,series of recipes are rigorously followed night after night. Clearly, at the formera change in chefs is a major event (whether good or bad), while at the latter itdoesn’t matter much who is cooking from night to night—as long as the cheffollows the recipes carefully.
If a fund’s performance deteriorates over several quarters, investors shouldconsider selling in favor of another fund that shows better results. If thisappears to be the case, it is of critical importance to make a fair and accurate
Expenses are of particularimportance to fixed-incomeinvestors, since they directlyaffect a fund’s relativeperformance over time.
LOAD VERSUS NO-LOAD:PERFORMANCEAND SERVICES
IMPACT OF EXPENSES
WHEN TO SELL A FUND

assessment of what constitutes poor performance. Investors who buy a fundbecause of the way it claims to invest should first consider whether or not thefund is doing what it said it was going to do. If the fund is following its charter,the investor must approach the sell decision from a different angle, questioninginstead the viability of the investment concept itself.
It is not always poor performance that should prompt an astute investor to sella fund. Investors who purchase a fund for a specific purpose should always sellwhen the fund is no longer satisfying that aim. To illustrate, consider funds thatspecialize in small-capitalization equities. Virtually all small-cap funds werelaggards during the mid-1980s. A less sophisticated investor in a weak small-company fund might have sold in favor of a better performer. By contrast, amore sophisticated investor might have taken exactly the opposite tack, sellinga stronger performing small-company fund, knowing that its strength resultedfrom its failure to maintain its small-cap style.
Investors should always sell a fund when their own goals have changed. Thisis easy to overlook, especially if a fund is performing well.
1. Buying last year’s top performer. At any given time there are funds thathave posted phenomenal results. Unfortunately for the legions of inves-tors who chase them, the same aggressive or specialty techniques thatrocketed the fund to the top one year can lead to dizzying declines thenext. As was the case for the slow-but-steady tortoise that beat the hare,a fund that performs consistently and lands in the top half of its group yearin and year out will undoubtedly rise to the top 10% of all funds over adecade or longer. Again, the investor should purchase funds solely on thebasis of how they contribute to his or her long-term financial goals.
2. Acting on hunches. Unless you have an uncanny knack for calling markettrends, you are better off developing a consistent, disciplined approachand sticking to it. The most enduring trait of a successful money manageris discipline and consistency.
3. Selling too soon. Many investors fail to understand the style with whichtheir fund is managed. When that style goes out of favor for several years,performance will suffer, but it will also rebound when the style returns tofavor. Many investors wind up selling a fund right before its performanceimproves, in favor of a fund whose relative performance is about to turnweak. One should sell, of course, if the fund is doing badly because it is notsticking to any discernible style.
4. Owning too many stock funds. A diversified portfolio of stock funds is agood idea. But investors who own dozens of stock funds run the risk ofoverdiversifying. Investors who want a portfolio that behaves like themarket should save themselves a lot of trouble and buy a low-cost indexfund.
The most important factorin the decision to sell
a fund is whetherit continues to meet
the individualinvestor’s needs.
FOUR COMMONMISTAKES
USER'S GUIDE 51
PART III
Investor ProfileQuestionnaire

For many investors, determining risk tolerance levels and investment timeframes is the most difficult component of the asset allocation process.
The following worksheet is designed to assist you in identifying your invest-ment profile.
For the results of this survey to be meaningful, you must respond to everyquestion.
For each of the following groups of three statements, check the box next tothe number of the statement that most closely reflects your financial situa-tion and/or investment philosophy:
(Questions A through C refer to your investment philosophy.)
A. ❑ 1) “One can’t be too careful.”
❑ 2) “When in doubt, err on the side of caution.”
❑ 3) “Nothing ventured, nothing gained.”
B. ❑ 1) “Put safety first. Stick with risk-free investments.”
❑ 2) “Don’t put all your eggs in just a few baskets. Diversification isvery important.”
❑ 3) “Go with your strong suit. Emphasize your strengths. Put mostof your money into your best investment ideas.”
C. ❑ 1) “Live for today. The future will take care of itself.”
❑ 2) “I need to begin thinking about the future.”
❑ 3) “If you save for a rainy day, you’ll never get wet. Plan for theseemingly distant future today.”
(Questions D through J refer to your own investments.)
D. ❑ 1) Receiving income on a regular basis is more important thangrowth of principal.
❑ 2) Both income and growth are equally important.
❑ 3) Growth is more important than current income.
E. ❑ 1) I usually stick to the most conservative investments.
❑ 2) Most of my investments are conservative, but I like to have a fewaggressive investments in order to achieve some growth.
❑ 3) Most of my money is invested for long-term growth.
VALUE LINEMUTUAL FUND SURVEY
INVESTOR PROFILEQUESTIONNAIRE
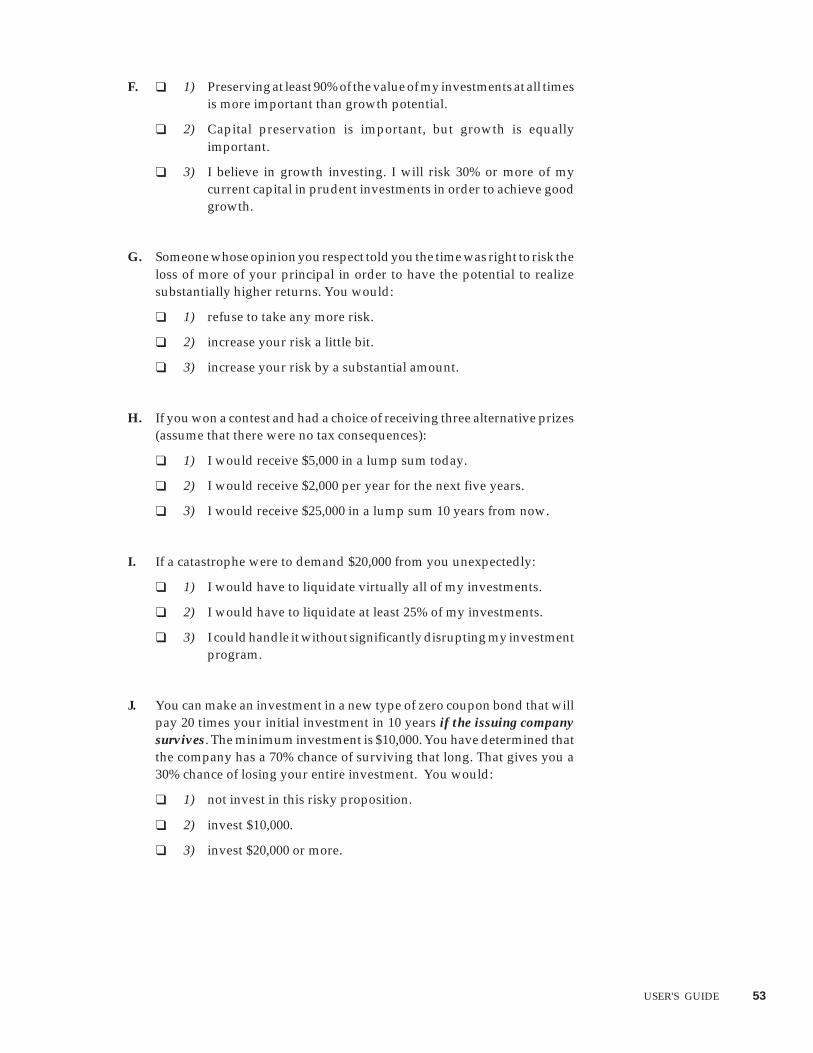
USER'S GUIDE 53
F. ❑ 1) Preserving at least 90% of the value of my investments at all timesis more important than growth potential.
❑ 2) Capital preservation is important, but growth is equallyimportant.
❑ 3) I believe in growth investing. I will risk 30% or more of mycurrent capital in prudent investments in order to achieve goodgrowth.
G. Someone whose opinion you respect told you the time was right to risk theloss of more of your principal in order to have the potential to realizesubstantially higher returns. You would:
❑ 1) refuse to take any more risk.
❑ 2) increase your risk a little bit.
❑ 3) increase your risk by a substantial amount.
H. If you won a contest and had a choice of receiving three alternative prizes(assume that there were no tax consequences):
❑ 1) I would receive $5,000 in a lump sum today.
❑ 2) I would receive $2,000 per year for the next five years.
❑ 3) I would receive $25,000 in a lump sum 10 years from now.
I. If a catastrophe were to demand $20,000 from you unexpectedly:
❑ 1) I would have to liquidate virtually all of my investments.
❑ 2) I would have to liquidate at least 25% of my investments.
❑ 3) I could handle it without significantly disrupting my investmentprogram.
J. You can make an investment in a new type of zero coupon bond that willpay 20 times your initial investment in 10 years if the issuing companysurvives. The minimum investment is $10,000. You have determined thatthe company has a 70% chance of surviving that long. That gives you a30% chance of losing your entire investment. You would:
❑ 1) not invest in this risky proposition.
❑ 2) invest $10,000.
❑ 3) invest $20,000 or more.

(Questions K through O refer to your current personal situation.)
K. ❑ 1) I have no dependent children now, and my future plans call forhaving no new dependent children in my lifetime.
❑ 2) I have at least one dependent child between 13 and 23 years ofage, but I have no children younger than 13, nor do I expect toadd to my family in the future.
❑ 3) I either have at least one child who is less than 13 years old, or Iexpect to be starting a family sometime in the future.
L. ❑ 1) I have no plans to buy a new house, or small business for the restof my life.
❑ 2) I currently own my own home, but plan to buy either a largerhome, a second home, or a small business within the next 10years.
❑ 3) I am not currently a homeowner, but I do plan to own a home, orsmall business sometime at least 10 years into the future.
M. ❑ 1) The principal earner in my family is retired, or very close to hisor her probable retirement age.
❑ 2) The principal earner in my family has between five and 15 yearsleft before he or she reaches retirement age.
❑ 3) The principal earner in my family has more than 15 years leftuntil retirement.
N. ❑ 1) Leaving a substantial inheritance is not important to me.
❑ 2) Leaving a substantial inheritance is important, but not at theexpense of my current life style.
❑ 3) Leaving a substantial inheritance is very important to me.
O. ❑ 1) I am not interested in providing for my funeral expenses.
❑ 2) Other things being equal, it would be nice to provide for myfuneral expenses before I die.
❑ 3) It is extremely important to provide for all expenses relating tomy funeral.
To calculate your investment profile, follow these simple steps:
1. Using the table that follows, add the numeric values (1, 2, or 3) of youranswers to Questions A, B, E, F, G, I, J, and M. To this total, add the valuesof your responses to E, F, I, and M.

USER'S GUIDE 55
QUESTION RESPONSE (1, 2 or 3):
A. __________
B. __________
E. __________
E. __________
F. __________
F. __________
G. __________
I. __________
I. __________
J. __________
M. __________
M. __________
TOTAL __________
2. If your total score is:a) between 12 and 17, your risk posture is conservative.b) between 18 and 24, your risk posture is moderate.
c) above 25, your risk posture is aggressive.
3. Now, add the numeric values (1, 2, or 3) of your answers to questions C,D, E, F, H, K, L, N, and O. To that total, add the values of your responsesto D, H, K, and L. Finally, add 2 more points if your answer to J was 2or 3.
QUESTION RESPONSE (1, 2 or 3):
C. __________
D. __________
D. __________
E. __________
F. __________
H. __________
H. __________
J. __________
K. __________
K. __________
L. __________
L. __________
N. __________
O. __________
TOTAL __________
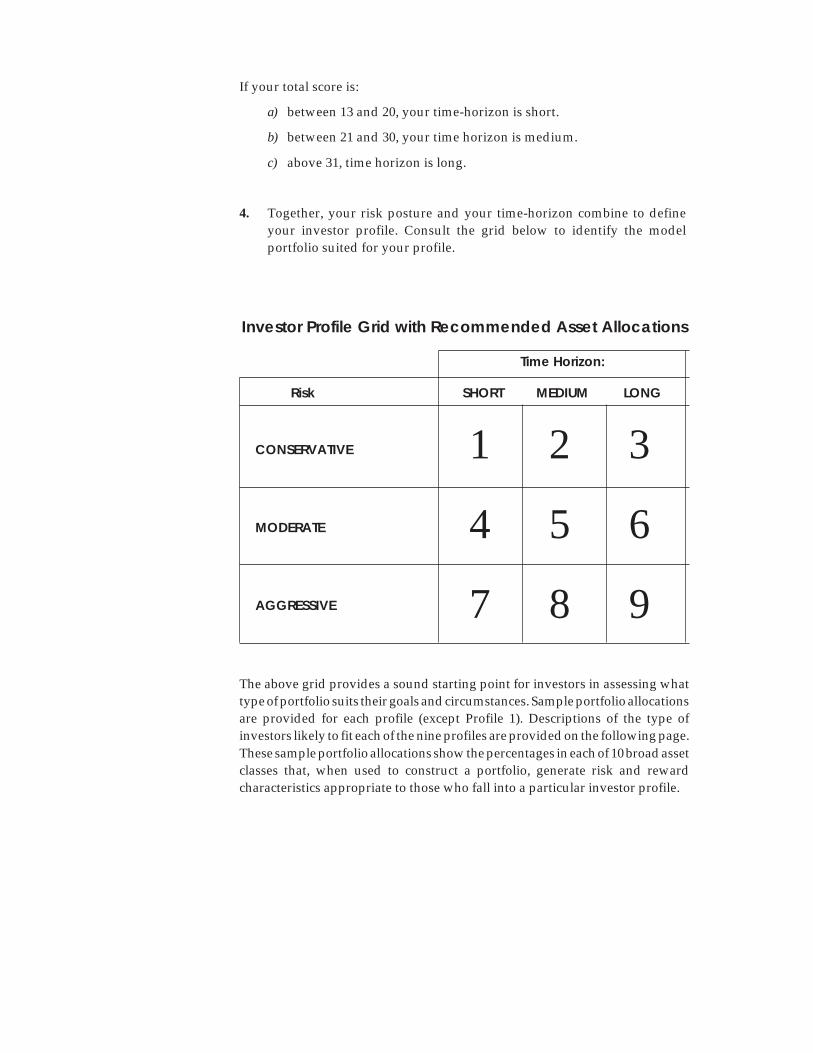
Investor Profile Grid with Recommended Asset Allocations
Time Horizon:
Risk SHORT MEDIUM LONG
CONSERVATIVE
MODERATE
AGGRESSIVE
The above grid provides a sound starting point for investors in assessing whattype of portfolio suits their goals and circumstances. Sample portfolio allocationsare provided for each profile (except Profile 1). Descriptions of the type ofinvestors likely to fit each of the nine profiles are provided on the following page.These sample portfolio allocations show the percentages in each of 10 broad assetclasses that, when used to construct a portfolio, generate risk and rewardcharacteristics appropriate to those who fall into a particular investor profile.
1 2 3
4 5 6
7 8 9
If your total score is:
a) between 13 and 20, your time-horizon is short.
b) between 21 and 30, your time horizon is medium.
c) above 31, time horizon is long.
4. Together, your risk posture and your time-horizon combine to defineyour investor profile. Consult the grid below to identify the modelportfolio suited for your profile.

USER'S GUIDE 57
General descriptions for the profiles represented by each box of the grid arepresented below. These profiles provide a basic framework for mutual fundinvestment decision-making.
1. Investors represented by Box 1 have a conservative risk posture and shorttime horizon. Typically, such individuals consider themselves to be partof the middle-income group; they are near retirement or already retired;and their current income is limited relative to the expenses and liabilitiesthey anticipate incurring. With little margin for error, they should keep allof their investments in money-market equivalents.
2. These investors have a conservative risk posture and medium timehorizon. Typically, they consider themselves to be middle-income; theyare between five and 20 years from retirement; and they probably are ator close to their peak earning power. Box 2 investors cannot afford to takemany risks, but they recognize that some investment risk is necessary toprovide for the family’s future needs.
3. A conservative risk posture and long time horizon characterize more U.S.investors than any other profile. These individuals typically are middle-income and less than 50 years old, and they believe that they are at leastfive to 10 years away from their peak earning power. Their aversion to riskand their current financial limitations lead them to err on the side ofcaution with their investments. At the same time, they realize that theymust accept some risk if they are to achieve long-term growth of capital.
4. Investors who fit into Box 4 have a moderate risk posture and short timehorizon. Typically, such investors are near retirement or already retired,and they have planned well enough for their financial future to be assuredof meeting their projected expenses and liabilities. These investors needto provide just sufficient principal growth to assure a steady stream ofincome for their retirement years.
5. With a moderate risk posture and medium time horizon, these investorsare typically between five and 20 years from retirement. They are nearingtheir peak earning power, and they have enough of a nest egg to sleepfairly well at night. Through profitable experience, Box 5 investors under-stand that assuming a reasonable amount of investment risk is desirableto achieve the family’s shared goals.
6. The moderate risk posture and long time horizon of these investors arehighly desirable for wealth accumulation. Box 6 investors are doingreasonably well financially at present and expect to be doing as well orbetter for the next 10 to 20 years. Since current needs are not overwhelm-ing, and long-term growth is the number-one priority, stocks are gener-ally the most appropriate investment vehicle for these investors.
7. This box characterizes fewer investors than any other in the grid. Anaggressive risk posture and short time horizon typify older Americanswho have planned their future well. These individuals have more moneynow than they expect their family to need. Since long-term growth is nolonger an issue, those with this profile should invest in enough stocks,bonds, and cash equivalents to ensure continuity of income for the rest oftheir lives.
DESCRIPTIONS OFINVESTOR PROFILES

8. With an aggressive risk posture and a medium time horizon, theseinvestors are typically between 40 and 60 years of age. They have earnedthe security not to be too concerned about their next paycheck, but theynevertheless seek to provide enough growth of capital to take care of allfuture needs that may arise.
9. An aggressive risk posture and a long time horizon are a most desirablecombination. Box 9 investors have successfully taken risks and havereached their current financial situation at a reasonably youthful age. Inview of the fact that long-term growth is their sole priority, stocks areoverwhelmingly their vehicle of choice.
Investors in Boxes 2 through 9 will find their model portfolio allocationsupdated each quarter in the “Mutual Fund Advisor” newsletter. Please notethat these model allocations do not take tax considerations or specific incomeneeds into account. They are intended as a general guide, to assist subscribersto The Value Line Mutual Fund Survey in their decision-making.
Value Line’s asset-allocation models are designed to provide investors with aframework from which to build their own portfolio. There are nine models,each representing a hypothetical investor profile. The profiles are determinedbased on a combination of three investment time horizons and three levels ofrisk tolerance, for a total of nine models.
The model portfolios are shown on the next page, along with an appropriateasset allocation for each. Note that the first portfolio, Box 1, is not shown,because it is for conservative investors with short time horizons, and recom-mends all cash and short-term instruments.
Because asset allocation is generally regarded as a more powerful determinantof a portfolio’s performance than individual security selection, it makes senseto focus at least as much attention on putting together an appropriate and well-thought-out asset mix as it does on choosing the individual investments. Themodels furnished here should provide a good start for investors.
Value Line’s asset-allocation models are based on risk-reward optimizationusing the projected rates of return and covariance of 10 asset classes. Thepercentage allocations shown for each asset class in each model are those that,based on projected returns and past covariance, would provide what ValueLine believes is an optimum blend of risk and return, given each modelinvestor’s circumstances. Investors are encouraged to modify these portfoliosin accordance with their own preferences and circumstances. While no one canmake guarantees as to how a particular portfolio, or even an entire strategy,will perform, we believe the kind of careful, quantitative approach we employin determining these allocations provides a sensible basis for putting togethera diversified portfolio that stands to help an investor achieve his or herinvestment goals.
THE VALUE LINEMODEL PORTFOLIO
METHODOLOGY
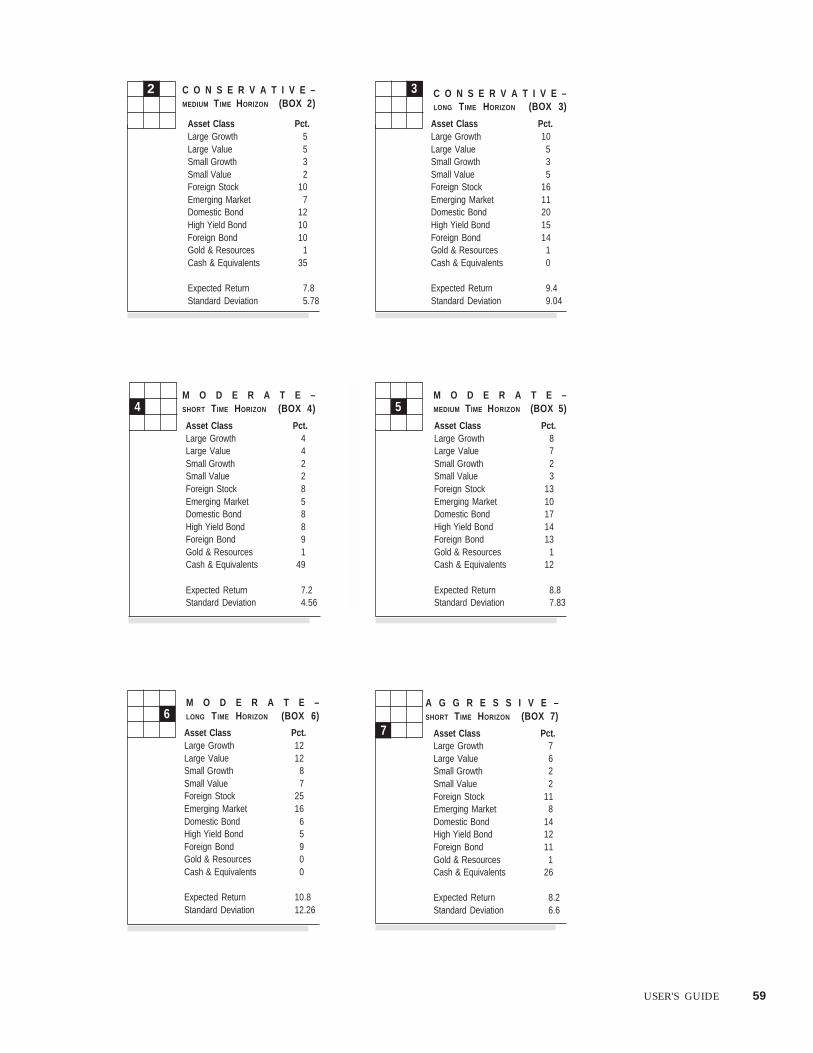
USER'S GUIDE 59
Asset Class Pct.Large Growth 5Large Value 5Small Growth 3Small Value 2Foreign Stock 10Emerging Market 7Domestic Bond 12High Yield Bond 10Foreign Bond 10Gold & Resources 1Cash & Equivalents 35
Expected Return 7.8Standard Deviation 5.78
C O N S E R V A T I V E –MEDIUM TIME HORIZON (BOX 2)
2 C O N S E R V A T I V E –LONG TIME HORIZON (BOX 3)
M O D E R A T E –SHORT TIME HORIZON (BOX 4)4
M O D E R A T E –MEDIUM TIME HORIZON (BOX 5)5
M O D E R A T E –LONG TIME HORIZON (BOX 6)6
A G G R E S S I V E –SHORT TIME HORIZON (BOX 7)
7
Asset Class Pct.Large Growth 4Large Value 4Small Growth 2Small Value 2Foreign Stock 8Emerging Market 5Domestic Bond 8High Yield Bond 8Foreign Bond 9Gold & Resources 1Cash & Equivalents 49
Expected Return 7.2Standard Deviation 4.56
Asset Class Pct.Large Growth 8Large Value 7Small Growth 2Small Value 3Foreign Stock 13Emerging Market 10Domestic Bond 17High Yield Bond 14Foreign Bond 13Gold & Resources 1Cash & Equivalents 12
Expected Return 8.8Standard Deviation 7.83
Asset Class Pct.Large Growth 7Large Value 6Small Growth 2Small Value 2Foreign Stock 11Emerging Market 8Domestic Bond 14High Yield Bond 12Foreign Bond 11Gold & Resources 1Cash & Equivalents 26
Expected Return 8.2Standard Deviation 6.6
3
Asset Class Pct.Large Growth 10Large Value 5Small Growth 3Small Value 5Foreign Stock 16Emerging Market 11Domestic Bond 20High Yield Bond 15Foreign Bond 14Gold & Resources 1Cash & Equivalents 0
Expected Return 9.4Standard Deviation 9.04
Asset Class Pct.Large Growth 12Large Value 12Small Growth 8Small Value 7Foreign Stock 25Emerging Market 16Domestic Bond 6High Yield Bond 5Foreign Bond 9Gold & Resources 0Cash & Equivalents 0
Expected Return 10.8Standard Deviation 12.26

A G G R E S S I V E –MEDIUM TIME HORIZON (BOX 8)
8
A G G R E S S I V E –LONG TIME HORIZON (BOX 9)
9Asset Class Pct.Large Growth 10Large Value 11Small Growth 5Small Value 5Foreign Stock 21Emerging Market 14Domestic Bond 12High Yield Bond 10Foreign Bond 11Gold & Resources 1Cash & Equivalents 0
Expected Return 10.2Standard Deviation 10.83
Asset Class Pct.Large Growth 7Large Value 7Small Growth 18Small Value 14Foreign Stock 33Emerging Market 21Domestic Bond 0High Yield Bond 0Foreign Bond 0Gold & Resources 0Cash & Equivalents 0
Expected Return 12Standard Deviation 15.34

USER'S GUIDE 61
PART IV
Glossary

AAccumulation Plan—An arrangement through which investors make regular purchases of mutual fund
shares, often with automatic reinvestment of dividends and distributions provided.
Adviser—See definition for "Investment Adviser".
Affiliated Company—Under the Investment Company Act, a company in which there is direct orindirect ownership of 5 percent or more of the outstanding voting stock.
Alpha—A measure of risk-adjusted performance. Alpha is calculated over a three-year period andrepresents the difference between the actual return and the return that would be expected basedon the fund’s risk level (beta) and the performance of the broader market (S&P 500). Forexample, if a fund had a beta of 1.5, then it would be expected to gain 15% if the S&P 500 gained10%. If the fund gained 20%, its alpha would be +5, indicating that its performance was fivepercentage points higher than expected. If in the same example the fund gained 10%, its alphawould be -5, indicating that given its level of risk it earned five percentage points less thanexpected. (The actual calculation, for the statistically inclined, uses least squares regression andadjusts for the risk-free rate of return, and is expressed as an annualized figure.) Note that alphais less useful with respect to certain types of funds, such as international, metals, and specialtyfunds. The performance of these funds bears little relationship to the movement of the S&P 500.The lower the relationship between the fund and the S&P (see definition for R-Squared), the lessmeaningful is its alpha.
American Depositary Receipt (ADR)—A receipt, held in a U.S. bank, for shares of a foreign corporation.ADRs entitle holders to all payments of income and capital gains. They allow Americaninvestors to purchase foreign companies’ shares without having to use foreign exchanges.
Annuity—An agreement that provides for regular payments to an individual over a period of time.Annuities are financial products, usually offered by insurance companies to provide incomeduring retirement, that combine insurance with an underlying financial asset, often a mutualfund or a group of mutual funds. Assets in such products usually grow on a tax-advantagedbasis, although payments are taxable as income. However, annuities differ with respect towhether payments are made for a set period of time or for the remainder of the individual’s life;whether payments are for a fixed or variable amount; and whether or not any balance in theaccount is paid to a beneficiary upon individual’s death.
Ask Price—Price at which an asset is offered for sale.
Asset Class—A group of securities with similar performance and risk characteristics; e.g., large-capitalization stocks, emerging-market bonds, etc.
Asset Value Per Share—The market value of a fund’s net resources divided by the number of sharesoutstanding.
BBalanced Fund—An investment company that at all times holds bonds and/or preferred stocks, in
varying ratios to its common stock holdings, in order to maintain relatively greater stability ofcapital and income. Such funds keep at least 25% of their assets in bonds at all times.
Bank Draft Plan—For regular share accumulation, a periodic cash investment made through ashareholder's checking account via bank drafts.
Basis Point—One one-hundredth of 1%, the smallest unit of measure used in quoting yields.

USER'S GUIDE 63
Beta— Statistical measure of a security’s volatility relative to the broader market. For a stock fund, betais measured against the S&P 500, which is deemed to equal 1.00. A beta higher than 1.00 meansthe fund has experienced greater sensitivity to swings in the market, while a beta of less than1.00 means the fund has experienced less sensitivity. For example, a fund with a beta of 1.5 canbe expected to rise (or fall) by 15% for each 10% gain (or loss) in the S&P 500. Note that beta isless useful as a risk measure with respect to certain types of funds, such as international, metals,and specialty funds, whose performance sometimes bears little relationship to the movementof the S&P 500. The relevance of a fund's beta is indicated by its R-Squared value (see definitionfor R-Squared).
Bid Price—In the case of shares of an open-end mutual fund, the price at which the holder may redeemshares. Usually, it is the current net asset value per share.
Blue Chip—The common stock of a large, well-known corporation with a stable record of earnings anddividend payments over a long period.
Blue Sky Laws—Laws of the various states governing the sale of securities, including mutual fundshares, and the activities of brokers and dealers within the particular states.
Bond—A security representing debt; a loan from the bondholder to the issuing entity.
Breakpoint—Dollar-value level of a purchase of mutual fund shares at which the percentage of the salescharge becomes lower. Typically, a sales-charge schedule contains five or six breakpoints.
Broker—A person who effects transactions in securities for the accounts of others and receives acommission for his or her services.
CCall—An option contract giving the holder the right to purchase the underlying security from another
person at a specific price during the term of the option. The duration may be any period of timebut is rarely longer than six months and 10 days. Calls may be used either for speculative orhedging purposes.
Call Price—A term most often used in reference to preferred stocks and debt securities having a fixedclaim. It is the price an issuer must pay in order to retire such securities. The call price oftenexceeds par or liquidating price.
Capital Gains Distribution—Distribution to investment company shareholders of net capital gainsrealized by an investment company on the sale of portfolio securities.
Capital Gains Tax Rates—Under the provisions of the Taxpayer Relief Act of 1997, which took effectin May and July of 1997, capital gains are taxed according to the following criteria:
Assets held 12 months or less: Taxed as ordinary income, at a maximum rate of 39.6%
Assets held more than 12 months: Taxed at a maximum rate of 20%.
Capital Growth—Increase in the market value of an asset, an objective of many investors andinvestment companies.
Cash Equivalents—Securities whose value is easily redeemable into cash, which includes receivablesand short-term U.S. government, municipal, and corporate securities, and commercial paper.
Cash Position—Cash plus cash equivalents, less current liabilities.
Check-Writing Privilege—A service that allows a shareholder to write checks against a mutual fundaccount.

Closed-End Fund—An investment company with a fixed number of shares of common and sometimespreferred stock, which are traded in the securities market.
Closed Fund—A mutual fund that no longer offers shares for sale to the public, usually becausemanagement believes that it cannot effectively manage additional money. Some closed fundswill continue to accept additional investments from existing shareholders.
Collateralized Mortgage Obligation—A mortgage-backed security paying a fixed portion of interest orprincipal at regular intervals. Pools of mortgages are divided into tranches based on maturity.
Common Stock—A security representing ownership in a corporation. The right of common stockhold-ers to dividends, assets, and other distributions is secondary to that of holders of bonds,debentures, and preferred stocks. Common shares usually carry voting rights.
Common Stock Fund—A mutual fund whose portfolio consists mainly of common stocks. Such fundsmay, from time to time, take temporary defensive positions in bonds or cash.
Contingent Deferred Sales Charge—A fee charged on the redemption of mutual fund shares. Such feesare highest during the first year and subsequently decline. Total fees, including 12b-1 charges,may not exceed 7.25 percent over the investment’s life.
Contractual Plan—A type of accumulation plan under which investors agree to follow a specificinvestment schedule. Those who fail to meet their obligation are subject to high fees.
Contrarian—An investor whose strategy is based on doing the opposite of what the majority of investorsare doing at any particular time.
Convertible Securities—Securities that carry the right to be exchanged for a different security of theissuer (usually applies to preferred stocks or bonds that may be exchanged for common stock).
Custodian—An entity, usually a bank, that holds all securities and cash owned by a mutual fund. Thecustodian has no supervisory function with regard to management policies.
Cyclical Stock—The stock of a company whose performance is tied to that of the overall economy.
DDebenture—A debt security backed by the general credit of the issuing corporation.
Defensive Stock—The stock of a company that is expected to do well in adverse market environmentsbecause of the nature of its industry.
Direct Purchase Fund—(see definition for No-Load Fund).
Discount—For a closed-end fund, the percentage below asset value at which the fund’s stock sells. Forconvertible preferred stock, the percentage below conversion value at which the stock sells.
Distributions—Payments of a mutual fund’s net investment income and capital gains to shareholders.
Distributor—The company that sells a mutual fund’s shares to the public.
Diversification—The investment in a number of different securities in such a manner as to reduce theimpact of a decline in any one security.
Diversified Investment Company—Under the Investment Company Act, a fund in which 75 percent oftotal assets is limited to beeing invested no more than five percent of total assets in any singlecompany, and that owns no more than 10 percent of the outstanding voting shares of any issuer.
Dividend—For a mutual fund, a distribution of dividends and interest earned on the fund’s underlyingsecurities.

USER'S GUIDE 65
Dollar-Cost Averaging—A systematic investment method under which investors make regular pur-chases of a fixed dollar amount. This usually results in an average cost per share lower than theaverage price at which purchases were made.
EEducation IRA—Actually an educational savings account created by the Taxpayer Relief act of 1997,
available in 1998. Individuals within certain income limitations may contribute up to $500 peryear on behalf of a child who is still under age 18. Contributions are not tax deductible, butearnings grow tax free, and withdrawals are tax free if made before age 30 and applied toeducational expenses such tuition or room and board. Other types of withdrawals, or anybalance in the account upon the beneficiary reaching age 30, is subject to taxes and penalties.
Equity Security—Securities whose interest in the issuer is ownership, rather than debt. The mostcommon equity security is common stock.
Exchange Privilege—The right to exchange shares of one fund for those of another offered by the samesponsor. For load funds such an exchange incurs no additional sales charges.
Expense Ratio—The proportion of a fund’s total annual operating expenses (excluding brokerage costs)to average net assets.
FFair Value—Under the Investment Company Act, the value determined in good faith by a fund’s
directors for securities for which no market quotation is readily available.
Fixed-Income Security—A debt security or preferred stock with a fixed percentage or dollar incomereturn.
Forward Pricing—The pricing of mutual fund shares for purchase or redemption at the price nextcomputed after a transaction. Most funds price daily.
Front-End Load—A sales commission charged on the initial purchase of fund shares. By law a front-endload may not exceed 8.5 percent of the total investment.
Fund Supermarket—A brokerage firm offering a large number of mutual funds for purchase from avariety of individual fund families.
GGeneral Obligation Bond—A municipal bond issued and backed by a municipality. The debt is serviced
from general revenue.
Glass-Steagall Act of 1933—Federal legislation prohibiting banks from owning brokerage firms or fromengaging in investment banking activities.
Government Agency Issues—(see definition for U.S. Government Securities).
Growth Stock—Stock of a company whose earnings are expected to continue to grow at an above-average rate.
HHedging—The use of securities to offset changes in the value of other securities.
IIncentive Compensation—A fee paid to an investment adviser that is based, wholly or in part, on
performance.
Income—Gross income is the total amount of dividends and interest (excluding capital gains) receivedfrom a mutual fund’s investments before deduction of any expenses. Net income is gross incomeless expenses, fixed charges, and taxes.
Individual Retirement Account (IRA) - A tax-qualified retirement program for individuals, establishedunder the Employee Retirement Income Security Act of 1974. The traditional IRA allowsindividuals who do not participate in an employer-sponsored retirement program to contributeup to $2,000 a year—with such contributions being tax-deductible—whose earnings are nottaxed until withdrawals begin. Individuals who already participate in an employer-sponsoredprogram may still open IRAs if they fall below specific income limits. Withdrawals taken beforethe individual reaches age 59 1/2 may be subject to penalties, and all withdrawals are taxed asordinary income (see definitions for Education IRA and Roth IRA).
Inflation—A rising trend in the general price level of goods and services, resulting in a reduction inpurchasing power.
Investment Advisor—A company whose principal business is to provide portfolio management, andsometimes administrative services, to mutual funds.
Investment Company—A corporation or trust whose sole business is the investment of its shareholders'money in pursuit of specific investment objectives.
Investment Company Act of 1940—A federal statute enacted by Congress in 1940 providing for theregistration and regulation of investment companies, including mutual funds.
Investment Company Amendments Act of 1970—This Act amended the Investment Company Act of1940, establishing revised standards for management fees, sales commissions, and contractual-plan sales charges.
IRA—(see definition for Individual Retirement Account).
JJunior Securities—Common stocks and other securities whose claims to assets and earnings are
secondary to other, senior obligations.
Junk Bond—A lower-rated, and usually higher-yielding, debt security. These issues are usuallyconsidered to be those rated BB or below by Standard & Poor’s Corporation or Ba or below byMoody’s Investor Services. These issues can be highly speculative and volatile.
KKeogh Plan—A tax-qualified retirement plan for self-employed persons and their employees.
USER'S GUIDE 67
LLetter of Intent—An agreement to buy a sufficient number of mutual fund shares, over a set period of
time, to qualify for the reduced selling charge that would apply had the investment been madein a lump sum.
Leverage—The use of borrowed money to increase an investment position. A fund employing leveragewill see its share-price fluctuations magnified.
Liquid—Easily redeemed or converted into cash.
Load—A commission on the price of a mutual fund’s shares generally used to compensate the sellingbroker. See also “Front-End Load” and “Contingent Deferred Sales Charge.”
MManagement Fee—The charge paid by a mutual fund for advisory services and portfolio management.
Management Style—Describes the characteristics of the underlying stocks held by a manager as theyrelate to market capitalization (large-cap versus small-cap) and to growth versus value.
Money Market Fund—A mutual fund whose investments are exclusively in highly liquid, short-termdebt securities, designed to provide current income, liquidity, and preservation of capital.Money market funds fix their net asset value, usually at $1.00 per share.
Mutual Fund—An investment company whose shares can be redeemed at any time at net asset value.Synonymous with open-end fund. See also “Open-End Investment Company.”
NNet Assets—Total assets at market value less liabilities.
No Transaction Fee (NTF)—(see definition for Transaction Fee).
No-Load Fund—A mutual fund whose shares are purchased directly from the fund at no sales charge.
Non-Diversified Investment Company—A fund whose investment portfolio is not anticipated to besufficiently diversified to meet the requirement of the Investment Company Act for qualifica-tion as a diversified investment company. Specialized funds usually must be registered as non-diversified companies so as to allow them to own predominately shares of companies in a singleindustry.
OObjective—The goal of a mutual fund or investor. Common objectives include growth of capital, growth
of income, current income, preservation of capital, or some combination of these aims.
Offering Price—The price at which the buyer may purchase shares from a mutual fund, including anysales charge.
Open-End Investment Company—An investment company whose shares can be redeemed at any timeat net asset value. The term “open-end” refers to the fund’s open, as opposed to fixed, capitalstructure.

Option—A contract to buy or sell a specific security for a predetermined price during the term of thecontract. (See definitions for Call and Put).
PPar Value—The amount determined by the issuer of a security to be the capital represented by that
security. A company that issues a $20 par stock and receives $25 per share allocates $20 to capitaland the remaining $5 to unearned surplus.
Payroll Deduction Plan—An arrangement between an employer and a mutual fund whereby moneyis deducted from an employee’s salary, at his election, and invested in the fund.
Performance History—The value of an investment, usually including all of its income and capital-gainsdistributions, over time. A security performance history is often compared to that of similarsecurities, such as those in the same asset class (see definitions of Asset Class and Total Return).
Portfolio—The securities owned by a mutual fund.
Portfolio Turnover—(see definition for Turnover Ratio).
Preferred Stock—An equity security (usually with a fixed dividend) whose claim to earnings and assetstakes precedence over common stock.
Premium—For a closed-end fund, the percentage above asset value at which the fund’s stock sells. Forconvertible preferred stock, the percentage above conversion value at which the stock sells.
Price/Book Ratio (P/B)— A ratio that compares the average market price of a fund’s stocks with thefund’s average book value. Companies that are older, slower-growing, and/or whose stocks aredepressed in price due to poor current earnings performance, generally sell at low price/bookratios. The figure on each mutual fund page is an average of all the P/Bs in the fund.
Price/Earnings Ratio (P/E)— The price of a stock divided by its earnings per share. This figure may useeither the reported earnings from the latest year (trailing P/E) or an analyst's forecast of nextyear’s earnings (forward P/E). The P/E gives mutual fund investors an idea how much, onaverage, the manager of a particular fund is paying for a company’s earnings power. The higherthe P/E, the more the manager, and subsequently investors, are paying for that potential.Young, fast-growing companies are typically high-P/E stocks with multiples over 20, while lessrisky, older, and more established companies usually sell at lower P/Es.
Prospectus—The document describing the shares and policies of a mutual fund or new security issuewhich, under the Securities Act of 1933, must be supplied to each purchaser.
Proxy Statement—A written power of attorney that allows stockholders to vote their stock if they arenot present at a stockholders meeting.
Prudent Man Rule—The law governing the investment of trust funds in states that provide the trusteewith broad discretion over investment decisions.
Put—An option contract that gives the holder the right to sell a particular security to another person ata specified price during the term of the option, which may be any period of time but is rarelylonger than six months and 10 days. May be used either for speculative or hedging purposes.
RR-Squared— A measure, in percentage terms, of how closely a fund’s performance correlates to the
broader market, as measured by the S&P 500. It is useful in determining a fund’s level of
USER'S GUIDE 69
diversification. An R-squared of 100 means that the fund is exactly as diversified as the S&P 500,and therefore that 100 percent of its performance is attributable to the market (as would be thecase for an index fund). R-squared is measured over a three-year period using monthlyobservations.
Record Date—The date on which a shareholder must be registered on the books of a mutual fund inorder to receive an income or capital-gains distribution.
Redemption in Kind—Redemption of mutual fund shares for which payment is made in securitiesinstead of cash. This is a right retained by many funds but infrequently used.
Redemption Price—The net asset value or “bid” price of a mutual fund. This is the price that a seller ofshares will receive.
Reinvestment Privilege—A service offered by mutual funds whereby income and capital-gains distri-butions may be used to purchase additional full and fractional shares of the fund.
Repurchase Agreement—An agreement under which the buyer acquires ownership of a debt securityand the seller agrees to repurchase the obligation at a mutually agreed upon time and price, thussetting the yield that will be received during the purchaser’s holding period.
Right of Accumulation—A reduction in sales charges effected by counting the aggregate value of all ofan investor’s holdings in a particular sponsor’s funds for the purpose of granting the quantitydiscounts afforded to larger investments.
Rollover—The transfer of assets from one investment to another, usually to avoid a tax liability.
Roth IRA - A new individual retirement account created by the Taxpayer Relief Act of 1997, andavailable in 1998. Unlike a traditional IRA, contributions (also limited to $2,000 per year) arenever tax-deducible. However, earnings are not taxed, and withdrawals are also tax-free if theaccount has been in existence for more than five years. Income limitations are also higher thanwith traditional IRAs. Withdrawals made prior to age 59 1/2 are restricted to specificcircumstances; otherwise penalties may apply.
SSales Load—A commission on the price of a mutual fund’s shares generally used to compensate the
selling broker. See also “Front-End Load” and “Contingent Deferred Sales Charge.”
Senior Securities—Corporate bonds, debentures, notes, or preferred stocks that have the first, or senior,claim to assets and earnings.
Short Sale—The sale of a borrowed security in the hope that the price will subsequently fall, so that thesecurity can be repurchased later at a lower price and returned to the owner.
Special Situation—An investment opportunity where unique circumstances are believed to provide aprofit opportunity.
Specialty Equity Fund—A fund that concentrates on a specific industry group.
Sponsor—Usually refers to the Principal Underwriter (see definition for Underwriter).
Standard Deviation— Shows the degree of variation in a fund’s returns. For example, a fund with astandard deviation of 10 can be expected to produce an annual return that is within 10percentage points (plus or minus) of its average annual return two-thirds of the time. It is auseful measure of a fund’s risk. Value Line measures standard deviation using monthlyobservations, but expresses the result on an annualized basis.
Syndicate—A group of funds that come together to underwrite a new securities offering. After the newsecurity has been sold to the market, the syndicate disbands.
TTotal Return—A statistical measure a security’s performance for a specific period of time (e.g., six
months, one year, 10 years, etc.). Total return is expressed as a percentage gain relative to theinitial value of the investment, and includes both the price appreciation of the security—or fora fund, of the underlying securities—as well as the reinvestment of all capital-gains anddividend distributions. For periods of greater than one year, total return is often expressed onan annualized basis.
Transaction Fee—A fee charged by a broker for purchasing or selling shares of a mutual fund for acustomer. Such fees are separate from and in addition to any fees and expenses charged by themutual fund itself. Some brokers, particularly those that operate fund supermarkets (seedefinition for Fund Supermarket), maintain a list of funds for which they will not chargetransaction fees, known as “NTF” funds.
Treasury Bill—Non-interest-bearing security issued at a discount by the U.S. Treasury to finance thenational debt. Most bills are issued with maturities of three months, six months, or one year.
Turnover Ratio—The degree to which a fund’s portfolio is turned over during the course of a year. Formutual funds, an approximation can be made by dividing the lesser of portfolio purchases orsales by average fund assets.
12b-1 Fee—Fee charged by some funds to pay for distribution costs such as marketing or commissionsto brokers.
UUnderwriter - a firm, specifically an investment bank, that brings a new issue to the securities market.
Underwriters buy the new security from the issuing entity, and then resell it to the market.Sometimes many firms will underwrite an issue, forming a syndicate to place a bid to sell thenew security to the issuer, and then, if successful, reselling the issue to the market (see definitionfor Syndicate). In the case of a syndicate, one or a few underwriters usually take(s) a leadershiprole, finding other banks to join the syndicate, and purchasing more of the security than otherunderwriters—and hence accepting more risk if the entire issue cannot be sold.
Unrealized Appreciation or Depreciation—The paper gain or loss on a fund’s investments. Once sold,these gains are realized and must be distributed to shareholders.
U.S. Government Securities—Marketable debt securities issued by the U.S. Treasury, which consist ofbills, notes, and bonds, or by U.S. Government Agencies. Treasury securities are directobligations of the U.S. Government and differ mainly in the length of their maturity. Both directand Agency obligations are backed by the full faith and credit of the United States Government.
VVolatility—The rate at which a security moves up or down in price.

USER'S GUIDE 71
WWarrant—An option to buy a specified number of shares of stock at a specified price. The warrant may
be valid for a set period of time or indefinitely.
Withdrawal Plan—Arrangement whereby mutual fund investors can receive automatic monthly orquarterly redemption payments of a predesignated amount.
YYankee Bond—A U.S.-dollar-denominated foreign bond that is issued and registered in the U.S.
Yield—Income received from investments, expressed as a percentage of the price of the security. ValueLine calculates yield by dividing the total dividends paid over the past 12 months by the sumof the fund's offer price plus any capital gains paid during the 12-month period.
Yield to Maturity—Rate of return on a debt security held to maturity, including the effect of interestpayments and capital gain or loss.
ZZero-Coupon Bond—A debt security that is sold at a deep discount from face value and that does not
pay interest. At maturity, the bond is redeemed at face value. Investors are taxed each year asif the rise in value were income.
USER'S GUIDE 73
VALUE LINEChampion of the
Informed InvestorIn 1931, the Great Depression was causing a crisis of confidence amonginvestors. In New York, a young analyst named Arnold Bernhard quietly setabout developing a system that would help restore the confidence of individu-als in the stock market. His dream was to provide the average investor withaccess to the same information that professionals had at their fingertips, at aprice affordable to the investing public. Arnold Bernhard’s vision grew intoone of the most enduring and trusted institutions in the financial world: ValueLine. The Value Line Investment Survey is today perhaps the largest stock marketinformation service in the world.
Now, individuals are participating in both the stock and bond markets inrecord numbers through investments in mutual funds. Today’s uncertaininterest-rate environment, changing banking industry, corporate restructurings,increasingly global economy, and concerns about the security of retirementincome (including Social Security) have again prompted many individuals toquestion the viability of their long-term investment strategies. Today’s inves-tor wants to know:
• How vulnerable are common stocks and mutual funds to another majormarket downturn?
• Does the individual have a chance to succeed in a market so heavilyinfluenced by institutional trading?
• Will bond funds provide adequate income over the long term?
Value Line recognizes the need for accessible, reliable data to help investorsmake sound decisions among a vast array of choices—this time in mutualfunds. Backed by the strength of Value Line’s experienced research staff andits strong tradition of service to the individual investor, Value Line introducedin 1993 The Value Line Mutual Fund Survey to provide high-quality, comprehen-sive, accurate analyses of mutual funds at an affordable price.
Value Line employs one of the world’s largest independent research staffs andpublishes one of the world’s most widely used investment publications —TheValue Line Investment Survey. The company’s businesses are broad-based,including financial periodicals and electronic data services, a family of no-loadmutual funds, and asset management for retirement and endowment ac-counts. Following is a review of Value Line’s services:
SERVING THE INVESTOR’SCHANGING NEEDS
FINANCIALINFORMATIONAND INVESTMENTMANAGEMENT

The Value Line Investment Survey is the company’s flagship publication.Published weekly, it covers some 1,700 companies in 94 industries and reachesan estimated half-million readers. This publication features the Value LineTimeliness™ Ranking System, which projects a stock’s likely price performanceover the next six to 12 months. The Value Line Investment Survey has been citedfrequently by outside researchers for the outstanding performance of its top-ranked stocks.
The Value Line Investment Survey—Small and Mid-Cap Edition more thandoubles the coverage of the standard Value Line Investment Survey. Introducedin March 1995, it covers 1,800 mostly small-cap stocks in weekly editions,providing most of Value Line’s proven statistical measures. The Small andMid-Cap Edition uses a modified Ranking System: Performance Ranks areassigned to each stock, based on the familiar scale of 1 through 5 (1 being theHighest). In place of analysts’ commentaries and performance estimates in thestandard service, the Small and Mid-Cap Edition presents a more detaileddescription of each company.
The Value Line Mutual Fund Survey applies the proven, trusted Value Lineformat, research discipline, and analysis to more than 2,000 individual stock andbond funds. Introduced in 1993, this biweekly publication provides the mostextensive data available to mutual fund investors. It consists of two elements:
• “Ratings & Reports,” with full-page profiles on over 700 equity funds, abbre-viated coverage on over 500 bond funds, and semiannual coverage of 100leading fund families.
• “Performance & Index,” with advice, commentary, and insight on currentMutual Fund and investment trends, and updated performance statistics onall 2,000 funds in the Value Line universe.
The Value Line No-Load Fund Advisor, a monthly newsletter, addresses needsof investors who wish to manage their own portfolios of no- and low-loadfunds. Each issue features strategies for maximizing total return, with specialattention given to tax considerations. Also featured are model portfolios for arange of investor profiles, information about retirement planning, industrynews, and listings (with descriptions) of new funds worthy of further consid-eration. The publication provides a full statistical review, including latestperformance, rankings, and sector weightings on 600 leading no- and low-loadfunds.
The Value Line Special Situations Service focuses on smaller-capitalization,potentially high-growth companies (usually traded over-the-counter). Issuedsemimonthly, this publication is especially appropriate for aggressive inves-tors. The performance record of its recommended stocks has frequently beencited among the best of investment publications.
The Value Line Daily Options Survey reviews more than 80,000 optionscontracts four times each month, ranking each for probable future perfor-mance. Both its low-risk recommendations (principally covered call-writing)and its high-risk strategies have consistently recorded outstanding perfor-mance results.
The Value Line Convertibles Survey covers 585 convertible securities (bothbonds and preferred stocks) and 70 warrants. Issued four times each month,the convertibles service is highly regarded in the industry.
INVESTMENTPUBLICATIONS

USER'S GUIDE 75
The Value Line 600. This monthly service contains full-page reports on morethan 600 stocks. Its reports provide information about mostly actively traded,larger capitalization issues. Introduced in 1996, it has been very popularamong investors who want the same type of analysis provided in The Value LineInvestment Survey, but who don’t want or need coverage of the approximately1,700 companies contained in that publication.
All of the reports included in The Value Line 600 are reprinted from the weeklyValue Line Investment Survey and include our estimates and forecasts. Readersalso receive supplemental reports as well as a monthly Index, which includesupdated statistics.
Value Line Select recommends one stock per month for inclusion in subscrib-ers’ investment portfolios. The stocks chosen have favorable risk/rewardratios, as judged by Value Line’s senior research staff, though the level of riskis sometimes greater than average. Each initial report devotes as much spaceas necessary to analyzing the company, its competitive position, future pros-pects, and risks related to the business and the stock, as a basis for therecommendation. Supplementary reports are issued as needed to keep sub-scribers immediately abreast of the companies’ performances and of any otherdevelopments that may alter the investment merits of the shares. These reportsinclude specific recommendations, in the form of Buy, Hold, and Sell pro-nouncements.
Value Line Insight is a 12-page monthly newsletter that focuses on Value Line’sstrengths in equity and mutual fund research. This service begins by inter-viewing top investment professionals from the mutual fund industry to findwhat they are doing, how they do it, and why. This information is thencompared to the views and opinions of Value Line’s in-house research staff,providing our readers independent and objective insight into what the profes-sionals are doing, and thinking.
Value Line IndustryWatch is a 12-page monthly newsletter that brings to-gether two powerful, proprietary Value Line tools into one-easy-to-use format.First, Value Line analysts examine over 90 industries to determine which arelikely to be the top performers, and which the worst. From here, our analystsselect stocks that receive high scores in Value Line’s TimelinessTM RankingSystem. Thus, we highlight the best stocks in the best industries so our readerscan focus their investment efforts.
Value Line Investment Survey for Windows®. This powerful software serviceprovides unprecedented analytical capabilities. These include powerful sort-ing, filtering, graphing and reporting capabilities on individual commonstocks, industry groups, or portfolios.
The core database is the 1,700 stocks covered by The Value Line InvestmentSurvey®, with an expanded version providing information on over 5,000stocks. The software includes over 200 data items for screening groups ofstocks. The service is available on CD-ROM for IBM-compatible PCs, withmonthly database updates and weekly updates available via on-line down-loads.
This new electronic presentation of the flagship Value Line Investment Survey®
ELECTRONICDATA SERVICES

VALUE LINEMUTUAL FUNDS
is unique, with analytics that are substantially more sophisticated than any-thing that is currently available. We anticipate that both current subscribers tothe print publication and others not now subscribing to our services will greetthis Windows®-based program with great enthusiasm.
Value Line Mutual Fund Survey for Windows®. This data/software serviceincludes extensive capabilities for viewing, sorting, screening, graphing, andpreparing reports on mutual funds in the Value Line universe. It presents fulldata on over 10,000 funds, with monthly updates. Users also can access weeklyupdates through Value Line Online.
Other functions of the new software include screening the data to select fundsfor evaluation, analyzing individual funds or fund groups, evaluating portfo-lios under user-determined scenarios, presenting data in graphic or reportform, and portfolio analysis capabilities that can present the composite perfor-mance, risk/reward profile, and asset allocations of a group of up to 200 funds.The software is available on CD-ROM for IBM-compatible PCs.
Value Line DataFile presents in electronic format historical financial records(annual and quarterly) for approximately 5,400 U.S. and international compa-nies. The data, updated weekly, enable investment professionals to conductintensive equity research effectively.
Value Line Estimates & Projections File, also updated weekly, presents toinstitutional clients the forward-looking data from 1,600 of the companiescovered in The Value Line Investment Survey—both performance estimates forup to eight quarters ahead and 3- to 5-year projections.
Value Line Convertible Securities File offers screening capabilities for theconvertible issues covered by Value Line, using the latest prices or targetprices. Updated weekly, it contains almost 150 fields of technical, fundamen-tal, and forecast data.
Value Line manages a family of 15 mutual funds.
Value Line Fund
Value Line Income and Growth Fund
Value Line Special Situations Fund
Value Line U.S. Government Securities Fund
Value Line Strategic Asset Management (SAM) Trust *
Value Line Centurion Fund *
Value Line Leveraged Growth Investors
Value Line Convertible Fund
Value Line Aggressive Income Trust
Value Line Tax Exempt Fund
Value Line New York Tax Exempt Trust
Value Line Asset Allocation Fund
Value Line Emerging Opportunities Fund

USER'S GUIDE 77
VALUE LINE ASSETMANAGEMENT
Value Line U.S. Multinational Company Fund
Value Line Cash Fund
* Only available through the purchase of Guardian Investor, a tax deferred annuity, or ValuePlus, a variable
life insurance policy.
Established in 1978, the Asset Management division is responsible for themanagement of accounts for corporate pension and retirement, endowments,trust accounts and those of high net-worth individuals. The major tools forselecting individual investments and managing individual portfolios are theValue Line TimelinessTM Ranking System, the Value Line Performance Rank-ing System, and the Small-Cap Ranking System—applied when appropriate).Among specific orientations available to clients are Standard Equity, Quanti-tative Equity, Small-Cap Equity, Balanced, and Fixed Income.
The group’s active management style has consistently yielded above-averagereturns for clients.

INDEXSymbols
+/- Peer 21, 23, 28, 36+/- Relevant Index 20, 23, 28, 3612-Month Dividend Yield 1912b-1 Fee 5, 18, 27, 35, 47, 70
A
Aggressive Growth 3, 7Alpha 22, 29, 39, 62Analyst Commentary 6, 24Asset Allocation 3, 8, 45, 52, 56Asset Allocation Fund 8Automatic Dividend Reinvestment 42Automatic Investing 42Average Coupon 38, 39Average Maturity 38
B
Back-end Load 18, 27, 47, 48Balanced 8, 62Beta 12, 21, 22, 29, 39, 63Bid Price 19, 63Breakpoint 17, 18, 63
C
Capital Gains 16, 17, 19, 20, 23,28, 42, 63, 64, 66, 71
Composition 13, 15, 37Contingent Deferred Sales
Charge 18, 27, 47, 64, 67, 69Convertible 3, 8, 64, 68, 74, 76Corporate High Yield 20, 21, 32Country Weightings 15Coupon 37, 38, 39, 71Credit Quality 37, 43Credit Risk 37, 45
D
Decile rank 22Distribution Fee 18, 27, 35Diversification 45, 64, 69Diversified Bond 3, 32Dividends 5, 10, 17, 19,
20, 23, 28, 29, 36, 62, 64, 66, 71Dollar-Cost Averaging 24, 37, 46, 65Dollar-Weighted Average 14, 30, 38Duration 38, 39
E
Energy/Natural Resources 3Estimated Taxes 23, 29, 36Europe Equity 3, 8Evaluating Risk 45Expense Ratio 19, 65Expense Structure 17Expenses 5, 17, 19, 27,
47, 48, 49, 65, 66
F
Financial Plan 43, 49Financial Services 3, 7Five-year Earnings Growth 13, 14, 30Five-Year Growth Persistence 5Five-Year Return 11, 12, 26, 34Flexible 3, 8Foreign Stock 3, 8Front-End Load (Front-end Sales Charge) 11, 18,
23, 27, 28, 36, 47, 67, 69Fund Information 13Fund Performance 42Fund-Family Analyses 2
G
General Equity 3, 7, 13, 20Global Equity 3, 8Gold/Precious Metals 3Government Fund 32Government Mortgage 32Growth 3, 7, 8, 16, 23, 30, 32, 44, 45, 46,
57, 58, 63, 65, 74, 76Growth Persistence 5, 23Growth Stocks 14, 65
H
Health Fund 7Historical Array 18
I
Income Fund 3, 7International Bond 3, 20, 32International Equity 3, 8, 15Investment Objective 2, 5, 7, 11, 12, 16, 42, 66Investor Profile Grid 56Investor Profile Questionnaire 52
USER'S GUIDE 79
J
Junk bonds 37, 66
L
Load Versus No-Load 49
M
Management Fee 5, 17, 19, 35, 66, 67Management Style 14, 15, 16, 20, 31, 67, 77Market Capitalization 13, 14, 16, 30, 67Market Risk 37, 45Maturity 37, 38, 39, 64, 70, 71Modern Portfolio Theory (MPT) 21, 29Modified Duration 38Muni California 32Muni National 32Muni New York 32Muni Single State 32
N
Net Asset Value (NAV) 5, 10, 11, 19, 23,28, 36, 48, 69
Net Assets 8, 10, 11, 13, 15, 17, 19, 20, 67No-load Funds 49
O
Offer price see "NAV"Optimization 45Other Fund 7Overall rank 5, 11, 12, 22, 25, 26, 33, 34, 46Ownership Cost 5
P
Pacific Stock 3, 8Partial Equity 3, 8, 13, 20Past Market Cycle (PMC) Performance 13Percentile Rank Peer 23, 28, 36Performance & Index 2, 4, 5, 74Performance Graph 17Performance History 4, 5Performance Quintile 21Portfolio Holdings 15, 16Portfolio Information 13, 15Price / Book (P/B) Ratio 13, 14, 30, 68Price / Earnings (P/E) Ratio 13, 14, 16, 30, 68Prospectus 48, 49, 68
Q
Quality 37Quintile Performance 21
R
R-Squared 22, 29, 39, 68, 69Ranking distributions 12, 26, 34Ranks 2, 4, 5, 11, 12, 21, 22, 23,
25, 26, 33, 34, 40, 46Redemption Fee 18, 27, 35, 48Relative Performance Graph 18Retirement Plan 42, 43, 66Risk Rank 5, 11, 12, 21, 22, 26, 33, 34, 40, 46Risk-adjusted Performance 11, 22, 26,
29, 34, 39, 62
S
Sales Load 17, 18, 27, 35, 49, 69Sector Weightings 13, 30Share Classes 48Small Company 3, 7Special Services 13, 42Standard Deviation 11, 22, 26, 30, 34, 39, 69Systematic Withdrawal Plan 42
T
Tax Status 16, 19Tax-Free Fixed Income 3, 32Taxable Fixed Income 3Telephone Redemption 42Total Return 5, 8, 11, 12, 17, 19, 20, 21,
23, 26, 28, 34, 36, 47Turnover 19, 20, 68, 70
U
Unique Risk 45Unrealized Appreciation 16, 70Utilities 8
V
Value Stocks 14
W
When To Sell 49
Y
Yield 5, 10, 19, 35, 36, 37, 49, 62, 66, 69, 71, 77

NOTES

USER'S GUIDE 81
NOTES

NOTES

USER'S GUIDE 83
NOTES

NOTES


![Value Line Investment Survey VU Homepage [] Libraries –Bartley Virtual Library –Finance –Databases A-Z – V - Value Line.](https://static.fdocuments.in/doc/165x107/56649e455503460f94b39262/value-line-investment-survey-vu-homepage-wwwvillanovaeduwwwvillanovaedu.jpg)


