Part I: Poly (ethylene sebacate) Nanoparticles of Anti...
111
Part I: Poly (ethylene sebacate) Nanoparticles of Anti- Tubercular Drugs
Transcript of Part I: Poly (ethylene sebacate) Nanoparticles of Anti...
Part I: Poly (ethylene sebacate) Nanoparticles of Anti-
Tubercular Drugs

1. Introduction

Poly (ethylene sebacate) Nanoparticles of Anti-Tubercular Drugs
1 Particulate Carriers as Drug Delivery Systems for Anti-Tubercular and Anti-Cancer Agents
1. INTRODUCTION:
1.1. TUBERCULOSIS
Tuberculosis (TB) is a chronic communicable disease caused by the bacterium
(Mycobacterium tuberculosis) and usually occurs in the lungs (pulmonary
tuberculosis), but it can also occur in other organs (extrapulmonary tuberculosis).
Pulmonary tuberculosis is the most common form of tuberculosis; involving alveolar
macrophages infected with Mycobacterium tuberculosis (Deol et al., 1997). TB
causes substantial mortality and morbidity. Most infections in humans result in an
asymptomatic, latent infection, and about one in ten latent infections eventually
progresses to active disease, which, if left untreated, kills more than 50% of its
victims. A third of the world's population are thought to be infected with M.
tuberculosis (Jasmer et al., 2002), and new infections occur at a rate of about one per
second. The proportion of people who become sick with tuberculosis each year is
stable or falling worldwide but, because of population growth, the absolute number of
new cases is still increasing. Each year, it leads to approximately 14.6 million chronic
active cases, 8.9 million new cases and 1.6 million deaths; new infections are
occurring at a rate of one per second according to the latest WHO report. Drugs or
vaccines have not been developed to rapidly prevent transmission to uninfected
individuals or to treat apparently healthy, recently infected individuals, in part
because of the requirement for early diagnosis of infection. These alarming figures
have put TB in a category, with AIDS and Malaria, of diseases that urgently require
attention to improve global public health.
a) Pathogenosis: Tuberculosis is spread by airborne droplet nuclei, which are
particles of 1–5 μm in diameter that contain Mycobacterium tuberculosis. Because of
their small size, the particles can remain airborne for minutes to hours after
expectoration by people with pulmonary or laryngeal tuberculosis during coughing,
sneezing, singing, or talking (Wells et al., 1934, Louden et al., 1966). The infectious
droplet nuclei are inhaled and lodge in the alveoli in the distal airways. M tuberculosis
is then taken up by alveolar macrophages, initiating a cascade of events that result in
either successful containment of the infection or progression to active disease
(primary progressive tuberculosis). Bacteria after pecked up by the alveolar
macrophages evolve to evade most of the host-defense mechanisms enabling
intracellular survival and also replicate within phagosomes. These phagosomes are

Poly (ethylene sebacate) Nanoparticles of Anti-Tubercular Drugs
2 Particulate Carriers as Drug Delivery Systems for Anti-Tubercular and Anti-Cancer Agents
subjected to degradation by lysosomal enzymes (intra-lysosomal acidic hydrolases)
upon phagolysosomal fusion. However, in tuberculosis, phagosomes are not
digested by the lysosomes because their unification with lysosomes for destructive
action is inhibited by the mycobacterium. This is because of the generation of
ammonia by mycobacterium, which results in an alkaline pH, and, further, the
presence of mycobacterial sulphatides and derivatives of multiacylated trehalose 2-
sulphates have the ability to inhibit phagolysosomal fusion (Sturgill-Koszycki et al.,
1994). When the bacilli are not digested, there is a development of cellular-mediated
immunity by the activation of T cells and monocytes. This results in chemotaxis of
lymphocytes and activated macrophages, which result in lesions that progress into
granuloma formation. This granuloma is a circumscribed collection of inflammatory
mass of macrophages, which are further surrounded by lymphocytes and fibrous
tissue (fibroblasts). At initial stages of infection, granuloma mass is hard in nature, but
after 10 to 12 days, bacilli inside the granuloma is further attacked by activated T cells
(CD 4+ helper T cells via interferon [IFN-γ] and CD 8+ suppressor T cells directly)
and the toxicity of Mycobacterium tuberculosis (MTB) towards macrophages leads to
degradation of granular material at the core of granuloma. This forms a cheesy-like
liquefied material called caseum, which is soft in nature because of presence of
lipids, large concentration of nuclear debris, and dead macrophages and eosinophils
(Thontesh et al., 2007). Exponential growth of MTB is inhibited but bacilli may
remain dormant for many years within the granuloma. It replicates exponentially
during favorable conditions. Thus, MTB is protected from lysosomal digestion and
survives and proliferates in macrophages for a long period of time (Thontesh et al.,
2007).
b) Current chemotherapy of tuberculosis: Since the control measures for TB such as
Bacillus Calmette-Guérin (BCG) vaccination and chemoprophylaxis appear to be
unsatisfactory, treatment with anti-tubercular (anti-TB) drugs becomes the only option
available. The goals of the treatment are to ensure cure without relapse, to prevent
death, to impede transmission, and to prevent the emergence of drug resistance. Long
term treatment with multiple drug therapy is employed to delay or prevent emergence
of the organism resistant to particular agent during treatment.
As suggested by WHO DOTs (Directly Observed Therapy short-course) programme
the first-line therapy consists with Rifampicin (RIF), Isoniazid (INH), Pyrazinamide

Poly (ethylene sebacate) Nanoparticles of Anti-Tubercular Drugs
3 Particulate Carriers as Drug Delivery Systems for Anti-Tubercular and Anti-Cancer Agents
(PZA), Ethambutol (ETH) and Streptomycin because of their efficacy and acceptable
degree of toxicity.
An initially intensive phase consist of three-four drugs (RIF, INH, PZA and
ETH) daily administered concurrently for 2 monts to reduce the rapidly
dividing bacilli load and
The continuation phase consists of two drugs (RIF and INH) either daily or
three times a week for 4-6 months to sterilize lesion containing fewer and
slow-growing bacilli
Intensive Phase-2 Months Under 50 kg Over 50 kg
AKT-3: (ETH-800mg, INH-300mg and RIF-
450mg)
AKT-4: (ETH-800mg, INH-300mg, PZA-
750mg and RIF-450mg)
3-4 tablets 4-5 tablets
Continuation Phase-4-6 Months Under 50 kg Over 50 kg
AKT-2: (INH-300mg and RIF-450mg) 3 tablets 2 tablets
Rifampicin is bactericidal for both intracellular and extracellular mycobacteria so it is
used in combination with Isoniazid as primary agents in a combination therapy and
acts against the metabolically dynamic mycobacteria that multiply perpetually and
rapidly, and also against to the quasi-dormant bacilli.
The second-line class of drug includes aminoglycoside antibiotics, cycloserin,
ethionamide and fluoroquinolones. Because they are no more effective and toxicity is
serious they considered as second-line drugs and are employed only if patient is not
responding to the first-line therapy and/or infected with drug resistant strains of
mycobacteria.
Current tuberculosis therapy administered by conventional oral route and consists of
minimum of six to nine months of treatment regimen and this prolongation of therapy
may lead to life threatening side effects, decreased bioavailability at the target sites
and most importantly non-compliance by the patient thus leading to multi-drug
resistance (MDR) lately extremely-drug resistant (XDR) strains of TB is of
particular concern. The MDR or XDR strains M. avium–M. intracellulare (MAC)
complex is the main cause of complications in immunodepressed patients(Mehta et
al., 1993, Gómez-Flores et al., 1996). MAC is resistant to most classic antitubercular

Poly (ethylene sebacate) Nanoparticles of Anti-Tubercular Drugs
4 Particulate Carriers as Drug Delivery Systems for Anti-Tubercular and Anti-Cancer Agents
drugs owing to the low permeability of cells or rapid degradation, such that new drugs
have been developed, although in practice they do not provide very good results
(Bermudez et al., 1994, Leitzke et al., 1998). The use of delivery systems facilitates
the selective shuttling of antitubercular drugs to the site of infection and such systems
provide slow and sustained drug release, which allows administration over longer
intervals of time. However, once in the blood, most of the antibiotic administered is
captured by the liver and spleen cells but not so much by alveolar macrophages,
limiting efficiency in lung infections (Bermudez et al., 1994). Novel drugs or delivery
systems that are below a toxic threshold at the effective doses and act on the bacteria
by a different absorption mechanism are urgently needed to replace or supplement
drugs that have been lost as therapies to drug resistance. Treatment regimens that are
short and allow less frequent intake of drugs by patients would greatly benefit
compliance.
1.2. COLLOIDAL DRUG DELIVERY SYSTEMS FOR TUBERCULOSIS
THERAPY
Colloidal drug delivery systems with the aim of targeted drug delivery and controlled
release to better manage drug pharmacokinetics, pharmacodynamics, non-specific
toxicity, immunogenicity and biorecognition systems have been proven an important
cum effective strategy for complete eradication of mycobacterium tuberculosis from
intra cellular sites, in animal models (Labana et al., 2002, Pandey et al., 2003, 2004
and 2005, Vyas et al., 2004, Mullaicharam et al., 2004, Chono et al., 2007 and 2008,
Ohashi et al., 2009, Hirota et al., 2010, Saraogi et al., 2010 and 2011). The following
are among the important technological advantages of colloidal drug carriers: high
stability (i.e., long shelf life); high carrier capacity (i.e., many drug molecules can be
incorporated in the particle matrix); feasibility of incorporation of both hydrophilic
and hydrophobic substances; and feasibility of variable routes of administration,
including oral administration, intravenous and inhalation. These carriers can also be
designed to enable controlled (sustained) drug release from the matrix.
Colloidal carriers such as liposomes, niosomes, microparticles, polymeric
nanoparticles, solid lipid nanoparticles, nanosuspension, nanoemulsion, micellar
nanocarriers and porous particles explored for the delivery of antitubercular drugs
after oral, intravenous or inhalation administration as summarized in Table 1.1.

Poly (ethylene sebacate) Nanoparticles of Anti-Tubercular Drugs
5 Particulate Carriers as Drug Delivery Systems for Anti-Tubercular and Anti-Cancer Agents
Table 1.1: Colloidal drug delivery systems containing anti-TB drugs Carrier Polymer/lipid Drugs Route of
administration/animal model
Study Ref.
Liposomes Lecithin Streptomycin Intravenous (mouse)
Significant decrease of the Mycobacterium count in the spleen, but not in the lungs. Prolonged mouse survival and reduced acute drug toxicity
Vladimirsky et al., 1982
ePC Gentamycin Intravenous (mouse)
Significantly reduced the bacterial count in spleen and liver. A dose-related reduction of the bacterial load, without sterilization was found.
Klemens et al., 1990
PC and phosphatidylglycerol
Sparfloxacin In-vitro cell culture
Reduction of the growth index to 30%. Duzgunes et al., 1996
PC, dicetylphosphate (O-SAP, Monosialogangliosides/DSPE-PEG 2000 ligand)
INH, RIF Intravenous (mice)
Significant decrease in the hepatoxic activity of the anti-TB agents. Within 30 min the accumulation of nanocarriers in the lungs was 31% with PEGylated systems.
Deol et al., 1997
PC, CH, dicetylphosphate (O-SAP, Monosialogangliosides/DSPE-PEG 2000 ligand)
INH, RIF Intravenous (mice)
A significant increase in the anti-TB activity was found. Deol et al., 1997 a
Lecithin Amikacin Intravenous (mice)
Significantly reduced bacterial replication in infected tissues and extended the survival time of infected mice.
Leitzke et al., 1998
PC Clofazimine Intravenous (mice)
Significant reduction of the in vitro and in vivo toxicity of the drug. The anti-TB activity in both acute and chronic models was enhanced.
Mehta et al., 1999, Adams et al., 1999
ePC, DSPE, PEG INH, RIF Intravenous (mice)
Reduced the mycobacterial load significantly in lungs, liver and spleen of infected mice.
Labana et al., 2002
DSPC, DPPC, HPC Capreomycin In vitro Demonstrated their suitability for use in inhaled formulations Giovagnoli et al., 2003
ePC (O-SAP and MBSA ligand)
RIF Inhalation (aerosol)
Percent viability of M. smegmatis inside macrophages in vitro and in vivo was significantly decrease with ligand-anchored liposomal aerosols.
Vyas et al., 2004

Poly (ethylene sebacate) Nanoparticles of Anti-Tubercular Drugs
6 Particulate Carriers as Drug Delivery Systems for Anti-Tubercular and Anti-Cancer Agents
DSPC, DPPC, HPC Capreomycin Both freeze–thawing technique and a response surface methodology were used to improve the drug content.
Ricci et al., 2006
HSPC, DOPE (4-Aminophenyl-a-D-mannopyranoside ligand)
Inhalation (rat)
A pronounced increase in the uptake was observed with the mannosylated-nanocarriers in vitro and in vivo.
Chono et al., 2007
DPPC PZA Intravenous (mice)
High therapeutic efficacy of PZA liposomes was observed in the treatment of M. tuberculosis in mice.
El-Ridy et al., 2007
HSPC, DOPE (4-Aminophenyl-a-D-mannopyranoside ligand)
Ciprofloxacin Intravenous (rat)
High targeting efficiency towards rat AMs Manno-sylated liposomes exhibited potent antibacterial effects against many bacteria.
Chono et al., 2008
DPPC, DPPG RFB Intravenous (mice)
Lower bacterial loads in the spleen, liver and lung. Gaspar et al., 2008
DSPC (Man-C4-Chol ligand)
intratracheal (rat)
Higher uptake of mannosylated-nanocarriers, preferably (15–17-fold) by alveolar macro-phages over alveolar epithelial type II cells.
Wijagkanalan et al., 2009
Niosomes Span 85 RIF Intravenous (rat)
Up to 65% of the drug was localized in the lungs by adjusting the size of the carrier.
Jain et al., 1995
RIF Intravenous and intathoracic (rat)
After i.v. administration, niosomes preferentially accumulated in the lung, liver and kidney. After intathoracic (i.t.) administration, the lung and/or plasma ratios for niosomes and free drug represented a 145-fold increase in the accumulation capacity of RIF-loaded niosomes in the lungs as compared to the free drug.
Mullaicharam et al., 2004
Span 20, 40, 60, 80, 85 RIF Intravenous and intraperitoneal (rat)
Niosomal formulations attained substantially higher RIF concentrations in thoracic lymph nodes.
Jain et al., 2006
Nanoparticles and microparticles
PIBCA Ciprofloxacin Intravenous infusion (rabbit)
NPs led to increased AUC, t1/2 and Vd. NPs were more effective against M. avium complex in human macrophages.
Fawaz et al., 1998
PBCA, PIBCA RIF, INH, Streptomycin
In vitro Encapsulated INH, Streptomycin and RIF showed 4–8-, 7-and 22–25-fold increases in the intracellular concentration.
Anisimova et al., 2000
PLG RIF, INH, PZA
Inhalation-Nebulization (guinea pig)
Therapeutic drug concentrations in plasma were detected until day 6 for RIF and day 8 for both INH and PZA. No tubercle bacilli could be detected in the lungs after five doses of treatment (dosing at 10days interval)
O’Hara et al., 2000
Poly (ethylene sebacate) Nanoparticles of Anti-Tubercular Drugs
7 Particulate Carriers as Drug Delivery Systems for Anti-Tubercular and Anti-Cancer Agents
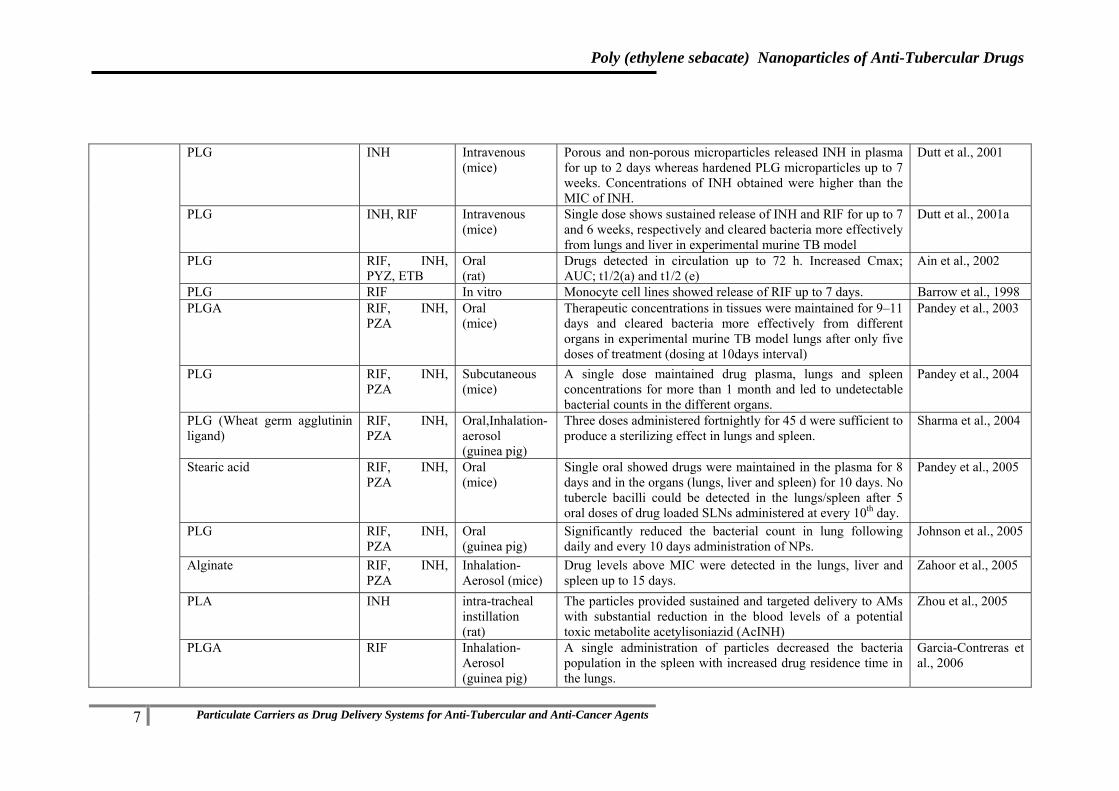
PLG INH Intravenous (mice)
Porous and non-porous microparticles released INH in plasma for up to 2 days whereas hardened PLG microparticles up to 7 weeks. Concentrations of INH obtained were higher than the MIC of INH.
Dutt et al., 2001
PLG INH, RIF Intravenous (mice)
Single dose shows sustained release of INH and RIF for up to 7 and 6 weeks, respectively and cleared bacteria more effectively from lungs and liver in experimental murine TB model
Dutt et al., 2001a
PLG RIF, INH, PYZ, ETB
Oral (rat)
Drugs detected in circulation up to 72 h. Increased Cmax; AUC; t1/2(a) and t1/2 (e)
Ain et al., 2002
PLG RIF In vitro Monocyte cell lines showed release of RIF up to 7 days. Barrow et al., 1998 PLGA RIF, INH,
PZA Oral (mice)
Therapeutic concentrations in tissues were maintained for 9–11 days and cleared bacteria more effectively from different organs in experimental murine TB model lungs after only five doses of treatment (dosing at 10days interval)
Pandey et al., 2003
PLG RIF, INH, PZA
Subcutaneous (mice)
A single dose maintained drug plasma, lungs and spleen concentrations for more than 1 month and led to undetectable bacterial counts in the different organs.
Pandey et al., 2004
PLG (Wheat germ agglutinin ligand)
RIF, INH, PZA
Oral,Inhalation-aerosol (guinea pig)
Three doses administered fortnightly for 45 d were sufficient to produce a sterilizing effect in lungs and spleen.
Sharma et al., 2004
Stearic acid RIF, INH, PZA
Oral (mice)
Single oral showed drugs were maintained in the plasma for 8 days and in the organs (lungs, liver and spleen) for 10 days. No tubercle bacilli could be detected in the lungs/spleen after 5 oral doses of drug loaded SLNs administered at every 10th day.
Pandey et al., 2005
PLG RIF, INH, PZA
Oral (guinea pig)
Significantly reduced the bacterial count in lung following daily and every 10 days administration of NPs.
Johnson et al., 2005
Alginate RIF, INH, PZA
Inhalation-Aerosol (mice)
Drug levels above MIC were detected in the lungs, liver and spleen up to 15 days.
Zahoor et al., 2005
PLA INH intra-tracheal instillation (rat)
The particles provided sustained and targeted delivery to AMs with substantial reduction in the blood levels of a potential toxic metabolite acetylisoniazid (AcINH)
Zhou et al., 2005
PLGA RIF Inhalation-Aerosol (guinea pig)
A single administration of particles decreased the bacteria population in the spleen with increased drug residence time in the lungs.
Garcia-Contreras et al., 2006

Poly (ethylene sebacate) Nanoparticles of Anti-Tubercular Drugs
8 Particulate Carriers as Drug Delivery Systems for Anti-Tubercular and Anti-Cancer Agents
PLGA RIF, INH, PZA, ETB
Oral (mice)
Therapeutic levels were maintained for 5–8 days in blood and 9 days in plasma; one administration every 10th day (5 doses) eliminated the bacteria in the meninges.
Pandey et al., 2006
PLG RIF, INH, PZA, ETB
Oral (mice)
Therapeutic levels were maintained for 5 days in plasma and 7-9 days in the organs (lungs, liver, spleen) after single oral dose while 3 oral doses of the 4-drug formulation administered at every 10th day resulted in undetectable bacilli in the organs.
Pandey et al., 2006a
Alginate RIF, INH, PZA, ETB
Oral (mice)
Encapsulated drugs were observed in plasma and in tissues until day 15.
Ahmad et al., 2006
PLGA RIF Insufflation or nebulization (guinea pig)
Single and double doses of microparticle reduced numbers of viable bacteria, inflammation and lung damage compared. Two doses of RIF-PLGA-reduced splenic enlargement.
Suarez et al., 2001
PLA RFB, INH Inhalation (mice)
Intracellular concentrations of respirable MPs were found to be four-fold.
Muttil et al., 2007
PBCA Moxifloxacin Intravenous (mice)
NPs were more toxic to the macrophages. Cellular uptake showed pronounced increase (2–3 fold) in the intracellular drug concentration. Anti-TB activity in infected mice showed a significant decrease in the total mycobacterial count in the lungs.
Kisich et al., 2007, Shipulo et al., 2008
PLG Econazole, Moxifloxacin, RIF
Intravenous (mice)
Only eight doses of NPs were sufficient to suppress bacterial clearance in infected mice. Third drug RIF to this combination showed complete bacterial clearance within 8 weeks.
Ahmed et al., 2008
Hyaluronan Ofloxacin Intratracheal and Intravenous (rat)
Ofloxacin-loaded hyaluronan particles resulted in 50% lower serum bioavailability with respect to intravenous or oral ofloxacin. This observation supported the view that inhaled MPs may reduce systemic side effects.
Hwang et al., 2009
PLGA, mannitol RIF Inhalation (rat)
NPs in mannitol improved the in vivo uptake of the drug by alveolar macrophages in rat lungs.
Ohashi et al., 2009
PLGA RIF Inhalation (rat)
Phagocytosis of PLGA MS does not generate the toxic humoral factors to AMs, such as TNF-a and NO, and the phagocytosis does not affect the viability of AMs.
Hirota et al., 2010
Gelatin RIF Intravenous (mice)
NPs sustained the plasma level with enhanced the AUC and MRT of the drug. Significant reduction in bacterial counts in the lungs and spleen of TB-infected mice was also found.
Saraogi et al., 2010

Poly (ethylene sebacate) Nanoparticles of Anti-Tubercular Drugs
9 Particulate Carriers as Drug Delivery Systems for Anti-Tubercular and Anti-Cancer Agents
Gelatin (Mannose ligand)
INH Intravenous (mice)
NPs are potential carrier for safer and efficient management of TB.
Saraogi et al., 2011
PLG INH, RIF Inhalation (rat)
The intracellular drug concentrations resulting from particle inhalation were found to be higher than vascular delivery of soluble drugs.
Sharma et al., 2011
Polymeric micelles
INH-PEG-PAA INH In vitro The micelle-forming prodrug showed a 5.6-fold increase in antituberculous activity against M. tuberculosis in vitro when compared to the free drug
Silva et al., 2001
PYZ-PEG-PAA PYZ Intravenous (rat)
The size of the micelles prevented renal filtration, increased the residence time in the blood stream with improved antimicrobial activity.
Silva et al., 2006
MPEG-PLLA and MPEG-PDLA
RIF In vitro RIF loading capacity and encapsulation efficiency of the stereo-complexes were higher. There was a fast initial release (50% after 4–8 hours) and a more moderated one (100% after 48 hours) afterwards.
Chen et al., 2007
P(CL-GA)–PEG-P(CL-GA) RIF In vitro RIF sustained release was obtained over 32 days from 25% gel matrix.
Jiang et al., 2007
RIF-PEG-PAA RIF Intravenous (rat)
The size of the micelles prevented renal filtration, increased the residence time in the blood stream with improved antimicrobial activity.
Silva et al., 2007
INH lipid derivatives INH In vitro Micelles showed increased penetration of the drug into the pathogen leading to promising antibacterial activity
Jin et al., 2008
PLA-modified chitosan oligomers
RIF In vitro RIF-chitosan oligomer micelles showed initial burst drug release of 35% within 10 h followed by more sustained drug release till 5th day
Wu et al., 2009
Dendrimers PPI (Mannose ligand)
RIF In vitro Mannose on surface significantly reduced the hemolytic toxicity of the nanocarriers and drug and also sustained the drug release. Surface modification improved the selective uptake of the drug-loaded nanocarriers by cells of the immune system.
Kumar et al., 2006
PEGylated PPI RIF In vitro PEG grafted dendrimers showed significant increase in drug entrapment, sustained release of RIF and low hemolytic activity.
Kumar et al., 2007

Poly (ethylene sebacate) Nanoparticles of Anti-Tubercular Drugs
10 Particulate Carriers as Drug Delivery Systems for Anti-Tubercular and Anti-Cancer Agents
1.3. ROUTES OF ADMINISTRATION:
Different routes of administration including oral, parenteral and pulmonary for
delivery of anti tubercular drugs have been actively investigated since last few
decades. Parenteral administration of colloidal DDS enable reduced toxicity of anti-
tubercular drugs through targeting to the alveolar macrophages. While the large
epithelial surface area, the high organ vascularization, the thin nature of the alveolar
epithelium and the immense capacity for solute exchange enable the lung to serve as
an ideal administration route for the application of drugs for treatment of tuberculosis.
1.3.1. Parenteral route
In contrast to microparticles with a diameter of more than 1 µm that cannot be
administered via intravascular routes, nanoparticles are small enough to allow
intracapillary passage followed by an efficient cellular uptake. When administered
intravenously, the nanoparticles follow the route of other foreign particulates,
including intracellular pathogens. They are endocytosed by resident macrophages of
the mononuclear phagocyte system and by circulating monocytes. On the other hand,
in the case of infections caused by intracellularly persisting microbes (e.g., Brucella,
Salmonella, Listeria, Mycobacterium), macrophages become reservoirs for pathogens,
thus representing one of the targets for delivery of antimicrobial agents.
Preferential uptake of nanoparticles by macrophages (mainly by Kupffer cells in the
liver) is achieved by the physicochemical properties of the carrier and by physiologic
opportunity, thus representing an example of passive delivery. This technology
improves drug delivery to macrophages, increasing the amount of the drug reaching
this target site, which allows reduction of the overall therapeutic dose and decrease of
the adverse effects. Accordingly, the enhanced efficacy of the nanoparticle-bound
antibiotics was demonstrated in a number of experimental infections (Pinto-
Alphandary et al., 2000, Kayser et al., 2003).
RIF loaded multilamellar vesicles consisting of lecithin dicetylphosphate and
cholesterol was administered parenterally, six times weekly to previously infected
mice, 7 days up to 8 weeks (Saito et al., 1989). Significant reduction in the colony
forming units (CFU) was observed by the intraperitoneal (i.p.) route as compared to
the subcutaneous (s.c.) and intramuscular (i.m.) routes (Saito et al., 1989). In another
study Deol and Khuller developed lung-specific Stealth® liposomes for the targeted
delivery of anti-TB drugs to the lung (Deol et al., 1997 and 1997a). Studies showed
that a prominent increase accumulation of the nanocarriers in lungs after
Poly (ethylene sebacate) Nanoparticles of Anti-Tubercular Drugs
11 Particulate Carriers as Drug Delivery Systems for Anti-Tubercular and Anti-Cancer Agents
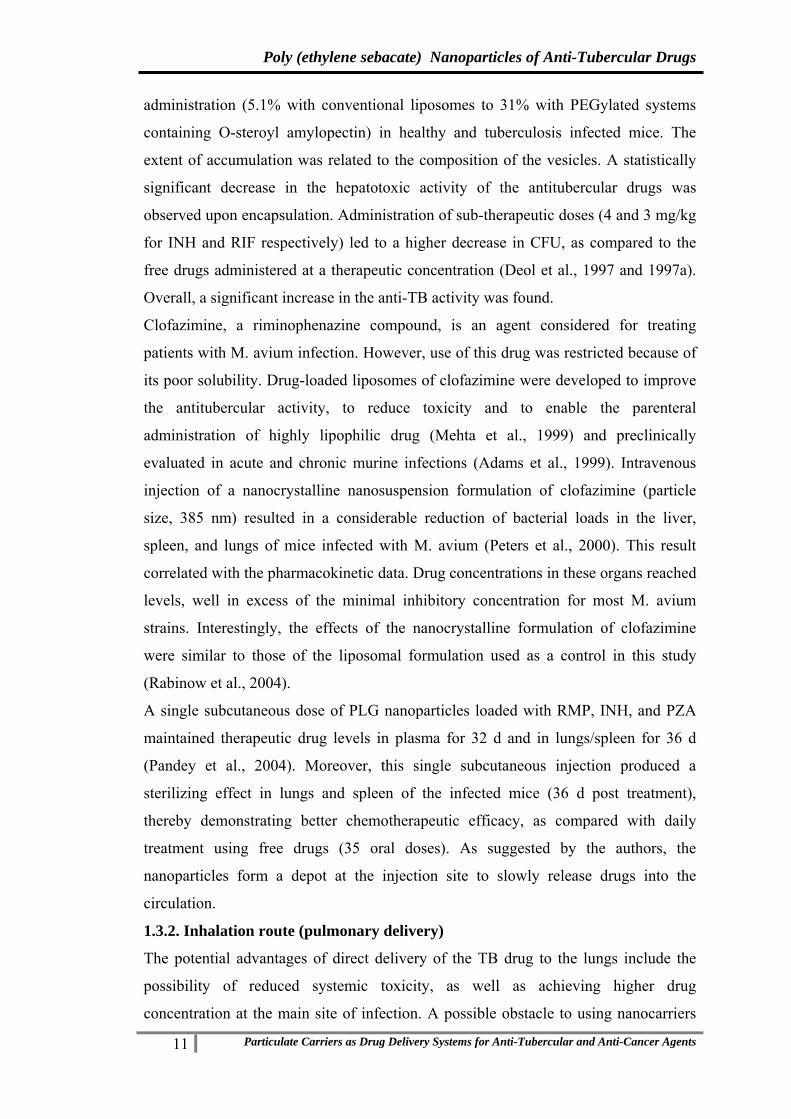
administration (5.1% with conventional liposomes to 31% with PEGylated systems
containing O-steroyl amylopectin) in healthy and tuberculosis infected mice. The
extent of accumulation was related to the composition of the vesicles. A statistically
significant decrease in the hepatotoxic activity of the antitubercular drugs was
observed upon encapsulation. Administration of sub-therapeutic doses (4 and 3 mg/kg
for INH and RIF respectively) led to a higher decrease in CFU, as compared to the
free drugs administered at a therapeutic concentration (Deol et al., 1997 and 1997a).
Overall, a significant increase in the anti-TB activity was found.
Clofazimine, a riminophenazine compound, is an agent considered for treating
patients with M. avium infection. However, use of this drug was restricted because of
its poor solubility. Drug-loaded liposomes of clofazimine were developed to improve
the antitubercular activity, to reduce toxicity and to enable the parenteral
administration of highly lipophilic drug (Mehta et al., 1999) and preclinically
evaluated in acute and chronic murine infections (Adams et al., 1999). Intravenous
injection of a nanocrystalline nanosuspension formulation of clofazimine (particle
size, 385 nm) resulted in a considerable reduction of bacterial loads in the liver,
spleen, and lungs of mice infected with M. avium (Peters et al., 2000). This result
correlated with the pharmacokinetic data. Drug concentrations in these organs reached
levels, well in excess of the minimal inhibitory concentration for most M. avium
strains. Interestingly, the effects of the nanocrystalline formulation of clofazimine
were similar to those of the liposomal formulation used as a control in this study
(Rabinow et al., 2004).
A single subcutaneous dose of PLG nanoparticles loaded with RMP, INH, and PZA
maintained therapeutic drug levels in plasma for 32 d and in lungs/spleen for 36 d
(Pandey et al., 2004). Moreover, this single subcutaneous injection produced a
sterilizing effect in lungs and spleen of the infected mice (36 d post treatment),
thereby demonstrating better chemotherapeutic efficacy, as compared with daily
treatment using free drugs (35 oral doses). As suggested by the authors, the
nanoparticles form a depot at the injection site to slowly release drugs into the
circulation.
1.3.2. Inhalation route (pulmonary delivery)
The potential advantages of direct delivery of the TB drug to the lungs include the
possibility of reduced systemic toxicity, as well as achieving higher drug
concentration at the main site of infection. A possible obstacle to using nanocarriers

Poly (ethylene sebacate) Nanoparticles of Anti-Tubercular Drugs
12 Particulate Carriers as Drug Delivery Systems for Anti-Tubercular and Anti-Cancer Agents
for pulmonary delivery is that their mass median aerodynamic diameter, an essential
parameter for the particle deposition in the lungs, is often too small. Nevertheless, the
effectiveness of pulmonary drug delivery using nanoparticles was demonstrated in a
number of studies.
A single administration INH and RIF loaded multilamellar liposomes to guinea pigs
following nebulization showed plasma drug levels from 45 minutes onwards up to 48
hours, whereas no drug could be detected beyond 24 hours post-nebulization when
free drugs were used. The aerosol formulation also showed significantly enhanced
plasma half-life due to slower rate of elimination (Pandey et al., 2004). In vivo studies
in albino rats demonstrated a higher pulmonary delivery and better localization of
ligand-appended liposomes to alveolar macrophages compared with conventional
liposomes or free rifampicin, from 30 min to 24 h post-nebulization (Vyas et al.,
2004). A single nebulization of poly (DL-lactide-co-glycolide) (PLG) nanoparticles of
INH, RIF and PZA resulted in sustained therapeutic drug levels in plasma for 6-8
days and in lungs for 11 days.
Based on the experimental data, it is clear that respiratory drug delivery systems
certainly have the potential for antitubercular inhaled therapy. The requirements for
fewer drug doses as well as a low dosing frequency are definite advantages. However,
there are some key issues that still need to be addressed. The possibility of variable
deposition of an inhaled formulation in the lungs needs to be considered and is a
matter of concern because it could result in suboptimal drug concentrations in certain
lung regions. If this does occur to a significant extent then treatment response could
be impaired.
1.3.1. Oral administration
The oral route widely used today is the most patient friendly route. Development of a
drug delivery system for oral administration which could show enhanced pulmonary
uptake of anti-tubercular drugs could provide a promising effective alternative to
current therapy. Further targeting the drug to the macrophages the site of the
tuberculosis infection could provide the dual advantage of improved treatment with
the possibility of decreased side effects.
After a single oral administration of PLGA nanoparticles co-encapsulated with
rifampin (RMP), isoniazid (INH), and pyrazinamide (PZA) provided sustained release
with drugs detected in circulation for 4-9 days with tissue concentrations maintained
for 9-11 days (Pandey et al., 2003, 2004). No tubercle bacilli could be detected in the

Poly (ethylene sebacate) Nanoparticles of Anti-Tubercular Drugs
13 Particulate Carriers as Drug Delivery Systems for Anti-Tubercular and Anti-Cancer Agents
tissues after 5 oral doses of treatment. Similar efficacy of the nanoparticle-bound
drugs was also observed in guinea pigs (Sharma et al., 2004). Anti-TB drug-loaded
alginate nanoparticles (235 nm diameter) were orally administered to mice and the
plasma concentrations monitored over time (Zahoor et al., 2006). Free drugs were
cleared from blood 12 to 24 h after administration and were detectable in tissues (e.g.
spleen, liver and lung) only until day 1. In contrast, encapsulated drugs were observed
in plasma up to 7, 9, 11 and 11 days after administration for ETB, RIF, INH and PYZ,
respectively, and in tissues until day 15 (Zahoor et al., 2006).
A single dose of RIF, INH and PYZ incorporated SLN administered orally in mice
resulted in drug concentrations detectable after 3 h and for up to 8 days (Pandey et al.,
2005). Moreover, plasma concentrations were equal to or above the MIC at all the
time points measured. The free drugs were cleared from circulation within 12h of
administration. Also, while drug-loaded SLN maintained detectable drug levels over
10 days in the lung, spleen and liver, free drugs were cleared from these organs 24–
48h after the oral administration. Finally, the initial CFU count 15 days after the
infection with M. tuberculosis H37Rv was 4.20 and 4.34 log in lungs and spleen,
respectively. Five doses of drug-loaded SLNs led to undetectable CFU. To attain a
similar effect with the free drugs, 46 daily doses were required.
Wheat germ agglutinin coated particles were administered to guinea pigs through
oral/aerosol route for pharmacokinetic and chemotherapeutic evaluation. The
presence of drugs in the plasma was detected for 6-7 days for RIF and 13-14 days for
INH and PZA. The lectin-modified formulations produced bacterial clearances in
lungs, liver and spleen after three oral doses administered every 14 days, which was
equivalent to 45 doses of oral free drugs (Sharma et al., 2004). Therapeutic efficacy of
the nanoparticle-based formulations of anti-tubercular drugs following oral and
inhalation route are compared in Table 1.2.

Poly (ethylene sebacate) Nanoparticles of Anti-Tubercular Drugs
14 Particulate Carriers as Drug Delivery Systems for Anti-Tubercular and Anti-Cancer Agents
Table 1.2: Therapeutic efficacy of the nanoparticle-based formulations of RIF-INH-PZA combinations (Gelperina et al., 2005)
Delivery System
Animal Model
Administration Route
Duration of Drug Release
(d )
Regimen Producing Sterilizing Effect in
Lungs and Spleen
Plasma Organs
PLG nanoparticles
Mice Oral 6–9 9–11 5 doses every 10 d
Mice Subcutaneous 32 36 Single injectionGuinea
pigs Aerosol 4–9 up to 10
(each drug)
5 doses every 10 d
Guinea pigs
Oral 4–9 up to 10 d (each drug)
5 doses every 10 d
Lectin-functionalized PLG nanoparticles
Guinea pigs
Oral 7–13 up to 15 (each drug)
3 doses fortnightly
Guinea pigs
Aerosol 6–14 up to 15 (each drug)
3 doses fortnightly
Solid lipid nanoparticles
Guinea pigs
Aerosol 5 7 7 doses weekly
1.4. FATE OF ORAL NANOPARTICULATE DRUG DELIVERY:
Nanocarriers by virtue of their unique uptake mechanisms hold the advantage of
bypassing the first pass metabolism of the encapsulated drug prone to such
metabolism. Most evidences suggest that nanocarrier uptake occurs preferentially via
“M-Cells” in Peyer’s patches by process of endocytosis (lymphatic uptake) thereby
delivering the drug loaded particles directly into the systemic circulation through the
lymphatics and circumventing first pass metabolism. However uptake by transcellular
and paracellular pathways (non-lymphatic uptake) involving intestinal adsorptive
endocytosis cannot be ruled out (Florence et al., 1997; Jung et al., 2000). Additionally
nanocarriers can improve the bioavailability of orally administered drug by inhibiting
multidrug efflux pump transporter P-glycoprotein (P-gp) present in intestine, liver and
kidney (Kalaria et al., 2008).
It is generally accepted that smaller particles are more effectively absorbed than larger
particles. While larger particles are retained for longer period in the Peyer’s patches,

Poly (ethylene sebacate) Nanoparticles of Anti-Tubercular Drugs
15 Particulate Carriers as Drug Delivery Systems for Anti-Tubercular and Anti-Cancer Agents
smaller particles are progressively transported to the major organs (Jani et al., 1990;
Jung et al., 2000). Further non-ionized carriers are reported to absorb at the greater
extent than charged carriers (Jani et al., 1989). Uptake of nanocarriers prepared from
hydrophobic polymers seems to be higher than from nanocarriers with hydrophilic
surfaces. Preferential uptake of polystyrene nanoparticles over PLA and PLGA
particles and negligible uptake of particles prepared from hydrophilic cellulose
matrices upon oral administration to mice has been observed by Eldridge et al., 1990.
Moreover coating of nanoparticles with hydrophilic polymers reduced their uptake
from the large intestine and inhibited their uptake in the small intestine (Hillery and
Florence et al., 1996). The other factors such as the vehicle used for oral
administration of nanocarriers and physiological factors including animal species, age
and food ingestion also have an influence on the uptake mechanisms of nanocarriers
(Galindo-Rodriguez et al., 2005).
Another strategy used for improving the bioavailability of poorly absorbed drugs is
based on developing bioadhesive nanocarriers to prolong gastrointestinal transit of
drugs. The intricacies and the factors influencing these interactions and uptake of
nanocarriers across GIT are extensively reviewed in the literature [Ponchel et al.,
1997; Chen and Langer et al., 1998; Hussain et al., 2001; Galindo-Rodriguez et al.,
2005; Rieux et al., 2006]. Tables 1.3-1.5 lists the nanocarriers evaluated for
improving oral bioavailability of drugs.

Poly (ethylene sebacate) Nanoparticles of Anti-Tubercular Drugs
16 Particulate Carriers as Drug Delivery Systems for Anti-Tubercular and Anti-Cancer Agents
Table 1.3: Examples of in vivo studies with nanoparticles for improving oral bioavailability of drugs
Material Drug Comment Ref Nanoparticles Sulfobutylether-β-cyclodextrin/chitosan
Docetaxel Significantly increased the AUC(0→t) and decreased the clearance
Wu et al., 2012
PLGA Estradiol Significant increase in AUC values when compared to that of oral pure drug
Mittal et al., 2007
Doxorubicin Superior bioavilability and lower toxicity with nanoparticulate formulation
Kalaria et al., 2008
Estradiol Nanoparticles improved oral bioavailability/ efficacy of estradiol
Mittal et al., 2009
Curcumin 5.6 fold enhanced bioavalability with longer half life
Xie et al., 2011
Chitosan Insulin Nanoparticles maintained the serum glucose level of the diabetic rats at prediabetic levels (60 % of baseline) for at least 11h
Ma et al., 2005
Green tea catechins (+)-catechin and (-)-epigallocatechin gallate
nanoparticles enhances their intestinal absorption and bioavalibility
Dube et al., 2010
PEG-chitosan Calcitonin Chitosan–PEG nanocapsules enhanced and prolonged the intestinal absorption of salmon calcitonin
Prego et al., 2006
PVA/MA (Bioadhesive albumin coated nanoparticles )
5-fluorouridine Higher bioavailability with nanoparticles (79%) when compared to oral solution (11%)
Arbos et al., 2004

Poly (ethylene sebacate) Nanoparticles of Anti-Tubercular Drugs
17 Particulate Carriers as Drug Delivery Systems for Anti-Tubercular and Anti-Cancer Agents
Table 1.4: Examples of in vivo studies with liposomes and proliposome for improving oral bioavailability of drugs
Material Drug Comment Ref
Liposomes polyelectrolyte-stabilized liposomes (layersomes)
Doxorubicin 5.94 fold increase in oral bioavailability with reduced toxicity
Jain et al., 2012
Chitosan–aprotinin coated
Calcitonin 11 fold and around 15 fold increase in AUC with chitosan coated liposomes and chitosan–aprotinin coated liposomes respectively compared to solution
Werle & Takeuchi 2009
Lectin coated Insulin Enhanced bioavilability with lectin coated liposomes in comparison with insulin solution administered subcutaneously
Zhang et al., 2005
Phosphotidylcholine (SPC) and sodium deoxycholate (SDC) and SPC/cholesterol (CL)
Fenofibrate Higher rates of fenofibrate absorption from both SPC/SDC and SPC/CL liposomes than micronized fenofibrate. 1.57-fold increase in bioavailability of SPC/SDC liposomes relative to SPC/CL liposomes,
Chen et al., 2009
Dipalmitoylphosphatidyl choline (DPPC) and cholesterol (CL)
Cyclosporine Significantly faster rate of absorption following liposome administration.
Al-Meshal et al. 1998
Proliposomes Phospholipids Silymarin Superior bioavailability of
SLN compared to drug suspension
Yan-yu et al., 2006
Poly (ethylene sebacate) Nanoparticles of Anti-Tubercular Drugs
18 Particulate Carriers as Drug Delivery Systems for Anti-Tubercular and Anti-Cancer Agents
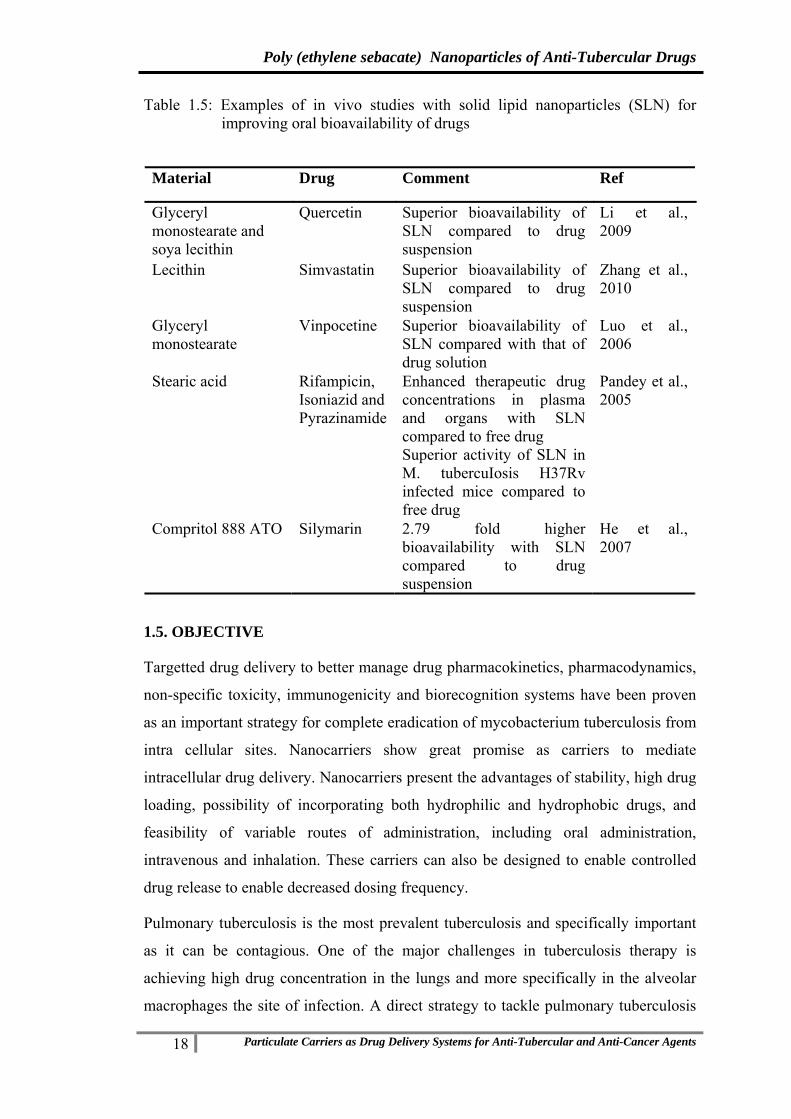
Table 1.5: Examples of in vivo studies with solid lipid nanoparticles (SLN) for improving oral bioavailability of drugs
Material Drug Comment Ref
Glyceryl monostearate and soya lecithin
Quercetin Superior bioavailability of SLN compared to drug suspension
Li et al., 2009
Lecithin Simvastatin Superior bioavailability of SLN compared to drug suspension
Zhang et al., 2010
Glyceryl monostearate
Vinpocetine Superior bioavailability of SLN compared with that of drug solution
Luo et al., 2006
Stearic acid Rifampicin, Isoniazid and Pyrazinamide
Enhanced therapeutic drug concentrations in plasma and organs with SLN compared to free drug Superior activity of SLN in M. tubercuIosis H37Rv infected mice compared to free drug
Pandey et al., 2005
Compritol 888 ATO Silymarin 2.79 fold higher bioavailability with SLN compared to drug suspension
He et al., 2007
1.5. OBJECTIVE
Targetted drug delivery to better manage drug pharmacokinetics, pharmacodynamics,
non-specific toxicity, immunogenicity and biorecognition systems have been proven
as an important strategy for complete eradication of mycobacterium tuberculosis from
intra cellular sites. Nanocarriers show great promise as carriers to mediate
intracellular drug delivery. Nanocarriers present the advantages of stability, high drug
loading, possibility of incorporating both hydrophilic and hydrophobic drugs, and
feasibility of variable routes of administration, including oral administration,
intravenous and inhalation. These carriers can also be designed to enable controlled
drug release to enable decreased dosing frequency.
Pulmonary tuberculosis is the most prevalent tuberculosis and specifically important
as it can be contagious. One of the major challenges in tuberculosis therapy is
achieving high drug concentration in the lungs and more specifically in the alveolar
macrophages the site of infection. A direct strategy to tackle pulmonary tuberculosis

Poly (ethylene sebacate) Nanoparticles of Anti-Tubercular Drugs
19 Particulate Carriers as Drug Delivery Systems for Anti-Tubercular and Anti-Cancer Agents
is pulmonary delivery of anti-tubercular drugs. Direct pulmonary deposition of
micro/nanoparticles through inhalation/nebulization has been evaluated by various
research groups to deliver high concentration of anti tubercular drugs to the lungs
(Pandey et al., 2001, 2005, Sen et al., 2003, Zahoor et al., 2005, Sharma et al., 2001,
2007). Although promising, the dose that can be delivered by this route poses serious
constraints. Variable deposition of inhaled nanoparticles in the lungs, resulting in
suboptimal drug concentrations in certain lung regions is another limiting issue.
Oral drug administration with high bioavailability and sustained release, coupled with
enhanced pulmonary uptake presents an ideal drug delivery strategy for the treatment
of tuberculosis. Targetting to the lungs following oral administration is an attractive,
although difficulty strategy. Colloidal systems, because of their small size, are capable
of being absorbed intact from the gastrointestinal tract by passive diffusion via
transcellular or paracellular pathways, or via active processes mediated by membrane-
bound carriers or membrane-derived vesicles. Although these would results in rapid
sequester by liver and spleen. Lymphatic uptake by the M cells of the Peyer’s patches
is reported to be one of the major pathways for rapid absorption of nanoparticles
(O’Hagan et al., 1987). Moreover lymphatic uptake could also enable bypass of portal
circulation and thereby enhance lung deposition.
A promising approach for active targeting to infected macrophage is by receptor
mediated endocytosis. Macrophages express a number of receptors including mannose
(Taylor et al., 1992 and 1997, Lennartz 1987, Kaur et al., 2008), tuftsin(Gupta et al.,
2000), scavenger (Van der Laan et al., 1999, Fluiter et al., 1998),,
fibronectin(Yukihiko et al., 1995),, and folate(Low et al., 2004, Low et al., 2009).
Folate receptors which are overexpressed in infected macrophages are widely
investigated receptor for targeting.
The most common ligand investigated is folic acid a low cost, non immunogenic and
safe moiety which exhibits very high affinity for the folate receptor(Kd~ 10-10) (Low
et.al, 2004a, Fatemeh et.al, 2011, Sudimack et.al, 2000, Stella et.al, 2000, Patil et.al,
2008).
Design of Nanoparticulate Drug Delivery Systems for targeting the anti-tubercular
drugs with enhanced bioavailability can prove to be an effective and practical
approach. The present project deals with the design and evaluation of folate anchored

Poly (ethylene sebacate) Nanoparticles of Anti-Tubercular Drugs
20 Particulate Carriers as Drug Delivery Systems for Anti-Tubercular and Anti-Cancer Agents
targeted nanoparticulate drug delivery system (NPDDS) of antitubercular drugs with
simultaneous entrapment of two drugs of different solubility, high entrapment
efficiency and desirable particle size for macrophage uptake and targeting. Poly
(ethylene sebacate) (PES) is a novel hydrolytically stable, nonionic, biocompatible
and biodegradable, non-mutagenic and non-genotoxic polymer was selected for the
present study (Deverajan et al., 2006, More et al., 2009).
The following specific NPDDS were evaluated.
A. PES-rifampicin nanoparticles with and without folic acid
B. PES-rifampicin-ethambutol combination nanoparticles with and without folic
acid
C. PES-rifampicin-MSDNC-22 (a new chemical entity) combination
nanoparticles with and without folic acid

2. Drug Profile

Poly (ethylene sebacate) Nanoparticles of Anti-Tubercular Drugs
21 Particulate Carriers as Drug Delivery Systems for Anti-Tubercular and Anti-Cancer Agents
2 DRUG PROFILE 2.1. RIFAMPICIN
Rifampicin or rifampin is a bactericidal antibiotic of the rifamycin group used to
treat Mycobacterium infections, including tuberculosis and leprosy; and also has a
role in the treatment of methicillin-resistant Staphylococcus aureus (MRSA) in
combination with fusidic acid.
Rifampicin is a semisynthetic derivative of rifamycin antibiotics which are produced
by the fermentation of a strain of Streptomyces mediterranei, a species which was first
isolated in Italy in 1957 from a soil sample collected in France. The fermentation
produces rifamycin B. Rifamycin B is transformed by a series of reactions into 3-
formylrifamycin SV, which in turn is condensed with 1-amino-4-methylpiperazine in
peroxide-free tetrahydrofuran to give rifampicin.
It is used in the treatment of tuberculosis mainly in combination with other drugs like,
isoniazid, ethambutol,and pyrazinamide, as a fixed dose combination (FDC). This is
mainly due to the reason that the tubercule bacillus is reported to develop resistance
with single drugs. But the main disadvantage reported with fixed dose combinations is
poor/variable bioavailability of rifampicin.
2.1.1. Chemical structure:
Formula - C43H58N4O12 Molecular weight - 822.94 g/mol
2.1.2. Chemical name- 5,6,9,17,19,21-Hexahydroxy-23-methoxy-2,4,12,16,18,20, 22
-heptamethyl-8-[N-(4-methyl-1-piperazinyl)formimidoyl]-2,7(epoxypentadeca
[1,11,13]trienimino)-naphtho[2,1-b]furan-1,11(2H)-dione 21-acetate
2.1.3. CAS number - 13292-46-1
2.1.4. Physicochemical properties
The drug is red to orange, odourless and is available in crystalline form. It is very
slightly soluble in water (1 g in approximately about 762 mL water [pH < 6]),

Poly (ethylene sebacate) Nanoparticles of Anti-Tubercular Drugs
22 Particulate Carriers as Drug Delivery Systems for Anti-Tubercular and Anti-Cancer Agents
acetone, carbon tetrachloride, alcohol, ether. Freely soluble in chloroform, DMSO;
soluble in ethyl acetate and methyl alcohol and tetrahydrofuran. Solubility in aqueous
solutions is increased at acidic pH. Melting point ranges from 138 to 188 °C.
Rifampicin has 2 pKa since it is a Zwitterion, pKa 1.7 related to 4-hydroxy and pKa
7.9 related to 3-piperazine nitrogen (Merck Index, 1989). A 1% suspension in water
has pH 4.5 to 6.5.
2.1.5. Analysis
Methods reported for analysis of rifampicin are HPLC (Panchgnula et al, 2004, Blain
et al, 1998, Singh et al, 2003), HPTLC (Shishoo et al, 1999, Shah et al, 2001, Argekar
et al, 1996), Dual wavelength UV vis spectrophotometry: (Shishoo et al, 1999),
Voltametric Assay: (Hammam et al, 2004), and Colorimetric analysis (Mariappan et
al, 2004).
2.1.6. Stability (Gallo and Radaelli et al., 1976)
Rifampicin is very stable in the solid state in sealedcontainers at room temperature as
well as temperature upto 70ºC. The stability of rifampicin in aqueous solution has
been widely investigated and the conditions and the transformation products are
reported below.
Conditions Transformed products
pH 2.3 at 20-22ºC and 0.1N HCl at 37ºC 3-Formyl-rifampicin SV
pH 8.2 at 20-22ºC Rifampicin-quinone
NaOH 5% in ethanol:Water (1:1) 20-22ºC 25-desacetyl rifampicin
pH 8.2 at 60-70ºC
25-desacetyl rifampicin
25-desacetyl-21-acetyl rifampicin
25-desacetyl-23-acetyl rifampicin
2.1.7. Indications
Rifampicin is typically used to treat Mycobacterium infections, including tuberculosis
and leprosy; and also has a role in the treatment of methicillin-resistant
Staphylococcus aureus (MRSA) in combination with fusidic acid. It is used in
prophylactic therapy against Neisseria meningitidis (meningococcal) infection.
2.1.8. Mechanism of action
Rifampicin inhibits DNA-dependent RNA polymerase in bacterial cells by binding its
beta subunit, thus preventing transcription of messenger RNA (mRNA) and
subsequent translation to proteins. Rifampicin may be bacteriostatic or bactericidal

Poly (ethylene sebacate) Nanoparticles of Anti-Tubercular Drugs
23 Particulate Carriers as Drug Delivery Systems for Anti-Tubercular and Anti-Cancer Agents
depending on the concentration of drug attained at the site of infection. The
bactericidal actions are secondary to interfering with the synthesis of nucleic acids by
inhibiting bacterial DNA-dependent RNA polymerase at the B-subunit thus
preventing initiation of RNA transcription, but not chain elongation.
2.1.9. Pharmacokinetic properties:
It has the bioavailability of 90-95 % but it is erratic, and half life of 6-7 hrs.
Rifampicin is readily absorbed mostly from the upper gastrointestinal tract (90%).
Peak plasma concentration occurs at 1.5 to 4hours after an oral dose. Eighty nine per
cent of rifampicin in circulation is bound to plasma proteins. It is lipid soluble. It is
widely distributed in body tissues and fluids. Approximately 85% of rifampicin is
metabolised by the liver microsomal enzymes to its main and active metabolite-
deacetylrifampicin. Rifampicin undergoes enterohepatic recirculation but not the
deacetylated form. Rifampicin metabolite deacetylrifampicin is excreted in the bile
and also in the urine. Approximately 50% of the rifampicin dose is eliminated within
24 hours and 6 to 30% of the drug is excreted unchanged in the urine, while 15% is
excreted as active metabolite. Approximately 43 to 60% of oral dose is excreted in
the faeces.
2.1.10. Adverse effects
Adverse effects are chiefly related to the drug's hepatotoxicity, and patients receiving
rifampicin often undergo liver function tests including aspartate aminotransferase
(AST).The most common unwanted effects are fever, gastrointestinal disturbances,
rashes and immunological reactions. Liver damage, associated with jaundice, has also
been reported and in some rare cases has led to death.
2.1.11. Contraindications
Rifampicin is contraindicated in known cases of hypersensitivity to the drug. It may
be contraindicated in pregnancy (because of teratogenicity noted in animal studies and
since the effects of drugs on fetus has not been established) except in the presence of
a disease such as severe tuberculosis. It is contraindicated in alcoholics with severely
impaired liver function and with jaundice
2.1.12. Brand names/Trade names
Rifampicin capsule/tablet of 150mg, 300mg, 450mg and 600mg available with
different brand names are as follow:
FAMCIN (IDPL), KEMORIFA (Chemo), MACOX (Macleods), R-CIN (Lupin),
RIFACEPT (Concept), RIFACILLIN (PCI), RIFAMPILA (Alb. David),

Poly (ethylene sebacate) Nanoparticles of Anti-Tubercular Drugs
24 Particulate Carriers as Drug Delivery Systems for Anti-Tubercular and Anti-Cancer Agents
RFAMYCIN (Biochem), RIFAPLUS CAPS (Redicura), RIMACTANE (Sandoz-
Novartis), RIMPACIN (Zydus Cadila), RIMPIN (Lyka Hetero), TICIN (Themis),
ZUCOX (GSK).
Also rifampicin Syrup – 100mg/5ml are available.
2.2. ETHAMBUTOL
Ethambutol (commonly abbreviated EMB, ETH or simply E) is a bacteriostatic
antimycobacterial drug prescribed to treat tuberculosis. It is usually given in
combination with other tuberculosis drugs, such as isoniazid, rifampicin and
pyrazinamide. It is sold under the trade names Myambutol and Servambutol.
2.2.1. Formula: C10H24N2O2
2.2.2. Mol. Wt: 204.31 g/mol
2.2.3. Chemical name: (2S,2′S)-2,2′-(ethane-1,2-diyldiimino)dibutan-1-ol
2.2.4. CAS number:
Ethambutol 74-55-5
Ethambutol hydrochloride 1070-11-7
Dose 15-20mg/kg body wt
2.2.5. Physicochemical Properties:
Colour - White
State/Form - Crystalline hygroscopic powder
Description - Odourless or almost odourless, Bitter taste
Melting point - 199 °C to 204 °C
Soluble 1 in 1 of water, 1 in 4 of alcohol, 1 in 850 of chloroform, and 1 in 9 of methyl
alcohol; very slightly soluble in ether. A solution in water is dextrorotatory. Solutions
are stable when heated at 121 °C for 10 minutes.
Storage conditions - Store in airtight containers between 15 to 30°C

Poly (ethylene sebacate) Nanoparticles of Anti-Tubercular Drugs
25 Particulate Carriers as Drug Delivery Systems for Anti-Tubercular and Anti-Cancer Agents
2.2.6. Analysis
Methods reported for analysis of ethambutol are HPLC with fluorescence detection
(Breda et al., 1996,) HPLC with UV detection (Chenevier et al., 1998), HPLC with
mass detection (Conte et al., 2002), Gas chromatography (Wang et al., 1980), and Gas
chromatography with mass detection (Holdiness et al., 1981).
2.2.7. Mechanism of action
Ethambutol is bacteriostatic against actively growing TB bacilli. It works by
obstructing the formation of cell wall. Mycolic acids attach to the 5'-hydroxyl groups
of D-arabinose residues of arabinogalactan and form mycolyl-arabinogalactan-
peptidoglycan complex in the cell wall. It disrupts arabinogalactan synthesis by
inhibiting the enzyme arabinosyl transferase. Disruption of the arabinogalactan
synthesis inhibits the formation of this complex and leads to increased permeability of
the cell wall.
2.2.8. Pharmacokinetics
It is well absorbed from the gastrointestinal tract and well distributed in body tissues
and fluids, 50% is excreted unchanged in urine.
2.2.9. Side effects
Headache, loss of appetite, upset stomach, or nausea/vomiting may occur. If any of
these effects persist or worsen, tell your doctor or pharmacist promptly.Remember
that your doctor has prescribed this medication because he or she has judged that the
benefit to you is greater than the risk of side effects. Many people using this
medication do not have serious side effects.Tell your doctor immediately if any of
these unlikely but serious side effects occur: vision changes (such as
blurred/decreased vision, color blindness), symptoms of liver disease (such as
persistent nausea/vomiting, unusual tiredness/weakness, severe stomach/abdominal
pain, yellowing eyes/skin, dark urine), numbness/tingling of arms/legs, toe/joint pain.
Tell your doctor immediately if any of these rare but serious side effects occur:
mental/mood disorders (such as confusion, hallucinations), signs of a new infection
(such as fever, persistent sore throat), easy bleeding/bruising.A very serious allergic
reaction to this drug is rare. However, seek immediate medical attention if you notice
any symptoms of a serious allergic reaction, including: rash, itching/swelling
(especially of the face/tongue/throat), severe dizziness, trouble breathing.

Poly (ethylene sebacate) Nanoparticles of Anti-Tubercular Drugs
26 Particulate Carriers as Drug Delivery Systems for Anti-Tubercular and Anti-Cancer Agents
2.2.10. Drug interactions
The effects of some drugs can change if you take other drugs or herbal products at the
same time. This can increase your risk for serious side effects or may cause your
medications not to work correctly. These drug interactions are possible, but do not
always occur. Your doctor or pharmacist can often prevent or manage interactions by
changing how you use your medications or by close monitoring. To help your doctor
and pharmacist give you the best care, be sure to tell your doctor and pharmacist
about all the products you use (including prescription drugs, nonprescription drugs,
and herbal products) before starting treatment with this product. While using this
product, do not start, stop, or change the dosage of any other medicines you are using
without your doctor's approval. Keep a list of all the products you use. Share the list
with your doctor and pharmacist to reduce your risk for serious medication problems.
2.2.11. Precautions
Before taking ethambutol, tell your doctor or pharmacist if you are allergic to it; or if
you have any other allergies. This product may contain inactive ingredients, which
can cause allergic reactions or other problems. Before using this medication, tell your
doctor or pharmacist your medical history, especially of: eye problems (such as optic
neuritis, cataracts, diabetic retinopathy), liver disease, kidney disease, alcohol use.
Before having surgery, tell your doctor or dentist about all the products you use
(including prescription drugs, nonprescription drugs, and herbal products).
Alcohol may increase the risk of liver disease. Avoid alcoholic beverages while using
this medication. During pregnancy, this medication should be used only when clearly
needed. Discuss the risks and benefits with your doctor. This medication passes into
breast milk but is unlikely to harm a nursing infant. Consult your doctor before breast-
feeding. If you have HIV disease, do not breast-feed because breast milk can transmit
HIV.
2.2.12. Contraindications:
Ethambutol hydrochloride is contraindicated in patients who are known to be
hypersensitive to his drug. Renal impairment, old age and optic neuritis are relative
contraindications.
2.2.13. Brand names/Trade names
Ethambutol (Argentina); Myambutol (Australia, Belgium, Canada, Denmark, France,
Germany, Netherlands, South Africa, Spain, Sweden, Switzerland, UK, USA), Mynah
(UK), Etibi (Canada), Dexambutol (France), EMS-Fasol (Germany), Etambutyl,

Poly (ethylene sebacate) Nanoparticles of Anti-Tubercular Drugs
27 Particulate Carriers as Drug Delivery Systems for Anti-Tubercular and Anti-Cancer Agents
Etapiam, Miambutol, Mycobutol and Tibutolo (Italy), Afimocil, Anvital, Cidanbutol,
Etambin, Farmabutol, Fimbutol, Inagen and Tisiobutol (Spain)
2.3. MSDNC22 (Tawari et al., 2010)
2.3.1. Chemical structure:
OO2N
O
N
2.3.2. Molecular formula: C18 H18 N2 O4
2.3.3. Molecular weight: 326.35
2.3.4. Chemical name: (E)-3-(5-nitrofuran-2-yl)-1-(4-(piperidin-1-yl) phenyl) prop-
2-en-1-one
2.3.5. Minimum inhibitory concentration (MIC): 0.19 mcg/ml
2.3.6. Solubility: Soluble in tetrahydrofuran, dichloromethane, methyl ethyl ketone
and acetone, practically insoluble in methanol, ethanol and water

3. Analytical Method Development

Poly (ethylene sebacate) Nanoparticles of Anti-Tubercular Drugs
28 Particulate Carriers as Drug Delivery Systems for Anti-Tubercular and Anti-Cancer Agents
3. ANALYTICAL METHOD DEVELOPMENT 3.1. RIFAMPICIN AND FOLIC ACID
The following two methods for the analysis of drug/s were developed:
UV Spectrophotometry
HPLC (High performance liquid chromatography) method
3.1.1. UV SPECTROPHOTOMETRY
UV spectrophotometric method were developed for routine analysis of
i) Rifampicin
ii) Folic acid
iii) Rifampicin in combination with Folic acid
Introduction
A UV spectrophotometric method was developed for the routine analysis of
rifampicin during dissolution studies and drug content analysis. Although the method
cannot be used easily for multicomponent formulations or formulations containing
interfering excipients, but ease of operation, low cost and low analysis time make it
the most popular analytical technique.
Materials
Rifampicin was obtained as a gift sample from Maneesh Pharma (India). Distilled
water was used during UV analysis. All other chemicals and solvents were analytical
– reagent grade and were purchased from s. d. fine chemicals, India. Instrumentation
UV1650PC, Schimadzu Corporation US spectrophotometer was used for analysis.
Preparation of standard curve
Approximately 5mg of rifampicin was accurately weighed and transferred to a 10mL
volumetric flask. It was dissolved in minimum amount of methanol (~1mL) and
volume was made up to 10mL with 0.1N HCl to obtain a primary stock solution of
concentration 500μg/mL. An aliquot 0.2mL was further diluted with 0.1N HCl to
10mL. This standard solutions of rifampicin (10μg/mL) were scanned in the range
from 200-600 nm on UV1650PC, Schimadzu Corporation US spectrophotometer.
Aliquots of the standard solution (500μg/mL) corresponding to 0.1, 0.2, 0.3, 0.4, 0.5,
0.6mL were diluted to 10mL in volumetric flasks with 0.1N HCl to obtain standard
solutions of concentrations 5, 10, 15, 20, 25, 30μg/mL respectively. The absorbance
of these solutions was recorded at 475 nm and plotted vs. the concentration to give the

Poly (ethylene sebacate) Nanoparticles of Anti-Tubercular Drugs
29 Particulate Carriers as Drug Delivery Systems for Anti-Tubercular and Anti-Cancer Agents
Beer Lamberts plot for the standard curve. Similarly standard curve was developed in
methanol, pH 7.4, and PBS pH 7.4 by recording the absorbance at 475 nm.
Results and Discussion
The standard curves of RIF in 0.1N HCl, methanol, pH 7.4, and phosphate buffer
saline pH 7.4 are depicted in Figure 3.1. Standard curve parameters of UV-
Spectroscopic method for RIF are listed in Table 3.1.
std curve in 0.1N HCl
y = 0.0116x + 0.0008R2 = 0.9998
00.050.1
0.150.2
0.250.3
0.350.4
0 5 10 15 20 25 30
concentration (mcg/ml)
abso
rban
ce
std curve in methanol
y = 0.0181x + 0.0055R2 = 0.9995
0
0.1
0.2
0.3
0.4
0.5
0.6
0 5 10 15 20 25 30
concentration (mcg/ml)
abso
rban
ce
a) 0.1 N HCl b) Methanol
c) PBS pH 7.4 d) pH 7.4
Figure 3.1: Standard curves of rifampicin
Table 3.1: Standard curve parameters for rifampicin
Active agent Medium λmax Beer’s law range Slope Intercept r2
Rifampicin
0.1N HCl 475 nm 2.5-30 mcg/ml 0.0115 0.003 0.9999Methanol 475 nm 2.5-30 mcg/ml 0.0181 0.0055 0.9995
pH 7.4 475 nm 2.5-30 mcg/ml 0.018 0.001 0.999 PBS 7.4 475 nm 2.5-20 mcg/ml 0.017 0.007 0.999
The UV-spectroscopic method was precise and can be used for the routine analysis of
RIF.

Poly (ethylene sebacate) Nanoparticles of Anti-Tubercular Drugs
30 Particulate Carriers as Drug Delivery Systems for Anti-Tubercular and Anti-Cancer Agents
ii) Folic acid
Preparation of standard curve: Approximately 10mg of folic acid was accurately
weighed and transferred to a 10mL volumetric flask. It was dissolved in 0.1N NaOH
and volume was made up to 10mL to obtain a primary stock solution of concentration
1000μg/mL. An aliquot of 1mL was further diluted with 0.1N NaOH to 10mL to give
solution of concentration 100μg/mL. Further an aliquot of 1mL was diluted with 0.1N
NaOH to 10mL to give solution of concentration 10μg/mL. This standard solutions of
folic acid (10μg/mL) was scanned in the range from 200-600 nm on UV1650PC,
Schimadzu Corporation US spectrophotometer.
Aliquots of the standard solution (100μg/mL) corresponding to 0.2, 0.5, 0.75, 1.0,
1.25, 1.5 and 1.75mL were diluted to 10mL in volumetric flasks with 0.1N NaOH to
obtain standard solutions of concentrations 2, 5, 7.5, 10, 12.5, 15, and 17.5μg/mL
respectively. The absorbance of these solutions was recorded at λmax 256.5 nm and
plotted vs. the concentration to give the Beer Lamberts plot for the standard curve.
Similarly standard curve was developed in PBS pH 7.4 by recording the absorbance at
λmax 256.5 nm.
Results and Discussion
The standard curves of folic acid in 0.1N NaOH, and phosphate buffer saline pH 7.4
are depicted in Figure 3.2. Standard curve parameters of UV-Spectroscopic method
for folic acid are listed in Table 3.2.
a) 0.1 N NaOH b) PBS pH 7.4
Figure 3.2: Standard curves of folic acid

Poly (ethylene sebacate) Nanoparticles of Anti-Tubercular Drugs
31 Particulate Carriers as Drug Delivery Systems for Anti-Tubercular and Anti-Cancer Agents
Table 3.2: Standard curve parameters for folic acid
Active agent Medium λmax
Beer’s law range Slope Intercept r2
Folic Acid 0.1N NaOH 256.5nm 2-17.5 µg/mL 0.0547 0.0119 0.9999PBS pH 7.2 280 nm 0.25-10 µg/mL 0.065 0.005 0.999
The UV-spectroscopic method was precise and can be used for the routine analysis of
folic acid.
iii) Rifampicin in combination with Folic acid
The concentrations of RIF and folic acid in combination were determined as follows.
Briefly, 10mg folic acid was dissolved in 0.5mL of 0.1 N NaOH, and volume made
~15 ml with water. To this solution 10mg of Rifampicin was added and dissolved by
sonication and volume made upto 20mL to obtain a concentration of 500µg/mL of
folic acid and rifampicin (Solution A).
Rifampicin analysis: Solution A (0.2mL) was diluted to 10mL with water to get
concentration 10µg/mL rifampicin and was analyzed by UV-Visible
spectrophotometry at λmax of 475nm without any interference.
Folic acid analysis: Dichloromethane (5mL) was added to 5mL of Solution A, mixed
on vortex mixer for 15mins, and allowed to separate for 1h. Dichloromethane (DCM)
and water are immiscible, RIF partitions into DCM and upper aqueous phase contains
folic Acid. The supernatant (0.2mL) was diluted to 10mL with 0.1 N NaOH and was
analyzed by UV-Visible spectrophotometry at λmax of 256.5nm without any
interference, from RIF.
The method for quantifying RIF and folic acid in combination was standardized as
follows:
i) Effect of Partition rate
After the addition of DCM (5mL) to the solution A containing mixture of RIF and
folic acid, the concentration of folic acid was monitored in the aqueous phase at
different time intervals viz. 1, 2 and 4 hrs to determine any interference from
unextracted RIF.
ii) Effect of surfactant and stabilizer concentration
The concentration of surfactant and stabilizer that is used in nanoparticles preparation
is added to the solution containing combination of RIF and folic acid, so as to check

Poly (ethylene sebacate) Nanoparticles of Anti-Tubercular Drugs
32 Particulate Carriers as Drug Delivery Systems for Anti-Tubercular and Anti-Cancer Agents
for its/their interference in analysis of RIF and folic acid. The concentration of RIF
and folic acid was determined in presence of surfactants AOT and stabilizer PVA.
Results and Discussion
Drug content values ranged between 98-102% for RIF and 100-103% for folic acid
when analyzed in combinations with the developed extraction method.
i) Effect of Partition rate:
Drug content values at different time intervals viz. 1, 2 and 4 h revealed less than 2
percent relative standard deviation values (Table 3.3) and indicating no interference in
analysis of folic acid and hence it can be concluded that complete extraction of RIF is
achieved within 1h.
Table 3.3: Partition rate of RIF at different time intervals
Time (H) Absorbance at 256.5 nm Drug content of folic acid 1 0.554, 0.550 97.8 2 0.560, 0.565 99.7 4 0.555, 0.549 97.81
%RSD 1.11
ii) Effect of surfactant concentration:
Table 3.4: Effect of surfactant concentration on RIF analysis at different time intervals
Time (H) Absorbance at 256.5 nm Drug content of folic acid 1 0.548, 0.545 96.81 2 0.560, 0.540 97.45 4 0.558, 0.561 99.18
%RSD 1.25
Surfactant concentration did not affect in the analysis of folic acid as indicated by the
drug content values at the end of 4h revealing less than 2% relative standard deviation
values (Table 3.4). RSD value <2% suggest good precision of the method.
Conclusion
The UV-spectroscopic method was precise and can be used for the routine analysis of
RIF and folic acid from combination.

Poly (ethylene sebacate) Nanoparticles of Anti-Tubercular Drugs
33 Particulate Carriers as Drug Delivery Systems for Anti-Tubercular and Anti-Cancer Agents
3.1.2. STABILITY INDICATING HPLC METHOD
A stability indicating RP-HPLC method for the analysis of RIF as a bulk drug and in
pharmaceutical formulations was developed and validated.
Introduction
The objective of the present work was to develop and validate a stability indicating
RP-HPLC method for the assay of rifampicin as a bulk drug and in pharmaceutical
formulations.
Materials
Rifampicin was obtained as a gift sample from Maneesh Pharma (India). Glass
distilled water was used during HPLC analysis. All other chemicals and solvents were
analytical – reagent grade and were purchased from s.d. Fine Chemicals, India Instrumentation:
The HPLC system used was JASCO LC900 Intelligent pump (jasco japan) coupled
with UV detector and Rheodyne injector model (7725) fitted with 20μl sample loop.
Data integration was done by Borwin chromatography software version 1.21.
Chromatography
Chromatography was performed on a Waters Spherisorb® S5 ODS2 (250 × 4 mm i.d.,
5μm particle size) column. The mobile phase comprised of methanol: (0.01M) sodium
phosphate buffer pH 5.2 (pH adjusted by o-phosphoric acid) in the ratio 65:35 v/v.
The mobile phase was filtered through a nylon membrane (0.22 μm, Pall Gelman) and
degassed by sonication prior to use. Chromatography was performed at room
temperature under isocratic conditions at a flow rate of 1mL/min. UV detection was
done at a λmax of 254nm [Panchgnula et al., 1999].
Preparation of standard solutions
Rifampicin (10mg) was accurately weighed and transferred to a 10mL volumetric
flask. The volume was made up to 10 mL with methanol to obtain a stock solution
(1000μg/mL). From the above solution, 2mL was diluted upto 10mL with mobile
phase to get stock solution having concentration of 200μg/mL. Aliquots of this
solution corresponding to 0.05, 0.1, 0.2, 0.3, 0.4, 0.5, and 0.6mL were diluted to
10mL with the mobile phase to obtain solutions in the concentration range of 1–
12μg/mL. Each solution was injected twice to obtain the output in duplicate. Average
of the peak areas were considered for calculation purposes.
Poly (ethylene sebacate) Nanoparticles of Anti-Tubercular Drugs
34 Particulate Carriers as Drug Delivery Systems for Anti-Tubercular and Anti-Cancer Agents
Validation
a) Stability of analyte in solution:
The stability of rifampicin in mobile phase was assessed by injecting the standard
solution (4μg/mL) at interval of 0 and 24 hrs post preparation kept in amber colored
volumetric flasks at room temperature. The chromatograms were checked for
presence of peaks corresponding to degraded product.
b) Linearity
Standard solutions (1, 2, 4, 6, 8, 10 and 12μg/mL), each in three replicates, were
injected into the system. The method of linear regression was used for data
evaluation. Peak areas were plotted against theoretical concentrations of standards.
Linearity was expressed as a correlation coefficient.
c) Precision:
System precision (repeatability) was determined by performing four consecutive
injections of the 6μg/mL standard solution. Method precision was determined by
injecting three different samples (10μg/mL) prepared individually.
Forced Degradation Studies
It was necessary to perform forced degradation studies to verify and prove the
stability-indicating feature of the proposed method. Intentional degradation was
attempted by heating the drug in the presence of base, acid and hydrogen peroxide
and exposing to sunlight.
i) Acid degradation
To 0.6mL of standard stock solution (200μg/mL) of rifampicin, 1mL of 1N HCl was
added and the solution was placed in a boiling water bath for 30min. The sample was
allowed to cool to room temperature and neutralized using 1N NaOH. The volume
was adjusted to 10mL with distilled water, and this solution was injected in the HPLC
column.
ii) Base degradation
To 0.6mL of standard stock solution (200μg/mL) of rifampicin, 1mL of 1N NaOH
was added and the solution was placed in a boiling water bath for 30min. The sample
was allowed to cool to room temperature and neutralized using 1N HCl. The volume
was adjusted to 10mL with distilled water, and this solution was injected in the HPLC
column.

Poly (ethylene sebacate) Nanoparticles of Anti-Tubercular Drugs
35 Particulate Carriers as Drug Delivery Systems for Anti-Tubercular and Anti-Cancer Agents
iii) Oxidation
To 0.6mL of standard stock solution (200μg/mL) of rifampicin, 1mL of 30% H2O2
was added and the solution was placed in a boiling water bath for 30min. The sample
was allowed to cool to room temperature. The volume was adjusted to 10mL with
distilled water, and this solution was injected in the HPLC column.
iv) Photodegradation
Drug solution (10μg/mL) in methanol was exposed to sunlight for 2h and this solution
was injected in the HPLC column.
The degraded samples were analyzed against an untreated control sample.
Results and Discussion
a) Stability of analyte in solution
Rifampicin was found to be stable in the mobile phase, when the standard solution of
strength 4μg/mL was analyzed at 0-24 h post preparation. No peaks corresponding to
the degradation products were observed. A low RSD value of 2.17 per cent indicated
that there was no significant change in the drug peak area (Table 3.5).
Table 3.5: Stability of rifampicin in solution
Time ( hr) Area (1) Area (2) Area (3) Average Mean concentration %RSD0 135480 133585 136874.1 134773.4 99.53784 2.17 24 131023.3 139025.8 132652.5 134233.8
b) Linearity
Figure 3.3: Standard curve of rifampicin by HPLC
Graph of the peak area vs concentration was plotted in order to check the linearity.
The developed method was found to be linear between concentration range of 1-
12μg/mL (Figure 3.3.) The regression coefficient was found to be 0.998.
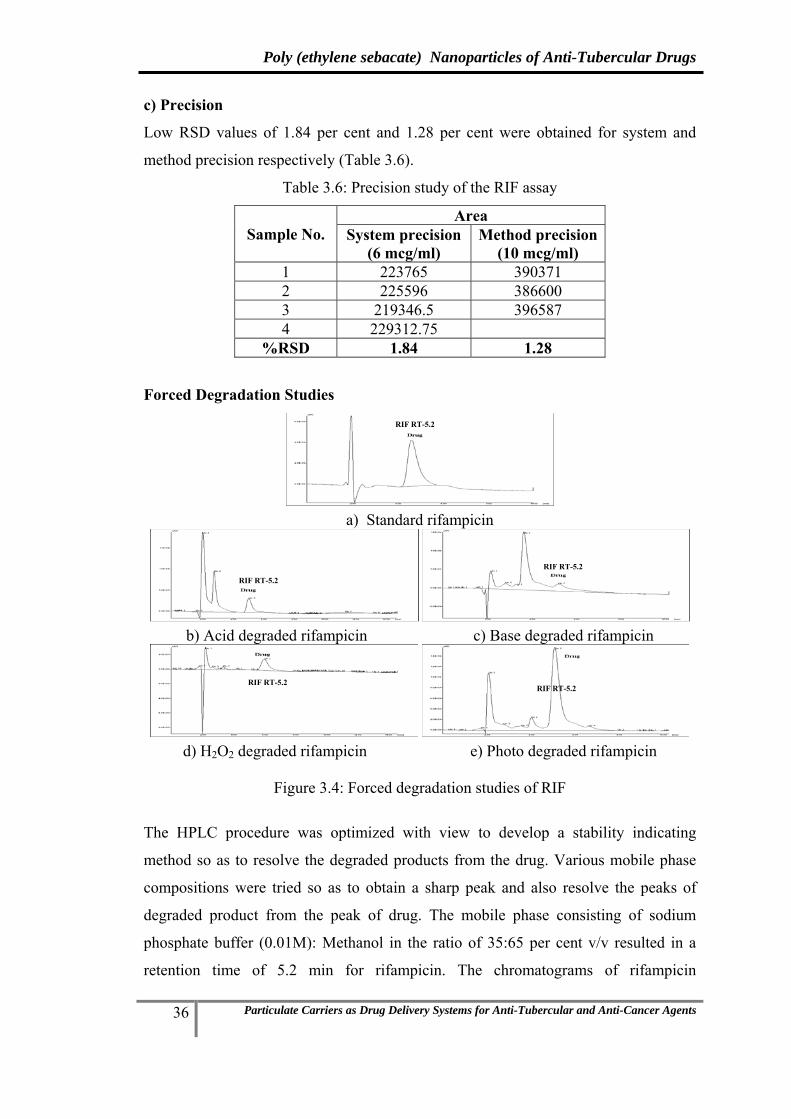
Poly (ethylene sebacate) Nanoparticles of Anti-Tubercular Drugs
36 Particulate Carriers as Drug Delivery Systems for Anti-Tubercular and Anti-Cancer Agents
c) Precision
Low RSD values of 1.84 per cent and 1.28 per cent were obtained for system and
method precision respectively (Table 3.6).
Table 3.6: Precision study of the RIF assay
Sample No. Area
System precision (6 mcg/ml)
Method precision (10 mcg/ml)
1 223765 390371 2 225596 386600 3 219346.5 396587 4 229312.75
%RSD 1.84 1.28
Forced Degradation Studies
a) Standard rifampicin
b) Acid degraded rifampicin c) Base degraded rifampicin
d) H2O2 degraded rifampicin e) Photo degraded rifampicin
Figure 3.4: Forced degradation studies of RIF
The HPLC procedure was optimized with view to develop a stability indicating
method so as to resolve the degraded products from the drug. Various mobile phase
compositions were tried so as to obtain a sharp peak and also resolve the peaks of
degraded product from the peak of drug. The mobile phase consisting of sodium
phosphate buffer (0.01M): Methanol in the ratio of 35:65 per cent v/v resulted in a
retention time of 5.2 min for rifampicin. The chromatograms of rifampicin
RIF RT-5.2
RIF RT-5.2
RIF RT-5.2
RIF RT-5.2 RIF RT-5.2

Poly (ethylene sebacate) Nanoparticles of Anti-Tubercular Drugs
37 Particulate Carriers as Drug Delivery Systems for Anti-Tubercular and Anti-Cancer Agents
(undegraded) and rifampicin degraded in the presence of acid, base, hydrogen
peroxide (H2O2) (oxidative degradation) and light (photo degradation) are shown in
Figure 3.4 and indicated a good separation of the undegraded drug from the
degradation products. Rifampicin is known to be degraded in presence of acid, base,
and light and also oxidized by peroxide. In our force degradation study same results
was observed. Acid degradation product was appeared around 3min, base degradation
products at 3min and 4min, peroxide degradation product at 3.5min and
photodegradation product was appeared at 4min. The peaks of all the degraded
products were resolved from the rifampicin peak.
Conclusion
The RP-HPLC method developed for rifampicin was found to be precise, rapid,
accurate, and stability indicating. Thus the method could be used for determining the
stability of rifampicin.
3.1.3. HPLC METHOD FOR DETERMINATION OF RIFAMPICIN FROM
MACROPHAGE CELLS
Instrumentation
The HPLC system used was JASCO LC900 Intelligent pump (jasco japan) coupled
with UV detector and Rheodyne injector model (7725) fitted with 20μl sample loop.
Data integration was done by Borwin chromatography software version 1.21.
Chromatography
Chromatography was performed on a Waters Spherisorb® S5 ODS2 (250 × 4 mm i.d.,
5 μm particle size) column. The mobile phase comprised of methanol: (0.01M)
sodium phosphate buffer pH 5.2 (pH adjusted by o-phosphoric acid) in the ratio 65:35
v/v. The mobile phase was filtered through a nylon membrane (0.22 μm, Pall
Gelman) and degassed by sonication prior to use. Chromatography was performed at
room temperature under isocratic conditions at a flow rate of 1 mL/min. UV detection
was done at a λmax of 254 nm.[Panchgnula R, et al, 1999]
Preparation of standard solutions
Rifampicin was accurately weighed (10mg) and transferred to a 10 mL volumetric
flask. The volume was made up to 10mL with methanol to obtain a stock solution
(1000μg/mL). From the above solution, 0.2mL was diluted upto 10mL with mobile
phase to get concentration of (200μg/mL)(Stock solution). Aliquots of this solution

Poly (ethylene sebacate) Nanoparticles of Anti-Tubercular Drugs
38 Particulate Carriers as Drug Delivery Systems for Anti-Tubercular and Anti-Cancer Agents
corresponding to 0.1, 0.2, 0.3, 0.4, 0.5 and 0.6mL were diluted to 10mL to get
concentration range from 2 to 12μg/mL. Each solution was injected twice to obtain
the output in duplicate. Average of the peak areas were considered for calculation
purposes.
Recovery of RIF from macrophage cells
A suspension of U-937 of histiocytic lymphoma origin macrophage like cells at a cell
density 2*106 cells/mL in RPMI media containing 10% fetal calf serum was prepared.
A solution of 0.5% sodium dodecyl sulphate (in PBS) was added to the cell
suspension in a ratio of (1:1) and the dispersion sonicated to enable cell lysis. The
dispersion was than centrifuged, the supernatant served as blank. To determine RIF
recovery from macrophage cells, RIF solution (100µL) (20–1200µg/mL) was spiked
to drug-free blank macrophage cells (400µL) and vortexed vigorously for 2min.
Methanol (500µL) was added to precipitate protein and the dispersion vortexed for
2min followed by centrifuged at 20,000 rpm for 20min at 25ºC. The supernatant was
injected into the HPLC system. Recovery of RIF from macrophage cells was
calculated by comparing the peak heights of standard RIF solution.
Validation
The chromatographic method was validated for linearity, specificity, sensitivity,
precision, accuracy and stability.
i) Linearity: All validation runs were performed in triplicate to assess variation.
Calibration curves were constructed in macrophage cells over the concentration range
2 – 12 μg/ml for RIF.
ii) Sensitivity: Limit of quantification (LOQ) of standard drug and spiked
macrophage cells was determined at a signal to noise ratio of 1:10.
iii) Precision: System precision (repeatability) was determined by performing four
consecutive injections of the 2μg/ml for RIF. Method precision was determined by
injecting three different samples of 4μg/ml for RIF prepared individually.
Results and Discussion
Rifampicin from macrophage cells
The developed method showed good resolution of the drug with retention time (RT)
of 7.2 mins with no interference. The chromatograms indicate that RIF peaks are well
separated from other peaks of cells protein (Figure 3.5). The HPLC analytical method
was found to be linear between concentration range of 2-12 μg/ml in the presence of

Poly (ethylene sebacate) Nanoparticles of Anti-Tubercular Drugs
39 Particulate Carriers as Drug Delivery Systems for Anti-Tubercular and Anti-Cancer Agents
macrophage cells and other media supplements with high correlation coefficient of
0.9995 (Figure 3.6). The standard curve of RIF after extraction from macrophage cells
is shown in Fig 3.6.
Figure 3.5: Chromatogram of RIF after recovery from macrophage cells
Figure 3.6: Standard curve of rifampicin after recovery from macrophage cells
Table 3.7: Recovery data of RIF from macrophage cells
Conc. In ng/ml Avg std area Avg spiked area %recovery 1000 35210 31828
91.68 34257 30512 33589 32781
8000 307766 281687 94.7 315488 295674
294567 291874 Average % recovery 93.19
Recovery was greater than 90% (Table 3.7) and low RSD values (<5%) were obtained
for system and method precision (Table 3.8).
Blank cells
RIF from macrophage cells

Poly (ethylene sebacate) Nanoparticles of Anti-Tubercular Drugs
40 Particulate Carriers as Drug Delivery Systems for Anti-Tubercular and Anti-Cancer Agents
Table 3.8: Precision data of RIF from macrophage cells
Sample No. Area
System precision(2000 ng/ml)
Method precision (4000 ng/ml)
1 88013 183159 2 84793.5 173120 3 89796.75 171012.5 4 89312.75 %RSD 2.56 3.69
HPLC method was validated for linearity, specificity, sensitivity, precision, &
stability thus establishing that the method can be efficiently used for uptake study of
RIF from macrophage cells.
Conclusion
The RP-HPLC method developed for rifampicin was found to be specific, precise,
rapid and accurate. Thus the method could be efficiently used for uptake study of
rifampicin in macrophage cells.
3.1.4. HPLC METHOD FOR DETERMINATION OF RIFAMPICIN FROM
PLASMA AND LUNG HOMOGENATE
Instrumentation:
The HPLC system used was JASCO LC900 Intelligent pump (jasco japan) coupled
with UV detector and Rheodyne injector model (7725) fitted with 20μl sample loop.
Data integration was done by Borwin chromatography software version 1.21.
Chromatography
Chromatography was performed on a Waters Spherisorb® S5 ODS2 (250 × 4 mm i.d.,
5 μm particle size) column. The mobile phase comprised of methanol: (0.01M)
sodium phosphate buffer pH 5.2 (pH adjusted by o-phosphoric acid) in the ratio 65:35
v/v. The mobile phase was filtered through a nylon membrane (0.22 μm, Pall
Gelman) and degassed by sonication prior to use. Chromatography was performed at
room temperature under isocratic conditions at a flow rate of 1 mL/min. UV detection
was done at a λmax of 254 nm.[Panchgnula R, et al, 1999]
Preparation of standard solutions
Rifampicin (10mg) was accurately weighed and transferred to a 10 mL volumetric
flask. Rifampicin was dissolved by sonication, the volume was made up to 10 mL
with methanol (1000μg/mL) and 0.1 ml was diluted to 10 ml with mobile phase to

Poly (ethylene sebacate) Nanoparticles of Anti-Tubercular Drugs
41 Particulate Carriers as Drug Delivery Systems for Anti-Tubercular and Anti-Cancer Agents
obtain concentration of 10μg/mL (Stock solution). Aliquots of this solution
corresponding to 0.05, 0.1, 0.25, 0.5, 1 and 5mL were diluted to 10 mL with mobile
phase to get concentrations of 50, 100, 250, 500, 1000, and 5000 ng/mL. Each
solution was injected twice to obtain the output in duplicate. Average of the peak
areas were considered for calculation purposes.
i) Recovery from plasma: Rat blood was collected in tubes containing 4.1% EDTA,
centrifuged and the plasma separated. To determine RIF recovery from plasma, RIF
solution (100µL) (20–1200µg/mL) was spiked to drug-free plasma (400µL) and
vortexed vigorously for 2min. Methanol (500µL) was added to precipitate protein and
the dispersion vortexed for 2min followed by centrifuged at 20,000 rpm for 20min at
25ºC. The supernatant was injected into the HPLC system. Recovery of RIF from
plasma was calculated by comparing the peak heights of standard RIF solution.
ii) Recovery from lung homogenate: Rats were sacrificed by cervical dislocation
and the lungs placed in phosphate buffered saline PBS, pH 7.4 and homogenized
using a tissue homogenizer. To determine RIF recovery from lung homogenate, RIF
solution (100µL) (20–1200µg/mL) was spiked to drug-free blank lung homogenate
(400µL) and vortexed vigorously for 2min. Methanol (500µL) was added to
precipitate protein and the dispersion vortexed for 2min followed by centrifuged at
20,000 rpm for 20min at 25ºC. The supernatant was injected into the HPLC system.
Recovery of RIF from lung homogenate was calculated by comparing the peak
heights of standard RIF solution.
Validation
The chromatographic method was validated for linearity, specificity, sensitivity,
precision, accuracy and stability.
i) Linearity: All validation runs were performed in triplicate to assess variation.
Calibration curves were constructed in plasma over the concentration range 50 –
5000ng/ml and in lung homogenate over the concentration range 50-5000ng/ml.
ii) Sensitivity: Limit of quantification (LOQ) of standard drug and spiked plasma and
spiked lung homogenate was determined at a signal to noise ratio of 1:10.
iii) Precision: System precision (repeatability) was determined by performing four
consecutive injections of the 250ng/ml plasma and lung homogenate extracted drug
samples. Method precision was determined by injecting three different samples
(500ng/ml) prepared individually.

Poly (ethylene sebacate) Nanoparticles of Anti-Tubercular Drugs
42 Particulate Carriers as Drug Delivery Systems for Anti-Tubercular and Anti-Cancer Agents
Results and Discussion
a) Plasma
The retention time of RIF was found to be 10.4 mins (Figure 3.7). The method was
found to be specific as blank plasma showed no interference with RIF. LOQ of RIF
was found to be 50ng/ml for plasma. HPLC chromatograms of blank plasma and RIF
recovered from plasma are as shown in Figure 3.7. The chromatograms indicate that
RIF peaks are well separated from other peaks in rat plasma. The method was found
to be linear over the concentration range 50-10000 ng/ml in rat plasma. The slope of
the equation was found to be 32.14 with r2 of 0.999. Figure 3.8 shows the linearity
curve of RIF recovered from rat plasma.
Figure 3.7: Chromatogram of RIF after recovery from rat plasma
Figure 3.8: Standard curve of RIF after recovery from rat plasma
Recovery of RIF from rat plasma was optimized greater than 90% as given in Table
3.9. Recovery data of RIF from rat plasma and precision data of RIF in rat plasma is
shown in Table 3.10.
Blank Plasma
RIF from Plasma RT-10.4 min

Poly (ethylene sebacate) Nanoparticles of Anti-Tubercular Drugs
43 Particulate Carriers as Drug Delivery Systems for Anti-Tubercular and Anti-Cancer Agents
Table 3.9: Recovery data of RIF from rat plasma
Conc. (ng/ml) Avg. std area Avg. spiked area % Recovery 100 4151.6 3848
91.65 4271.5 3963 4396.9 3939.25
1000 35210 31828 92.3 34257 30512
33589 32781 Average % recovery 91.97
Table 3.10: Precision data of RIF from rat plasma
Sample No. Area
System precision(250 ng/ml)
Method precision (500 ng/ml)
1 9134 15666.25 2 10053 15123.5 3 9346.5 16012.5 4 9312.75
%RSD 4.28 2.87
The HPLC method was well validated for linearity, specificity, sensitivity, precision,
and stability thus establishing that the method can be efficiently used for
pharmacokinetic study of RIF from rat plasma.
b) Lung homogenate
Figure 3.9: Chromatogram of RIF after recovery from lung homogenate
Figure 3.10: Standard curve of RIF after recovery from lung homogenate
Blank lung homogenate
RIF from lung homogenate RT-10.4 min

Poly (ethylene sebacate) Nanoparticles of Anti-Tubercular Drugs
44 Particulate Carriers as Drug Delivery Systems for Anti-Tubercular and Anti-Cancer Agents
The retention time of RIF was found to be 10.5 mins (Figure 3.9). The method was
found to be specific as blank lung homogenate showed no interference with RIF. LOQ
of RIF was found to be 50ng/ml for lung homogenate. HPLC chromatograms of blank
lung homogenate and RIF recovered from lung homogenate are as shown in Figure
3.9. The chromatograms indicate that RIF peaks are well separated from other peaks
in rat lung homogenate. The method was found to be linear over the concentration
range 50-1000ng/ml in rat lung homogenate. The slope of the equation was found to
be 30.40 with R2 of 0.999. Figure 3.10 show the standard curve of RIF after extraction
from rat lung homogenate.
Recovery was optimized greater than 85%. Recovery data of RIF from rat lung
homogenate and precision data of RIF in rat lung homogenate is shown in Table 3.11
and Table 3.12 respectively.
Table 3.11: Recovery data of RIF from lung homogenate
Conc. (ng/ml) Avg. std area Avg. spiked area % Recovery 100 4151.6 3648
87.27 4271.5 3853 4396.9 3687.3
1000 35210 29828 87.48 34257 28512
33589 31781 Average % recovery 87.37
Table 3.12: Precision data of RIF from lung homogenate
Sample No. Area
System precision(250 ng/ml)
Method precision (500 ng/ml)
1 8634 14857.25 2 9173 14356.25 3 8146.5 15123.5 4 8696.25
RSD 4.84 2.63
Conclusion:
The HPLC method was well validated for linearity, specificity, sensitivity, precision,
and stability thus establishing that the method can be efficiently used for lung uptake
study of RIF from rat.

Poly (ethylene sebacate) Nanoparticles of Anti-Tubercular Drugs
45 Particulate Carriers as Drug Delivery Systems for Anti-Tubercular and Anti-Cancer Agents
3.2. RIFAMPICIN AND ETHAMBUTOL
3.2.1. UV SPECTROPHOTOMETRIC METHOD FOR DETERMINATION OF
RIFAMPICIN IN COMBINATION WITH ETHAMBUTOL
Introduction
UV spectrophotometry method was developed for the routine analysis of rifampicin
and ethambutol in combination during dissolution studies and drug content analysis.
Although the method cannot be used easily for multicomponent formulations or
formulations containing interfering excipients, but ease of operation, low cost and low
analysis time make it the most popular analytical technique.
Materials
Ethambutol was obtained as a gift sample from Themis Medicare (India). Distilled
water was used during UV analysis. All other chemicals and solvents were analytical
– reagent grade and were purchased from s. d. fine chemicals, India. Instrumentation
UV1650PC, Schimadzu Corporation US spectrophotometer was used for analysis
Method
RIF was analyzed from the combination by UV-Visible spectrophotometry at λmax
475 nm as described in chapter II, without any interference. For analysis of ETH, RIF
was extracted from the combination solution by using dichloromethane (DCM). ETH
remaining in the aqueous phase was then determined by UV- spectrophotometry at
λmax of 412nm after derivatization with acetyl acetone reagent by a method
developed in our laboratory.
Active agent Medium λmax Beer’s law range Slope Intercept r2
Rifampicin Water 475 nm 5-30 mcg/ml 0.0116 0.0008 0.999
Ethambutol Water 412 nm 1-14 mcg/ml 0.054 0.002 0.999
Results and Discussion
Drug content values ranged between 97.5-101.5% for RIF and 97-102% for ETH
when analyzed in combinations with the developed extraction method
Conclusion
The UV-spectroscopic method was precise and can be used for the routine analysis of
RIF and ETH from combination of both.

Poly (ethylene sebacate) Nanoparticles of Anti-Tubercular Drugs
46 Particulate Carriers as Drug Delivery Systems for Anti-Tubercular and Anti-Cancer Agents
3.2.2. HPLC METHOD FOR DETERMINATION OF ETHAMBUTOL FROM
MACROPHAGE CELLS
Chromatography
Chromatography was performed on a Waters Spherisorb® S5 ODS2 (250 × 4 mm i.d.,
5 μm particle size) column. The mobile phase comprised of 1 mM CuSO4 .5H2O :
Tetrahydrofuran (THF) [75:25]. The mobile phase was filtered through a nylon
membrane (0.22 μm, Pall Gelman) and degassed by sonication prior to use.
Chromatography was performed at room temperature under isocratic conditions at a
flow rate of 1 mL/min. UV detection was done at a λmax of 260 nm.
Preparation of standard solutions
ETH (10mg) was accurately weighed and transferred to a 10 mL volumetric flask.
The volume was made up to 10 mL with glass distilled water to obtain a stock
solution (1000μg/mL). From the above solution, 1 ml was diluted upto 10 ml with
mobile phase to get concentration of (100μg/mL)(Stock solution). Aliquots of this
solution corresponding to 0.1, 0.25, 0.5, 0.75, and 1mL were diluted to 10 mL with
mobile phase to get concentration range from 1 to 10μg/mL. Each solution was
injected twice to obtain the output in duplicate. Average of the peak areas were
considered for calculation purposes.
Recovery of ETH from macrophage cells
A suspension of U-937 of histiocytic lymphoma origin macrophage like cells at a cell
density 2*106 cells/mL in RPMI media containing 10% fetal calf serum was prepared.
A solution of 0.5% sodium dodecyl sulphate (in PBS) was added to the cell
suspension in a ratio of (1:1) and the dispersion sonicated to enable cell lysis. The
dispersion was than centrifuged, the supernatant served as blank. To determine ETH
recovery from macrophage cells, ETH solution (100µL) (20–1200µg/mL) was spiked
to drug-free lysed macrophage cells (400µL) and vortexed vigorously for 2min
followed by addition of equal volume (500µL) of methanol. The resulting mixture
was vortexed vigorously for 2 min and centrifuged at 20,000 rpm for 20 min at 25 ºC.
The supernatant containing ETH was kept with mobile phase containing CuSO4.5H2O
for 45mins to form a derivative quantifiable/detected by HPLC. The supernatant was
injected into the HPLC system. Recovery of ETH from macrophage cells was
calculated by comparing the peak heights of standard ETH solution.
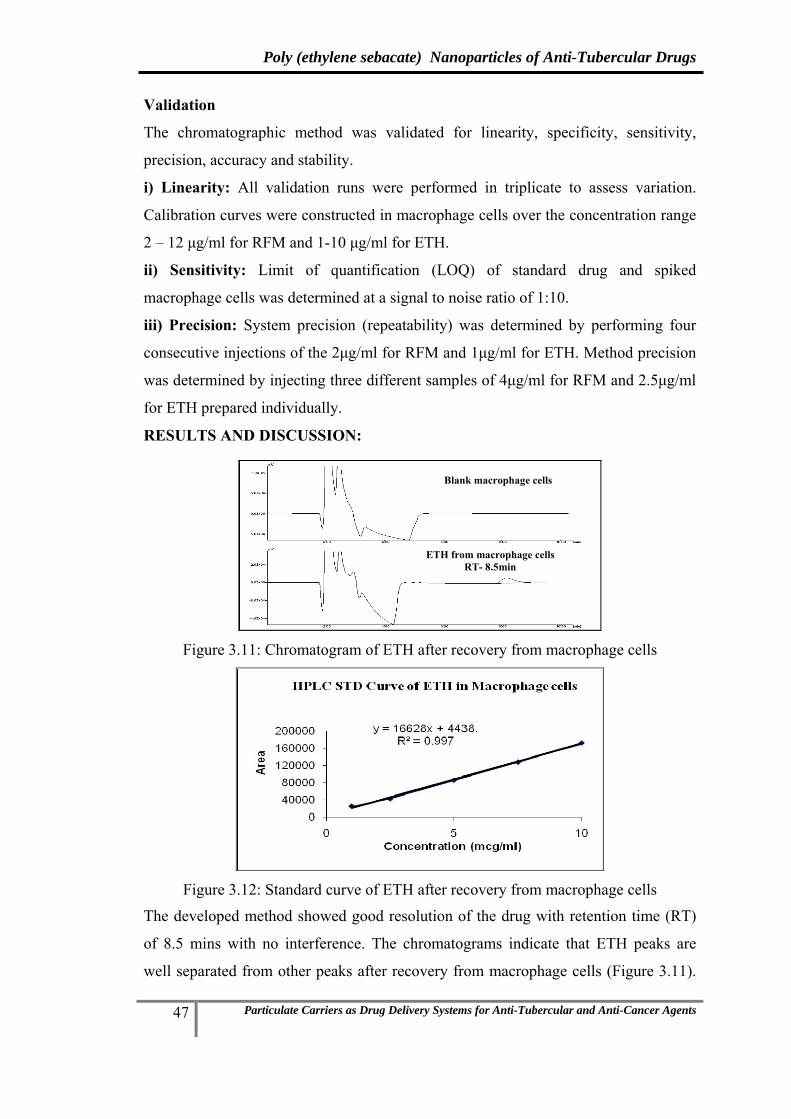
Poly (ethylene sebacate) Nanoparticles of Anti-Tubercular Drugs
47 Particulate Carriers as Drug Delivery Systems for Anti-Tubercular and Anti-Cancer Agents
Validation
The chromatographic method was validated for linearity, specificity, sensitivity,
precision, accuracy and stability.
i) Linearity: All validation runs were performed in triplicate to assess variation.
Calibration curves were constructed in macrophage cells over the concentration range
2 – 12 μg/ml for RFM and 1-10 μg/ml for ETH.
ii) Sensitivity: Limit of quantification (LOQ) of standard drug and spiked
macrophage cells was determined at a signal to noise ratio of 1:10.
iii) Precision: System precision (repeatability) was determined by performing four
consecutive injections of the 2μg/ml for RFM and 1μg/ml for ETH. Method precision
was determined by injecting three different samples of 4μg/ml for RFM and 2.5μg/ml
for ETH prepared individually.
RESULTS AND DISCUSSION:
Figure 3.11: Chromatogram of ETH after recovery from macrophage cells
Figure 3.12: Standard curve of ETH after recovery from macrophage cells
The developed method showed good resolution of the drug with retention time (RT)
of 8.5 mins with no interference. The chromatograms indicate that ETH peaks are
well separated from other peaks after recovery from macrophage cells (Figure 3.11).
Blank macrophage cells
ETH from macrophage cells RT- 8.5min

Poly (ethylene sebacate) Nanoparticles of Anti-Tubercular Drugs
48 Particulate Carriers as Drug Delivery Systems for Anti-Tubercular and Anti-Cancer Agents
The HPLC analytical method was found to be linear between concentration range of
1-10 μg/ml in the presence of macrophage cells and other media supplements with
high correlation coefficient of 0.997 (Figure 3.12).
Recovery was greater than 90% (Table 3.13) and low RSD values (<5%) were
obtained for system and method precision (Table 3.14).
Table 3.13: Recovery data of ETH from macrophage cells
Conc. In ng/ml Avg std area Avg spiked area %recovery 1000 25356.79 22710.8
92.6 27487 26570 27987 25570
7500 136546 120821 91.66 141987 131950
139982 130841 Average % recovery 92.13
Table 3.14: Precision data of ETH from macrophage cells
Sample No. Area
System precision(1000 ng/ml)
Method precision (2500 ng/ml)
1 25356.79 43842.4 2 27487 41143 3 27987 44123.5 4 26312.75
%RSD 4.41 3.82
Further the HPLC method was well validated for linearity, specificity, sensitivity, precision, and stability thus establishing that the method can be efficiently used for uptake study of ETH from macrophage cells.
3.2.3. HPLC METHOD FOR DETERMINATION OF ETHAMBUTOL FROM PLASMA AND LUNG HOMOGENATE
Chromatography
Chromatography was performed on a Waters Spherisorb® S5 ODS2 (250 × 4 mm i.d.,
5 μm particle size) column. The mobile phase comprised of 1 mM CuSO4 .5H2O :
Tetrahydrofuran (THF) [75:25]. The mobile phase was filtered through a nylon
membrane (0.22 μm, Pall Gelman) and degassed by sonication prior to use.
Chromatography was performed at room temperature under isocratic conditions at a
flow rate of 1 mL/min. UV detection was done at a λmax of 260 nm.

Poly (ethylene sebacate) Nanoparticles of Anti-Tubercular Drugs
49 Particulate Carriers as Drug Delivery Systems for Anti-Tubercular and Anti-Cancer Agents
Preparation of standard solutions
ETH (10mg) was accurately weighed and transferred to a 10 mL volumetric flask.
The volume was made up to 10 mL with glass distilled water (1000μg/mL). From the
above solution, 0.1mL and 1mL was diluted to 10mL with glass distilled water to get
concentration of 10μg/mL and 100μg/mL respectively (Stock solutions). Aliquots of
this solution corresponding to 0.05, 0.2, 0.5, 1 and 5mL were diluted to 10mL with
mobile phase to get concentrations of 50, 200, 500, 1000, and 5000ng/mL. The
samples were kept for 45mins for derivatization with mobile phase prior to injection.
Each solution was injected twice to obtain the output in duplicate. Average of the
peak areas were considered for calculation purposes.
i) Recovery from plasma: Rat blood was collected in tubes containing 4.1% EDTA,
centrifuged and the plasma separated. In order to determine recovery, ETH solution
(100µL) (0.5–100µg/mL) was spiked to drug-free plasma (400µL) and vortexed
vigorously for 2 min followed by addition of equal volume (500µL) of methanol to
induce protein precipitation. The resulting mixture was vortexed vigorously for 2min
and centrifuged at 20,000 rpm for 20min at 25 ºC. Supernatant was evaporated to
dryness under nitrogen gas. The residue obtained was reconstituted with 100μL
mobile phase, vortex mixed for 1 min, kept for 45mins and injected into HPLC
system. Recovery of ETH from plasma was calculated by comparing the peak heights
of standard ETH solution.
ii) Recovery from lung homogenate: Rats were sacrificed by cervical dislocation
and the lungs placed in phosphate buffered saline PBS, pH 7.4 and homogenized
using a tissue homogenizer in order to determine recovery, ETH solution (100µL)
(0.5–100µg/mL) was spiked to drug-free lung homogenate (400µL) and vortexed
vigorously for 2min followed by addition of equal volume (500µL) of methanol to
induce protein precipitation. The resulting mixture was vortexed vigorously for 2min
and centrifuged at 20,000 rpm for 20 min at 25 ºC. Supernatant was evaporated to
dryness under nitrogen gas. The residue obtained was reconstituted with 100μL
mobile phase, vortex mixed for 1 min, kept for 45mins and injected into HPLC
system. Recovery of RIF from lung homogenate was calculated by comparing the
peak heights of standard RIF solution.

Poly (ethylene sebacate) Nanoparticles of Anti-Tubercular Drugs
50 Particulate Carriers as Drug Delivery Systems for Anti-Tubercular and Anti-Cancer Agents
Validation:
The chromatographic method was validated for linearity, specificity, sensitivity,
precision, accuracy and stability.
i) Linearity: All validation runs were performed in triplicate to assess variation.
Calibration curves were constructed in plasma over the concentration range 50 –
5000ng/ml and in lung homogenate over the concentration range 50-5000ng/ml.
ii) Sensitivity: Limit of quantitation (LOQ) of standard drug and spiked plasma and
spiked lung homogenate was determined at a signal to noise ratio of 1:10.
iii) Precision: System precision (repeatability) was determined by performing four
consecutive injections of the 250ng/ml plasma and lung homogenate extracted drug
samples. Method precision was determined by injecting three different samples
(500ng/ml) prepared individually.
Results and Discussion:
a) Plasma method
Figure 3.13: Chromatogram of ETH after recovery from plasma
Figure 3.14: Standard curve of ETH after recovery from plasma
Blank Plasma
ETH from plasma RT- 8.8min

Poly (ethylene sebacate) Nanoparticles of Anti-Tubercular Drugs
51 Particulate Carriers as Drug Delivery Systems for Anti-Tubercular and Anti-Cancer Agents
The retention time of ETH was found to be 8.8mins. The method was found to be
specific as blank plasma showed no interference with ETH. LOQ of ETH was found
to be 50ng/ml for plasma. HPLC chromatograms of ETH in mobile phase, and rat
plasma spiked with ETH are as shown in Figure 3.13. The chromatograms indicate
that ETH peaks are well separated from other peaks in rat plasma. The method was
found to be linear over the concentration range 50-10000 ng/ml in rat plasma. The
slope of the equation was found to be 62.17 with r2 of 0.998 (Figure 3.14).
Extraction efficiency was optimized greater than 80% as given in Table 3.15.
Recovery data of ETH from rat plasma and precision data of ETH in rat plasma is
shown in Table 3.15 and Table 3.16 respectively.
Table 3.15: Recovery data of ETH from plasma
Conc. (ng/ml) Avg. std area Avg. spiked area % Recovery 200 8123.5 6078
84.33 8496.3 6822 8910 8630
1000 52687 39934 89.65 53815 52877
51587 48924 Average % recovery 86.99
Table 3.16: Precision data of ETH from rat plasma
Sample No. Area
System precision(500 ng/ml)
Method precision (1000 ng/ml)
1 18500 48924 2 19000 46683.5 3 16881 51265.75 4 18156.5
%RSD 4.98 4.68
The HPLC method was well validated for linearity, specificity, sensitivity, precision,
and stability thus establishing that the method can be efficiently used for
pharmacokinetic study of ETH from rat plasma.
b) Lung homogenate method
The retention time of ETH was found to be 7.7mins. The method was found to be
specific as blank lung homogenate showed no interference with ETH as shown in
Figure 3.15. LOQ of ETH was found to be 50ng/mL for lung homogenate. HPLC

Poly (ethylene sebacate) Nanoparticles of Anti-Tubercular Drugs
52 Particulate Carriers as Drug Delivery Systems for Anti-Tubercular and Anti-Cancer Agents
chromatograms of standard ETH in mobile phase, and rat lung homogenate spiked
with ETH are as shown in Figure 3.15. The chromatograms indicate that ETH peaks
are well separated from other peaks in rat lung homogenate. The method was found to
be linear over the concentration range 50-1000ng/mL in rat lung homogenate. The
slope of the equation was found to be 58.68 with r2 of 0.998 (Figure 3.16).
Figure 3.15: Chromatogram of ETH after recovery from lung homogenate
Figure 3.16: Standard curve of ETH after recovery from lung homogenate
Recovery was optimized greater than 80%. Recovery data of ETH from rat lung
homogenate and precision data of ETH in rat lung homogenate is shown in Table 3.17
and Table 3.18 respectively.
Table 3.17: Recovery data of ETH from lung homogenate
Conc. In ng/ml Avg std area Avg spiked area %recovery 200 7903.5 6578
80.62 8696.3 6136 8830 7789
1000 51516 44123 85.96 56715 48578
52969 45879 Average % recovery 83.29
Blank lung homogenate
ETH from lung homogenate RT- 7.7min

Poly (ethylene sebacate) Nanoparticles of Anti-Tubercular Drugs
53 Particulate Carriers as Drug Delivery Systems for Anti-Tubercular and Anti-Cancer Agents
Table 3.18: Precision data of ETH from lung homogenate
Sample No. Area
System precision(500 ng/ml)
Method precision (1000 ng/ml)
1 17932 48578 2 18124 45568.5 3 16981 48896.25 4 16556.5
%RSD 4.31 3.85
The HPLC method was well validated for linearity, specificity, sensitivity, precision,
and stability thus establishing that the method can be efficiently used for lung uptake
study of ETH from rat.
3.2.4. RIFAMPICIN AND ETHAMBUTOL COMBINATION
Rifampicin and Ethambutol combination was analysed by HPLC in 2 separate
injections. The collected macrophage cells/plasma/lung homogenate was divided into
2 parts and processed separately for RIF and ETH and analysed by HPLC as
described above.
3.3. RIFAMPICIN AND MSDNC-22 COMBINATION
3.3.1. UV SPECTROPHOTOMETRIC METHOD FOR RIFAMPICIN AND
MSDNC-22 COMBINATION
Introduction
UV spectrophotometric method was developed for the routine analysis of rifampicin
and MSDNC-22 in combination during dissolution studies and drug content analysis.
Although the method cannot be used easily for multicomponent formulations or
formulations containing interfering excipients, but ease of operation, low cost and low
analysis time make it the most popular analytical technique.
Materials
MSDNC-22 is a new cell wall modulator synthesized. Distilled water was used during
UV analysis. All other chemicals and solvents were analytical – reagent grade and
were purchased from s. d. fine chemicals, India.
Instrumentation
UV1650PC, Schimadzu Corporation US spectrophotometer was used for analysis.

Poly (ethylene sebacate) Nanoparticles of Anti-Tubercular Drugs
54 Particulate Carriers as Drug Delivery Systems for Anti-Tubercular and Anti-Cancer Agents
Preparation of standard solutions
Rifampicin: Rifampicin (10mg) was accurately weighed and transferred to a 10mL
volumetric flask. The volume was made up to 10mL with tetrahydrofuran (THF) to
obtain a stock solution (1000μg/mL). Aliquots of this solution corresponding to 0.01,
0.05, 0.1, 0.15, 0.2, 0.25 and 0.3mL were diluted to 10mL with mixture of THF:water
(1:1) to obtain solutions in the concentration range of 1–30 μg/mL. The absorbance of
these solutions was recorded at 425nm and 475 nm and plotted vs. the concentration
to give the Beer Lamberts plot for the standard curve.
MSDNC-22: MSDNC-22 (10mg) was accurately weighed and transferred to a 10mL
volumetric flask. The volume was made up to 10mL with THF to obtain a stock
solution (1000μg/mL). Aliquots of this solution corresponding to 0.01, 0.05, 0.1, 0.15,
0.2, 0.25 and 0.3mL were diluted to 10mL with mixture of THF:water (1:1) to obtain
solutions in the concentration range of 1–30 μg/mL. The absorbance of these
solutions was recorded at 425nm and 475 nm and plotted vs. the concentration to give
the Beer Lamberts plot for the standard curve.
Simultaneous equation
The two drugs in combination were estimated using the simultaneous equation
method and the equations are as follow.
Cx = (A2*ay1- A1*ay2)/(ax2*ay1-ax1*ay2)-----------------------------------------1
Cy = (A2*ay1- A1*ay2)/(ax2*ay1-ax1*ay2)-----------------------------------------2
For MSDNC-22 in combination with Rifampicin
Where: Cx=Concentration of MSDNC-22
Cy=Concentration of Rifampicin
A1= Absorbance of unknown sample at λmax 425 nm and
A2= Abs. of unknown sample at λmax 475 nm
ax1 ax2 ay1 ay2
0.0399 0.0263 0.0079 0.0196
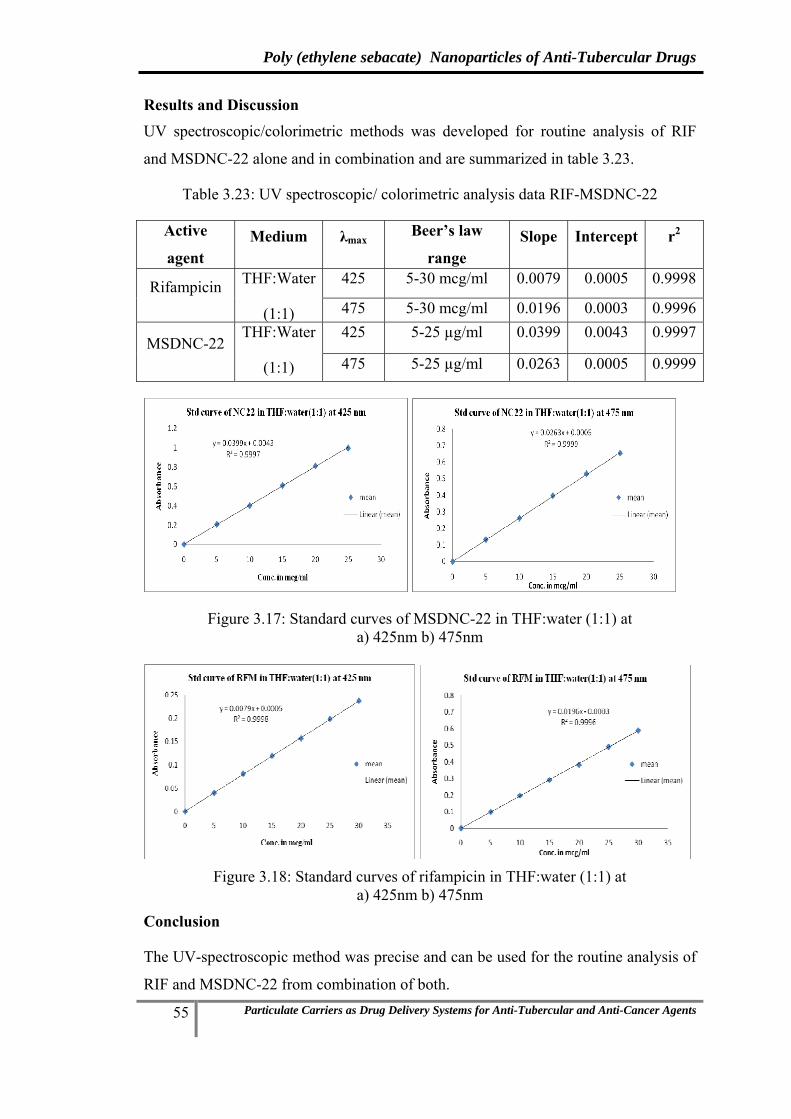
Poly (ethylene sebacate) Nanoparticles of Anti-Tubercular Drugs
55 Particulate Carriers as Drug Delivery Systems for Anti-Tubercular and Anti-Cancer Agents
Results and Discussion UV spectroscopic/colorimetric methods was developed for routine analysis of RIF
and MSDNC-22 alone and in combination and are summarized in table 3.23.
Table 3.23: UV spectroscopic/ colorimetric analysis data RIF-MSDNC-22
Active
agent Medium λmax Beer’s law
range Slope Intercept r2
Rifampicin THF:Water
(1:1)
425 5-30 mcg/ml 0.0079 0.0005 0.9998
475 5-30 mcg/ml 0.0196 0.0003 0.9996
MSDNC-22 THF:Water
(1:1)
425 5-25 µg/ml 0.0399 0.0043 0.9997
475 5-25 µg/ml 0.0263 0.0005 0.9999
Figure 3.17: Standard curves of MSDNC-22 in THF:water (1:1) at a) 425nm b) 475nm
Figure 3.18: Standard curves of rifampicin in THF:water (1:1) at
a) 425nm b) 475nm
Conclusion
The UV-spectroscopic method was precise and can be used for the routine analysis of
RIF and MSDNC-22 from combination of both.

Poly (ethylene sebacate) Nanoparticles of Anti-Tubercular Drugs
56 Particulate Carriers as Drug Delivery Systems for Anti-Tubercular and Anti-Cancer Agents
3.3.2. STABILITY INDICATING HPLC METHOD
A stability indicating RP-HPLC method for the analysis of RIF and MSDNC-22
combination as a bulk drug and in pharmaceutical formulations was developed and
validated.
Introduction
The objective of the present work was to develop and validate a stability indicating
RP-HPLC method for the assay of rifampicin and MSDNC-22 as a bulk drug and in
pharmaceutical formulations.
Materials
Rifampicin was obtained as a gift sample from Maneesh Pharma (India). MSDNC-22
is a new chemical entity synthesized in Prof. M.S. Degani laboratory at Institute of
Chemical Technology. Glass distilled water was used during HPLC analysis. All
other chemicals and solvents were analytical – reagent grade and were purchased
from s.d. Fine Chemicals, India Instrumentation:
The HPLC system used was JASCO LC2000 Intelligent pump (jasco japan) coupled
with UV detector and Rheodyne injector model (7725) fitted with 20μl sample loop.
Data integration was done by Borwin chromatography software version 1.21.
Chromatography
Chromatography was performed on a Waters Spherisorb® S5 ODS2 (250 × 4 mm i.d.,
5μm particle size) column. The mobile phase comprised of THF:Methanol: water in
the ratio 30:30:40 v/v. The mobile phase was filtered through a nylon membrane
(0.22μm, Pall Gelman) and degassed by sonication prior to use. Chromatography was
performed at room temperature under isocratic conditions at a flow rate of 1 mL/min.
UV detection was done at a λmax of 254 nm.
Preparation of standard solutions
Rifampicin (10mg) and MSDNC-22 (10mg) was accurately weighed and transferred
to a 10 mL volumetric flask. The volume was made up to 10 mL with methanol to
obtain a stock solution (1000μg/mL). Aliquots of this solution corresponding to 0.01,
0.05, 0.1, 0.15, 0.2, 0.25 and 0.3 were diluted to 10 mL with the mobile phase to
obtain solutions in the concentration range of 1–30 μg/mL. Each solution was injected
in triplicate. Average of the peak areas were considered for calculation purposes.

Poly (ethylene sebacate) Nanoparticles of Anti-Tubercular Drugs
57 Particulate Carriers as Drug Delivery Systems for Anti-Tubercular and Anti-Cancer Agents
Validation
a) Stability of analyte in solution: The stability of rifampicin and MSDNC-22
combination in mobile phase was assessed by injecting the standard solution
(30μg/ml) at interval of 0, 3 and 6 hrs post preparation kept in amber colored
volumetric flasks at room temperature. The chromatograms were checked for
presence of peaks corresponding to degraded product.
b) Linearity: Standard solutions (1, 5, 10, 15, 20, 25 and 30 μg/mL), each in three
replicates, were injected into the system. The method of linear regression was used for
data evaluation. Peak areas were plotted against theoretical concentrations of
standards. Linearity was expressed as a correlation coefficient.
c) Precision: System precision (repeatability) was determined by performing five
consecutive injections of the 30 μg/ml standard solution. Method precision was
determined by injecting three different samples (30 μg/ml) prepared individually.
Forced Degradation Studies
It was necessary to perform forced degradation studies to verify and prove the
stability-indicating feature of the proposed method. Intentional degradation was
attempted by heating the drug in the presence of base, acid and hydrogen peroxide
and exposing to sunlight.
i) Acid degradation: To 1mL of standard stock solution (300μg/mL) of rifampicin
and MSDNC-22 combination, 1 mL of 0.1N HCl was added and the solution was
placed in a boiling water bath for 2h. The sample was allowed to cool to room
temperature and neutralized using 0.1N NaOH. The volume was adjusted to 10 ml
with distilled water, and this solution was injected in the HPLC column.
ii) Base degradation: To 1mL of standard stock solution (300μg/mL) of rifampicin
and MSDNC-22, 1 mL of 0.1N NaOH was added and the solution was placed in a
boiling water bath for 2h. The sample was allowed to cool to room temperature and
neutralized using 0.1N HCl. The volume was adjusted to 10 ml with glass-distilled
water, and this solution was injected onto the HPLC column.
iii) Oxidation: To 1mL of standard stock solution (300μg/mL) of rifampicin and
MSDNC-22, 1 mL of 3% H2O2 was added and the solution was placed in a boiling
water bath for 2h. The sample was allowed to cool to room temperature. The volume

Poly (ethylene sebacate) Nanoparticles of Anti-Tubercular Drugs
58 Particulate Carriers as Drug Delivery Systems for Anti-Tubercular and Anti-Cancer Agents
was adjusted to 10 ml with glass-distilled water, and this solution was injected onto the
HPLC column.
iv) Photodegradation: Drug solution (30μg/mL) in methanol was exposed to
sunlight for 2h and this solution was injected onto the HPLC column.
The degraded samples were analyzed against an untreated control sample.
Results and Discussion
a) Stability of analyte in solution
Rifampicin and MSDNC-22 was found to be stable in the mobile phase, when the
standard solution of strength 10μg/mL was analyzed at 0-6h post preparation. No
peaks corresponding to the degradation products were observed. A low RSD (<2)
value indicated that there was no significant change in the drug peak area (Table
3.20).
Table 3.20: Stability of rifampicin and MSDNC-22 in mobile phase
RIF Area 1 Area 2 Average SD SE %RSD
0 hr 739019.3 747143.5 743081.4 5744.712 4062.125 0.7730933 hr 749146 743750.3 746448.1 3815.364 2697.87 0.5111366 hr 746895.5 746751.8 746823.6 101.6466 71.875 0.013611
Average %RSD 0.4326 MSDNC-22 Area 1 Area 2 Average SD SE %RSD
0 hr 1133610 1140362 1136986.0 4774.385 3376.0 0.4199163 hr 1120521 1083644 1102082.1 26076.15 18438.6 2.3660816 hr 1118988 1075519 1097253.3 30737.58 21734.8 2.80132
Average %RSD 1.8624
b) Linearity
Figure 3.19: Standard curve of rifampicin by HPLC

Poly (ethylene sebacate) Nanoparticles of Anti-Tubercular Drugs
59 Particulate Carriers as Drug Delivery Systems for Anti-Tubercular and Anti-Cancer Agents
Figure 3.20: Standard curve of MSDNC-22 by HPLC
Graph of the peak area vs concentration was plotted in order to check the linearity.
The developed method was found to be linear between concentration range of 1-
30μg/mL (Figure 3.19 and 3.20). The regression coefficient was found to be 0.9987
for RIF and 0.9994 for MSDNC-22.
c) Precision
Low RSD values of 1.84 per cent and 1.28 per cent were obtained for system and
method precision respectively (Table 3.21)
Table 3.21: Precision study of the RIF and MSDNC-22 assay
Sample No.
Area for Rifampicin Area for MSDNC-22System
precision (30 µg/ml)
Method precision
(30 µg/ml)
System precision
(30 µg/ml)
Method precision
(30 µg/ml)1 750446 750446 1114051 1114051 2 743081 739328 1136986 1139463 3 734956 740387 1124987 1126433 4 743872 - 1142386 - 5 739845 - 1122674 -
% RSD 0.7658 0.8254 1.0100 1.1278
Forced Degradation Studies
The HPLC procedure was optimized with view to develop a stability indicating
method so as to resolve the degraded products from the drugs. Various mobile phase
compositions were tried so as to obtain a sharp peak and also resolve the peaks of
degraded product from the peak of drug. The mobile phase consisting of
THF:Methanol: water in the ratio of 30:30:40 per cent v/v resulted in a retention time
of 7.7 min for rifampicin and 15.3 min for MSDNC-22. The chromatograms of
rifampicin and MSDNC-22 (undegraded) and rifampicin and MSDNC-22 degraded in

Poly (ethylene sebacate) Nanoparticles of Anti-Tubercular Drugs
60 Particulate Carriers as Drug Delivery Systems for Anti-Tubercular and Anti-Cancer Agents
the presence of acid, base, hydrogen peroxide (H2O2) (oxidative degradation) and
light (photo degradation) are shown in Figure 3.21 and indicated a good separation of
the undegraded drug from the degradation products. The peaks of all the degraded
products were resolved from the rifampicin and MSDNC-22 peak. The
chromatograms after forced degradation are shown in Figure 3.21.
a) Standard RIF and MSDNC-22
b) Acid degraded RIF and MSDNC-22 c) Base degraded RIF and MSDNC-22
d) H2O2 degraded RIF and MSDNC-22 e) Photo degraded RIF and MSDNC-22
Figure 3.21: Forced degradation studies of RIF and MSDNC-22
Conclusion
The RP-HPLC method developed for rifampicin was found to be precise, rapid,
accurate, and stability indicating. Thus the method could be used for determining the
stability of rifampicin.
3.3.3. HPLC METHOD FOR DETERMINATION OF RIFAMPICIN AND
MSDNC-22 FROM MACROPHAGE CELLS
Instrumentation
The HPLC system used was JASCO LC2000 Intelligent pump (jasco japan) coupled
with UV detector and Rheodyne injector model (7725) fitted with 20μl sample loop.
Data integration was done by Borwin chromatography software version 1.21.
Chromatography
Chromatography was performed on a Waters Spherisorb® S5 ODS2 (250 × 4 mm i.d.,
5μm particle size) column. The mobile phase comprised of THF:Methanol: water in

Poly (ethylene sebacate) Nanoparticles of Anti-Tubercular Drugs
61 Particulate Carriers as Drug Delivery Systems for Anti-Tubercular and Anti-Cancer Agents
the ratio 30:30:40 v/v. The mobile phase was filtered through a nylon membrane
(0.22μm, Pall Gelman) and degassed by sonication prior to use. Chromatography was
performed at room temperature under isocratic conditions at a flow rate of 1 mL/min.
UV detection was done at a λmax of 254 nm.
Preparation of standard solutions
Rifampicin and MSDNC-22 was accurately weighed (10mg) and transferred to a
10mL volumetric flask. The volume was made up to 10mL with methanol to obtain a
stock solution (1000μg/mL). Aliquots of this solution corresponding to 0.01, 0.05,
0.1, 0.2 and 0.3mL were diluted to 10mL to get concentration range from 1-30μg/mL.
Each solution was injected twice to obtain the output in duplicate. Average of the
peak areas were considered for calculation purposes.
Recovery of RIF and MSDNC-22 from macrophage cells
A suspension of U-937 of histiocytic lymphoma origin macrophage like cells at a cell
density 2*106 cells/mL in RPMI media containing 10% fetal calf serum was prepared.
A solution of 0.5% sodium dodecyl sulphate (in PBS) was added to the cell
suspension in a ratio of (1:1) and the dispersion sonicated to enable cell lysis. The
dispersion was than centrifuged, the supernatant served as blank. To determine RIF
and MSDNC-22 recovery from macrophage cells, RIF-MSDNC-22 solution (100µL)
(20–1200µg/mL) was spiked to drug-free lysed macrophage cells (400µL) and
vortexed vigorously for 2 min followed by addition of equal volume (500µL) of
methanol. The resulting mixture was vortexed vigorously for 2 min and centrifuged at
20,000 rpm for 20 min at 25 ºC. The supernatant was injected into the HPLC system.
Recovery of RIF and MSDNC-22 from macrophage cells was calculated by
comparing the peak heights of standard RIF and MSDNC-22 solutions.
Validation
The chromatographic method was validated for linearity, specificity, sensitivity,
precision, accuracy and stability.
i) Linearity: All validation runs were performed in triplicate to assess variation.
Calibration curves were constructed in macrophage cells over the concentration range
1 – 30μg/mL for RIF and MSDNC-22.
ii) Sensitivity: Limit of quantification (LOQ) of standard drug and spiked
macrophage cells was determined at a signal to noise ratio of 1:10.

Poly (ethylene sebacate) Nanoparticles of Anti-Tubercular Drugs
62 Particulate Carriers as Drug Delivery Systems for Anti-Tubercular and Anti-Cancer Agents
iii) Precision: System precision (repeatability) was determined by performing four
consecutive injections of the 10μg/ml for RIF and MSDNC22. Method precision was
determined by injecting three different samples of 10μg/ml for RIF and MSDNC22
prepared individually.
Results and Discussion
Rifampicin and MSDNC-22 from macrophage cells
The developed method showed good resolution of the drug with retention time (RT)
of 7.7 mins for RIF and 15.3min for MSDNC-22 with no interference. The
chromatograms indicate that RIF and MSDNC-22 peaks are well separated from other
peaks in macrophage cells. The HPLC analytical method was found to be linear over
concentration range of 1-30 μg/ml in the presence of macrophage cells and other
media supplements with high correlation coefficient of 0.9995 (Figure 3.23). The
standard curve of RIF after extraction from macrophage cells is shown in Figure 3.22.
a) b)
Figure 3.22: Chromatogram a) Blank macrophage cells b) RIF and MSDNC22 after
recovery from macrophage cells
Rifampicin MSDNC22
Figure 3.23: Standard curve after recovery from macrophage cells
Recovery was greater than 90% for both RIF and MSDNC22 (Table 3.22 and 3.23)
and low RSD values (<5%) were obtained for system and method precision (Table
3.24).
Blank macrophage cells RIF and MSDNC-22 from macrophage cells
RIF RT-7.7min
MSDNC-22 RT-15.3min

Poly (ethylene sebacate) Nanoparticles of Anti-Tubercular Drugs
63 Particulate Carriers as Drug Delivery Systems for Anti-Tubercular and Anti-Cancer Agents
Table 3.22: Recovery data of RIF from macrophage cells
Concentration (µg/mL)
Average Area of
Standard
Average Area of extracted RIF
Extraction Efficiency/ recovery
1 7620.8 6796.9 89.18 5 53173.4 49171.1 92.47 10 150327.3 130365.5 86.72 20 296432.8 281359.6 94.91 30 469845.3 452355.8 96.27
Average Extraction efficiency 91.91
Table 3.23. Recovery data of MSDNC22 from macrophage cells
Concentration (µg/mL)
Average Area of
Standard
Average Area of extracted
MSDNC22
Extraction Efficiency/ recovery
1 32863.1 30708.0 93.44 5 173521.6 167801.7 96.70 10 378521.5 367331.5 97.04 20 774322.9 762150.2 98.42 30 1280367.2 1195225.5 93.35
Average Extraction efficiency 95.79
Table 3.24: Precision data of RIF and MSDNC22 from macrophage cells
Sample No.
System precision Area (10 µg/mL)
Method precision Area (10 µg/mL)
RIF MSDNC22 RIF MSDNC22 1 130832 367060 130832 367060 2 129899 367603 132157 368921 3 131443 370234 128930 371243 4 128842 369952 - -
Average 130254 368712 130639 369074 RSD 0.87 0.44 1.24 0.57
HPLC method was validated for linearity, specificity, sensitivity, precision, &
stability thus establishing that the method can be efficiently used for macrophage
uptake study of RIF and MSDNC22.
Conclusion
The RP-HPLC method developed for rifampicin and MSDNC22 was found to be
specific, precise, rapid and accurate. Thus the method could be efficiently used for
macrophage uptake study of RIF and MSDNC22.

4. Experimental methods

Poly (ethylene sebacate) Nanoparticles of Anti-Tubercular Drugs
64 Particulate Carriers as Drug Delivery Systems for Anti-Tubercular and Anti-Cancer Agents
4. EXPERIMENTAL METHODS 4.1. MATERIALS
Poly (ethylene sebacate) [PES] synthesized in our laboratory (Mw= 11300) earlier,
was used, rifampicin (RIF), ethambutol (ETH), poly vinyl alcohol (PVA), and
trehalose 100 (Hayashibara Co. Ltd., Japan) were kindly gifted by Maneesh Pharma
(Mumbai, India), Themis medicare, Colorcon Asia Pvt ltd and Gangwal Chemicals
Pvt. Ltd. (Mumbai, India) respectively. Lutrol-F-68 (polyoxyethylene
polyoxypropylene block co-polymer) was a gift sample from BASF. Folic acid(FA),
dichloromethane AR, methanol AR, methyl ethyl ketone AR, dioctyl sodium
sulphosuccinate AR (Aerosol OT , AOT), tetrahydrofuran AR (THF), stanneous
chloride, disodium hydrogen phosphate AR and sodium chloride AR were purchased
from s. d. fine-chem limited (Mumbai, India). Ethyl alcohol AR (99.9% pure) was
purchased from Changshu Yangyuan Chemical (China). Filtered (0.45 µ membrane
filter) doubled distilled water was used for preparation of nanoparticles. All other
chemicals and solvents were either spectroscopic or analytical grade.
4.2. PREPARATION AND OPTIMIZATION OF NANOPARTICLES
A. PES-RIF nanoparticles with and without folic acid
Rifampicin loaded PES nanoparticle were prepared by nanoprecipitation (Fessi et al
1992). Briefly, rifampicin (20mg) and PES (100mg) were dissolved in
tetrahydrofuran: methanol (9:1ml). The non solvent phases comprised an aqueous
solution of lutrol-F-68 (10mg) in 25ml water. The organic phase was added to the non
solvent phase under magnetic stirring. The dispersion was kept under continuous
stirring on a magnetic stirrer at room temperature till complete evaporation of organic
solvent (approx. 2-3 hrs). The nanoparticle suspension was centrifuged at 15000 rpm
for 30 min and the supernatant analyzed for drug to determine entrapment efficiency.
a) Effect of Lutrol-F-68 concentration
The surfactant concentration evaluated was 0.04, 0.1 and 0.2% in order to find the
optimum concentration for maximum entrapment efficiency (Table 4.1).
b) Effect of drug: polymer ratio
Effect of RIF:PES ratio (drug:polymer) on entrapment efficiency and particle size was
evaluated. Ratio of RIF:PES evaluated include 1:2, 1:3, 1:4 and 1:5 (Table 4.2).
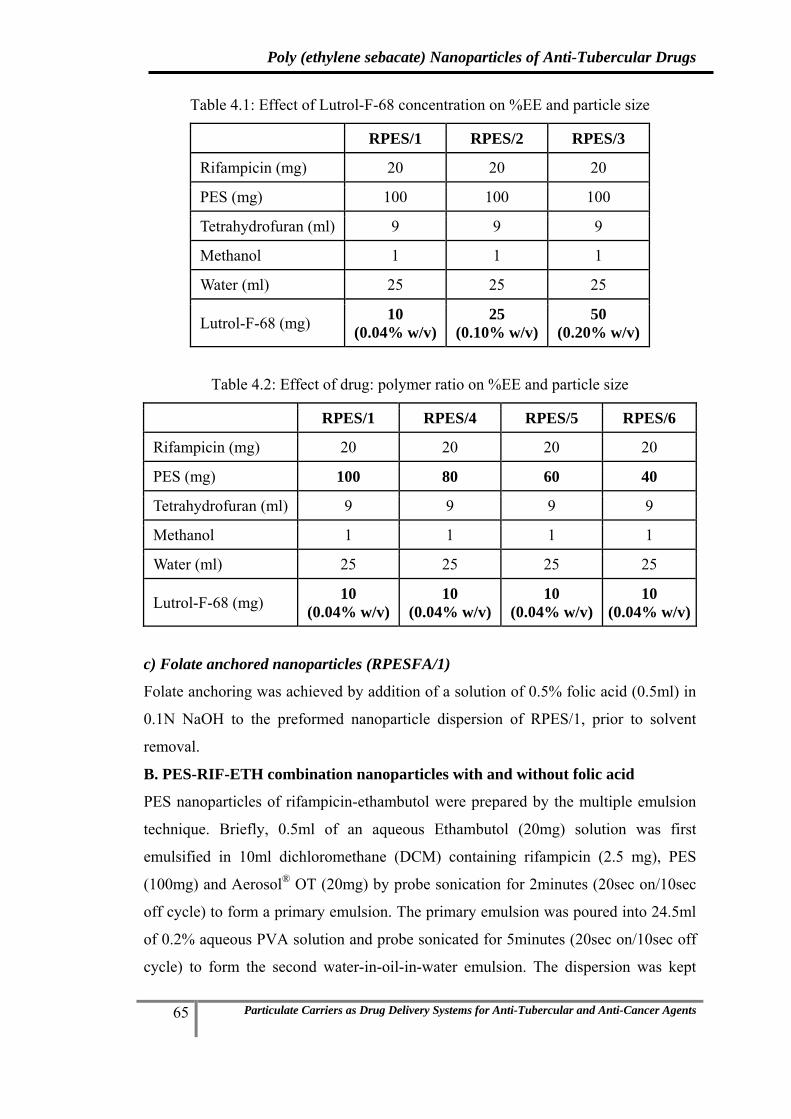
Poly (ethylene sebacate) Nanoparticles of Anti-Tubercular Drugs
65 Particulate Carriers as Drug Delivery Systems for Anti-Tubercular and Anti-Cancer Agents
Table 4.1: Effect of Lutrol-F-68 concentration on %EE and particle size
RPES/1 RPES/2 RPES/3
Rifampicin (mg) 20 20 20
PES (mg) 100 100 100
Tetrahydrofuran (ml) 9 9 9
Methanol 1 1 1
Water (ml) 25 25 25
Lutrol-F-68 (mg) 10 (0.04% w/v)
25 (0.10% w/v)
50 (0.20% w/v)
Table 4.2: Effect of drug: polymer ratio on %EE and particle size
RPES/1 RPES/4 RPES/5 RPES/6
Rifampicin (mg) 20 20 20 20
PES (mg) 100 80 60 40
Tetrahydrofuran (ml) 9 9 9 9
Methanol 1 1 1 1
Water (ml) 25 25 25 25
Lutrol-F-68 (mg) 10 (0.04% w/v)
10 (0.04% w/v)
10 (0.04% w/v)
10 (0.04% w/v)
c) Folate anchored nanoparticles (RPESFA/1)
Folate anchoring was achieved by addition of a solution of 0.5% folic acid (0.5ml) in
0.1N NaOH to the preformed nanoparticle dispersion of RPES/1, prior to solvent
removal.
B. PES-RIF-ETH combination nanoparticles with and without folic acid
PES nanoparticles of rifampicin-ethambutol were prepared by the multiple emulsion
technique. Briefly, 0.5ml of an aqueous Ethambutol (20mg) solution was first
emulsified in 10ml dichloromethane (DCM) containing rifampicin (2.5 mg), PES
(100mg) and Aerosol® OT (20mg) by probe sonication for 2minutes (20sec on/10sec
off cycle) to form a primary emulsion. The primary emulsion was poured into 24.5ml
of 0.2% aqueous PVA solution and probe sonicated for 5minutes (20sec on/10sec off
cycle) to form the second water-in-oil-in-water emulsion. The dispersion was kept

Poly (ethylene sebacate) Nanoparticles of Anti-Tubercular Drugs
66 Particulate Carriers as Drug Delivery Systems for Anti-Tubercular and Anti-Cancer Agents
under continuous stirring on a magnetic stirrer till complete evaporation of organic
solvent (approx. 2-3 hrs) at room temperature. The nanoparticle suspension was
obtained and evaluated for entrapment efficiency and particle size. RIF-ETH PES
nanoparticles with different ratios of RIF:ETH were prepared by varying the
concentration of RIF and ETH during the method of preparation.
a) Effect of PVA concentration
The PVA concentration evaluated was 0.2, 0.5 and 1% w/v in order to find the
optimum concentration for maximum entrapment efficiency (Table 4.3).
Table 4.3: Effect of PVA concentration on %EE and particle size
REPES/1 REPES/2 REPES/3
Rifampicin (mg) 10 10 10
Ethambutol 20 20 20
PES (mg) 100 100 100
Dichloromethane 10 10 10
Water (ml) 25 25 25
Aerosol OT (mg) 20 20 20
PVA (mg) 50 (0.2% w/v)
125 (0.5% w/v)
250 (1% w/v)
b) Optimization of RIF:ETH ratio
Table 4.4: Optimization of RIF:ETH ratio
REPES/4 REPES/5 REPES/6 REPES/7 REPES/8
Rifampicin (mg) 20 15 2.5 20 20
Ethambutol 20 20 20 5 2.5
PES (mg) 100 100 100 100 100
Dichloromethane 10 10 10 10 10
Water (ml) 25 25 25 25 25
Aerosol OT (mg) 20 20 20 20 20
PVA (mg) 50 (0.2% w/v)
50 (0.2% w/v)
50 (0.2% w/v)
50 (0.2% w/v)
50 (0.2% w/v)
Nanoparticles with RIF:ETH in ratios from 10:1, 1:1, and 1:10 were optimized by
varying the ratios of ETH and RIF in REPES/1 batch during their preparation based

Poly (ethylene sebacate) Nanoparticles of Anti-Tubercular Drugs
67 Particulate Carriers as Drug Delivery Systems for Anti-Tubercular and Anti-Cancer Agents
on their entrapment efficiency observed. Various batches evaluated are reported in
(Table 4.4).
c) Folate anchored nanoparticles (REPES6FA/1)
Folate anchoring was achieved by addition of a solution of 0.5% folic acid (0.5ml) in
0.1N NaOH to the preformed nanoparticle dispersion of REPESFA/6 prior to solvent
removal.
C. PES-RIF-MSDNC-22 combination nanoparticles with and without folic acid
RIF-MSDNC-22 loaded PES nanoparticle were prepared by nanoprecipitation
method. Briefly, rifampicin (2-20mg), MSDNC-22 (10mg) and PES (100mg) were
dissolved in tetrahydrofuran: methanol (9:1ml). The non solvent phases comprised an
aqueous solution of lutrol-F-68 (10mg) in 25ml water. The organic phase was added
to the non solvent phase under magnetic stirring. The dispersion was kept under
continuous stirring on a magnetic stirrer at a room temperature till complete
evaporation of organic solvent (approx. 2-3 hrs). The nanoparticle suspension was
obtained and evaluated for entrapment efficiency and particle size. RIF-MSDNC-22
PES nanoparticles with different ratios of RIF:MSDNC-22 were prepared by varying
the concentration of RIF and MSDNC-22 during the method of preparation (Table
4.5).
a) Folate anchored nanoparticle (RMPES3FA/1)
Folate anchoring was achieved by addition of a solution of 0.5% folic acid (0.5ml) in
0.1N NaOH to the preformed nanoparticle dispersion of RMPES/3, prior to solvent
removal.
Table 4.5: Optimization of RIF:MSDNC-22 ratio
RMPES/1 RMPES/2 RMPES/3
Rifampicin (mg) 15 20 2.5
MSDNC-22 10 2 10
PES (mg) 100 100 100
Tetrahydrofuran 9 9 9
Methanol 1 1 1
Water (ml) 25 25 25
Lutrol-F-68 (mg) 50 (0.2% w/v)
50 (0.2% w/v)
50 (0.2% w/v)
Poly (ethylene sebacate) Nanoparticles of Anti-Tubercular Drugs
68 Particulate Carriers as Drug Delivery Systems for Anti-Tubercular and Anti-Cancer Agents
4.3. ISOLATION AND PRESERVATION OF NANOPARTICLES
4.3.1. Freeze-thaw (FT) study
The Rifampicin PES nanoparticles dispersion obtained was centrifuged at 15000 rpm
for 30 min and the supernatant separated. The pellet was re-dispersed in 10 ml water
to obtain nanoparticle concentration 11-12mg/ml, cryoprotectants added and
subjected to freezing at a temperature -70°C, for 12 hrs in deep freezer (Eclipse 400,
RS Biotech, UK) followed by thawing at 28°C. The particle size and polydispersity
index (P.I) before freezing and after thawing was determined by PCS. Selected
batches were subjected to freeze drying using the LABCONCO freeze dryer system
(FreeZone 4.5, USA).
a) Effect of cryoprotectant - type and concentration: Two cryo-protectants namely
mannitol and trehalose and Lutrol-F-68 as stabilizer were evaluated. The ratio of
nanoparticle to cryo-protectant was 1:5, 1:10 and 1:20, while the ratio of nanoparticle
to Lutrol-F-68 was 1:0.05, 1:0.1 and 1:0.2. Based on the freeze thaw batches with
trehalose and lutrol-F-68 were selected for freeze drying and the size obtained after
freeze drying are shown in table 1.3. The optimum composition was then selected for
freeze drying of the nanoparticles of all the other batches.
4.3.2. Freeze-drying of nanoparticles
Freeze-drying of various nanoparticle batches were carried out using trehalose (10:1
by weight of nanoparticles) and lutrol-F-68 (0.1:1 by weight of nanoparticles), which
showed minimal change in particle size during the freeze thaw study. Samples of 10
mL dispersion of nanoparticles were dispensed in 250mL freeze drying glass vessels,
frozen at -70 °C for 12 h and then subjected to freeze-drying using Labconco freeze-
drying system (FreeZone 4.5, USA). Sublimation lasted for 36-48 h at a vacuum
pressure of 10-50×10-3 bar, with the condenser surface temperature maintained at less
than -50 °C. Lyophilized samples were collected under anhydrous conditions and
stored in a dessicator until re-hydrated. Re-hydration of lyophilized nanoparticles was
carried with 0.2 µm filtered water by simple manual shaking. Particle size and PI of
the re-hydrated samples were determined by PCS to assess the cryoprotection
provided by the cryoprotectant.

Poly (ethylene sebacate) Nanoparticles of Anti-Tubercular Drugs
69 Particulate Carriers as Drug Delivery Systems for Anti-Tubercular and Anti-Cancer Agents
4.4. EVALUATION AND PHYSICAL CHARACTERIZATION
4.4.1. Entrapment Efficiency
Nanoparticle dispersion was centrifuged at 15,000 rpm for 30 min at 20 ºC. The
resultant supernatant was analysed for free drug.
i) Entrapment Efficiency of RIF: The concentration of rifampicin in the supernatant
was determined by UV-Visible spectrophotometry at λmax of 475nm without any
interference of folic acid. Entrapment efficiency was calculated using equation 1:
Entrapment efficiency (%) = (RIFinitial – RIFsupernatant) / RIFinitial ×100 (1)
ii) Entrapment Efficiency of ETH: Entrapment efficiency of ETH was determined by
partitioning the supernatant with dichloromethane, in which RIF completely partitions
while the ethambutol remains in the aqueous phase, and this aqueous phase containing
ethambutol was derivatized and analyzed by UV-Visible spectrophotometry at λmax
of 412nm without any interference. The method used for analysis of ethambutol was
validated (chapter 2). Entrapment efficiency was calculated using equation 2.
Entrapment efficiency (%) = (ETHinitial – ETHsupernatant) / ETHinitial ×100 (2)
iii) Entrapment Efficiency of folic acid: Entrapment efficiency of folic acid was
determined by partitioning the supernatant with dichloromethane, in which RIF
completely partitions while the folic acid remains in aqueous phase, and this aqueous
phase can be analyzed for folic acid by UV-Visible spectrophotometry at λmax of
256.5nm without any interference. The method used for analysis of folic acid was
validated (chapter 2). Entrapment efficiency was calculated using equation 3.
Entrapment efficiency (%) = (FAinitial – FAsupernatant) / FAinitial ×100 (3)
iv) Entrapment Efficiency of MSDNC-22: The concentration of RIF and MSDNC-22
in the supernatant was determined using simultaneous equation method developed by
UV-Visible spectrophotometry at λmax of 425 and 475nm. Entrapment efficiency was
calculated using equation 4.
%EE = (MSDNC-22initial – MSDNC-22supernatant) / MSDNC-22initial ×100 (4)
4.4.2. Particle Size
Particle size was determined by Photon Correlation Spectroscopy using N4 plus
submicron particle size analyzer (Beckman Coulter, USA). The analysis was
performed at a scattering angle of 90º at a temperature of 25 ºC. All the
nanoparticulate dispersions were sonicated using ultrasonic probe system (DP120,
Dakshin, Mumbai, India) for 5 min with 10 sec pulse at 200 voltages over an ice bath.

Poly (ethylene sebacate) Nanoparticles of Anti-Tubercular Drugs
70 Particulate Carriers as Drug Delivery Systems for Anti-Tubercular and Anti-Cancer Agents
Dispersions were then appropriately diluted with filtered water (0.2 µm filter,
Millipore India Pvt. Ltd.) to obtain 5 ×10⁴ to 1×10⁶ counts per second. Each sample
was analyzed in triplicate and average particle size and polydispersity index (PI)
measured.
4.4.3. Drug loading
Measured quantity of freeze dried nanoparticles were dissolved in THF:water (1:1) by
sonication for 5 mins and assayed for drug content by developed HPLC method.
Percent Drug loading (DL%) was calculated using the equation:
DL (%) = WDL/WNP×100 ………………………………………….. (5)
where WDL = weight of Drug in Np and WNP = weight of Np
4.4.4. Zeta Potential
Zeta potential of nanoparticle dispersion was measured using Malvern Zetasizer
Nanoseries using DTS Nano software. Nanoparticle dispersion was centrifuged at
15,000 rpm for 30 min at 20ºC. The resultant pellet was washed and redispersed with
distilled deionized water (nanoparticles 100µg/ml) by sonication. Samples were filled
in to the folded capillary cell and zeta potential was measured. Each sample was
analyzed in triplicate.
4.4.5. Scanning Electron Microscopy (SEM)
The morphology/shape of nanoparticles was determined by SEM (JSM-6380-LA,
JEOL, Tokyo, Japan). A drop of colloidal dispersion was deposited onto a carbon tape
and dried under vacuum. The samples were sputtered with platinum using an auto fine
coater prior to analysis (JFC-1600, JEOL, Tokyo, Japan).
4.4.6. Fourier Transform Infrared (FTIR) Spectroscopy
FT-IR for rifampicin, ethambutol, MSDNC-22, folic acid, PES, the nanoparticles and
excipients were recorded on a Perkin-Elmer FTIR spectrophotometer by the KBr disk
method from 4000 to 500 cm-1. Samples were crushed to a fine powder, mulled with
anhydrous potassium bromide, compressed to form a thin transparent pellet and
subjected to FTIR.
4.4.7. Differential Scanning Calorimetry (DSC)
DSC thermograms of rifampicin, ethambutol, MSDNC-22, folic acid, PES, the
nanoparticles and excipients were recorded on a Perkin Elmer Pyris 6 DSC
(PerkinElmer, Netherlands) system in the temperature range 40 -300°C at a heating
rate of 10°C /min in a dynamic nitrogen atmosphere (20 mL/min). A sample of 5-6

Poly (ethylene sebacate) Nanoparticles of Anti-Tubercular Drugs
71 Particulate Carriers as Drug Delivery Systems for Anti-Tubercular and Anti-Cancer Agents
mg was sealed in an aluminum pan and an empty sealed aluminum pan was used as
the reference.
4.4.8. Powder X-Ray Diffraction (PXRD)
Powder XRD patterns were obtained for rifampicin, ethambutol, MSDNC-22, folic
acid, PES and the nanoparticles were recorded using a Rigaku Miniflex
diffractometer, with Cu Kα target tube, NaI detector, variable slits, a 0.050 step size,
operated at a voltage of 30 kV, 15mA current, at 2θ/min scanning speed, and scanning
angles ranged from 8-60º(2θ).
4.4.9. Hydrophobicity evaluation of nanoparticles (contact angle measurement)
Hydrophobicity of RIF, ETH, PES, RIF PES, RIF PES FA nanoparticles, RIF-ETH
PES nanoparticles and RIF-ETH PES FA nanoparticles was evaluated by measuring
the static contact angle of nanoparticles/drug pellet. Briefly, nanoparticle pellets were
prepared in KBr press using 25 mg freeze dried nanoparticles and press it at 10 tone
pressure for 1 minute. Drop water contact angles were measured on a Kruss contact
angle measuring instrument G10, Germany. Milli-Q water was used with a drop
volume of approximately 5µl. Results are presented as an average of 3 measurements.
4.4.10. In-Vitro Release
i) Rifampicin release from RIF-PES nanoparticles
Drug release studies were performed by a modified dialysis method (Li, Y., et al.,
2005). Nanoparticles (equivalent to 10 mg drug) were loaded into a pre-treated
dialysis bag (Sigma, molecular weight cut-off 12-14 kDa,) and introduced into the
basket of USP apparatus-I. Phosphate-buffered saline(900ml) containing 1%w/v
ascorbic acid and 0.05%w/v sodium azide, at a pH of 7.2 was used as the dissolution
medium (Muttil, P., et al., 2007). Aliquots (5 mL) were withdrawn at specific time
intervals, and analyzed for RIF by UV spectroscopy at λmax475 nm. Percent drug
release versus time profiles were plotted. Negligible leakage of the particles from the
dialysis tube was confirmed by testing the blank Np, which showed no absorbance in
the release medium.
ii) Folic acid release from RIF-PES FA nanoparticles
Release of folic acid from the nanoparticles was evaluated as above excluding sodium
azide and ascorbic acid from dissolution medium. Aliquots (5 mL) were withdrawn at
specific time intervals, and extracted with dichloromethane (DCM) to separate RIF.
Folic acid was quantified at λmax256.5 nm. Additionally release of folic acid was

Poly (ethylene sebacate) Nanoparticles of Anti-Tubercular Drugs
72 Particulate Carriers as Drug Delivery Systems for Anti-Tubercular and Anti-Cancer Agents
studied in media having various pH such as pH-1.2, pH-4.5, and pH-6.8. Percent folic
acid release versus time profiles were plotted.
iii) RIF and ETH release from RIF-ETH PES nanoparticles
In-vitro release of RIF and ETH from RIF-ETH PES nanoparticles was performed by
a modified dialysis method (Li, Y., et al., 2008). Nanoparticles (equivalent to 10 mg
drug) were loaded into a pre-treated dialysis bag (Sigma, molecular weight cut-off 12-
14 kDa,) and introduced into the basket of USP apparatus-I. Phosphate-buffered
saline (900ml) at a pH of 7.4 was used as the dissolution medium. Aliquots (5 mL)
were withdrawn at specific time intervals. RIF was analysed by UV spectroscopy at
λmax412 nm. RIF was extracted out and ETH was analyzed after derivatization with
copper sulphate by UV spectroscopy at λmax412 nm. Percent drug release versus time
profiles were plotted.
vi) Kinetic model study
In vitro release data for RIF was fitted to kinetic models such as zero-order, first-
order, Higuchi equation, Korsemeyer–Peppas equation, and Hixson–Crowell
equation. The regression analysis was performed.
• Qt versus t (zero order)
• log Qt versus t (first order)
• Qt versus square root of t (Higuchi)
• log %Qt versus log %t (Korsmeymer-Peppas)
• Qt versus cube root of t (Hixson–Crowell)
Where Qt is the amount of drug released at time t. The criteria for selecting the most
appropriate model were sum of square of residuals (SSR) (Shivkumar et. al, 2007,
Shoaib et.al, 2006, Thakkar et,al. 2009).
4.5. STABILITY STUDY
The nanoparticles were freeze dried, packed and sealed in amber glass vials and
subjected to stability studies as per the ICH guidelines at 300C/65RH and 400C/75RH.
4.6. MACROPHAGE UPTAKE STUDY IN U937 CELL LINE
4.6.1. Maintenance of cell line
Human macrophage cell line U-937 of histiocytic lymphoma origin was procured
from the National Centre for Cell Science (NCCS), Pune, India. Cells were cultured at
37o C and 5% CO2 in RPMI 1640 medium with growth supplements, gentamycin and

Poly (ethylene sebacate) Nanoparticles of Anti-Tubercular Drugs
73 Particulate Carriers as Drug Delivery Systems for Anti-Tubercular and Anti-Cancer Agents
10% bovine fetal calf serum. Cells were screened for their viability and change in
morphology by trypan blue dye exclusion technique. 100 µl of the cells from each
well were mixed with 100 µl of Trypan Blue solution (0.16%w/v) and cells were
counted in a WBC chamber of the Neubauer hemocytometer.
4.6.2. Cell uptake study
Macrophage uptake of the following formulations was evaluated:
i) RIF solution, RIF PES nanoparticles and RIF PES FA nanoparticles
ii) RIF-ETH solution, RIF-ETH PES nanoparticles and RIF-ETH PES FA
nanoparticles
iii) RIF-MSDNC-22 solution, RIF-MSDNC-22 PES nanoparticles and RIF-MSDNC-
22 PES FA nanoparticles
Free drug/drugs and nanoparticles (equivalent to 10µg drug/drugs) were incubated,
with the human macrophage cells containing 10% fetal calf serum, at 370C in
presence of 5% CO2 at a cell density of 2 x 10⁶ cells/ml. After incubation for 1 h, the
cells were separated from the uninternalized nanoparticles by centrifugation at 1000
rpm for 3 mins. Methanol was added to the supernatant. The precipitated protein was
separated by centrifugation and drug/drugs in the supernatant quantified by HPLC
method. The cell pellet was lysed by sonication following addition of 0.5% sodium
dodecyl sulphate solution (in PBS). Methanol was added to precipitate the proteins,
the suspension centrifuged and the supernatant analyzed by HPLC method to
determine drug/drugs concentration in the cells. Drug was quantified both in
supernatant and cell pellet to ensure mass balance.
4.7. ORAL BIODISTRIBUTION STUDY BY GAMMA SCINTIGRAPHY
4.7.1. Instruments
In vivo studies were carried out by gamma scintigraphy. The radioactivity in each
organ was counted using CAPINTEC radioisotope calibrator (CRC®-127 R) and
expressed as percent injected dose per gram organ. Dynamic images were acquired in
64 X 64 matrix for 30 minutes (4 fr/sec for 1 minute followed by frame/minute for 29
minutes) using Millenium MP5 single head Gamma camera mounted with pin-hole
collimator (GE). The data was acquired in Genie Acquisition Station. Dynamic
images were processed on eNTEGRA workstation employing temporal filter. Static
images were acquired in 256 x 256 matrix at 140 kev and 20% window for 1 minute.
Poly (ethylene sebacate) Nanoparticles of Anti-Tubercular Drugs
74 Particulate Carriers as Drug Delivery Systems for Anti-Tubercular and Anti-Cancer Agents
The acquisition of images (dynamic and static) was performed by using GENIE
acquisition station and transferred to eNTEGRA workstation for further processing.
4.7.2. Radiolabeling
Rifampicin and RIF nanoparticles were radiolabelled using 99mTc direct labeling
method. Briefly 0.1 ml of stannous chloride stock solution was added to 0.5 ml of
solution containing 8mCi of radioactivity and was shaken for 10 minutes. RIF/RIF
nanoparticles (0.6ml) were added to the above mixture followed by shaking for 20
minutes at room temperature.
4.7.3. Radiolabeling- efficiency
Radiolabeled RIF/RIF nanoparticles (50 µl) were loaded onto precoated TLC plates
and chromatography was carried out using acetone as the mobile phase. The spots
were eluted and counted in the gamma counter and radiolabeling efficiency was
calculated using the equation:
4.7.4. Stability of Radiolabeled RIF/RIF nanoparticles
All the radio-conjugates were tested for in-vivo and in-vitro stability. For
ascertaining in-vivo stability, the radiolabeled drug or the nanoparticulates were
administered to rats under gamma camera and whole body images were acquired.
The radioactivity counts appearing in thyroid over a time period up to 2 hours is an
indication of in vivo hydrolysis and reflects the in-vivo stability of the radio-
conjugate. Stability of the radioconjugates was also tested in-vitro where the
radiolabeled conjugates were tested for their stability in normal saline and rat serum.
Radiolabeled RIF/RIF nanoparticles (0.2ml) were taken and mixed with 5 ml rat
serum/normal saline. This mixture was shaken for one hour and the aliquot of the
mixture run on a TLC plate. The stability was determined over 6 hours.
4.7.5. Biodistribution study
Healthy male wistar rats with average body weight (BW) 200-250 g and were used for
the study. The animals were maintained under standard laboratory conditions (14h:
10h dark/light cycle, a temperature of 22±2°C and 50-70% humidity). Pelleted feed
and water were provided ad libitum. The animal ethics committee, Bombay veterinary
College, Mumbai, India had approved the experimental protocol for study. Animals

Poly (ethylene sebacate) Nanoparticles of Anti-Tubercular Drugs
75 Particulate Carriers as Drug Delivery Systems for Anti-Tubercular and Anti-Cancer Agents
were anesthetized by injecting a ketamine hydrochloride (50 mg kg-1) and xylazine
hydrochloride (10 mg kg-1) cocktail intramuscularly 20 min prior to study.
Male wistar rats (n=4) were fasted for 12 hrs. RIF (10 mg/kg) as radiolabeled RIF
solution/ RIF nanoparticles (approx 500 µCi) was administered by oral gavage. The
animals were placed prone on a Millennium MPS Acquisition System, (Multipurpose
Single Head Square Detector) Gamma Camera fitted with Low Energy General
Purpose (LEGP) collimator. The distance of collimator to table was maintained at 95
cm for all acquisitions. For the purpose of determining total injected dose the
radioactivity of syringe before and after dosing was determined using gamma counter.
Total injected dose was estimated by subtracting radioactivity after dosing from
radioactivity before dosing. At intervals of 0.5h, 1 h, 2 h, 4 h, and 6 h post dosing,
static images were recorded for a period of 1 min each at 1.33x zoom. All the static
images were stored digitally in a 256 x 256 matrix. At the end of 6 hours animals
were sacrificed by cervical dislocation, and different organs of interest including
heart, spleen, lungs, stomach, liver, and small intestine were isolated. The organs were
washed three times with saline, blot dried and weighed and radioactivity was measure
in gamma counter. Administered dose was calculated by subtracting the activity of
empty syringe from the full syringe image. The radioactivity counts per minute (cpm)
in each organ were determined using gamma counter (Capnitech) and corrected for
physical decay. The % injected dose g-1 of organ was calculated.
4.8. PHARMACOKINETIC AND LUNG UPTAKE OF NANOPARTICLES
4.8.1. Pharmacokinetic study
Male Wistar rats (200-250gms) (n=6) were fasted 12-18h prior to dosing. Rats were
divided into six groups, one group received plain drug solution, the second group
received RIF PES Np’s, third group received RIF PES FA Np’s (equivalent to
10mg/kg body weight of RIF) administered by oral gavage. While fourth group
received RIF-ETH solution, the fifth group received RIF-ETH PES Np’s and sixth
group received RIF-ETH PES Np’s (equivalent to 20mg/kg body weight of ETH)
administered by oral gavage. Blood samples were withdrawn from the retro-orbital
plexus prior to dosing and at 1, 2, 4, 6, 12 and 24h post dosing and collected in tubes
containing 4.1% EDTA. Plasma was separated, drug extracted and quantified by
HPLC. The peak plasma concentration (Cmax) and peak plasma time (Tmax) were

Poly (ethylene sebacate) Nanoparticles of Anti-Tubercular Drugs
76 Particulate Carriers as Drug Delivery Systems for Anti-Tubercular and Anti-Cancer Agents
obtained by visual data inspection. The area under plasma drug concentration over
time curve (AUC0–t) and t1/2 were calculated using BASICA software.
4.8.2. Lung uptake study
Rats mentioned above in pharmacokinetic were euthanized at 24h by excessive
carbon dioxide, lungs, liver, spleen and kidney were isolated and placed in phosphate
buffered saline (PBS), pH 7.4 and homogenized using a tissue homogenizer. Drug
was extracted and evaluated for drug content by HPLC.

5. Results and Discussion

Poly (ethylene sebacate) Nanoparticles of Anti-Tubercular Drugs
77 Particulate Carriers as Drug Delivery Systems for Anti-Tubercular and Anti-Cancer Agents
5. RESULTS AND DISCUSSION 5.1. PREPARATION AND OPTIMIZATION OF NANOPARTICLES
5.1.1. PES Nanoparticles of Rifampicin
Nanoprecipitation method first developed by Fessi et al., 1992 is an easy and
reproducible technique to produce nanoparticles with size < 500nm and has been used
by several research groups to prepare drug loaded polymeric nanoparticles. Hence
nanoprecipitation method was selected for the preparation of RIF loaded PES
nanoparticles.
Studies were initiated with a prototype formula consisting of 100mg PES, 25ml
aqueous phase, 10ml organic phase (THF:MeOH-9:1), 20mg RIF, and 50mg lutrol-f-
68.
a) Effect of lutrol-F-68 concentration
Table 5.1 : Effect of lutrol-F-68 concentration on %EE and particle size
RPES/1 RPES/2 RPES/3
Particle size (nm) 405.9 ± 15.9 287.15 ± 18 252.75 ± 14.5
PI 0.328 ± 0.083 0.347 ± 0.062 0.297 ± 0.092
%EE RIF 74.18 ± 2.35 % 72.37 ± 2.13 72.37 ± 2.13
% RIF loading 12.56 ± 0.186 12.3 ± 0.211 10.9 ± 0.143
Figure 5.1: Effect of lutrol-F-68 concentration on %EE and particle size
As shown in figure 5.1 lutrol-f-68 concentration from 0.04% w/v (RPES/1) to 0.1%
w/v (RPES/2) revealed no significant change in entrapment efficiency of RIF

Poly (ethylene sebacate) Nanoparticles of Anti-Tubercular Drugs
78 Particulate Carriers as Drug Delivery Systems for Anti-Tubercular and Anti-Cancer Agents
(P>0.05), with further increase in lutrol-F-68 concentration from 0.1% w/v (RPES/2)
to 0.2% w/v (RPES/3) significant decrease in entrapment efficiency (P<0.05) was
observed (table 5.1). The decrease in entrapment efficiency with lutrol-f-68
concentration 0.2% w/v was attributed to the low CMC value of lutrol-F-68 (0.1 %)
(Youan et al., 2003) resulting in enhanced solubilisation of RIF. A significant
decrease in particle size (P<0.05) was seen with increase in lutrol-F-68 concentration.
Surfactants bring about reduction in particle size by two mechanisms; (i) reduction in
interfacial tension between organic and aqueous phases due to surfactants promotes
rapid diffusion of two phases and allows formation of smaller droplet and thus small
mean size of nanoparticles, (ii) increase in viscosity of the aqueous phase promotes
hydrodynamic stabilization by preventing coalescence and aggregation of droplets
formed (Schubert et al., 2003; Galindo-Rodriguez et al., 2004). This effect is more
pronounced above the critical micelle concentration (CMC) of the surfactant. Above
CMC, excess surfactant present in the bulk solution is available for droplet coverage
resulting in better hydrodynamic stability and thereby lower particle size. This
explains the role of lutrol-F-68 on particle size (figure 5.1). Similar data is reported in
literature with other drugs (Lamprecht et al., 2001, Patil et al., 2008).
b) Effect of RIF: PES ratio
Figure 5.2: Effect of Drug:Polymer ratio on %EE and particle size
Effect of different RIF:PES ratio on entrapment efficiency and particle size is shown
in figure 5.2. Varying the RIF:PES ratio from 1:2 to 1:5 significantly increased the
entrapment efficiency of RIF with increase in polymer concentration (table 5.2). This

Poly (ethylene sebacate) Nanoparticles of Anti-Tubercular Drugs
79 Particulate Carriers as Drug Delivery Systems for Anti-Tubercular and Anti-Cancer Agents
increase in entrapment efficiency can be related to higher amount of polymer
available for entrapment. Increase in particle size can be related to increased viscosity
of the organic phase at higher polymer concentration. At higher polymer
concentration solvent diffusing into the aqueous phase carries with it higher amount
of polymer which forms relatively larger nanoparticles. Moreover, increasing polymer
concentration increases polymer-polymer interaction which means that more polymer
remains associated during the diffusion process to contribute relatively larger particle
size [Quintanar-Guerrero et al., 2005, Galindo-Rodriguez et.al, 2004].
Table 5.2 : Effect of Drug:Polymer ratio on %EE and particle size
RPES/1 RPES/4 RPES/5 RPES/6 Particle size
(nm) 405.9 ± 15.9 349.5 ± 30 330.2 ± 20 302.3 ± 25
PI 0.328 ± 0.083 0.239 ± 0.09 0.281 ± 0.102 0.197 ± 0.12 %EE RIF 74.18 ± 2.35 60.32 ± 2.3 43.57 ± 1.95 28.94 ± 3.04
% RIF loading 12.56 ± 0.186 10.9 ± 0.140 7.83 ± 0.12 5.66 ± 0.11
5.1.2. Folate anchored PES Nanoparticles of Rifampicin
Folic acid is a known ligand for the folate receptors over-expressed on infected
macrophages. Folic acid was included to increase uptake of nanoparticles by active
targeting to the macrophages and to increase the efficacy. Folate anchored PES
nanoparticles of RIF (RPESFA/1) was successfully prepared by simple physical
adsorption technique. Entrapment efficiency ~42% was obtained for folic acid which
did not influence the particle size.
Literature reports folic acid anchored to the nanocarriers by covalent conjugation to
the polymer prior to nanoparticle preparation (Zhao et al., 2008; Lee et al., 2003; Han
et al., 2009; Lee et al., 1994; Low et al., 1991), alternatively preformed polymeric
nanoparticles are covalently conjugated to folic acid (Stella et al., 2000). A common
approach is the use of carbodimide derivatives to activate folic acid and conjugate it
to the polymer (Lee et al., 2003; Chen et al., 2007). Couvreur et al. have coupled folic
acid to poly[aminopoly(ethylene glycol)cyanoacrylate-co-hexadecyl cyanoacrylate,
by preparing its N-hydroxysuccinimide ester. Conjugation methods include the need
for purification, and moreover toxicity evaluation, as the conjugate could be
considered as a new excipient. This could increase the cost (You et al., 2008; Chen et
al., 2007; Turk et al., 2004; Leamon et al., 1991). Physical adsorption techniques to
anchor folic acid could provide a significant advantage in the design of folate

Poly (ethylene sebacate) Nanoparticles of Anti-Tubercular Drugs
80 Particulate Carriers as Drug Delivery Systems for Anti-Tubercular and Anti-Cancer Agents
anchored nanoparticles. Physical adsorption techniques as an approach for folate
anchoring therefore presents a simple, practical and viable non-covalent method for
the design of folate anchored nanoparticles that could facilitate folate receptor
mediated targeting.
Table 5.3 shows optimized batch for RIF loaded PES nanoparticles with and without
folic acid using nanoprecipitation method.
Table 5.3: Optimized batch for RIF PES Np’s and RIF PES FA Np’s
RIF-PES NPs
(RPES/1)RIF-PES FA NPs
(RPESFA/1)
Mean Particle size (nm) 405.9 ± 15.9 416.6 ± 10.1
Polydispersity index 0.328 ± 0.083 0.298 ± 0.059
%EE for RIF 74.18 ± 2.35 % 73.07 ± 1.69 %
%EE for Folic acid - 42.28 ± 2.5 %
%Drug Loading 12.56 ± 0.186% 12.48 ± 0.167%
5.1.3. PES Nanoparticles of Rifampicin-Ethambutol
The challenge here was preparation of nanoparticles of combination of two drugs with
contrasting solubility i.e RIF having poor water solubility and EMB being highly
water soluble. Therefore we evaluated multiple emulsion method (double emulsion
method). Method is advantageous for entrapment of both hydrophilic as well as
hydrophobic drugs especially for good entrapment efficiency of water soluble small
drugs, protein and peptide with retention of bioactivity (Soppimath et al., 2001, Bala
et al., 2004, Moinard-Checot et al., 2006). In this method highly water soluble drug(s)
is present in innermost aqueous phase (w/o/w) and hydrophobic molecule present in
middle oil phase and hence good entrapment for both hydrophilic and hydrophobic
drugs achieved.
Multiple emulsion method necessitates selection of a water immiscible solvent. Hence
DCM was selected. Studies were initiated with a prototype formula consisting of
100mg PES, 25ml aqueous phase, 10ml dichloromethane 10mg RIF, EMB 20mg,
20mg dioctyl sodium sulfosuccinate (AOT) and 50mg polyvinyl alcohol (PVA).
Although AOT has HLB >25 it was selected as surfactant as it is reported to form
reverse micelles. Amount of PVA and RIF to EMB ratio were varied in this prototype
formula.
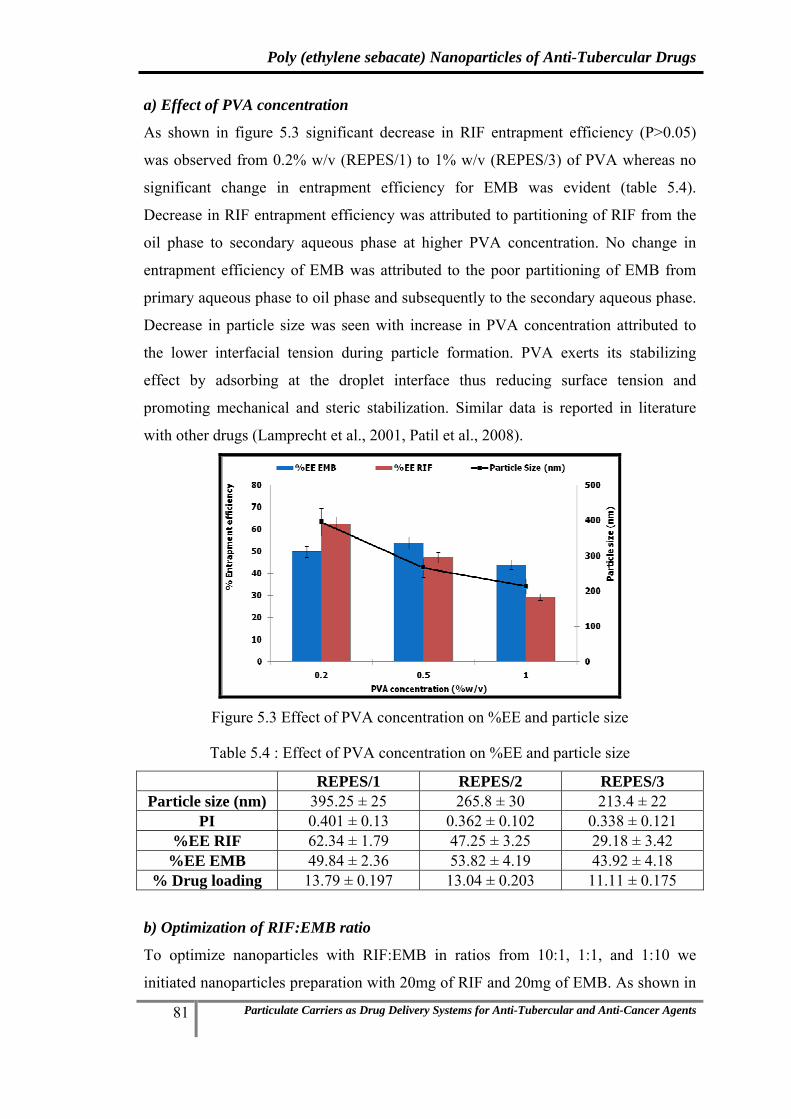
Poly (ethylene sebacate) Nanoparticles of Anti-Tubercular Drugs
81 Particulate Carriers as Drug Delivery Systems for Anti-Tubercular and Anti-Cancer Agents
a) Effect of PVA concentration
As shown in figure 5.3 significant decrease in RIF entrapment efficiency (P>0.05)
was observed from 0.2% w/v (REPES/1) to 1% w/v (REPES/3) of PVA whereas no
significant change in entrapment efficiency for EMB was evident (table 5.4).
Decrease in RIF entrapment efficiency was attributed to partitioning of RIF from the
oil phase to secondary aqueous phase at higher PVA concentration. No change in
entrapment efficiency of EMB was attributed to the poor partitioning of EMB from
primary aqueous phase to oil phase and subsequently to the secondary aqueous phase.
Decrease in particle size was seen with increase in PVA concentration attributed to
the lower interfacial tension during particle formation. PVA exerts its stabilizing
effect by adsorbing at the droplet interface thus reducing surface tension and
promoting mechanical and steric stabilization. Similar data is reported in literature
with other drugs (Lamprecht et al., 2001, Patil et al., 2008).
Figure 5.3 Effect of PVA concentration on %EE and particle size
Table 5.4 : Effect of PVA concentration on %EE and particle size
REPES/1 REPES/2 REPES/3 Particle size (nm) 395.25 ± 25 265.8 ± 30 213.4 ± 22
PI 0.401 ± 0.13 0.362 ± 0.102 0.338 ± 0.121 %EE RIF 62.34 ± 1.79 47.25 ± 3.25 29.18 ± 3.42
%EE EMB 49.84 ± 2.36 53.82 ± 4.19 43.92 ± 4.18 % Drug loading 13.79 ± 0.197 13.04 ± 0.203 11.11 ± 0.175
b) Optimization of RIF:EMB ratio
To optimize nanoparticles with RIF:EMB in ratios from 10:1, 1:1, and 1:10 we
initiated nanoparticles preparation with 20mg of RIF and 20mg of EMB. As shown in

Poly (ethylene sebacate) Nanoparticles of Anti-Tubercular Drugs
82 Particulate Carriers as Drug Delivery Systems for Anti-Tubercular and Anti-Cancer Agents
table 5.5 RIF has entrapment efficiency in the range of 57-64% and EMB 44-51%.
Based on the entrapment efficiency of RIF and EMB initially we obtained
nanoparticles in a ratio of 1:0.7 (RIF:EMB) (REPES/4). For example based on the
ratio the amount of RIF and EMB was varied during nanoparticle preparation to
obtain the desire ratio of RIF and EMB. To obtain RIF:EMB ratio 1:1 and 10:1
amount of RIF was modified as 15mg (REPES/5) and 2.5mg (REPES/6) respectively.
Similarly to obtain RIF:EMB ratio 1:10 amount of RIF kept same in REPES/4 and
amount of EMB was modified as 2.5mg (REPES/8). All the nanoparticles having the
particle size ranging from 350 to 450 nm.
Table 5.5: Optimized batch for RIF-EMB PES Np’s at different ratio
REPES/4 REPES/5 REPES/6 REPES/7 REPES/8 Average particle size (nm) 397.3 ± 25 401.05 ± 30 391.2 ± 40 399.8 ± 10 385.0 ± 45
%EE RIF 63.98 ± 1.06 63.42 ± 1.5 57.33 ± 1.93 63.51 ± 1.24 62.6 ± 2.05 %EE EMB 44.55 ± 0.33 47.93 ± 2.59 50.93 ± 2.34 51.34 ± 0.82 48.75± 3.1 Drug Entrapped RIF (mg) 12.79 ± 0.12 9.51 ± 0.28 1.14 ± 0.24 12.60 ± 0.09 12.52 ± 0.29 EMB (mg) 8.90 ± 0.16 9.58 ± 0.35 10.18 ± 0.31 2.57 ± 0.19 1.22 ± 0.36 RIF:EMB ratio ~1:0.7 ~1:1 ~1:10 ~1:0.2 ~1:0.1 (10:1)
5.1.4. PES Nanoparticles of Rifampicin-Ethambutol with ligand folic acid
In-vitro studies on RIF-EMB combinations revealed maximum efficacy against
Mycobacterium tuberculosis at RIF:EMB (1:10) hence nanoparticles of the same ratio
of the two drugs were evaluated with ligand folic acid.
RIF-EMB PES FA nanoparticles (REPESFA/1) were readily prepared by adding
ligand folic acid to RIF-EMB PES nanoparticles (REPES/6) and the concentration of
folic acid optimized in section 5.1.2 (RPESFA/1) was used. Folate anchored PES
nanoparticles of RIF-EMB (RPESFA/1) was successfully prepared with entrapment
efficiency ~42% was obtained for folic acid which did not influence the particle size.
5.1.4. PES Nanoparticles of Rifampicin-MSDNC-22 with and without folic acid
This study was intended of a physibility study of an entrapment of MSDNC-22 with
RIF. RIF-MSDNC-22 PES and RIF-MSDNC-22 PES FA nanoparticles were prepared
by nanoprecipitation method optimized in section 5.1.1 and 5.1.2 was used (RPES/1).
MSDNC-22 was included in organic phase. Nanoparticles with RIF:MSDNC-22 in
ratios from 10:1, 1:1, and 1:10 and particle size ranging from 350 to 450nm were

Poly (ethylene sebacate) Nanoparticles of Anti-Tubercular Drugs
83 Particulate Carriers as Drug Delivery Systems for Anti-Tubercular and Anti-Cancer Agents
readily prepared by varying the ratios of MSDNC-22 and RIF during their preparation
based on their entrapment efficiency observed. Table 5.6 shows optimized batch for
RIF- MSDNC-22 loaded PES nanoparticles at different ratio.
Table 5.6: Optimized batch for RIF- MSDNC-22 PES Np’s at different ratio
RMPES/2
RMPES/1
RMPES/3
Average particle size (nm) 421.05 ± 30 430.0 ± 20 425.2 ± 20 %EE RIF 59.32 ± 1.85 75.3 ± 2.25 35.33 ± 2.43 %EE MSDNC-22 87.53 ± 0.66 86.17± 0.37 86.74 ± 0.79 Drug Entrapped RIF (mg) 8.72 ± 0.13 15.24 ± 0.41 0.85 ± 0.25 MSDNC-22 (mg) 8.75 ± 0.21 1.71 ± 0.29 8.75 ± 0.12 RIF:MSDNC-22 (1:1) (10:1) (1:10)
RIF-MSDNC-22 PES FA nanoparticles (RMPESFA/1) were readily prepared by
adding ligand folic acid to RIF-MSDNC-22 PES nanoparticles (REPES/6) and the
concentration of folic acid optimized in section 5.1.2 (RPESFA/1) was used. Folate
anchored PES nanoparticles of RIF-MSDNC-22 (RMESFA/1) was successfully
prepared with entrapment efficiency ~42% was obtained for folic acid which did not
influence the particle size.
5.2. ISOLATION AND PRESERVATION OF NANOPARTICLES
5.2.1. Freeze-Thaw study
The RIF PES nanoparticle (RPES/1) was selected for freeze thaw study as it has
entrapment efficiency >70% with desire particle size 350-450nm. The
physicochemical properties of nanoparticles have an effect on their efficiency in drug
delivery (Bozdag et.al, 2005). If particles are stored as a suspension in an aqueous
medium, degradation and/or solubilization of the polymer, drug leakage, drug
desorption and/or drug degradation may occur. Lyophilization represents one of the
most useful methodology to ensure the long term conservation of unloaded or drug-
bound polymeric nanoparticles (Roy et.al, 1997, Abdelwahed et.al, 2006, Kuleshova
et.al, 1999). After freeze-drying, easy and rapid reconstitution and unchanged particle
size of the product are important features. Freeze thaw represent a quick and
economical method to assess effect of cryoprotectant on particle aggregation.
Carbohydrates are favored as freeze-drying excipients since they are chemically
innocuous and can be easily vitrified during freezing (Bozdag et.al, 2005).

Poly (ethylene sebacate) Nanoparticles of Anti-Tubercular Drugs
84 Particulate Carriers as Drug Delivery Systems for Anti-Tubercular and Anti-Cancer Agents
Carbohydrates as cryoprotectant have proved to be superior to polyalcohols. Hence a
disaccharide trehalose and a sugar alcohol mannito were selected for the study.
(Schwarz, et.al, 1997, Chasteigner et.al, 1996, Franks et.al, 1998).
a) Effect of type and concentration of cryoprotectant
Table 5.7: Freeze Thaw study of RPES/1 nanoparticle using Mannitol
Lutrol-F-68 (1:0) Lutrol-F-68 (1:0.05) Lutrol-F-68 (1:0.1) Lutrol-F-68 (1:0.2)
Si Sf Sf/Si
ratio Si Sf
Sf/Si
ratio Si Sf
Sf/Si
ratio Si Sf
Sf/Si
ratio
Mannitol
(1:5) 385.5 570.5 1.468 434 499.6 1.151 415.5 482.6 1.161 390.2 513.2 1.468
Mannitol
(1:10) 401.4 >1000 2.491 428.6 602.4 1.405 442 592.2 1.339 424.8 959.2 2.258
Mannitol
(1:20) 427.2 >1000 2.339 388.9 >1000 2.902 391 819 2.052 423.3 843.8 1.988
Table 5.8: Freeze Thaw study of RPES/1 nanoparticle using Trehalose
Lutrol-F-68 (1:0) Lutrol-F-68 (1:0.05) Lutrol-F-68 (1:01) Lutrol-F-68 (1:0.2)
Si Sf Sf/Si
ratio Si Sf
Sf/Si
ratio Si Sf
Sf/Si
ratio Si Sf
Sf/Si
ratio
Trehalose
(1:5) 395.9 >1000 3.120 450.6 622.2 1.380 447.1 495.3 1.107 455.5 464.4 1.019
Trehalose
(1:10) 421.1 742.3 1.762 383.2 392.2 1.023 432.3 419.6 0.970 449.9 467.8 1.039
Trehalose
(1:20) 420.1 621.4 1.479 462 452.9 0.980 442.5 447.3 1.010 439.8 455.8 1.036
Samples with cryoprotectants showed concentration dependent cryoprotection and
revealed greater increase in particle size at lower cryoprotectant concentrations
(Sugrue et.al, 1992). Large aggregates were clearly observed in samples frozen
without cryoprotectant, and hence their particle size was not determined. Absence of
lutrol-f-68 revealed poor cryoprotection with both trehalose and Mannitol (Table 5.7
and 5.8). Similar kind of results was observed by Guhagarkar et al., 2009 and 2010
for PES as a polymer. At equivalent concentration in combination with lutrol-f-68,
trehalose proved to be a better cryoprotectant than mannitol (Table 5.8). Trehalose
(1:10, 1:20 by weight of nanoparticles) in combination with lutrol-F-68 (1:0.05, 1:0.1,
1:0.2 by weight of nanoparticles) revealed the best cryo-protection with a Sf/Si (Sf-

Poly (ethylene sebacate) Nanoparticles of Anti-Tubercular Drugs
85 Particulate Carriers as Drug Delivery Systems for Anti-Tubercular and Anti-Cancer Agents
final particle size after freeze thaw, Si- initial particle size) ratio of <1.3 (Table 5.8) is
considered acceptable(Saez, A et.al, 2000), while mannitol at the same concentration
revealed a high Sf/Si ratio of >1.3 after the freeze thaw study.
When the nanoparticle dispersion containing cryoprotectant is frozen below glass
transition temperature, the cryoprotectants form a glassy/vitreous coating around the
nanoparticles protecting them against stresses like mechanical stress of ice crystals
thereby preventing aggregation. Insufficient concentration of cryoprotectant leads to
incomplete coating of glassy matrix around nanoparticles favoring aggregation.
Further according to the Particle Isolation Hypothesis the spatial separation of
particles within the unfrozen fraction results in insufficient cryoprotectant at higher
concentration of nanoparticles, leading to aggregation. Particle isolation hypothesis
suggest that the separation of individual particles within the unfrozen fraction
prevents aggregation during freezing. According to this hypothesis, sufficient
quantities of virtually any excipient should offer similar protection during freezing.
Furthermore the concentrated suspensions employed in clinical trials may be difficult
to preserve by lyophilization (Allison et.al, 2000).
Freezing temperature below Tg′ of cryoprotectant has no effect on the glassy
protective matrix of cryoprotectant formed around the nanoparticles. Freeze thaw
study was carried out at temperatures below the Tg′ of cryoprotectants used (Franks
et.al, 1998) and hence it is expected to have no effect on stability, aggregation and
redispersion properties of freeze dried nanoparticle preparation. It has been reported
that there was a negligible increase in Sf/Si ratio of poly(D,L-lactic acid)
nanoparticles during freeze thawing at 2 different temperatures i.e -55°C and at -
196°C with trehalose (Guerrero et.al, 1998).
Trehalose showed better cryoprotectant effect than mannitol because, trehalose is a
non-reducing sugar and exists only in closed ring form. Moreover trehalose has one of
the highest glass transition temperatures (Tg) of all saccharides commonly used
(TREHATM, trehalose by Hayashibara, Japan) and disaccharides like trehalose appear
to have a greater influence on the vitrification properties or they are more active than
monosaccharides like mannitol. The lower the Tg, the more the lyophilizates tend to
collapse. Trehalose is very often considered as the best cryoprotective agent among
the available carbohydrates (Abdelwahed, et.al, 2006, Chasteigner et.al, 1996, Franks
et.al, 1998). Our study supports this observation.

Poly (ethylene sebacate) Nanoparticles of Anti-Tubercular Drugs
86 Particulate Carriers as Drug Delivery Systems for Anti-Tubercular and Anti-Cancer Agents
5.2.2. Freeze-drying of nanoparticles
Table 5.9: Freeze drying of RIF PES nanoparticle
Sr. No RIF PES Np’s (RPES/1) Size before
FD (Si)
Size after
FD (Sf)
Sf/Si ratio
1 Trehalose (1:10) + Lutrol-F-68 (1:0.05) 389.7 602.1 1.54 2 Trehalose (1:20) + Lutrol-F-68 (1:0.05) 421.5 575.8 1.36 3 Trehalose (1:5) + Lutrol-F-68 (1:0.1) 416.5 598.3 1.43 4 Trehalose (1:10) + Lutrol-F-68 (1:0.1) 413.4 501.2 1.21
Various concentrations of trehalose along with lutrol-F-68 showed marginal increase
in particle size with a Sf/Si ratio <1.3 hence selected for freeze drying of RIF PES
nanoparticle. As shown in table 5.9 trehalose (10:1 by weight of nanoparticles) in
combination with lutrol-F-68 (0.1:1 by weight of nanoparticles) revealed the best
cryo-protection with a Sf/Si (Sf- final particle size after freeze thaw, Si- initial particle
size) ratio of <1.3 during freeze drying. Hence was selected for freeze drying of all
other nanoparticles, the data is shown in table 5.10.
Table 5.10: Sf/Si ratio of various freeze dried nanoparticles
Freeze dried NPDDS Size beforeFD (Si)
Size after FD (Sf)
Sf/Si ratio
RIF PES Np (RPES/1) 413.4 501.2 1.21 RIF PES FA Np (RPESFA/1) 421.3 518.1 1.23 RIF-EMB PES Np (REPES/6) 403.9 484.6 1.20 RIF-EMB PES FA Np (REPES6FA/1) 410.6 480.4 1.17 RIF-MSDNC-22 PES Np (RMPES/3) 425.3 514.6 1.21 RIF-MSDNC-22 PES FA Np (RMPES3FA/1) 416.8 495.9 1.19
5.3. EVALUATION AND PHYSICAL CHARACTERIZATION
5.3.1. Scanning Electron Microscopy (SEM)
a) b)

Poly (ethylene sebacate) Nanoparticles of Anti-Tubercular Drugs
87 Particulate Carriers as Drug Delivery Systems for Anti-Tubercular and Anti-Cancer Agents
c) d)
e) f)
Figure 5.4: SEM images of a) RIF PES Nps b) RIF PES FA Nps c) RIF-EMB PES Nps d) RIF-EMB PES FA Nps e) RIF-MSDNC-22 PES Nps f) RIF-MSDNC-22 PES FA Nps
Scanning Electron Microscopy (SEM) revealed polydispersed nanoparticles with
spherical morphology (Figure 5.4).
5.3.2. Zeta Potential
Table 5.11: Zeta potential of nanoparticles
NPDDS Zeta Potential mV RIF PES Np (RPES/1) -33.22 RIF PES FA Np (RPESFA/1) -29.85 RIF-EMB PES Np (REPES/6) -31.79 RIF-EMB PES FA Np (REPES6FA/1) -32.07 RIF-MSDNC-22 PES Np (RMPES/3) -29.11 RIF-MSDNC-22 PES FA Np (RMPES3FA/1) -30.95
Nanoparticles exhibited a negative zeta potential due to free terminal hydroxyl group
of PES (Table 5.11). Zeta potential values ranged from -25 to – 35 mV which is an
indicator of good colloidal stability (Sugrue et al., 1992). Anchoring folic acid did not
cause significant change in zeta potential.

Poly (ethylene sebacate) Nanoparticles of Anti-Tubercular Drugs
88 Particulate Carriers as Drug Delivery Systems for Anti-Tubercular and Anti-Cancer Agents
5.3.3. Fourier Transform Infrared spectroscopy (FTIR)
FTIR studies are rapid method of accessing drug: excipient interaction in the
formulation. FTIR of RIF, EMB, MSDNC-22, folic acid, PES and their respective
nanoparticles along with excipients revealed all the characteristic peaks of RIF, EMB,
MSDNC-22. RIF has principal peaks at wavenumbers 1250, 1567, 976, 1098, 1064,
1650 cm−1which are also found in RIF PES nanoparticles with and without folic acid.
EMB has principal peaks at wavenumbers 1090, 1061, 1142, 987, 1050, 1009 cm−1.
RIF-EMB PES nanoparticles with and without folic acid revealed no change in the
wavenumbwe of RIF and EMB. No drug: excipient interaction was evident in the
spectra (Figure 5.5).
Rifampicin Ethambutol
MSDNC-22 Folic acid
Poly (ethylene sebacate) Lutrol-F-68

Poly (ethylene sebacate) Nanoparticles of Anti-Tubercular Drugs
89 Particulate Carriers as Drug Delivery Systems for Anti-Tubercular and Anti-Cancer Agents
Poly vinyl alcohol Aerosol OT
RIF PES Nps RIF PES FA Nps
RIF-EMB PES Nps RIF-EMB PES FA Nps
RIF-MSDNC-22 PES Nps RIF-MSDNC-22 PES FA Nps
Figure 5.5: FTIR of drugs, excipients and nanoparticles

Poly (ethylene sebacate) Nanoparticles of Anti-Tubercular Drugs
90 Particulate Carriers as Drug Delivery Systems for Anti-Tubercular and Anti-Cancer Agents
5.3.4. Differential Scanning Calorimetry (DSC)
a) b)
c) d)
e) f)
Figure 5.6: DSC thermogram of a) RIF PES Nps b) RIF PES FA Nps c) RIF-EMB PES Nps d) RIF-EMB PES FA Nps e) RIF-MSDNC-22 PES Nps f) RIF-MSDNC-22 PES FA Nps
DSC enables detection of all the processes in which energy is required or produced
(i.e. endothermic and exothermic phase transformations). The thermograms of RIF,
EMB, MSDNC-22, folic acid, PES and their respective nanoparticles along with
excipients are shown in figure 5.6. Pure RIF, EMB and MSDNC-22 revealed a sharp
melting endotherm corresponding to their melting point indicating crystalline nature.

Poly (ethylene sebacate) Nanoparticles of Anti-Tubercular Drugs
91 Particulate Carriers as Drug Delivery Systems for Anti-Tubercular and Anti-Cancer Agents
The disappearance of RIF, EMB and MSDNC-22 melting endotherm in their
respective nanoparticle suggests remarkable decrease in crystallinity (Date et al., 2012
Guhagarkar et al., 2010).
5.3.5. Powder X-ray Diffraction (P-XRD)
Poly (ethylene sebacate)
Rifampicin Ethambutol
MSDNC-22 Folic acid
RIF PES Nps RIF PES FA Nps
RIF-EMB PES Nps RIF-EMB PES FA Nps
RIF-MSDNC-22 PES Nps RIF-MSDNC-22 PES FA Nps
Figure 5.7: pXRD spectra of RIF, EMB, MSDNC-22, folic acid, PES and their respective nanoparticles

Poly (ethylene sebacate) Nanoparticles of Anti-Tubercular Drugs
92 Particulate Carriers as Drug Delivery Systems for Anti-Tubercular and Anti-Cancer Agents
Crystallinity in the sample is reflected by a characteristic fingerprint region in the
diffraction pattern. The XRD spectra of RIF, EMB, MSDNC-22, folic acid, PES and
their nanoparticles are shown in figure 5.7. RIF, EMB, MSDNC-22, folic acid and
PES are highly crystalline powders showing characteristic sharp diffraction peaks.
These sharp diffraction peaks disappeared in the respective nanoparticles indicating
amorphization/remarkable decrease in crystallinity of the drug (Date et al., 2012
Guhagarkar et al., 2010).
5.3.6. In-vitro release
i) RIF PES FA nanoparticles
a) Rifampicin
RIF PES FA nanoparticles (RPESFA/1) showed sustained release of RIF upto 12h
with t50% 3.1h and t90% 10.13h which may be due to slow release of drug from the
nanoparticle matrix (figure 5.8). Ascorbic acid in the medium served as a stabilizer
(Muttil, et al., 2007).
Figure 5.8: In-vitro release of RIF from RIF PES FA nanoparticles (RPEFA/1)
Kinetic model study
The results of curve fitting of in-vitro release of RIF from RIF PES FA nanoparticles
into different mathematical models are given in table 5.12.
Table 5.12: Model fitting of RIF from RIF PES FA nanoparticles (RPESFA/1)
Model r2 Slope Intercept
Zero order 0.935 7.933 12.25
First order 0.993 -0.101 2.024
Higuchi 0.987 32.47 -12.41
Korsmeyer-Peppas 0.990 0.745(n) 1.233

Poly (ethylene sebacate) Nanoparticles of Anti-Tubercular Drugs
93 Particulate Carriers as Drug Delivery Systems for Anti-Tubercular and Anti-Cancer Agents
The plots of Log percent cumulative drug release vs. time were found to be linear
with higher correlation coefficient value (r2 = 0.993), and following the first order
model, and the mechanism of drug release from the nanoparticles is suggested as
diffusion controlled (Thakkar et al., 2009; Shivakumar et al., 2007; Shoaib et al.,
2006).
b) Folic acid
RIF PES FA nanoparticles (RPESFA/1) revealed slow release of folic acid upto 12h
in phosphate buffered saline pH 7.4 (Figure 5.9) with no initial burst release. Slower
release of folic acid observed at pH 1.2 and pH 4.5 is attributed to the low solubility
of folic acid at acidic pH. Relatively faster release were seen at pH 6.8, pH 7.4 and its
related to enhance solubility of folic acid. Folic acid release however was sustained
with 100% release occuring over 12h even in the alkaline medium. Tabe 5.13 shows
t50% and t90% values for release of folic acid at different pH.
Figure 5.9: Effect of pH on In-vitro release of folic acid from RPESFA/1 Nps
Table 5.13: t50% and t90% release of folic acid at different pH
Buffer Medium t50% t90%
pH 1.2 15.86h 48.27h
pH 4.5 10.27h 31.35h
pH 6.8 4.25h 10.96h
pH 7.4 4.68h 10.32h

Poly (ethylene sebacate) Nanoparticles of Anti-Tubercular Drugs
94 Particulate Carriers as Drug Delivery Systems for Anti-Tubercular and Anti-Cancer Agents
Table 5.14: Model fitting of folic acid from RPESFA/1 nanoparticles
Model r2 Slope Intercept
pH 1.2 pH 4.5 pH 1.2 pH 4.5 pH 1.2 pH 4.5
Zero order 0.933 0.940 0.683 0.689 6.466 9.008
First order 0.958 0.975 13.51 16.74 1.973 1.965
Higuchi 0.991 0.995 -0.018 -0.026 -3.84 -3.73 Korsmeyer-
Peppas 0.989 0.961 3.292 4.087 0.928 1.038
As showen in Table 5.14 the plots of percent cumulative folic acid release vs. SQRT
of time were found to be linear with higher correlation coefficient value (r2 = 0.991 at
pH 1.2 and 0.995 at pH 4.5), and following the Higuchi model, and the mechanism of
folic acid release from the nanoparticles is suggested as diffusion and erosion
controlled (Thakkar et al., 2009; Shivakumar et al., 2007; Shoaib et al., 2006).
ii) RIF-EMB PES FA nanoparticles
Figure 5.10: In-vitro release of RIF and EMB from REPES6FA/1 nanoparticles
RIF-EMB PES FA nanoparticles (REPES6FA/1) showed sustained release of RIF and
EMB upto 12h for both RIF and ETH which may be due to slow release of drug from
the nanoparticle matrix (figure 5.10). EMB however exhibited faster release in the
initial time period up to 4h (P<0.05) beyond which a release of both drugs were
comparable (P>0.05). RIF and EMB revealed t50% release at 3.49h and 2.93h
respectively whereas t90% release at 9.69h and 8.59h respectively. Ascorbic acid in the
medium served as a stabilizer (Muttil, et al., 2007).

Poly (ethylene sebacate) Nanoparticles of Anti-Tubercular Drugs
95 Particulate Carriers as Drug Delivery Systems for Anti-Tubercular and Anti-Cancer Agents
Kinetic model study
The results of curve fitting of in-vitro release of RIF and EMB from RIF-EMB PES
FA nanoparticles into different mathematical models are given in table 5.15.
Table 5.15: Model fitting of RIF and EMB from REPES6FA/1 nanoparticles
Model r2 Slope Intercept
RIF EMB RIF EMB RIF EMB
Zero order 0.934 0.874 7.818 7.839 14.47 19.53 First order 0.964 0.905 -0.114 -0.175 2.046 2.129
Higuchi 0.992 0.966 32.09 32.82 -10.01 -6.276 Korsmeyer-
Peppas 0.983 0.889 0.732 0.864 1.263 1.213
The plots of percent cumulative drug release vs. SQRT of time were found to be
linear with higher correlation coefficient value (r2 = 0.992 for RIF and 0.966 for
EMB), and following the Higuchi model, and the mechanism of drug release from the
nanoparticles is suggested as diffusion and erosion controlled (Thakkar et al., 2009;
Shivakumar et al., 2007; Shoaib et al., 2006).
5.4. STABILITY OF NANOPARTICLES
Freeze dried NPDDS were stable for 12 months at 30°C/60%RH and for 6 months at
40°C/75%RH (Table 5.16-5.21). All the NPDDS revealed good redispersibility, no
significant change in particle size (as indicated by Sf/Si ratio<1.3) and drug content
>90% suggest stability. No significant difference in drug release was observed as the
F2 >70 (Figure 5.11 and Table 5.16-5.17)
a

Poly (ethylene sebacate) Nanoparticles of Anti-Tubercular Drugs
96 Particulate Carriers as Drug Delivery Systems for Anti-Tubercular and Anti-Cancer Agents
Figure 5.11: In-vitro release stability results of RPESFA/1 nanoparticles
a) 300C/65% RH, b) 400C/75% RH
Table 5.16: Stability results of RPES/1 and RPESFA/1 at 300C/65%RH
Drug content Sf/Si ratio F2 value
RPES/1 RPESFA/1 RPES/1 RPESFA/1 RPESFA/1
Initial 97.17±2.31 97.48±1.55 1.276 1.257 -
1 month 96.93±0.33 97.20±1.82 1.228 1.260 97
3 month 97.58±1.05 97.92±1.61 1.236 1.267 99
6 month 95.83±1.23 96.03±2.31 1.254 1.271 82
12 month 96.21±1.87 95.82±2.01 1.249 1.253 78
Table 5.17: Stability results of RPES/1 and RPESFA/1 at 400C/75%RH
Drug content Sf/Si ratio F2 value
RPES/1 RPESFA/1 RPES/1 RPESFA/1 RPESFA/1
Initial 97.17±2.31 97.48±1.55 1.276 1.257 -
1 month 97.94±0.25 98.09±0.95 1.246 1.248 88
3 month 98.54±0.65 97.74±1.42 1.223 1.240 82
6 month 96.29±0.61 96.11±1.61 1.258 1.255 82
b

Poly (ethylene sebacate) Nanoparticles of Anti-Tubercular Drugs
97 Particulate Carriers as Drug Delivery Systems for Anti-Tubercular and Anti-Cancer Agents
Table 5.18: Stability results of REPES/6 and REPES6FA/1 at 300C/65%RH
Drug content Sf/Si ratio
REPES/6 REPES6FA/1 REPES/6 REPES6FA/1
RIF EMB RIF EMB
Initial 98.32±1.51 99.83±2.05 99.27±2.01 99.19±0.97 1.193 1.210
1 month 97.78±1.97 99.12±0.97 98.89±1.32 98.87±1.49 1.216 1.218
3 month 96.64±1.35 98.54±1.61 98.07±1.46 98.34±1.67 1.177 1.215
6 month 97.13±2.07 96.65±1.29 96.22±1.24 97.53±2.01 1.220 1.218
12 month 97.58±1.05 96.12±1.71 95.96±2.13 96.12±1.71 1.239 1.227
Table 5.19: Stability results of REPES/6 and REPES6FA/1 at 400C/75%RH
Drug content Sf/Si ratio
REPES/6 REPES6FA/1 REPES/6 REPES6FA/1
RIF EMB RIF EMB
Initial 98.32±1.51 99.83±2.05 99.27±2.01 99.19±0.97 1.193 1.210
1 month 97.34±1.43 99.43±1.17 98.14±1.25 98.35±1.24 1.184 1.186
3 month 97.02±1.68 98.17±1.46 98.26±1.12 98.01±1.92 1.201 1.196
6 month 95.64±1.03 96.78±2.09 97.32±1.24 95.83±1.01 1.210 1.221
Table 5.20: Stability results of RMPES/3 and RMPES3FA/1 at 300C/65%RH
Drug content Sf/Si ratio
RMPES/3 RMPES3FA/1 RMPES/3 RMPES3FA/1
RIF MSDNC22 RIF MSDNC22
Initial 97.87±2.05 101.8±2.39 98.67±2.31 99.87±1.97 1.228 1.1769
1 month 97.73±1.17 99.67±1.97 98.19±1.72 99.45±1.84 1.204 1.1580
3 month 97.27±1.49 99.11±1.83 97.83±1.39 98.89±1.92 1.218 1.1767
6 month 98.56±1.22 98.18±1.78 95.82±2.24 97.94±2.09 1.2398 1.1924
12 month 97.18±1.59 98.22±1.75 95.96±2.73 96.92±1.83 1.231 1.217

Poly (ethylene sebacate) Nanoparticles of Anti-Tubercular Drugs
98 Particulate Carriers as Drug Delivery Systems for Anti-Tubercular and Anti-Cancer Agents
Table 5.21: Stability results of RMPES/3 and RMPES3FA/1 at 400C/75%RH
Drug content Sf/Si ratio
RMPES/3 RMPES3FA/1 RMPES/3 RMPES3FA/1
RIF MSDNC22 RIF MSDNC22
Initial 97.87±2.05 101.8±2.39 98.67±2.31 99.87±1.97 1.228 1.176
1 month 97.14±1.56 99.44±1.67 97.23±1.59 99.41±1.49 1.214 1.172
3 month 96.45±1.79 99.02±1.91 96.63±1.66 98.34±1.67 1.243 1.187
6 month 95.43±2.22 96.23±1.89 95.19±1.47 97.49±2.01 1.234 1.200
5.5. MACROPHAGE UPTAKE STUDY IN U937 CELL LINE
Table 5.22: In vitro macrophage uptake of NPDDS
NPDDS
Supernatant Cell pellets
RIF (%)
EMB/ MSDNC-22
(%)
RIF (%)
EMB/ MSDNC-22
(%)
RIF Solution 90.68 ±1.94 - 7.3
±2.86 -
RIF-EMB solution (RIF to EMB ratio 1:10)
87.08 ±1.01
89.34 ±0.96
10.01 ±0.95
8.93 ±1.45
RIF-MSDNC-22 solution (RIF to MSDNC-22 ratio 1:10)
88.98±1.22
86.59 ±0.92
9.32 ±1.42
10.23 ±1.35
RIF PES Nps (RPES/1) 60.61±0.76 - 39.27
±0.36 -
RIF PES FA Nps (RPESFA/1) 39.24±0.53 - 59.57
±0.64 -
RIF-EMB PES Nps (REPES/6) (RIF to EMB ratio 1:10)
54.72±1.25
57.34 ±1.23
43.12 ±3.27
42.06 ±0.87
RIF-EMB PES FA Nps (REPES6FA/1) (RIF to EMB ratio 1:10)
35.87±1.48
36.34 ±0.93
62.94 ±1.53
62.71 ±1.10
RIF-MSDNC-22 PES Nps (RMPES/3) (RIF to MSDNC-22 ratio 1:10)
56.86±1.95
55.35 ±1.14
44.68 ±2.80
44.48 ±0.76
RIF-MSDNC-22 PES FA Nps (RMPES3FA/1) (RIF to MSDNC-22 ratio 1:10)
35.89±2.20
36.18 ±1.74
64.36 ±2.62
64.80 ±0.71

Poly (ethylene sebacate) Nanoparticles of Anti-Tubercular Drugs
99 Particulate Carriers as Drug Delivery Systems for Anti-Tubercular and Anti-Cancer Agents
Quantification of drug was done both in the supernatant and the cell pellet.
Quantitative uptake study was carried out by incubating nanoparticles equivalent to
10μg/ml of RIF as this was the maximum non-cytotoxic concentration. In-vitro
studies on RIF-EMB combinations revealed maximum efficacy against MTb at
RIF:EMB (1:10). Hence nanoparticles of the same ratio of the two drugs were
evaluated for macrophage uptake.
Uptake of drugs by macrophages was in the order drug solution< nanoparticles < folic
acid anchored nanoparticles for RIF, RFM-EMB and RIF-MSDNC-22 combination
(Table 5.22). The mass balance was >90% in all cases when total drug concentration
was evaluated in supernatant and in cell pellets. The plain drug revealed ≤10% uptake
irrespective of their hydrophobicity. PES nanoparticles of RIF, EMB and MSDNC-22
revealed ~43% uptake which further increase to ~60% with folate anchoring (figure
5.12). Macrophage are known to express folate receptor and our study confirmed the
role of folate receptor on enhance macrophage uptake. This enhancement in uptake is
reflected in table 5.22 and figure 5.12.
a) b)
c)
Figure 5.12: In vitro macrophage uptake of a) RPES/1 and RPESFA/1, b) REPES/6 and REPES6FA/1, c) RMPES/3 and RMPES3FA/1

Poly (ethylene sebacate) Nanoparticles of Anti-Tubercular Drugs
100 Particulate Carriers as Drug Delivery Systems for Anti-Tubercular and Anti-Cancer Agents
Despite contrasting solubilities of RIF (slightly water soluble) and EMB (highly water
soluble), the comparable uptake from RIF and EMB from the combination
nanoparticles suggests stability/integrity and rapid internalization of nanoparticles by
macrophages, as EMB being highly water soluble could have leached out of the
nanoparticles prior to uptake. As combination drug therapy is important for the
efficient treatment of tuberculosis due to rapid development of drug resistance with
single drugs, the comparable uptake of RIF and EMB from combination nanoparticles
suggests NPDDS of drug combinations as a promising approach for targeted delivery
to macrophage for the treatment of tuberculosis.
Premature release of folate from nanoparticles could result in decreased uptake of
folate anchored nanoparticles due to competitive inhibition (Reddy et al., 2002; Patil
et al., 2008; Gabizon et al., 1999; Aronov et al., 2003; Goren et al., 2000). Although
folic acid was anchored by simple physical adsorption folate mediated enhanced
macrophage uptake was observed suggesting physical adsorption as a simple strategy
for folate anchoring.
5.6. ORAL BIODISTRIBUTION STUDY BY GAMMA SCINTIGRAPHY
Figure 5.13: Organ distribution profile of RPES/1 and RPESFA/1 post 6h oral administration by gamma scintigraphy
The organ distribution of RIF nanoparticle is shown in figure 5.13. After 6h of RIF
PES nanoparticle with and without folic acid administration maximum radioactivity
was observed in stomach (50-60%) and intestine (20-30%) (Table 5.23). Significantly
higher concentrations of RIF were seen in the liver, the lungs and kidney following

Poly (ethylene sebacate) Nanoparticles of Anti-Tubercular Drugs
101 Particulate Carriers as Drug Delivery Systems for Anti-Tubercular and Anti-Cancer Agents
oral administration of nanoparticles compared to drug solution. Surprisingly the
concentration of RIF in the lung with the nanoparticles was significantly higher than
from the solution. While an approximately 13 fold increase in lung concentration was
seen with RIF PES Np’s, the folate anchored RIF PES Np’s revealed a 35 fold
increase.
Table 5.23: Organ distribution of RIF nanoparticles expressed as % injected dose
% Distribution
RIF Solution RPES/1 RPESFA/1 Heart 0.12 0.14 0.17 Liver 0.53 1.47 1.42 Lung 0.09 1.08 3.52 Left Kidney 0.10 0.16 0.21 Right Kidney 0.11 0.15 0.21 Spleen 0.25 0.25 0.14 Blood 0.22 0.23 0.25 Bone 0.15 0.26 0.13 Muscle 0.14 0.25 0.25 Stomach 55.87 51.10 64.02 Intestine 32.40 34.20 21.17 Body 7.13 5.00 5.57 TOTAL 97.47 94.29 97.06
Polymeric nanoparticles, because of their small size, are capable of being absorbed
intact from the gastrointestinal tract by transcellular pathways, or via active processes
mediated by membrane-bound carriers or membrane-derived vesicles (Devissaguet et
al., 1992, Jiao et al., 2002). Most evidences suggest that nanoparticle uptake occurs
preferentially via “M-Cells” in Peyer’s patches by the process of endocytosis
(lymphatic uptake). Nanoparticles below 1 μm are taken up by M cells and delivered
in the basal medium, while particles larger than 5 μm are taken up by M cells but
remain entrapped in Peyer's patches. Our nanoparticles are in the size range of 350-
450nm which enable absorption of nanoparticle by M-cells of Peyer’s patches and
avoid portal circulation. Subsequently particles enter mesenteric lymph nodes and are
drained in to the blood via junction of the left jugular and sub clavian vain through
thoracic duct to pass to the heart (Swartz et al., 2001). Bypass of portal circulation and

Poly (ethylene sebacate) Nanoparticles of Anti-Tubercular Drugs
102 Particulate Carriers as Drug Delivery Systems for Anti-Tubercular and Anti-Cancer Agents
direct transport to the lungs via heart by the lymph could have enabled enhanced lung
concentration with the nanoparticles.
Further the high blood concentration of RIF from the nanoparticle is suggestive of
longer circulation time and possible controlled release. Folic acid is a known ligand
for macrophage which express the folate receptor. This suggests the higher
concentration with folic acid anchored nanoparticles in the lungs due to alveolar
macrophage uptake.
5.7. PHARMACOKINETIC AND LUNG UPTAKE STUDY
The plasma concentration versus time profile of RIF solution, RIF PES Np’s and RIF
PES FA Np’s following oral administration is depicted in figure 5.14.
Figure 5.14: Pharmacokinetic profile of RIF PES nanoparticles
Rifampicin nanoparticles with and without ligand folic acid exhibited higher Cmax
and Tmax and sustained plasma drug concentration as compared to rifampicin
solution. The pharmacokinetic parameters are reported in table 5.24. A significant
increase in T1/2 was seen with the RIF PES Np’s compared to plain drug, however a
lower T1/2 was revealed in presence of folate suggesting more rapid clearance from
the plasma, due to probable enhanced uptake by the RES. High plasma concentrations
were observed even at 12 hours with the Np’s which were comparable to the Cmax of
the solution of RIF. Bioavailability increased upto 178% with RIF PES NPs and,
210% with RIF PES FA NPs compared with plain drug.

Poly (ethylene sebacate) Nanoparticles of Anti-Tubercular Drugs
103 Particulate Carriers as Drug Delivery Systems for Anti-Tubercular and Anti-Cancer Agents
Table 5.24: Pharmacokinetic parameters of RIF PES nanoparticles
Parameters RIF Solution RPES/1 RPESFA/1
Cmax (μg/ml) 6.53 ± 1.2 7.90 ± 0.78 8.17 ± 0.88 Tmax (h) 2 4 4
Slope - 4.34 -2.41 -2.81 Kel(h-1) 0.1001 0.0055 0.0064 T ½ (h) 6.92 ± 1.32 12.48 ± 0.59 10.67 ± 0.73
AUC0-24h (μg/ml*h) 55.51 ± 2.57 98.55 ± 2.89 115.17 ± 3.12Bioavailability enhancement Ref. 178% 210%
PES nanoparticles revealed significantly higher lung concentration compared to
rifampicin solution (figure 5.15). Folic acid anchoring further enhanced lung uptake
significantly (P<0.05). The reported MIC of RIF is 0.25µg/ml. The concentration of
RIF in the lungs following oral administration of Np’s is significantly greater than
then MIC (P<0.05), ~70 times higher with RIF PES Np’s and ~100 times higher with
folate anchoring.
Figure 5.15: Lung concentration of RPES/1 and RPESFA/1 nanoparticles at 24h
Similar results were obtained with RIF-EMB PES combination nanoparticles. RIF
bioavailability increased upto 132% and 146% with RIF-EMB PES NPs and RIF-
EMB PES FA NPs respectively compared to plain RIF. EMB bioavailability
increased upto 237% and 247% with RIF-EMB PES NPs and RIF-EMB PES FA NPs
respectively compared with plain EMB (table 5.25). The nanoparticles revealed
sustained release with significant increase in half life for both RIF and EMB. Folate
anchoring did not influence the PK behavior of the nanoparticles (figure 5.16). The
Cmax for RIF and EMB was higher and the Tmax delayed compared to RIF and EMB
solutions respectively.

Poly (ethylene sebacate) Nanoparticles of Anti-Tubercular Drugs
104 Particulate Carriers as Drug Delivery Systems for Anti-Tubercular and Anti-Cancer Agents
Figure 5.16: Pharmacokinetic profile of REPES/6 and REPES6FA/1 nanoparticles
Table 5.25: Pharmacokinetic parameters of RIF-EMB PES nanoparticles
Parameters RIF-EMB Solution REPES/6 REPES6FA/1
RIF EMB RIF EMB RIF EMB
Cmax
(μg/ml) 1.31 12.62 1.24 12.38 1.31 12.46
T max
(h) 2 1 4 4 4 4
Slope -4.36 -5.38 -3.53 -3.03 -3.65 -3.77
Kel(h-1) 0.10 0.124 0.0081 0.0085 0.0084 0.0086
T ½ (h) 6.89 5.58 8.5 8.13 8.24 7.96
AUC0-24h (μg/ml*h) 11.13 62.33 14.68 147.57 16.25 153.43
Bioavailability enhancement factor
Ref Ref 132% 237% 146% 246%
Figure 5.17: Lung concentration a) RIF and b) EMB from REPES/6 and
REPES6FA/1 nanoparticles at 24h

Poly (ethylene sebacate) Nanoparticles of Anti-Tubercular Drugs
105 Particulate Carriers as Drug Delivery Systems for Anti-Tubercular and Anti-Cancer Agents
Lung uptake study revealed significantly high lung concentration of RIF and EMB
from the nanoparticles compared to the respective solutions. Moreover the lung
concentration at the end of 24 hrs for both drugs from the nanoparticles translated to
concentrations many fold higher than the MIC for RIF and EMB (MIC of RIF-
0.25μg/ml, EMB-1.5μg/ml). Further folate anchoring resulted in enhanced lung
deposition (figure 5.17). Increased lung uptakes following oral administration of
nanoparticles can be explained as discussed earlier in section 5.6.
5.8. HIGHLIGHTS A promising and effective oral drug delivery system for pulmonary targeting
using a new biodegradable polymer PES, which will be useful not only for
treatment of tuberculosis but also other potential lung infections, has been
developed.
Nanoparticles with RIF:EMB in varying ratios could be readily prepared
despite contrasting solubilities of RIF and EMB.
A simple physical adsorption approach for anchoring ligand folic acid on
nanoparticles prepared using polymer PES has been developed thereby
precluding the need for covalent bonding.
High and comparable uptake of both RIF and EMB from combination
nanoparticles indicated integrity/stability of RIF-EMB combination
nanoparticles and rapid macrophage uptake, as EMB being highly water
soluble could have leached out of the nanoparticles prior to uptake
A significantly enhancement in bioavailability was observed following oral
administration of RIF PES and RIF-EMB PES nanoparticles
RIF PES and RIF-EMB PES nanoparticles exhibited lung concentrations
much higher than MIC of RIF and EMB at 24h.
Bypass of portal circulation and direct transport to the lungs via heart by the
lymph could have enabled enhanced lung concentration with the nanoparticles.
Macrophages are known to express folate receptor, hence higher lung
concentration with folate anchored nanoparticle suggests folate receptor
mediated uptake.