Part C, Atomic scale measurements: Local probes …wa14/camonly/FECM/PartC1.pdf · Part C, Atomic...
16
1 Frontiers of Experimental Frontiers of Experimental Condensed Matter Physics Condensed Matter Physics Part C, Atomic scale measurements: Part C, Atomic scale measurements: Scanned Probe Microscopies Scanned Probe Microscopies First Lecture First Lecture First Lecture First Lecture ¾ Principles of probe microscopes ¾Tunnelling microscopy ¾Force microscopy ¾ T lli i ¾ Tunnelling microscopy ¾Basic theory ¾Morphology and spectroscopy ¾Case study: Si(111) Second lecture Second lecture ¾ Force microscopy ¾Atomic forces ¾Contact and non-contact methods ¾Contact and non contact methods ¾ Atom manipulation ¾Moving atoms and molecules ¾Dissociating and reacting atoms and molecules 1 Principles Principles Local probes Local probes ¾ Spatial resolution comes from a confined probe, which is usually a sharp point. Generally able to move in x, y, z, directions P b ti x, y, z translator typically a piezo-electric Sample ¾ Classic example is the Tunnelling microscopy, STM h i ith l t t t i Probe tip Sample STM, where microscopy with electrons at atomic resolution is achieved by directing electrons through a single atom – the finest possible probe. ¾ There are many variants on the method, eg: ¾S i fi ld ti l i ¾Scanning near-field optical microscopy ¾Magnetic force microscopy ¾Scanning capacitance microscopy. ¾ We concentrate on two of the most common and i t t 2 important: ¾Scanning tunnelling microscopy (STM) ¾Atomic force microscopy (AFM)
Transcript of Part C, Atomic scale measurements: Local probes …wa14/camonly/FECM/PartC1.pdf · Part C, Atomic...

1
Frontiers of Experimental Frontiers of Experimental Condensed Matter PhysicsCondensed Matter Physics
Part C, Atomic scale measurements: Part C, Atomic scale measurements: Scanned Probe MicroscopiesScanned Probe MicroscopiesFirst LectureFirst LectureFirst LectureFirst Lecture
Principles of probe microscopesTunnelling microscopyForce microscopy
T lli iTunnelling microscopy Basic theory
Morphology and spectroscopyCase study: Si(111)
Second lectureSecond lectureForce microscopy
Atomic forcesContact and non-contact methodsContact and non contact methods
Atom manipulationMoving atoms and moleculesDissociating and reacting atoms and molecules
1
PrinciplesPrinciples
Local probesLocal probesSpatial resolution comes from a confined probe, which is usually a sharp point. Generally able to y p p ymove in x, y, z, directions
P b ti
x, y, z translatortypically a piezo-electric
Sample
Classic example is the Tunnelling microscopy, STM h i ith l t t t i
Probe tipSample
STM, where microscopy with electrons at atomic resolution is achieved by directing electrons through a single atom – the finest possible probe.There are many variants on the method, eg:
S i fi ld ti l iScanning near-field optical microscopyMagnetic force microscopyScanning capacitance microscopy.
We concentrate on two of the most common and i t t
2
important:Scanning tunnelling microscopy (STM)Atomic force microscopy (AFM)

2
Tunnelling microscopeTunnelling microscope
11--D barrier separating two metalsD barrier separating two metals
V( )
In general there is a voltage (bias) U between theeU
V(z)
In general there is a voltage (bias), U, between the metals, and the potential, V(z), includes the image potential.The simplest model is to replace set the bias to zero and make the barrier rectangular (one of thezero and make the barrier rectangular (one of the first problems encountered in Quantum Mechanics)
VV(z)
( ) ( )ikzAikzI −+= expexpψ
VoE
0 s
zI II III
( )ikzDIII exp=ψ
22 2 hmEk =
3
( ) ( )I ppψ ( )III pψ( ) ( )zCzBII χχψ expexp +−=
( ) 22 2 hEVm o −=χ
Matching ψ and dψ/dx at boundaries gives the transmitted current T=jIII/jI=|D|2.
( ) ( )( )skkT χχχ 222222 sinh411 ++=
In the limit of a strongly attenuating barrier
The behaviour is typical in that strong exponential dependence with a dependence on (Vo-E)1/2 arises
( )sT χ2exp −∝ A
independently of the exact shape of the barrier.Orders of magnitude: If s = 5Å, and the effective barrier height is 4eV, T ≈ 10-5. Increasing s by 1Å reduces T by an order of magnitude.
TimeTime--dependent approachdependent approachBefore looking at the 3-D problem, we consider an alternative approach to the simple 1-D problem. The aim is to exploit the small transmissionThe aim is to exploit the small transmission probability and seek a perturbation treatment.First solve the separate problems of the left barrier (in the absence of the right) and the right barrier in the absence of the left.
4See: Wiesendanger, Ch1.11

3
Transfer Hamiltonian methodTransfer Hamiltonian method
ψlHl Hr ψr
Eo
Solutions are:
and the current is given by Fermi’s Golden Rule
( )( ) 0;exp
0;exp≤=≥−=
zzbzza
r
l
χψχψ
The result is identical to eq A p 4 Note it is
rlTrt E
NHejdd2 2ψψπ
h=
Density of final statesH - Eo
The result is identical to eq. A, p. 4. Note, it is straightforward to add a sample bias (see below) as we only need the solution in the vacuum region.
Tunnelling in 3Tunnelling in 3--D. D. (Bardeen, Phys. Rev. Lett. 6 (1961) 57)
Generalising the above method( ) ( )[ ]{
( ) ( )[ ]} ( )μνμνμν
νμνμ
δ
π
EEMEfeUEf
eUEfEfeI
−−+−
+−= ∑2
,
1
12h
5
f(E) is the Fermi function and tunnelling both ways is included.
Bardeen argued that the tunneling matrix element is given by
( )∫ ∇−∇−
= **2
.2 μννμμν ψψψψdS
mM h
where the integral is over any surface lying entirely in the vacuum region. To calculate the expression in parentheses (current density) we need a model of the tip.
2 m
Tersoff and Hamann (Phys. Rev. B31, (1985) 805) were first to apply the method to STM. They modelled the tip as a sphere (s-wave only, higher l-values are neglected).At low temperature and low bias,
Using the s-wave approximation, they obtained( ) ( )FF EEEEMUeI −−= ∑ μ
νμνμν δδπ
,
222
h
( ) ( ) ( ) ( )∑ −∝ νν δψχ FoFt EEREnUI 2.2exp.. r B
Tip radius
L l d it f t t (LDOS) f th l
Tip dos at EF
ro, centreof the tip
∑ν
φ, effectivebarrier height
( ) h212 φχ m=
B
6
Local density of states (LDOS) of the sample states at the Fermi energy, calculated at the position of the tip centre.

4
zz--dependence of the tunnellingdependence of the tunnelling
In the vacuum, the sample wavefunction decays exponentially
z( )zχψ ν −∝ exp
Hence, the amplitudeat the centre of the tip is
and the current is
R
s
z
( )( )Rs +−∝ χψ ν 2exp2
a d e cu e s
The simple theory gives us two key results:The current decreases exponentially with z.The tunnelling current depends on the sample
( ).2exp sI χ−∝
The tunnelling current depends on the sample, LDOS measured at the tip site.
The two results are the origin of, respectively,Atomic resolution. (Recall, the decay rate with zmeans that a 1% change in current corresponds tomeans that a 1% change in current corresponds to a z-displacement of ~0.02Å).Spectroscopy (STS). The ability to map electronic states.
Both ideas need further exploration…..
7
p
Lateral resolutionLateral resolution
What about the lateral resolution?A corrugation decays rapidly into the vacuum region. Tersoff and Hamman show that, for a lateral variation of period, a, the corrugation Δ is
, where G =2πn/a. Only the lowest Fourier components will be seen.Example: Au(111) has 23 surface atoms for 22 b lk l di i fi d l
( )χ4exp 2 zG−∝Δ
bulk atoms, leading to a misfit and a long range corrugation (approximately as sketched). The long range periodicity is much easier to observe than the atom corrugation.
300Å 20Å
corrugation ~0.2Å,independent oftunnelling conditions
8
gatomic corrugation is much smaller and only observable under favourable conditions

5
Tip statesTip states
On the basis of s-wave, tip states, one would not expect to see atomic corrugation on close-packed metal surfaces.It follows that lateral resolution depends on the dominant tip orbitals. The sketch shows s, p and dorbitals embedded in a corrugated charge. Clearly the lateral averaging is more for the s-state and least fro the d stateleast fro the dz2-state.
+-
++- -
s p d z2
(See Chen, Phys Rev B42 (1990) 8841, for a quantitative treatment).The fact that the resolution depends on the electronic state at the tip may explain why tips with d-states are the most common in practice (typicald states are the most common in practice (typical materials are Tungsten or Pt/Ir alloy).Modern simulations rely on ab-initio calculations of the sample states and a quantitative treatment of the tunnelling.
9
g
Constant current imagesConstant current images
Imaging at constant current:Imaging at constant current:The usual mode of operation is for the tip height to be adjusted to maintain the current constant. The jmeasured current is fed-back to the z-piezo control and (if the piezo actuator is linear) the voltage driving the piezo is proportional to the height of the tip.
V z~
R
V I R= t
Iset
V zout
In constant current mode, at small bias voltage, the height z is a contour of constant density of
U
the height, z, is a contour of constant density of states, at EF. Thus, there are two main components to the image:
sample morphology.sample density of states
10
sample density of states.It can be difficult to separate the two components, in the image without careful consideration.

6
SpectroscopySpectroscopy
Scanning tunnelling spectroscopyScanning tunnelling spectroscopyWe need to generalise the basic, low bias formula for the tunnelling current Eq. , on p 6.Bg q pAt a bias of U, we need to integrate over E
EeU
n eU Et( - ) n Es( )
(energies of tip and sample measured wrt their ti E ) Th t t l t i
TipSample
respective EF). The total current is
( ) ( ) ( )dEeUETEnEeUnIeU
st ,0∫ −∝
Transmission coeff.Tip dos Sample dos
The formula suggests that the tip and sample states contribute equally to the current. In fact it is the variation of the empty state density that is
11
p y ymost important, see below…
In general, the largest contribution to the current is determined by the transmission coefficient. States with the highest energy see the smallest effective b i d i th hi h t t i ibarrier and give the highest transmission.
Tip Sample
T
Tip Sample
T
Thus, in the left figure (Tip biased negatively) the current is predominantly due to electrons at EF ofcurrent is predominantly due to electrons at EF of the tip. The strongest changes in current are due to changes in the sample dos. Similarly, in the right figure (Tip biased positively) the current is predominantly due to electrons at EFthe current is predominantly due to electrons at EFof the sample, and the strongest changes in current are due to changes in the tip dos.
12

7
Case study Si(111)Case study Si(111)
Si(111) Si(111) ––(7x7)(7x7)Atoms at the silicon (111) surface re-arrange to form a 7x7 surface unit cell. For many years its y yremained an unsolved structural problem. Early STM measurements helped to elucidate the structure and marked the breakthrough of the STM methodSilicon atoms bond tetrahedrally and when cut to expose the 111 surface each atom has a single bond directed out of the surface. When that bond is saturated (for example by adsorbing hydrogen), th f t t h th i di itthe surface structure has the same periodicity as the bulk: denoted Si(111)-(1x1)H
Si
When the hydrogen is absent the bonds are
H
13
When the hydrogen is absent the bonds are unsaturated and the surface reconstructs to lower its energy
Ref: Wiesendanger pp. 293
(7x7) reconstruction(7x7) reconstruction
The number of dangling bonds is reduced (from 49 to 19) by providing ad-atoms
Plan
AdatomAd-atom
Note there is some lattice distortion necessary to accommodate the ad-atoms. There are also other
Side
aspects of the reconstruction that relieves the lattice strain (a stacking fault and dimer formation in lower layers).Hence the name: Ad-atom
Dimer, Ad-atom,Stacking fault(DAS) model.A plan view of one
14
unit cell is shown,right. dimer
rest-atom

8
Si(111)Si(111)-- ImagesImages
Constant current images (tunnelling into empty sample states) show the positions of the ad-atoms clearly (left image is a single unit cell).
S t d t h f i d t t
Ad-atom
Corner hole
Spectroscopy: data shown for occupied states (negative sample bias).
ce,
/IUAd-atom siteImage of thestate at -0.35V
Con
duct
anc
Rest-atom site
15Ref: Hamers et al: Phys Rev Lett 56 (1986) 1972Ann Rev Phys Chem 40 (1989) 531
Energy/eV-2 -1 0 Image of the
state at -0.8V
Notes:Notes:Images are remarkable for their clarity and the ease with which features can be attributed to specific atoms (Si(111) is almost unique in this regard).Empty state images (top half of previous page) are dominated by the ad-atomsConductance curves taken at different lateral positions show maxima that can be attributed to localised, surface states.Filled state images of these states (bottom half of g (previous page) show ad-atoms at low bias voltages and the rest-atoms at higher bias voltages.The ability to image electronic states is a unique attribute of the STM method.Note the asymmetry in the occupied-state image at -0.35V, which is due to the stacking fault. It follows that the underlying layers play some role in
16
the tunnelling.

9
Force MicroscopyForce Microscopy
Tunnelling microscopy can only be used on metallic samples. Force microscopy is applicable to conducting and non-conducting samples. It
fi b d th fuses a fine probe and measures the force between sample and probe.
Historical note:Historical note:Some of the methods derive from pioneering gexperiments done at the Cavendish by Tabor and others (especially Israelichvilli); see museum.Their interest was in determining surfaces forces
Crossed mica c lindersCoarse approach
Stiff, mono-
Crossed mica cylinders
Stiff, monolithic hinge
Fine approachSoft spring
17
Fine approach
SFM/AFMSFM/AFM
Scanning Force Microscopy (SFM):Scanning Force Microscopy (SFM):also called Atomic Force Microscopy (AFM)The method derives its spatial resolution from aThe method derives its spatial resolution from a sharp probe mounted ona sprung cantilever.These are usually micro-fabricated with integratedtips.
Cantilever deflection is oftendetermined by reflection of a laser beam. A 4-quadrant detector allows measurement of both
SiO2 cantilever/tip40μm
quadrant detector allows measurement of both vertical and torsional motion of the cantilever
4-quadrant detector creates an up/downimbalance
18
creates a left/rightimbalance

10
Imaging in contact modeImaging in contact mode
The instrument can be used in either contact mode, where the tip is in permanent contact with the sample, or in non-contact mode.
Contact modeContact modeConstant force imaging: the cantilever is manipulated by piezo drives to maintain a constant cantilever deflection. The forces are repulsive and, under favourable conditions, atomic resolution is possible.Example: LiF(100), the protrusions seen are ascribed to the larger F¯ ion.
F-
Li+
19Meyer et al. J. Vac. Sci. Technol. B9 (1991)1329
The ionic radius of Li+ (0.68Å) is much less than F¯ (1.33Å) and is invisible. The corrugation was originally interpreted in terms of a rigid, hard-
h d lsphere model. z [001]
F-
Li+
[011]
The forces used to generate images are typically
z [011]F Li
[001]
The forces used to generate images are typically 10-8-10-7N. With a single atom tip, such forces will cause deformations in the sample (and/or tip).Some early images (~1990) showed atomic resolution with giant corrugations These are nowresolution with giant corrugations. These are now believed to be artifacts. A full explanation of the images remains to be achieved.Accurate modelling of the images requires the mechanical properties of the tip and sample to be
20
mechanical properties of the tip and sample to be included. Such simulations are now possible (see later)
11
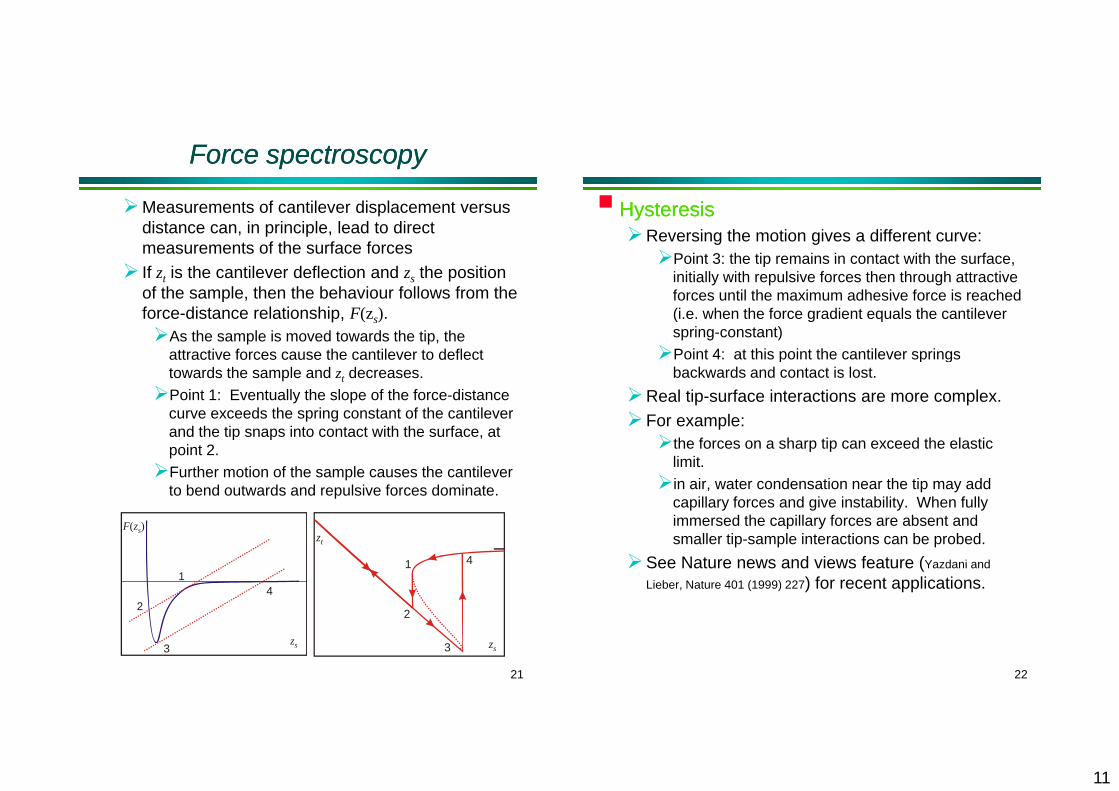
Force spectroscopyForce spectroscopy
Measurements of cantilever displacement versus distance can, in principle, lead to direct measurements of the surface forcesIf zt is the cantilever deflection and zs the position of the sample, then the behaviour follows from the force-distance relationship, F(zs).
As the sample is moved towards the tip, the attracti e forces ca se the cantile er to deflectattractive forces cause the cantilever to deflect towards the sample and zt decreases.Point 1: Eventually the slope of the force-distance curve exceeds the spring constant of the cantilever and the tip snaps into contact with the surface, at p ppoint 2.Further motion of the sample causes the cantilever to bend outwards and repulsive forces dominate.
F z( )
14
2
F z( )s
1 4
2
zt
21
3zs 3
2
zs
HysteresisHysteresisReversing the motion gives a different curve:
Point 3: the tip remains in contact with the surface, p ,initially with repulsive forces then through attractive forces until the maximum adhesive force is reached (i.e. when the force gradient equals the cantilever spring-constant)Point 4: at this point the cantilever springsPoint 4: at this point the cantilever springs backwards and contact is lost.
Real tip-surface interactions are more complex.For example:
th f h ti d th l tithe forces on a sharp tip can exceed the elastic limit.in air, water condensation near the tip may add capillary forces and give instability. When fully immersed the capillary forces are absent and p ysmaller tip-sample interactions can be probed.
See Nature news and views feature (Yazdani and
Lieber, Nature 401 (1999) 227) for recent applications.
22

12
Forces in Chemistry and Forces in Chemistry and BiologyBiology
ExamplesExamplesAdhesion forces in Chemistry:
take a tip modified with a functional monolayer p yhaving a known termination (Y) and the sample with a different termination (X).Force spectroscopy allows a direct measurement of the X-Y adhesion.
Tip
XXXXXYYYY
Mechanical properties of single bio-molecules:
Sample
400
200
Forc
e/pN
transition tosingle-strand
DNA
Attaching one end of the molecule to the tip and the other to the sample, allows
t f th
230 2 4
Extension/ mμ
0
F
B-S transition
measurement of the mechanical properties of single molecules eg. DNA (Biophys. J. 78 (2000 )1997)
NonNon--contact AFMcontact AFM
In the contact-mode, experiments are predominantly sensitive to repulsive forces and they are sensed by quasi-static deflection of the
tilcantilever.In the non-contact mode, the tip-surface separation is greater and the forces smaller. The cantilever deflection is too small to measure staticallystatically.Instead, it is set to vibrate at its resonant frequency, ωo, and changes in ωo are used to create the image. The main effect is to change the spring constant due to the local force gradientthe spring constant due to the local force-gradient,
.An attractive force, F’ > 0, softens the spring constant 'Fcceff −=
21'2121⎞⎛⎞⎛⎞⎛ F
zFF z ∂∂='
The change in frequency is a direct measure of the force-gradient
21
1 ⎟⎠
⎞⎜⎝
⎛−⎟
⎠⎞
⎜⎝⎛=⎟
⎠
⎞⎜⎝
⎛=
cF
mc
mceffω
F 2'Δ
24
the frequency decreases for an attractive interactioncFo 2−≈−=Δ ωωω

13
Since frequency shifts can be determined very accurately, the non-contact mode offers superior sensitivity in most cases.Maps of frequency shift can be obtained at the same time as the usual topographic images, giving two complementary views of the sample.Typical operating conditions are:
oscillation amplitude 1-5 nm.oscillation frequency ~10kHzoscillation Q-value:
In vacuo Q ~ 104
in air Q~ 100in liquid Q ~ 1
Example: Example: Single-molecule recognition.The use of a functionalised tip to identify specificThe use of a functionalised tip to identify specific bio-molecules. (Stroh et al. PNAS 101 (2004) 12503)
Non-contact, AFM is widely used to study biological systems; however, topographic images lack clear contrast. DNA can be identified by its
25
lack clear contrast. DNA can be identified by its thread-like appearance but different protein components look similar.
By tethering an antibody to the tip, a specific contrast mechanism occurs.When there is no antigen, the tip operates normally (fig. a); However, when the tip approaches an antigen, the antibody binds to a specific site and the cantilever motion is disturbed (fig. b).
Specifically, the oscillation amplitude dips slightly, by an amount ΔA, before being re-established as the instrument continues to scan. Thus, a map of ΔA, as the tip scans, identifies the location of antigen sites.Typical variation of ΔA/Aduring a scan are shown inthe figure (right) and amount
26
to changes of ~2%. Cleardips in ΔA are visible.

14
A conventional topographic image taken alongside a ΔA map gives the following:
Topographicg
Topographicimage Recognition
image
Topographic image (left): nucleosomal arrays are the light patches, with a “height” of ~5nm.The recognition image (right) shows darker patches that correspond to specific antibodypatches that correspond to specific antibody-antigen recognition events.Specificity is demonstrated by a mixture of proteins (below). Green dots (right), showing recognition do not occur for proteins without therecognition, do not occur for proteins without the antigen (shown by yellow arrows in the left image)
gTopographic
image Recognition
27
Recognitionimage
Atom ManipulationAtom Manipulation
NanotechnologyNanotechnologyScanned probe methods (STM, AFM) have been used to manipulate samples as well as observe p pthem.A key breakthrough was the controlled manipulation of single atoms (see Stroscio and Eigler,
Science 254 (1991) 1319, and references therein.). Several processes have been identified:
Soft manipulation Soft manipulation Lateral motion of Xe atoms..Through a combination of tip motion and changes in tunnelling current:in tunnelling current:
Tip
Position tip (~1 nA, 10mV) and move towards atom by increasing current (~16nA).
Move tip laterally to pre-
Sample
determined destination.Retract tip by reducing
current to original value.
28

15
MoleculesMolecules
Similar behaviour reported for some molecules, where surface features, such as steps, affect the motion.eg: for CO on stepped
copper (Cu(211)),manipulation is easy parallelto steps but difficult in theperpendicular direction.perpendicular direction.
The number “2000” writtenin CO molecules(See Hla, Meyer Rieder CHEMPHYSCHEM 2001, 2, 361) 16.3 nm
Note regarding the image: The CO adsorbates are seen as a protrusion when the tip has a CO molecule attached. Without a “CO-functionalised” tip the adsorbates appear as depressions.
Ti
Sample
Tip
Sample
Tip
29
Vertical manipulationVertical manipulation
The last images raise the question of how to get CO molecules onto the tip. This is the topic of vertical manipulation.The processes are complex and not well understood. The procedure is to place the tip above the atom/molecule and apply a current pulse (i.e. change the bias voltage)
I t( )( )
t
Tip
In the case sketched, Xet tl
V ttip( )
t
Sample
atoms move, apparently,by electromigration. i.e.the flux of electron drives the transition.Note, the I(t) curve shows that the conductance of the junction has changed. The change is, therefore,
30
the junction has changed. The change is, therefore, indicative of the transition having taken place.

16
Dissociation and assemblyDissociation and assembly
AtomicAtomic--scale reactionsscale reactionsA further manipulation process is dissociation (See: Chem Phys Lett 370 (2003) 431). In disscoiation of ( )Iodobenzene C6H5I by the tunnelling current, the tip bias is changed continuously. The signature of dissociation is seen as a sudden change in current (left figure). “Before” and “after”i h i himages are shown right.
Complete reactions have beenperformed: Dissociation of 2 iodobenzenes and assembly of a biphenyl molecule (C12H10)
Dissociation
31Reaction
Ref: PRL 85 (2000) 2777