Part A: General Information - SADPMR Report 2014.pdf · PART A GENERAL INFORMATION....
82
Transcript of Part A: General Information - SADPMR Report 2014.pdf · PART A GENERAL INFORMATION....

CO
NTE
NTS
Part A: General Information 2
List of Abbreviations/Acronyms 3
Strategic Overview 4
Organisational Structure 5
Statement by the Chairperson 6
Chief Executive Officer’s Overview 8
Part B: Performance Information 10
Statement of Responsibility for the Performance Information 11
Auditor-General’s Report: Predetermined Objectives 12
Performance Information for the 2013/ 2014 Financial Year 13
Programme Performance 16
Overview of the SADPMR Performance Information 16
Programme 1: Diamond Trade 17
Programme 2: Regulatory Compliance 26
Programme 3: Administration 31
Part C: Human Resources Management 34
Part D: Corporate Governance 39
Part E: Financial Information 47

2 SADPMRANNUALREPORT2013/2014
PART AGENERAL INFORMATION
3SADPMRANNUALREPORT2013/2014
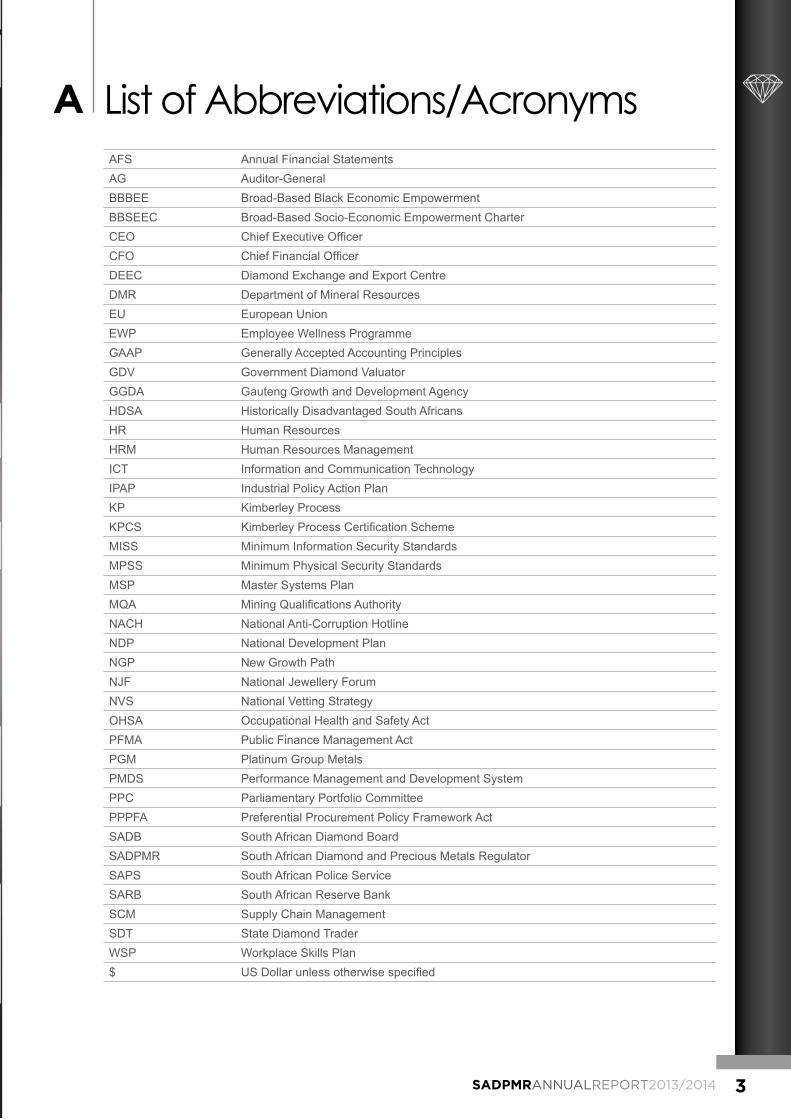
List of Abbreviations/AcronymsAAFS Annual Financial StatementsAG Auditor-General BBBEE Broad-Based Black Economic EmpowermentBBSEEC Broad-Based Socio-Economic Empowerment CharterCEO Chief Executive OfficerCFO Chief Financial OfficerDEEC Diamond Exchange and Export CentreDMR Department of Mineral ResourcesEU European UnionEWP Employee Wellness Programme GAAP Generally Accepted Accounting PrinciplesGDV Government Diamond ValuatorGGDA Gauteng Growth and Development Agency HDSA Historically Disadvantaged South Africans HR Human Resources HRM Human Resources Management ICT Information and Communication TechnologyIPAP Industrial Policy Action Plan KP Kimberley Process KPCS Kimberley Process Certification SchemeMISS Minimum Information Security StandardsMPSS Minimum Physical Security StandardsMSP Master Systems PlanMQA Mining Qualifications AuthorityNACH National Anti-Corruption Hotline NDP National Development Plan NGP New Growth Path NJF National Jewellery ForumNVS National Vetting StrategyOHSA Occupational Health and Safety ActPFMA Public Finance Management ActPGM Platinum Group MetalsPMDS Performance Management and Development SystemPPC Parliamentary Portfolio CommitteePPPFA Preferential Procurement Policy Framework ActSADB South African Diamond Board SADPMR South African Diamond and Precious Metals RegulatorSAPS South African Police ServiceSARB South African Reserve Bank SCM Supply Chain ManagementSDT State Diamond TraderWSP Workplace Skills Plan$ US Dollar unless otherwise specified

4 SADPMRANNUALREPORT2013/2014
Strategic OverviewAThe South African Diamond and Precious Metals Regulator subscribes to the following vision, mission, values and strategic outcomes:
Vision
Regulating for business excellence, transformation and economic empowerment.
Mission
We render regulatory services by ensuring:
• Compliance with legislation• Skills transfer• Business development support• Equitable access to resources • Local beneficiation
Values
• Integrity • Respect • Time management • Accuracy• Consistency
Strategic outcome-orientated goals
• To ensure competitiveness, sustainable development and job creation in the diamond and precious metals industry.
• To ensure effective transformation of the diamond and precious metals sectors.
• To ensure equitable access to resources for local beneficiation.
• To ensure compliance with legislative requirements.
• To improve organisational capacity for maximum execution for excellence.
Legislative mandates
The South African Diamond and Precious Metals Regulator (SADPMR) is a Schedule 3A Public Entity in terms of the Public Finance Management Act, 1999 (Act No. 1 of 1999). It was established in terms of Section 3 of the Diamond Act, 1986 (Act No. 56 of 1986), as amended.
The SADPMR’s mandate is to implement and enforce the provisions of the Diamond Act, 1986 (Act No. 56 of 1986), as amended, the Diamond Export Levy (Administration) Act, 2007 (Act No. 14 of 2007), the Diamond Export Levy Act, 2007 (Act No. 15 of 2007) and the Precious Metals Act, 2005 (Act No. 37 of 2005). These pieces of legislation are implemented in conjunction with other national legislation that is directly and indirectly affecting the role and mandate of the Organisation.

5SADPMRANNUALREPORT2013/2014
Organisational StructureA
BOARD
CHIEF EXECUTIVE OFFICER
COMPANY SECRETARY
INTERNAL AUDIT
PROGRAMME 1DIAMOND TRADE
PROGRAMME 2REGULATORY COMPLIANCE
PROGRAMME 3ADMINISTRATION
DIAMOND EXPORT AND EXCHANGE
GOVERNMENT DIAMOND VALUATION
KIMBERLEY PROCESS CERTIFICATION SCHEME
DIAMOND INSPECTORATE
PRECIOUS METALS AND BENEFICIATION
LICENSING
OFFICE OF THE CHIEF FINANCIAL OFFICER
HUMAN RESOURCES MANAGEMENT
INFORMATION COMMUNICATION
TECHNOLOGY
SECURITY RISK MANAGEMENT
COMMUNICATIONS
LEGAL SERVICES
6 SADPMRANNUALREPORT2013/2014
“”
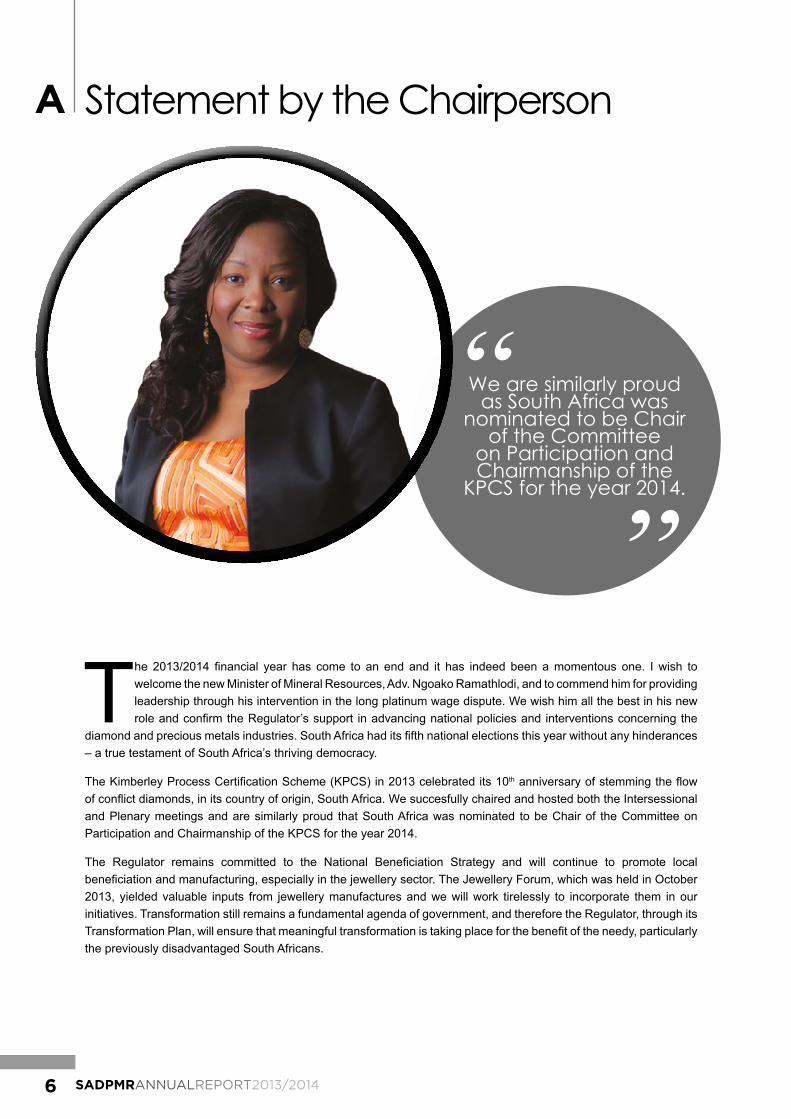
The 2013/2014 financial year has come to an end and it has indeed been a momentous one. I wish to welcome the new Minister of Mineral Resources, Adv. Ngoako Ramathlodi, and to commend him for providing leadership through his intervention in the long platinum wage dispute. We wish him all the best in his new role and confirm the Regulator’s support in advancing national policies and interventions concerning the
diamond and precious metals industries. South Africa had its fifth national elections this year without any hinderances – a true testament of South Africa’s thriving democracy.
The Kimberley Process Certification Scheme (KPCS) in 2013 celebrated its 10th anniversary of stemming the flow of conflict diamonds, in its country of origin, South Africa. We succesfully chaired and hosted both the Intersessional and Plenary meetings and are similarly proud that South Africa was nominated to be Chair of the Committee on Participation and Chairmanship of the KPCS for the year 2014.
The Regulator remains committed to the National Beneficiation Strategy and will continue to promote local beneficiation and manufacturing, especially in the jewellery sector. The Jewellery Forum, which was held in October 2013, yielded valuable inputs from jewellery manufactures and we will work tirelessly to incorporate them in our initiatives. Transformation still remains a fundamental agenda of government, and therefore the Regulator, through its Transformation Plan, will ensure that meaningful transformation is taking place for the benefit of the needy, particularly the previously disadvantaged South Africans.
A Statement by the Chairperson
We are similarly proud as South Africa was
nominated to be Chair of the Committee
on Participation and Chairmanship of the
KPCS for the year 2014.
Special thanks to my fellow Board members for their unwavering support and to the management of the Regulator for assisting the Board with the implementation of the strategic objectives and goals of the Regulator. I am excited with the planned initiatives of the upcoming financial year, especially the beginning of the process of establishing a state-of-the-art Bourse in South Africa.
Ms N MkhumaneChairperson
7
“The Regulator remains committed to the National Beneficiation Strategy and will continue to
promote local beneficiation and manufacturing, especially in the jewellery sector.”

8 SADPMRANNUALREPORT2013/2014
“”
It is a great pleasure to present this overview for the financial year 2013/2014. The South African Diamond and Precious Metals Regulator became very active in supporting the Chair of the Kimberley Process Certification Scheme for the year 2012. The KP family or participant member countries, took a decision in 2011 at the Kinshasa Plenary, that South Africa must Chair the KP for the second time in 2013, since its inception in 2003. This decision was taken to allow for the commemoration of the success of the KP on the country of its birth. Two important KP
meetings were held at Kimberley in June 2013 and at Johannesburg in November 2013, respectively.
The Regulator, as the official appointed focal point for the implementation of the KP, led a number of Review Visits to various countries in support of the country’s chairship of the KP in 2013.
The decline in the manufacturing industry of our commodities is a great concern to the organisation and to this we have researched how the diamond trade and generally the jewellery manufacturing sector is conducted elsewhere in the global sphere. This lead to the Board mandating the CEO to further research the possibility of establishing a Bourse that will specifically focus on promoting and enhancing the trade of jewellery manufacturing commodities. This approach will revive the declining of our beneficiation sector.
A Chief Executive Officer’s Overview
The decline in the manufacturing industry of our
commodities is a great concern

With almost seven years of existence of the Regulator since its inception in 2007, the key priority of government on transformation still leaves a lot to be desired. Nonetheless I am happy and cherish the Board’s decision to allow me to create a dedicated team that will assist the promotion of transformation by conducting verification inspection on licence holders and advise the Board accordingly, through the Licencing Committee.
I would further like to thank the co-operation of those members of the industry, who on a regulator basis dialogued with me and presented their challenges that sought our assistance. My special thanks is to the Chairperson and the entire Board for the support and leadership that they provided to the Regulator.
Lastly, I have been humbled and excited by the Honourable Minister Ngoako Ramatlhodi’s Budget Vote speech, which confirmed the mandate of exploring the establishment of a dedicated Bourse, which will be the first of its kind on the African continent.
Mr GL RapooChief Executive Officer
9
“...confirmed the mandate of exploring the establishment of a dedicated Bourse,
which will be the first of its kind on the African continent.”

10 SADPMRANNUALREPORT2013/2014
PART BPERFORMANCE INFORMATION
11SADPMRANNUALREPORT2013/2014
Statement of Responsibility BSTATEMENT OF RESPONSIBILITY FOR THE PERFORMANCE INFORMATION FOR THE YEAR ENDED 31 MARCH 2014
The Chief Executive Officer (CEO) is responsible for the preparation of the Public Entity’s performance information and for the judgements made in this information.
The CEO is responsible for establishing and implementing a system of internal control, designed to provide reasona-ble assurance as to the integrity and reliability of performance information.
In my opinion, the performance information fairly reflects the operations of the Public Entity for the financial year ended 31 March 2014.
Mr GL Rapoo Ms N MkhumaneChief Executive Officer Chairperson
12 SADPMRANNUALREPORT2013/2014
B Auditor-General’s ReportPredetermined Objectives
The Auditor-General of South Africa (AGSA) currently performs the necessary audit procedures on the performance information to provide reasonable assurance in the form of an audit conclusion. The audit conclusion on performance against predetermined objectives is included in the report to Management, under the Predetermined Objectives head-ing in the Report on other legal and regulatory requirements section of the Auditor’s Report.
Refer to page 51 of the Auditor’s Report, published as Part E: Financial Information.

13SADPMRANNUALREPORT2013/2014
Performance Information BPR
OG
RA
MM
E 1:
DIA
MO
ND
TR
AD
E
SUB
-PR
OG
RA
MM
ES: D
iam
ond
Exc
hang
e an
d E
xpor
t Cen
tre (D
EE
C),
Gov
ernm
ent D
iam
ond
Valu
ator
(GD
V) a
nd K
imbe
rley
Pro
cess
Cer
tifica
tion
Sch
eme
(KP
CS
)
STR
ATEG
IC O
BJE
CTI
VEK
EY A
CTI
VITI
ESM
EASU
RES
BA
SELI
NE
AN
NU
AL
TA
RG
ETA
CTU
AL
PE
RFO
RM
AN
CE
REA
SON
S FO
R V
AR
IAN
CE
Ensu
re co
mpeti
tiven
ess,
susta
inable
deve
lopme
nt an
d job
crea
tion i
n the
dia
mond
and p
reciou
s me
tals i
ndus
tries
Facil
itate
skills
de
velop
ment
initia
tives
for
the i
ndus
tries
Numb
er of
skills
ini
tiativ
es fa
cilita
ted fo
r the
indu
stries
22
Achie
ved,
three
(3) s
kills
initia
tives
facil
itated
Due t
o the
incre
ase i
n the
numb
er of
licen
ses,
more
peop
le sh
owed
int
eres
t in th
e tra
ining
inter
venti
on.
Ensu
re eq
uitab
le ac
cess
to
reso
urce
s for
loca
l be
nefic
iation
Over
see t
he
Imple
menta
tion o
f the
diamo
nd m
arke
ting
strate
gy of
the D
EEC
Numb
er of
clien
ts ac
cess
ing th
e DEE
C1 2
001 2
50Ac
hieve
d, 3 5
46 cl
ients
acce
ssed
the D
EEC
New
diamo
nd pr
oduc
ers b
roug
ht the
ir goo
ds to
DEE
C (R
ooipo
ort a
nd
Jage
rsfon
tein)
and m
ore c
lients
acce
ssed
the D
EEC.
Over
see t
he
Imple
menta
tion o
f the
diamo
nd m
arke
ting
strate
gy of
the D
EEC
Numb
er of
polis
hed
diamo
nd te
nder
s fac
ilitate
d
4 poli
shed
dia
mond
ten
ders
facilit
ated
3 poli
shed
dia
mond
ten
ders
facilit
ated
Achie
ved,
five (
5) po
lishe
d dia
mond
tend
ers f
acilit
ated
Post
the la
unch
of po
lishe
d diam
ond t
ende
rs, m
ore p
eople
show
ed
inter
est in
the b
uying
and s
elling
of po
lishe
d diam
onds
fasc
ilitate
d by t
he
DEEC
.
Incre
ase a
cces
s for
loc
al be
nefic
iator
sNu
mber
of v
isits
by
bene
ficiat
ors i
nto th
e DE
EC
179
50Ac
hieve
d, 28
7 visi
ts by
dia
mond
bene
ficiat
ors i
nto
DEEC
New
prod
ucer
s bro
ught
their d
iamon
ds to
the D
EEC
for fa
cilita
tion.
As a
resu
lt, mo
re ac
cess
ed th
e DEE
C.
Ensu
re co
mplia
nce w
ith
legisl
ative
requ
ireme
ntsOv
erse
e the
prov
ision
of
Diam
ond v
aluati
on
servi
ces
% of
valua
tions
co
nduc
ted at
fair
marke
t valu
e
100%
of
diamo
nds
offer
ed/
pres
ented
100%
of
diamo
nds
offer
ed/
pres
ented
Achie
ved,
100%
(572
) of
diamo
nds o
ffere
d/ pr
esen
ted va
luated
.
% of
disp
utes o
n va
luatio
ns re
gard
ing fa
ir ma
rket v
alue l
odge
d
Estab
lish
base
line
2%Ac
hieve
d 0.20
% (1
)
Impr
ove o
rgan
isatio
nal
capa
city f
or m
axim
um
exec
ution
of ex
celle
nce
Over
see t
he m
onthl
y re
vision
of th
e Di
amon
d Pric
e Boo
k
Upda
ted m
onthl
y Di
amon
d Pric
e Boo
k12
12Ac
hieve
d, 12
upda
ted
month
ly Di
amon
d Pric
e Bo
oks
Over
see t
he
admi
nistra
tion
of KP
CS an
d pa
rticipa
tion i
n KP
Comp
lianc
e to t
he
KPCS
mini
mum
requ
ireme
nts ch
eckli
st
100%
co
mplia
nce
to KP
CS to
mi
nimum
re
quire
ments
ch
eckli
st
100%
co
mplia
nce
to KP
CS to
mi
nimum
re
quire
ments
Achie
ved,
100%
(1,49
5)
KPC
issue
d; fou
r (4)
Qu
arter
ly Re
ports
su
bmitte
d to K
PCS
and
eight
(8) K
PCS
Revie
w Vi
sits c
ondu
cted b
y RSA

14 SADPMRANNUALREPORT2013/2014
PRO
GR
AM
ME
2: R
EGU
LATO
RY C
OM
PLIA
NC
E
SUB
-PR
OG
RA
MM
ES: L
icen
sing
, Dia
mon
d In
spec
tora
te, P
reci
ous
Met
al In
spec
tora
te a
nd B
enefi
ciat
ion
STR
ATEG
IC O
BJE
CTI
VEK
EY A
CTI
VITI
ESM
EASU
RES
BA
SELI
NE
AN
NU
AL
TA
RG
ETA
CTU
AL
PE
RFO
RM
AN
CE
REA
SON
S FO
R V
AR
IAN
CE
Ensu
re ef
fectiv
e tra
nsfor
matio
n of th
e dia
mond
and p
recio
us
metal
s sec
tors
Proc
ess a
pplic
ation
s an
d iss
ue lic
ense
s in
line w
ith th
e leg
islati
on
Numb
er of
licen
ses
issue
d in a
ccor
danc
e wi
th the
legis
lative
tim
efram
es
393
250
Achie
ved,
650 l
icens
es
issue
d in a
ccor
danc
e with
the
legis
lative
timefr
ames
The y
ear 2
013 m
arke
d the
end o
f the fi
rst fiv
e-ye
ar pe
riod f
or lic
ense
s iss
ued.
As a
resu
lt a nu
mber
of lic
ense
s wer
e due
for r
enew
al an
d this
im
pacte
d on t
he se
t targ
et.
Imple
ment
the S
ADPM
R Tr
ansfo
rmati
on P
lan
Numb
er of
prog
ress
re
ports
04
Achie
ved,
four (
4)
prog
ress
repo
rts on
the
SADP
MR Tr
ansfo
rmati
on
plan c
ompil
ed an
d pr
esen
ted to
the B
oard
Ensu
re co
mplia
nce w
ith
legisl
ative
requ
ireme
ntsOv
erse
e the
prov
ision
of
the co
mplia
nce
inspe
ction
/audit
s on
licen
sees
Numb
er of
comp
lianc
e ins
pecti
on/au
dits
cond
ucted
405
200
Achie
ved,
238 c
ompli
ance
ins
pecti
ons/a
udits
co
nduc
ted
1. Du
e to l
icens
e ren
ewals
and n
ew ap
plica
tions
ther
e was
an in
creas
e in
the nu
mber
of in
spec
tions
for o
bliga
tion o
n tra
nsfor
matio
n2.
More
follo
w up
insp
ectio
ns w
ere m
ade i
n ter
ms of
the t
rans
forma
tion
plan a
s req
ueste
d by t
he Li
cens
ing C
ommi
ttee t
o enfo
rce
trans
forma
tion o
n the
unde
rtakin
gs th
at lic
ense
es ha
ve m
ade.i
n the
ir ap
plica
tions
.Ov
erse
e the
prov
ision
of
inspe
ction
servi
ces
withi
n the
diam
ond
and p
recio
us m
etals
secto
rs
Numb
er of
insp
ectio
ns
cond
ucted
1400
1150
Achie
ved,
1 400
diam
onds
an
d pre
cious
meta
ls ins
pecti
ons c
ondu
cted
SADP
MR in
creas
ed it
s ins
pecti
ons
to de
al wi
th no
n-co
mplia
nce
in dia
-mo
nds
and
prec
ious
metal
s. Fu
rther
more
licen
ses
issue
d als
o re
quire
d ins
pecti
on.
Ensu
re co
mpeti
tiven
ess,
susta
inable
deve
lopme
nt an
d job
crea
tion i
n the
dia
mond
and p
reciou
s me
tals i
ndus
tries
Over
see t
he
prov
ision
of is
suing
of
bene
ficiat
ion lic
ense
s
Numb
er of
Ben
eficia
tion
Licen
ses i
ssue
d 98
50Ac
hieve
d, 11
2 be
nefic
iation
licen
ses
issue
d
The N
ation
al Je
welle
r’s F
orum
whic
h rec
eived
inter
est fr
om th
e jew
eller
s pr
ompte
d pro
spec
tive a
pplic
ants
to ap
ply fo
r ben
eficia
tion l
icens
es.
The w
orks
hops
that
were
cond
ucted
abou
t SAD
PMR
also i
ncre
ased
int
eres
t in th
e ben
eficia
tion.
Assis
t pro
spec
tive
entre
pren
eurs
in the
dia
mond
and p
recio
us
metal
s ind
ustrie
s
Numb
er of
busin
esse
s as
sisted
5
5Ac
hieve
d, six
(6)
busin
esse
s ass
isted
Ro
ad sh
ows t
hat w
ere c
ondu
cted b
y SAD
PMR
led to
some
licen
sees
sh
owing
mor
e inte
reste
d in o
btaini
ng as
sistan
ce in
ther
busin
esse
s.
Facil
itate
skills
de
velop
ment
initia
tives
for
the i
ndus
tries
Numb
er of
skills
ini
tiativ
es fa
cilita
ted fo
r the
indu
stries
21
Achie
ved,
2 skil
ls ini
tiativ
es fa
cilita
ted fo
r the
ind
ustrie
s
Due t
o the
incre
ase i
n the
numb
er of
licen
ses,
more
peop
le sh
owed
int
eres
t in th
e tra
ining
inter
venti
on.
15SADPMRANNUALREPORT2013/2014
PRO
GR
AM
ME
3: A
DM
INIS
TRAT
ION
SU
B-P
RO
GR
AM
MES
: Hum
an R
esou
rces
(HR
), C
omm
unic
atio
ns, I
nfor
mat
ion
and
Com
mun
icat
ion
Tech
nolo
gy (I
CT)
, Leg
al S
ervi
ces,
Fin
ance
and
Sec
urity
Ris
k
STR
ATEG
IC
OB
JEC
TIVE
KEY
AC
TIVI
TIES
MEA
SUR
ESB
ASE
LIN
EA
NN
UA
L
TAR
GET
AC
TUA
L
PER
FOR
MA
NC
ER
EASO
NS
FOR
VA
RIA
NC
E
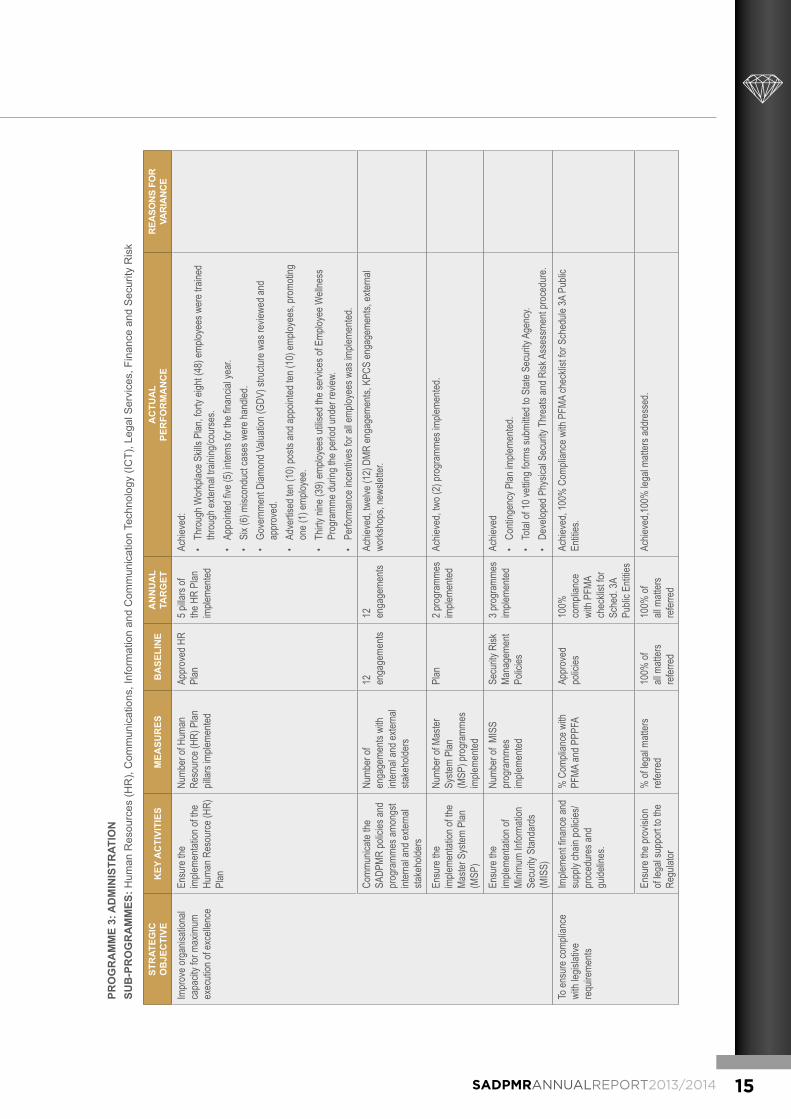
Impr
ove o
rgan
isatio
nal
capa
city f
or m
axim
um
exec
ution
of ex
celle
nce
Ensu
re th
e im
pleme
ntatio
n of th
e Hu
man R
esou
rce (H
R)
Plan
Numb
er of
Hum
an
Reso
urce
(HR)
Plan
pil
lars i
mplem
ented
Appr
oved
HR
Plan
5 pilla
rs of
the H
R Pl
an
imple
mente
d
Achie
ved:
• Th
roug
h Wor
kplac
e Skil
ls Pl
an, fo
rty ei
ght (
48) e
mploy
ees w
ere t
raine
d thr
ough
exter
nal tr
aining
/cour
ses.
• Ap
point
ed fiv
e (5)
inter
ns fo
r the
finan
cial y
ear.
• Si
x (6)
misc
ondu
ct ca
ses w
ere h
andle
d.•
Gove
rnme
nt Di
amon
d Valu
ation
(GDV
) stru
cture
was
revie
wed a
nd
appr
oved
.•
Adve
rtised
ten (
10) p
osts
and a
ppoin
ted te
n (10
) emp
loyee
s, pr
omoti
ng
one (
1) em
ploye
e.•
Thirty
nine
(39)
emplo
yees
utilis
ed th
e ser
vices
of E
mploy
ee W
ellne
ss
Prog
ramm
e dur
ing th
e per
iod un
der r
eview
.•
Perfo
rman
ce in
centi
ves f
or al
l emp
loyee
s was
imple
mente
d.Co
mmun
icate
the
SADP
MR po
licies
and
prog
ramm
es am
ongs
t int
erna
l and
exter
nal
stake
holde
rs
Numb
er of
en
gage
ments
with
int
erna
l and
exter
nal
stake
holde
rs
12
enga
geme
nts12
en
gage
ments
Achie
ved,
twelv
e (12
) DMR
enga
geme
nts, K
PCS
enga
geme
nts, e
xtern
al wo
rksho
ps, n
ewsle
tter.
Ensu
re th
e im
pleme
ntatio
n of th
e Ma
ster S
ystem
Plan
(M
SP)
Numb
er of
Mas
ter
Syste
m Pl
an
(MSP
) pro
gram
mes
imple
mente
d
Plan
2 pro
gram
mes
imple
mente
dAc
hieve
d, tw
o (2)
prog
ramm
es im
pleme
nted.
Ensu
re th
e im
pleme
ntatio
n of
Minim
um In
forma
tion
Secu
rity S
tanda
rds
(MIS
S)
Numb
er of
MIS
S pr
ogra
mmes
im
pleme
nted
Secu
rity R
isk
Mana
geme
nt Po
licies
3 pro
gram
mes
imple
mente
dAc
hieve
d•
Conti
ngen
cy P
lan im
pleme
nted.
• To
tal of
10 ve
tting f
orms
subm
itted t
o Stat
e Sec
urity
Age
ncy.
• De
velop
ed P
hysic
al Se
curity
Thr
eats
and R
isk A
sses
smen
t pro
cedu
re.
To en
sure
comp
lianc
e wi
th leg
islati
ve
requ
ireme
nts
Imple
ment
finan
ce an
d su
pply
chain
polic
ies/
proc
edur
es an
d gu
idelin
es.
% C
ompli
ance
with
PF
MA an
d PPP
FAAp
prov
ed
polic
ies10
0%
comp
lianc
e wi
th PF
MA
chec
klist
for
Sche
d. 3A
Pu
blic E
ntitie
s
Achie
ved,
100%
Com
plian
ce w
ith P
FMA
chec
klist
for S
ched
ule 3A
Pub
lic
Entiti
es.
Ensu
re th
e pro
vision
of
legal
supp
ort to
the
Regu
lator
% of
lega
l matt
ers
refer
red
100%
of
all m
atter
s re
ferre
d
100%
of
all m
atter
s re
ferre
d
Achie
ved,1
00%
lega
l matt
ers a
ddre
ssed
.
16 SADPMRANNUALREPORT2013/2014
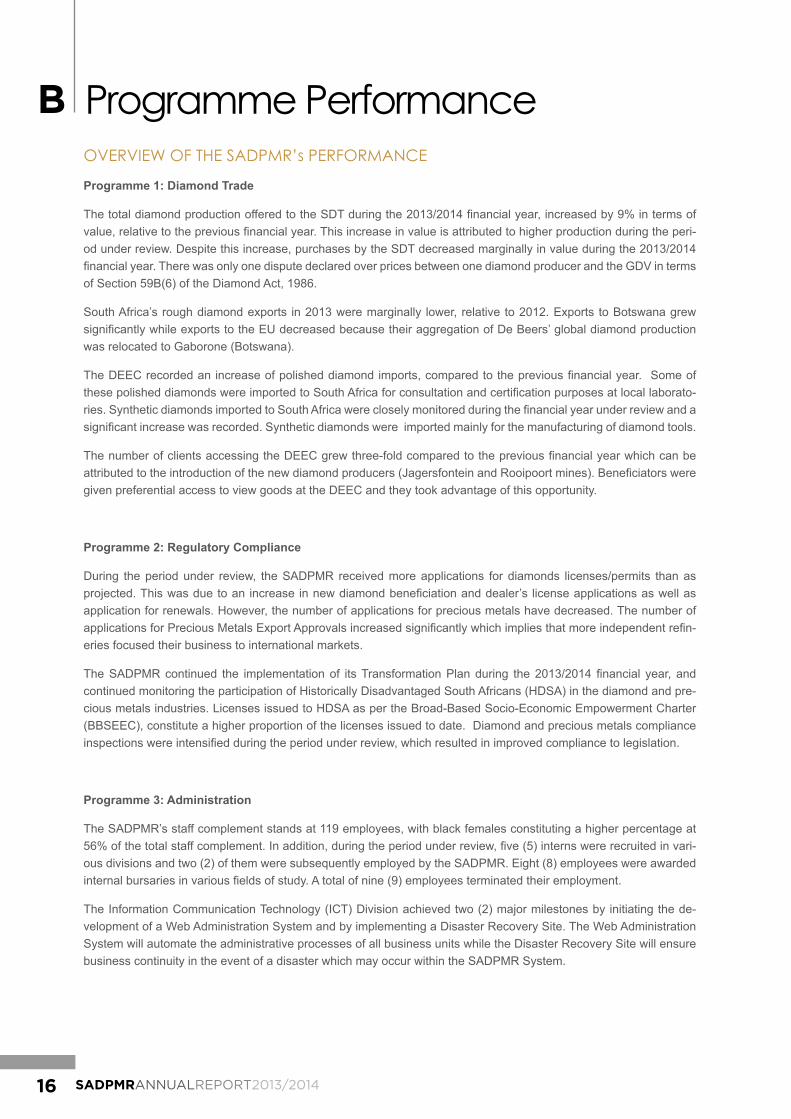
Programme PerformanceOVERVIEW OF THE SADPMR’s PERFORMANCE
Programme 1: Diamond Trade
The total diamond production offered to the SDT during the 2013/2014 financial year, increased by 9% in terms of value, relative to the previous financial year. This increase in value is attributed to higher production during the peri-od under review. Despite this increase, purchases by the SDT decreased marginally in value during the 2013/2014 financial year. There was only one dispute declared over prices between one diamond producer and the GDV in terms of Section 59B(6) of the Diamond Act, 1986.
South Africa’s rough diamond exports in 2013 were marginally lower, relative to 2012. Exports to Botswana grew significantly while exports to the EU decreased because their aggregation of De Beers’ global diamond production was relocated to Gaborone (Botswana).
The DEEC recorded an increase of polished diamond imports, compared to the previous financial year. Some of these polished diamonds were imported to South Africa for consultation and certification purposes at local laborato-ries. Synthetic diamonds imported to South Africa were closely monitored during the financial year under review and a significant increase was recorded. Synthetic diamonds were imported mainly for the manufacturing of diamond tools.
The number of clients accessing the DEEC grew three-fold compared to the previous financial year which can be attributed to the introduction of the new diamond producers (Jagersfontein and Rooipoort mines). Beneficiators were given preferential access to view goods at the DEEC and they took advantage of this opportunity.
Programme 2: Regulatory Compliance
During the period under review, the SADPMR received more applications for diamonds licenses/permits than as projected. This was due to an increase in new diamond beneficiation and dealer’s license applications as well as application for renewals. However, the number of applications for precious metals have decreased. The number of applications for Precious Metals Export Approvals increased significantly which implies that more independent refin-eries focused their business to international markets.
The SADPMR continued the implementation of its Transformation Plan during the 2013/2014 financial year, and continued monitoring the participation of Historically Disadvantaged South Africans (HDSA) in the diamond and pre-cious metals industries. Licenses issued to HDSA as per the Broad-Based Socio-Economic Empowerment Charter (BBSEEC), constitute a higher proportion of the licenses issued to date. Diamond and precious metals compliance inspections were intensified during the period under review, which resulted in improved compliance to legislation.
Programme 3: Administration
The SADPMR’s staff complement stands at 119 employees, with black females constituting a higher percentage at 56% of the total staff complement. In addition, during the period under review, five (5) interns were recruited in vari-ous divisions and two (2) of them were subsequently employed by the SADPMR. Eight (8) employees were awarded internal bursaries in various fields of study. A total of nine (9) employees terminated their employment.
The Information Communication Technology (ICT) Division achieved two (2) major milestones by initiating the de-velopment of a Web Administration System and by implementing a Disaster Recovery Site. The Web Administration System will automate the administrative processes of all business units while the Disaster Recovery Site will ensure business continuity in the event of a disaster which may occur within the SADPMR System.
B

17SADPMRANNUALREPORT2013/2014
PROGRAMME PERFORMANCE
PROGRAMME 1: DIAMOND TRADE
SUB-PROGRAMMES: DEEC, GDV AND KPCS
SUB-PROGRAMME: DIAMOND EXCHANGE AND EXPORT CENTRE (DEEC)
Rough Diamond Trade at the DEEC
Table 1. Rough Diamonds offered for local sale by Diamond Producers, Dealers and Beneficiators
2013/2014 2012/2013Total carats received 5 542 365.68 4 122 378.29Total $ received 1 092 687 801.75 902 041 682.72Total carats of parcels sold and qualified to be exported 5 541 180.04 4 114 199.04Total $ value parcels sold and qualified to be exported 1 084 333 080.38 906 544.46Total carats withdrawn 1 185.64 460.73Total $ value withdrawn 37 682.00 686 851.00
The above table indicates the rough diamond tender activities that took place during the 2013/2014 financial year. The DEEC received approximately 5.5 million carats which were valued at approximately US$1.09 billion. In com-parison to the previous financial year, there was an increase of 1 419 988.00 carats offers for local sale at the DEEC.
Rough Diamond Exports
South Africa exported 8.6 million carats, valued at $1.5 billion, during the 2013 calendar year. This represented a de-crease from 8.7 million carats in 2012. In terms of value, exports decreased from $1.8 billion during the 2012 calendar year to $1.5 billion in 2013.
Exports to the European Union decreased significantly from 7 million carats in 2012 to 2.4 million carats in 2013. This was due to the relocation of De Beers Diamond Trading Company’s global aggregation facilities to Botswana. Rough diamond exports to Botswana consequently increased from 1 437 carats in 2012 to 3.7 million carats in 2013.
Table 2: Rough diamond exports: 2013 vs. 2012
Participants2013 2012
Carats Value ($) Carats Value ($)Australia 0 0.00 988.42 96 690.80Botswana 3 698 833.25 481 758 530.83 1 437.06 232 506 191.13Canada 16.65 1 000.00 156.38 14 839.94Central African Republic 0 0.00 218.51 95 468.95China (People’s Republic of ) 63 367.59 10 852 447.96 39 729.26 5 570 499.15European Union 2 354 130.37 410 757 348.19 7 049 084.94 1 102 983 720.93India 79 142.02 33 152 473.69 122 591.18 38 874 958.21Israel 322 778.82 187 477 803.25 316 578.85 208 133 051.66Lebanon 0.00 0.00 94.53 200 000.00

18 SADPMRANNUALREPORT2013/2014
Table 2: Rough diamond exports: 2013 vs. 2012 (continued)
Participants2013 2012
Carats Value ($) Carats Value ($)Lesotho 0.00 0.00 52.14 150 000.00Namibia 0.00 0.00 1 226.10 123 153.00Switzerland 98 653.92 79 115 960.36 142 838.11 69 279 197.00Thailand 7 097.80 1 725 731.00 4 747.04 2 178 068.00United Arab Emirates 1 910 430.18 256 957 276.67 1 013 965.03 163 221 310.57United States of America 31 630.40 79 798 214.86 10 606.38 26 343 560.51Vietnam 0 0.00 881.44 847 367.00TOTAL 8 566 081.00 1 541 596 786.81 8 705 195.37 1 850 618 076.85
Rough Diamond Imports
South Africa imported 864 083 carats to the value of $743.8 million during the 2013 calendar year. This indicates a decrease from 1.3 million carats in 2012. The value, however, increased significantly from $444.3 million in 2012 to $743.8 million in 2013.
Table 3: Rough diamond imports: 2013
Participants2013 2012
Carats Value ($) Carats Value ($)Botswana 198 530.84 275 924 320.05 10 944.59 10 186 828.69Canada 79.9 1 724.00 78.98 16 070.00Central African Republic 0 0.00 252.96 107 208.95People's Republic of China 3 632.99 1 911 746.85 17 545.36 8 530 865.60Democratic Republic of the Congo (DRC) 12 229.56 441 465.11 6 203.91 415 074.49
European Union 129 929.42 61 848 234.61 280 584.99 199 363 578.53Guinea 79.91 28 000.00 0 0India 28 799.44 2 683 088.57 23 575.19 4 730 158.63Israel 151 298.17 119 860 156.11 105 725.28 92 256 700.34Lesotho 0 0 33 503.62 8 259 584.00Liberia 2 071.67 669 867.14 4 597.66 1 132 900.81Namibia 535.12 825 593.90 970.04 3 245 614.94Russian Federation 20.53 58 203.00 722.77 3 664 161.00Sierra Leone 7.35 7 250.04 0 0Switzerland 53 865.67 30 770 696.00 22 674.79 38 795 152.44United Arab Emirates 138 278.23 45 306 492.37 305 390.77 47 880 282.29United States of America 2 642.93 28 972 886.11 1 693.91 12 909 902.96Zimbabwe 142 082.19 174 539 823.84 475 320.44 12 786 719.32TOTAL 864 083.92 743 849 547.70 1 289 785.26 444 280 802.99

19SADPMRANNUALREPORT2013/2014
Polished Diamond Imports and Exports
During the period under review, South Africa exported a total of 180 096.47 carats of polished diamonds, valued at approximately $ 1 billion. There was an increase of approximately 30 000 carats of diamond exports received and declared during this period, when compared to the previous financial year. Part of these diamonds were imported by the local laboratories for the purpose of being certified.
Table 4: Polished diamond exports
2013/2014 2012/2013
Carats Value (US$)
Rand Value (ZAR) Carats Dollar Value
(US$)Rand Value
(ZAR)TOTAL 180 096 1 034 670 337 10 587 527 307 150 175 801 776 793 6 814 285 591
During the period under review, the DEEC received and cleared a total of 199, 216.00 carats of polished diamond im-ports, valued at approximately $595 million (see Table 5). The DEEC saw an increase of 58 000.00 carats compared to the previous financial year. Some of these polished diamonds were imported to South Africa for consultation and certification at local laboratories and were re-exported to their country of origin.
Table 5: Polished diamond imports
2013/2014 2012/2013
Carats Value (US$)
Rand Value (ZAR) Carats Dollar Value
(US$)Rand Value
(ZAR)TOTAL 199 216 595 310 209.20 6 133 928 793 141 182 379 691 781 2 555 282 479
190 000
180 000
170 000
160 000
150 000
140 000
130 000
0
2013/2014 2012/2013
Graph 1: Polished diamond exports

20 SADPMRANNUALREPORT2013/2014
The DEEC received and cleared 113 021 654 carats of synthetic diamond powder, valued at approximately US$10 million (see Table 6). The synthetic diamond powder was imported for the purpose of manufacturing diamond tools.
Table 6: Synthetic diamonds imported: 2013/2014
Period Carats Value(US$) Value (ZAR)Apr 2013 5 551 600.00 816 798.00 7 638 728.00May 2013 6 019 797.00 927 817. 00 8 725 558.00Jun 2013 17 420 500.00 1 287 456. 00 13 243 725.00July 2013 20 358 900.00 1 386 481. 00 13 911 764.00Aug 2013 2 750 488.00 691 566. 00 7 055 483.00Sep 2013 10 495 850.00 1 099 698. 00 11 352 887.00Oct 2013 12 371 500.00 864 609. 00 8 708 787.00Nov 2013 12 043 600.00 833 395. 00 8 650 657.0Dec 2013 10 771 519.00 585 524. 00 6 215 468.00Jan 2014 1 042 500.00 171 998.00 1 913 738.00Feb 2014 13 819 500.00 1 301 906.00 14 694 884.00Mar 2014 375 900.00 46 951.00 511 196.00TOTAL 113 021 654.00 10 014 199.00 102 622 875.00
200 000
180 000
160 000
140 000
120 000
100 000
80 000
60 000
40 000
20 000
0
2013/2014 2012/2013
Graph 2: Polished diamond imports: 2013/2014 vs. 2012/2013

21SADPMRANNUALREPORT2013/2014
SUB-PROGRAMME: KIMBERLEY PROCESS CERTIFICATION SCHEME (KPCS)
During the 2013/2014 financial year, SADPMR oversaw the administration and implementation of KPCS and KP participation, by ensuring compliance with KPCS Requirements and other relevant legislation.
• IssuingofKPCSCertificates
South Africa issued 1 528 KP Certificates for unpolished diamond exports, while receiving 390 KP Certificates for the importation of unpolished diamonds from its other Kimberley Process participants.
• Submission of Statistical Reports to KPCS
Four statistical reports were submitted timeously to the KPCS working group on statistics.
• Highlights
i. The Republic of South Africa served as Chair of the KP during 2013, and managed to successfully host the intersessional and plenary meetings in Kimberley and Johannesburg during June and November 2013 respectively.
ii. KP could not reach consensus on the decision-making process as well as the definition of Conflict diamonds. The revised Terms of Reference for the Working Group on Alluvial and Artisanal Diamond Production were adopted.
iii. An administrative decision on the dissolution of the Participation and Selection Committees as well as the formation of the Committee on Participation and Chairmanship were adopted. The Terms of Reference for the Committee on Participation and Chairmanship were also adopted.
iv. The Republic of South Africa was accepted as the Chair of the new Committee on Participation and Chair-manship for the year 2014.
v. Mali was welcomed as a new member of the Kimberley Process Certification Scheme.
vi. South Africa participated in seven (7) review visits to various KP participants.
SUB-PROGRAMME: GOVERNMENT DIAMOND VALUATOR (GDV)
The GDV was appointed in terms of Section 5(1) (c) of the Diamonds Act, 1986 (Act No. 56 of 1986) which empowers the SADPMR to appoint a person who has the necessary expertise with regard to the market prices of diamonds as a Government Diamond Valuator (GDV).
Core Function of the GDV
The GDV ensures that diamonds are traded at fair market value and provides technical assistance to SADPMR in matters concerning the valuation of diamonds.
The GDV managed to successfully oversee the provision of diamond valuation services by ensuring that all diamonds were traded at a fair market value and managed to verify the value of all diamonds that were offered to the SDT as per legislative requirements.
Key Activities
• Verifying the value of all diamonds offered to the SDT for the purpose of local beneficiation.
• Ensuring that all unpolished diamonds, whether imported or exported, reflect fair market value.
• Describe and value exhibits confiscated by the South African Police Service (SAPS).
• Providing technical advice, regarding the value of diamonds, to all stakeholders.

22 SADPMRANNUALREPORT2013/2014
GDVVerificationintermsofSection59B(5)oftheDiamondSecondAmendmentAct,2005(ActNo.30of2005)
Total annual diamond production increased by 17.46% from the previous financial year (2012/2013). This increase could be as a result of some mining companies expanding their operations and seeking alternative mining methods to increase production (refer to Table 6).
Table 6: Producer summary (in carats) of all unpolished diamonds verified by the GDV in terms of Section 59B
2013/2014 2012/2013100% carats presented to the SDT 8 336 934.13 7 097 464.28
10% carats selected by the SDT 834 046.11 753 025.88Carats purchased by the SDT 259 195.04 300 587.91
There was a 10.75% increase in carats selected by the SDT in 2013/2014, compared to the previous financial year. This amounts to an increase of 81,020.23 carats selected during 2013/2014. This increase can be attributed to the overall increase in diamond production during the 2013/2014 financial year (refer to Graph 4).
9 000 000
8 000 000
7 000 000
6 000 000
5 000 000
4 000 000
3 000 000
2 000 000
1 000 000
0
100% carats 2013/2014 100% carats 2012/2013
Graph 3: 100% carats presented to SDT: 2013/2014 vs. 2012/2013
900 000
800 000
700 000
600 000
500 000
400 000
300 000
200 000
100 000
0
10% carats 2013/2014 10% carats 2012/2013
Graph 4: 10% carats selected by the SDT from what was presented in 2013/2014 vs. 2012/2013
23SADPMRANNUALREPORT2013/2014
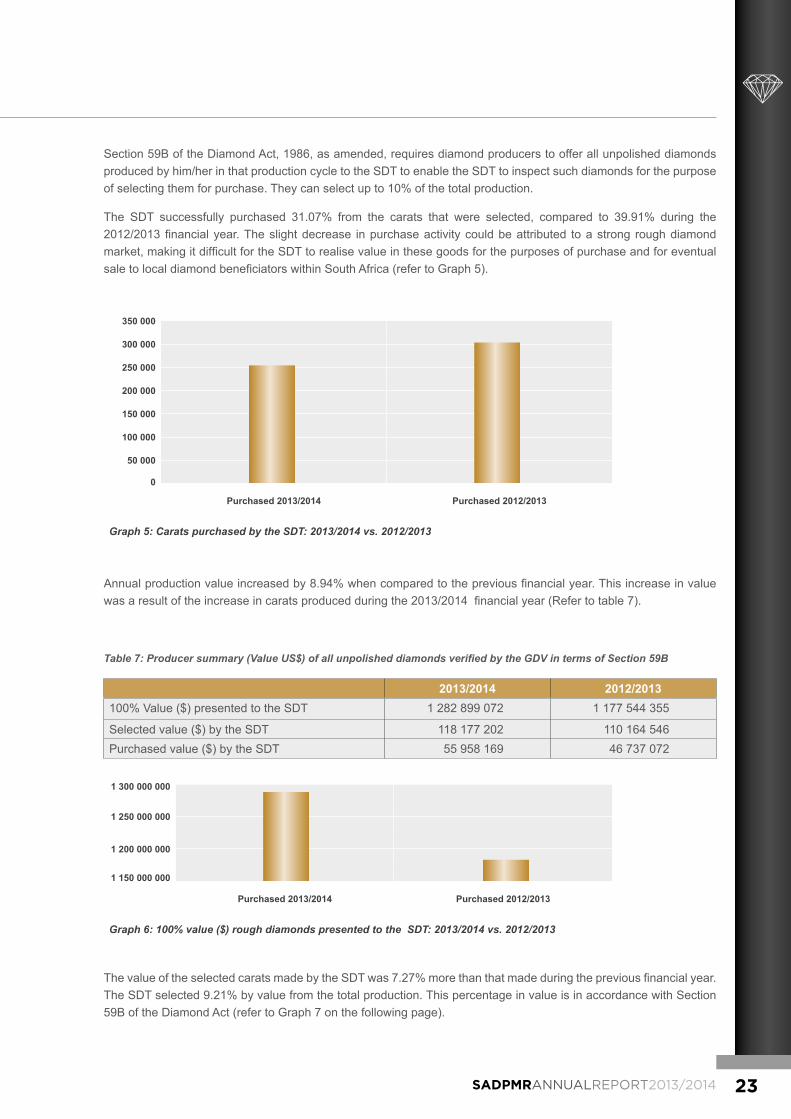
Section 59B of the Diamond Act, 1986, as amended, requires diamond producers to offer all unpolished diamonds produced by him/her in that production cycle to the SDT to enable the SDT to inspect such diamonds for the purpose of selecting them for purchase. They can select up to 10% of the total production.
The SDT successfully purchased 31.07% from the carats that were selected, compared to 39.91% during the 2012/2013 financial year. The slight decrease in purchase activity could be attributed to a strong rough diamond market, making it difficult for the SDT to realise value in these goods for the purposes of purchase and for eventual sale to local diamond beneficiators within South Africa (refer to Graph 5).
Annual production value increased by 8.94% when compared to the previous financial year. This increase in value was a result of the increase in carats produced during the 2013/2014 financial year (Refer to table 7).
Table 7: Producer summary (Value US$) of all unpolished diamonds verified by the GDV in terms of Section 59B
2013/2014 2012/2013100% Value ($) presented to the SDT 1 282 899 072 1 177 544 355
Selected value ($) by the SDT 118 177 202 110 164 546Purchased value ($) by the SDT 55 958 169 46 737 072
The value of the selected carats made by the SDT was 7.27% more than that made during the previous financial year. The SDT selected 9.21% by value from the total production. This percentage in value is in accordance with Section 59B of the Diamond Act (refer to Graph 7 on the following page).
350 000
300 000
250 000
200 000
150 000
100 000
50 000
0
Purchased 2013/2014 Purchased 2012/2013
Graph 5: Carats purchased by the SDT: 2013/2014 vs. 2012/2013
1 300 000 000
1 250 000 000
1 200 000 000
1 150 000 000
Purchased 2013/2014 Purchased 2012/2013
Graph 6: 100% value ($) rough diamonds presented to the SDT: 2013/2014 vs. 2012/2013

24 SADPMRANNUALREPORT2013/2014
Actual value purchased by the SDT from the selection made of the total production, increased from 42.42% in 2012/2013 to 47.35% in 2013/2014. The increase in purchase activity could be attributed to the SDT selecting from certain categories of rough diamonds that can be used for local beneficiation (refer to Graph 8).
Actual carats, purchased from the total production (100%) presented to SDT, decreased from 4.24% in 2012/2013 to 3.11% in 2013/2014, in relation to the total production (100%) presented. This is a 26.65% decrease (refer to Table 8).
Table 8: Carats purchased by the SDT
2013/2014 2012/2013Carats offered 8 336 934 7 097 464
SDT purchases 259 195 300 587Percentage purchased 3.11% 4.24%
120 000 000
115 000 000
110 000 000
105 000 000
100 000 000
Purchased 2013/2014 Purchased 2012/2013
Graph 7: Value ($) selected by SDT: 2013/2014 vs. 2012/2013
60 000 000
55 000 000
50 000 000
45 000 000
40 000 000
35 000 000
2013/2014 2012/2013
Graph 8: Purchases by value (US$): 2013/2014 vs. 2012/2013
320 000 000
300 000 000
280 000 000
260 000 000
240 000 000
220 000 000
2013/2014 SDT purchases 2012/2013 SDT purchases
Graph 9: Carats purchased by SDT: 2013/2014 vs. 2012/2013

25SADPMRANNUALREPORT2013/2014
Diamond Valuation Services Rendered to the South African Police Service (SAPS)
The GDV renders a service to the SAPS pertaining to all objects confiscated for the purpose of an expert opinion in terms of Section 212 of the Criminal Procedures Act, 1977. This opinion is to verify whether the objects presented are either diamonds or non-diamonds. In the event that the objects verified are found to be diamonds, then an appropriate value needs to be determined.
During the 2013/2014 financial year, 1 060 objects were presented to the GDV for verification and valuation, com-pared to 1 719 objects during the 2012/2013 financial year. This represents a 38.33% decrease in the number of objects presented during the 2013/2014 financial year. Although the number of objects presented decreased, it should also be noted that the amount of diamond content decreased from 1 506.20 carats confiscated in 2012/2013 to 168.39 carats confiscated in 2013/2014. This represented an 88.82% decrease, which could be attributed to that, there were a few large consignments of rough diamonds confiscated by the SAPS in 2012/2013 financial year (refer to Table 9).
Table 9: Objects confiscated by the South African Police Service (SAPS)
Province 2013/ 2014
Exhibits Totals 2012/ 2013
Exhibits Totals
Diamonds Non- Diamonds Carats Value (Zar) Diamonds Non-
Diamonds Carats Value (Zar)
Gauteng 300 44 256 18.48 154 826.73 419 273 146 1153.5 23 043 882.12
Limpopo 0 0 0 0 0.00 3 0 3 0
Free State 180 107 73 32.72 21 315.45 71 45 26 40.13 89 494.00
Northern Cape 354 137 217 55.97 118 894.10 484 308 176 228.1 19 018 976.50
Eastern Cape 4 0 4 0 0.00 0 0 0 0 0
North West 168 42 126 50.1 107 435.46 137 36 101 43.76 17 305.91
Mpumalanga 0 0 0 0 0.00 8 7 1 20.25 171
KwaZulu-Natal 3 2 1 0.86 892.00 18 0 18 0 0
Western Cape 51 9 42 10.26 10 481.00 579 41 538 20.46 71 861.00
TOTAL 1 060 341 719 168.39 413 844.74 1719 710 1009 1506.2 42 241 690.53

26 SADPMRANNUALREPORT2013/2014
PROGRAMME 2: REGULATORY COMPLIANCE
SUB-PROGRAMMES: LICENSING, DIAMOND INSPECTORATE, PRECIOUS METALS AND BENEFICIATION
PURPOSE OF THE PROGRAMME: To regulate the diamond and precious metals industries
SUB PROGRMME: LICENSING
The Licensing Division is responsible for receiving, processing all license/permit applications for trade in diamonds, research and the beneficiation of unpolished diamonds, beneficiation of precious metals licenses and permits, refining, research and jewellery making, as well as precious metals import permits and export approvals.
There was an increase in the number of diamond beneficiation and dealer’s applications received in 2013/2014 com-pared to the previous financial year. There was a decrease in the number of authorised representative certificates ap-plications received. In relation to the applications received, there was an increase in the number of diamond dealers and beneficiation licenses issued. The significant increase of diamond beneficiation and diamond dealer’s licenses was attributed to renewal of licenses issued during the period under review. There was no significant variance in other types of licenses and permits issued.
Table 10: Diamond license applications
License type2013/2014 2012/2013
Application received
License issued
Application received
License issued
Diamond Beneficiation 115 112 25 11Diamond Dealer 282 265 184 203Diamond Trading House 6 6 1 2Diamond Research 3 1 1 1Temporary Buyers Permit 0 0 0 0Diamond Certificate 2 1 2 1Authorised Representative Certificate 110 70 161 171Diamond Permit 42 35 36 36Diamond Endorsements 23 23 N/A N/ATOTAL 583 513 410 425
During the period under review, a total of 133 precious metal licenses, permits and certificates were issued and 152 precious metal license applications were received. There was an overall decrease in precious metals licenses/permits issued in the 2013/2014 financial year, compared to the 139 precious metal licenses issued in the previous financial year. Table 11 on the following page indicates a decline in refining and jewellery permit applications received during the 2013/2014 financial year, compared to the previous financial year. There was a 50% increase in export approval applications received in the 2013/2014 financial year, compared to the previous financial year. This was due to an increase in small to medium-scale refiners exporting independently. There was no significant variance in other types of licenses and permits issued.

27SADPMRANNUALREPORT2013/2014
Table 11: Precious metals applications received and licenses issued
Precious metals licenses/permits2013/2014 2012/2013
Application received
License issued
Application received
License issued
Precious Metals Refining 10 7 16 16Precious Metals Beneficiation 3 3 3 2Jewellers Permits 45 40 66 84Special Permits 12 12 14 11Permits to Import 14 8 14 14Export Approval 16 11 8 10Precious Metal Certificates 3 3 1 2Precious Metal Endorsements 49 49 N/A N/ATOTAL 152 133 122 139
Licenses are rolled over from the previous reporting period
During the period under review Precious Metals Jeweller’s Permits, Precious Metals Beneficiation and Refining li-censes decreased. The table below shows Historically Disadvantaged South Africans (HDSA) ownership in terms of the Broad-Based Socio-Economic Empowerment Charter (BBSEEC).
Table 12: Diamond and precious metals licenses issued, based on HDSA and non-HDSA ownership
Licenses issued and % ownership
100% HDSA ownership
90% – 50% HDSA* ownership
≥26%HDSAownership
Non-HDSA ownership
Male Female Male Female Male Female Male FemaleDiamond Dealers 127 21 7 2 20 37 36 15Diamond Beneficiation 25 8 0 5 22 20 6 4Jewellers Permits 8 4 0 0 1 0 6 11Precious Metal Beneficiation 1 0 0 0 0 0 0 0Precious Metal Refining 3 0 0 0 5 0 0 1TOTAL 164 33 7 7 48 57 48 31
* Historically Disadvantaged South Africans (HDSA)
SUB-PROGRAMME: DIAMOND INSPECTORATE
The Diamond Inspectorate Sub-programme on regulatory compliance has the following main functions:
• Diamond inspections to ensure compliance with the Diamonds Act, 1986 (Act No. 56 of 1986), which involves:
a. conducting business premises inspections on new applicants prior to a license being issued;
b. conducting follow-up inspections pertaining to existing licenses; and
c. conducting import and export inspections specifically for diamondiferous gravel recovered while mining, as well as of rock samples used for laboratory testing.

28 SADPMRANNUALREPORT2013/2014
• Maintenance of diamond activity statistics, namely:
a. monitoring of monthly J-Register submissions and the issuing of penalty statements in this regard;
b. ensuring that diamond producers or permit holders are registered with the Regulator; and
c. monitoring and capturing of diamond trade transactions.
Table 13: Breakdown of inspections conducted by license/permit type
License/permit type
Number of inspections 2013/14
Number of inspections 2012/13
New premises inspections
Follow-up inspections
New premises inspections
Follow-up inspections
Dealing License 206 254 230 150Beneficiation License 50 78 26 67Trading House License 1 50 3 64Research License 3 1 1 1Producer Permit 44 50 0 147Import/Export Comfort Letters 0 56 0 57TOTAL 304 489 260 486
The table above indicates that a total of 793 inspections were conducted during the 2013/2014 financial year. Of these inspections, 304 were related to new diamond license applications, including 44 new producer registrations, while 489 were follow-up inspections of existing licenses. The total number of inspections conducted represents a 6.3% increase relative to the previous financial year’s 746 inspections, of which 260 inspections pertained to new license applications and 486 to follow-up inspections on existing licensees.
Non-compliance in terms of Register submissions occurs when a licensee fails to submit monthly transaction returns to the SADPMR or late submission – i.e. more than seven days after the end of each month. During the follow-up inspections, 450 statements of accounts were delivered to J-Register defaulters by the Diamond Inspectors. Over and above these deliveries made, 1 200 warning letters were sent out by post.
These follow-up inspections and sending out of warning letters had a major positive impact on compliance and result-ed in the improvement of J-register submissions.
SUB-PROGRAMME: PRECIOUS METALS AND BENEFICIATION
The Precious Metals and Beneficiation Sub-programme of Regulatory Compliance has two main functions:
• Precious Metals Inspections: This function entails ensuring compliance with the Precious Metals Act, 2005 (Act No. 37 of 2005), and involves:
a. conducting inspections relating to precious metal licenses and applications for such licenses; and
b. monitoring of trade transactions via prescribed registers and information submission forms.
• Beneficiation: This function involves monitoring and promoting the beneficiation of precious metals and diamonds in South Africa.

29SADPMRANNUALREPORT2013/2014
Precious Metals Inspections
The highlight of this sub-programme was surpassing the targeted number of inspections, which, for the first time, included 12 imports inspections in Cape Town and 13 joint inspections conducted in conjunction with SAPS. This resulted in increased compliance in terms of the Precious Metals Act.
During the period under review, a total of 607 inspections were conducted, of which 122 inspections were related to new precious metal license/permit applications, while the balance of 485 were follow-up inspections, conducted on the premises of existing license/permit holders (see Table 14). The number of inspections conducted represented a 7% decrease, compared with the previous financial year’s 654 inspections, of which 153 pertained to new applica-tions and 501 were related to existing licenses/permits. The decrease was mainly due to a decrease in the number of applications for new licenses and permits, as well as to the decrease in jeweller’s permit follow-up inspections, which was the result of an improved understanding of completing Registers by permit holders.
The majority of the inspections were related to applications for jeweller’s permits (83) and existing jeweller’s permits (390), followed by inspections related to refining licenses and beneficiation licenses (see Table 14) Jeweller’s permit follow-up inspections dominated the inspections, because they are by far the dominant permits issued. Jewellery manufacturing is the main activity relating to precious metals in terms of the number of participants in the industry.
The result of premises inspections was the identification of transgressions which were dealt with in accordance with the provisions of the Precious Metals Act, 2005. Furthermore, follow-up inspections assisted in educating new licen-sees on register completion, while also ensuring that registers were completed and submitted timeously.
Table 14: Breakdown of the inspections done by license/permit type
License/permit type
Number of inspections 2013/2014
Number of inspections 2012/2013
New premises inspections
Follow-up inspections
New premises inspections
Follow-up inspections
Refining Licenses 16 47 20 47Beneficiation Licenses 8 46 5 42Jewellers Permits 83 390 114 412Special Permits 15 2 14 0TOTAL 122 485 153 501
Register of Transactions
Every holder of a precious metals license or permit must keep a true and correct register, in the prescribed format and for the prescribed period, of all unwrought or semi-fabricated precious metals deposited, received, dispatched or otherwise disposed of by such license. The registers of transactions must be submitted to SADPMR periodically (quarterly, biannually or annually, as the case may be).
Although register submissions remain a challenge due to the different submission periods for licenses and permits, there was a significant improvement of 14% in register submissions (from about 60% to 74%), compared to the previ-ous financial year. Non-submission of registers was followed-up and warning letters were sent to defaulters.
30 SADPMRANNUALREPORT2013/2014
Beneficiation
• Diamond Beneficiation
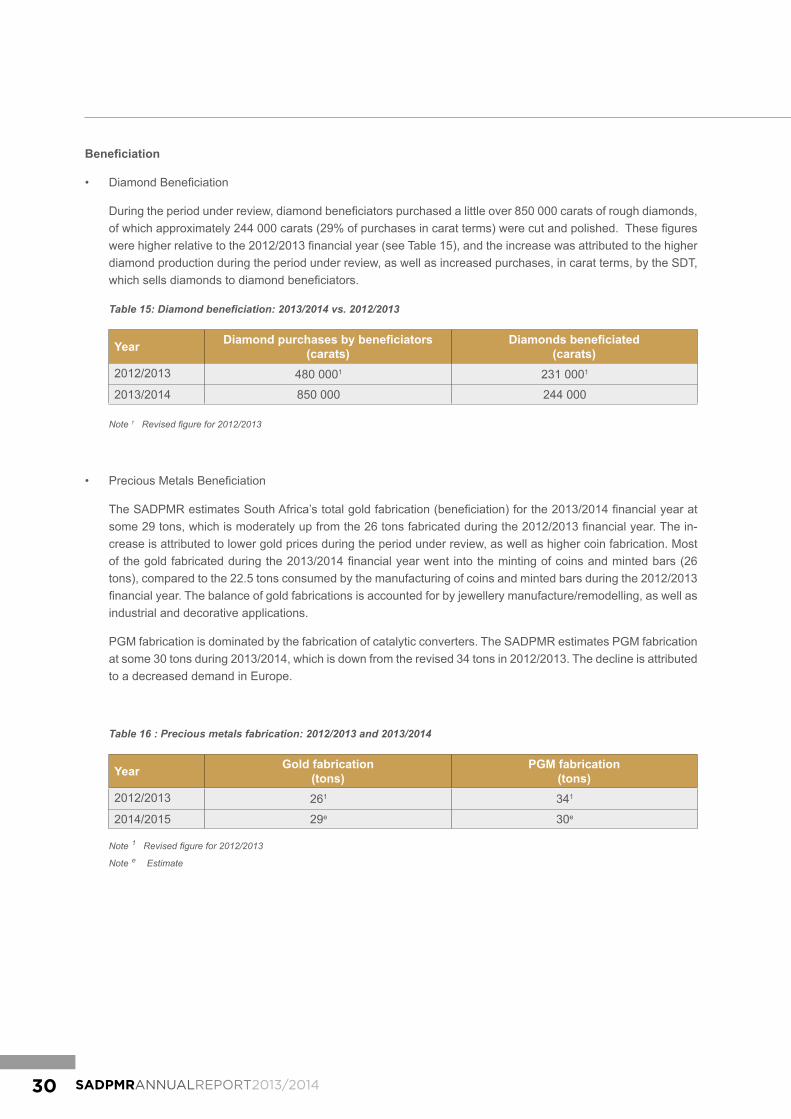
During the period under review, diamond beneficiators purchased a little over 850 000 carats of rough diamonds, of which approximately 244 000 carats (29% of purchases in carat terms) were cut and polished. These figures were higher relative to the 2012/2013 financial year (see Table 15), and the increase was attributed to the higher diamond production during the period under review, as well as increased purchases, in carat terms, by the SDT, which sells diamonds to diamond beneficiators.
Table 15: Diamond beneficiation: 2013/2014 vs. 2012/2013
Year Diamondpurchasesbybeneficiators(carats)
Diamondsbeneficiated(carats)
2012/2013 480 0001 231 0001
2013/2014 850 000 244 000
Note 1 Revised figure for 2012/2013
• Precious Metals Beneficiation
The SADPMR estimates South Africa’s total gold fabrication (beneficiation) for the 2013/2014 financial year at some 29 tons, which is moderately up from the 26 tons fabricated during the 2012/2013 financial year. The in-crease is attributed to lower gold prices during the period under review, as well as higher coin fabrication. Most of the gold fabricated during the 2013/2014 financial year went into the minting of coins and minted bars (26 tons), compared to the 22.5 tons consumed by the manufacturing of coins and minted bars during the 2012/2013 financial year. The balance of gold fabrications is accounted for by jewellery manufacture/remodelling, as well as industrial and decorative applications.
PGM fabrication is dominated by the fabrication of catalytic converters. The SADPMR estimates PGM fabrication at some 30 tons during 2013/2014, which is down from the revised 34 tons in 2012/2013. The decline is attributed to a decreased demand in Europe.
Table 16 : Precious metals fabrication: 2012/2013 and 2013/2014
Year Gold fabrication (tons)
PGM fabrication (tons)
2012/2013 261 341
2014/2015 29e 30e
Note 1 Revised figure for 2012/2013
Note e Estimate

31SADPMRANNUALREPORT2013/2014
PROGRAMME 3: ADMINISTRATION
SUB-PROGRAMMES: FINANCE, COMMUNICATIONS, ICT, LEGAL SERVICES, SECURITY RISK AND HR
PURPOSE OF THE PROGRAMME: The provision of administration
SUB-PROGRMME: FINANCE
The main function of the Finance Division is to ensure that revenue, expenditure, assets and liabilities of the SADPMR are managed efficiently and effectively, pursuant to the Public Finance Management Act (Act No. 1 of 1999) (PFMA).
During the period under review, the Finance Division executed all key activities intended to achieve the set strategic objectives. Furthermore, in order to maintain a clean audit status that the SADPMR had obtained for two consecutive years, additional controls that were developed and implemented while existing ones were reviewed to ensure align-ment with business requirements and compliance with best practice.
To further enhance compliance with legislative requirements, three policies and guidelines were developed and imple-mented. Implementation of these policies and guidelines will continue to improve financial discipline in the utilisation of public funds, accountability, as well as enhance internal controls.
The development and implementation of the Supply Chain Management Procurement Policy, the formalisation of the Terms of Reference/Charter for the bid committees, and the appointment of members thereof, the improved compli-ance with procurement prescripts, thereby affording South Africans the opportunity to participate in the government procurement process.
SUB-PROGRAMME: INFORMATION AND COMMUNICATION TECHNOLOGY (ICT)
During the period under review, two major milestones were achieved, namely the development of the Web Adminis-tration System and the implementation of the Disaster Recovery Site.
The Web Administration System will automate the administrative processes of all business units. It is used to execute most of the organisation’s processes, such as licensing of clients, imports and exports, diamond tenders, and the capturing of registers of transaction. The new Web Administration System was integrated with the finance system, which allowed real-time sharing of data between the two systems.
The Disaster Recovery Site will ensure business continuity in the event of a disaster that may occur within SADPMR. A Disaster Recovery Plan was developed and approved, detailing business applications that have to be replicated to the Disaster Recovery Site. In the event of disaster on the primary site (SADPMR), a secondary site will be activated to ensure that the core business and strategic applications are accessible as defined in the Disaster Recovery Plan.
SUB-PROGRAMME: SECURITY RISK
During the period under review, SADPMR did not experience any security breaches, owing to the continuous imple-mentation of the Minimum Information Security Standards (MISS), the Minimum Physical Security Standards (MPSS) and a National Vetting Strategy (NVS).
Three programmes were implemented, namely Contingency Plan, Vetting, and a Physical Security Threats and Risk Assessment Procedure, which will be integrated into the SADPMR Risk Register. During the period under review, 10 vetting forms were submitted to the State Security Agency, which will continue to assist in determining the security competency of vetted officials. In order to improve the health and safety of employees, one component of the Contin-gency Plan, namely Emergency Preparedness, was implemented via biannual evacuation practices.

32 SADPMRANNUALREPORT2013/2014
SUB-PROGRAMME: LEGAL SERVICES
Legal Services ensures the provision of professional legal support and advisory services to the SADPMR, which in-clude the provision of legal opinions and advice, interpretation of legislation and the management of litigation against the organisation.
During the period under review, the SADPMR had two pending cases. In the first case the applicant challenged the constitutionality of the two Diamond Amendment Acts, while the second case was a labour matter waiting to be set down for hearing by the applicant.
Legal Services also vetted and drafted various service level agreements on behalf of the South African Diamond and Precious Metals Regulator, engaged with various stakeholders, provided internal legal advice on various matters, subpoenaed to provide expert opinion on validity of licenses compliant to the legislation.

33SADPMRANNUALREPORT2013/2014
PART CHUMAN RESOURCES
34 SADPMRANNUALREPORT2013/2014
Human Resources Management CThe purpose of Human Resources Management (HRM) is to enable the organisation to deliver on its mandate, by providing strategic human resources management and administration to the SADPMR. The main priority was the imple-mentation of an approved Integrated Human Resources Plan.
The HRM provides services relating to organisational development; recruitment and selection; facilitating performance evaluation of employees via a Performance Management and Development System (PMDS); managing service benefits; an Employee Wellness Programme (EWP); labour relations management; and to building human resources capacity via training and development interventions.
The HR Division played a pivotal role in creating a harmonious working environment and improving working relation-ships between staff members, with the ultimate goal to make SADPMR an employer of choice. The EWP continues to facilitate the implementation of health promotion programmes and the rendering of psycho-social support to all SAD-PMR employees and their family members. During the period under review, a considerable effort was made to retain, attract and recruit employees with critical skills, in order to deliver on the organisation’s mandate.
HUMAN RESOURCES STATISTICS
Personnel Cost By Salary Band
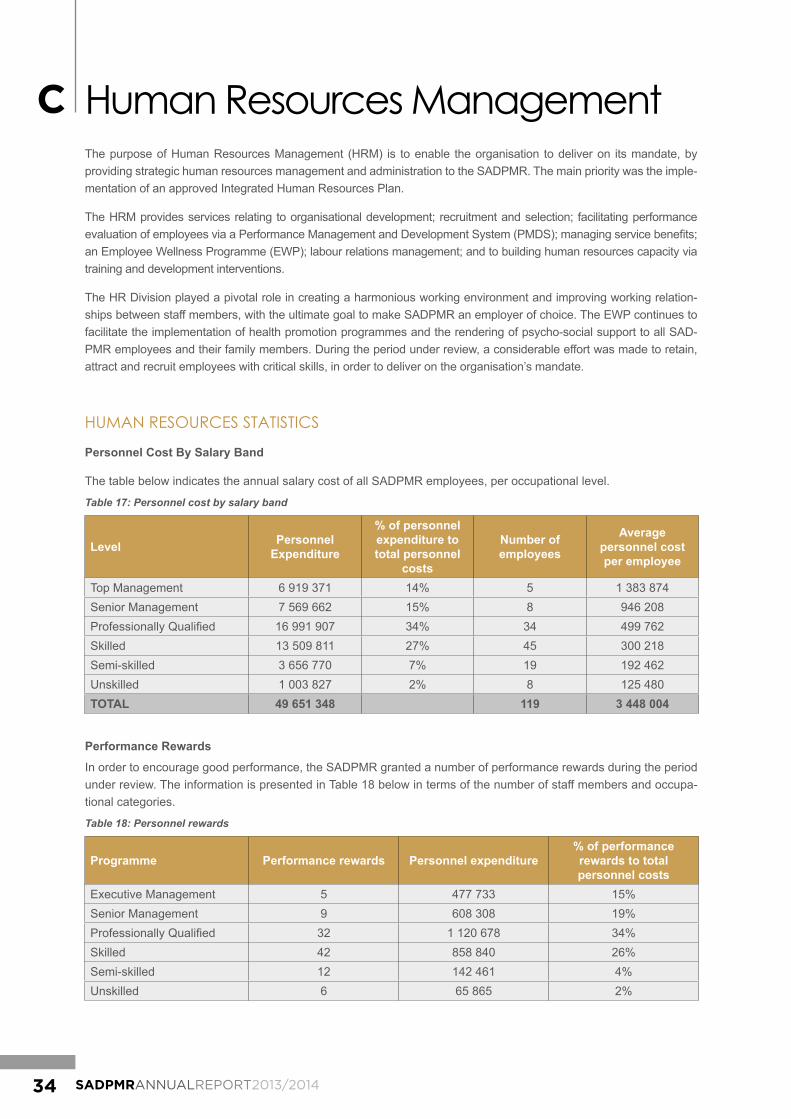
The table below indicates the annual salary cost of all SADPMR employees, per occupational level.
Table 17: Personnel cost by salary band
Level Personnel Expenditure
% of personnel expenditure to total personnel
costs
Number of employees
Average personnel cost per employee
Top Management 6 919 371 14% 5 1 383 874Senior Management 7 569 662 15% 8 946 208Professionally Qualified 16 991 907 34% 34 499 762Skilled 13 509 811 27% 45 300 218Semi-skilled 3 656 770 7% 19 192 462Unskilled 1 003 827 2% 8 125 480TOTAL 49 651 348 119 3 448 004
Performance Rewards
In order to encourage good performance, the SADPMR granted a number of performance rewards during the period under review. The information is presented in Table 18 below in terms of the number of staff members and occupa-tional categories.
Table 18: Personnel rewards
Programme Performance rewards Personnel expenditure% of performance rewards to total personnel costs
Executive Management 5 477 733 15%Senior Management 9 608 308 19%Professionally Qualified 32 1 120 678 34%Skilled 42 858 840 26%Semi-skilled 12 142 461 4%Unskilled 6 65 865 2%

35SADPMRANNUALREPORT2013/2014
Internal Staff Bursaries
During the period under review, eight employees were awarded internal bursaries in different fields of study. The table below provides a summary of bursaries and expenditure in the respective divisions of the Organisation.
Table 19: Internal bursaries
Directorate/Business unit Personnel expenditure
Training expenditure
Training expenditure
as a % of personnel
costs
Number of employees
trained
Average training cost per employee
Compliance 3 363 836 11 243 0.33% 1 11 243Finance 10 507 313 12 480 0.12% 1 12 480Information and Communica-tion Technology
2 840 857 13 630 0.48% 1 13 630
Office of the CEO 4 674 720 132 234 2.83% 2 66 117Precious Metals and Benefi-ciation
6 098 363 70 190 1.15% 2 35 095
Security Risk Management 4 229 088 12 480 0.30% 1 12 480TOTAL 31 714 177 252 257 8 151 045
Internship Programme
During the year under review five interns were appointed. The table below provides a summary of the total number of interns during the period under review, in terms of gender and race. Four interns were employed by SADPMR and other organisations, and one intern opted to continue to study further.
Table 20: Internship programme
Male Female Foreign National Total
A C I W A C I W Male FemaleInternship Programme
1 0 0 0 4 0 0 0 0 0 5
* African = A, Coloured = C, Indian = I, White = W
Employment and Vacancies
The table below indicates the number of approved funded posts in the Organisation, the number of employees and the vacancy rate. This information is presented in terms of occupational levels during the period under review.
Table 21: Employment and vacancies
Programme2013/2014 Approved
posts
2013/2014 Number of employees
2013/2014 Vacancies
% of vacancies
2012/2013 Number of employees
Executive Management 5 5 0 0% 5Senior Management 8 8 0 0% 8Professionally Qualified 39 34 5 12% 34Skilled 46 45 1 2% 44Semi-skilled 19 19 0 0% 16Unskilled 8 8 0 0% 7TOTAL 125 119 6 4.8% 114
36 SADPMRANNUALREPORT2013/2014
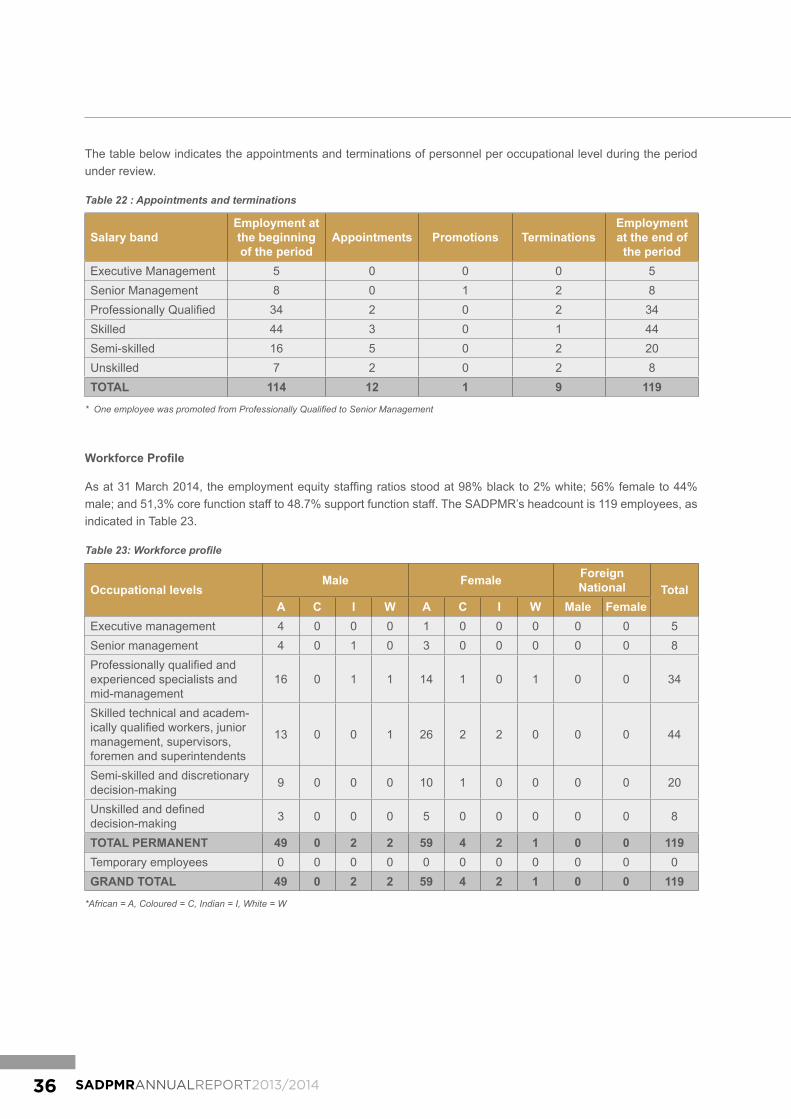
The table below indicates the appointments and terminations of personnel per occupational level during the period under review.
Table 22 : Appointments and terminations
Salary bandEmployment at the beginning of the period
Appointments Promotions TerminationsEmployment at the end of the period
Executive Management 5 0 0 0 5Senior Management 8 0 1 2 8Professionally Qualified 34 2 0 2 34Skilled 44 3 0 1 44Semi-skilled 16 5 0 2 20Unskilled 7 2 0 2 8TOTAL 114 12 1 9 119
* One employee was promoted from Professionally Qualified to Senior Management
WorkforceProfile
As at 31 March 2014, the employment equity staffing ratios stood at 98% black to 2% white; 56% female to 44% male; and 51,3% core function staff to 48.7% support function staff. The SADPMR’s headcount is 119 employees, as indicated in Table 23.
Table 23: Workforce profile
Occupational levelsMale Female Foreign
National TotalA C I W A C I W Male Female
Executive management 4 0 0 0 1 0 0 0 0 0 5Senior management 4 0 1 0 3 0 0 0 0 0 8Professionally qualified and experienced specialists and mid-management
16 0 1 1 14 1 0 1 0 0 34
Skilled technical and academ-ically qualified workers, junior management, supervisors, foremen and superintendents
13 0 0 1 26 2 2 0 0 0 44
Semi-skilled and discretionary decision-making 9 0 0 0 10 1 0 0 0 0 20
Unskilled and defined decision-making 3 0 0 0 5 0 0 0 0 0 8
TOTAL PERMANENT 49 0 2 2 59 4 2 1 0 0 119Temporary employees 0 0 0 0 0 0 0 0 0 0 0GRAND TOTAL 49 0 2 2 59 4 2 1 0 0 119
*African = A, Coloured = C, Indian = I, White = W

37SADPMRANNUALREPORT2013/2014
Equity Targets and Employment Equity Status
Tables 24, 25 and 26 below indicate employment equity and targets during the period under review. The information is presented in terms of three categories, namely male, female and disability.
Table 24: Current status and planned targets (male employees)
LevelsMale
African Coloured Indian WhiteCurrent Target Current Target Current Target Current Target
Executive Management 4 0 0 0 0 0 0 0Senior Management 4 0 0 0 1 0 0 0Professionally Qualified 16 1 0 1 1 0 1 0Skilled 13 1 0 1 0 0 1 0Semi-skilled 9 0 0 0 0 0 0 0Unskilled 3 0 0 0 0 0 0 0TOTAL 49 2 0 2 2 0 2 0
Table 25: Current status and planned targets (female employees)
LevelsFemale
African Coloured Indian WhiteCurrent Target Current Target Current Target Current Target
Executive Management 1 0 0 0 0 0 0 0Senior Management 3 0 0 0 0 0 0 0Professionally Qualified 14 1 1 0 0 0 1 0Skilled 26 0 2 0 2 0 0 0Semi-skilled 10 0 1 0 0 0 0 0Unskilled 5 0 0 0 0 0 0 0TOTAL 59 1 4 0 2 0 1 0
Table 26: Current and targets: Employees with disabilities
LevelsEmployees with Disabilities
Male FemaleCurrent Target Current Target
Executive Management 0 0 0 0Senior Management 0 0 0 0Professionally Qualified 0 0 0 0Skilled 0 1 0 1Semi-skilled 0 0 0 0Unskilled 0 0 0 0TOTAL 0 1 0 1

38 SADPMRANNUALREPORT2013/2014
Labour Relations: Misconduct and Disciplinary Action
The table below provides basic information on labour relations management during the period under review. All disci-plinary and grievance cases were finalised within the reporting period.
Table 27: Labour relations - Misconduct and disciplinary action
Nature of disciplinary actions NumberVerbal warning 2Written warning 4Final written warning 2Dismissal 0TOTAL 8
Staff Turnover
During the period under review, 9 employees left the organisation due to various reasons as reflected in the table below.
Table 28: Staff turnover
Reason Number % of total number of staff leavingDeath 2 20%Resignation 4 40%Dismissal 0 0%Retirement 1 10%Ill health 2 20%Expiry of contract 0 0%Other 0 0%TOTAL 9 100%

39SADPMRANNUALREPORT2013/2014
PART DCORPORATE GOVERNANCE
40 SADPMRANNUALREPORT2013/2014
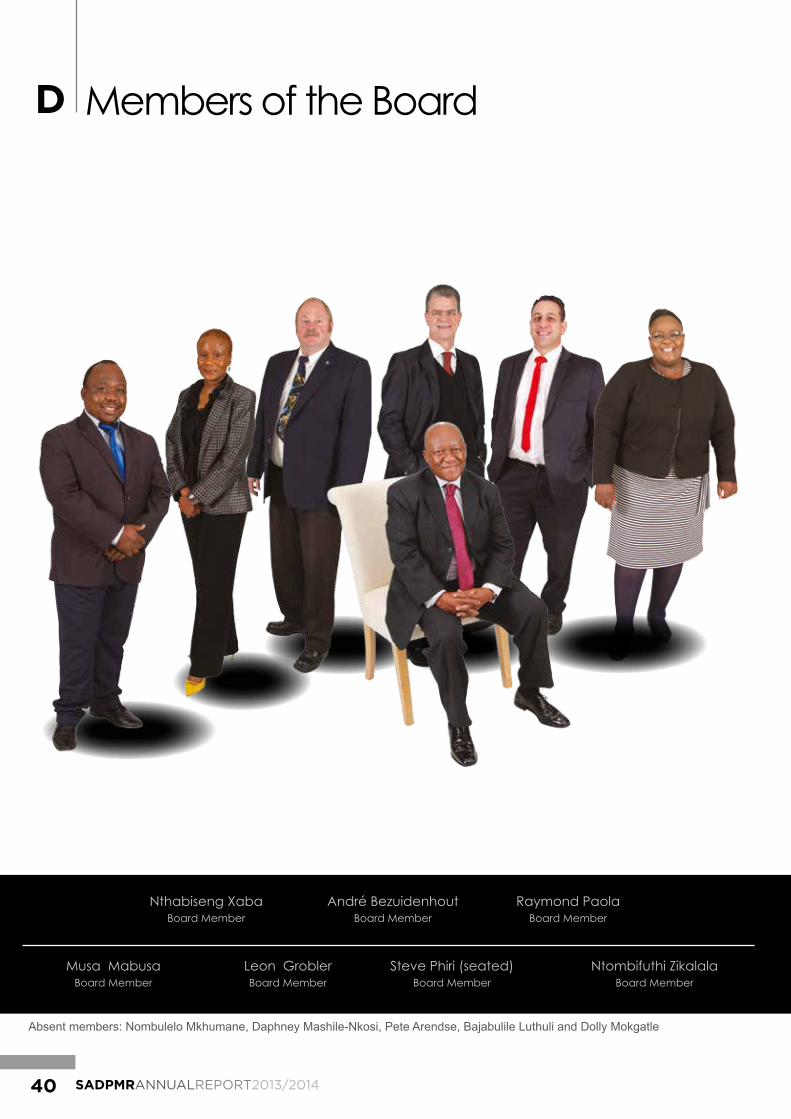
Leon GroblerBoard Member
D Members of the Board
Nthabiseng XabaBoard Member
Musa MabusaBoard Member
Ntombifuthi ZikalalaBoard Member
Raymond PaolaBoard Member
Steve Phiri (seated)Board Member
André BezuidenhoutBoard Member
Absent members: Nombulelo Mkhumane, Daphney Mashile-Nkosi, Pete Arendse, Bajabulile Luthuli and Dolly Mokgatle
41SADPMRANNUALREPORT2013/2014
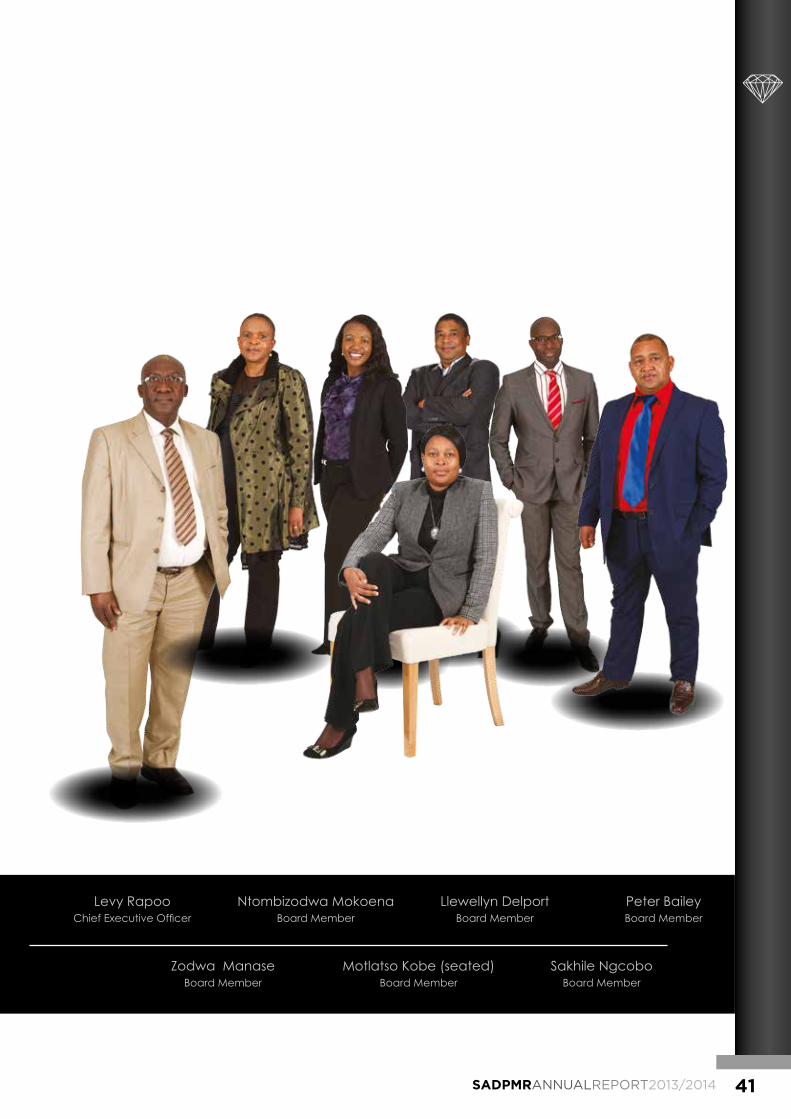
Levy RapooChief Executive Officer
Zodwa ManaseBoard Member
Ntombizodwa MokoenaBoard Member
Sakhile NgcoboBoard Member
Peter BaileyBoard Member
Motlatso Kobe (seated)Board Member
Llewellyn DelportBoard Member
42 SADPMRANNUALREPORT2013/2014
Corporate Governance DCorporate governance plays an integral part in directing the activities of the SADPMR, as well as with regard to its processes and systems. Corporate governance at SADPMR is governed by legislative requirements of the Diamond Act of 1986, as amended, the Companies Act, 2008 (Act No. 71 of 2008), as well as the PFMA, together with the Protocol on Corporate Governance, which encapsulates the principles contained in the King III Report on Corporate Governance.
Portfolio Committees
During the period under review, the SADPMR briefed the Mineral Resources Parliamentary Portfolio Committee (PPC) on its Strategic Plan, as well as on the Annual Performance Plan for 2013/2014. The PPC was also briefed on the Annual Report for the 2012/2013 financial year.
Executive Authority
During the period under review, the SADPMR submitted quarterly reports on performance information to the Execu-tive Authority, as well as financial results.
The following persons are the members of the Board:
1. Ms N Mkhumane (Chairperson)2. Mr S Phiri (Deputy Chairperson)3. Mr. L Rapoo (Chief Executive Officer)4. Mr L Delport5. Mr L Grobler6. Mr R Paola7. Mr P Arendse8. Ms N Mokoena (alternate from SAPS)9. Ms D Mokgatle10. Ms D Mashile-Nkosi11. Ms M Kobe12. Mr A Bezuidenhout (alternate from SARB)13. Mr P Bailey14. Ms N Xaba15. Ms B Luthuli (resigned: 1 November 2013)16. Mr S Ngcobo17. Mr M Mabuza (alternate from DMR)18. Ms. N Zikalala

43SADPMRANNUALREPORT2013/2014
Meetings and AttendanceBOARD MEETING
Chairperson: Ms N Mkhumane
Name 24 /04/2013 25/04/2013 23/05/2013 29/07/2013 20/08/2013 25/09/2013 22/10/2013 30/01/2014
N Mkhumane Yes Yes Yes Yes Yes Yes Yes YesS Phiri No No No Yes No Yes No YesGL Rapoo Yes Yes Yes No Yes Yes Yes YesL Delport Yes Yes Yes No Yes Yes Yes YesL Grobler Yes Yes Yes Yes No Yes Yes YesB Luthuli* No No No No No No No NoM Mabuza ** No No No No No No No NoR Paola Yes Yes Yes Yes Yes Yes Yes YesF Zikalala Yes Yes No Yes No Yes No YesN Xaba Yes Yes Yes Yes Yes No Yes YesS Ngcobo Yes Yes Yes Yes Yes Yes No NoP Bailey Yes Yes No Yes Yes Yes No YesA Bezuidenhout*** Yes Yes Yes Yes No Yes Yes YesD Mashile-Nkosi No Yes No No No No Yes NoP Arendse No No No No No No No NoM Kobe Yes Yes Yes Yes No No No YesN Mokoena**** Yes Yes Yes Yes No No Yes Yes
* Ms B Luthuli resigned from the Board of SADPMR (01 November 2013)** Alternate member from DMR*** Alternate member from SARB**** Alternate member from SAPS
Executive CommitteeChairperson: Ms N Mkhumane
Name 24/04/2013 29/07/2013 25/09/2013 22/10/2013 30/01/2014N Mkhumane Yes Yes Yes Yes YesS Phiri No Yes Yes No YesGL Rapoo Yes No Yes Yes YesS Ngcobo No No Yes No NoL Delport Yes No Yes Yes YesF Zikalala Yes Yes Yes No YesL Grobler Yes Yes Yes Yes YesR Paola Yes Yes Yes Yes YesP Bailey n/a n/a n/a Yes n/a
Technical CommitteeChairperson: Mr L Grobler
Names 02/04/2013 10/07/2013 17/07/2013 08/10/2013 15/01/2014L Grobler Yes Yes Yes Yes YesL Rapoo No Yes Yes Yes YesN Xaba Yes Yes Yes Yes YesD Mashile-Nkosi No No No No NoS Ngcobo Yes Yes Yes No NoM Kobe No No No No NoN Mokoena No No No No Yes

44 SADPMRANNUALREPORT2013/2014
Internal Audit and Audit Committees
Key Activities and Objectives of the Audit Committee
(a) Key Activities
• Review of financial statements for completeness, accuracy and to ensure that they comply with disclosure re-quirements.
Remuneration, Social and Ethics CommitteeChairperson: Mr S Ngcobo
Names 13/06/2013 14/08/2013 04/09/2013 16/01/2014S Ngcobo Yes Yes Yes YesL Rapoo Yes Yes Yes NoP Bailey Yes Yes Yes YesD Mashile-Nkosi Yes No No NoM Kobe No Yes Yes Yes
Finance CommitteeChairperson: Mr L Delport
Name 16/04/2013 16/05/2013 18/07/2013 18/09/2013 16/10/2013 17/01/2014L Delport Yes Yes Yes Yes Yes YesGL Rapoo No Yes Yes Yes Yes YesR Paola Yes Yes No Yes No YesN Xaba Yes Yes Yes Yes Yes YesA Bezuidenhout Yes No Yes Yes No NoB Luthuli No Yes Yes No No NoL Grobler n/a n/a n/a n/a Yes n/a
Licensing CommitteeChairperson: Ms N Zikalala
Name 13/06/2013 04/09/2013 03/10/2013 15/01/2014N Zikalala Yes Yes Yes YesGL Rapoo Yes Yes Yes YesN Mokoena Yes Yes Yes YesP Bailey Yes Yes Yes YesM Kobe No Yes No No
Audit and Risk CommitteeChairperson: Mr R Paola
Name 16/05/2013 24/07/2013 18/09/2013 16/10/2013 17/01/2014R Paola Yes Yes Yes No No L Rapoo Yes Yes Yes Yes Yes L Grobler Yes No Yes Yes Yes N Xaba Yes Yes Yes Yes Yes B Luthuli Yes Yes No No No L Delport n/a n/a n/a Yes Yes
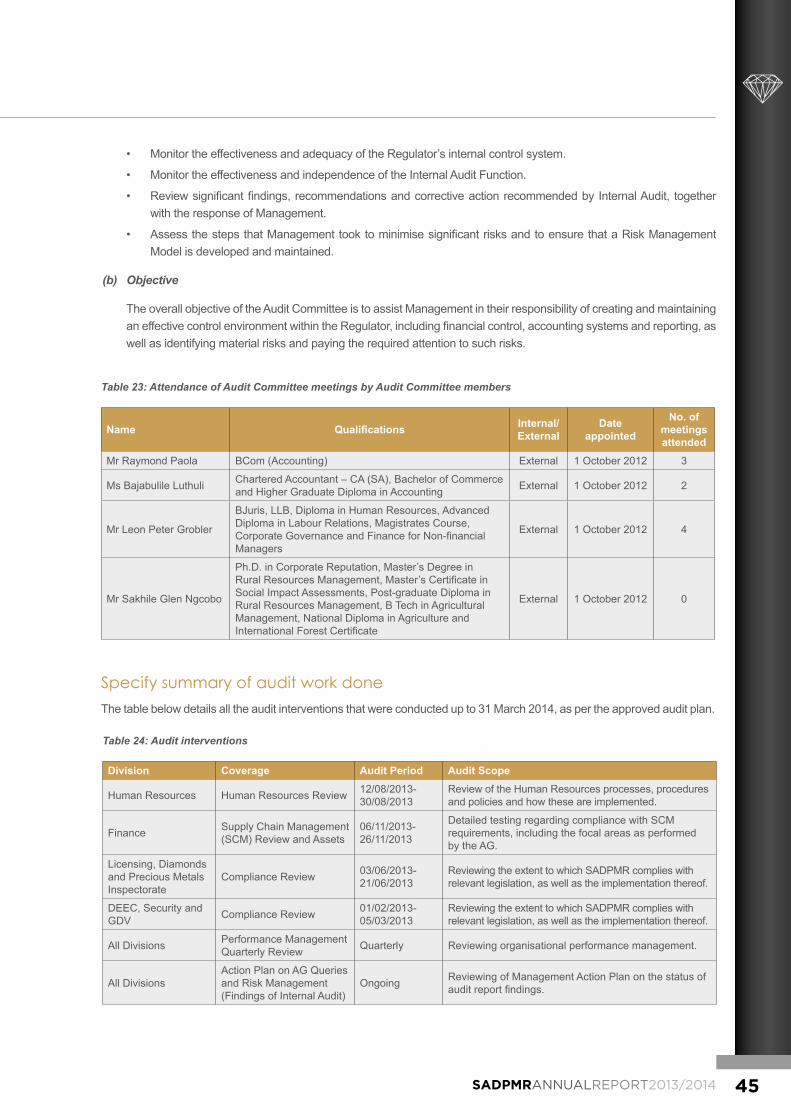
45SADPMRANNUALREPORT2013/2014
Table 23: Attendance of Audit Committee meetings by Audit Committee members
Name Qualifications Internal/ External
Date appointed
No. of meetings attended
Mr Raymond Paola BCom (Accounting) External 1 October 2012 3
Ms Bajabulile Luthuli Chartered Accountant – CA (SA), Bachelor of Commerce and Higher Graduate Diploma in Accounting External 1 October 2012 2
Mr Leon Peter Grobler
BJuris, LLB, Diploma in Human Resources, Advanced Diploma in Labour Relations, Magistrates Course, Corporate Governance and Finance for Non-financial Managers
External 1 October 2012 4
Mr Sakhile Glen Ngcobo
Ph.D. in Corporate Reputation, Master’s Degree in Rural Resources Management, Master’s Certificate in Social Impact Assessments, Post-graduate Diploma in Rural Resources Management, B Tech in Agricultural Management, National Diploma in Agriculture and International Forest Certificate
External 1 October 2012 0
Specify summary of audit work doneThe table below details all the audit interventions that were conducted up to 31 March 2014, as per the approved audit plan.
• Monitor the effectiveness and adequacy of the Regulator’s internal control system.
• Monitor the effectiveness and independence of the Internal Audit Function.
• Review significant findings, recommendations and corrective action recommended by Internal Audit, together with the response of Management.
• Assess the steps that Management took to minimise significant risks and to ensure that a Risk Management Model is developed and maintained.
(b) Objective
The overall objective of the Audit Committee is to assist Management in their responsibility of creating and maintaining an effective control environment within the Regulator, including financial control, accounting systems and reporting, as well as identifying material risks and paying the required attention to such risks.
Table 24: Audit interventions
Division Coverage Audit Period Audit Scope
Human Resources Human Resources Review 12/08/2013-30/08/2013
Review of the Human Resources processes, procedures and policies and how these are implemented.
Finance Supply Chain Management (SCM) Review and Assets
06/11/2013-26/11/2013
Detailed testing regarding compliance with SCM requirements, including the focal areas as performed by the AG.
Licensing, Diamonds and Precious Metals Inspectorate
Compliance Review 03/06/2013-21/06/2013
Reviewing the extent to which SADPMR complies with relevant legislation, as well as the implementation thereof.
DEEC, Security and GDV Compliance Review 01/02/2013-
05/03/2013Reviewing the extent to which SADPMR complies with relevant legislation, as well as the implementation thereof.
All Divisions Performance Management Quarterly Review Quarterly Reviewing organisational performance management.
All DivisionsAction Plan on AG Queries and Risk Management (Findings of Internal Audit)
Ongoing Reviewing of Management Action Plan on the status of audit report findings.

46 SADPMRANNUALREPORT2013/2014
Risk ManagementThe Board has the overall responsibility to ensure that the SADPMR has in place, and maintains effective, efficient and transparent systems of risk management and internal control. The Board’s Audit and Risk Committee has an oversight role that is independent and objective in this regard. Furthermore, the Risk Steering Committee, which comprises the SADPMR Senior Management, has the responsibility to ensure the adequacy and effectiveness of risk management and internal control systems.
The Risk Steering Committee continually reviews the risk management process, internal controls and significant risks facing the organisation and reports quarterly to the Audit and Risk Committee.
Fraud and Corruption
The SADPMR aligned itself with government’s initiative to fight corruption, and it is allowed to use the services of the National Anti-Corruption Hotline (NACH). The NACH is an initiative arising out of the South African Government’s National Anti-Corruption Strategy, in order to combat and prevent corruption. Awareness amongst employees was raised through workshops which were held during the period under review.
Employees are continuously encouraged to use the NACH Number, which is 0800 701 701, to report any acts or intentions to commit acts of corruption, relating to the diamond and precious metals industries. This may also be any act relating to SADPMR’s employees, services, clients and stakeholders. In this regard, clients and employees of SADPMR may make anonymous calls to the NACH Number, which is managed by the Office of the Public Service Commission.
MinimisingConflictofInterests
The SADPMR has transparent and effective procedures for identifying, disclosing and managing conflict of interests, which reduce the opportunity for corruption or improper conduct in the Organisation.
On an annual basis, members of the Board are requested to complete and submit a disclosure form, which indicates their other interests, as well as potential areas of conflict, if any. Members are requested on a regular basis to disclose any conflict of interests during Board and Committee meetings, prior to the commencement of the meeting.
SADPMR employees are also required to complete financial disclosure and private interest forms on an annual basis.
Code of Conduct
The SADPMR adopted a Code of Conduct that requires employees to conduct themselves with integrity, openness, ac-countability and transparency when dealing with stakeholders. The SADPMR is committed to principles and practices that provide stakeholders with the assurance that the Organisation is managed soundly and ethically.

47SADPMRANNUALREPORT2013/2014
PART EFINANCIAL INFORMATION
Accounting Authority’s Responsibilities and Approval 48
Report of the Audit Committee 49
Report of the Auditor-General 51
General Information 53
Statement of Financial Position 54
Statement of Financial Performance 55
Statement of Changes in Net Assets 56
Statement of Cash Flow 57
Accounting Policies 58
Notes to the Annual Financial Statements 64
Detailed Budget Statement 79
48 SADPMRANNUALREPORT2013/2014
The members of the Board are required by the Public Finance Management Act (Act 1 of 1999), as amended, to maintain adequate accounting records and is responsible for the content and integrity of the annual financial statements and related financial information included in this report. It is the responsibility of the accounting authority to ensure that the annual financial statements fairly present the state of affairs of the entity as at the end of the financial year and the results of its operations and cash flows for the period then ended. The external auditors are engaged to express an independent opinion on the Annual Financial Statements and were given unrestricted access to all financial records and related data.
The annual financial statements have been prepared in accordance with Standards of Generally Recognised Accounting Practice (GRAP).
The Annual Financial Statements are based upon appropriate accounting policies consistently applied and support-ed by reasonable and prudent judgements and estimates.
The members of the Board acknowledge that they are ultimately responsible for the system of internal financial control established by the entity and place considerable importance on maintaining a strong control environment. To enable the members to meet these responsibilities, the accounting authority sets standards for internal control aimed at reducing the risk of error or deficit in a cost effective manner. The standards include the proper delegation of re-sponsibilities within a clearly defined framework, effective accounting procedures and adequate segregation of duties to ensure an acceptable level of risk. These controls are monitored throughout the entity and all employees are required to maintain the highest ethical standards in ensuring the entity’s business is conducted in a manner that in all reasonable circumstances is above reproach. The focus of risk management in the entity is on identifying, assessing, managing and monitoring all known forms of risk across the entity. While operating risk cannot be fully eliminated, the entity endeavours to minimise it by ensuring that appropriate infrastructure, controls, systems and ethical behaviour are applied and managed within predetermined procedures and constraints.
The members of the Board are of the opinion, based on the information and explanations given by management, that the system of internal control provides reasonable assurance that the financial records may be relied on for the preparation of the Annual Financial Statements. However, any system of internal financial control can provide only reasonable, and not absolute, assurance against material misstatement or deficit.
The members of the Board have reviewed the entity’s cash flow forecast for the year ending 31 March 2014 and in the light of this review and the current financial position, they are satisfied that the entity has or has access to adequate resources to continue in operational existence for the foreseeable future.
The Regulator is dependent on Government grants, License, Penalties and Service Fees for continued funding of its operations. The Annual Financial Statements are prepared on the basis that the Regulator is a going concern and has neither the intention nor the need to liquidate or curtail materially the scale of the entity. Although the members of the Board are primarily responsible for the financial affairs of the entity, it is supported by the entity’s internal auditors.
The Auditor-General of South Africa is responsible for independently reviewing and reporting on the entity’s Annual Financial Statements. The Annual Financial Statements have been examined by the Auditor-General of South Africa.
The Annual Financial Statements set out on pages 54 to 80, which have been prepared on the going concern basis, were approved by the accounting authority on 28 May 2014 and were signed on its behalf by:
Accounting Authority’s Responsibilities and ApprovalE
Mr L Rapoo Ms N MkhumaneChief Executive Officer Chairperson
49SADPMRANNUALREPORT2013/2014
We are pleased to present our report for the financial year ended 31 March 2014.
Audit Committee responsibility
The Audit Committee is a committee of the Board and has discharged its responsibilities accordingly in terms of section 51 (1) a (ii) of the PFMA and 27.1.8 of the Treasury Regulations. The Audit Committee adopted a formal terms of ref-erence, its audit committee charter, and has regulated its affairs in compliance with the charter and has discharged its responsibilities contained therein.
Effectiveness of internal control
During the year various reports of the Internal Auditors, as well as the Audit Report on the Annual Financial Statements and management Letter of the Auditor-General indicated that the system of internal control has shortcomings in limited areas. The Audit Committee has noted these and based on the outcome of such reviews and the information provided by Management, the Audit Committee is of the opinion that the internal controls of the Regulator operated effectively throughout the year under review.
The Audit Committee is also of the view that progress has been made with respect to the control environment, especially in view of the fact that the regulator has achieved its third successive unqualified audit report.
Risk Management and governance
A risk management framework and policy has been adopted and approved by the Board. A process of risk management was implemented by the Regulator wherein risk assessments are conducted on a quarterly basis by management and updated on an annual basis by the internal audit function at both senior management and Board level.
During the year the Regulator adopted and approved various policies and procedures to strengthen the control en-vironment.
Monthly and quarterly performance information
The Audit Committee is satisfied with the content and quality of monthly and quarterly reports prepared and issued by the regulator to the Executive Authority during the year under review.
Internal Audit
The Audit Committee reviewed the activities of the internal audit function and has concluded the following:
• The function is effective and that there were no unjustified restrictions or limitations; and• The internal audit reports were reviewed at Audit Committee meetings, including its annual work programme, co-or-
dination with the external auditors, the reports of significant audit investigations and the responses of management to issues raised therein.
EReport of the Audit Committee
50 SADPMRANNUALREPORT2013/2014
EvaluationofAnnualFinancialStatementsfor2013/14financialyear
The Audit Committee has:
• Reviewed and discussed with the Auditor-General and the Accounting Authority the audited annual financial state-ments to be included in the annual Report;
• Reviewed the Auditor-General’s audit report, the Management Letter and Management’s responses thereto; and• Reviewed the significant adjustments resulting from the audit.
The Audit Committee concurs and accepts the conclusions of the Auditor-General on the Annual Financial Statements and is of the opinion that the audited financial statements be accepted and read together with the report of the Audi-tor-General and the Accounting Authority’s Report. The Audit Committee agrees that the adoption of the going concern premise is appropriate in preparing the Annual Financial Statements.
Raymond PaolaChairperson of the Audit Committee

51SADPMRANNUALREPORT2013/2014
Report of the Auditor-GeneralReport on the financial statementsIntroduction1. I have audited the financial statements of the South African Diamond and Precious Metals Regulator (SADPMR)
set out on pages 54 to 80 which comprise statement of financial position as at 31 March 2014, the statement of financial performance, statement of changes in net assets, and cash flow statement and detailed budget statement for the year then ended, as well as the notes, comprising a summary of significant accounting policies and other explanatory information.
AccountingAuthority’sresponsibilityforthefinancialstatements2. The Accounting Authority is responsible for the preparation and fair presentation of these financial statements in
accordance with Generally Recognised Accounting Principles (SA Standards of GRAP) and the requirements of the Public Finance Management Act of South Africa, 1999 (Act No. 1 of 1999), and for such internal control as the Accounting Authority, other determines is necessary to enable the preparation of financial statements that are free from material misstatement, whether due to fraud or error.
Auditor-General’s responsibility3. My responsibility is to express an opinion on these financial statements based on my audit. I conducted my audit in
accordance with the Public Audit Act of South Africa, 2004 (Act No. 25 of 2004) (PAA), the general notice issued in terms thereof and International Standards on Auditing. Those standards require that I comply with ethical require-ments, and plan and perform the audit to obtain reasonable assurance about whether the financial statements are free from material misstatement.
4. An audit involves performing procedures to obtain audit evidence about the amounts and disclosures in the financial statements. The procedures selected depend on the auditor’s judgement, including the assessment of the risks of material misstatement of the financial statements, whether due to fraud or error. In making those risk assessments, the auditor considers internal control relevant to the entity’s preparation and fair presentation of the financial state-ments in order to design audit procedures that are appropriate in the circumstances, but not for the purpose of expressing an opinion on the effectiveness of the entity’s internal control. An audit also includes evaluating the ap-propriateness of accounting policies used and the reasonableness of accounting estimates made by management, as well as evaluating the overall presentation of the financial statements.
Opinion 5. In my opinion, the financial statements present fairly, in all material respects, the financial position of the SADPMR
as at 31 March 2014 and its financial performance and cash flows for the year then ended, in accordance with SA Standards of GRAP and the requirements of the PFMA.
Emphasis of matter 6. My opinion is not modified in respect of this matter.
Restatementofcorrespondingfigures7. As disclosed in note 27 to the financial statements, the corresponding figures for 31 March 2013 have been restated
as a result of an error discovered during 31 March 2014 in the financial statements of the SADPMR at, and for the year ended, 31 March 2013.
Report on other legal and regulatory requirements8. In accordance with the PAA and the general notice issued in terms thereof, I report the following findings on the
reported performance information against predetermined objectives for selected programmes presented in the an-nual performance report, non-compliance with legislation as well as internal control. The objective of my tests was to identify reportable findings as described under each subheading but not to gather evidence to express assurance on these matters. Accordingly, I do not express an opinion or conclusion on these matters.
Predetermined objectives9. I performed procedures to obtain evidence about the usefulness and reliability of the reported performance informa-
tion for the following selected programmes presented in the annual performance report of the Public Entity for the year ended 31 March 2014:
E

52 SADPMRANNUALREPORT2013/2014
• Programme 1: Diamond Trade on page 13.• Programme 2: Regulatory compliance on page 14.
10. I evaluated the reported performance information against the overall criteria of usefulness and reliability. 11. I evaluated the usefulness of the reported performance information to determine whether it was presented in ac-
cordance with the National Treasury’s annual reporting principles and whether the reported performance was con-sistent with the planned programmes. I further performed tests to determine whether indicators and targets were well defined, verifiable, specific, measurable, time bound and relevant, as required by the National Treasury’s Framework for managing programme performance information (FMPPI).
12. I assessed the reliability of the reported performance information to determine whether it was valid, accurate and complete.
13. I did not raise any material findings on the usefulness and reliability of the reported performance information for the selected objectives.
Additional matter 14. Although I raised no material findings on the usefulness and reliability of the reported performance information for
the selected objectives, I draw attention to the following matter:
Achievement of planned targets15. Refer to the annual performance report on pages 13 to 15 for information on the achievement of the planned targets
for the year.
Compliance with legislation16. I performed procedures to obtain evidence that the Public Entity had complied with applicable legislation regarding
financial matters, financial management and other related matters. My findings on material non-compliance with specific matters in key legislation, as set out in the general notice issued in terms of the PAA, are as follows.
Annualfinancialstatements,performanceandannualreports17. The financial statements submitted for auditing were not prepared in all material respects in accordance with the
requirements of section 55(1)(a) of the PFMA. Material misstatements of non-current assets, current assets and liabilities identified by auditors in the submitted financial statements were subsequently corrected, resulting in the financial statements receiving an unqualified audit opinion.
Internal control18. I considered internal control relevant to my audit of the financial statements, predetermined objectives report and
compliance with legislation. The matters reported below are limited to the significant internal control deficiencies that resulted in the findings on the non-compliance with legislation included in this report.
Financial and performance managementRegular,accurateandcompletefinancialandperformancereport19. Management did not prepare regular, accurate and complete financial reports as the financial statements contained
numerous misstatements that were subsequently corrected.
Other reportsInvestigations20. An investigation is pursued in response to the information received from the National Anti-corruption Hotline (NACH)
regarding the employees alleged to have been involved in corrupt activities.21. Investigation with respect to an employee who is alleged to have leaked confidential client information to the public.
Pretoria31 July 2014
53SADPMRANNUALREPORT2013/2014
General InformationCOUNTRY OF INCORPORATION
Republic of South Africa
LEGAL FORM OF ENTITY
Schedule 3A entity listed in terms of the Public Finance Management Amendment Act, 1999 (Act No. 29 of 1999).
NATURE OF BUSINESS AND PRINCIPAL ACTIVITIES
Regulating control over the possession, the purchase and sale of diamonds, the processing and the export of dia-monds and implementing, administering and controlling all matters relating to acquisition, possession, melting, refin-ing, fabrication, use and disposal of precious metals.
MEMBERS OF THE ACCOUNTING AUTHORITY
N Mkhumane ChairpersonS Phiri Deputy ChairpersonG L Rapoo Chief Executive OfficerR Paola Member S Ngcobo Member P Bailey Member L Delport Member P Arendse Member A Bezuidenhout Member L Grobler Member M Mabuza Member N Xaba Member D Mashile-Nkosi Member B Luthuli Member M Kobe Member F Zikalala Member N Mokoena Member
BUSINESS ADDRESS POSTAL ADDRESS251 Fox StreetJewel CityJohannesburg 2001
PO Box 16001Jewel CityDoornfontein2028
BANKERS Nedbank
AUDITORS The Auditor-General of South Africa
E

54 SADPMRANNUALREPORT2013/2014
Statement of Financial Position
Note(s)
2014R
2013R
Restated
AssetsNon-current AssetsProperty, plant and equipment 3 9,630,922 9,787,528Intangible assets 4 2,099,028 1,269,493Total Non-Current Assets 11,729,950 11,057,021
Current AssetsInventory 5 636,375 298,325Receivables from exchange transactions 6 2,804,701 2,323,128Financial instruments at fair value 13 23,264,363 38,425,732Operating lease asset 35,409 -Cash and cash equivalents 7 18,317,325 12,950,601Total Current Assets 45,058,173 53,997,786Total Assets 56,788,123 65,054,807
Net Assets and LiabilitiesAccumulated surplus 48,871,509 53,696,927
48,871,509 53,696,927
Non-current LiabilitiesFinance lease obligations 8 115,952 -
Current LiabilitiesPayables from exchange transactions 10 5,481,423 8,597,088Provisions 11 2,006,000 2,600,000Current portion of finance lease obligations 8 81,810 118,153Deferred income 15 151,637 257Operating lease liability 79,793 42,382Total Current Liabilities 7,800,663 11,357,880Total Net Assets and Liabilities 56,788,124 65,054,807
as at 31 March 2014
E

55SADPMRANNUALREPORT2013/2014
Statement of Financial Perfornmancefor the year ended 31 March 2014
Note(s)
2014R
2013R
Restated
Operating revenueLevy income, license, penalty and service fees 33,425,943 25,284,833Interest received - investment 2,373,403 2,776,854Other income 14 651,477 591,184Revenue from non exchange transactionsTransfer payment (Grant) 44,824,000 41,601,000Total operating revenue 81,274,823 70,253,871
ExpenditureFinance costs 28,661 62,912Debt impairment 521,734 327,422Employee costs 18 54,859,523 48,705,916Depreciation and amortisation 3,888,873 4,044,152Other operating expenses 17 26,599,406 19,173,661Total expenditure 85,898,197 72,314,063
Surplus/(Deficit) on disposal of assets (179,640) (8,736)Fair value adjustments - Financial instruments at fair value (22,404) (28,678)Total other revenue and expenditure (202,044) (37,414)Deficitfortheyear (4,825,418) (2,097,606)
E
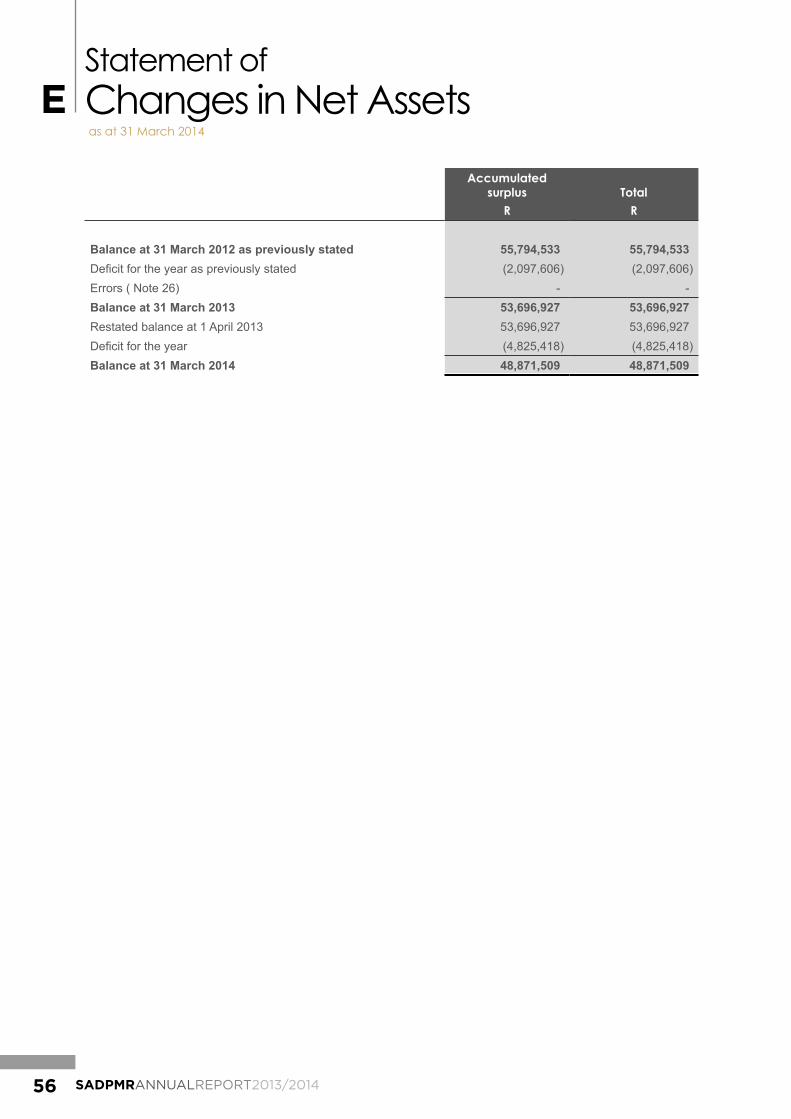
56 SADPMRANNUALREPORT2013/2014
Statement of Changes in Net Assets
Accumulated surplus
RTotal
R
Balance at 31 March 2012 as previously stated 55,794,533 55,794,533Deficit for the year as previously stated (2,097,606) (2,097,606)Errors ( Note 26) - -Balance at 31 March 2013 53,696,927 53,696,927Restated balance at 1 April 2013 53,696,927 53,696,927Deficit for the year (4,825,418) (4,825,418)Balance at 31 March 2014 48,871,509 48,871,509
as at 31 March 2014
E
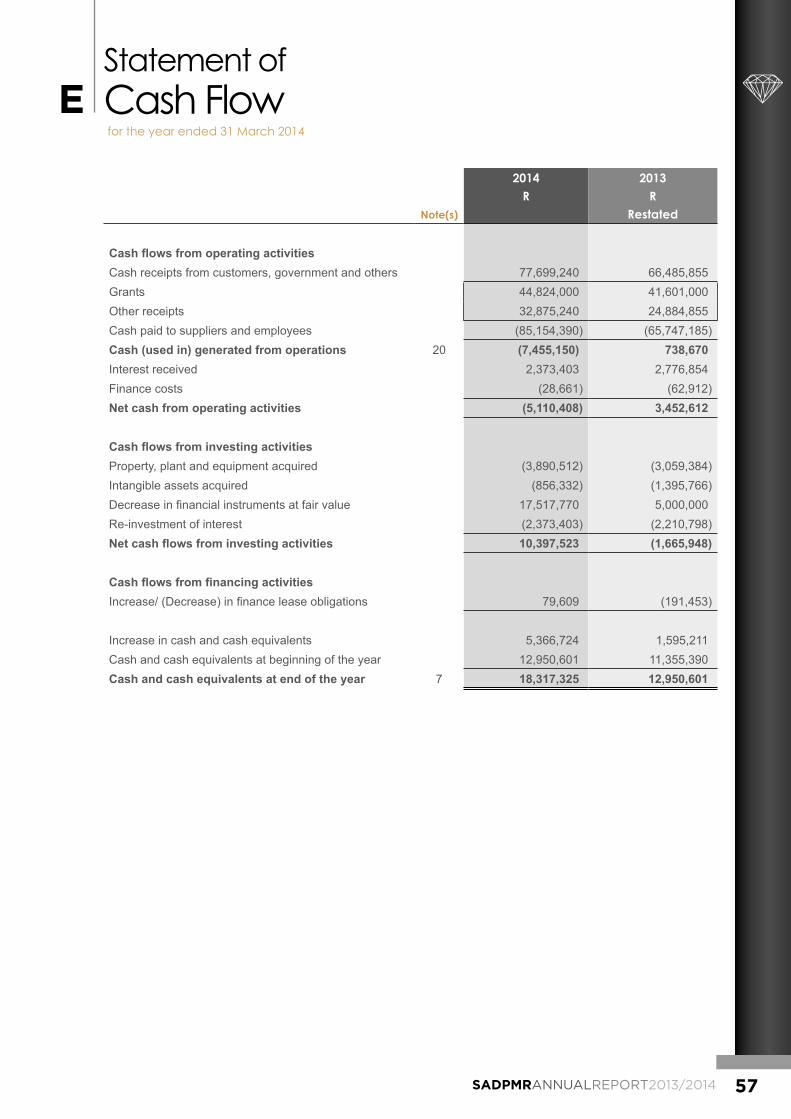
57SADPMRANNUALREPORT2013/2014
Statement of Cash Flowfor the year ended 31 March 2014
Note(s)
2014R
2013R
Restated
CashflowsfromoperatingactivitiesCash receipts from customers, government and others 77,699,240 66,485,855Grants 44,824,000 41,601,000Other receipts 32,875,240 24,884,855Cash paid to suppliers and employees (85,154,390) (65,747,185)Cash (used in) generated from operations 20 (7,455,150) 738,670Interest received 2,373,403 2,776,854Finance costs (28,661) (62,912)Net cash from operating activities (5,110,408) 3,452,612
CashflowsfrominvestingactivitiesProperty, plant and equipment acquired (3,890,512) (3,059,384)Intangible assets acquired (856,332) (1,395,766)Decrease in financial instruments at fair value 17,517,770 5,000,000Re-investment of interest (2,373,403) (2,210,798)Netcashflowsfrominvestingactivities 10,397,523 (1,665,948)
CashflowsfromfinancingactivitiesIncrease/ (Decrease) in finance lease obligations 79,609 (191,453)
Increase in cash and cash equivalents 5,366,724 1,595,211Cash and cash equivalents at beginning of the year 12,950,601 11,355,390Cash and cash equivalents at end of the year 7 18,317,325 12,950,601
E

58 SADPMRANNUALREPORT2013/2014
Accounting Policiesfor the year ended 31 March 2014
1. Basis of preparation
The following are the principal accounting policies of the Regulator which are, in all material respects, consistent with those applied in the previous year. The historical cost convention has been used, except where indicated otherwise.
Management has used assessments and estimates in preparing the annual financial statements – these are based on the best information available at the time of preparation. The financial statements have been prepared on a going concern basis.
2. Presentation of Annual Financial Statements
The financial statements have been prepared in accordance with the effective Standards of Generally Recognised Accounting Practices (GRAP) including any interpretations, guidelines and directives issued by the Accounting Stand-ards Board and the National Treasury.
All amounts have been presented in the currency of South African Rand, which is the functional currency of the Reg-ulator.
2.1 Revenue recognition
Revenue from exchange transactions
Revenue from the sale of diamond books and registers is recognised at the date of sale.
Revenue from licence fees is recognised upon receipt of application.
Revenue from service fees is recognised when services are completed and billed.
Revenue from non-exchange transactions
The transfer payment from the Department of Mineral Resources (DMR) is recognised as income over the periods necessary to match them with the related costs that they intended to compensate.
Interest received
Interest received is recognised on a time proportionate basis using the effective interest rate method.
2.2 Property, plant and equipment
Items of property, plant and equipment are stated at cost less accumulated depreciation and impairment losses. Depreciation is charged to surplus/deficit so as to write off the cost or valuation of assets over their estimated useful lives, using the straight-line method.
Useful lives and residual values are assessed on an annual basis.
The cost of an item of property, plant and equipment is the purchase price and other costs attributable to bring the as-set to the location and condition necessary for it to be capable of operating in the manner intended by management.
E
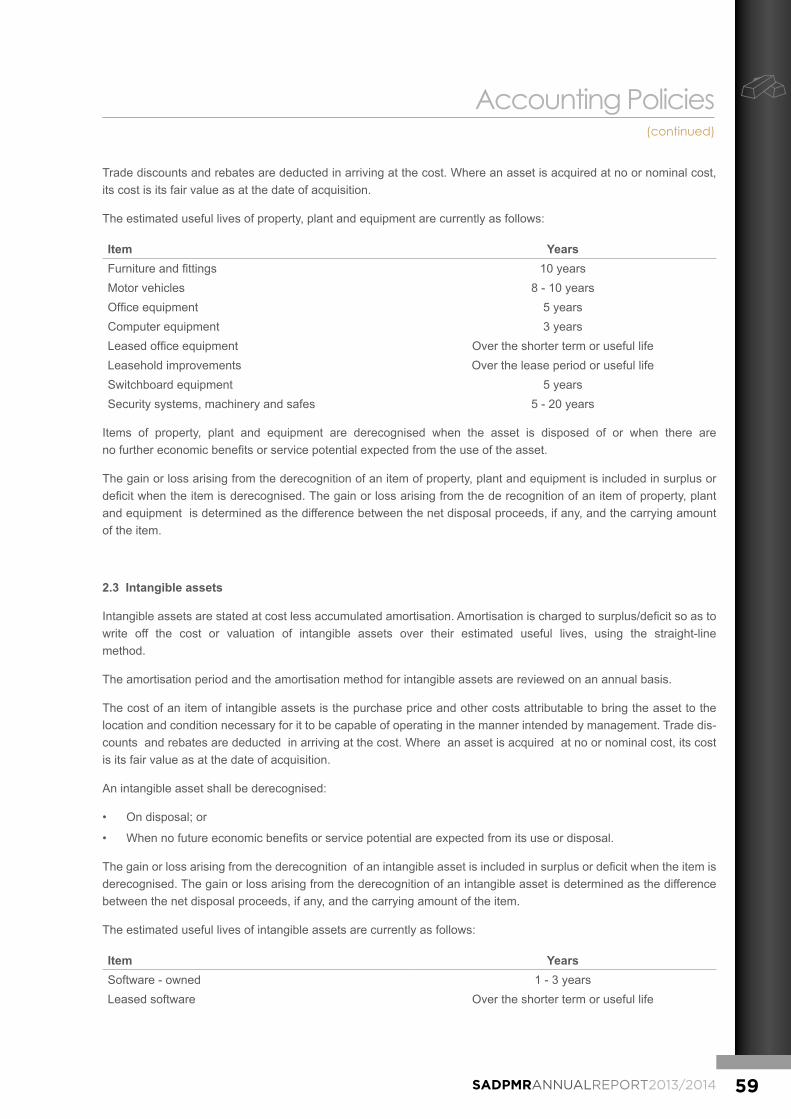
59SADPMRANNUALREPORT2013/2014
Trade discounts and rebates are deducted in arriving at the cost. Where an asset is acquired at no or nominal cost, its cost is its fair value as at the date of acquisition.
The estimated useful lives of property, plant and equipment are currently as follows:
Item Years Furniture and fittings 10 years Motor vehicles 8 - 10 years Office equipment 5 years Computer equipment 3 yearsLeased office equipment Over the shorter term or useful life Leasehold improvements Over the lease period or useful life Switchboard equipment 5 yearsSecurity systems, machinery and safes 5 - 20 years
Items of property, plant and equipment are derecognised when the asset is disposed of or when there are no further economic benefits or service potential expected from the use of the asset.
The gain or loss arising from the derecognition of an item of property, plant and equipment is included in surplus or deficit when the item is derecognised. The gain or loss arising from the de recognition of an item of property, plant and equipment is determined as the difference between the net disposal proceeds, if any, and the carrying amount of the item.
2.3 Intangible assets
Intangible assets are stated at cost less accumulated amortisation. Amortisation is charged to surplus/deficit so as to write off the cost or valuation of intangible assets over their estimated useful lives, using the straight-line method.
The amortisation period and the amortisation method for intangible assets are reviewed on an annual basis.
The cost of an item of intangible assets is the purchase price and other costs attributable to bring the asset to the location and condition necessary for it to be capable of operating in the manner intended by management. Trade dis-counts and rebates are deducted in arriving at the cost. Where an asset is acquired at no or nominal cost, its cost is its fair value as at the date of acquisition.
An intangible asset shall be derecognised:
• On disposal; or
• When no future economic benefits or service potential are expected from its use or disposal.
The gain or loss arising from the derecognition of an intangible asset is included in surplus or deficit when the item is derecognised. The gain or loss arising from the derecognition of an intangible asset is determined as the difference between the net disposal proceeds, if any, and the carrying amount of the item.
The estimated useful lives of intangible assets are currently as follows:
Item YearsSoftware - owned 1 - 3 yearsLeased software Over the shorter term or useful life
Accounting Policies (continued)

60 SADPMRANNUALREPORT2013/2014
2.4 Leases
Finance leases – lessee
Finance leases are recognised as assets in the statement of financial position at amounts equal to the fair value of the leased property or, if lower, the present value of the minimum lease payments. The corresponding liability to the lessor is included in the statement of financial position as a finance lease obligation.
The discount rate used in calculating the present value of the minimum lease payments is the interest rate implicit in the leases.
Minimum lease payments are apportioned between the finance charge and reduction of the outstanding liability. The finance charge is allocated to each period during the lease term so as to produce a constant periodic rate on the remaining balance of the liability.
Operating leases – lessee
Operating lease payments are recognised as an expense on a straight-line basis over the lease term. The difference between the amounts recognised as an expense and the contractual payments are recognised as an oper-ating lease asset or liability.
2.5 Provisions and contingencies
Provisions
Provisions are recognised when the Regulator has a present legal or constructive obligation as a result of past events, for which it is probable that an outflow of economic benefits or service potential will be required to settle the obligation, and a reliable estimate can be made of the obligation. All provisions of the Regulator are short-term in nature and thus ignore the effect of discounting.
Contingent liabilities
These are liabilities that will only become payable by the Regulator should some other event occur. Because the liability is not a real one for the Regulator (the actual amount of the liability may not have been established) until the occurrence of the other event it cannot be accounted for in the statement of financial position and so any con-tingent liabilities are listed in the notes to the financial statements.
2.6 Inventory
Inventories that qualify for recognition as assets shall initially be measured at cost. Inventories are measured at the lower of cost or current replacement cost. Where inventories are acquired at no cost, or for nominal consideration, their costs shall be fair value as at the date of acquisition.
Inventory consists of diamond books and registers held for resale. and consumables.
Accounting Policies(continued)
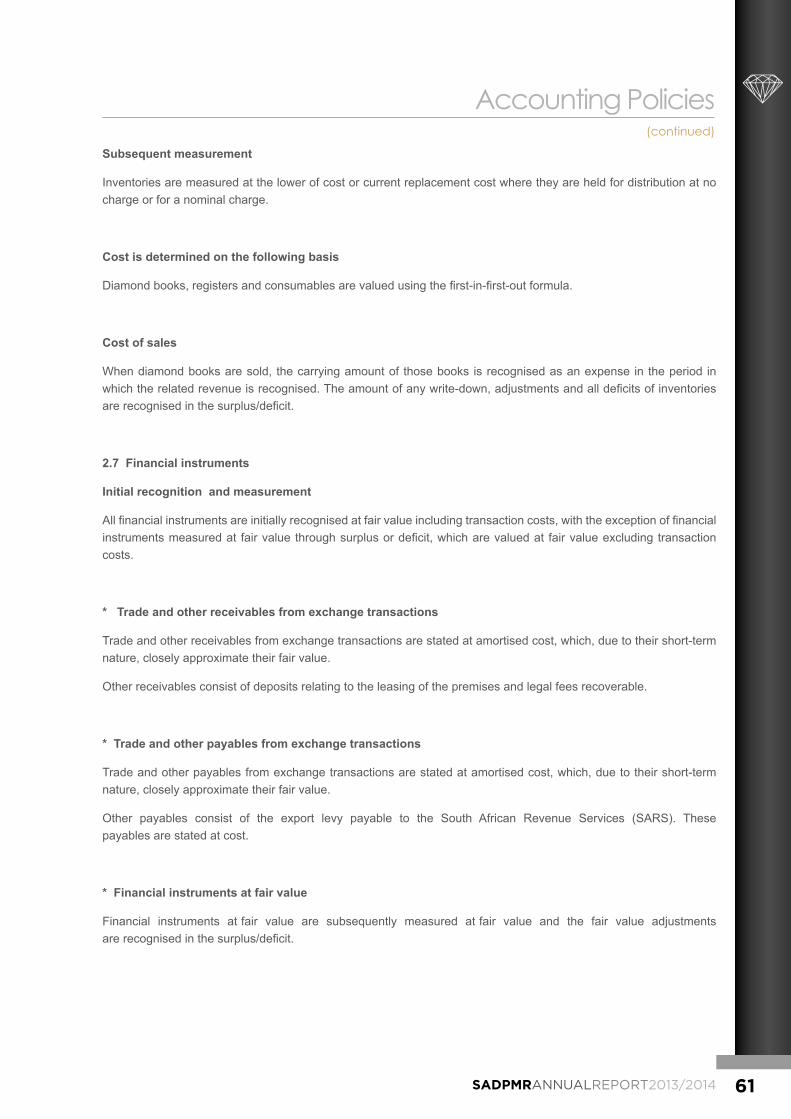
61SADPMRANNUALREPORT2013/2014
Accounting Policies (continued)
Subsequent measurement
Inventories are measured at the lower of cost or current replacement cost where they are held for distribution at no charge or for a nominal charge.
Cost is determined on the following basis
Diamond books, registers and consumables are valued using the first-in-first-out formula.
Cost of sales
When diamond books are sold, the carrying amount of those books is recognised as an expense in the period in which the related revenue is recognised. The amount of any write-down, adjustments and all deficits of inventories are recognised in the surplus/deficit.
2.7 Financial instruments
Initial recognition and measurement
All financial instruments are initially recognised at fair value including transaction costs, with the exception of financial instruments measured at fair value through surplus or deficit, which are valued at fair value excluding transaction costs.
* Trade and other receivables from exchange transactions
Trade and other receivables from exchange transactions are stated at amortised cost, which, due to their short-term nature, closely approximate their fair value.
Other receivables consist of deposits relating to the leasing of the premises and legal fees recoverable.
* Trade and other payables from exchange transactions
Trade and other payables from exchange transactions are stated at amortised cost, which, due to their short-term nature, closely approximate their fair value.
Other payables consist of the export levy payable to the South African Revenue Services (SARS). These payables are stated at cost.
* Financial instruments at fair value
Financial instruments at fair value are subsequently measured at fair value and the fair value adjustments are recognised in the surplus/deficit.

62 SADPMRANNUALREPORT2013/2014
* Cash and cash equivalents
Cash and cash equivalents are stated at amortised cost, which, due to their short-term nature, closely approximate their fair value. Cash and cash equivalents comprise cash at bank, cash on hand and deposits held on call. Bank overdrafts are recorded as current liabilities.
* Offsetting
Financial assets and financial liabilities have not been offset in the Statement of Financial Position.
*Impairmentoffinancialassets
At each end of the reporting period the entity assesses all financial assets, other than those at fair value through sur-plus or deficit, to determine whether there is objective evidence that a financial asset or group of financial assets has been impaired.
For amounts due to the entity, significant financial difficulties of the debtor, probability that the debtor will enter bank-ruptcy and default of payments are all considered indicators of impairment. As the indicators are subject to uncertainty and as such may change in future financial periods, such changes in estimates may have the effect of decreasing impairment losses recognised. The carrying amount of the receivable is reduced through the use of an allowance account. Impaired debts are derecognised when they are assessed as uncollectible.
Impairment losses are recognised in surplus or deficit.
* Derecognition
A financial asset (or, where applicable, a part of a financial asset) is derecognised when:
• The rights to receive cash flow from the asset have expired;
• The entity retains the right to receive cash flow from the asset, but has assumed the obligation to pay them in full without material delay to a third party under a “pass- through” arrangement; or
• The entity has transferred its right to receive cash flows from the asset and either
- Has transferred substantially all the risks and rewards of the assets, or
- Has neither transferred nor retained substantially all the risks and rewards of the assets, but has transferred control of the asset,
A financial liability is derecognised when an obligation under the liability is discharged, cancelled or expires. On derecognition, the difference between the carrying amount of the financial assets and the sum of the proceeds receiv-able and any prior adjustment to reflect the fair value of the asset that had been reported in net assets, is included in the surplus or deficit for the period.
2.8Employeebenefits
Short-termemployeebenefits
The cost of all short-term employee benefits is recognised during the period in which the employee renders the related service.
Accounting Policies(continued)

63SADPMRANNUALREPORT2013/2014
2.9 Accruals
Accruals are recognised as liabilities when the entity has taken receipt of the related goods or services without a corresponding invoice having been issued.
The amount of accruals is the present value of the expenditure required to settle the obligation. Accruals are not rec-ognised for future operating deficits.
2.10 Budget
The budget is prepared as part of the 3 year Medium Term Expenditure Framework (MTEF) on an accrual basis. The budget for the year of operation is monitored against actual expenditure incurred. Provisions and accruals are reviewed monthly. A quarterly review is also conducted whereby variances against budget are explained.
Fruitless and wasteful expenditure means expenditure which was made in vain and would have been avoided had reasonable care been exercised.
All expenditure relating to fruitless and wasteful expenditure is recognised as an expense in the statement of financial performance in the year that the expenditure was incurred. The expenditure is classified in accordance with the nature of the expense, and where recovered, it is subsequently accounted for as revenue in the statement of financial performance.
Standards and Pronouncements comprising the GRAP Financial Reporting Framework
The following standards have been approved but are not yet effective as at 31 March 2014. The impact that these standards will have on the entity is detailed below. A list of these standards is provided below:
GRAP Standards Impact Effective DateGRAP 18 Segment reporting Disclosure will not be affected as the Regulator’s
operations in different geographic regions are not treated as segments, because they fall under Di-visions in the Head Office.
No effective date.
GRAP 20 Related party disclosures The Regulator complies with the standard re-quirements.
No effective date.
GRAP 105 Transfer of functions between entities under common control
This will have an impact on the entity, if the Exec-utive Authority (Department of Mineral Resourc-es) implements the transfers.
No effective date.
GRAP 106 Transfer of functions between entities not under common control
This will have an impact on the entity, if the Exec-utive Authority (Department of Mineral Resourc-es) implements the transfers.
No effective date.
GRAP 107 Mergers This will have an impact on the entity, if the Exec-utive Authority (Department of Mineral Resourc-es) engages in these types of transactions.
No effective date.
Accounting Policies (continued)
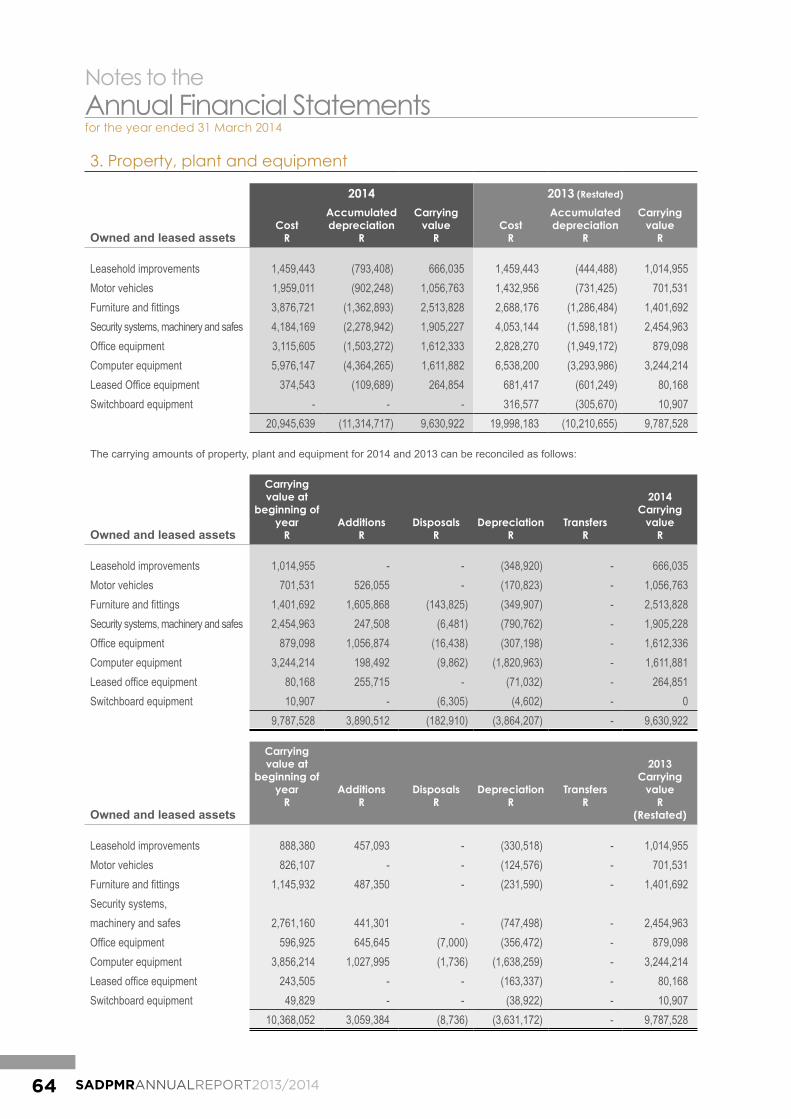
64 SADPMRANNUALREPORT2013/2014
3. Property, plant and equipment
2014 2013 (Restated)
Owned and leased assetsCost
R
Accumulated depreciation
R
Carrying value
RCost
R
Accumulated depreciation
R
Carrying value
R
Leasehold improvements 1,459,443 (793,408) 666,035 1,459,443 (444,488) 1,014,955Motor vehicles 1,959,011 (902,248) 1,056,763 1,432,956 (731,425) 701,531Furniture and fittings 3,876,721 (1,362,893) 2,513,828 2,688,176 (1,286,484) 1,401,692Security systems, machinery and safes 4,184,169 (2,278,942) 1,905,227 4,053,144 (1,598,181) 2,454,963Office equipment 3,115,605 (1,503,272) 1,612,333 2,828,270 (1,949,172) 879,098Computer equipment 5,976,147 (4,364,265) 1,611,882 6,538,200 (3,293,986) 3,244,214Leased Office equipment 374,543 (109,689) 264,854 681,417 (601,249) 80,168Switchboard equipment - - - 316,577 (305,670) 10,907
20,945,639 (11,314,717) 9,630,922 19,998,183 (10,210,655) 9,787,528
The carrying amounts of property, plant and equipment for 2014 and 2013 can be reconciled as follows:
Owned and leased assets
Carrying value at
beginning of year
RAdditions
RDisposals
RDepreciation
RTransfers
R
2014 Carrying
valueR
Leasehold improvements 1,014,955 - - (348,920) - 666,035Motor vehicles 701,531 526,055 - (170,823) - 1,056,763Furniture and fittings 1,401,692 1,605,868 (143,825) (349,907) - 2,513,828Security systems, machinery and safes 2,454,963 247,508 (6,481) (790,762) - 1,905,228Office equipment 879,098 1,056,874 (16,438) (307,198) - 1,612,336Computer equipment 3,244,214 198,492 (9,862) (1,820,963) - 1,611,881Leased office equipment 80,168 255,715 - (71,032) - 264,851Switchboard equipment 10,907 - (6,305) (4,602) - 0
9,787,528 3,890,512 (182,910) (3,864,207) - 9,630,922
Owned and leased assets
Carrying value at
beginning of year
RAdditions
RDisposals
RDepreciation
RTransfers
R
2013 Carrying
valueR
(Restated)
Leasehold improvements 888,380 457,093 - (330,518) - 1,014,955Motor vehicles 826,107 - - (124,576) - 701,531Furniture and fittings 1,145,932 487,350 - (231,590) - 1,401,692Security systems,machinery and safes 2,761,160 441,301 - (747,498) - 2,454,963Office equipment 596,925 645,645 (7,000) (356,472) - 879,098Computer equipment 3,856,214 1,027,995 (1,736) (1,638,259) - 3,244,214Leased office equipment 243,505 - - (163,337) - 80,168Switchboard equipment 49,829 - - (38,922) - 10,907
10,368,052 3,059,384 (8,736) (3,631,172) - 9,787,528
Notes to the Annual Financial Statementsfor the year ended 31 March 2014

65SADPMRANNUALREPORT2013/2014
3. Property, plant and equipment (continued)2014
R2013
R(Restated)
Obligations under finance leases are secured by the lessors’ title to the leased assets. Carrying value of assets pledged as security:
Leased office equipment 264,854 80,168
4. Intangible assets
Owned and leased assets
2014 2013 (Restated)
CostR
Accumulated amortisation
R
Carrying value
RCost
R
Accumulated amortisation
R
Carrying value
R
Computer software - owned 2,403,147 (304,119) 2,099,028 3,457,204 (2,207,292) 1,249,912Leased software 78,323 (78,323) - 78,323 (58,742) 19,581
2,481,470 (382,442) 2,099,028 3,535,527 (2,266,034) 1,269,493
The carrying amounts of intangible assets for 2014 and 2013 can be reconciled as follows:
Owned and leased assets
Carrying value at
beginning of year
RAdditions
RAmortisation
RDisposals
R
2014 Carrying
valueR
Computer software 1,249,912 856,334 (5,086) (2,133) 2,099,028Leased software 19,581 - (19,581) - -
1,269,493 856,334 (24,667) (2,133) 2,099,028
Owned and leased assets
Carrying value at
beginning of year
RAdditions
RAmortisation
RDisposals
R
2013 Carrying
valueR
(Restated)
Computer software 241,019 1,395,766 (386,873) - 1,249,912Leased software 45,688 - (26,107) - 19,581
286,707 1,395,766 (412,980) - 1,269,493
Pledged as security
Obligations under finance leases are secured by the lessors’ title to the leased assets. Carrying value of assets pledged as security:
2014R
2013R
(Restated)
Leased software - 19,581
As required by GRAP 102, management has reviewed the useful lives and residual values of intangible assets. The review did not result in any adjustments in the current year.
Notes to the Annual Financial Statements
for the year ended 31 March 2014 (continued)

66 SADPMRANNUALREPORT2013/2014
5. Inventory2014
R2013
R(Restated)
Inventories comprise:Consumables 60,348 47,852Broker's notes, certificates, registers and temper proof stationery 576,026 250,473
636,375 298,325
The cost of inventory recognised as an expense is included under other operating costs.
6. Receivables from exchange transactions
Receivables 2,134,540 2,785,690Staff debtors 113,881 147,711Prepaid expenses 1,974,930 205,605Provision for bad debts (1,696,676) (1,177,292)Interest receivable 105,643 156,373Other receivables 172,383 205,041
2,804,701 2,323,128
Staff debtors consists of unpaid leave days, study fees, traffic fines, uniform and telecommunication expenses.
Reconciliation of provision for bad debtsOpening balance 1,177,292 2,039,819Raised for the year 521,734 327,422Reversals (2,350) (1,189,949)Closing balance 1,696,676 1,177,292
7. Cash and cash equivalents
Cash on hand 63,645 10,370Call accounts 17,345,911 11,862,358Current accounts 907,769 1,077,873
18,317,325 12,950,601
Current assets 18,317,325 12,950,60118,317,325 12,950,601
Notes to the Annual Financial Statements
for the year ended 31 March 2014 (continued)

67SADPMRANNUALREPORT2013/2014
8. Finance lease obligations2014
R2013
R(Restated)
Photocopiers with Merchant West Asset Finance (Pty) Ltd and Fintech (Pty) Ltd 115,952 -Repayable within one year, transferred to current liabilities 81,810 118,153
197,762 118,153
Reconciliation between the total of the minimum lease payments and the present value:
Minimum lease payments 237,059 122,983- No later than 1 year 109,412 122,983- Later than 1 year and no later than 5 years 127,647 -Future finance charges on finance leases (39,297) (4,830)
197,762 118,153
It is the practice of the Regulator to lease office equipment under finance lease.
9. Obligations under operating leases
At the statement of financial position date, the company has outstanding commitments under non-cancellable op-erating leases that fall due as follows:
JohannesburgOffice 4,201,982 7,233,405- Not later than one year 657,447 770,518- Greater than one year, less than five 3,544,535 6,462,887
The Regulator entered into a 5 year lease agreement with Redefine Properties Ltd, for the rental of office space in the Jewel City, Johannesburg. The lease commenced on 01 April 2011 and terminates on 31 March 2016 and provides for an escalation of rental of 8% per annum. The lease payment is R 130,569 with additional charges for parking at R 31,429 and security at R 3,420 per month.
ORTamboInternationalAirportOffice - 22,768- Not later than one year - 22,768- Greater than one year, less than five - -
The Regulator entered into a 3 year lease agreement with Airports Company of South Africa Ltd (ACSA), for the rental of the office at OR Tambo International Airport. The lease commenced on 01 October 2010 and was termi-nated on 31 August 2013.
KimberleyOffice 552,312 919,367- Not later than one year 151,734 140,490- Greater than one year, less than five 400,578 778,877
The Regulator entered into a 3 year lease agreement with Providence Family Trust, for the rental of Kimber-ley office. The lease commenced on 27 August 2012 and terminates on 01 September 2015 and provides for an escalation of rental of 10% per annum. The lease payment is R 27,588 per month and with no additional charges.
Notes to the Annual Financial Statements
for the year ended 31 March 2014 (continued)

68 SADPMRANNUALREPORT2013/2014
10. Payables from exchange transactions2014
R2013
R(Restated)
Accruals 2,571,470 3,014,357Trade creditors 1,366,572 1,778,740Export levy 771,000 771,000Other payables 772,381 3,032,991
5,481,423 8,597,088
All payables are paid within 30 days, where possible and where there are no disputes. Payables are not secured.
11. Provisions
Reconciliation of provision for performance bonus:Carrying amount at the beginning of the year 2,600,000 1,900,000Additions 2,006,000 2,600,000Amounts incurred and charged against the provision (3,921,845) (2,452,791)Underprovision - prior year 1,321,845 552,791Carrying amount at end of the year 2,006,000 2,600,000
The provision for bonus is 3.5% of the 2014/15 salaries budget. This is payable in the first and second quarter of the following financial year, based on the employees’ scale at the reporting date.
12. Capital commitments
Diamond Scales - 1,164,413Development of Web Admin System 2,245,171 4,366,398Office furniture - 1,341,973Custom- made furniture 433,696 1,059,898Website and intranet 73,594 498,750Outdoor and indoor signage 506,502 506,502Motor vehicle (replacement and additional) - 526,000Lease: High Volume Printers 180,000 328,235Office partitioning - 955,963
3,438,963 10,748,132
These relate to commitments made towards procurement of capital expenditure, goods and services but the services/goods have not been delivered/rendered.
Notes to the Annual Financial Statements
for the year ended 31 March 2014 (continued)

69SADPMRANNUALREPORT2013/2014
13. Financial instruments at fair value2014
R2013
R(Restated)
Financial instruments held for trading with StanlibOpening balance 38,425,732 41,243,612Interest received 2,373,403 2,210,798Withdrawals: Other (9,993,468) (5,000,000)Withdrawals: Kimberly Process (7,518,900) -Fair value adjustment (22,404) (28,678)Closing balance 23,264,363 38,425,732
14. Other income
Administration Fee (Client fees) 18,040 19,644Bad Debts Recovered 48,500 20,850Discount Received 64,317 -Legal Fees Recovered - 192,740Non-refundable fees - 18,618Recovery of expenses 309,717 21,202Sale of diamond books and registers 78,720 118,740Sale of tender documents 23,400 53,350MQA grant income 108,783 146,040
651,477 591,184
15. Deferred income
Reconciliation of deferred income:Carrying amount at the beginning of the year 257 62,105Received during the year 260,163 84,192Amounts incurred and charged against the income (108,783) (146,040)Carrying amount at end of the year 151,637 257
16. Auditor’s remuneration
External audit 1,698,457 1,991,627Other audit 180,000 -
1,878,457 1,991,627
Notes to the Annual Financial Statements
for the year ended 31 March 2014 (continued)

70 SADPMRANNUALREPORT2013/2014
17. Other operating expenses2014
R2013
R(Restated)
Administration expenses 85,698 113,896Advertising 110,964 225,767Audit Fees 1,878,457 1,991,627Board 1,540,484 1,434,324Corporate Social Responsibility Programmes 9,283 91Domestic Travel 574,250 611,798Hiring 129,415 147,755Hospitality 27,457 70,705Insurance 1,283,086 1,502,276International travel 1,723,753 2,560,695Inventory 826,450 928,266Kimberley Process 7,730,361 148,960Legal fees 232,233 750,300Licences 772,277 176,248Membership fees 5,986 384Office lease 3,041,760 2,706,900Office relocation 31,396 103,311Postage and courier 29,680 40,205Publications 38,680 595,902Recruitment and selection costs 153,263 143,867Repairs and maintenance 434,619 400,564Security 765,643 645,704Staff Welfare 184,641 273,290Subscriptions 96,144 62,430Telecommunication 2,208,658 1,221,179Venue & Facilities 348,690 -Warehousing 31,447 27,970Training and Development 571,767 444,468Consulting fees 462,414 146,620Repairs and maintenance 129,103 692,663Sponsorship and special programmes 292,618 37,068Staff recognition 2,527 -Medical expenses-retired staff 101,438 85,727Inspection and compliance expenses 744,767 882,699
26,599,406 19,173,661
Notes to the Annual Financial Statements
for the year ended 31 March 2014 (continued)
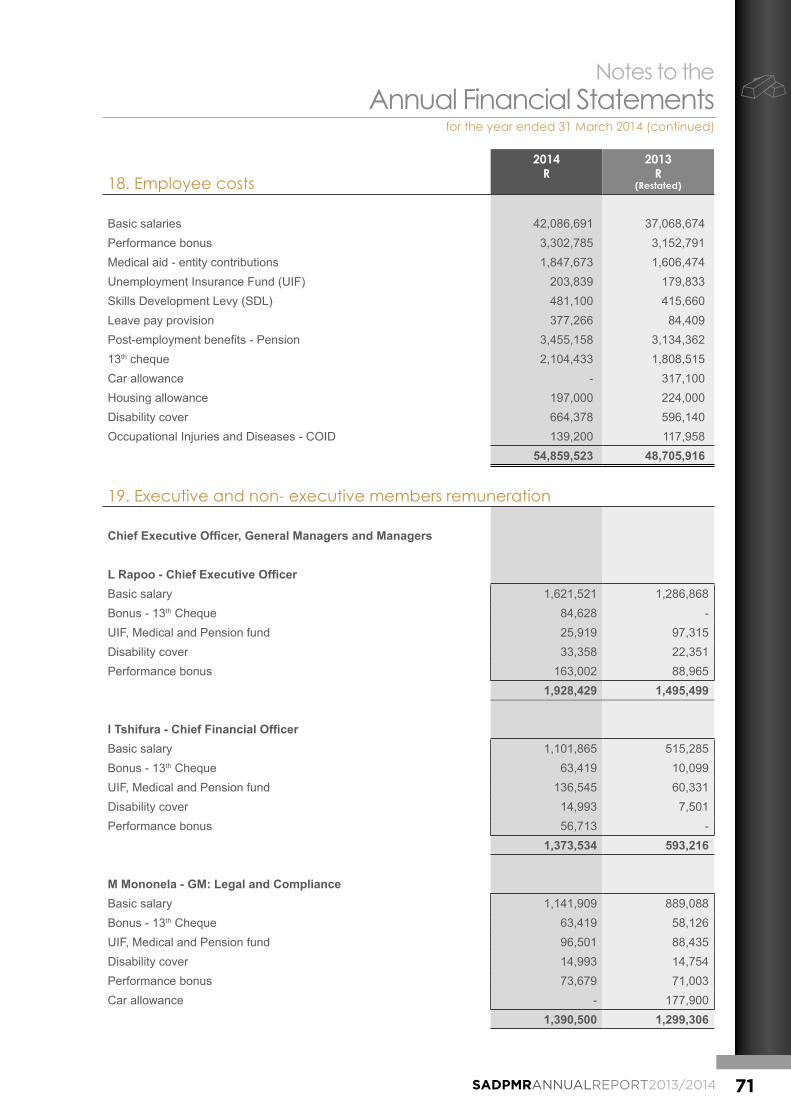
71SADPMRANNUALREPORT2013/2014
18. Employee costs2014
R2013
R(Restated)
Basic salaries 42,086,691 37,068,674Performance bonus 3,302,785 3,152,791Medical aid - entity contributions 1,847,673 1,606,474Unemployment Insurance Fund (UIF) 203,839 179,833Skills Development Levy (SDL) 481,100 415,660Leave pay provision 377,266 84,409Post-employment benefits - Pension 3,455,158 3,134,36213th cheque 2,104,433 1,808,515Car allowance - 317,100Housing allowance 197,000 224,000Disability cover 664,378 596,140Occupational Injuries and Diseases - COID 139,200 117,958
54,859,523 48,705,916
19. Executive and non- executive members remuneration
ChiefExecutiveOfficer,GeneralManagersandManagers
LRapoo-ChiefExecutiveOfficerBasic salary 1,621,521 1,286,868Bonus - 13th Cheque 84,628 -UIF, Medical and Pension fund 25,919 97,315Disability cover 33,358 22,351Performance bonus 163,002 88,965
1,928,429 1,495,499
ITshifura-ChiefFinancialOfficerBasic salary 1,101,865 515,285Bonus - 13th Cheque 63,419 10,099UIF, Medical and Pension fund 136,545 60,331Disability cover 14,993 7,501Performance bonus 56,713 -
1,373,534 593,216
M Mononela - GM: Legal and ComplianceBasic salary 1,141,909 889,088Bonus - 13th Cheque 63,419 58,126UIF, Medical and Pension fund 96,501 88,435Disability cover 14,993 14,754Performance bonus 73,679 71,003Car allowance - 177,900
1,390,500 1,299,306
Notes to the Annual Financial Statements
for the year ended 31 March 2014 (continued)

72 SADPMRANNUALREPORT2013/2014
19. Executive and non-executive members remuneration (continued)
2014R
2013R
(Restated)
S Sikhosana - GM: Diamonds and Precious MetalsBasic salary 963,114 901,689Bonus - 13th Cheque 63,419 58,126UIF, Medical and Pension fund 144,562 125,051Disability cover 14,993 15,177Performance bonus 110,518 63,720Car allowance 129,600 129,600
1,426,205 1,293,363
C Mlondo - GM: Security and Risk ManagementBasic salary 1,070,379 1,030,066Bonus - 13th Cheque 58,127 58,237UIF, Medical and Pension fund 147,483 129,970Disability cover 15,021 15,204Performance bonus 102,150 70,227
1,393,160 1,303,704
KE Makgohlo - Manager: Human ResourcesBasic salary 829,799 772,309Bonus - 13th Cheque 46,085 41,614UIF, Medical and Pension fund 70,613 64,251Disability cover 10,880 10,917Performance bonus 72,210 65,171
1,029,586 954,262
ADamarupurshad-Manager:PreciousMetalsandBeneficiationBasic salary 838,888 783,234UIF, Medical and Pension fund 98,008 86,897Disability cover 10,880 10,917Performance bonus 49,314 31,771Car allowance 9,600 9,600
1,006,690 922,419
J Lenka - Manager: DiamondsBasic salary 863,884 802,914UIF, Medical and Pension fund 70,613 64,251Disability cover 10,880 10,917Performance bonus 56,359 67,615Housing allowance 12,000 12,000
1,013,735 957,697
Notes to the Annual Financial Statements
for the year ended 31 March 2014 (continued)
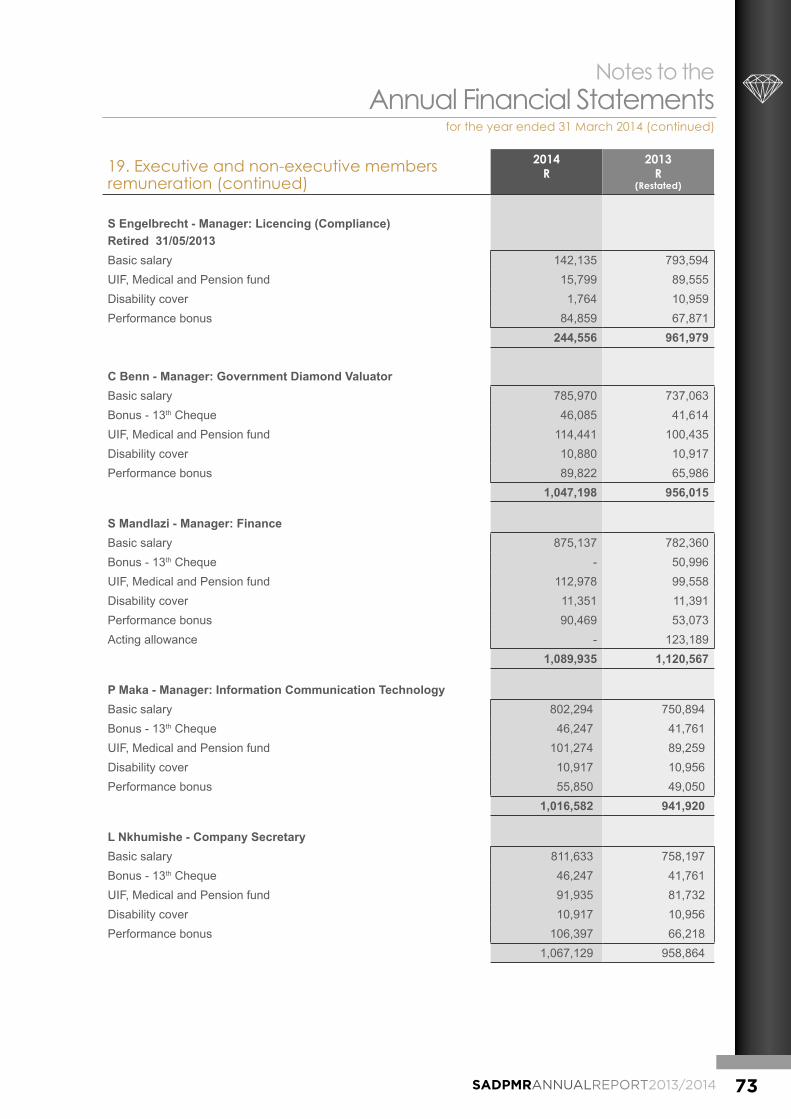
73SADPMRANNUALREPORT2013/2014
19. Executive and non-executive members remuneration (continued)
2014R
2013R
(Restated)
S Engelbrecht - Manager: Licencing (Compliance) Retired 31/05/2013Basic salary 142,135 793,594UIF, Medical and Pension fund 15,799 89,555Disability cover 1,764 10,959Performance bonus 84,859 67,871
244,556 961,979
C Benn - Manager: Government Diamond ValuatorBasic salary 785,970 737,063Bonus - 13th Cheque 46,085 41,614UIF, Medical and Pension fund 114,441 100,435Disability cover 10,880 10,917Performance bonus 89,822 65,986
1,047,198 956,015
S Mandlazi - Manager: FinanceBasic salary 875,137 782,360Bonus - 13th Cheque - 50,996UIF, Medical and Pension fund 112,978 99,558Disability cover 11,351 11,391Performance bonus 90,469 53,073Acting allowance - 123,189
1,089,935 1,120,567
P Maka - Manager: Information Communication TechnologyBasic salary 802,294 750,894Bonus - 13th Cheque 46,247 41,761UIF, Medical and Pension fund 101,274 89,259Disability cover 10,917 10,956Performance bonus 55,850 49,050
1,016,582 941,920
L Nkhumishe - Company SecretaryBasic salary 811,633 758,197Bonus - 13th Cheque 46,247 41,761UIF, Medical and Pension fund 91,935 81,732Disability cover 10,917 10,956Performance bonus 106,397 66,218
1,067,129 958,864
Notes to the Annual Financial Statements
for the year ended 31 March 2014 (continued)

74 SADPMRANNUALREPORT2013/2014
19. Executive and non-executive members remuneration (continued)
2014R
2013R
(Restated)
MM Babu -Manager - Compliance (Appointed 01/12/2013 )Basic salary 255,009 -Bonus - 13th Cheque - -UIF, Medical and Pension fund 38,758 -Disability cover 3,386 -Performance bonus - -
297,154 -
TOTAL EXECUTIVE REMUNERATION 15,027,237 13,758,811
This represents the total cost to company, the choice of salary structure is that of the employee.
Non-executive members of the Board and Other Committees
No. of Meetings attended
Paid to memberR
Paid to employer R
Total - 2014 R
Total - 2013R
N Mkhumane 13 99,712 - 99,712 31,104S Phiri 6 33,312 - 33,312 62,580RA Manoko ## - - - - 47,600A Luhlabo ## - - - - 52,460E Majadibodu ## - - - - 20,984L Grobler 23 127,280 - 127,280 72,056FW Peterson ## - - - - 36,722A Bezuidenhout 10 - 10,224 10,224 5,784P Bersiks ## - - - - 69,914K Rana ## - - - - 47,786RJ Paola 20 - 106,928 106,928 82,010L Delport 19 - 108,160 108,160 77,976MC Ntumba ## - - - - 23,484D Mashile-Nkosi 4 22,448 - 22,448 11,568P Bailey 15 73,680 - 73,680 34,704N Xaba 22 - 104,464 104,464 40,488B Luthuli ### 3 12,336 - 12,336 23,136S Ngcobo 13 - 73,472 73,472 23,136Total Non-executive Remuneration 368,768 403,248 772,016 763,492
The fee structure for the 2013/14 financial year was approved by the Minister of Mineral Resources.## Term Ended: 30/09/2012### Resigned
Notes to the Annual Financial Statements
for the year ended 31 March 2014 (continued)

75SADPMRANNUALREPORT2013/2014
20. Cash generated from operations2014
R2013
R(Restated)
Net deficit (4,825,418) (2,097,606)Adjustment for:Depreciation and amortisation 3,888,873 4,044,152Loss on disposal of property, plant and equipment 179,640 8,736Interest received - investment (2,373,403) (2,776,854)Finance costs 28,661 62,912Fair value adjustment - financial instruments at fair value 22,404 28,678
(3,079,243) (729,982)
Movements in working capital (4,375,907) 1,468,652Decrease/ (Increase) in inventory (338,050) (197,897)Increase/ (Decrease) in deferred income 151,380 (61,848)Movements in operating lease assets (35,409) -Movements in operating lease accruals 37,411 (154,558)Increase in payables (3,115,665) 2,854,329Increase/ (Decrease) in provisions (594,001) 700,000Increase/ (Decrease) in receivables (481,573) (1,671,374)Cash generated from operations (7,455,150) 738,670
21. Contingent liabilities
There is a case against the Regulator challenging the constitutionality of the Diamond Act which the Regulator might incur legal costs of about R1,5 million. There are also two labour related cases that might incur legal costs of about R3,1 million.
22. Contingent assets
Two cases are in process against the Regulator relating to the establishment of the Diamond Export and Exchange Centre and the constitutionality of the Diamonds Act and its Amendments. The Regulator has incurred legal costs amounting to R 620,000 and management is of the opinion that the outcome would be favourable and that the costs incurred may be recovered from the plaintiffs.
23. Related party transactions
Name and nature of services
Amounts received/paid to related party
Amounts owed by/(to) the related party at year-end
2014 2013(Restated)
2014 2013(Restated)
Department of Mineral Resources - Transfer payment 44,824,000 41,601,000 - -
There were no balances with the Department of Mineral Resources at year-end.
Notes to the Annual Financial Statements
for the year ended 31 March 2014 (continued)

76 SADPMRANNUALREPORT2013/2014
24. Irregular expenditure2014
R2013
R(Restated)
During the year under review, management did not detect any irregular expenditure.
25. Fruitless and wasteful expenditure
Opening balance - - Fruitless and wasteful expenditure - current year - 4,063Expenditure ratified by the Board - -Fruitless and wasteful expenditure balance at end of year - 4,063
Details of fruitless and wasteful expenditure - current and prior yearIncident
* An amount of R4,063 was interest charged on disputed electricity charges levied by the Landlord when they took over the account.
26. Change in accounting estimate
The depreciation for motor vehicles purchased before 2009 was previosly calculated using the residual val-ues, at the beggining of the current year management revised the calculation to exclude the residual values for consistancy with other assets and only revalue the assets once it has been fully depreciated. The effect of the revision has resulted in the increase in depreciation charge of the affected vehicles for the current and future period by R51 591.29.
27. Errors
A computer software licence purchased in January 2013 with a cost of R517 943.54 was accounted for as an intangible asset and amortised over one year instead of being accounted for as prepaid expense and allocated to software licence over one year. This resulted in the intangible assets cost overstated by R517 943.54, accumulated depreciation and depreciation overstated by R147 983.87 while prepaid expense was understated by R369 959. 67 and software licence understated by R147 983.87.
StatementoffinancialpositionDecrease in intangible assets - (517,944) Decrease in accumulated depreciation - Software - 147,984Increase in prepaid expense - 369,960
- -Increase in software licence - 147,984Decrease in depreciation - (147,984)Increaseindeficit-2013 - -
Notes to the Annual Financial Statements
for the year ended 31 March 2014 (continued)

77SADPMRANNUALREPORT2013/2014
28. Financial risk management2014
R2013
R(Restated)
The Regulator in the course of normal operations, has limited exposure to the financial risks, and attempts to man-age the following financial risks:
Liquidity risks
The entity manages liquidity risk through proper management of working capital, capital expenditure and actual versus forecasted cash flows. Adequate reserves and liquid resources are also maintained.
The maturity analysis of payables at reporting date were as follows:
PayablesNot past due 1,067,407 917,171Past due 0 - 30 days 200,225 858,470Past due 31-120 days 4,341 3,099Past due 121 - 180 days 86 -
1,272,059 1,778,740
The following are the entity’s other liabilities, including interest payments:
Not later than one yearFinance lease obligations 81,810 118,153Provisions 2,006,000 2,600,000Deferred income 151,637 257
2,239,447 2,718,410
Greaterthanoneyear,lessthanfiveFinance lease obligations 115,952 -
115,952 -
Market Risk
Market risk is the risk that the fair value or future cash flows of financial instruments will fluctuate because of chang-es in commodity prices, interest rates and equity prices.
A significant part of the market risk encountered arises from financial instruments that are managed by other finan-cial institutions.
The objective of the market risk management policy is to protect and enhance the statement of financial position and surplus or a deficit by managing and controlling market risk exposures and to optimise the funding of business operations and facilitate capital expansion.
Interest Rate Risk
Deposits and call accounts attract interest rates that vary with prime. The Regulator’s policy is to manage interest rate risk by investing in a range of balanced portfolios so that fluctuations in variable rates do not have a material impact on the surplus or (deficit).
At year end, financial instruments exposed to interest rate risk were as follows: (i) Balances with banks, current and call accounts.
Notes to the Annual Financial Statements
for the year ended 31 March 2014 (continued)

78 SADPMRANNUALREPORT2013/2014
28. Financial risk management (continued)2014
R2013
R(Restated)
Credit Risk
Credit risk is the risk of financial loss to the entity if a customer or other counterparty (including government and fi-nancial institutions) to a financial instrument fails to meet its contractual obligations. Credit risk arises primarily from the sale of goods and services in the ordinary course of business. Credit risk includes counterparty risk and delivery or settlement risk. Counterparty risk is the risk that a counterparty is unable to meet its financial and/or contractual obligations during the period of a transaction.
Credit risk consists mainly of call deposits, cash equivalents and trade receivables. The South African Diamond and Precious Metals Regulator only deposits cash with major banks with high quality credit standing and limits exposure to any one counterparty. Trade receivables are presented net of allowance for doubtful receivables.
The maximum exposure to credit risk of financial assets is:
Loans and receivables 4,501,377 3,500,420Financial instruments at fair value 23,264,363 38,425,732Cash and cash equivalents 18,317,325 12,950,601
46,083,065 54,876,753
The ageing of the entity’s receivables is as follows:
2014 2013 (Restated)
Gross Impaired Gross Impaired0 - 30 days 74,794 7,479 1,695,178 169,51831- 60 days 1,420,044 284,009 18,843 3,76961- 90 days 78,377 31,351 95,255 38,102Over 90 days 1,419,201 1,373,836 976,414 965,903
2,992,416 1,696,676 2,785,690 1,177,292
29. Cash and Cash equivalents
Cash and deposits are regarded as having insignificant credit risk. The composition of the balances was as follows:
Bank TypeBalance at 31 March 2014
NEDBANK Current 907,769NEDBANK Call 6,051,394NEDBANK Call 2 2,676,465INVESTEC Call 8,618,052PETTY CASH On hand 63,645
18,317,325
Notes to the Annual Financial Statements
for the year ended 31 March 2014 (continued)
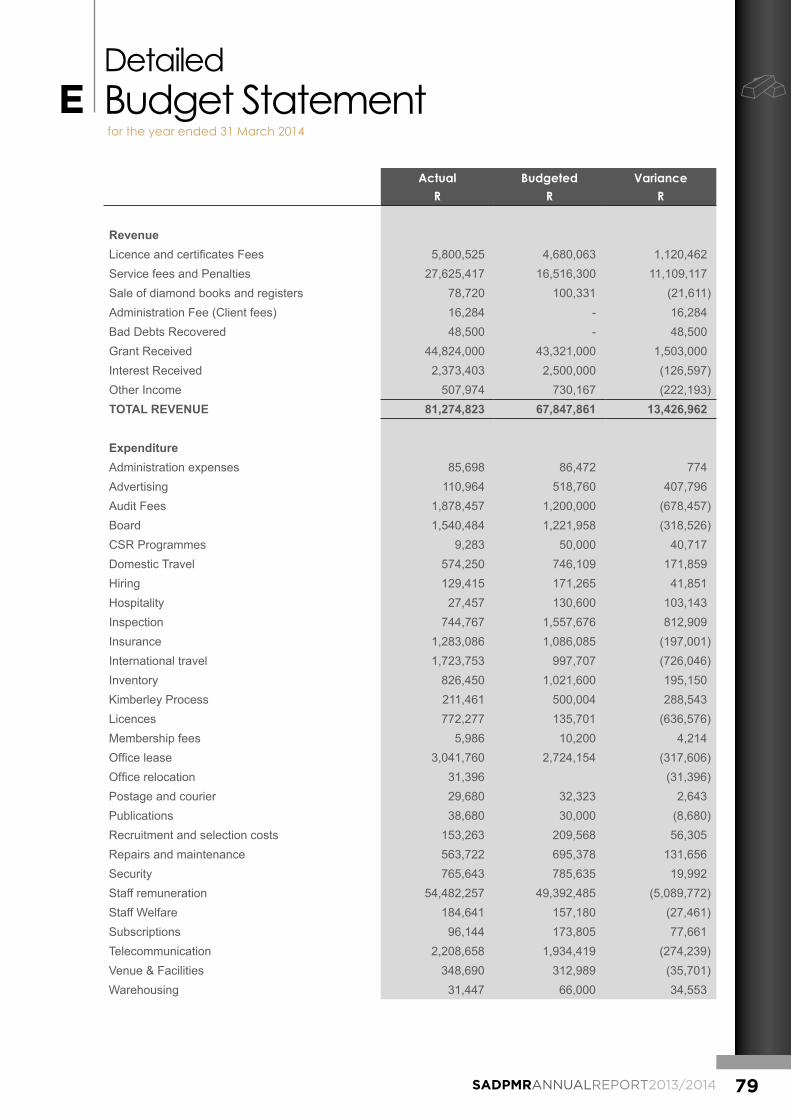
79SADPMRANNUALREPORT2013/2014
Detailed Budget Statementfor the year ended 31 March 2014
ActualR
BudgetedR
VarianceR
RevenueLicence and certificates Fees 5,800,525 4,680,063 1,120,462Service fees and Penalties 27,625,417 16,516,300 11,109,117Sale of diamond books and registers 78,720 100,331 (21,611)Administration Fee (Client fees) 16,284 - 16,284Bad Debts Recovered 48,500 - 48,500Grant Received 44,824,000 43,321,000 1,503,000Interest Received 2,373,403 2,500,000 (126,597)Other Income 507,974 730,167 (222,193)TOTAL REVENUE 81,274,823 67,847,861 13,426,962
ExpenditureAdministration expenses 85,698 86,472 774Advertising 110,964 518,760 407,796Audit Fees 1,878,457 1,200,000 (678,457)Board 1,540,484 1,221,958 (318,526)CSR Programmes 9,283 50,000 40,717Domestic Travel 574,250 746,109 171,859Hiring 129,415 171,265 41,851Hospitality 27,457 130,600 103,143Inspection 744,767 1,557,676 812,909Insurance 1,283,086 1,086,085 (197,001)International travel 1,723,753 997,707 (726,046)Inventory 826,450 1,021,600 195,150Kimberley Process 211,461 500,004 288,543Licences 772,277 135,701 (636,576)Membership fees 5,986 10,200 4,214Office lease 3,041,760 2,724,154 (317,606)Office relocation 31,396 (31,396)Postage and courier 29,680 32,323 2,643Publications 38,680 30,000 (8,680)Recruitment and selection costs 153,263 209,568 56,305Repairs and maintenance 563,722 695,378 131,656Security 765,643 785,635 19,992Staff remuneration 54,482,257 49,392,485 (5,089,772)Staff Welfare 184,641 157,180 (27,461)Subscriptions 96,144 173,805 77,661Telecommunication 2,208,658 1,934,419 (274,239)Venue & Facilities 348,690 312,989 (35,701)Warehousing 31,447 66,000 34,553
E

80 SADPMRANNUALREPORT2013/2014
ActualR
BudgetedR
VarianceR
Training and Development 571,767 485,748 (86,019)Consulting fees 462,414 437,629 (24,784)Sponsorship and special programmes 292,618 780,000 487,382Staff recognition 2,527 50,000 47,474Bad debts 2,350 - (2,350)Labour relations cost 232,233 54,744 (177,489)Medical expenses-retired staff 101,438 91,668 (9,770)Total expenditure excluding non-cash items 73,565,113 67,847,861 (5,717,251)
Surplus for the year 7,709,710 - 7,709,710
Less non-cash itemsFair Value Adjustment 22,404 - (22,404)Finance charges - Loans and Leases 28,661 - (28,661)Loss on disposal of assets 179,640 - (179,640)Depreciation and armotisation 3,888,873 - (3,888,873)Provision for Bad debts adjustments 519,385 - (519,385)Leave pay provision 377,266 - (377,266)Total non-cash items included in the surplus 5,016,227 - (5,016,229)
Surplus for the year including non-cash items 3,693,483 - -
Abnormal expenditure - Kimberly process 7,518,900 - -
NetDeficitfortheyearincludingabnormalexpenditure (4,825,418) - -
Detailed Budget Statementfor the year ended 31 March 2014 (continued)
Head OfficeJewel City, 251 Fox Street, Johannesburg, 2001
Tel: 011 223 7000 Fax: 011 334 8898
Kimberley Office15 - 17 Chapel Street, 2nd Floor Chapwood Chambers, Kimberley, 8301
Tel: 053 831 3121 Fax: 053 831 3101
Durban Office3rd floor, Durban Bay House, 333 Anton Lembede Street, Durban, 4000
Tel: 031 335 9677 Fax: 031 301 6950
Cape Town Office10th floor, Atterbury House, 9 Riebeek Street, Cape Town, 8000
Tel: 021 427 1070 Fax: 0866 124 907
www.sadpmr.co.za
ISBN 978-0-621-42690-8 • RP 114/2014