A1.4-V25-mW600-MS/s6-bitfoldingandinterpolatingADCin0.13 ...

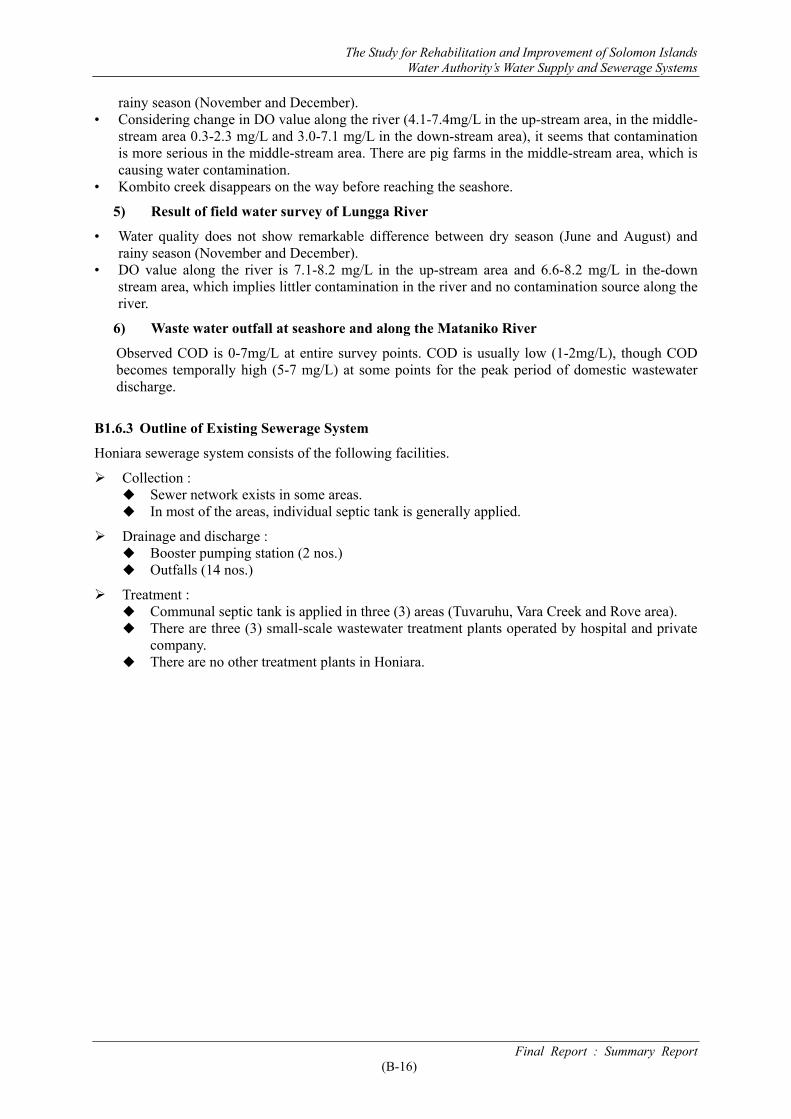
The Study for Rehabilitation and Improvement of Solomon Islands Water Authority’s Water Supply and Sewerage Systems
Final Report : Summary Report (A-1)
PART A FRAMEWORK OF THE STUDY
A1 Introduction
A1.1 Background of the Study
In the Solomon Islands (hereinafter referred to as “Solomon”), Solomon Islands Water Authority (hereinafter referred to as “SIWA”) is responsible for the management of urban water supply and sewerage services.
SIWA has many difficulties in the aspects of infrastructures, financial situation and human resources. Therefore, SIWA is desirous of improving water supply and sewerage facilities, and capacity development related to management and organization.
In those circumstances, the Government of Solomon requested a development study to the Government of Japan in order to implement follow-up project for the facilities damaged under the ethnic tension and formulate a facility improvement plan (target year 2010) for the water supply and sewerage systems for Honiara and other provincial centers (Noro, Auki and Tulagi).
In response to the request, JICA dispatched a mission for the Preparatory Evaluation Study in November 2004, and the mission held discussions and exchanged the signed S/W with SIWA under the Ministry of Natural Resources.
Then, JICA sent the Study Team (hereinafter referred to as “the Team”) to conduct the Study for Rehabilitation and Improvement of Solomon Islands Water Authority’s Water Supply and Sewerage Systems (hereinafter referred to as “the Study”).
The Study has been conducted for about 13 months from May 2005 to May 2006 based on the S/W.
A1.2 Objectives of the Study
The objectives of the Study were:
1. To formulate an urgent rehabilitation plan for Honiara and urgent restoration plan for Auki or Tulagi.
2. To formulate a facility improvement plan for the water supply and sewerage systems of Honiara, Noro, Auki and Tulagi for the target year 2010; and
3. To formulate an action plan for supporting capacity development of SIWA to strengthen its management.
A1.3 Study Area
The Study covered Honiara, the capital of the Solomon Islands, and three provincial centers of Noro, Auki and Tulagi as shown in the map attached to the opening page of this report.
A1.4 Organization and Staffing of the Study
The Study Team consists of eleven (11) members. The Study has been implemented with the cooperation of SIWA as a counterpart, Department of Mines & Energy in the Ministry of Natural Resources, Ministry of Health and Honiara City Council.
Socio-economic Survey have and pilot projects been executed in the Study with the cooperation of Department of Statistics, NGO, private companies and the residents of survey areas.
Figure A1-1 shows the relations among all the parties concerned.

The Study for Rehabilitation and Improvement of Solomon Islands Water Authority’s Water Supply and Sewerage Systems
Final Report : Summary Report (A-2)
Source : JICA Study Team
Figure A1-1 Implementation Organization of the Study
A2 Framework of the Study
A2.1 Basic Policy of the Study
In this Study, it has been recognized that the capacity development of SIWA is the most important aspect. The Study, therefore, put emphasis on formulating Action Plan, which will facilitate strengthening of the management of SIWA, through implementation of pilot projects, etc.
Formulation of the improvement plan for water supply and sewerage facilities in the Study areas is considered one of the important aspects for the capacity development of SIWA. The facility improvement plan for the target year 2010 was prepared based on the results of field surveys in the Study and using the study reports as a reference prepared under the assistance of Australian Agency for International Development (hereinafter referred to as “AusAID”).
Formulation of the urgent rehabilitation plan for Honiara water supply system and the supervision of the follow-up cooperation project based on the plan are also considered as the important aspects. The follow-up cooperation has been done for rehabilitating the water supply facilities in Honiara constructed under the Japan’s Grant Aid in 1998 and damaged during the ethnic tension from 2000 to 2003.
The important aspects of the Study are shown in the Figure A2-1.
SIWA (Counterpart)
• Support Services Department
• Finance & Sales Department
• Engineering Services Department – Planning & Design
Section – Environmental Section – Water Supply Section – Wastewater Section – Province Section
Ministry of Natural Resources
Department of Mines and Energy • Water Resource Division • Environment
Conservation Division
Other Related Authorities
• Ministry of Health • Honiara City Council
JICA Study Team 1. Team Leader / Water
Supply and Sewerage System Planning
2. Management / Financial Analysis / Institutional Strengthening
3. Architectural Planning for Institutional Strengthening
4. Water Supply Facility Planning
5. Water Supply Equipment Planning
6. Unaccounted for water Reduction
7. Water Resources Development and Social Consideration
8. Sewerage Facility Planning9. Sanitation Improvement
Planning 10. Public Participation /
Socio-economic Survey 11. Coordinator / Groundwater
Survey
Support
Water Resources Survey
Water Quality Survey
Sanitary Improvement
Socio - economic Survey
Pilot Projects
Statistic Department
Private Sectors
NGO’s
Residents

The Study for Rehabilitation and Improvement of Solomon Islands Water Authority’s Water Supply and Sewerage Systems
Final Report : Summary Report (A-3)
Source : JICA Study Team
Figure A2-1 Important Aspects of the Study A2.2 Overall Work Flow of the Study
The Study has been started from the middle of May 2005 and finished in June 2006. The Study has been implemented over two phases (Phase 1 and Phase 2) in the fiscal year (FY) 2005 as shown in Table A2-1. The overall implementation schedule of the Study is as shown in Figure A2-2.
Table A2-1 Study Phases Fiscal Year Study Phase Study Period
1st Fiscal Year - Phase 1:Preparation in Japan Beginning of May 2005 Formulation of Urgent Rehabilitation Plan and Mid-term Facility Improvement Plan Selection of pilot projects Preparation and submission of IT/R
Middle of May 2005 to the end of August 2005
FY2005 1st Fiscal Year - Phase 2:
Explanation of IT/R Supervision work on Follow-up Project Execution of Pilot Projects Preparation and submission of Draft Final Report (DF/R)
November 2005 to March 2006
FY2006 2nd Fiscal Year
Explanation of DF/R Preparation and submission of Final Report
Middle of May to the end of June 2006
Source: JICA Study Team
Problems and Issues on Water Supply and Sewerage Systems in Solomon
Necessity of Capacity
Development of SIWA
Formulation of urgent rehabilitation plan and supervision of follow-up
cooperation project
Formulation of mid-term water supply and sewerage
systems master plan (target year 2010)
Formulation of action plan for facilitating improvement
of SIWA management capability
Damages during ethnic tension on water supply facilities constructed under the last Japan’s grant aid
Formulation of mid-term water supply and sewerage systems master plan is required
Master plans formulated by assistance of AusAID shall be reviewed
Request of urgent rehabilitation by follow-up cooperation
Technical Aspects Managerial and Institutional Aspects
Leakage ratio in water supply system to be
reduced
Shifting from Konglai spring to groundwater
to be needed
Inefficient water supply system to
be upgraded
Fear for pollution of
water sources and environment to be eliminated
Tariff collection to be improved
Income resources to be
expanded
Operation and maintenance cost
to be reduced
Organizationand human
resources to be strengthened
Exec
utio
n of
th
e St
udy
Pilot Projects Field Surveys

The Study for Rehabilitation and Improvement of Solomon Islands Water Authority’s Water Supply and Sewerage Systems
Final Report : Summary Report (A-4)
Fiscal Year FY 2005 FY 2006 Month 4 5 6 7 8 9 10 11 12 1 2 3 4 5 6 7
Study Phase
Study Works
Study Items
Submission of
Reports
Workshop(WS)
1st Year (Phase-2) 1st Year (Phase -1) 2nd Year
2nd Study Works in Solomon 1st Study Works in Solomon
Preparation Works in Japan
1st Study Works in
Japan
2nd Study Works in Japan
3rd Study
Works in Solomon
3rd Study Works
in Japan
Prep
arat
ion
and
Subm
issio
n of
D
raft
Fina
l Rep
ort (
DF/
R)
Prep
arat
ion
and
Subm
issio
n of
Fin
al
Follow-up Cooperation Plan (For Honiara City)
Urgent Restoration Plan for Auki City or Tulagi City
Approval of Tender
Documents
Expl
anat
ion
on In
cept
ion
Repo
rt (I
C/R
)
Prep
arat
ion
and
Subm
issio
n of
Inte
rim R
e por
t (I/R
)
[Urgent Rehabilitation Plan]
Expl
anat
ion
on In
terim
Rep
ort i
n So
lom
on
Pumping Test
Survey for Existing
Conditions of Facilities
Determination of Contents for Follow-up Cooperation
Form
ulat
ion
of A
ctio
n Pl
an
Expl
anat
ion
on D
F/R
Procurement & Transportation D
ata
Col
lect
ion/
Ana
lysis
and
Pre
para
tion
of
Que
stio
nnai
re
Prep
arat
ion
and
Subm
issio
n of
Ince
ptio
n R
epor
t (IC
/R)
3rd W
orks
hop
for E
valu
atio
n
of P
ilot P
roje
cts
Tendering & Contract
Procurement Plan for Material and Equipment (including Preparation of Tender Documents) Supervision of Installation Work
Receipt of Material & Equipment + Installation Work
[Institutional and Managerial Improvement]
Colle
ctio
n an
d A
naly
sis o
f Rel
evan
t Dat
a an
d M
ater
ials
Management Diagnosis Counter-measure for Non-Revenue Water Efficiency Improvement for Facility Operation
[Mid-term Facility Improvement Plan]
Cost Estimation
Project Evaluation
Project Implementation Program
Field Surveys Surface Water & Spring Survey
Groundwater Survey Water Quality Survey at Water Sources & Intake Points Non-Revenue Water Survey
Socio-economic Survey
Implementation of Pilot Projects
2nd W
orks
hop
for P
repa
ratio
n
of P
ilot P
roje
cts Risk Analysis
Implementation of the Study in line with JICA Guidelines for Environmental and Social Considerations
Facility Plan
Water Demand Projection
Sanitation Improvement Plan
Examination of Pilot Projects
[Examination of Pilot Projects]
1st Workshop for Selection
of Pilot Projects
Strengthening Relationship between SIWA and Citizen Consideration for the Vulnerable and Poor
[Consideration for Social Environment & Natural Environment]
IC/R IT/R DF/R F/R
WS WS WS Source : JICA Study Team
Figure A2-2 Overall Work Flow of the Study

The Study for Rehabilitation and Improvement of Solomon Islands Water Authority’s Water Supply and Sewerage Systems
Final Report : Summary Report (A-5)
A2.3 Capacity Development Activities in the Study
Items for capacity development activities done in the Study were determined after examination of the following points;
Items should lead to solve problems faced with SIWA for strengthening management of SIWA. Counterpart training in Japan can be utilized in some items. Items can be implemented in the pilot projects.
The capacities developed under the Study and the capacity development activities of the Study are shown in Figure A2-3.

The Study for Rehabilitation and Improvement of Solomon Islands Water Authority’s Water Supply and Sewerage Systems
Final Report : Summary Report (A-6)
Fi
gure
A2-
3 C
apac
ity D
evel
opm
ent A
ctiv
ities
in th
e St
udy
C
apac
ity
Dev
elop
men
t of
SIW
A S
taff
in th
e St
udy
SIW
A st
aff m
aste
rs th
e le
akag
e su
rvey
met
hod
and
leak
age
dete
ctio
n te
am w
ill b
e es
tabl
ishe
d in
SIW
A.
By
this
, lea
kage
redu
ctio
n w
ork
will
be
root
ed a
nd e
ffect
ive
leak
age
redu
ctio
n pl
an w
ill b
e fo
rmul
ated
and
impl
emen
ted.
SIW
A st
aff m
aste
rs m
etho
d fo
r wat
er re
sour
ces
man
agem
ent a
nd e
xecu
te
regu
larly
mon
itorin
g of
wat
er
reso
urce
s.
Awar
enes
s of S
IWA
staf
f is
impr
oved
and
met
hod
for
impr
ovin
g ta
riff c
olle
ctio
n sy
stem
is le
arnt
.
Awar
enes
s of w
ater
co
nser
vatio
n is
impr
oved
and
m
etho
d fo
r red
ucin
g le
akag
e an
d w
asta
ge in
the
cust
omer
s’ pr
emis
es is
lear
nt.
Met
hod
for
expa
ndin
g w
ater
su
pply
to
the
unse
rved
are
as
is le
arnt
.
Leak
age
ratio
of H
onia
ra is
40%
an
d th
eref
ore
wat
er e
ffect
ive
ratio
is
as l
ow a
s 60%
. F
or th
is
reas
on, w
ater
supp
ly c
ost i
s so
high
that
inve
stm
ent b
udge
t for
fa
cilit
y im
prov
emen
t is s
mal
l and
th
eref
ore
it is
diff
icul
t for
SIW
A to
im
prov
e w
ater
supp
ly se
rvic
es.
Kon
glai
sprin
g, m
ain
wat
er so
urce
of
Hon
iara
, has
man
y pr
oble
ms
such
as b
lock
ages
of s
ink
hole
s an
d di
sput
es w
ith th
e la
nd o
wne
rs.
It is
inev
itabl
e th
at th
e w
ater
so
urce
shou
ld b
e sh
ifted
from
the
Kon
glai
sprin
g to
the
grou
ndw
ater
in
side
the
city
bou
ndar
y.
Ther
e ar
e se
vera
l pro
blem
s in
tarif
f col
lect
ion
syst
em.
Wat
er c
onsu
mpt
ion
is 3
34LC
D.
Fo
r thi
s rea
son,
wat
er d
istri
butio
n (o
r wat
er d
eman
d) b
ecom
es
556L
CD
and
this
lead
s to
one
of
the
caus
es fo
r hig
h m
aint
enan
ce
cost
.
30%
of t
he w
ater
serv
ice
area
is
unse
rved
. Esp
ecia
lly, e
xpan
sion
of
wat
er su
pply
to lo
w in
com
e cl
ass
area
s is n
eede
d.
Ther
e is
no
team
for l
eaka
ge
redu
ctio
n in
SIW
A so
that
le
akag
e re
duct
ion
wor
k ha
s no
t bee
n do
ne re
gula
rly a
nd
effe
ctiv
ely.
Ther
e is
no
staf
f of h
avin
g sk
ill f
or w
ater
res
ourc
es
man
agem
ent.
Awar
enes
s of s
olvi
ng th
e pr
oble
m is
not
so h
igh
for
SIW
A st
aff.
The
citiz
en o
f Hon
iara
has
a
little
aw
aren
ess o
f wat
er
cons
erva
tion.
Th
is is
be
caus
e SI
WA
has
not
po
sitiv
ely
addr
esse
d so
far
to th
e ci
tizen
for w
ater
co
nser
vatio
n.
SIW
A h
as n
oco
ncre
te
plan
s for
exp
andi
ng w
ater
su
pply
to th
e un
serv
ed
area
.
Technical Aspect Managerial, Financial and Institutional Aspect
Act
iviti
es fo
r C
apac
ity
Dev
elop
men
t E
xper
tise
to b
e D
evel
opm
ent
Issu
es F
acin
g SI
WA
C
urre
nt S
ituat
ion
of
SIW
A
・SI
WA
st
aff
rece
ives
C
/Ptra
inin
g in
Japa
n.
・PP
is e
xecu
ted.
・SI
WA
staf
f tra
ined
C/P
tra
inin
g in
Japa
n pa
rtici
pate
s in
PP
and
mas
ters
leak
age
surv
ey sk
ill.
・SI
WA
st
aff
rece
ives
C
/Ptra
inin
g in
Japa
n.・
Tech
nica
l tra
nsfe
r to
SIW
Ast
aff
is
done
by
the
Stud
yTe
amm
embe
r.
・SI
WA
staf
f par
ticip
ates
in P
P.
・PP
is e
xecu
ted.
・SI
WA
staf
f par
ticip
ates
in P
P.
・PP
is e
xecu
ted.
・SI
WA
staf
f par
ticip
ates
in P
P.
・PP
is e
xecu
ted.
Not
es )
SIW
A: S
olom
on Is
land
s Wat
er A
utho
rity,
LC
D: L
iter p
er c
apita
per
day
, PP:
Pilo
t Pro
ject
, C/P
: Cou
nter
Par
tSo
urce
: JI
CA
Stu
dy T
eam

The Study for Rehabilitation and Improvement of Solomon Islands Water Authority’s Water Supply and Sewerage Systems
Final Report : Summary Report (A-7)
A2.4 Public Relations/Participation Activities in the Study
Relation between SIWA and the communities is not good due to the problems of water quality, water bills, meter reading, etc. In order to establish good relation with the communities, SIWA should provide water supply services efficiently and disseminate information regarding authority management, water supply and sewerage systems based on better management of the authority. On the other hand, the communities should understand user pay system which is a policy implemented by SIWA as beneficiaries of water supply services, and participate in the activities of water conservation and protection of water sources (see Figure A2-4). Based on those points, public relations/participation activities of the Study are formulated and carried out.
Source : JICA Study Team
Figure A2-4 Establishment of Good Relations between SIWA and the Communities
Under the Study, the following activities were carried out in order to grasp current conditions of households, disseminate information regarding water supply and sewerage systems, raise public awareness of water conservation, and enhance public participation in formulation of mid-term facility improvement plan and action plans for SIWA and preparation of pilot projects.
Socio-economic survey ① Interview survey ② Workshop for Rapid Rural Appraisal (RRA)
Water conservation campaign (Pilot Project-3) ① Repair of leaking taps, showers and toilet at home, school and hospital ② Questionnaire survey on water conservation ③ Community workshop at Kaibia, Fulisango and Burns Creek ④ Medium programme (newspaper and radio) ⑤ Distribution of leaflets
Construction of shared standing pipe (Pilot Project-4) ① Construction of shared standing pipe ② Survey on current living conditions of residents before and after the project ③ Community workshop at Burns Creek
Mutual Understanding
Cooperation
< SIWA >
• Dissemination of information regarding authority management, water supply and sewerage systems
• Community consultation meeting/workshop to raise public awareness of water supply, sanitation and water conservation
< Communities >
• Socio-economic survey to grasp current conditions of households
• Provision of opinion about water supply and sewerage services
• Understanding of water tariff system • Participation in activities of water
conservation, protection of water source, etc.

The Study for Rehabilitation and Improvement of Solomon Islands Water Authority’s Water Supply and Sewerage Systems
Final Report : Summary Report (B-1)
PART B HONIARA WATER SUPPLY AND SEWERAGE
B1 Existing Conditions
B1.1 Natural Conditions
B1.1.1 Topography
Honiara city is located in the narrow coastal plain and hills in the inland side. Altitude of the terrace plains is different in accordance with geological age of its formation. It is classified into three plains.
Commercial and industrial areas of Honiara city are located in the coastal plain. Residential area is located in the top/slope of hills and bottom of valleys.
Rivers system in Honiara city consists of i) White River, ii) Rove Creek, iii) Mataniko River, and iv) Kombito Creek. They flow from the south to the north into Iron Bottom Sounds. (Refer to Annex-1)
B1.1.2 Climate
(1) Precipitation
Annual precipitation varies year by year from 1,265mm to 2,629mm during the past 20 years. Monthly precipitation is the maximum in February, with average of 281mm, and it is the minimum in July with average of 83mm. Amount of precipitation is proportional to elevation of area in Guadalcanal Island. Annual precipitation drastically increases from 1,700mm to 10,000mm from the shoreline to the top of mountains. Average annual precipitation of river basins of the Study Area is 2,500mm.
(2) Temperature
Average annual temperature is 27.4℃, which is almost constant throughout year. Monthly temperature is the maximum in April with 27.6℃, and the minimum in August with 27.0℃. Fluctuation of average monthly temperature is small and that of daily temperature is 7 to 8℃. It goes up to 32℃ in the daytime, and it goes down to 23℃ at night time.
B1.2 Socio-economic Conditions
According to the national census conducted in 1999, the population was 49,107 and household was 7404 within Honiara town boundary. The population growth rate was estimated as 2.8% for the whole nation in the 1999 census.
The 1999 population census enumerated a total of 409,042 people living in Solomon Islands. Melanesians comprised 96% of the population, followed by Polynesians with 3% and Micronesian with just over 1% and the remaining 1% for all other population. Males made up slightly more than half (51.7%) of the population whilst females constituted 48.3% of the population.
The majority of the people (84%) live in the rural areas, in small and widely dispersed settlement, mostly along the coasts.
Honiara is the capital of the Solomon Islands and located in northern part of Guadalcanal Island. Population of Honiara is accounts for 12% of the total population of the country. Major industry is fishing and agriculture but there are medium and small size industries such as food processing, beer, furniture, construction materials, etc.
1999 census report noted that households with 4-6persons are most common in the Solomon Islands and they represent over one quarter of all households. As for the employment status of those who are engaged in paid work, 78% are working for wage, compared with 12% for self-employed.

The Study for Rehabilitation and Improvement of Solomon Islands Water Authority’s Water Supply and Sewerage Systems
Final Report : Summary Report (B-2)
B1.3 Field Surveys
B1.3.1 Non Revenue Water Survey
(1) Non Revenue Water (NRW)
NRW is comprised of unbilled authorized consumption, apparent losses and real losses. The real losses (or physical losses) are considered as leakage which is obtained through leakage survey. The remaining volume excluding the real losses from NRW is the unbilled authorized consumption and the apparent losses. NRW ratio in 2004 was found as about 43%.
(2) Leakage Survey
The leakage survey was executed to find out the real loss or leakage ratio in Honiara. The survey was done in 10 model blocks selected from the whole area of Honiara city.
(3) Results of Leakage Survey
It is found that the leakage ratio in Honiara is 47.4% in average. However, the actual leakage ratio is set as 40% taking into account the unexpected usage by the residents in the area during the surveying period.
B1.3.2 Surface Water and Spring
Discharge measurements were carried out in June 2005 as dry season, November and December 2005 as rainy season. (Refer to Annex-2)
In the Table B1-1, Result of the discharge measurement of December is shown as rainy season.
Table B1-1 Characteristics of Objective River in Honiara
July.2005 December.2005
Name of Basin Area of Basin (km2 )
Length(km)
Maximum Flow (m3/s)
Specific Flow(m3/s/km2)
Maximum Flow (m3/s)
Specific Flow(m3/s/km2)
White River 10.2 10.0 0.160 0.016 0.034 0.003Rove Creek 4.8 3.5 0.076 0.016 0.016 0.003Mataniko River 57.8 15.0 1.272 0.022 1.852 0.032Kombito Creek 10.7(4.0) 9.0 0.055 0.005(0.014) 0.028 0.003(0.007)Lunnga River 377.0 50.0 16.000 0.042 29.600 0.078
Note: Figure in ( ) means the values of the river basin at the flow survey measurement. Source : JICA Study Team
Outlines of the survey results are described as follows;
For Mataniko River and Lungga River, having large catchment area in the mountain side and large precipitation in the rainy season, it was confirmed that discharge of dry season is less than that of rainy season.
For rivers having small catchment area such as White River, Rove Creek and Kombito Creek, it was confirmed that discharge of the rainy season is less than that of the dry season. The reasons are given as follows;
・ In White River, most of the water from Konglai Spring is supplied from Kovi Sinkhole where surface water goes into a cave that extends to the intake point of Konglai Spring. Kovi Sinkhole has been blocked by the flood occurred in October 2005. Therefore, it is considered that the discharge in the rainy season (November and December) was less than the discharge of the dry season (June).
・ In Rove Creek, it rained before the surveying day. It is considered that this is the reason for the discharge in the rainy season being less than that in the dry season.

The Study for Rehabilitation and Improvement of Solomon Islands Water Authority’s Water Supply and Sewerage Systems
Final Report : Summary Report (B-3)
・ In Kombito Creek, it is uncertain that it rained before the surveying day. It can be considered that the influence of the rainfall was found in the measurement results of Kombito Creek as well as Rove Creek.
Discharge property is different in each river basin and has annual variation caused by annual fluctuation of precipitation, area of the catchments and the property of groundwater recharge. Therefore, river discharge in the rainy season and dry season varies every year. In this Study, the discharge measured in the dry season was larger than that in the rainy season. This is because influence due to rain was remarkable for the small catchment area.
In consideration of the discharge measurement results and situations above, it can be concluded that the discharge measurement results of June 2005 are the base flow of each river.
B1.3.3 Groundwater Survey
(1) Geology
Rock formation in Honiara consists of limestone, calcareous sandstone/mudstone of Miocene to the recent, which overlies the basement rock, diorite of Oligocene. Stratigraphic classification of Honiara city area is shown in Table B1-2.
Table B1-2 Stratigraphic Classification of Honiara City Area
Age Formation Rock facies Thickness of formation Distribution in Honiara City
Holocene Alluvium Sand, clay, gravel <30m Distributed in the coastal plain and bottom of valleys
Pleistocene Honiara Coral Reef Limestone Coral Limestone <60m Distributed upper half of Marine
terrace
Qua
tern
ary
Pliocene~Pleistocene Honiara Beds
Calcareous sandstone, mudstone, conglomerate, limestone
<200m
Outcropping in the foot of marine terrace and can be encountered shallower than 200m from the ground surface.
Former~middle Miocene Mbonehe
Limestone Limestone <100m Not outcropping in Honiara City and encountered deeper than 100m from the ground surface. Te
rtiar
y
Late Oligocene Poha Diorite Fine Diorite -
Not outcropping in Honiara City and encountered deeper than 200m from the ground surface.
Source : Geology of the Honiara, MNR, 1979
(2) Hydrogeology
1) Aquifer classification
Aquifer of Honiara ground water basin is summarized shown as Table B1-3.

The Study for Rehabilitation and Improvement of Solomon Islands Water Authority’s Water Supply and Sewerage Systems
Final Report : Summary Report (B-4)
Table B1-3 Aquifer in Honiara Groundwater Basin Formation Groundwater Merit and demerit in groundwater development
Alluvium Sand and gravel layer store the groundwater.
Area of aquifer distribution, size of aquifer and recharge area is too narrow. It is subject to sea water intrusion.
Honiara Coral reef limestone
Limestone has much porosity suitable for groundwater storage. The Groundwater occurs as perched water.
Limestone is distributed only in upper half of terrace, and size of this aquifer is small. Recharge area is also small. So this aquifer is not suitable for large groundwater development. In addition, there is a risk of groundwater contamination from town area.
Honiara Beds
This formation comprises sandstone and limestone forming good aquifer. Water from Kombito Spring and Panatina Borefield comes from this formation.
Sandstone and limestone form confined aquifer in the depth of less than 100m. All the boreholes that were drilled so farare taking groundwater from Honiara Beds.
Mbonehe Limestone
This formation keeps huge amount of groundwater within in cave system, which has large recharge area. White River spring originates from this formation.
This aquifer exists deeper than GL-100m over the study area. Limestone is compact with poor porosity. Cave system with the groundwater is locally developed. It is not easy to detect the groundwater of this aquifer because of deep occurrence of groundwater. This aquifer can not be direct target of groundwater development
Poha Diorite Groundwater occurs as fissure water.
This formation exists too deep in the ground of the study to be target for groundwater development.
Source : SIWA, MNR, JICA
2) Hydrogeology of Honiara Groundwater Basin
Hydrogeological structure of the Honiara can be simplified as shown in Figure B1-1. Aquifers in Honiara can be considered independent from the other groundwater basins.
Source : JICA Study Team
Figure B1-1 Hydrogeological Structure of Honiara Groundwater Basin
3) Recharge to Honiara Groundwater Basin
Honiara Beds is distributed in the south of Honiara, where the aquifer is recharged by rainfall and rivers. It is assumed that Mbonehe limestone provides groundwater to the overlaying Honiara beds through fracture zones. In addition to this, down-ward groundwater recharge from Honiara Reef Limestone to Honiara Beds is also expected through fracture zones. Honiara Beds has good condition to get groundwater recharge.
Area for groundwater recharge
Groundwater recharge from Lungg River
White River Spring Honiara Reef Limestone
Honiara City Alluvium
Poha Diorite
Mbonehe Limestones
Sea water intrusion
Faults
Faults Up-ward groundwater movement along faults
Honiara Beds (promising for groundwater development)
Honiara Groudwater Basin

The Study for Rehabilitation and Improvement of Solomon Islands Water Authority’s Water Supply and Sewerage Systems
Final Report : Summary Report (B-5)
(3) Electric Resistivity Prospecting
1) Outline of survey
Electric resistivity survey was carried out in Honiara. The survey was done at 20 measuring points within Honiara town boundary. (Refer to Annex-3)
2) Results of resistivity prospecting
Results of the survey are summarized as follows;
• Electric resistivity structure of Honiara groundwater basin has homogeneous structure over the entire city.
• There are promising aquifers in the entire city between 20m to 100m in depth.
• Judging from the capacity of the existing boreholes, required water yield for the target year can be secured by the boreholes to be newly developed.
• Success ratio for drilling boreholes within Honiara town boundary will be high.
3) Sea water intrusion
Electric resistivity prospecting was carried out in the area of Honiara beds in this Study. According to its results, it has become clear that seawater intrusion is not taken place in aquifer which is located farther than 300m to 500m from the seashore.
B1.3.4 Water Quality Survey
(1) Contents of Water Quality Analysis
Water quality survey in Honiara consists of field water quality survey at site and water quality analysis in laboratory. Purposes for the survey are as follows;
• Field observation using water quality checker was carried out along rivers to confirm the current situation of contamination by sewage.
• Water sampling was carried out at sites to confirm water quality of water, the samples of which were taken from water sources and taps. The water quality analysis was done in SIWA laboratory.
Results of field water quality survey at site are shown in Section B.1.5.3 and results of water quality analysis in laboratory are shown in TableB1-11 and Section B.1.6.2. (Refer to Annex-4 and 5)
(2) Water Quality Standard in Solomon
WHO water quality guideline is applied as the water quality standard in Solomon. SIWA can analyze one (1) item of “Bacteria”, 12 items of “naturally occurring chemicals”, four (4) items of “chemicals used in water treatment or from materials in contact with drinking water, one (1) item of “chemicals from industrial sources and human dwellings”, three (3) items of “chemicals from agricultural activities”.
SIWA is regularly checking Faecal coliform, taste, color, odor, turbidity, magnesium (Mg), water temperature and conductivity.
As for the standard for water quality of public water bodies, there is no standard in Solomon Islands. B1.3.5 Ownership and Water Right of Water Sources
(1) Current Situation of Ownership and Water Right of Water Sources
According to Ministry of Water Resources, river/river water and groundwater belong to the Government, and use of water resources in large scale must be approved by the Ministry of Water Resources. To the contrary, it is also widely recognized that river and river water belong to

The Study for Rehabilitation and Improvement of Solomon Islands Water Authority’s Water Supply and Sewerage Systems
Final Report : Summary Report (B-6)
land-owners. Land-owners usually request payment for water right of river water if taken by SIWA. Then, the Government pays it to the land-owners. On the other hand, in the past there was no case that payment for water light of the groundwater was claimed by land-owners.
(2) Current Situation of Payment for Water Right
Current situation of payment by the Government/SIWA for water right in Honiara is summarized in Table B1-4.
Table B1-4 Current Situation of Payment for Water Right Water source/facilities Water right Land lease Note
1. White River Spring
25% of total sales of water from Konglai Spring. It is around S$3,600,000/year.
SI$32,000/year
• White River Spring is located within customary land.
• Contract period for water right with customary landowners is from 1981-2055 for 75 years. The contract is reviewed every 5 years.
2.
White River: Borehole W-1and W-2, pipe-line
- SI$8,000/year W-1 and W-2 are located within customary land.
3. White River: Borehole W-4 -
SIWA is now under negotiation with the current lease-holder who has leased the area from the Government.
W4 is located within Honiara
4. Skyline reservoir - SI$2000/year The reservoir is located within Honiara.
Source : JICA Study Team Contract on Konglai Spring is until year 2055. Following the contract, payment for land lease will be continued until 2055. On the other hand, payment for water right is proportional to water usage by SIWA. Therefore, payment for water right will be reduced if water usage is reduced.
B1.3.6 Socio-economic Survey
Socio-economic survey was carried out through interview with the sample households (414 samples) from July to August 2005 not only in Honiara but also in Noro, Auki and Tulagi. Researchers visited the sample households and asked questions in line with the questionnaire sheet. Sampling for the survey was done in cooperation with the Department of Statistics that has census information conducted in 1999. Due to no information such as address of household necessary to sample, households were selected by cluster sampling treating an area as a sampling unit, which considers an area as representative of all areas within the target area based on enumeration maps and dwelling number of the 1999 census.
(1) Results of Survey
Table B1-5 shows an average household size and the number of paid workers per household. 1999 census reported the average household size was 7.1 in Honiara, while the survey result shows that it is 8.6 persons. It seems that influx from provincial areas to Honiara is increasing after ethnic tension.

The Study for Rehabilitation and Improvement of Solomon Islands Water Authority’s Water Supply and Sewerage Systems
Final Report : Summary Report (B-7)
Table B1-5 Average Household Size and Number of Paid Workers per Household Item Survey Result
Average household size 8.6
Number of paid workers per household 2.1
Source : JICA Study Team
The average monthly income per household is SI$3,553 in Honiara. By income level, it is SI$4,456 for the high-income area and SI$2,007 for the low-income area. As shown in Figure B1-2, SI$1,001 to SI$2,000 group accounts 31%, followed by less than SI$1,000 group (27%) and SI$2,001- SI$3,000 group (13%).
0%
5%
10%
15%
20%
25%
30%
35%
Less th
an 1,
000
1,001-2,00
0
2,001-3,00
0
3,001-4,00
0
4,001-5,00
0
5,001-6,00
0
6,001-7,00
0
7,001-8,00
0
8,001-9,00
0
9,001-10,0
00
Over 10
,000
Source : JICA Study Team
Figure B1-2 Average Monthly Income per Household (Honiara) Households use four major types of water supply in Solomon: piped water, rain tank, bore hole/spring, and river/stream. As shown in Figure B1-3, piped water and rain water tanks are the main sources of drinking water. Low-income households are more dependent on the piped water than high-income households. 1999 census noted that piped water is the major source (89%) for the households in Honiara. However, the percentage obtained from this survey was lower (75%) because the high-income households use rain water tanks for the source of dinking water.
14%
14%
22% 47%2%1%
Piped water in dwelling
Piped water outside (private)
Piped water outside (shared)
Rain tank
Bore hole/spring/well
Other
Source : JICA Study Team
Figure B1-3 Sources of Drinking Water
78% of the households are satisfied with water volume in Honiara. Meanwhile, many people are not satisfied with water charge. This is because many of the households do not have a post office box to

The Study for Rehabilitation and Improvement of Solomon Islands Water Authority’s Water Supply and Sewerage Systems
Final Report : Summary Report (B-8)
which the bill is delivered from SIWA. Therefore, it is strongly recommended that SIWA deliver water bills to residences or households. Half of the respondents in Honiara think that water is the most important among them for improving their living condition.
Major type of toilet is flush type in Honiara, accounting for 70 percent. As shown in Figure B1-4, major sewage discharge is mainly done by septic tank. It is considered that protection of water sources from contamination is as important as the water supply to the customers. Direct contamination of water sources includes people’s wrong use of streams, rivers, bush and beaches for recreation spots or as toilets. Prevention of water contamination is responsibility to be partly taken by the people in Honiara. Therefore, people should understand the causes of water contamination and some penalties should be applied when people cause water pollution in Honiara. Almost half of the respondents have the experiences of water-borne disease. Over 90% of households think that water source should be conserved in order to avoid contamination of water.
5%
71%
24%
SewerconnectionSeptic tank
Latrine, etc.
Source : JICA Study Team
Figure B1-4 Sewerage Discharge System in Honiara
(2) Findings from Socio-Economic Survey
87% of the respondents pointed out the problems of water supply and sewerage systems. The most common opinion about water supply is poor water quality and necessity of filtration. Half of the respondents noted that water was contaminated and not safe for drinking after rain or filtration system should be installed to purify water. Unreliable billing system/meter reading and low water pressure are also their major concerns about water supply.
SIWA conducted a customer satisfaction survey in Honiara in April 1998. The customer services with which customers were satisfied least were meter reading, followed by field staffs. Although meter readers are the most visible among SIWA’s staffs, the public perception of meter readers is the worst of all and has not been improved since this customer survey.
More than 2,000 meters do not work properly at moment because most of them are used over 35 years. SIWA applies fixed rate of SI$41.04 to the customers for the broken meters. It accounts one-third of the domestic users. Some customers said that the water charge was suddenly increased after replacement of meter and they doubted meter readers might estimate the amount. Less information leads to unreliability of meter reading and billing system.
There are households sharing a meter but having separate account for each household. In that case, those households pay the same amount of water charge because monthly water consumption is divided by the number of households sharing the meter. However, the number of family and actual water use differs from one to another. Those households feel that this billing system is unfair. This system also caused less reliability of meter reading and billing system.
In order to improve consumer services and perception of the public, and to establish better relationship with the public, the following actions should be taken by SIWA;
• Improvement of reliability/the public perception of meter reading • Dissemination of information (Public relations) • Community education/public awareness

The Study for Rehabilitation and Improvement of Solomon Islands Water Authority’s Water Supply and Sewerage Systems
Final Report : Summary Report (B-9)
• Improvement of billing system • Consideration on the low-income households
(3) Willingness to Pay (WTP)
As shown in Table B1-6, monthly water charge averages SI$138.22 for Honiara, SI$147.16 for the high-income group (more than the average) and SI$128.80 for the low-income group (not more than the average). Based on data gained from the socio-economic survey, average marginal willingness to pay (MWTP) for better water supply is SI$56.53 per month for Honiara, SI$71.94 for high-income group and SI$38.34 for the low-income group (MWTP, Table B1-6). WTP is the sum of monthly water bill and MWTP. It is total monthly amount which they are prepared to pay for better water supply.
Table B1-6 Monthly Water Charge and Willingness to Pay in Honiara (SI$/month)
Area Monthly
water charge
(A)
MWTP 1
(B) WTP 2 (A+B)
High-income group 147.16 71.94 219.10 Low-income group 128.80 38.34 167.14
Average 138.22 56.53 194.75 Notes: 1 Willingness to pay for the better water supply services 2 Sum of monthly bill (A) and WTP (B) Source : JICA Study Team
The water tariff should be set at the rates less than the amount of ability to pay (ATP). ATP is calculated by the statistics of income and distribution of household expenditure. After summing up monthly water bill and WTP, it is not affordable for the respondents to pay for water supply.
Table B1-7 Monthly Water Charge, WTP and ATP in Honiara
Income Group Monthly water bill WTP ATP
High-income group 147.16 (3.3%)
219.10 (4.9%) 178.24
Low-income group 128.80 (6.4%)
167.14 (8.3%) 80.28
Average 138.22 (3.9%)
194.75 (5.9%) 142.12
Note 1: Percentage in blackest is an expenditure ratio of water supply to the average income. 2: Highlighted cells mean over 4% of expenditure ratio of water supply. 3: Monthly water bill for high and low-income groups of Honiara is an average after eliminating the
extremely high values Source : JICA Study Team
Suppose that the household which monthly income is lower than average monthly income are categorised as low-income group, 73 % of the households in Honiara belong to low-income group and 27 % to high-income group. Based on the OECD’s measuring method of poverty line which is 50 % of median income, poverty line in Honiara is calculated as SI$1,000 per month and 26% of the respondents are categorised as poverty. In this case, ATP for water supply is SI$40 per month for the households on and under the poverty line.
Based on these results, it seems difficult for SIWA to increase the water rates due to less affordability of the customers unless countermeasures for improving customer service level are carried out.

The Study for Rehabilitation and Improvement of Solomon Islands Water Authority’s Water Supply and Sewerage Systems
Final Report : Summary Report (B-10)
B1.4 Water Supply System
(1) Current Situation
As a result of the field surveys and analysis of collected data, conditions of water supply system have been confirmed as follows;
About 50% of the water source depends on Konglai Spring which is vulnerable to reduction of water intake volume by blockage of the inflow point (or sinkhole) of the source by heavy rain and vandalism.
About 25% of the population in Honiara water distribution districts is suffering from low pressure so that the residents cannot get water during the day time.
Water transmission pipeline and distribution pipeline are not separated so that the water distribution reservoir cannot work with its original functions such as absorbing peak demand, supplementing water supply in emergency case, etc.
Pipe diameters are too small to transfer the required water to customers. Inadequate pipe diameter is also the cause of low water pressure.
Capacity of the existing water reservoir is only about 5 hour-volume of daily maximum water demand.
Water from spring sources is often contaminated with high turbidity after heavy rain in the catchment area of the sources.
Unserved ratio is estimated as 30%. There are unserved areas not only outside the city boundary but also inside the city boundary. Especially, in Kombito area where a spring and borefield as water sources are located, the residents (estimated as 6,000) are not served. Getting water directly from the spring or river every day is a burden of the household wives and children.
(2) Data for Water Supply Service
Basic data for water supply service for Honiara in 2005 were confirmed as follows:
Table B1-8 Basic Data for Water Supply Service for Honiara in 2005 Code Item Unit Data
A Population inside town boundary person 60,365 B Population outside town boundary person 6,037 C Population in water supply service districts [A + B] person 66,402 D Served population person 46,221 E Served ratio [(D/C) x 100] % 70 F Revenue water ratio % 57 G Non-revenue water ratio % 43 H Leakage ratio % 40 I Effective water ratio [100-H] % 60 J Effective water consumption (distributed water-leakage) m3/day 15,431 - Domestic m3/day 7,596 - Commercial m3/day 4,390 - Government m3/day 1,963 - Major customers (hotel, school, hospitals, etc.) m3/day 1,482
K Per capita water consumption for domestic customers LCD 164 L Per capita water demand for domestic customers LCD 274 M Maximum daily water demand m3/day 25,719
Note : Revenue water ratio = [(Billed metered consumption + Billed Unmetered consumption)/water distributed] x 100
Non revenue water ratio = [(Water distributed – Billed authorized consumption)/Water distributed] x 100
Source : JICA Study Team

The Study for Rehabilitation and Improvement of Solomon Islands Water Authority’s Water Supply and Sewerage Systems
Final Report : Summary Report (B-11)
B1.5 Water Source
B1.5.1 Existing Sources
The existing water sources for the current water supply by SIWA are classified into springs and boreholes as shown in Table B1-9 and Table B1-10.
Table B1-9 Spring Sources for Water Supply by SIWA Spring
Site Name Water intake
volume(m3/day) Geology of spring point
White River Konglai spring 12,430 Honiara beds Rove Rove spring 1,780 Honiara coral reef limestone Kombito Kombito spring 2,600 Kombito marl Source: SIWA (average volume of June 2005)
Table B1-10 Groundwater Sources for Water Supply by SIWA in Honiara Borehole No. Diameter
(inch) Depth(m)
Yield*1
(m3/day)S.W.L *2
(GL-m)D.W.L*3(
GL-m) Aquifer Current use*4
White River
W-1 8 80 (880) -0.7 9.0
W-2 8 80 (880) -0.8 8.0 W-3 8 80 (880) -0.5 6.0 W-4 8 80 (880) -0.5 16.0
• Sandstone of Honiara Beds
Mataniko M-1 8 100 703 6.0 8.0 ○
M-2 8 100 850 7.0 12.0 ○ M-3 8 100 1160 5.2 9.0 ○ M-4 8 100 0 6.1 - M-5 8 50 1380 4.7 9.0
• Sandstone of Honiara Beds
• Mbonehe Limestone
○ No.1 6 48 720 24.5 ○ No.2 6 90 0 2.0 26.7
No.3 6 99 0 -
• Sandstone of Honiara Beds
• Mbonehe Limestone
Kombito K-1 8 80 1,020 6.5 17.0 ○ K-2 8 80 750 2.3 18.0 ○ No.1 10 20 0 2.8 - No.2 10 60 0 Flowing
bore -
Sandstone and limestone of Honiara Beds
Panatina No.1 6 64 2350 20.5 ○ No.2 6 64 680 5.0 40.5 ○ No.3 6 48 670 20.2
Sandstone of Honiara Beds
○ Ndondo Creek - 5 15 130 2.0 5.9 Alluvial sand
Note : 1. Water intake volume is from SIWA showing average value of June 2005 2. S.W.L stands for Static Water Level. 3. D.W.L stands for Dynamic Water Level. 4. ○ means “in use”
Source : SIWA B1.5.2 Reduction of Discharge from Konglai Spring
Amount of discharge from Konglai Spring has seriously been reduced by the blockage of sinkhole since October 2005. Amount of discharge has not yet recovered as of June 2006. Characteristics of Konglai Spring and reduction of discharge are summarized below;
(1) Geological Structure of Konglai Spring
It is said that water falling into Kovi sinkhole, which is located in the middle-reach of White River, is the main water source of Konglai Spring (see Figure B1-5). It is assumed that water from Matangguaggulu River appears at immediate upper-reach of Kovi sinkhole crossing water-shed.

The Study for Rehabilitation and Improvement of Solomon Islands Water Authority’s Water Supply and Sewerage Systems
Final Report : Summary Report (B-12)
Source : JICA Study Team
Figure B1-5 Image of Cave System of Konglai Spring to Kovi Sinkhole
(2) Blockage of Sinkhole in Konglai Spring
In the past 10 years, there were six (6) serious blockages in Konglai Spring, and discharge from the spring was much reduced. SIWA and Ministry of Natural Resources carried out field survey, and they got conclusion that reduction in Konglai Spring water was caused by blockage of Kovi Sinkhole.
(3) Current Discharge from Konglai Spring
Even after reduction of discharge, Konglai Spring still produces constantly 40% (5000m3/day) of the water intake volume in normal condition, all the volume of which is currently taken by SIWA. After heavy rainfall, spring water increases immediately and sometimes recovers to 100% of the normal water intake volume. But it is temporary recovery. It should be noticed that spring water after heavy rainfall has high turbidity.
(4) Future Use of Konglai Spring
Konglai Spring has two problems as follows;
(1) Kovi Sinkhole is vulnerable to blockage in flooding. (2) It is restricted by landowner for SIWA to get access to Kovi sinkhole to remove blockage. Maintenance of Konglai Spring is difficult because it is vulnerable to heavy rainfall, and its restoration depends on landowner. Sedimentation in the Kovi sinkhole becomes more serious year by year, and it will be more difficult to restore from the blockage year by year. Therefore, water from Konglai Spring should be gradually replaced by groundwater from boreholes to be newly developed.
B1.5.3 Results of Water Quality Analysis for Water Source and Tap Water
The results of water quality analysis for water sources and tap water are shown in Table B1-11.
Konglai Spring
Sinkholes Honiara Beds
Mbonehe LimestoneKovi
Sinkhole
White River Basin Matangguaggulu River Basin

The Study for Rehabilitation and Improvement of Solomon Islands Water Authority’s Water Supply and Sewerage Systems
Final Report : Summary Report (B-13)
Table B1-11 Results of Water Quality Analysis
Item Nitrate (mg/L)
Nitrite (mg/L)
Ammonium nitrogen (mg/L)
Mn (mg/L)
Cl2 (mg/L)
Cl (mg/L)
Cr (VI) (mg/L)
Total Coliform
(MPN/mL)WHO Guidline 50 3 - 0.4 - 5 0.05
White River Well W-1 0.02 0.002 0 0 0 0.047 0.021 over 200
White River Well W-2 0.03 0.002 0 0 0 0.011 0.024 0
White River Well W-3 0.02 0.002 0 0.001 0 0.035 0.020 4
White River Well W-4 0.09 0.005 0 0.003 0 0.043 0.038 0
Mataniko Well M-2 0.03 0.010 0.015 0.540 0 0.023 0.100 over 200
Mataniko Well M-4 0.03 0.037 0.018 0.540 0 0.035 0.100 200
Mataniko Well No.1 0.03 0.010 0.152 0.510 0.012 0.031 0
Kombito Well K-1 0.01 0 0 0 0 0.061 0.057 5
Kombito Well K-2 0.04 0 0 0.021 0 0.055 0.057 17
Panatina Well No.1 0.03 0.001 0 0.005 0 0.026 0.016
Panatina Well No.2 0.04 0.005 0 0.003 0 0.022 0.018 0
Panatina Well No.3 0.04 0.005 0.006 0.003 0 0.018 0
Panatina Tank 0.05 0.002 0 0.004 0 0.026 0.016
White River Kongulai Spring 0.17 0.006 0.600 0.020 0 0.001 0.021 over 200
Rove Creek Rove Spring 0.90 0.600 1.030 0 0 0.037 0.024 over 200
Kombito Spring-1 1.07 0.046 0.960 0.041 0.042 0.012 0
Kombito Spring-2 1.38 0.096 0.044 0.038 0 0.057 0.047 over 200
Mt.Austen new Spring Source 0.93 0.046 0.062 0.011 0 0.003 0.033 over 200
Wat
er S
ourc
es
(spr
ings
and
bor
ehol
es)
Mamulele new Spring Source 1.50 0.009 0.005 3.330 0 5.000 0.009 0White River High Level
System 0.18 0.006 0.011 0.500 0.3 0.810 0.023 0
White River Gravity System 0.18 0.005 0.024 0.530 0.6 0.790 0.023 0
Rove Gravity System 0.90 0.600 1.030 0 0 0.037 0.024 0
Mataniko Skyline System 0.04 0.010 0.093 0.044 0.4 0.012 0.031 0
Mataniko SIWA System 0.02 0.002 0.062 0.061 0.3 0.017 0.022
Kombito K-1,K-2 System 0.04 0.009 0.008 0.017 0 6.300 0.100 78
Kombito Spring System 0.93 0.087 0.063 0.038 0.3 0.057 0.042 over 200
Tap
wat
er
Panatina System 0.05 0.002 0 0.004 0 0.026 0.016 0
Source : JICA Study Team
Water samples for water quality analysis of water sources were taken from Konglai Spring and W-1 to W-4 in White River area. According to the results of analysis, water quality of water sources satisfied WHO guideline values except for total coliform in W-1 and W-3. On the other hand, tap water did not have any problem in water quality.
Water samples for water quality analysis of water sources were taken from Rove Spring in Rove
Creek area. According to result of analysis, water quality of Rove Spring satisfied WHO guideline values except for total coliform. On the other hand, tap water did not have any problem in water quality.
Water samples for water quality analysis of water sources were taken from Well M-2/M-4 and
SIWA No.1 in Mataniko river area. According to the result of analysis, water quality of water sources exceeded WHO guideline values in total coliform and manganese. On the other hand, tap water did not have any problem in water quality.
Water samples for water quality analysis of water sources were taken from SIWA spring point,
borehole K-1 and K-2 and candidate sites for new water sources in Kombito Creek area. According to the result of analysis, water quality of water sources satisfied WHO guideline values except for total coliform and Chrome (VI). On the other hand, more coliforms were detected in tap water than in source water. It is considered that coliforms were put into water in distribution.

The Study for Rehabilitation and Improvement of Solomon Islands Water Authority’s Water Supply and Sewerage Systems
Final Report : Summary Report (B-14)
Water samples for water quality analysis of water sources were taken from borehole No.1, No.2, No.3 and distributing tank in Panatina area. According to the result of analysis, water quality of water sources satisfied WHO guideline values. Tap water did not have any problem in water quality.
B1.5.4 Countermeasures against Contamination of Water Source and Tap Water
As shown in Table B1-11, coliform group was detected in the groundwater of the boreholes in wide area covering White River, Mataniko River and Kombito Creek. Additionally, coliform group was detected from drinking water supplied through water distribution system of Kombito Creek. Countermeasures against coliforms are as follows;
(1) Coliforms in Water Source
Since water from the boreholes can be disinfected by chlorine in water distribution system from water sources to consumers, regular monitoring of residual chlorine at the end of water distribution network will prevent existence of coliforms. However, protection of boreholes of water sources should be considered against imperfect chlorination due to technical problems in disinfection facilities.
It is presumed that coliforms in the groundwater from boreholes be caused by infiltration of wastewater into aquifer of borehole. The wastewater was from septic tanks of the residents around boreholes, which infiltrated into the aquifer because sealing between borehole and casing is not enough.
Following countermeasures are proposed;
1) Concrete slab around borehole should be reconstructed, which can prevent infiltration of waste water into the ground.
2) Type of septic tank should be changed from seepage type to storage type such as concrete pit. In this case, community septic tank is desirable in view point of maintenance by SIWA. Night soil will be regularly collected by vacuum vehicle of SIWA.
3) For the area near the boreholes, public sewage discharge system should be constructed.
(2) Coliforms in Tap Water
It is considered that coliforms in water distribution system are caused by technical problems in the chlorination facility or insufficient dosage of chlorine. Residual chlorine in water must be checked more strictly by SIWA although it is done regularly at present. In addition to it, daily maintenance of chlorination facilities and control of chlorine dosage should be done by SIWA.
B1.6 Sewerage System
B1.6.1 Issues for Sewage Drainage and Treatment Service
(1) Current Situation
As a result of the field surveys and analysis of collected data, current conditions of sewage drainage and treatment have been confirmed as follows:
There are no sewage treatment facilities in Honiara except small scale treatment facility in a central hospital and a few private companies.
Only about 11% of the residents connect with sewer pipelines and the sewage is discharged into Iron Bottom Sea and Mataniko River through outfall pipes without any treatment.
Most of the sewage outfall pipes are damaged at the seashore, so that the sewage is now diffused not offshore but along the seashore.
About 90% of the residents discharge sewage into septic tank. Sewage is flooding from some of the septic tanks and flowing into the river.
Sludge generated from communal and household septic tanks is dumped at the final disposal site

The Study for Rehabilitation and Improvement of Solomon Islands Water Authority’s Water Supply and Sewerage Systems
Final Report : Summary Report (B-15)
without any treatment.
(2) Data for Sewerage System
Basic data for sewerage sewage for Honiara in 2005 have been confirmed as follows:
Table B1-12 Basic Data for Sewerage Service for Honiara in 2005 Code Item Unit Data
A Population inside city boundary Person 60,365 B Population connected to sewer network Person 7,450 C Population using septic tank Person 52,915 D Served ratio [B/A x 100] % 11.2 E Sewage discharge per person LCD 334 F Sewage volume discharged into sea and river m3/day 2,490
Source : JICA Study Team B1.6.2 Sewage Volume and Water Quality of Related Public Waters
(1) Sewage Volume
Sewage volume in Honiara was estimated as 15,400m3/day from the current water distribution volume and leakage ratio. Among this volume, the sewage discharged into the public sewer system is estimated as 2,490m3/day and it is discharged into sea or river without any treatment. Remaining amount of sewage is dealt with septic tanks of each household.
(2) Result of Field Water Quality Survey on Contamination by Sewage
Field water quality survey was done in rivers/estuaries and at outlets along the seashore to confirm the extent of contamination by sewage drained from the surrounding areas. The summary of the survey is as follows;
1) Results of the field water quality survey of White River
• Water quality does not show remarkable difference between the dry season (June and August) and the rainy season (November and December).
• Considering change in DO value along the river (7.9-6.4 mg/L in the up-stream area and 2.3-1.0 mg/L in the down-stream area), it seems that contamination is more serious in the down-stream area. On the other hand, contamination is not so serious in the seashore around estuaries according to survey result (COD is 1-2 mg/L).
2) Results of filed water quality survey of Rove Creek
• Water quality does not show remarkable difference between the dry season (June and August) and the rainy season (November and December).
• DO value along the river is 2.2-5.6 mg/L in the up-stream area and 3.1-6.7 mg/L in the-down stream area. Water quality does not show remarkable difference along the river. Contamination is not so serious in the seashore around estuaries according to survey result: COD is 0-2 mg/L.
3) Result of field water survey of Mataniko River
• Water quality does not show remarkable difference between dry season (June and August) and rainy season (November and December).
• Considering change in DO value along the river (5.3-8.0mg/L in the up-stream area and 3.3-4.3 mg/L in the down-stream area), it seems that contamination is more serious in the down-stream area.
• Contamination in the seashore near estuaries is more serious in the rainy season than in the dry season according to survey result: COD is 0-2 mg/L in dry season, 5-7mg/L in rainy season.
4) Result of field water survey of Kombito Creek
• Water quality does not show remarkable difference between dry season (June and August) and
The Study for Rehabilitation and Improvement of Solomon Islands Water Authority’s Water Supply and Sewerage Systems
Final Report : Summary Report (B-16)
rainy season (November and December). • Considering change in DO value along the river (4.1-7.4mg/L in the up-stream area, in the middle-
stream area 0.3-2.3 mg/L and 3.0-7.1 mg/L in the down-stream area), it seems that contamination is more serious in the middle-stream area. There are pig farms in the middle-stream area, which is causing water contamination.
• Kombito creek disappears on the way before reaching the seashore.
5) Result of field water survey of Lungga River
• Water quality does not show remarkable difference between dry season (June and August) and rainy season (November and December).
• DO value along the river is 7.1-8.2 mg/L in the up-stream area and 6.6-8.2 mg/L in the-down stream area, which implies littler contamination in the river and no contamination source along the river.
6) Waste water outfall at seashore and along the Mataniko River
Observed COD is 0-7mg/L at entire survey points. COD is usually low (1-2mg/L), though COD becomes temporally high (5-7 mg/L) at some points for the peak period of domestic wastewater discharge.
B1.6.3 Outline of Existing Sewerage System
Honiara sewerage system consists of the following facilities.
Collection : Sewer network exists in some areas. In most of the areas, individual septic tank is generally applied.
Drainage and discharge : Booster pumping station (2 nos.) Outfalls (14 nos.)
Treatment : Communal septic tank is applied in three (3) areas (Tuvaruhu, Vara Creek and Rove area). There are three (3) small-scale wastewater treatment plants operated by hospital and private
company. There are no other treatment plants in Honiara.

The Study for Rehabilitation and Improvement of Solomon Islands Water Authority’s Water Supply and Sewerage Systems
Final Report : Summary Report (B-17)
B2 Mid-term Facility Improvement Plan
B2.1 Water Demand Projection
Design population for the target year 2010 has been set based on the national census in 1999 and the AusAID report titled as “Development of the Solomon Islands Urban Water & Sewerage Infrastructure – Project Design Study” prepared in 2000. Water demand in 2010 is determined by the design served population, per capita per day consumption and effective water ratio. Design data for the water supply facility improvement plan for 2010 are as follows:
Table B2-1 Design Data for Water Supply Facility Improvement Plan for 2010
Code Item Unit Data (2010)
Data (2005)
A Population inside town boundary -- 71,695 60,365 B Population outside town boundary -- 7,170 6,037 C Population in water supply service districts [A + B] -- 78,865 66,402 D Served population -- 61,520 46,221 E Served ratio [(D/C) x 100] % 78 70 F Revenue water ratio % 57 57 G Non-revenue water ratio % 43 43 H Leakage ratio % 40 40 I Effective water ratio [100-H] % 60 60 J Effective water consumption (distributed water-leakage) m3/day 18,352 15,431 - Domestic m3/day 10,118 7,596 - Commercial m3/day 4,614 4,390 - Government m3/day 2,063 1,963 - Major customers (hotel, school, hospitals, etc.) m3/day 1,558 1,482
K Per capita water consumption for domestic customers LCD 164 164 L Per capita water demand for domestic customers LCD 274 274 M Maximum daily water demand m3/day 30,587 25,719
Source : JICA Study Team
B2.2 Potential Projection of Water Source Development
B2.2.1 Surface Water and Spring
(1) Criteria of Exploitable Surface Water
1) Evaluation in normal river flow
Exploitable discharge of surface flow is commonly defined as the surplus of “Low-water discharge” after deduction of “Current water intake by SIWA” and “Normal discharge”. Normal discharge is composed of maintenance flow discharge and intake water volume at downstream area. In objective rivers, no facility for water intake is identified at the down-stream area. Therefore, normal discharge is considered as equivalent to the maintenance flow discharge.
In Japan, maintenance flow discharge is set up a standard of approximately 0.3m3/s/100km2. This maintenance flow discharge shall be applied for calculating exploitable discharge of the river surface flow.
Newly exploitable flow discharge shall be defined as follows,
Newly Exploitable flow discharge = [(Low-water river discharge) – (Current water intake by SIWA)] – (Normal discharge)
Normal discharge = Maintenance flow discharge = 0.3m3/s/100km2 ×Area of river basin(km2)/100

The Study for Rehabilitation and Improvement of Solomon Islands Water Authority’s Water Supply and Sewerage Systems
Final Report : Summary Report (B-18)
2) Evaluation in Environmental Aspect Other than from aspect of normal river flow, exploitable discharge was evaluated from aspect of social environmental view points, such as water use by local people, condition of water quality such as turbidity and bad smell. Based on result of analysis in normal flow aspect, it was confirmed that every rivers have potential for new exploitation. However, new water exploitation should be evaluated impossible, if water use of local people is affected or water quality is deteriorated by new exploitation.
(2) Newly Exploitable Surface Water
The summary of exploitable surface water in Honiara area is shown in Table B2-2. White river, Rove creek and Kombito creek have a little capacity for new exploitation in aspect of normal river flow. However, river water is used by local people living in the water source area for tapping, bathing, washing. Domestic waste water flows into the rivers in the down-stream area, which deteriorate the river environment showing white turbid water with bad smell. This means the current discharge at down- stream area is not enough to purify water quality. Therefore, exploitation of above 3 rivers should be avoided considering both “Normal flow aspect” and “Environmental aspect”.
On the other hand, as Mataniko and Lungga River have large discharge due to large basins area. Those rivers have enough potential to satisfy water demand for Honiara area.
Table B2-2 Summary of Newly Exploitable Surface Water in Honiara Area Potential of exploitable surface water*1 Water resource
Normal flow aspect Environmental aspect Total evaluation White river 0.022m3/s (1,900m3/day) 0 Rove creek 0.040m3/s (3,456m3/day)
New exploitation is difficult 0
Mataniko river 1.099m3/s (94,954m3/day) No problem in new exploitation 1.099m3/s (94,954m3/day) Kombito Creek 0.016m3/s (1,382m3/day) New exploitation is difficult 0 Lungga river 14.87m3/s (1,284,768m3/day) No problem in new exploitation 14.87m3/s (1,284,768m3/day)
Note: 1. Exploitable discharge is in the down-stream of the current water-intake of SIWA Source : SIWA
B2.2.2 Groundwater
(1) Water Balance and Groundwater Potential of Honiara Groundwater Basin
Groundwater potential of Honiara Groundwater Basin was evaluated from water balance analysis following relationship below.
① Precipitation = Evapo-transpiration + River Discharge + Groundwater flow to the sea (Direct runoff + Base flow) ② Groundwater Potential = Base flow + Groundwater flow to the sea
<Water balance and groundwater potential in Honiara Groundwater Basin>
Water balance and groundwater potential in Honiara Groundwater Basin was analyzed based on data for Lunga river. Result is shown below.
① Precipitation = Evapo-transpiration + Direct run-off + Base flow + Groundwater
flow to the sea 2,500mm/year
(100%) 1,400mm/year (56%)
324mm/year (13%)
355mm/year (14%) 421mm/year
(17%)
②Groundwater Potential = Base flow + Groundwater flow to the sea = 776mm/year ≑ 700mm/year
355mm/year 421mm/year
(2) Groundwater Development Potential
Groundwater development potential of Honiara Groundwater Basin should be less than the

The Study for Rehabilitation and Improvement of Solomon Islands Water Authority’s Water Supply and Sewerage Systems
Final Report : Summary Report (B-19)
groundwater potential that was evaluated by water balance analysis as shown Table B2-3.
Table B2-3 Groundwater Development Potential Basin Area of Honiara groundwater basin Groundwater Potential
59.4 km2 700 mm/year 113,900 m3/day Source : SIWA
The groundwater development potential from Honiara Groundwater Basin was evaluated as shown in Table B2-4.
Table B2-4 Groundwater to be Developed Groundwater potential Current extraction of groundwater Groundwater
development potential
113,900 m3/day
-
14,663m3/day
• 10,283 m3/day from boreholes • 4,380 m3/day from Love and
Kombito spring
=
99,237 m3/day
Source : JICA Study Team
B2.2.3 Optimum Water Resources
(1) Selection of Water Resources
Potential of water resources is summarized in Table B2-5.
Table B2-5 Water Demand in 2010 and Water Resources Development Potential Water development potential
Area
Water demand in
year of 2010 (m3/day)
Water to be developed newly*1
(m3/day)
Type of water source
Remaining potential*2
(m3/day) Water quality Land ownership
Surface- water
• Mataniko River: 29,980 • The other rivers: 0
Purification plant is
necessary
Customary land Honiara 30,587 12,717
Ground- water 99,237 Chlorination
only Town area
Note 1. Water to be developed newly = Water demand in 2010 – Current water extraction from existing sources (25,719m3/day) 2. Remaining potential=Development Potential-Current water extraction
Source : SIWA In this Study, groundwater is proposed for source of water supply to meet water demand of year 2010. Groundwater is more favorable than surface water in terms of items below.
• Construction cost for water intake facilities • Water quality • Stability of water sources in connection to land-owner ship
(2) Important Notice in Groundwater Development
In formulation of groundwater development plan, items below should be taken into consideration.
• Boreholes that are located too near to the sea will cause sea water intrusion. Therefore, new boreholes should be located more than 500m far from the shoreline.
• New boreholes should be located within Honiara town area to prevent problem of water right in costmary land, though there was no similar case in the past.
• New wells should be located near the current water supply system to reduce construction cost for connection pipe between new boreholes and the current water supply system.

The Study for Rehabilitation and Improvement of Solomon Islands Water Authority’s Water Supply and Sewerage Systems
Final Report : Summary Report (B-20)
(3) Amount of Groundwater to be Developed and Number of Boreholes Necessary
Amount of groundwater to be developed in 2010 shall be determined taking into account the current available water sources and the water demand. Yield from one borehole is expected 800 (m3/day). Therefore, number of boreholes required in 2010 is calculated by the following formula.
Amount of groundwater to be developed Number of boreholes required in 2010 = 800 (m3/day)
B2.2.4 Groundwater Development Plan
(1) Drilling Points and Landownership
Drilling points are shown in Table B2-6. Every drilling point is located within Honiara town boundary. Land within Honiara belongs to the Government. Therefore, payment for water right is not necessary for the groundwater from boreholes within Honiara. (Refer to Annex-6)
Table B2-6 Drilling points and land-ownership
Area Borehole No. Current land-ownership
N-1 N-2 N-3
Tasahe new borefield (Ngossi Area)
N-4
Public
M-1 M-2 M-3
Titinge new borefield (Mbokona Area)
M-4
Public
MB-1 MB-2 MB-3
Skyline new borefield (Mbokonavera Area) MB-4
Public
Ko-1 Public Ko-2 Church Ko-3
Borderline new borefield (Kombuvatu Area) Ko-4 Public
Source : SIWA
(2) Drillng Plan
Hydrogeology and borehole specifications are shown in Table B2-7.

The Study for Rehabilitation and Improvement of Solomon Islands Water Authority’s Water Supply and Sewerage Systems
Final Report : Summary Report (B-21)
Table B2-7 Hydrogeology and Borehole Specification
Area Well No. G.E.*1 Assumed
G.W.L.*2 Planned Depth
Planned Φ*3 Aquifer
Depth of Aquifer (m) *4
Geological structure
N-1 67m 64m N-2 62m 59m N-3 56m 53m
Tasahe new borefield (Ngossi Area)
N-4 67m 64m
Honiara Bed 20-100 Fractured
zone
M-1 63m 60m M-2 51m 48m M-3 54m 51m
Titinge new borefield (Mbokona Area) M-4 54m 51m
Honiara Bed 40-100 Fractured
zone
MB-1 58m 55m MB-2 52m 49m MB-3 44m 41m
Skyline new borefield (Mbokonavera Area) MB-4 40m 37m
Honiara Bed 30-100 Fault
Ko-1 62m 59m Ko-2 54m 51m Ko-3 56m 53m
Borderline new borefield (Kombuvatu Area) Ko-4 56m 53m
100m 8 inch
Honiara Bed 30-100 Fault
Note 1 Ground Elevation 2. Groundwater level is assumed from relation below: Groundwater level of proposed borehole = Ground elevation
– 10(m) 3. Diameter of borehole 4. Result of electric resistivity survey
Source: SIWA
B2.3 Plan for Water Supply Facility Improvement
For the facility improvement plan for water supply and sewerage systems, AusAID gave technical assistance to Solomon and the feasibility study (F/S) report was prepared in 2000. In the present Study, unit prices for materials and equipment of the AusAID report have been applied in the cost estimation in the Study.
The unit prices of AusAID report are considered reasonable because it is found that the equipment price such as pumps calculated with the inflation ratio of 4% applied under the ongoing Asian Development Bank (ADB) project is reasonable when compared with the present price.
(1) Basic Policy
In the Study, in consideration of SIWA’s policy for shifting water sources from the sources in the customary land to those in the land inside the town boundary and based on the results of field surveys including socio-economic survey, mid-term facility plan for improving the existing water supply system (hereinafter referred to as “the Plan”) has been formulated.
Problems facing SIWA and countermeasures to be taken in the Plan are mentioned in Table B2-8.

The Study for Rehabilitation and Improvement of Solomon Islands Water Authority’s Water Supply and Sewerage Systems
Final Report : Summary Report (B-22)
Table B2-8 Problems in Existing Water Supply Facilities and Countermeasures in the Plan No. Item Problems Countermeasures in the Plan 1 Main Water
Sources About 50% of water distribution volume in Honiara depends on Konglai Spring. Water intake volume from the spring is not stable due to the frequent blockage.
The blockage occurred in October 2005 has not been recovered at present (as of May 2006) and it will not be recovered in the future. It is estimated that daily per capita water supply (excluding leakage) is reduced to 115LCD.
Moreover, Konglai Spring is located in customary land in which SIWA faces problems in the maintenance work. Therefore, SIWA is desirous of shifting main source to groundwater inside the town boundary.
Three (3) options are examined in terms of water intake volume from Konglai Spring. Option J-1 White River high lift pumping system is cancelled. This system is now distributing 65% of water from the spring to water distribution districts. Option J-2 Current pumping system is maintained in this option. Option J-3 Capacity of the current pumping system is much reduced. Reduced amount of water and additional water by population increase will be secured by developing new groundwater sources inside the town boundary.
2 Water Pressure About 25% of the residents in the water distribution districts in Honiara are suffering from low water pressure. Some of the residents can not get any water during the peak demand hours in daytime.
Water distribution system with pipe diameters sufficient for meeting water demand up to the year 2010 is planned to eliminate low water pressure areas.
3 Water Distribution System
Water transmission pipeline and distribution pipeline are not separated so that water distribution reservoir can not work with its original functions.
Independent water distribution system is established allocating one water source and one water reservoir in each water district.
4 Pipe Diameter Pipe diameters are too small to secure the required water with enough water pressure to customers.
Pipe diameters for serving water demand up to 2010 are planned.
5 Capacity of Water Distribution Reservoir
Existing reservoirs have only 5 hour-volume of daily maximum water demand so that they can not serve enough water during the peak demand hours and in an emergency case.
Each distribution reservoir is planned so as to have a capacity of 12 hour-volume of daily maximum water demand.
6 Turbidity of Spring Water
Tap water often shows high turbidity after heavy rain and becomes unsuitable for domestic water use.
Water treatment facility for removing turbidity is installed in each spring water source.
7 Water Supply to the unserved areas
Unserved water supply area accounts for 30% of water distribution districts of SIWA.
Water distribution mains are expanded to the unserved areas.
Source : JICA Study Team
(2) Components of the Plan
The Plan consists of the following components;
Development of new boreholes Construction of water transmission pump stations Expansion of water distribution reservoirs Replacement of main water distribution pipelines with larger diameter pipes Expansion of main water distribution pipelines for the unserved areas Construction of water treatment facility for reducing turbidity of spring water Construction of disinfection facility

The Study for Rehabilitation and Improvement of Solomon Islands Water Authority’s Water Supply and Sewerage Systems
Final Report : Summary Report (B-23)
Three (3) options for the plan have been proposed in consideration of the utilization of the existing Konglai Spring as follows; (Refer to Annex-7, 8 and 9)
Table B2-9 Outline of 3 Options in Water Supply Facility Improvement Plan Option Contents of Facility Concept of the Plan
J-1
New borehole Transmission pump station Water reservoir
Distribution main
Water treatment facility
for reducing turbidity of spring water
Disinfection facility
16 nos. 4 nos./each borefield 6 nos. with capacity
of 7,005m3 in total Diameter 50 to
300mm x 25.5km 3 nos./each spring
7 nos.
35% of water intake volume from Konglai Spring (accounting for 14% of the total water distribution volume for 2010 in Honiara)
In order to shift the water source from unstable Konglai Spring to stable groundwater inside the city boundary, the high lift pumping station which consumes much electric power is cancelled.
J-2
New borehole Transmission pump station Water reservoir
Distribution main
Water treatment facility
for reducing turbidity of spring water
Disinfection facility
6 nos. 2 nos./each borefield 6 nos. with capacity
of 7,005m3 in total Diameter 50 to
400mm x 25.8km 3 nos./each spring
5 nos.
100% of water intake volume from Konglai Spring (accounting for 40 percent of the total water distribution volume for 2010 in Honiara).
Increment of water demand for 2010 is for the population increase.
J-3
New borehole Transmission pump station Water reservoir
Distribution main
Water treatment facility
for reducing turbidity of spring water
Disinfection facility
12 nos. 3nos./each borefield 6 nos. with capacity
of 7,405m3 in total Diameter 50 to
300mm x 23.0km 3 nos./each spring
6 nos.
This option is similar in principle to Option J-1.
43% of water intake volume from Konglai Spring (accounting for 17% of the total water distribution volume for 2010 in Honiara).
White River Boreholes shall be utilized to cover the water demand in 2010.
The distributed water amount from White River high lift pumping system is reduced to 1/8.
Source : JICA Study Team
(3) Water Production Volume to be Developed
Water production volume to be newly developed for the demand of 2010 in each option is determined from the water intake rate to the total intake volume from Konglai Spring. As shown in Table B2-10 the rate becomes the biggest in Option J-1.
Table B2-10 Newly Developed Water Production Volume (2010) (Unit : m3/day)
Option Ratio to the total intake volume from Konglai Spring (2010)
Water Demand (2005)
Water Demand (2010)
Available Water Source (2010)
Water Production to
be Newly Developed
(2010) J-1 35% 25,719 30,587 17,870 12,717 J-2 100% 25,719 30,587 25,719 4,868 J-3 43% 25,719 30,587 21,357 9,230
Source : JICA Study Team

The Study for Rehabilitation and Improvement of Solomon Islands Water Authority’s Water Supply and Sewerage Systems
Final Report : Summary Report (B-24)
(4) Effects by Implementation of Mid-term Water Supply Facility Improvement Plan
The following are the effects to be expected from the implementation of mid-term water supply facility improvement plan for the target year of 2010. (Refer to Annex-10)
Stable water supply is secured even if blockage of Konglai Spring is not recovered. While it is estimated as 115LCD (excluding water leakage) for the daily per capita water supply during the blockage, 164LCD of the water supply will be secured after the implementation of the Plan.
Stable water pressure and water supply are secured and low pressure area will be eliminated.
High turbidity of the drinking water after heavy rain will be eliminated.
Served ratio of 70% (served population of 46,221 in 2005) will be increased to 78% (served population of 61,520 in 2010) and the unserved area of 30% will be reduced to 22%.
B2.4 Plan for Sewerage Facility Improvement
(1) Basic Policy
It is difficult for SIWA to expand its business in sewerage system for the time being because SIWA has small investment budget of SIWA and many problems in water supply business. In consideration of this situation, facility improvement plan for sewerage system in Honiara has been formulated for rehabilitating the existing sewerage facilities.
(2) Components of the Plan
Based on the results of the field surveys, mid-term facility plan for improving the existing sewerage system (hereinafter referred to as “the Plan”) has been formulated.
Table B2-11 Outline of Sewerage Facility Improvement Plan Component Contents of Facility or Equipment Outline of Plan
Upgrading sewage outfall facility
Outfall facility 3 nos. There are 14 sewage outfalls and most of them are damaged, so that sewage is discharged along the seashore. In order to reduce maintenance difficulty and decrease sewage diffusion area, the existing outfalls are rearranged to new outfalls.
Construction of sludge treatment facility
Sludge drying bed Sewage settling tank
1 no. 1 no.
Sludge from domestic septic tanks is treated to reduce the environmental pollutants into the public water bodies.
Improvement of operation and maintenance system of household septic tanks
Vacuum truck Sewage cleaning
vehicle Wheel loader
4 nos. 1 no. 1 no.
SIWA will take responsibility for maintenance and operation of household septic tanks so that the sewage drainage service will be able to be provided regularly and effectively. Another advantage is that SIWA can obtain additional revenue from carrying out this service. In order to do the above work, operation equipment is required.
Source : JICA Study Team
(3) Effects by Implementation of Mid-term Sewerage Facility Improvement Plan
The following are the effects to be expected from the implementation of mid-term sewerage facility improvement plan for the target year of 2010.
Sewage is discharged offshore so that sewage diffusion at the seashore can be eliminated. Consequently, fear for environmental pollution by sewage at the seashore will be dissolved.

The Study for Rehabilitation and Improvement of Solomon Islands Water Authority’s Water Supply and Sewerage Systems
Final Report : Summary Report (B-25)
Sludge is discharged from domestic septic tanks regularly so that effluent of sewage into public water bodies from the septic tanks can be eliminated. Consequently, environmental pollutants into the public water bodies will be reduced.
Sludge is treated properly so that environmental pollutants can be reduced.
B2.5 Cost Estimation
Cost estimation was done using the unit costs of the AusAID report with an inflation rate of 4%. The results of the cost estimation are as follows:
(1) Water Supply System Improvement Plan
The capital cost and operation cost for the 3 options in the water supply system improvement plan in 2010 are as shown below:
Table B2-12 Capital Cost and Operation Cost for Each Option (Unit : x1,000US$)
Option Capital Cost (US$)
Operation Cost (US$/year)
J-1 7,236 1,570 J-2 6,098 1,491 J-3 6,514 1,628
Source : JICA Study Team
(2) Sewerage Facility Improvement Plan
The capital cost of sewerage facility improvement for 2010 is US$2,808,000.
B2.6 Technical Evaluation and Risk Analysis for the Project
Three (3) options were proposed for mid-term facility improvement plan for Honiara water supply system in this report as shown in Table B2-8. Technical evaluation was done and social risk was examined for each option as follows;
B2.6.1 Technical Evaluation
(1) Water Intake Volume from Konglai Spring
Technical evaluation related to the water intake volume from Konglai Spring is done because it is unstable as a major water source as mentioned below.
As mentioned in previous section (B1.5.2), Konglai Spring is located in the customary land, on which 40% of the total water production of Honiara is depended upon in this option at present (2006), has experienced frequent blockages of the inflow points in the catchment area (that is called “sinkhole”). There are 4 large sinkholes in the catchment area of Konglai Spring. Main sinkholes are located about 2km from the spring and in a large catchment area of the customary land. It is very difficult for SIWA to do maintenance of the sinkholes because SIWA staff cannot reach to the sinkholes without permission of the landowners. It is a big obstacle for SIWA’s management and therefore SIWA is desirous of shifting water sources from the spring in the customary land to new boreholes inside the town boundary.
Blockage has been occurred six (6) times for the past ten (10) years from 1995 to 2005 by heavy rain or vandalism. The latest blockage happened after the heavy rain at the beginning of October 2005 and the water intake volume from the spring decreases to about 40% of the normal condition. Water shortages have occurred in many places of the city. At the moment (the end of April 2006), it is uncertain when the blockage will be removed and Konglai Spring will be restored. Rationing of

The Study for Rehabilitation and Improvement of Solomon Islands Water Authority’s Water Supply and Sewerage Systems
Final Report : Summary Report (B-26)
water supply is now executed in the western half of the city and therefore the residents suffer from insufficient water supply.
In consideration of the above-mentioned circumstances, technical evaluation related to the water intake volume from Konglai Spring was done for each option. The evaluation results are shown in Table B2-13 below:
Table B2-13 Technical Evaluation
Option
Ratio to Total Water Distribution in
Honiara (2010)
Ratio to Total Intake Volume from Konglai
Spring (2010)
Comment Technical Evaluation
J-1 14% 35%
Even if blockage occurs in Konglai Spring and the recover is not possible, required water volume can be taken from the spring because the base flow from the spring is about 40% of the normal situation.
Therefore, there is no technical problem in terms of securing required water intake volume in this option.
A
J-2 40% 100%
40% of water demand in Honiara depends on Konglai Spring. When Konglai Spring is blocked, the influence on the water supply system is large.
Therefore, this option has much disadvantage.
C
J-3 17% 43%
The risk is similar to Option J-1. Even if blockage occurs in Konglai Spring and the recover is not possible, required water volume can be taken from the spring.
Therefore, there is no technical problem in terms of securing required water intake volume in this option.
A
Rank. A : Low B : Medium C : High Source : JICA Study Team
(2) Groundwater Development
In formulation of groundwater development plan for the above three options, not only groundwater development potential but also technical issues below shall be evaluated.
Impact to groundwater use other than SIWA Land subsidence by over pumping Sea water intrusion
After the evaluation of the items above, there are no technical disadvantages related to the groundwater development in all options.
B2.6.2 Social Risks
(1) Relationship with Customary Land Owners
One of the social risks is the relation with the customary land owners. It has been examined in each option as follows;

The Study for Rehabilitation and Improvement of Solomon Islands Water Authority’s Water Supply and Sewerage Systems
Final Report : Summary Report (B-27)
Table B2-14 Risk for Relation with Customary Land Owners Option Risk Evaluation
J-1
1. By shifting substantial amount of water from Konglai Spring to the new groundwater within the town boundary, SIWA will face some problems with the landowners of the Konglai Spring area. Raising unit price of current water right fee is considered as one of the risks.
2. For the new boreholes development, there will be risks as follows; - Land lease will not be permitted by the land owners - It will be permitted but at an exorbitant lease price.
C
J-2 1. No change of relation with the land owners of Konglai Spring area. So there is no
risk for Konglai Spring.
2. Risk for development of new boreholes is almost the same as other options. B
J-3 Similar to Option J-1. C Rank. A : Low B : Medium C : High Source : JICA Study Team
(2) Security of Infrastructure
In the light of the social unrest on Guadalcanal occurred from 2000 to 2003, further acts of sabotage and interference with sources and storage tanks that are located in customary lands cannot be ruled out. Continued reliance on Konglai Spring as the main source of water is assessed as a major and unacceptable risk. The security of the project is assessed as follows;
Table B2-15 Risk for Security of Infrastructure Option Risk Evaluation
J-1 Major sources are located within the town boundary so that the security risk is assessed as low. A
J-2 In this option, Konglai Spring is still the major source. Therefore, the security risk is assessed as high. C
J-3 Major sources are located within the town boundary so that the security risk is assessed as low. A
Rank. A : Low B : Medium C : High Source : JICA Study Team
B2.7 Project Evaluation
The project evaluation is aiming at selection of the water supply system in Honiara to be the most practical one for SIWA from viewpoints of viability.
The project evaluation is also made by risk analysis in addition to financial analysis. Financial analysis is made for these 3 alternatives (Option J-1, J-2 and J-3) of water supply system in Honiara.
Evaluation indicators are normally demonstrated by the Internal Rate of Return (IRR), Net Present Value (NPV), and Benefit-Cost Ratio (B/C).
B2.7.1 Preconditions
Financial analysis is made on the basis of the following preconditions.
(1) Scope of Analysis
A Comparison between newly incremental benefit and cost generated from the project to be implemented is made at the year 2005 price. Financial analysis is carried out for 3 alternatives (Option J-1, J-2 and J-3).
The scope of financial analysis is financial comparison between newly incremental revenue and expenditure with project. A benefit and cost generated from existing facilities are excluded for the

The Study for Rehabilitation and Improvement of Solomon Islands Water Authority’s Water Supply and Sewerage Systems
Final Report : Summary Report (B-28)
comparison of project profitability as deemed as a sunk cost, because of this project is not new one, rehabilitation project.
(2) Project Benefit
It is assumed that the project benefit is to be i) newly generated water sales by increasing number of users and water consumption unit, ii) saving of water production cost for water leakage, and iii) reduction of land lease fee for customary land.
1) Incremental water sales Incremental water sales after implementation of the Project (With Project).is assumed by water demand (revenue water) and average water unit price (assumed price).
a) Revenue water Revenue water is estimated by incremental water demand and revenue water ratio by year as shown in Table B2-16.
Table B2-16 Revenue Water in Honiara Indicators FY 2005 FY 2010 FY2016
A) Daily Maximum Water Demand (m3/day) *1
25,719 30,587 31,510
B) Revenue Water Ratio (%) *2 57% 57% 70% Notes: 1. Refer to Table G4-1.
2. Refer to Table G1-2. Source : JICA Study Team
b) Average water unit price
Average water unit price is assumed by water demand proportion for domestic and commercial customers and government facilities in accordance with the preset tariff rate.
Table B2-17 Average Water Unit Price for Financial Analysis
Category Average water unit price at the 2005 *1
Water demand proportion at the 2016 *2 Assumed unit price
Domestic SI$1.57/m3 62% SI$0.97/m3 Commercial/Government SI$7.39/m3 38% SI$2.81/m3 Weighed average unit price 100% SI$3.78/m3 Notes: 1. Average water unit price at the 2005 is that water billed .amount is divided by water sales unit per category.
2. Water demand proportion at the 2016 is based on water demand per category. Source : JICA Study Team
2) Saving of water production cost by leakage reduction
It is expected that water leakage will be reduced after implementation of the project (from the 2011 onward). Saving of water production cost is assumed as project benefit of which reduction of operation cost i.e., electricity, chemical materials for chlorination
Reduction of leakage; 11,569 m3/day (the 2011) – 12,131m3/day (the 2010) = - 562m3/day
3) Reduction of land lease fee It should be considered that reduction or increment of land lease fee dealing with a benefit or cost, if this fee is to be changed by option.
At the Skyline tank, the water from Mataniko source and that from Konglai source is merged and mixed. Total water from Mataniko and Konglai source is 125,600m3 per month. The total amount of water from Konglai has been calculated by SIWA based on the water consumption amounting to 60,800m3 per month equivalent to SI$114,000. 25% of consumption due to tribe amounts to SI$28,500 per month are being paid by the Department of Land and Survey on behalf of SIWA.
Intake ratio from Konglai source and contribution ratio for the Project is shown in Table B2-18.
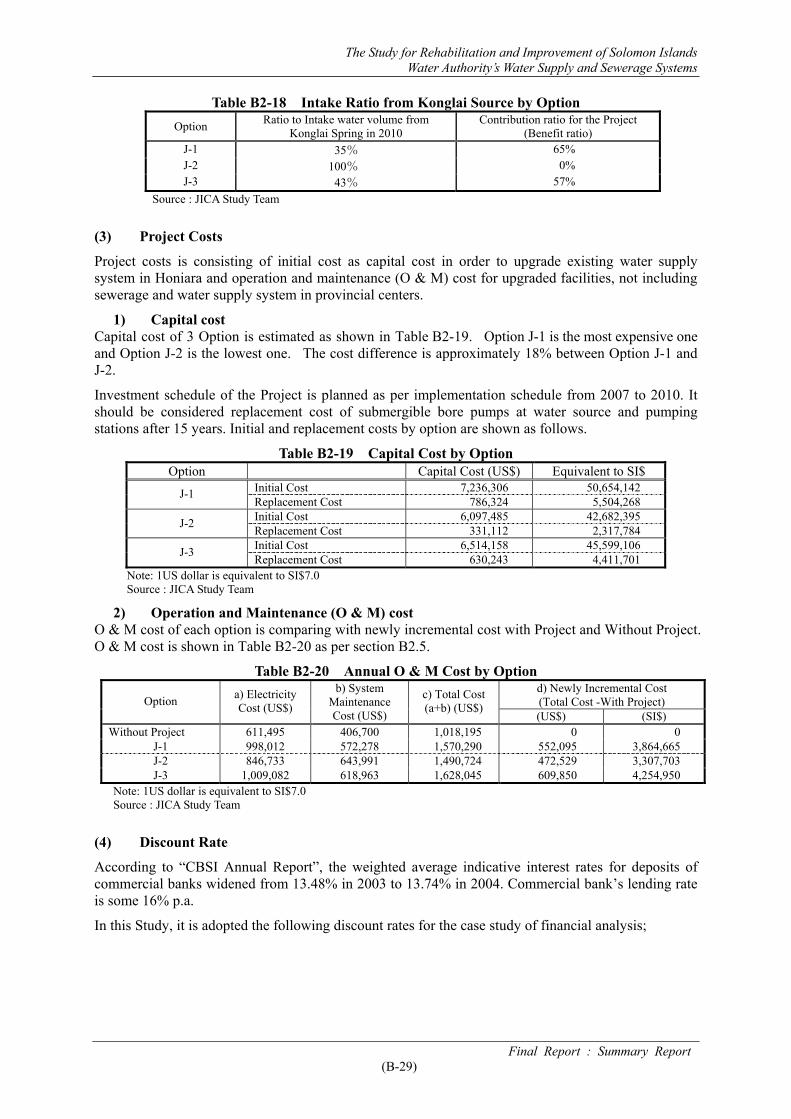
The Study for Rehabilitation and Improvement of Solomon Islands Water Authority’s Water Supply and Sewerage Systems
Final Report : Summary Report (B-29)
Table B2-18 Intake Ratio from Konglai Source by Option Option Ratio to Intake water volume from
Konglai Spring in 2010 Contribution ratio for the Project
(Benefit ratio) J-1 35% 65% J-2 100% 0% J-3 43% 57%
Source : JICA Study Team
(3) Project Costs
Project costs is consisting of initial cost as capital cost in order to upgrade existing water supply system in Honiara and operation and maintenance (O & M) cost for upgraded facilities, not including sewerage and water supply system in provincial centers.
1) Capital cost Capital cost of 3 Option is estimated as shown in Table B2-19. Option J-1 is the most expensive one and Option J-2 is the lowest one. The cost difference is approximately 18% between Option J-1 and J-2.
Investment schedule of the Project is planned as per implementation schedule from 2007 to 2010. It should be considered replacement cost of submergible bore pumps at water source and pumping stations after 15 years. Initial and replacement costs by option are shown as follows.
Table B2-19 Capital Cost by Option Option Capital Cost (US$) Equivalent to SI$
Initial Cost 7,236,306 50,654,142 J-1 Replacement Cost 786,324 5,504,268 Initial Cost 6,097,485 42,682,395 J-2 Replacement Cost 331,112 2,317,784 Initial Cost 6,514,158 45,599,106 J-3 Replacement Cost 630,243 4,411,701
Note: 1US dollar is equivalent to SI$7.0 Source : JICA Study Team
2) Operation and Maintenance (O & M) cost O & M cost of each option is comparing with newly incremental cost with Project and Without Project. O & M cost is shown in Table B2-20 as per section B2.5.
Table B2-20 Annual O & M Cost by Option d) Newly Incremental Cost (Total Cost -With Project) Option a) Electricity
Cost (US$)
b) System Maintenance Cost (US$)
c) Total Cost (a+b) (US$)
(US$) (SI$) Without Project 611,495 406,700 1,018,195 0 0
J-1 998,012 572,278 1,570,290 552,095 3,864,665 J-2 846,733 643,991 1,490,724 472,529 3,307,703 J-3 1,009,082 618,963 1,628,045 609,850 4,254,950
Note: 1US dollar is equivalent to SI$7.0 Source : JICA Study Team
(4) Discount Rate
According to “CBSI Annual Report”, the weighted average indicative interest rates for deposits of commercial banks widened from 13.48% in 2003 to 13.74% in 2004. Commercial bank’s lending rate is some 16% p.a.
In this Study, it is adopted the following discount rates for the case study of financial analysis;

The Study for Rehabilitation and Improvement of Solomon Islands Water Authority’s Water Supply and Sewerage Systems
Final Report : Summary Report (B-30)
Table B2-21 Case Study of Discounted Rate Discount Rate Remarks
10.0% The discount rate is normally adopted 10%-12% p.a. for the Project evaluation, in this case, it is adopted discount rate 10% p.a. for the case study.
3.5% The weighted average rate is assumed to be 3.5% p.a. discount rate based on assumption of foreign soft loan with 1.6% p.a. for 80% of total project cost from international organization, etc. and domestic commercial loan with 16% p.a. for 20% of total project cost
1.0% The weighted average rate is assumed to be 1.0% p.a. discount rate based on assumption of foreign grant aids for 95% of total project cost from international organization , etc. and domestic commercial loan with 16% p.a. for 5% of total project cost
Source : JICA Study Team
B2.7.2 Project Evaluation Results
(1) Evaluation by Financial Analysis
Option J-2 is the most viable project based on financial analysis (evaluation indices of IRR, B/C-Ratio and NPV).
Financial analysis results of three options mentioned above are shown as follows;
Table B2-22 Evaluation by Financial Analysis Option Discount Rates NPV (SI$’000) B/C IRR Evaluation
10.0% -9,322 0.72 3.5% 24,167 1.59 J-1 1.0% 54,165 2.23
7.2% B
10.0% -958 0.97 3.5% 37,369 2.09 J-2 1.0% 70,778 2.90
9.7% A
10.0% -7.894 0.74 3.5% 23,974 1.65 J-3 1.0% 52,451 2.32
7.5% B
Rank. A : Much profitable B : Less profitable than A C : Not profitable Source : JICA Study Team
(2) Evaluation by Risk Analysis
As mentioned above, Option J-2 has been selected as the most profitable project by the financial analysis. However, evaluation by risk analysis should also be considered as explained in B2.6.
(3) Overall Evaluation
The overall evaluation through financial analysis and risk analysis is as shown in Table B2-23. Although Option J-1 and J-3 have the same mark, Option J-1 is considered more favorable because it is less ratio to the total intake volume from Konglai Spring and less O & M cost than J-3. Therefore, it was concluded that Option J-1 is the most viable project among 3 options.
Table B2-23 Result of Overall Evaluation Evaluation by Social Risk
Option Financial Evaluation
Technical Evaluation Relation with
Landowner Security of
Infrastructure Weight 1.0 1.0 0.5 0.5
Overall Evaluation
(Mark)
J-1 B(2) A(3) C(0.5) A(1.5) 1(7.0) J-2 A(3) C(1) B(1.0) C(0.5) 3(5.5) J-3 B(2) A(3) C(0.5) A(1.5) 2(7.0)
Note : Figure in ( ) shows a mark for each rank, 3 for A, 2 for B and 1 for C. Source : JICA Study Team

The Study for Rehabilitation and Improvement of Solomon Islands Water Authority’s Water Supply and Sewerage Systems
Final Report : Summary Report (B-31)
B2.8 Project Implementation Program
Mid term facility improvement plan shall include following projects with priority.
Priority-1 : Improvement of water supply system in Honiara
Priority-2 : Improvement of water supply system in Auki (The improvement plan for Auki is described in PART C.)
Priority-3 : Improvement of sewerage system in Honiara Based on the priority, project implementation program is formulated as shown in Table B2-24.
Table B2-24 Project Implementation Program (unit : x 1000US$)
No. Project InvestmentAmount 2006 2007 2008 2009 2010 2011
1 7,2401,020 2,600 2,600 1,020
2 Improvement of water supply system in Auki 330330
3 Improvement of sewerage system in Honiara 2,810670 2,140
Investment Amount - Total Accumulated 10,380 1,020 2,600 3,600 3,160
Improvement of water supply system in Honiara (Option J-1)
Source : JICA Study Team

The Study for Rehabilitation and Improvement of Solomon Islands Water Authority’s Water Supply and Sewerage Systems
Final Report : Summary Report (C-1)
PART C PROVINCIAL CENTERS WATER SUPPLY AND SEWERAGE
C1 NORO
C1.1 Existing Conditions
C1.1.1 Natural Conditions
(1) Topography and Geology
Noro is located in marine terrace. Limestone of coral reef in the Tertiary forms the narrow terrace extending along the coast. Residential area of Noro is distributed in the top and the slope of the terrace. Inland area of Noro shows hilly terrain with gentle slope comprising limestone and the other sedimentary rocks of the Tertiary.
(2) Climate
Monthly temperature is the highest of 30.7 ℃, showing almost the same temperature throughout year with seasonal difference within 3℃. Annual precipitation is 3,607mm. Precipitation is the highest in March with 459mm, and it is the lowest in October with 218mm, showing enough precipitation throughout a year.
C1.1.2 Socio-economic Conditions
Noro is located in the western part of New Georgia Island, Western Province. Population in Noro is 4,109 in 2005. Major industry in Noro is fishing and private canned food company, Soltai Fishing & Processing Limited (Soltai). After the ethnic tension, public order is improved and private companies resume the business in Noro.
C1.1.3 Field Surveys
(1) Surface Water Survey
The results of the Surface water discharge measurement are shown in Table C1-1. (Refer to Annex-10)
• Discharge of the rainy season was slightly less than dry season. • At each survey date, difference between the discharge No.1 and No.2 show quantity of water
intake of the Zinta intake.
Table C1-1 Results of Surface Water Discharge Measurement in Noro No Name Water flow (m3/s) Survey Date
0.127 9 Jun. ‘05 No.1 Upstream of SIWA intake point 0.107 30 Nov ‘05 0.105 9 Jun. ‘05 No.2 Downstream of SIWA intake point 0.088 30 Nov ‘05
Source : JICA Study Team (2) Groundwater Survey
Noro is located in coral reef limestone that extends along the narrow shoreline. This limestone is porous and highly permeable. It is possible to get groundwater from boreholes in the limestone area. However, limestone is distributed only in the narrow coastal area. Therefore, groundwater development in large scale is impossible.

The Study for Rehabilitation and Improvement of Solomon Islands Water Authority’s Water Supply and Sewerage Systems
Final Report : Summary Report (C-2)
(3) Water Quality Survey
1) Result of water quality survey
The results of the field water quality survey are shown in Table C1-2. (Refer to Annex-11)
Table C1-2 Results of Field Water Quality Survey in Noro Survey Items
Survey Month
Water Temperature
(℃)
Electric Conductivity
(mS/m)
Turbidity(NTU) pH DO
(mg/L) COD
(mg/L)
No.1 25.4 10 8 7.6 1.81 - June 2005 No.2 25.5 8 10 7.6 1.29 -
No.1 25.1 8 10 7.4 1.18 6 No.2 25.2 7 10 7.2 1.08 7 Coast1 30.9 - 8 8.2 1.17 3 Coast2 28.8 - 12 7.4 1.50 3
August 2005
Factory outfall
28.7 - 18 7.8 0.93 5
No.1 25.9 11 1 6.1 4.43 9 No.2 25.9 10 2 6.3 4.74 9 Coast1 31.5 - 1 8.0 6.91 2 Coast2 31.0 - 6 7.8 6.09 2
November 2005
Factory outfall
30.6 - 7 7.9 5.78 2
Source : JICA Study Team The result of field water quality is summarized as below:
• At survey point No.1 and No.2, each survey result does not show remarkable difference. • According to the DO and COD value, river water and sea water in the dry season was more
contaminated than in the rainy season. • COD value of survey points Coast-1, Coast-2 and Factory outfall (Soltai) ranges from 3 to 5
(mg/L) in August and is 2mg/L in November.
2) Results of water quality analysis in laboratory
Water analysis samples were collected from upstream area of the Ziata intake point, tap of Noro and Soltai borehole.
Water Source:
The analysis results do not exceeds WHO guideline value. Total Coliform Bacteria is 0(MPN/mL) at each sampling points.
Tap water:
The analysis results of these boreholes do not exceed WHO guideline value. Total Coliform Bacteria has been detected from the tap water.
3) Evaluation of water quality
- According to the results of water quality analysis, tap water of Noro system has no problem.
(4) Socio-economic Survey
The average household size is smallest in the target area of the Study (5.0 persons). Major type of toilet is flush same as in Honiara and the other provincial centers. The number of paid workers per household is largest in the provincial centers (1.9 persons). The average monthly income is 2,170 Solomon Islands Dollars (SI$).
Regarding water supply, combination of piped water and rain tanks is major source of water supply. The ratio dependent on rainwater for drinking use is very high (80% of drinking water). Major sewer

The Study for Rehabilitation and Improvement of Solomon Islands Water Authority’s Water Supply and Sewerage Systems
Final Report : Summary Report (C-3)
system is septic tank. There is no sewer connection. Almost half of the households have the experiences of disease caused by drinking water. All the respondents think that water source should be conserved in order to avoid contamination of water.
Monthly water bill averages SI$68.89, 3.2% in Noro. Marginal willingness to pay for better water supply service (MWTP) is SI$42.07. Total WTP is SI$110.96, 5.1% of average monthly income.
C1.1.4 Water Supply Facility
The served ratio is 61%. Soltai and other commercial customers are using about 60% (1,238m3/day) of the total water supply (2,063m3/day). This means that 825m3/day is delivered to the domestic customer. So the average water supply per capita per day for domestic customer is 330LCD (including 40% leakage).
Existing surface water source (Ziata Creek) has much enough capacity for the whole water demand in Noro. The current water demand accounts for only 17% of the potential volume of the water source. Therefore, new water source development will not be needed.
For the existing water supply system in Noro, there are no outstanding problems. Basic data for water supply service for Noro in 2005 have been confirmed as follows;
Table C1-3 Basic Data for Water Supply Service for Noro in 2005 Code Item Unit Data
A Population in water distribution districts -- 4,109 B Served population -- 2,498 C Served ratio [(B/A) x 100] % 61 D Revenue water ratio % 53 E Non-revenue water ratio % 47 F Leakage ratio[estimated] % 40 G Effective water ratio [100-F] % 60 H Effective water ratio (distribution-leakage) m3/day 1,238 - Domestic m3/day 495 - Commercial m3/day 743 I Per capita consumption for domestic customers LCD 198 J Per capita water demand for domestic customers LCD 330 K Maximum daily water demand m3/day 2,063
Source : JICA Study Team C1.1.5 Sewerage Facility
In Noro, residential and commercial properties are served by septic tanks. Soltai Fishing & Processing Limited has its own wastewater treatment system for both industrial wastewater and sewage. However, the wastewater treatment system is now closed down and needed to be rehabilitated.
C1.2 Mid-term Facility Improvement Plan
C1.2.1 Water Demand Projection
Water demand in 2010 for Noro is as shown below:

The Study for Rehabilitation and Improvement of Solomon Islands Water Authority’s Water Supply and Sewerage Systems
Final Report : Summary Report (C-4)
Table C1-4 Water Demand in 2010 for Noro Code Item Unit Data
A Population in water distribution districts -- 4,718 B Served population -- 3,170 C Served ratio [(B/A) x 100] % 67 D Revenue water ratio % 53 E Non-revenue water ratio % 47 F Leakage ratio[estimated] % 40 G Effective water ratio [100-F] % 60 H Effective water ratio (distribution-leakage) m3/day 1,408 - Domestic m3/day 523 - Commercial m3/day 885 I Per capita consumption for domestic customers LCD 198 J Per capita water demand for domestic customers LCD 330 K Maximum daily water demand m3/day 2,347
Source : JICA Study Team
C1.2.2 Potential Projection of Water Sources Development and Optimum Water Source
Based on the results of analysis on development potential of the surface water and groundwater, it was concluded that both surface water and groundwater have enough potential for water demand in year of 2010. Development potential of water resources in Noro is summarized in Table C1-5.
Table C1-5 Water Demand in 2010 and Water Resources Development Potential for Noro Water development potential Water
demand in year of 2010
(m3/day)
Water to be developed Newly*1
(m3/day)
Type of water source
Remaining potential*2
(m3/day) Water quality Land ownership
Surface -water 3,629 Purification plant
is necessary Customary land 2,347 284
Ground- water More than 2,350 Chlorination
only Town area
Note: 1. Water to be developed Newly = Water demand in 2010 – Current water extraction from existing sources (2,063)
2. Remaining potential=Development Potential-Current water extraction Source : JICA Study Team
The current water source for water supply for Noro is Ziata River. To meet water demand in year of 2010, it is recommended that additional water should be taken form the current water intake-point of Ziata River.
C1.2.3 Policy for Improvement of Water Supply Facility Improvement
In Noro, it was confirmed that the existing water source and water distribution facilities will be able to serve for the water demand in the target year 2010. Therefore, the facility improvement plan for the year 2010 in Noro is not prepared. However, served ratio is still 61% in 2005. Therefore, SIWA is required to expand water distribution network to meet the demand of the unserved population.
C1.2.4 Plan for Sewerage Facility Improvement
In the provincial centers-Noro, Auki and Tulagi, there is no sewerage system in operation. Most of the people have a household septic tank. Since the sewage discharge volume is small, the environmental pollution from the sewage has not been found. Therefore, a plan for sewerage system improvement is not formulated in this study.
The Study for Rehabilitation and Improvement of Solomon Islands Water Authority’s Water Supply and Sewerage Systems
Final Report : Summary Report (C-5)
C2 AUKI
C2.1 Existing Conditions
C2.1.1 Natural Conditions
(1) Topography and Geology
Auki is located in hill-side of Tertiary limestone. This limestone is classified as Suaba chalk deposit of Maraita Group. Rock is compact and poor in porosity except where fractures are densely developed. There are many sinkholes in hills behind Auki town area. Groundwater comes out at the bottom of sinkholes. Group of sinkholes has formed special topography that can be called as cockpit karst.
(2) Climate
Annual average temperature of Auki is 26.6℃. Monthly average temperature is 27.1℃ in January and 25.8℃ in July, showing almost constant temperature throughout year. Annual precipitation of Auki is 3,271mm. Precipitation is 406mm in January and 212mm in July, showing much precipitation throughout a year.
C2.1.2 Socio-economic Conditions
Auki is located in the north-west of Malaita Island, Malaita Province. Population in Auki is 4,747 in 2005. Major industry in Auki is fishing and agriculture. There is no such a large factory as Soltai in Noro.
C2.1.3 Field Surveys
(1) Surface Water Survey
The results of the Surface water discharge measurement are shown in Table C2-1. (Refer to Annex-12)
• Discharge along the Kawaibala River except Kawaibala water resource of rainy season is larger than discharge of dry season.
• At survey point No.6, Kawaibala water resource, discharge of rainy season was less than dry season. This means that groundwater recharge by rain fall is not enough so as to raise the groundwater level and to increase base flow at beginning of the rainy season.
Table C2-1 Results of Surface Water Discharge Measurement in Auki No Survey Month Name Water flow
(m3/s) Comment
No.1 Lebagnali spring water 0.004 Spring water No.2 Tributary of Lebagnali 0.039 Few spring points at tributary.
No.3 Main river of upstream of confluence 0.151 Discharge of the Kawaibala River before confluence
No.4 Middle reach 0.101 No.5 Downstream 0.247 No.6
June 2005
Kawaibala water resources 0.180 No effluent from spillway No.1 Lebagnali spring water 0.009 Spring water No.2 Tributary of Lebagnali 0.054 Few spring points at tributary.
No.3 Main river of upstream of Confluence 0.313 Discharge of the Kawaibala River before confluence
No.4 Middle reach 0.439 No.5 Downstream 0.509 No.6 Kawaibala water resources 0.006 No effluent from spillway No.7
November 2005
Bitakaula spring water 0.065 Source : JICA Study Team

The Study for Rehabilitation and Improvement of Solomon Islands Water Authority’s Water Supply and Sewerage Systems
Final Report : Summary Report (C-6)
(2) Groundwater Survey
Promising water sources for water supply is groundwater from sinkholes and boreholes. Characteristics of sinkholes and boreholes for water sources in Auki are summarized in Table C2-2.
Table C2-2 Sinkholes and Boreholes in Auki Type Merit / Demerit for water sources
Merit • Water can be easily taken from simple facility such as small weir. • Water from sinkholes can be distributed by gravity.
Sink
hole
Demerit
• Yield of spring in bottom of each sinkhole is usually small. • Long pipeline is necessary to deliver water from the sinkholes to Auki. • Water will be turbid by strong rainfall. • Sinkholes are located in customary land, and it will cause problems in water right.
Merit
• Limestone is distributed in Auki, and it is promising to drill boreholes within town area. Therefore, payment for water right is not necessary.
• Drilling boreholes seems highly successful with expected yield of 800m3/day per one borehole. • There may be no environmental problem by new groundwater development for SIWA Water supply.
Gro
undw
ater
Demerit • Auki is located in seaside, and over-pimping from boreholes will cause sea water intrusion into
boreholes. Source : JICA Study Team (3) Water Quality Survey
1) Result of field water quality survey
Results of field water quality survey in Auki are shown in Table C2-3. (Refer to Annex-13)
Table C2-3 Results of Field Quality Survey in Auki Survey Point
Survey Month
Water Temperature
(℃)
EC (mS/m)
Turbidity (NTU) pH DO
(mg/L) COD
(mg/L)
No.1 24.6 40 14 7.6 6.6 - No.2 25.3 20 14 7.8 6.6 - No.3 24.6 40 14 7.6 7.8 - No.4 27.1 38 14 7.9 3.8 - No.5 24.7 60 10 7.7 4.6 - No.6 26.2 - 11 8.0 1.7 - No.7 28.6 - 14 8.0 2.3 - No.8
June 2005
- - - - - - No.1 24.8 36 4 7.6 2.9 4 No.2 24.8 41 4 7.7 2.7 7 No.3 24.5 35 1 7.9 2.9 7 No.4 24.7 35 3 7.9 2.9 7 No.5 26.3 36 2 7.8 3.5 6 No.6 26.3 100 3 7.8 5.5 7 No.7 30.5 - 33 7.9 7.3 7 No.8
August 2005
- - - - - - No.1 24.8 34 6 7.8 5.7 6 No.2 25.0 37 6 7.3 7.4 7 No.3 25.6 37 3 8.3 5.4 7 No.4 25.7 32 7 8.0 7.4 7 No.5 25.8 32 7 8.0 5.6 6 No.6 27.0 - 5 7.9 5.3 7 No.7 30.7 - 1 7.5 6.4 3 No.8 26.6 35 7 7.1 6.3 7 No.9
November 2005
26.6 42 5 7.3 6.7 6 Source : JICA Study Team
According to DO values, Kawaibala River is contaminated in downstream area of the river.
COD value at sea is not less than 2mg/L at each survey time. It shows that sea water is slightly contaminated.

The Study for Rehabilitation and Improvement of Solomon Islands Water Authority’s Water Supply and Sewerage Systems
Final Report : Summary Report (C-7)
2) Results of water quality analysis in Laboratory
Results of water quality analysis conducted by SIWA are as follows; (Refer to Annex-14)
Water Source: The analysis results did not exceed WHO guideline value. Total Coliform Bacteria was detected at all spring and content of Total Coliform Bacteria ranged from 43 to more than 200MPN/mL.
Tap Water: The analysis results did not exceed WHO guideline value. Total Coliform Bacteria was 0 MPN/mL.
3) Evaluation of Water Quality
– Total Coliform Bacteria was detected at all spring points. However, it was not detected from the tap water of SIWA office.
– Phenol was detected at Kawaibala spring and Bitakulala spring. Phenol dose not exist naturally and therefore it is considered that the contamination is caused by human activity.
(4) Socio-economic Survey
Major dwelling style in Auki is “rented” (77%) and the percentage of owner-occupied dwellings is very low (20%). The average household size is larger than the other provincial centers (6.7 persons). Major type of toilet is flush type which is the same as in Honiara and the other provincial centers. The number of paid workers per household is 1.3 persons. The average monthly income is SI$1,184.
Regarding water supply, combination of piped water and rain tanks is a major source of water supply. The ratio dependent on piped water for drinking use is very high (77% of drinking water). Major sewer system is septic tank. There is no sewer connection. Over 80% of the households have the experiences of disease caused by drinking water. All the respondents answered that water source should be conserved in order to avoid contamination of water.
Monthly water bill averages SI$20.61, 1.7% in Auki. Marginal willingness to pay for better water supply service (MWTP) is SI$13.70. Total WTP is SI$34.31, 2.9% of the average monthly income.
C2.1.4 Water Supply System
The served ratio is 58% in Auki. The per capita demand for domestic customers is 104LCD (including 40% leakage) and actual available water per person is only 63LCD. Rationing of water supply is being executed because the yield of water source is much short of the actual demand.
Therefore, development of new groundwater source will be required in the facility improvement plan for the year 2010. Basic data for water supply service for Auki in 2005 have been confirmed as follows;
Table C2-4 Basic Data for Water Supply Service for Auki in 2005 Code Item Unit Data
A Population in water distribution districts -- 4,747 B Served population -- 2,700 C Served ratio [(B/A) x 100] % 58 D Revenue water ratio % 50 E Non-revenue water ratio % 50 F Leakage ratio[estimated] % 40 G Effective water ratio [100-F] % 60 H Effective water ratio (distribution-leakage) m3/day 287 - Domestic m3/day 172 - Commercial m3/day 115 I Per capita consumption for domestic customers LCD 63 J Per capita water demand for domestic customers LCD 104 K Maximum daily water demand m3/day 478
Source : JICA Study Team

The Study for Rehabilitation and Improvement of Solomon Islands Water Authority’s Water Supply and Sewerage Systems
Final Report : Summary Report (C-8)
C2.1.5 Sewerage Facility
Auki has a small reticulated sewer system, which is not in operation because the outlet pipe runs through customary land and no agreement has yet been reached with the owners of the land to operate the outlet pipeline. Each household uses a septic tank for treatment of its domestic wastewater.
C2.2 Mid-term Facility Improvement Plan
C2.2.1 Water Demand Projection
Water demand in 2010 for Auki is as shown below:
Table C2-5 Water Demand in 2010 for Auki Code Item Unit Data
A Population in water distribution districts -- 5,450 B Served population -- 3,663 C Served ratio [(B/A) x 100] % 67 D Revenue water ratio % 50 E Non-revenue water ratio % 50 F Leakage ratio[estimated] % 40 G Effective water ratio [100-F] % 60 H Effective water ratio (distribution-leakage) m3/day 977 - Domestic m3/day 586 - Commercial m3/day 391 I Per capita consumption for domestic customers LCD 160 J Per capita water demand for domestic customers LCD 267 K Maximum daily water demand m3/day 1,628
Source : JICA Study Team
C2.2.2 Optimum Water Source
(1) Selection of Water Sources
Both surface water and groundwater have enough potential for water demand in year of 2010. Development potential of water resources is summarized in Table C2-6.
Table C2-6 Water Demand in 2010 and Water Resources Development Potential for Auki Water development potential Water
demand in year of 2010
(m3/day)
Water to be newly
developed*1
(m3/day)
Type of water source
Remaining potential*2
(m3/day) Water quality Land
ownership
Surface-
Water 3,369 Chlorination
only Customary
land 1,628 1,150
Ground- water More than 1,200 Chlorination
only Town area
Note 1. Water to be newly developed = Water demand in 2010 – Current water extraction from existing sources(478)
2. Remaining potential=Development potential-Current water extraction from existing sources Source : JICA Study Team
Groundwater development is proposed for water supply to meet the water demand of year 2010 of Auki for the reasons below.
• Surface water potential is high but water source is far from Auki. Development of surface water

The Study for Rehabilitation and Improvement of Solomon Islands Water Authority’s Water Supply and Sewerage Systems
Final Report : Summary Report (C-9)
will cause problem in payment for water right and trouble in water intake. • Groundwater can be developed within Auki town area, which will prevent problem above. • Water sources development of 1,150m3/day is necessary to meet water demand of year of 2010.
This is small amount that can be obtained from just two boreholes.
(2) Groundwater Development Plan
Drilling Point
Drilling point is located in site of Low level tank of SIWA. Two boreholes are proposed near the tank. This site belongs to SIA, and behind the site there is small valley that is public area.
Specification of borehole Specification of proposed borehole is as shown Table C2-7. Amount of new groundwater development is proposed 1,200m3/day. Distance between the proposed boreholes and the shoreline is 600m. Yield of 1,200m3/day will not cause sea water intrusion into aquifer.
Table C2-7 Specification of Proposed Bores in Auki
Depth Diameter Planned yield Number of wells Total yield
Distance between
wells Aquifer
100m 8 inch 600m3/day 2 1,200m3/day 100 Limestone
Source : JICA Study Team
C2.2.3 Plan for Water Supply System
In Auki, it was confirmed that the existing water source from Kwaibala spring will not be enough to serve for the water demand in the target year 2010. For water distribution facilities, they will have enough capacity in 2006 to serve for the water demand in 2010 owing to ongoing ADB project for upgrading water distribution facility such as water transmission mains, water reservoir, etc., and rehabilitation of water intake facility. As a facility improvement plan in the Study, it is proposed that two (2) new boreholes will be developed. Meanwhile, served ratio is still 58% in 2005. Therefore, SIWA is required to expand water distribution network to meet the demand of the unserved population.
C2.2.4 Cost Estimation
Water supply system improvement plan for Auki includes following components.
Water source development (two boreholes)
The cost for the water source development in Auki is estimated as follows.
Table C2-8 Cost Estimate for Water Supply Facility Improvement in Auki Component Quantity Amount (US$)
Water source development in Auki 166,000/borehole - Borehole drilling work 2 nos. - Procurement of submersible bore pump 3 units - Water conveyance pipeline (150mm PVC) 150m
Total 332,000 Source : JICA Study Team
C2.2.5 Risk Analysis for the Project
Two (2) boreholes will be developed in Auki for the water demand of 2010. The borefield will be located inside the Power Station of SIEA Auki.

The Study for Rehabilitation and Improvement of Solomon Islands Water Authority’s Water Supply and Sewerage Systems
Final Report : Summary Report (C-10)
There will be two risks for implementing this project, that is, political risk and technical risk.
Political risk The political risk is either that the land lease will not be permitted by SIEA or that it will be permitted but at an exorbitant lease price. However, since there is SIWA’s water reservoirs and pump station located in the proposed site and size of the new borefield sites is small, the risk is assessed as low.
Technical risk Impact on groundwater environment by new groundwater development will be negligible because of reason below.
• Amount of groundwater to be developed is only 1,200m3/day. This is small amount compared with the total development potential of groundwater basin covering Auki.
• There is no groundwater use within Auki except for small pumping-up by SIWA. Therefore, there is no impact on groundwater use other than SIWA by new groundwater development.
• Site for borehole drilling is located at 600m from the shoreline. Pumping rate of about 1,200m3/day will not cause sea-water intrusion into aquifer.
Sea-water intrusion is only risk in terms of groundwater environment. Regular monitoring of water quality (electric conductivity) of groundwater from boreholes should be conducted to evaluate effect of sea-water intrusion. If salinity of the groundwater increases, pumping-rate from the boreholes should be decreased.
C3 TULAGI
C3.1 Existing Conditions
C3.1.1 Natural Conditions
Tulagi Island extends NW-SW direction with 3.3km-length and 0.7km-width with area of 2.3 km2. Drainage system is not developed because of too small drainage area. Most of the lands show hilly topography, which has gentle slopes with the top altitude of 31m. Tulagi is located in Tulagi Island, of which geology comprises Kombuana sandstone of Oligocene to Pliocene of the Tertiary.
C3.1.2 Socio-economic Conditions
Tulagi is located in Tulagi Island, Central Province. Population in Tulagi is 1,573 in 2005. Before World War II, Tulagi was capital of Solomon Islands. Soltai had a base for fishery before ethnic tension. Now it is moved to Noro. Major industry in Tulagi is fishing. There is no factory but a shipyard which is only one in Solomon Islands.
C3.1.3 Field Surveys
(1) Surface Water Survey
The results of the surface water flow discharge measurement are shown in Table C3-1. (Refer to Annex-15)
The results of water flow discharge measurement are summarized as below.
- In dry season, water discharge of resource is about 0.020m3/s, which is said to originate in spring existed in upstream area.
- Water flow of the downstream river is only 0.005m3/s, river width is about 1.8m, and maximum depth is 2cm. In rainy season, water discharge of resource is about 0.107m3/s and 0.062m3/s at downstream area.
- Each season, most of water flow is presumed to infiltrate into the ground between upstream

The Study for Rehabilitation and Improvement of Solomon Islands Water Authority’s Water Supply and Sewerage Systems
Final Report : Summary Report (C-11)
to downstream. Discharge of the dry season is less than that of the rainy season.
Table C3-1 Results of Surface Water Discharge Measurement in Tulagi Measurement
Point Name Water flow(m3/s) Survey Date Comment
No.1 SIWA water resources 0.020 No.2 Downstream of river 0.005
8 Jun. ‘05 Intake from river
No.1 SIWA water resources 0.107 No.2 Downstream of river 0.062 6 Dec ‘05 Intake from river
Source : JICA Study Team
(2) Groundwater Survey
Tulaghi Island is small island surrounded by sea. Groundwater development will easily cause sea water intrusion. Aquifer of Tulaghi Island is being intruded by sea water all around the island because the island is very small. Groundwater development is impossible except for small development for domestic water supply. Groundwater development should be planned not in Tulaghi but in Nggela Sule Island.
(3) Water Quality Survey
1) Result of water quality survey
The results of the field water survey are shown in Table C3-2. (Refer to Annex-16)
Table C3-2 Results of Field Water Quality Survey in Tulagi Survey Point
Survey Month
Water Temperature
(℃)
EC (mS/m)
Turbidity (NTU) pH DO
(mg/L) COD
(mg/L)
No.1 25.4 18. 12 8.4 1.2 - No.2
June 2005 25.4 34 0 8.0 1.0 -
No.1 25.5 21 11 8.1 - - No.2
August 2005 25.7 28 11 7.3 - -
No.1 25.6 11 5 8.2 6.4 7 No.2
December 2005 26.1 11 4 8.7 6.3 7
Source : JICA Study Team The results of field water quality survey are summarized as below:
– The results do not have remarkable difference between at survey point No.1 and No.2, and the rainy season and dry season.
– According to DO value, the water quality in the dry season is more contaminated than the water quality in the rainy season.
2) Results of water quality analysis in Laboratory
Water Source: Water analysis samples were collected from existing water source and existing borehole.
- Although, the Chromium analysis result of the existing water source sample exceeds the WHO guideline value, the results of the other items do not exceed the WHO guideline value.
- Total Coliform Bacteria is more than 200(MPN/mL) at Existing borehole (back ground of school).But this bore has not been used now.
Tap Water: According to the water quality analysis that was done by SIWA from 1996 to 1999, Chromium content was detected. However, it does not exceed the WHO guideline value.

The Study for Rehabilitation and Improvement of Solomon Islands Water Authority’s Water Supply and Sewerage Systems
Final Report : Summary Report (C-12)
3) Evaluation of Water Quality
- Chromium analysis result of the existing water source sample exceeds the WHO guideline value. It is considered that this is caused by geological distribution of the upstream of the river.
(4) Socio-economic Survey
The average household size is 5.3 persons. Major type of toilet is flush same as in Honiara and the other provincial centers. The number of paid workers per household is 1.3 persons. The average monthly income is the lowest in the provincial centers (SI$1,025).
Regarding water supply, combination of piped water and rain tanks is major source of water supply. The ratio dependent on rainwater for drinking use is 50%. Major sewer system is septic tank. There is no sewer connection. 30% of the households have the experiences of disease caused by drinking water. All the respondents think that water source should be conserved in order to avoid contamination of water.
Monthly water bill averages SI$56.38, 5.5% in Tulagi. Marginal willingness to pay for better water supply service (MWTP) is SI$23.33. Total WTP is SI$79.71, 7.8% of average monthly income.
C3.1.4 Water Supply Facility
The served ratio is 68% in Tulagi. NRW is relatively high as 61%. The leakage ratio is expected as more than 50%. The yield of water source is enough for the actual demand in 2005. The problem other than the NRW problem in Tulagi water supply system is that there is no disinfection facility. Installation of the chlorination injection facility is urgently needed.
Basic data for water supply service for Tulagi in 2005 have been confirmed as follows:
Table C3-3 Basic Data for Water Supply Service for Tulagi in 2005 Code Item Unit Data
A Population in water distribution districts -- 1,573 B Served population -- 1,064 C Served ratio [(B/A) x 100] % 68 D Revenue water ratio % 39 E Non-revenue water ratio % 61 F Leakage ratio[estimated] % 50 G Effective water ratio [100-F] % 50 H Effective water ratio (distribution-leakage) m3/day 278 - Domestic m3/day 167 - Commercial m3/day 111 I Per capita consumption for domestic customers LCD 157 J Per capita water demand for domestic customers LCD 314 K Maximum daily water demand m3/day 556
Source : JICA Study Team
C3.1.5 Sewerage Facility
Tulagi is served by septic tanks and no reticulated sewer system exists. There are no outstanding problems related to the sewage in Tulagi. C3.2 Mid-term Facility Improvement Plan
C3.2.1 Water Demand Projection
Water demand in 2010 for Tulagi is as shown below:

The Study for Rehabilitation and Improvement of Solomon Islands Water Authority’s Water Supply and Sewerage Systems
Final Report : Summary Report (C-13)
Table C3-4 Water Demand in 2010 for Tulagi Code Item Unit Data
A Population in water distribution districts -- 1,806 B Served population -- 1,345 C Served ratio [(B/A) x 100] % 74 D Revenue water ratio % 39 E Non-revenue water ratio % 61 F Leakage ratio[estimated] % 50 G Effective water ratio [100-F] % 50 H Effective water ratio (distribution-leakage) m3/day 352 - Domestic m3/day 211 - Commercial m3/day 141 I Per capita consumption for domestic customers LCD 157 J Per capita water demand for domestic customers LCD 314 K Maximum daily water demand m3/day 704
Source : JICA Study Team
C3.2.2 Potential Projection of Water Sources Development and Optimum Water Source
The current water source of a river is enough for water demand of year of 2010. Therefore, new water source is not necessary so far. Water demand and water development potential is summarized in Table C3-5.
Table C3-5 Water Demand in 2010 and Water Resources Development Potential for Tulagi Water development potential Water
demand in year of 2010
(m3/day)
Water to be newly
developed *1
(m3/day)
Type of water source
Remaining potential*2
(m3/day) Water quality Land
ownership
Surface water 1,728 Chlorination
only Customary land
704 148 Ground- water Negligibly small Chlorination
only -
Note 1. Water to be newly developed = Water demand in 2010 – Current extraction from water sources(556) 2. Remaining water development potential=Development Potential-Current extraction from water
sources Source : JICA Study Team
C3.2.3 Policy for Water Supply Facility Improvement
In Tulagi, it was confirmed that the existing water source and water distribution facilities will be able to serve for the water demand in the target year 2010. Therefore, the facility improvement plan for the year 2010 in Tulagi is not prepared. However, leakage detection and the repair work will be required and since there is no chlorination disinfection facility in the water distribution system, installation plan for chlorination injection facility has been proposed as an urgent rehabilitation plan. Meanwhile, served ratio is still 68% in 2005. Therefore, SIWA is required to expand water distribution network to meet the demand of the unserved population.
C3.2.4 Plan for Sewerage Facility Improvement
There is no sewerage system in Tulagi. Most of the people have a household septic tank. Since the sewage discharge volume is small, the environmental pollution from the sewage has not been found.
Therefore, a plan for sewerage system improvement is not formulated in this study.

The Study for Rehabilitation and Improvement of Solomon Islands Water Authority’s Water Supply and Sewerage Systems
Final Report : Summary Report (D-1)
PART D CURRENT MANAGEMENT CONDITIONS OF SIWA
D1 Tariff Structure and Water Sales
D1.1 Current Tariff Structure
Based on the recommendation of the study financed by the European Commission in 2003, SIWA introduced a tariff adjustment which brought its water tariffs to less inadequate levels, by raising the commercial/government tariff from SI$3.00 to SI$5.60 and SI$6.16 per m3 respectively and the tariff for domestic consumers to a uniform tariff of SI$1.00 per m3 from SI$1.30 per m3 for the first 30m3 and SI$2.42 per m3 for consumption thereafter. SIWA also charges half the water consumption charges for the sewerage service cost, as in Honiara. Some 1,000 households and commercial/institutional set-up are connected to the sewer network.
Table D1-1 Fees and Charges for Water Supply (Unit: SI$)
Classification Effective from 1995
Effective from July 2001
Present Rate (Effective from
Oct. 2003) <=30 m3 (life line) 0.65 1.30 1.00 Domestic ( per 1m3) >30 m3 1.30 2.42
Commercial Per 1 m3 5.60 Government Per 1 m3
1.30 3.00 6.16 Standing (or Fixed) Charge Per Month 6.20
Domestic 400.00 Connection Fee (Service pipe length should be less than 10m, more than 10m to be assessed)
Commercial 350.00 700.00
Domestic 60.00 500.00 Deposit (Refundable, Trust Account) Commercial 300.00 1,000.00 Source: Sales and Customer Service Dept., SIWA
D1.2 Number of Customers and Collection Efficiency
The number of customers/users is around 6,800 on the basis of issued bills as of April 2005.
The amount of the average monthly revenue water was recorded at about 410,000m3 for FY2005. Domestic and commercial sales accounted for 58% and 42% respectively.
Table D1-2 Operation Income for FY2003-FY2005 (Unit: SI$1000) FY2003 FY2004 FY2005 Income-Honiara (A+B) 14,853.7 93.5% 15,471.0 89.9% 19,367.4 91.7%A Water Supply-Honiara 14,062.7 88.5% 13,755.5 79.9% 17,406.4 82.4% Domestic Water 2,715.2 17.1% 2,167.5 12.6% 4,182.0 19.8% Commercial Water 10,694.5 67.3% 10,571.2 61.4% 11,206.0 53.1% Standing Charge 502.0 3.2% 514.7 3.0% 1,551.4 7.3% Other Income 151.0 1.0% 502.1 2.9% 467.0 2.2%B Sewerage-Honiara 791.0 5.0% 1,715.5 10.0% 1,961.0 9.3%C Provinces 1,034.5 6.5% 1,746.9 10.1% 1,753.0 8.3% Auki 8.6 0.1% 6.2 0.0% 145.0 0.7% Noro 820.0 5.2% 1,380.3 8.0% 1,137.0 5.4% Tulagi 205.9 1.3% 360.4 2.1% 471.0 2.2%D Total Income(A+B+C) 15,888.2 100% 17,217.9 100% 21,120.4 100%
Source : SIWA

The Study for Rehabilitation and Improvement of Solomon Islands Water Authority’s Water Supply and Sewerage Systems
Final Report : Summary Report (D-2)
D1.3 Special Circumstances
D1.3.1 Lease Agreements with Landowner
Currently about 50% of SIWA’s water sources depend on Konglai Spring, where a lease agreement is concluded between the Department of Lands and the landowners. The Department is paying a few landowners 25% of the water sales revenue from Konglai Spring source, corresponding to the distributed amount per month at the Skyline tank, as calculated by SIWA.
For example, water distribution from Konglai Spring for April 2005 is estimated at 60,773 m3 per month (the amount deducted 64,800m3 distributed by Mataniko borefield from 125,573m3). Consequently, total water sale from Konglai is estimated at SI$114,062 of which SI$26,515 (25%) is due to landowners.
D1.3.2 Small Revenue from Auki
Revenue from Auki is negligible, due to insufficient water distribution volume. Although a water supply facility rehabilitation project by the Asian Development Bank (ADB) in Auki is under construction to upgrade existing water distribution facilities, groundwater development to find a new water source is indispensable.
D1.4 Technical Assistance by Foreign Donors
D1.4.1 The World Bank
The World Bank carried out the technical assistances for power and water utilities restructuring, management and regulation at the request of the Solomon Islands Government (SIG).
The following paragraphs are extracted from “The Final Report: Implementation of Management Contract - the Solomon Islands Electricity Authority (SIEA) and the Solomon Islands Water Authority (SIWA)” prepared by the consultants in September 2005.
In February, 2005 the World Bank (WB) and the Solomon Islands Government (SIG) initiated a project to prepare a financial restructuring plan for SIEA and to formulate various private sector participation (PSP) options for the SIEA. The PSP study was to review the industry structure and PSP options, including the potential for a multi-utility PSP option involving SIEA and the Solomon Islands Water Authority (SIWA), recommend a PSP option and develop an implementation plan for that option. the Consultant (PricewaterhouseCoopers in association with Allens Arthur Robinson) were engaged by the World Bank to carry out this project.
The Consultants recommended that a five year management contract be implemented for both SIEA and SIWA where the management contractor would be expected to initially run the two authorities separately during a transition period before they were legally merged into one authority. A management contract, if properly implemented, can prepare SIEA and SIWA for the future application of a fuller form of PSP (e.g. a concession in 5 years time).
The objectives of the management contract will be to establish an efficient and reliable operation and management of the electricity and water sectors in current service locations and to achieve full localisation of both authorities.
D1.4.2 Asian Development Bank
The Government has agreed to the provision of ADB’s technical assistance co-financed by the Government of Australia to examine PSP options for the nation’s State-Owned Enterprises (SOE).
The assistance consists of a total of 24 person months with both international and domestic consultants, and will be implemented over 24 months until February 2007 from March 2005. A steering committee

The Study for Rehabilitation and Improvement of Solomon Islands Water Authority’s Water Supply and Sewerage Systems
Final Report : Summary Report (D-3)
will be established, with selected senior officers from relevant government departments to help build consensus and drive the reform process.
D1.4.3 Coordination with Technical Assistances by Foreign Donors
Mutually integrated technical assistance has been implemented by the World Bank, ADB and JICA Study to improve the public sectors in the Solomon Islands.
Once this technical assistance ends, the management of SIWA is expected to be smoothly implemented by SIWA staff, from top management to employees, as an autonomous organization, focusing on securing its financial autonomy.
D2 Financial Situation
SIWA’s Annual Budget is drafted by the end of the previous year. The draft budget is prepared by each department and provincial departments firstly, then internal adjustment is made by the top management staff (general manager, 3 division managers). Finally SIWA’s board approves the budget. Daily expenses are also accounted for and controlled by the division level. The main reason is to facilitate control of every expense.
SIWA’s financial performance from the FY2003 to FY2005 (estimated) is shown in Table D2-1.
Total income in FY2005 is expected to be some SI$21 million, which is an increase of 16% on the FY2004 figure of SI$17.2 million.
Total expenditure is expected to be SI$24.7 million, including capital costs (SI$7.9 million), in FY2005. Total income is more than recurrent expenses (SI$16.7 million). However, electricity arrears to be settled with SIEA are not included.
Recurrent expenses amount to some SI$10 million (excluding depreciation) in FY2004 and were estimated at some SI$16.7 million for the FY2005.
Operation cost is the cost of operating water supply and sewerage systems and accounts for some 46% of total expenses. The largest portion of operation cost is electricity charges, amounting to SI$3.1 million in FY2004 and SI$5.6 million in FY2005.
SIWA owed SIEA SI$17.885 million in arrears for electricity charge as of December 2004.
SIWA has reviewed the electricity bills issued by SIEA for the period FY1999 to FY2004 and prepared “Financial Proposals for the Electricity Arrears” on 29 April 2005. According to this proposal, SIWA concluded that it actually owes SIEA about SI$10.2 million, as of the end of December 2004, in arrears for electricity charges.
This gap between SIWA and SIEA will be arbitrated by their supervisory organization.
The Department of Lands has the responsibility to pay land rent for the sites of water sources, pipelines and water reservoirs, etc. However, SIWA also has responsibility to pay land rent for the lease of the Skyline tank, the borehole for the White River, and the pipeline for Tasahe and the provinces.

The Study for Rehabilitation and Improvement of Solomon Islands Water Authority’s Water Supply and Sewerage Systems
Final Report : Summary Report (D-4)
Table D2-1 SIWA Financial Data (Unit: SI$1000) FY2003 FY2004 FY2005 I Total Income 15,888.2 100% 17,217.9 100% 21,120.4 100% II Recurrent Expenses (1+2+3) 6,068.2 100.0% 10,014.0 100.0% 16,771.7 100.0%
1 Employee Costs 2,544.6 41.9% 2,911.3 48.0% 3,024.1 49.8% Salaries & Wages 1,862.1 30.7% 2,039.2 20.4% 2,170.0 12.9% Allowances 547.9 684.2 624.0 NPF Contributions 113.2 157.9 197.2 Others 21.4 30.1 33.0
2 Administration Costs 2,009.6 33.1% 2,590.8 25.9% 5,966.1 35.6% Board Members Allowances 139.4 133.6 140.0 Audit & Accounting Fees 64.3 10.7 265.0 Awareness & Public Relations 59.0 140.2 10.0 Education/Training 30.0 18.0 286.0 Accommodations & Housing 841.1 13.9% 1,039.4 10.4% 1,194.0 7.1% Computer & Office Equipment 164.4 640.5 1,229.0 Printing, Stationery & Postage 96.8 309.1 473.5 Telephone 88.3 133.6 152.8 Transport & Travel 115.7 128.7 474.2 Others 410.6 37.1 1,741.6
3 Operation Costs 1,514.0 25.0% 4,511.8 45.1% 7,781.5 46.4% Electricity 671.6 11.1% 3,150.3 31.5% 5,649.5 33.7% Motor Vehicles & Machine Repairs 263.9 963.0 1,009.0 Fuel & Lubricants 295.6 276.5 572.0 Chemicals 34.2 42.1 225.0 Land Rental/Compensation 58.6 40.6 208.5 Others 190.1 39.4 117.5 III Balance (I-II) 9,820.0 61.8% 7,203.9 41.8% 4,348.7 20.6%IV Capital Costs 718.5 2,062.5 7,922.3 System Maintenance 591.3 1,379.2 3,081.5 Project Works 0.1 492.9 4,670.0 Tools & Equipments 127.1 190.3 170.8 V Balance before Grants Aid (III-IV) 9,101.5 57.3% 5,141.4 29.9% -3,573.6 -16.9%VI Government/Grants Aid 1,795.4 8,852.9 VII Total Balance (V+VI) 9,101.5 57.3% 6,936.8 40.3% 5,279.4 25.0%
Note 1. Values in FY2003 and Fy2004 are recalculated based on the data by the SIWA department and values in FY2005 are estimated by the Study Team based on the 2006 Annual Budget.
2. Percentages of balance mean percentage of total income and other percentages are based on recurrent expenses. Source : SIWA
D3 Financial Forecast
D3.1 Preconditions
The assumption of income and expenses statement should take account of annual inflation. The domestic inflation rates considered for the financial projections are provided in the table below in this financial plan. All values (SI$) are indicated in the form of nominal values, rather than fixed prices.

The Study for Rehabilitation and Improvement of Solomon Islands Water Authority’s Water Supply and Sewerage Systems
Final Report : Summary Report (D-5)
Table D3-1 Domestic Annual Inflation Rates Year Annual % Change Notes 1998 12.4% 1999 8.0% 2000 6.9% 2001 7.6% 2002 9.4% 2003 10.1% 2004 6.9% 2005 6.6%
(*1)
2006 9% 2007 8% 2008 6% 2009 6% 2010 6%
(*2)
Source: 1. Annual Report 2004, Central Bank of Solomon Islands 2. “SIEA Financial Restructuring Plan” prepared by the World Bank.
D3.2 Income Forecast
Annual income will be estimated based on the projection of FY 2006, as estimated by SIWA. Monthly average revenue water is 410,000m3, including provinces, and 375.000m3 for Honiara, which accounts for 90% of the total revenue water of SIWA.
D3.3 Expenses Forecast
SIWA’s expenses consist of recurrent expenses in the form of a routine budget and capital cost in the form of an infrastructure development budget.
i) Annual expenditure is estimated based on the FY2006 Approval Annual Budget of SIWA.
ii) Annual estimation shows a nominal price, including annual inflation.
D3.3.1 Costs
Costs consist of direct and indirect costs, including electricity debt payment to SIEA and depreciation cost.
(1) Employee Costs
Employee costs consist of salaries and wages, allowances, NPF contributions and others.
(2) Direct Costs
Direct costs for services of water supply and sewerage systems consist of employee costs, electricity costs, including debt payment to SIEA, depreciation costs and other recurrent costs for providing service. The direct costs are estimated based on the 2006 Annual Budget for the Office of Divisional Manager Engineering Services, Department of Planning & Design, Department of Water Supply, Department of Waste Water, Department of Environment, Department of Provincial Operations – Auki, Department of Provincial Operations – Tulagi, Department of Provincial Operations – Noro and Technical Services.
1) Electricity Electricity cost is budgeted based on annual consumption plus debt repayment (SI$10.2 million) to SIEA for the period FY 2006 to FY2010.

The Study for Rehabilitation and Improvement of Solomon Islands Water Authority’s Water Supply and Sewerage Systems
Final Report : Summary Report (D-6)
Table D3-2 Estimated Electricity Cost (SI$1,000) FY2005 FY2006 FY2007 FY2008 FY2009 FY2010 Electricity Bills *1 5,649.5 6,214.5 6,711.6 7,114.3 7,541.2 7,993.6 (Debt payment) *2 2,400.0 2,400.0 2,400.0 2,400.0 600.0 Annual SIWA Paid SIEA 5,649.5 8,614.5 9,111.6 9,514.3 9,941.2 8,593.6 Note 1:Electricity bills in FY2005-2006 are based on SIWA estimate and for FY2007-2010 are estimated by the Study Team. Note 2: Debt payment schedule is based on the arrear installment proposal for SIEA prepared by SIWA. Source: JICA Study Team
2) Depreciation
The SIWA accounting system does not take the depreciation cost into account. However, depreciation cost is essential for the survival of SIWA in terms of renovation or replacement of invested capital in future. Therefore, the following annual depreciation cost must take account of recurrent costs, according to the capital investment plan and based on Non-Current Assets of some SI$42.4 million at the end of 2003.
The depreciation period is divided into two categories, considering the lifespan as follows:
Table D3-3 Depreciation Period Category Capital Goods Service Life Average Life
System Building, System, Plants, Equipments, Meters, etc. 15 – 30 years 25 years
Other Computer, Motor Vehicles, Motors, etc. 5 – 10years 6 years Note: Estimated by the Study Team. Source: JICA Study Team
Table D3-4 Depreciation Cost (Unit : SI$ 1,000)
FY2005 FY2006 FY2007 FY2008 FY2009 FY2010 Non-Current Assets 44,929.8 50,381.3 54,725.6 70,789.7 85,877.6 100,886.7 Depreciation 2,353.7 2,541.3 3,143.0 3,346.9 4,277.0 5,105.9
Note: Values in Non-Current Assets are estimated based on SIWA data of SI$42,397,123 in FY2003 Source: JICA Study Team
3) Other
Other costs consist of operation costs, such as fuels & lubricants, motor vehicle repair & service, and maintenance costs based on the FY2006 Annual Budget.
(3) Indirect Costs
Indirect costs are estimated on the basis of the FY2006 Annual Budget, with annual inflation taken into account.
Indirect costs consist of recurrent costs for a) sales division such as the Office of the Divisional Manager Finance & Sales, Department of Sales and Customer Services, Department of Financial Management, Department of Internal Audit, and b) administration division such as the Board of Directors, Office of General Manager, Office of Divisional Manager Support Services, Department of Human Resources Development, Department of Administration and Department of Management Information Systems.
D3.3.2 Capital Costs
Capital costs mainly consist of system maintenance, project work and tools & equipment cost. It also includes vehicles and computers as other items. Annual capital costs are estimated in Table D3-5.

The Study for Rehabilitation and Improvement of Solomon Islands Water Authority’s Water Supply and Sewerage Systems
Final Report : Summary Report (D-7)
Table D3-5 Capital Costs (Unit : SI$ 1,000)
FY2005 FY2006 FY2007 FY2008 FY2009 FY2010 System 1,056.7 4,480.0 4,581.4 16,338.8 16,572.0 16,423.6Other 1,077.7 1,159.0 704.0 854.0 384.0 344.0Capital
Costs Total 2,134.4 5,639.0 5,285.4 17,192.8 16,956.0 16,767.6
Note: Estimated by the Study Team. Source : JICA Study Team
D3.4 Financial Forecasts and Counter Measures
D3.4.1 Financial Forecasts
According to the above assumptions, a trial calculation for profit and loss statement is made. The Estimated Profit & Loss Statement -A (refer to Table D3-6, Revenue assumption based on the FY2006 Annual Budget) shows deficits (negative profits) arising from FY2007. With this in mind, SIWA must either increase the revenue or reduce costs. If SIWA is unable to reduce costs, revenue should be increased from FY2007.
When it is assumed that revenue for FY2007 will be increased by 20% over the FY2006 level, SIWA will be sustainable up to FY2008. In FY2009, costs will be nearly equal to income, as shown in the Estimated Profit & Loss Statement - B (refer to Table D3-7, Revenue assumption, where FY2007 increased by 20% over FY2006). However, in FY2010, it will be difficult for SIWA to cover all costs, including depreciation.
Therefore, an applicable water tariff is needed for the period FY2007 to FY2009 for full cost recovery. If SIWA boosted revenue by 20% for the period FY2007 to FY2009, it would be financially viable according to the Estimated Profit & Loss Statement -C (refer to Table D3-8, Revenue assumption in the FY2007 and FY2010 increased by 20% over levels for FY2006 and FY2009 respectively). Accordingly, the water tariff must change by FY 2010.
Table D3-6 Estimated Profit & Loss Statement -A (Unit : SI$ 1,000)
FY2005 FY2006 FY2007 FY2008 FY2009 FY2010 A Income Water fees & Charges 18,635.7 21,950.0 21,950.0 21,950.0 21,950.0 21,950.0 Wastewater fees & Charges 1,802.2 2,020.0 2,020.0 2,020.0 2,020.0 2,020.0 Other Income 682.5 685.0 685.0 685.0 685.0 685.0 Total 21,120.4 24,655.0 24,655.0 24,655.0 24,655.0 24,655.0 B Direct Costs Employee Costs 1,694.7 1,872.2 2,022.0 2,143.3 2,271.9 2,408.2 Electricity (Billed) 5,649.5 6,214.5 6,711.6 7,114.3 7,541.2 7,993.6 Electricity Debts 0.0 2,400.0 2,400.0 2,400.0 2,400.0 600.0 Depreciation 2,353.7 2,541.3 3,143.0 3,346.9 4,277.0 5,105.9 Other 2,896.1 3,368.7 3,638.2 3,856.5 4,087.9 4,333.1 Total Direct Costs 12,594.0 16,396.6 17,914.7 18,860.9 20,577.9 20,440.8 C Balance (A-B) 8,526.4 8,258.4 6,740.3 5,794.1 4,077.1 4,214.2 D Indirect Costs Employee Costs 695.4 916.4 989.8 1,049.1 1,112.1 1,178.8 Other 764.2 1,490.1 1,609.3 1,705.9 1,808.2 1,916.7 Sub Total (Sales) 1,459.6 2,406.5 2,599.1 2,755.0 2,920.3 3,095.5 Employee Costs 634.0 1,241.8 1,341.2 1,421.6 1,506.9 1,597.3 Other 2,084.1 4,536.2 4,899.1 5,193.0 5,504.6 5,834.9 Sub Total (Administration) 2,718.1 5,778.0 6,240.2 6,614.7 7,011.5 7,432.2 Total Indirect Costs 4,177.7 8,184.6 8,839.3 9,369.7 9,931.9 10,527.8 E Total Costs (B+D) 16,771.7 24,581.1 26,754.0 28,230.6 30,509.7 30,968.6 F Net Profits/Deficits (A-E) 4,348.7 73.9 -2,099.0 -3,575.6 -5,854.7 -6,313.6
Note: 1. It is assumed that revenues and cost based on the 2006 Annual Budget. 2. Values in FY2006 are based on the 2006 Annual Budget and Values in FY2007-2010 are estimated by the Study Team.
Source : JICA Study Team

The Study for Rehabilitation and Improvement of Solomon Islands Water Authority’s Water Supply and Sewerage Systems
Final Report : Summary Report (D-8)
Table D3-7 Estimated Profit & Loss Statement -B (Unit : SI$ 1,000)
Item FY2005 FY2006 FY2007 FY2008 FY2009 FY2010 A Income Water fees & Charges 18,635.7 21,950.0 26,340.0 26,340.0 26,340.0 26,340.0 Wastewater fees & Charges 1,802.2 2,020.0 2,424.0 2,424.0 2,424.0 2,424.0 Other Income 682.5 685.0 822.0 822.0 822.0 822.0 Total 21,120.4 24,655.0 29,586.0 29,586.0 29,586.0 29,586.0 B Costs (Direct and Indirect) Employee Costs 3,024.1 4,030.4 4,352.9 4,614.0 4,890.9 5,184.3 Electricity 5,649.5 8,614.5 9,111.6 9,514.3 9,941.2 8,593.6 Depreciation 2,353.7 2,541.3 3,143.0 3,346.9 4,277.0 5,105.9 Other 5,744.4 9,395.0 10,146.6 10,755.4 11,400.7 12,084.8 Total 16,771.7 24,581.1 26,754.0 28,230.6 30,509.7 30,968.6 C Net Profits/Deficits (A-B) 4,348.7 73.9 2,832.0 1,355.4 -923.7 -1,382.6
Note: 1. It is assumed that revenues from FY2007 to 2010 are increased by 20% of 2006 revenus. 2. Values in FY2006 are based on the 2006 Annual Budget and Values in FY2007-2010 are
estimated by the Study Team.. Source : JICA Study Team
Table D3-8 Estimated Profit & Loss Statement -C
(Unit : SI$ 1,000) Item FY2005 FY2006 FY2007 FY2008 FY2009 FY2010
A Income Water fees & Charges 18,635.7 21,950.0 26,340.0 26,340.0 26,340.0 31,608.0 Wastewater fees & Charges 1,802.2 2,020.0 2,424.0 2,424.0 2,424.0 2,908.8 Other Income 682.5 685.0 822.0 822.0 822.0 986.4 Total 21,120.4 24,655.0 29,586.0 29,586.0 29,586.0 35,503.2B Costs (Direct and Indirect) Employee Costs 3,024.1 4,030.4 4,352.9 4,614.0 4,890.9 5,184.3 Electricity 5,649.5 8,614.5 9,111.6 9,514.3 9,941.2 8,593.6 Depreciation 2,353.7 2,541.3 3,143.0 3,346.9 4,277.0 5,105.9 Other 5,744.4 9,395.0 10,146.6 10,755.4 11,400.7 12,084.8 Total 16,771.7 24,581.1 26,754.0 28,230.6 30,509.7 30,968.6 C Net Profits/Deficits (A-B) 4,348.7 73.9 2,832.0 1,355.4 -923.7 4,534.6
Note: 1. It is assumed that revenues from FY2007 to 2009 are increased by 20% of FY2006 revenue and revenue of FY2009 is increased by 20% of 2009 revenue.
2.Values in FY2006 are based on the 2006 Annual Budget and Values in FY2007-2010 are estimated by the Study Team.
Source : JICA Study Team
D3.4.2 Consideration for Water Rate Revision
Based on the above forecasts, SIWA must revise its water rates to increase income. Before the introduction of a new tariff structure, the following items should be carefully reviewed by SIWA:
1) To review the possibility of a reduction in recurrent expenses from FY2007 in particular and to avoid a financial burden on users.
2) To consider the ability to pay of low-income groups for tariff revision, based on socio-economic survey results such as Ability to Pay and Willingness to Pay by low-income groups.
3) It is preferable to introduce a block-based commodity charge method for water consumption restraint type. To study countermeasures for different metering devices to come up with a new tariff calculation.
4) To study a change of tariff structure at 2 year intervals when significant changes take place at 3 year intervals.
5) To study special water rates to be applicable for foreign or high income residents, if they can be identified.
6) To consider water rates for large demand users in addition to socio-economic survey results, because they are important customers for SIWA. Relatively high rates are already adopted for commercial and government institutions from the viewpoint of an income ratio of some 70%, even though their water distribution ratio received only amounts to some 40% of total water supply.

The Study for Rehabilitation and Improvement of Solomon Islands Water Authority’s Water Supply and Sewerage Systems
Final Report : Summary Report (D-9)
7) To review options as case studies for new rates to cover the expenditure forecast in FY2009. These options are made for Honiara, which accounted for 90% of total income based on the FY2005 performance record (refer to Part G2.2 for the Action plan). D4 SIWA Organizational Structure and Business Strategy
SIWA Mandate, Departmental Purpose & Description and Strategic Directions are drafted as follows:
SIWA is mandated to deliver and levy charges for urban water industry services & products within its declared area of operations in a sustainable and environmentally responsible manner, consistent with government policies on good governance, transparency and accountability, while observing the cultural and social values of the Solomon Islands.
The board of directors consists of the 7 members mentioned below and board meetings are held regularly on a quarterly basis.
SIWA is mainly divided into 4 departments, namely i) Executive Management, ii) Engineering Services, iii) Support Services and iv) Financial and Sales under the Board of Directors.
SIWA is planning to increase the number of staff to 88 from the current workforce of 76.
The business strategy of SIWA is as follows:
Develop a competitive advantage by attracting, developing and maintaining a competent workforce.
Achieve customer satisfaction by developing and managing urban water industry infrastructure to international best practices standard throughout the Solomon Islands.
A move to a highly efficient and effective regulated national urban water industry.
Adherence to strong corporate governance and sound commercial principles & practices
D5 Current Problems Facing SIWA
The following problems are identified through the Study and necessary activities to be taken by SIWA for management improvement are mentioned in the Action Plan of “PART G”.
D5.1 Tariff Collection
(1) Collection Efficiency
SIWA identified a lack of full tariff collection as a problem because some people do not pay for water bills. SIWA will act to disconnect their meters and take legal action. SIWA will ensure they collect a deposit when applications are received to ensure that all arrears are paid.
(2) Bill Posting to Customers
It is noted that approximately 2,000 water bills had not been delivered to customers, since customers had no postal boxes and their water bills were always delayed. Further arrangement to address this problem will be dealt with by SIWA and the Post Office management, respectively. SIWA decided to increase the delivery of water bills by hand as far as possible.
(3) Change of Names/Addresses of Customers
SIWA found that customers sometimes move to new location from their usual place without settling their water bills. When doing so, they also either change their name/s or address/es so that it is difficult for SIWA to deliver their water bills to their new locations. To solve this problem, SIWA decided that landowners will be responsible for the payment of water bills of their occupants or tenants.

The Study for Rehabilitation and Improvement of Solomon Islands Water Authority’s Water Supply and Sewerage Systems
Final Report : Summary Report (D-10)
(4) Mix of Gallon Meters and Metric Meters
There are two types of meters used by SIWA. One is the imperial (Gallon unit) and the other is the metric type. Sometimes bill amounts are calculated inappropriately due to miscalculation during conversion. On a monthly basis, the number of claims from customers amounted to about 500, including those made to the telephone enquiry number on bills. SIWA will change all the old meters (imperial) to metric ones and considers that all meter readers should periodically receive proper training.
(5) Tariff Collection from Shared Standing Pipe User’s
Some communities use one water tap as shared standing pipes and payment for the bill can not be coordinated by the users of the group. In many cases, their bill payments are not made properly. SIWA will give some incentives to community leaders who will act as SIWA agents to collect tariff from their community’s members.
D5.2 Income Sources
(1) Water Sales Arrears
The customers owed SIWA around SI$ 12.4 million (active debtors) as of the end of 2005. Although the arrears of the government are gradually being recovered and are declining, the problem of college’s arrears remains unsolved. SIWA will take legal means to ensure that creditors, including the government, make payments in full.
(2) Water Tariff
All expenses such as salary, electricity, fuel, etc. in SIWA’s account have been increased day by day due to inflation, while the present water tariff rate has been fixed since December 2003. The current tariff rate does not reflect the cost in tariff to services and recovering costs. Currently, Honiara subsidizes the water production cost in the provinces. SIWA is considering how to justify a reasonable tariff rate, for which there would be 3 categories.
(3) Low Pressure and Unserved Area
As described in B1.4 “Water Supply System”, the Study has confirmed that about 25% of the served population in Honiara suffer from low pressure there. In order to overcome the above mentioned problems, SIWA is planning to improve the existing system to consumers demand, based on the results of this Study. SIWA will supply water to meet consumers’ demands and needs in the low pressure areas. SIWA is also planning to provide a water tanker to deliver water to consumers in unserved or low pressure areas.
(4) Sludge Disposal Services
There are 3 commercial vacuum trucks owned by the Honiara City Council and a commercial company. However, these services are not considered free from pollution. Sludge collected from the septic tanks is drained into SIWA’s sewer manholes along the seashore or dumped untreated at the final disposal site.
Since sewage treatment service is one of the SIWA mandates for environmental protection, SIWA intends to take the responsibility for the maintenance service of septic tanks.
D5.3 Operation and Maintenance (O/M) Cost
(1) Electricity
The remarkable item of operation costs is electricity. How to reduce electricity cost is a big issue for SIWA. SIWA owed SIEA some SI$17million in arrears on electricity bills since 1999 to the end of FY2004. SIWA submitted SIEA a reconciliation proposal for the electricity arrears of SI$10.2 million

The Study for Rehabilitation and Improvement of Solomon Islands Water Authority’s Water Supply and Sewerage Systems
Final Report : Summary Report (D-11)
in April 2005. However, negotiation for reconciliation between two parties had yet been held as of the end of 2005.
(2) Housing Allowance
SIWA is spending lots of money on renting accommodation for its employees according to a housing free policy. In addition, SIWA needs to repair the rented houses. SIWA is considering alternative possibilities to solve this issue and has already acquired land for housing estates in Honiara and the provinces.
(3) Non Revenue Water (NRW)
According to the leakage survey under this Study, NRW (real loss plus administration loss) was revealed to be 43%. Water losses are mostly considered to be due to leakage on water distribution facilities used beyond their service lifespan and due to poor workmanship of construction. SIWA usually executes repairs on the damaged parts only when leakage has occurred.
(4) Land Lease
Land lease fees for the sites of boreholes, pipelines, water tanks, etc. should be borne by SIWA. In the case of Mataniko, SIWA and owners have mutually agreed upon an annual fee since 1988. However, land lease fees in Noro and Tulagi remain under negotiation.
D5.4 Organization and Human Resources
(1) Staffing
SIWA currently has 76 staff and is planning to employ more than 10 persons to strengthen the organizational functions by securing workers to repair the aged infrastructure. SIWA is planning to renovate the existing headquarters to a two-story building in order to cater for space to accommodate the new development within the organization. SIWA is also concerned about insufficient staff in the provinces, e.g. only two staff members in Auki.
(2) Assets Management and Inventory Control
SIWA has lots of materials and parts in its store to make repairs to the water supply system. However, the inventory control system from purchasing materials and parts to their delivery for repair at customer request is not well established. SIWA is planning for a store expert to be developed and countermeasures to be introduced.
(3) Accounting System
SIWA’s accounting system does not accord with the international accounting system. The present accounting staff are incapable of preparing Balance Sheets (B/S) and Profit and Loss Statements (P/L). B/S and P/L for 1996 were drafted by the accounting office in Solomon and authorized by SIG in 2005. B/S and P/L for the period 1997 to 2005 have not yet been authorized. However, SIWA is planning to recruit a highly educated accountant who is able to produce B/S and P/L.
(4) Geographical Information System (GIS)
The existing data and information concerning the water supply system has not been updated properly in the GIS system introduced in SIWA, due to a lack of manpower of GIS engineers. This sometimes causes trouble in terms of repair and maintenance work at site because the existing conditions at the site differ from the existing data and information. SIWA is planning to use GIS more effectively by the engineers.
(5) Efficient Operation System for Water Supply Facilities
The electricity cost is a burden on overall SIWA operation costs. In order to reduce the cost of electricity through an efficient operation system for water supply facilities. SIWA is planning to introduce a SCADA system for intensively controlling the whole of SIWA’s facilities at the SIWA headquarters.

The Study for Rehabilitation and Improvement of Solomon Islands Water Authority’s Water Supply and Sewerage Systems
Final Report : Summary Report (D-12)
(6) Water Quality Analysis
SIWA is only capable of performing water analysis for typical items defined in WHO guidelines because of a lack of testing equipment and staff. SIWA needs to acquire laboratory equipment to enhance capacity building for water quality analysis and also laboratory staff to enhance its quality services.
(7) Information Technology (IT)
An IT system (Linux) is installed in the Honiara headquarters but not yet in the provinces. Therefore, SIWA needs to install the latest software for the headquarters and IT hardware for the provincial offices to achieve efficient service.
(8) Workshop for Maintenance
There is no workshop building for the maintenance of vehicles and machinery in and around the premises of SIWA headquarters. Mechanical technicians are forced to perform repair works outside, where they are affected by the severe natural circumstances. The Study Team prepared a plan of workshop building for repair work.

The Study for Rehabilitation and Improvement of Solomon Islands Water Authority’s Water Supply and Sewerage Systems
Draft Final Report : Summary Report (E-1)
PART E PLAN FOR NEW BUILDINGS FOR INSTITUTIONAL STRENGTHENING OF SIWA
E1 Current Situation and Problems for Office Environment of SIWA
Head office of SIWA is located in Honiara and the premises of SIWA’s head office comprise of main office building, customer service building, meeting house, store house and security post.
Current problems facing SIWA are described as follows.
Existing main office building is full up to capacity and it is difficult to make a proper room allocation to the staff.
SIWA is planning to recruit around 10 new staff in the near future. However, insufficient capacity of main office building is now an obstacle to the recruiting plan of SIWA.
Staff rooms for accountant department and the related departments are allocated separately so that their work can not be done efficiently.
Since water quality laboratory is located in the main office building, it should be relocated in a separate building because the dangerous chemicals are handled there.
Main store house is located across the road along SIWA’s head office premises. Therefore, it is difficult for SIWA to do its maintenance properly. SIWA has a small store house made of container within the head office premises. However, it does not have enough space to contain important items with frequent use. Repair of vehicles and equipment is executed outside, which is easily affected by the weather.
The elevation of the premises is lower than that of the road nearby and therefore the main office building is likely to be flooded by a heavy rain.
There are 36 technicians and field workers mainly working outside who have no indoor space to take a rest.
E2 Overall Plan for New Buildings
In order to solve the above-mentioned problems, SIWA is desirous of making a construction plan for new buildings. It is considered that the construction of new buildings is important for organization and staff reinforcement. Therefore, in this Study, the construction plan for new buildings has been proposed in consideration of the following points. (Refer to Annex-17)

The Study for Rehabilitation and Improvement of Solomon Islands Water Authority’s Water Supply and Sewerage Systems
Draft Final Report : Summary Report (E-2)
Table E2-1 Points to be Considered in Construction Plan of New Buildings Building Points to be Considered
Main Office Building ・ Functions of existing customer service building and conference building shall be included in new main office building so that services to the customers can be improved.
・ Space for all the permanent staff shall be secured and each room shall be arranged in the new main office building so that the staff can work efficiently.
Workshop Building ・ Water quality laboratory shall be relocated from the current main office building to this building.
・ Space for a store of important items with frequent use and maintenance area of vehicles and equipment shall be secured.
・ Space for all the field workers shall be secured so that they can use it for their doing desk work and taking a rest.
Security Post ・ Security Post shall be located at the west end and at the new entrance of SIWA’s premises.
Landscaping ・ Fences shall be installed along the boundary of the premises. ・ The elevation of the land of the current premises shall be raised by
40cm in average so that the rain water does not flow into the buildings.
・ Space for vehicles for SIWA staff, customers and maintenance work shall be secured.
Source: JICA Study Team E3 Cost Estimation
The construction cost for new buildings was estimated as shown in Table E3-1.
Table E3-1 Cost Estimation for New Buildings of SIWA
Building Name Floor Area (m2)
Unit Price (SI$/m2)
Cost (SI$) Remarks
Main Office Building 1,224 5,000 6,120,000 Structural Steel Workshop Building 648 4,000 2,592,000 Structural Steel Security Post 35 2,000 875,000 Wooden Frame Related Works -- -- 3,155,000
Total 12,742,000 Note : Related works include site reclamation work, fencing/gate installation work, and demolishing of the
existing buildings of SIWA. Source: JICA Study Team

The Study for Rehabilitation and Improvement of Solomon Islands Water Authority’s Water Supply and Sewerage Systems
Final Report : Summary Report (F-1)
PART F PILOT PROJECTS OF THE STUDY
F1 Contents of Pilot Projects
F1.1 Policy for Selecting Pilot Projects
Pilot projects shall be selected in accordance with the following policy;
• Pilot project will lead to capacity building of management and financial aspect of SIWA. • Pilot project will lead to strengthening the relation between SIWA and residents. • Outcomes of the pilot project will be utilized for the action plan.
F1.2 Analysis of Current Issues for SIWA and Selection of Pilot Projects
The current problems which SIWA is faced with have been sorted out by the internal workshops by SIWA and results of several discussions with SIWA about the current issues to be solved.
Pilot projects have been selected using four (4) criteria as follows;
• Criterion-1 : Impact on SIWA’s capacity building • Criterion-2 : Period for implementation • Criterion-3 : Effect after implementation • Criterion-4 : Utilization of outputs in action plan Finally, after consultation with the stakeholders in the workshop held in 8th of August 2005, following four (4) pilot projects were selected;
PP-1 : Formulation of Tariff Collection Improvement Method PP-2 : Establishment of Leakage Reduction Indicator PP-3 : Water Conservation Campaign PP-4 : Installation of Shared Standing Pipe
F1.3 Outline of Pilot Projects
Outline of pilot projects is shown in Table F1-1.
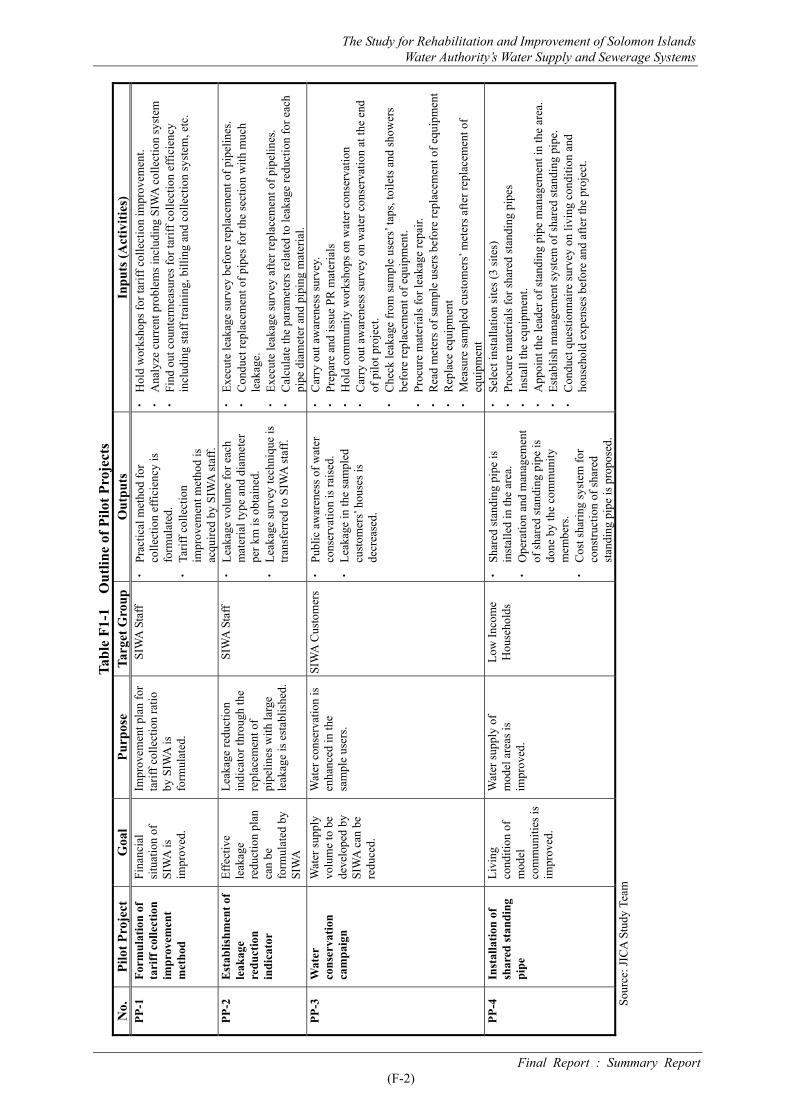
The Study for Rehabilitation and Improvement of Solomon Islands Water Authority’s Water Supply and Sewerage Systems
Final Report : Summary Report (F-2)
Tabl
e F1
-1
Out
line
of P
ilot P
roje
cts
No.
Pi
lot P
roje
ct
Goa
l Pu
rpos
e Ta
rget
Gro
upO
utpu
ts
Inpu
ts (A
ctiv
ities
) PP
-1
Form
ulat
ion
of
tari
ff c
olle
ctio
n im
prov
emen
t m
etho
d
Fina
ncia
l si
tuat
ion
of
SIW
A is
im
prov
ed.
Impr
ovem
ent p
lan
for
tarif
f col
lect
ion
ratio
by
SIW
A is
fo
rmul
ated
.
SIW
A S
taff
・
Prac
tical
met
hod
for
colle
ctio
n ef
ficie
ncy
is
form
ulat
ed.
・
Tarif
f col
lect
ion
impr
ovem
ent m
etho
d is
ac
quire
d by
SIW
A st
aff.
・
Hol
d w
orks
hops
for t
ariff
col
lect
ion
impr
ovem
ent.
・
Ana
lyze
cur
rent
pro
blem
s inc
ludi
ng S
IWA
col
lect
ion
syst
em
・
Find
out
cou
nter
mea
sure
s for
tarif
f col
lect
ion
effic
ienc
y in
clud
ing
staf
f tra
inin
g, b
illin
g an
d co
llect
ion
syst
em, e
tc.
PP-2
E
stab
lishm
ent o
f le
akag
e re
duct
ion
indi
cato
r
Effe
ctiv
e le
akag
e re
duct
ion
plan
ca
n be
fo
rmul
ated
by
SIW
A
Leak
age
redu
ctio
n in
dica
tor t
hrou
gh th
e re
plac
emen
t of
pipe
lines
with
larg
e le
akag
e is
est
ablis
hed.
SIW
A S
taff
・
Leak
age
volu
me
for e
ach
mat
eria
l typ
e an
d di
amet
er
per k
m is
obt
aine
d.
・
Leak
age
surv
ey te
chni
que
is
trans
ferr
ed to
SIW
A st
aff.
・
Exec
ute
leak
age
surv
ey b
efor
e re
plac
emen
t of p
ipel
ines
. ・
Con
duct
repl
acem
ent o
f pip
es fo
r the
sect
ion
with
muc
h le
akag
e.
・
Exec
ute
leak
age
surv
ey a
fter r
epla
cem
ent o
f pip
elin
es.
・
Cal
cula
te th
e pa
ram
eter
s rel
ated
to le
akag
e re
duct
ion
for e
ach
pipe
dia
met
er a
nd p
ipin
g m
ater
ial.
PP-3
W
ater
co
nser
vatio
n ca
mpa
ign
Wat
er su
pply
vo
lum
e to
be
deve
lope
d by
SI
WA
can
be
redu
ced.
Wat
er c
onse
rvat
ion
is
enha
nced
in th
e sa
mpl
e us
ers.
SIW
A C
usto
mer
s・
Publ
ic a
war
enes
s of w
ater
co
nser
vatio
n is
rais
ed.
・
Leak
age
in th
e sa
mpl
ed
cust
omer
s’ ho
uses
is
decr
ease
d.
・
Car
ry o
ut a
war
enes
s sur
vey.
・
Prep
are
and
issu
e PR
mat
eria
ls
・
Hol
d co
mm
unity
wor
ksho
ps o
n w
ater
con
serv
atio
n ・
Car
ry o
ut a
war
enes
s sur
vey
on w
ater
con
serv
atio
n at
the
end
of p
ilot p
roje
ct.
・
Che
ck le
akag
e fr
om sa
mpl
e us
ers’
taps
, toi
lets
and
show
ers
befo
re re
plac
emen
t of e
quip
men
t. ・
Proc
ure
mat
eria
ls fo
r lea
kage
repa
ir.
・
Rea
d m
eter
s of s
ampl
e us
ers b
efor
e re
plac
emen
t of e
quip
men
t ・
Rep
lace
equ
ipm
ent
・
Mea
sure
sam
pled
cus
tom
ers’
met
ers a
fter r
epla
cem
ent o
f eq
uipm
ent
PP-4
In
stal
latio
n of
sh
ared
stan
ding
pi
pe
Livi
ng
cond
ition
of
mod
el
com
mun
ities
is
impr
oved
.
Wat
er su
pply
of
mod
el a
reas
is
impr
oved
.
Low
Inco
me
Hou
seho
lds
・
Shar
ed st
andi
ng p
ipe
is
inst
alle
d in
the
area
. ・
Ope
ratio
n an
d m
anag
emen
t of
shar
ed st
andi
ng p
ipe
is
done
by
the
com
mun
ity
mem
bers
. ・
Cos
t sha
ring
syst
em fo
r co
nstru
ctio
n of
shar
ed
stan
ding
pip
e is
pro
pose
d.
・
Sele
ct in
stal
latio
n si
tes (
3 si
tes)
・
Proc
ure
mat
eria
ls fo
r sha
red
stan
ding
pip
es
・
Inst
all t
he e
quip
men
t. ・
App
oint
the
lead
er o
f sta
ndin
g pi
pe m
anag
emen
t in
the
area
. ・
Esta
blis
h m
anag
emen
t sys
tem
of s
hare
d st
andi
ng p
ipe.
・
Con
duct
que
stio
nnai
re su
rvey
on
livin
g co
nditi
on a
nd
hous
ehol
d ex
pens
es b
efor
e an
d af
ter t
he p
roje
ct.
Sour
ce: J
ICA
Stu
dy T
eam

The Study for Rehabilitation and Improvement of Solomon Islands Water Authority’s Water Supply and Sewerage Systems
Final Report : Summary Report (F-3)
F1.4 Implementation Framework of Pilot Project
Pilot projects have been implemented for getting data for formulation of the action plan on capacity development of SIWA by means of;
• Training SIWA staff for the improvement method for water tariff collection • Training SIWA staff for leakage detection and reduction technique • Training SIWA staff for enhancing awareness of water conservation to the residents and, • Training SIWA staff for developing a method for expansion of water supply to the unserved
population mainly in the low income area The pilot projects were implemented by JICA Study Team in cooperation with SIWA counterpart staff and by the assistance of NGOs, mass media and private sectors. Implementation frame of the pilot projects are as shown in Figure F1-1.
Source: JICA Study Team
Figure F1-1 Implementation Framework of Pilot Projects
F2 Results of Pilot Projects (PP)
F2.1 PP-1 : Formulation of Tariff Collection Improvement Method
In order to strengthen SIWA management system, two (2) workshops with SIWA staff were held on 16th and 23rd of November 2005 for examining a method for revenue improvement of SIWA by means of project cycle management (PCM) method.
The targets of the workshop were as follows; 1. Increasing water sales income (tariff collection ratio) 2. Improving financial situation of SIWA The workshops were held to discuss current problems (direct causes) on tariff collection system by means of problem analysis and find out solution of each problem through objective analysis taking into account their realization in terms of expectation.
Attendants were 13 staff of SIWA from Support Services Division, Finance & Sales Division and
• Interview Survey • Broadcasting by Radio • Advertisement on Newspaper • Replacement of Pipes • Replacement of Washers • Installation of Stand Pipes
Entrustment Activities
Activities
(Workshop / Training)
[Target Group]
JICA Study Team
NGO
Mass Media
PrivateSector
SIWA Staff
SIWA’s Customers
Low Income Households

The Study for Rehabilitation and Improvement of Solomon Islands Water Authority’s Water Supply and Sewerage Systems
Final Report : Summary Report (F-4)
Engineering Services Division including general manager.
After the discussions in the workshops, following problems were identified and their solutions were reflected in the action plan;
(1) Low water rates for domestic customers (2) Affordability of low-income group (3) Water sales arrears (4) Change of names/addresses of customers (5) Bill posting method (6) Customers’ negligence (7) Customers’ satisfaction (8) Mix of metric meters and gallon meters (9) Lack of logistic support
In order to discuss how to improve revenue SIWA, the workshops were held twice in November 2005. Through these workshops, top management and senior staff of SIWA had discussions on the current problems on tariff collection system and solution of the problems. Lesson learnt from the workshop is described as follows;
Purpose of workshop is to find out the current problem on tariff collection system and how to increase collection efficiency from the present tariff collection achievement. However, it is very difficult for them to fix future collection ratio because they are familiar with water sales value (Billed Amount) on a monthly basis. There would be two major reasons mentioned below.
1) One of the absolute measures is to disconnect meters of the customers that do not pay water charge. On the other hand, this countermeasure is against SIWA’s slogan of “Water is life” and it will reduce number of customers. Therefore, SIWA is in a dilemma whether to implement disconnection of meters or to allow payment arrear which causes huge amount of debts for SIWA.
2) Although they understand collection efficiency is the most important matter in view of SIWA management, it is difficult for them to assume future collection ratio because there is no achievement records due to the ethnic tension.
F2.2 PP-2 : Establishment of Leakage Reduction Indicator
According to the leakage survey conducted in Phase-1 of the Study, the leakage (or real loss) ratio of Honiara was found as 40% and non revenue water consisting of leakage, apparent loss and unbilled authorized consumption was 43%. This means that SIWA is distributing much water without revenue so that revenue water ratio is as low as 57% in 2005. Therefore, reduction of leakage is considered as one of the biggest issues for the management of SIWA.
Purpose of this pilot project is to establish leakage reduction indicator which will be utilized for implementation of the efficient leakage reduction program by SIWA. The pilot project is mainly divided into two activities as follows;
- Minimum night flow (or leakage) survey by JICA Study Team and SIWA counterpart. - Pipe replacement work done by the private sector entrusted by the Study Team. The pilot project (PP-2) was implemented from the end of November 2005 to the middle of March 2006. Process and activities of PP-2 is as explained in Figure F2-1.
Locations of 12 model areas have been selected in such a manner that the selected areas represent the whole Honiara.

The Study for Rehabilitation and Improvement of Solomon Islands Water Authority’s Water Supply and Sewerage Systems
Final Report : Summary Report (F-5)
Source: JICA Study Team
Figure F2-1 Process of the Activities for PP-2 In order to grasp the leakage reduction volume, the minimum night flow before pipe replacement was measured. Then, the pipeline with large leakage was replaced with new pipes. After that, the minimum night flow was measured again.
From the survey in this pilot project, 300m3/km/day was obtained as the leakage reduction indicator.
The Solomon Islands has a dry season and rainy season. Implementation period of this pilot project fell in the rainy season. Therefore, the progress of pipe replacement work and minimum flow measurement were much affected by the weather.
During the detection work of the existing pipelines with large leakage to be replaced, it was found that the existing GIS drawings of SIWA do not show the pipe location exactly and some of the pipelines are buried just under the ordinary houses or opposite side of the indicated route. This means that the maintenance of the pipelines is difficult for SIWA.
In this pilot project, the existing pipelines with the diameters of 50, 75, 100 and 150mm and service life of more than 30 years were selected. Among these diameters, leakage amount of 50 and 75mm pipeline, the length of which accounts for one-third of the existing pipelines, was judged relatively bigger than 100 and 150mm.
By the implementation of this pilot project, following lessons have been learnt;
Pipe replacement for leakage reduction should be executed intensively during dry season. SIWA has to update the GIS data for the location of water supply facilities such as pipelines,
valves, etc. so that the pipe replacement work can be executed smoothly and effectively. Leakage reduction work has to be concentrated on the pipelines of 50mm and 75mm at the early
stage to gain much leakage reduction.
JICA Study Team and SIWA
Selection of 12 model areas
Leakage Survey in the model area (by measuring minimum night flow)
Identification of water distribution pipe with large leakage (max. length of 100m : total 1,200m)
Leakage survey after the replacement
Calculation of leakage reduction volume and reduction ratio (m3/km/day)
Implementation of the above items for 12 model areas
Finally, determination of leakage reduction ratio
Replacement of the pipeline with new pipes
Entrusting to Private Sector
12 model Areas

The Study for Rehabilitation and Improvement of Solomon Islands Water Authority’s Water Supply and Sewerage Systems
Final Report : Summary Report (F-6)
F2.3 PP-3 : Water Conservation Campaign
In order to raise awareness of water conservation, replacement of washers and cisterns was carried out at the selected households, KG VI school and Honiara Hospital. Prior to implementation, SIWA carried out questionnaire survey to select the candidate households for the PP-3. As a result, 50 domestic users and two large water users (KG VI School and Honiara Hospital) were selected as the targets. After repair of water service equipment, water consumption of the large water users tends to decrease after repair of leaking taps, showers and toilets. On the other hand, water consumption of the domestic users is decreasing for some households, while others are increasing or no change. Monitoring period is only one month after repair, so that there is not enough data to evaluate effects of repair of water service equipment on water conservation. It is necessary to continue to monitor water consumption of the large water users and domestic users.
Newspaper advertisement and radio programme were carried out for eight weeks in order to raise public awareness of water conservation. Leaflets explaining tips for water conservation were prepared and distributed in order to raise public awareness of water conservation.
Community workshops were carried out at Kaibia, Fulisango and Burns Creek. Participants of the workshops had no knowledge of water conservation. They did not understand the importance as to why water has to be conserved. Some people knew the radio programme of water conservation. Therefore, the necessity of water conservation was explained by facilitator.
<Necessity of water conservation> • Residents in Kaibia have been facing water problems due to the fact that the flow of water at the
source has changed its direction. This has resulted with water shortage. Therefore, it is important that the residents save water as it is getting more difficult to obtain water from their source.
• Fulisango residents have been facing same water problems as Kaibia. If they did not save water by monitoring and saving their daily usage they are at risk of drying up their water source faster.
• Residents have to use their water sustainable as SIWA has to practice sustainable pumping or the water in the borehole will mix up with sea water.
<Benefit of water conservation> • If they monitor the amount of water, they will be able to save a lot of money. • In addition to saving money, the environment will improve as there is less water that is used. It
means that the supply does not deplete at a fast rate. Participants did not know how to calculate daily water consumption and bills, so that they split into two groups to calculate water consumption and bills based on the amount of water used in a typical household. In case of calculation for only one person, they feel the water bill is not so high. However, when they calculate water consumption and bills for their family, those become very high because of the extended family and their behavior. Thus some participants raised comments that it is hard to save water because of the extended family.
The followings are identified as low perception of current water tariff and behavior through the community workshops and questionnaire survey.
• Most of community members did not know the current water tariff and water consumption per day before the workshop.
• In Kaibia and Fulisango, they use the piped water as they do in their home village, i.e. washing clothes under running tap, etc. In Burns Creek, they use different water sources by purpose because they do not have private water taps and the number of standing pipe is very limited.
• Most of community members did not understand the term “water conservation” before the workshop.
• In addition to their behavior on water consumption, the extended family also makes the water bills

The Study for Rehabilitation and Improvement of Solomon Islands Water Authority’s Water Supply and Sewerage Systems
Final Report : Summary Report (F-7)
high. Therefore, it is thought that water conservation is difficult. • Some people do not care about washing dishes/clothes under running tap and unattended running
taps. • Landlords are responsible for repair of leaking taps in the rented dwelling, so that tenants’
awareness of leaking taps is relatively lower than dwelling owners. SIWA had activities for raising public awareness of water such as talks at schools, issuing newsletters, etc. before changing job description of community education and consultation officer in 1999. After that, nobody is in charge of public relations and a few activities have been carried out in the national event or the anniversary of establishment of SIWA. It is difficult to disseminate basic information on water supply, i.e. water tariff and enhance practice of proper water use or water conservation because the activities are not carried out continuously. Meter readers are most visible and have opportunities for public relations, but reliability from the customers on meter reading is very low.
F2.4 PP-4 : Installation of Shared Standing Pipe
Matariu and two communities of Burns Creek were selected as model communities for the PP-4. Matariu was hit in the Socio-economic Survey as a community, which had wanted a shared standing pipe. Several communities of Burns Creek have already had shared standing pipes and SIWA recognizes that communities of Burns Creek have potentials to manage shared standing pipes since there are good example in the area. The number of households is forty (40) for Burns Creek 1, eight (8) for Burns Creek 2, and three (3) for Matariu.
For each community, one representative was appointed to control usage of the shared standing pipe and collect charge from the households. The representative consulted with the community members on usage of the shared standing pipe and charge collection. As a result, the representative and the community of each target area decided that the standing pipe should be used for drinking and cooking only because it is very difficult to control water consumption if it can be used for all proposes.
In principle, scope of SIWA is to lay 10m of water service pipe branched from water distribution pipe. Most of required water service pipe laying work should be borne by customer. Bearing the water service cost is supposed to be one of the reasons that low income households can not conduct the water connection individually. Therefore cost per household should be affordable for the households of the target community if the standing pipe water supply were extended by SIWA.
After the facility construction, the representative person of each target community applied water supply service to SIWA and SIWA put meters and started managing the standing pipes as customer. Since one standing pipe is counted as one customer under the current SIWA’s customer registration system, the number of registered customer increased only three. However there are 51 households behind the three registered customers. As a result, SIWA got 51 real customers and 51 households became to be capable to obtain the piped water.
Each target community plans to pay the water tariff through the representative person, who signed on water supply service application form to SIWA. The representative person is required to collect certain amount of money from member households and finish the monthly payment to SIWA.
(1) Advantage and Disadvantage of Shared Standing Pipe
Through PP-4, the followings are found as advantage of shared standing pipe.
Shared standing pipe increases real customers at low investment cost when the length of water service pipe can be kept shorter and consisting household number can be secured enough.
Shared standing pipe decreases unserved population of the piped water at low investment cost. Shared standing pipe is effective for low income households, who can not afford to connect the
piped water individually.

The Study for Rehabilitation and Improvement of Solomon Islands Water Authority’s Water Supply and Sewerage Systems
Final Report : Summary Report (F-8)
Meanwhile, the followings are found as disadvantage of shared standing pipe.
Shared standing pipe requires investment to be charged to customers for construction. The construction cost is high, especially for communities far from the existing water distribution pipe.
Shared standing pipe requires stable revenue form member households. In case that some households did not pay their share, all remaining households should be influenced for water supply maintenance.
(2) Recommended Ways to Overcome Disadvantages
1) Investment sharing and payment In order to keep fairness between shared standing pipe customers and other individual customers, the construction cost should be borne by customers. Therefore candidate communities, which need shared standing pipe, are responsible for construction in principle.
However many of communities are supposed to be unable to finish full payment at construction time. In this case, it is recommended that SIWA constructs the facility and claim the payment in installments. Reasonable payment period is as same as life of construction i.e. 25 years for water service pipe and 15 years for tap facility. When the payment in installments is introduced, SIWA claim the construction cost monthly as an additional claim to water tariff.
2) Securing stable revenue The following two cases are forecasted as obstacles for stable revenue;
- Some households are put in serious situation for paying water tariff or refuse the payment. Consequently enough amounts can not be collected to complete the payment to SIWA.
- Representative person, who collect the tariff in the community, does not complete the payment to SIWA.
In order to solve the above problem, SIWA should conduct a series of workshops in the community before the construction and obtain residents’ consent on rule of shared standing pipe management. It is recommended to have a written consent of member households as an attachment of water supply application.
3) Residents’ consensus The written consent, as described above, is recommended to cover the followings:
- Ways to select/dismiss the representative person and his service term - Rights and obligations of the representative person - Name of the selected first representative person - Ways to share the construction cost and payment period - Ways to share the maintenance cost, reserve fund for repair and manage the fund - Ways to determine the sharing water tariff such as fixed rate per household or number of
family - Location of tap facility - Rules for usage of the tap facility - Ways to withdraw from community of shared standing pipe - Countermeasures in case that non payable household is found
(3) Role of SIWA
SIWA should play roles of not only water supplier but also facilitator to conduct the residents’ consensus. The recommended activities of SIWA are as follows for the shared standing pipe;
- Survey for candidate community on number of households, topography, households’ spreading condition, distance from the existing distribution pipeline, capable water quantity to be supplied from the existing distribution network
- Cost estimation for construction of shared standing pipe and make a example price to be shared

The Study for Rehabilitation and Improvement of Solomon Islands Water Authority’s Water Supply and Sewerage Systems
Final Report : Summary Report (F-9)
- Holding workshop to confirm the residents’ intension to have a shared standing pipe and presenting the example price to be shared
- Facilitating the residents’ consensus through several workshops until completion of written consent
- Inspection and maintenance with charge of the facility on behalf of the community if the community desires
(4) Finding Candidate Community
Principally, SIWA starts facilitating activities based on community’s application. However SIWA can utilize the shared standing pipe as one way to increase the number of customer and develop the income. It is therefore recommended positive customer development through shared standing pipe.
SIWA can list up candidate communities utilizing the existing list of customer and contact the listed community for needs and market survey through hearing from sampled households. After confirmation of potential to have a shared standing pipe, SIWA should organize the first workshop to confirm the intention of the community.
(5) Standard Number of Household of Candidate Community
Water consumption rate of shared standing pipe is supposed to be approx. 50 LCD. According to the Socio-economic Survey, average family number is about 8 per household in Honiara. Therefore the water consumption per household is supposed to be 12 m3 per month. This is converted into SI$12.00 using the current water tariff rate.
The other hand, from the result of “Survey on Water Supply after the Project” done in PP-4, resident s are willing to pay SI$20.00 - 30.00/household/month. In this case, SI$8.00 - 18.00/household/month can be affordable for construction and maintenance cost of the shared standing pipe because the standing pipe is used only for drinking and cooking, so that the water charge will not become so high.
Assuming that standard length of water service pipe is 100m, the construction cost is calculated at SI$10,725.00.
Considering depreciation years and maintenance cost (1% of construction cost per year), total cost per year is supposed to be SI$668.25/year and to be covered by 40 households. Therefore, standard number of household to share one stand pipe is set as 40.
(6) Attention to be Paid in the Extending Shared Standing Pipe
Although the extending shared standing pipe will conduct the customer development, it has a risk of unstable revenue. Therefore SIWA should pay attentions on the residents’ consensus and confirm through the written consent. The followings are conditions to be examined.
- Residents’ consensus is confirmed. - Residents understand the tariff and ways for payment. - SIWA has enough capacity of water supply for the area.
F3 Evaluation of Pilot Projects
Based on the results and achievements of the pilot projects executed in Phase-2 of the Study, a final evaluation was conducted for the activities of the pilot projects from the view point of five criteria, i.e., relevance, effectiveness, efficiency, impact and sustainability. The results of evaluation are summarized in Table F3-1 on each pilot project.

The Study for Rehabilitation and Improvement of Solomon Islands Water Authority’s Water Supply and Sewerage Systems
Final Report : Summary Report(F-10)
Tabl
e F3
-1
Sum
mar
ized
Eva
luat
ion
of P
ilot P
roje
cts
Pilo
t Pro
ject
R
elev
ance
E
ffec
tiven
ess
Eff
icie
ncy
Impa
ct
Sust
aina
bilit
y PP
-1 :
Fo
rmul
atio
n of
Tar
iff
Col
lect
ion
Impr
ovem
ent
Met
hod
Sinc
e th
e im
prov
emen
t of
tarif
f col
lect
ion
ratio
is o
ne
of th
e vi
tal i
ssue
s for
SIW
A’s
man
agem
ent,
it ca
n be
said
th
at th
e pi
lot p
roje
ct h
as m
et
the
keen
nee
ds o
f the
So
lom
on si
de o
n m
anag
emen
t stre
ngth
enin
g.
The
proj
ect p
urpo
se o
f the
pi
lot p
roje
ct h
as b
een
succ
essf
ully
ach
ieve
d be
caus
e so
lutio
ns h
ave
been
ob
tain
ed fr
om th
e pi
lot
proj
ect a
nd in
corp
orat
ed in
th
e ac
tion
plan
.
The
inpu
ts fr
om b
oth
side
s w
ere
appr
opria
te fo
r ac
hiev
emen
t of o
utpu
ts.
Th
ree
wor
ksho
ps w
ere
held
an
d 13
staf
f inc
ludi
ng
gene
ral m
anag
er p
artic
ipat
ed
in th
e w
orks
hops
, whi
ch
wer
e m
ore
than
pla
nned
.
Alm
ost a
ll th
e st
aff f
or
adm
inis
tratio
n an
d fin
anci
al
depa
rtmen
ts p
artic
ipat
ed in
th
e w
orks
hop.
Th
ey
disc
usse
d an
d fo
und
solu
tions
for t
ariff
col
lect
ion
syst
em.
Alm
ost a
ll th
e st
aff
of S
IWA
is n
ow a
war
e of
the
prob
lem
s and
solu
tions
.
Ther
efor
e, it
can
be
said
that
th
is p
ilot p
roje
ct h
ad p
ositi
ve
impa
ct.
Sorti
ng o
ut p
robl
ems a
nd
findi
ng o
ut so
lutio
ns th
roug
h w
orks
hops
is n
ow
fam
iliar
ized
am
ong
SIW
A
staf
f.
PP-2
: E
stab
lishm
ent o
f Lea
kage
R
educ
tion
Indi
cato
r
Sinc
e th
e le
akag
e re
duct
ion
is o
ne o
f the
key
issu
es fo
r im
prov
ing
man
agem
ent
capa
city
of S
IWA
.
Ther
efor
e, it
can
be
said
that
th
e pi
lot p
roje
ct h
as m
et th
e ke
en n
eeds
of t
he S
olom
on
side
on
tech
nica
l kno
wle
dge.
The
proj
ect p
urpo
se o
f the
pi
lot p
roje
ct h
as b
een
succ
essf
ully
ach
ieve
d be
caus
e th
e le
akag
e re
duct
ion
indi
cato
r was
ob
tain
ed a
nd te
chni
cal
trans
fer w
as m
ade
effe
ctiv
ely.
Mos
t of t
he n
eces
sary
inpu
ts
have
bee
n m
ade
as p
lann
ed
from
the
Japa
nese
side
and
So
lom
on si
de.
By
the
impl
emen
tatio
n of
th
is
pilo
t pr
ojec
t, ab
out
380m
3 of
leak
ed w
ater
was
re
duce
d.
It
acco
unts
fo
r 1.
6%
of
tota
l le
akag
e in
H
onia
ra.
Ther
efor
e, it
can
be
said
that
th
is p
ilot p
roje
ct h
ad p
ositi
ve
impa
ct.
Dur
ing
this
pilo
t pro
ject
s, th
ree
(3) s
taff
of S
IWA
m
aste
red
the
leak
age
dete
ctio
n an
d re
duct
ion
met
hod.
Th
eref
ore,
SIW
A
will
be
able
to e
stab
lish
a le
akag
e re
duct
ion
team
or
sect
ion.
PP-3
: W
ater
Con
serv
atio
n C
ampa
ign
In o
rder
to m
ake
the
bills
lo
w, it
is n
eces
sary
for t
he
cust
omer
s to
save
wat
er.
R
epai
r of l
eaka
ge a
nd sa
ving
w
ater
hel
p SI
WA
redu
ce
volu
me
and
cost
of w
ater
su
pply
.
For t
he p
artic
ipan
ts of
PP-
3,
awar
enes
s of w
ater
co
nser
vatio
n w
as ra
ised.
H
owev
er, i
t tak
es ti
me
to
prac
tice
wat
er c
onse
rvat
ion,
so
that
it is
nec
essa
ry to
mon
itor
chan
ge o
f wat
er c
onsu
mpt
ion.
The
inpu
ts fr
om b
oth
side
s w
ere
appr
opria
te fo
r ac
hiev
emen
t of o
utpu
ts.
How
ever
, im
plem
enta
tion
perio
d sh
ould
be
long
er a
nd
life
styl
e of
Sol
omon
Is
land
ers s
houl
d be
take
n in
to c
onsi
dera
tion.
Base
d on
the
mon
itorin
g da
ta,
wat
er c
onsu
mpt
ion
of la
rge
wat
er u
sers
such
as s
choo
l and
ho
spita
l is d
ecre
asin
g af
ter
repa
ir of
leak
ing
taps
. H
owev
er, i
t is n
eces
sary
to
cont
inue
to m
onito
r wat
er
cons
umpt
ion.
It is
nec
essa
ry to
ass
ign
the
offic
er in
cha
rge
of p
ublic
re
latio
ns. C
urre
nt c
ondi
tions
an
d pu
blic
per
cept
ion
of
wat
er su
pply
als
o sh
ould
be
impr
oved
to o
btai
n co
oper
atio
n of
the
cust
omer
s.
PP-4
: In
stal
latio
n of
Sha
red
Stan
ding
Pip
e
It is
nec
essa
ry fo
r the
low
in
com
e ho
useh
olds
to
impr
ove
acce
ss to
the
pipe
d w
ater
. SIW
A sh
ould
pro
vide
th
e op
tions
whi
ch e
nabl
e th
e lo
w in
com
e ho
useh
olds
to
conn
ect t
he p
iped
wat
er.
im
prov
ed w
ater
supp
ly in
th
e ta
rget
are
a. O
n th
e ot
her
hand
, the
re is
no
chan
ge o
f w
ater
con
sum
ptio
n vo
lum
e at
B
urns
Cre
ek d
ue to
the
limite
d us
es fo
r drin
king
and
co
okin
g.
The
inpu
ts fr
om b
oth
side
s w
ere
appr
opria
te fo
r ac
hiev
emen
t of o
utpu
ts. I
t is
nece
ssar
y to
exa
min
e sh
are
of th
e ex
pend
iture
for
inst
alla
tion
betw
een
com
mun
ities
and
SIW
A.
Alth
ough
wat
er u
se w
as n
ot
so c
hang
ed d
rast
ical
ly d
ue to
th
e lim
ited
uses
, acc
ess t
o th
e pi
ped
wat
er w
as im
prov
ed
afte
r ins
talla
tion
of th
e sh
ared
stan
ding
pip
e.
It is
nec
essa
ry fo
r the
ca
ndid
ate
com
mun
ities
to
unde
rsta
nd th
e ta
riff a
nd
way
s for
pay
men
t and
co
nsen
t ins
talla
tion
of sh
ared
st
andi
ng p
ipe.
SIW
A sh
ould
al
so h
ave
enou
gh c
apac
ity o
f w
ater
supp
ly fo
r the
are
as.
Sour
ce: J
ICA
Stu
dy T
eam

The Study for Rehabilitation and Improvement of Solomon Islands Water Authority’s Water Supply and Sewerage Systems
Final Report : Summary Report (G-1)
PART G ACTION PLAN
G1 Future Frame for Action Plan
G1.1 Socio-economic Frame (Population Projection)
In Solomon, the official document which can be an aid to forecast future socio-economic conditions at a national level is the National Economic Recovery, Reform and Development Plan (NERRDP) 2003 - 2006. NERRDP is a medium-term development strategy policy document of the Solomon Islands Government. Its purpose is to set out government strategies, polices and actions to be taken for economic recovery, social restoration, reform and development during the Plan period.
The overall national development goal of NERRDP is to enhance and improve the quality of life and the living standards of all the people in the Solomon Islands.
In NERRDP, it states, based on the 1999 census, that the population of the whole Solomon Islands is 409,042 people and the average population growth rate between 1986 and 1999 is 2.8%.
In the Study, population projections for 2005 and 2010 were executed, based on the national census conducted by the Department of Statistics in 1986 and 1999, which is referred to in NERRDP. As mentioned above, the annual population growth rate for the whole nation is 2.8% in average. For the population projection of Honiara, the growth rate was examined, taking into consideration migration into the capital city, and determined as 3.5%, based on the study result in the AusAID report. For the provincial centers of Noro, Auki and Tulagi, an average national growth rate of 2.8% was applied.
The action plan has been formulated for the following three (3) stages:
- Short term plan : Period from 2006 to 2007 - Mid term plan : Period from 2008 to 2010 - Long term plan : Period from 2011 to 2016
Thus, the population projection for the action plan (2007, 2010 and 2016) for the study areas was determined as shown in Table G1-1.
The population of Honiara shows the population of the service area in Honiara, including that of the urban developed areas adjacent to and still outside the city boundary, which is estimated to be 10% of the population inside the city boundary.
Table G1-1 Population Projection for Study Areas in 2007, 2010 and 2016
Population Projection Study Area
1999 Census Population Inside City Boundary
Annual Population Growth (%)
(2006~2016) 2007
(Short-term)2010
(Mid-term) 2016
(Long-term)Honiara City 49,107 3.5 64,664
(71,131) 71,695
(78,865) 88,131
(96,945) Noro 3,482 2.8 4,342 4,718 5,568 Auki 4,022 2.8 5,017 5,450 6,432 Tulagi 1,333 2.8 1,662 1,806 2,131 Note : Figures in ( ) shows the population of service area by SIWA. Source : Calculated by the Study Team using data from SIWA data from Department of Statistics
G1.2 Indicators and Targets for Managerial and Institutional Strengthening of SIWA
In general, it is recognized that important indicators for the management of water supply utility include the revenue water ratio, water tariff collection ratio, leakage (or Real loss) ratio, effective water ratio and served ratio.
Future targets for the above indicators are as shown in Table G1-2. The targets have been determined

The Study for Rehabilitation and Improvement of Solomon Islands Water Authority’s Water Supply and Sewerage Systems
Final Report : Summary Report (G-2)
based on the actual figures in 2005, which were obtained in the field survey and analysis of the collected data, and Water Supply Capital Works Plan of SIWA.
Table G1-2 Performance Indicators and Targets for SIWA’s Management (Unit : %)
Targets No. Indicator Area 2007
(Short-term)2010
(Mid-term)2016
(Long-term) Honiara 57 57 70 Noro 53 53 60 Auki 50 50 60
1 Revenue water ratio
Tulagi 39 39 55 Honiara 90 95 98 Noro - - - Auki - - -
2 Water charge collection ratio
Tulagi - - - Honiara 40 40 27 Noro 40 40 35 Auki 40 40 35
3 Leakage ratio
Tulagi 50 50 40 Honiara 60 60 73 Noro 60 60 65 Auki 60 60 65
4 Effective water ratio
Tulagi 50 50 60 Honiara 70 78 90 Noro 63 67 75 Auki 60 67 75
5 Served ratio
Tulagi 70 74 80 Source : SIWA and field survey by JICA Study Team
G1.3 Evaluation of Management Improvement for SIWA
SIWA is currently facing management problems, which are caused by issues such as a lack of human resources, financial constraints and obsolete infrastructure. Thus, the management problems have been initially classified by objective analysis for management improvement. Secondly, the necessary activities to be taken by SIWA are evaluated by several requirements for management improvement, which are divided into two categories as mentioned below.
- Primary evaluation for activities is made by the first category that consists of a) urgency and b) the scale of influence for management.
- Secondary evaluation for activities is made by the second category that consists of c) the necessity for support from donors, d) the necessity for facility improvement and e) the contribution to the improvement of services.
The evaluation results mentioned above are summarized as follows.

The Study for Rehabilitation and Improvement of Solomon Islands Water Authority’s Water Supply and Sewerage Systems
Final Report : Summary Report (G-3)
Table G1-3 Evaluation of Management Improvement for SIWA Primary
Evaluation Secondary Evaluation
Subject R
elat
ed S
ectio
n fo
r A
ctio
n Pl
an
Activities
Urg
ency
Scal
e of
Im
prov
emen
t Ef
fect
Nec
essi
ty o
f Su
ppor
t fro
m
Don
ors
Nec
essi
ty o
f Fa
cilit
y Im
prov
emen
t
Con
tribu
tion
to
Impr
ovem
ent o
f Se
rvic
es
1) Improving collection efficiency A A 2) Increasing delivery of water bills A B 3) Improving collection of water
sales arrears A B
4) Integrating into metric system meter for reducing billing mistakes
B B Y Y Tariff Collection
Improvement G2.1
5) Establishing water tariff collection system for shared standing pipe
C C Y Y
Introduction of New Tariff Structure
G2.2 Setting reasonable water tariff for improving revenue A A
1) Constructing new office building for recruiting additional staff A A Y Y
2) Constructing workshop building for maintenance of equipment for improving services
C C Y New Staff
Reinforcement for Service
Improvement
G2.3
3) Reinforcing staff in provincial centers for improving services and management
B C Y Y
Establishment of Assets
Management G2.4
Rationalizing management by establishing inventory control system
A A Y Y
Establishment of Effective Water
Distribution G2.5 Establishing efficient operation
system for water supply facilities B B Y Y
1) Reducing meter reading mistakes A A Y 2) Introducing international
accounting system A A Y
3) Rationalizing inventory control and assets management A A Y Y
4) Improving capability for planning and maintenance of water supply system
B B Y
5) Utilizing geographical information system (GIS) B B Y
6) Conducting water quality analysis in accordance with the international standards
B B Y
Human Resources
Development for Existing
Staff
G2.6
7) Introducing Information Technology for encouraging rationalization of management
B A Y
1) Shifting water source from spring to groundwater A A Y Y Y
2) Upgrading water supply facilities which are inefficient and deteriorated by over-service life
A A Y Y Y
Water Supply and Sewerage
Facility Improvement
G3
3) Improving water quality A A Y Y Y Leakage
Reduction G4 Conducting regular leakage reduction activity A A Y Y
Notes: A - high (large), B - normal, C - low (small), Y – Yes (Necessary) Source: JICA Study Team

The Study for Rehabilitation and Improvement of Solomon Islands Water Authority’s Water Supply and Sewerage Systems
Final Report : Summary Report (G-4)
G2 Action Plan for Capacity Development of SIWA
The action plan for the SIWA capacity development is formulated as follows. The implementation schedule of the Action Plan is shown in Table G2-2.
G2.1 Tariff Collection Improvement
One of the most important issues for SIWA management is tariff collection improvement. Several problems represent obstacles to tariff collection for SIWA activities. Of these, major problems are false meter readings caused by meter readers and the huge number of undelivered bills. For improvement from meter readings to tariff collection, SIWA should consider the following activities with management improvement;
1) It is recommended to establish a monitoring committee for the tariff collection rate and the committee should monitor the collection efficiency regularly.
2) Undelivered bills should be delivered by meter readers to customers when they visit households for monthly inspection.
3) To improve the collection efficiency of water sales arrears.
4) To reduce meter reading errors caused by meter readers, remedial education of meter readers is necessary.
5) SIWA is planning to replace old gallon meters, some of which are out of order, with metric meters. The above monitoring committee must prepare a meter replacement plan as mentioned below and observe the practice sequentially.
- To prepare an annual implementation plan to replace all gallon meters within 5 years. In order to reduce the level of incorrect meter reading, meter replacement will be completed by a circle unit (water supply district).
- To draft the plan in parallel with annual budget preparation for the procurement of meters in the next fiscal year, so that meter replacement will be conducted according to the plan.
- To procure approved number of metric meters, according to the plan. - To transfer the latest information on meter type to meter readers after a renewable
system directory whenever meter exchange is completed. 6) It is proposed to increase tariff collection efficiency on shared stand pipes.
G2.2 Introduction of New Tariff Structure
It is recommended that the current water tariff be revised. There are proposals to revise the following procedures. As income from Honiara accounts for 90% of total SIWA income, thus it is suggested that the new tariff structure in Honiara be established firstly.
(1) Setting Reasonable Water Tariff for Improving Revenue
(a) Establishment of New Tariff Committee
It is preferable to establish a tariff revision committee, headed by the General Manager, to examine a new tariff structure. According to the findings of the socio-economic survey being carried out under this Study, a reasonable water rate should be established for both sides of SIWA management and customers as users.

The Study for Rehabilitation and Improvement of Solomon Islands Water Authority’s Water Supply and Sewerage Systems
Final Report : Summary Report (G-5)
(b) Study of New Tariff
The examination should proceed based on the following preconditions.
- It is required that the rate should be set at a reasonable level compared with the cost of water under efficient management because of the monopoly by SIWA as the public authority.
- Full cost recovery cannot be achieved within the current tariff structure because depreciation and amortization are not considered as current expense items.
- 70% of people (of those who responded to the questionnaire) are complaining about the billed amount for water relative to SIWA’s service level.
- It is estimated that the “Willingness to Pay” of a household in the high-income group is more than twice that of a household of low-income group.
- The average water consumption of 164 liters per person in Honiara is high in comparison with other developing countries, hence the use of the charging method for consumption restraint is preferable to reduce water consumption.
- Considering the current inflation rates in the Solomon, it seems that a revision is desirable at every 2 to 3 years intervals.
For reference, case studies for new tariff structure are made based on the following points. The results of study are shown in Table D2-1.
a) Taking into consideration the socio-economic survey result such as WTP (Willingness to Pay) and
ATP (Ability to Pay) b) Introduction of a new tariff structure of differentiated unit price for every 10m3 block up to 30m3
from the constant price of SI$1.00 for 30m3 should be considered for public utility charges of the water consumption restraint type.
A number of case studies for the new tariff structure have been prepared based on the means by which SIWA can secure its revenues to cover the estimated expenditure in FY2009. For the case studies, the following 3 preconditions are selected from the socio-economic survey results:
Case-1: Domestic water rates are set for an ATP of SI$80.28 as the upper limit for the low-income group.
Case-2: Domestic water rates are set for an ATP of SI$142.80 as the upper limit for an average in the low- and high-income groups.
Case-3: Domestic water rates are set for a WTP of SI$167.14 as the upper limit that is a precondition to improve the water supply service for the low-income group.

The Study for Rehabilitation and Improvement of Solomon Islands Water Authority’s Water Supply and Sewerage Systems
Final Report : Summary Report (G-6)
Table G2-1 Case Study for New Tariff Structure Case 1 Case 2 Case 3
Classification Current Water Tariff ATP(SI$80.28) for Low Income Group
Average ATP(SI$142.12)
WTP(SI$167.14) for Low Income Group
Domestic Unit a) Current Rates b)
Changed ratio
New Rates(=a x b)
c) Changed
ratio
New Rate (=a x c)
d) Changed
ratio
New Rate (=a x d)
Fees and Charges (0 to 10m3) SI$/m3 1.00 1.00 1.00 1.00 1.00 1.00 1.00Fees and Charges (10 to 20m3) SI$/m3 1.00 1.20 1.20 1.80 1.80 2.00 2.00Fees and Charges (20 to 30m3) SI$/m3 1.00 1.40 1.40 2.40 2.40 3.10 3.10Fees and Charges (over 30m3) SI$/m3 2.42 1.50 3.63 3.00 7.26 3.50 8.47
Case 1 Case 2 Case 3 Classification Record of Water Supply Services
for FY2005 ATP(SI$80.28) for Low Income Group
Average ATP(SI$142.12)
WTP(SI$167.14) for Low Income Group
Domestic Unit a) Current Rates Record
b) Changed
ratio
New Rates(=a x b)
c) Changed
ratio
New Rate (=a x c)
d) Changed
ratio
New Rate (=a x d)
Average Charges/household SI$/Month 60.31 81.47 142.94 167.10Average Water Value/m3 SI$/m3 1.58 1.35 2.13 2.37 3.74 2.77 4.37No. of Households *1 Household 5,778 Water Consumption (Honiara) m3/year 2,653,000 Water Sales Value (Honiara) SI$/year 4,182,000 1.35 5,648,976 2.37 9,911,232 2.77 11,586,216Water Consumption/capita/day LCD 180
Commercial/Government
Commercial Fees and Charges SI$/m3 5.60 1.75 9.80 1.50 8.40 1.30 7.28No. of Commercial Customers*1 No. 639 Government Fees and Charges SI$/m3 6.16 1.75 10.78 1.50 9.24 1.30 8.01No. of Government Customers*1 No. 318 Water Consumption (Commercial/Government) m3/year 1,845,000
Water Sales Value (Commercial/Government) SI$/year 13,167,000 1.75 23,042,250 1.50 19,750,500 1.30 17,117,100
Average Value SI$/m3 7.14 12.49 10.70 9.28Other Income *2 SI$/year 2,018,400 685,000 685,000 685,000
1.Total Sales Value (Honiara)
SI$/year 19,367,400 1.52 29,376,226 1.57 30,346,732 1.52 29,588,206
2. Sales Value (Province)*2 SI$/year 1,753,000 1,280,000 1,280,000 1,280,000A. Income Forecast (1 + 2) SI$/year 21,120,400 30,656,226 31,626,732 30,668,316B. Expenditure Forecast(FY2009) SI$/year 30,509,700 30,509,700 30,509,700
C. Balance (A - B) SI$/year 146,526 1,117,072 158,616D. Expenditure Forecast (FY2008) SI$/year 28,230,600 28,230,600 28,230,600
E.. Balance (A - D) SI$/year 2,425,626 3,396,132 2,437,716Note :1: Actual data as of April 2005 were given by SIWA.
2: Actual data in FY 2005 and value for case-1 to case-3 is based on SIWA 2006 Approved Annual Budget. Source : JICA Study Team (c) Getting Approvals from the Board and SIG
If a new rate revision plan is settled by the Committee, SIWA board members should study in particular whether the revision plan is acceptable for low income group households or not. A rate revision is enforced only after getting approval for the rate revision plan from the SIG parliament.
(d) Implementation of Awareness Campaign
The enforcement of the new rate should be introduced by an explanation and publicity campaign. SIWA should announce the revision rate, effectively using the media, such as radio and newspapers. Through acting to explain to residents, SIWA is required to get the consensus of residents, especially those from the low-income group.
(2) Rate Revision of Province
A new tariff structure for the provinces is to be introduced by a similar step while observing the domestic customer payment situation, after the introduction of a new tariff structure in Honiara City and

The Study for Rehabilitation and Improvement of Solomon Islands Water Authority’s Water Supply and Sewerage Systems
Final Report : Summary Report (G-7)
based on the socio-economic findings in the Provinces
G2.3 Staff Reinforcement for Service Improvement
It is physically impossible to reinforce the number of staff because the SIWA office building is not capable of housing additional staff. Therefore, it is necessary for SIWA to prepare an organizational reinforcement plan by examining both an office expansion plan and staff recruitment plan.
(1) Constructing a New Office and Workshop Building for Recruiting Additional Staff
A new plan of an office building is already planned by this study, and construction once funding can be secured. In addition, it is desirable that a workshop for machinery repair, including a laboratory, be constructed at the same time.
(2) Expanding the Water Supply and Sewerage Disposal Services for Improving Services
SIWA must examine the following for staff reinforcement in parallel with construction of the office buildings:
(a) Study of Cost and Service Comparision with Outsourcing
A “Corporate Plan 2005-2007” is drafted, based on the mandate given to SIWA. A staff reinforcement plan, including a positional description of each department, including the ability of the current staff, etc should be reviewed, based on the cost comparison analysis between direct management and outsourcing for the provision of the same service, according to the SIWA management strategy. It is assumed that the General Manager is the enforcement person in charge for this purpose.
(b) Review of Corporate Plan
In 2007, the “Corporate Plan 2008-2010” will be drafted after a review of ”Corporate Plan 2005-2007” and on the basis of the results of performance records. In particular, it is advisable that the realization of new services, such as water supply service and sewage treatment service, should be studied as mentioned in the action plan. In addition, a new plan should be considered to meet the requests of several provincial centers for water supply services.
(c) Providing Services with Water Tankers and Vaccume Trucks
Staff reinforcement is required for the new duties of SIWA’s service expansion. New services are expected as follows;
Water supply service: Employment of the new staff for water supply service by water tanker to unserved areas will be necessary (a cost comparison study with outsourcing should be done).
Sewage treatment service: There are plans to purchase vacuum trucks for sewage sludge disposal service. For realization of this service, it is necessary to hire new staff (a cost comparison study with outsourcing should be done).
Water quality analysis: One of the SIWA mandates is to supply safe drinking water. For this purpose, water quality analysis is essential. However, current water analysis is carried out as part of an item set by WHO guidelines. It is necessary to carry it out for all items stipulated under WHO guidelines on a regular basis. It is necessary to reinforce the staff with this purpose and to supply the chemical reagent for water analysis appropriately.
(3) Reinforcing Staff in Provincial Centers for Improving Services and Management
SIWA is responsible for a water service business in provincial centers. Noro, Auki and Tulagi are already administered by SIWA, but SIWA is to administer other provincial centers. When these are realized, reinforcement of personnel is also required. The water supply business in several provincial centers is planned in SIWA Water Supply Capital Works Plan.
G2.4 Establishment of Assets Management
SIWA is expecting to establish a reasonable management system for materials and parts control. SIWA

The Study for Rehabilitation and Improvement of Solomon Islands Water Authority’s Water Supply and Sewerage Systems
Final Report : Summary Report (G-8)
must stock and deliver materials and parts to the site on a timely basis from their procurement through management of a series of duties. In the case of SIWA, most material and maintenance parts for water supply and sewerage systems are usually imported from overseas. This may lead to a problem of supplies being delayed for several months due to supplier conditions. On the other hand, it is necessary to maintain material stock to cope quickly when they are needed.
The following demerits are included for stock possession so that it is necessary to manage stock adequately:
1) Increase of inventory control expense 2) Increase of stock fund 3) Obsolescence of stock articles, and deterioration of quality 4) Increase of stock space SIWA is required to establish the following inventory control flow from the preparation of an operation and maintenance (O/M) plan to periodic and regular inventory check.
Source : JICA Study Team
Figure G2-1 Inventory Control Flow
G2.5 Establishment of Effective Water Distribution System
SIWA is planning to take certain countermeasures to reduce operation and maintenance costs by effective pump operation and make effective use of the limited water sources in the water distribution districts.
Therefore, SIWA wishes to introduce a SCADA system (Supervisory Control and Data Acquisition) for controlling, a) water distribution from water sources to the distribution reservoir, b) water level change at water sources and distribution reservoir and c) pressure change at main pumping stations, which will enable SIWA to distribute the limited water effectively in the water distribution district and to control the total waterworks system comprehensively for effective water distribution over a wide district area.
The SCADA system has already been introduced in many countries and includes many advantages, in particular for complicated water supply systems in urban areas.
The SCADA system consists of measuring instruments to collect data at monitoring sites, a telemetry system to convey collected data to the central station, and data processing equipment at a monitoring center (SIWA Office) to process the collected data. Telemeter panels will be installed in each monitoring site and monitoring center to convey data.
However, since it seems difficult for SIWA to introduce such system as part of the short and mid-term plans, due to their financial and technical constraints, the introduction of the system shall be examined as part of the long term plan and implemented according to the following steps, under technical guidance from an overseas expert, if available:
1) Basic design of the SCADA system
Preparation of O/M Plan
Approval ofAnnual Budget forNext Year
Preparation of Materials & Parts Procurement Plan
Execution of Materials & Parts Procurement
Execution of Periodic/ Regular Inventory Check
SIWACustomer Service Center

The Study for Rehabilitation and Improvement of Solomon Islands Water Authority’s Water Supply and Sewerage Systems
Final Report : Summary Report (G-9)
2) Purchasing and installation of the SCADA system
3) Operation guidance for the SCADA system
G2.6 Human Resources Development for Existing Staff
(1) Review of Staff Training Plan
In order to reinforce the SIWA organization, human resources development is one of the essential issues. Even if SIWA has already drawn up a "Staff Development Plan 2004-2006" and is going to actively implement ability development of the staff, the following points should be considered for review of the personnel training plan.
(2) Necessary Training Fields
SIWA should conduct capability development of the existing staff in the following areas:
1) Meter readers 2) Accounting staff 3) Inventory control staff 4) Water supply and SCADA system engineer 5) GIS engineer 6) Laboratory staff 7) IT engineer
(3) Training Methods
There would be various kinds of methods for training, i.e. dispatching staff for participation in seminars for the short term or vocational school for the longer term. However, external resources in Solomon for acquired technical knowledge are considerably limited to capability development, meaning an effective method would either be technical guidance by a special instructor from overseas or dispatching staff to overseas specialized agencies for a certain period of time. It seems that practice by OJT (On-the-Job Training) is the most effective method.

Final Report : Summary Report(G-10)
The Study for Rehabilitation and Improvement of Solomon Islands Water Authority’s Water Supply and Sewerage Systems
Tabl
e G
2-2
Act
ion
Plan
for
Cap
acity
Dev
elop
men
t of S
IWA
(1/3
)
1Im
prov
ing
colle
ctio
n ef
ficie
ncy
Esta
blis
hmen
t of m
onito
ring
com
mitt
eeG
M
2In
crea
sing
del
iver
y of
wat
er b
ills
Dis
patc
hing
und
eliv
ered
bill
sD
MFS
3Im
prov
ing
colle
ctio
n of
wat
er s
ales
arre
ars
Impl
emen
tatio
n of
aw
aren
ess c
ampa
ign
& n
egot
iatio
n w
ith d
ebto
rsD
SCS
Prep
arat
ion
of m
eter
repl
acem
ent p
lan
DSC
S
Rep
lace
men
t of i
mpe
rial m
eter
s to
met
ricD
SCS
Prom
otio
n of
sha
red
stan
ding
pip
ein
stal
latio
nD
SCS
Neg
otia
tion
with
gro
up u
sers
&A
ppoi
ntm
ent o
f mon
ey c
olle
ctor
DSC
S
Esta
blis
hmen
t of n
ew ta
riff c
omm
ittee
GM
Stud
y of
new
tarif
fD
MFS
Get
ting
appr
oval
s fr
om B
oard
and
SIG
GM
Impl
emen
tatio
n of
aw
aren
ess c
ampa
ign
DSC
S
Subj
ect
5Es
tabl
ishi
ng w
ater
tarif
f col
lect
ion
syst
em fo
r sha
red
stan
ding
pip
es
Inte
grat
ing
into
met
ric s
yste
m m
eter
for
redu
cing
bill
ing
mis
take
s
2009
Act
iviti
este
r m
2006
Res
pons
ible
4
2010
2011
-
Tariff Collection Improvement
Perf
orm
ance
Mea
sure
Shor
t-ter
mM
id-te
rm
2008
Long
-
2016
Introduction ofNew TariffStructure
1Se
tting
reas
onab
le w
ater
tarif
f for
impr
ovin
g re
venu
e
2007
N
otes
: ・
DM
SS: D
ivis
iona
l Man
ager
Sup
port
Serv
ices
, ・
DSC
S: D
epar
tmen
t of S
ales
and
Cus
tom
er S
ervi
ces
・
DFM
: Dep
artm
ent o
f Fin
anci
al M
anag
emen
t, ・
DIA
: Dep
artm
ent o
f Int
erna
l Aud
it
・ D
A: D
epar
tmen
t of A
dmin
istra
tion
,
・ D
WS:
Dep
artm
ent o
f Wat
er S
uppl
y
・ D
PD: D
epar
tmen
t of P
lann
ing
& D
esig
n ,
・ D
E: D
epar
tmen
t of E
nviro
nmen
t
・ D
MIS
: Dep
artm
ent o
f Man
agem
ent I
nfor
mat
ion
Syst
ems,
・ G
M: G
ener
al M
anag
er
・
DM
FS: D
ivis
iona
l Man
ager
Fin
ance
& S
ales
, ・
DM
ES: D
ivis
iona
l Man
ager
Eng
inee
ring
Serv
ices
So
urce
: JI
CA
Stu
dy T
eam

Final Report : Summary Report(G-11)
The Study for Rehabilitation and Improvement of Solomon Islands Water Authority’s Water Supply and Sewerage Systems
Tabl
e G
2-2
Act
ion
Plan
for
Cap
acity
Dev
elop
men
t of S
IWA
(2/3
)
Find
ing
out f
und
GM
Prep
arat
ion
of te
nder
doc
umen
t and
tend
erin
gD
MES
Con
stru
ctio
n su
perv
isio
nD
MES
Stud
y of
cos
t & s
ervi
ce c
ompa
rison
with
out
sour
cing
DM
SS/D
MES
Rev
iew
of C
orpo
rate
Pla
nG
M
Prov
idin
g se
rvic
es w
ith w
ater
tank
ers
& v
acuu
m tr
ucks
DM
SS/D
MES
3R
einf
orci
ng s
taff
in p
rovi
ncia
l cen
ters
for
impr
ovin
g se
rvic
es a
nd m
anag
emen
tB
usin
ess
expa
nsio
n in
pro
vinc
ial
cent
ers
DM
SS
Prep
arat
ion
of O
/M p
lan
DM
ES
Prep
arat
ion
of m
ater
ials
and
par
tspr
ocur
emen
t pla
nD
MFS
Mat
eria
ls a
nd p
arts
pro
cure
men
tD
MSS
Perio
dic
and
regu
lar i
nven
tory
che
ckD
A
1
Con
stru
ctin
g ne
w o
ffice
& w
orks
hop
build
ing
for r
ecru
iting
add
ition
al s
taff
Expa
ndin
g w
ater
sup
ply
and
sew
erag
edi
spos
al s
ervi
ces
for i
mpr
ovin
g se
rvic
es2
Rat
iona
lizin
g m
anag
emen
t by
esta
blis
hing
inve
ntor
y co
ntro
l sys
tem
Establishment of AssetsManagement
New Staff Reinforcement for ServiceImprovement
1
Act
iviti
esSu
bjec
t 2
011-
Perf
orm
ance
Mea
sure
Shor
t-ter
mM
id-te
rm
Res
pons
ible
2006
2007
2008
2009
2010
2016
Long
-te
rm
N
otes
:
・ D
MSS
: Div
isio
nal M
anag
er S
uppo
rt Se
rvic
es,
・ D
SCS:
Dep
artm
ent o
f Sal
es a
nd C
usto
mer
Ser
vice
s
・ D
FM: D
epar
tmen
t of F
inan
cial
Man
agem
ent,
・
DIA
: Dep
artm
ent o
f Int
erna
l Aud
it
・ D
A: D
epar
tmen
t of A
dmin
istra
tion
,
・
DW
S: D
epar
tmen
t of W
ater
Sup
ply
・
DPD
: Dep
artm
ent o
f Pla
nnin
g &
Des
ign
,
・ D
E: D
epar
tmen
t of E
nviro
nmen
t
・ D
MIS
: Dep
artm
ent o
f Man
agem
ent I
nfor
mat
ion
Syst
ems,
・ G
M: G
ener
al M
anag
er
・
DM
FS: D
ivis
iona
l Man
ager
Fin
ance
& S
ales
,
・ D
MES
: Div
isio
nal M
anag
er E
ngin
eerin
g Se
rvic
es
Sour
ce :
JIC
A S
tudy
Tea
m

Final Report : Summary Report(G-12)
The Study for Rehabilitation and Improvement of Solomon Islands Water Authority’s Water Supply and Sewerage Systems
Ta
ble
G2-
2 A
ctio
n Pl
an fo
r C
apac
ity D
evel
opm
ent o
f SIW
A (3
/3)
Bas
ic d
esig
n of
SC
AD
A s
yste
mD
PD
Purc
hasi
ng a
nd in
stal
latio
n of
SC
AD
Asy
stem
DM
ES
Ope
ratio
n gu
idan
ce fo
r SC
AD
As y
stem
DPD
0
(Com
mon
item
s)R
evie
w o
f sta
ff tra
inin
g pl
anD
MSS
1R
educ
ing
met
er re
adin
g m
ista
kes
On
the
Job
Trai
ning
DSC
S
Trai
ning
of a
ccou
ntin
g st
aff a
t sch
ools
DFM
Rec
eivi
ng te
chni
cal g
uida
nce
byfo
reig
n ex
pert
or o
vers
eas
train
ing
DIA
3R
atio
naliz
ing
inve
ntor
y co
ntro
l and
asse
ts m
anag
emen
tR
ecei
ving
tech
nica
l gui
danc
e by
fore
ign
expe
rt or
ove
rsea
s tra
inin
gD
A
4Im
prov
ing
capa
bilit
y fo
r pla
nnin
g an
dm
aint
enan
ce o
f wat
er s
uppl
y sy
stem
Rec
eivi
ng te
chni
cal g
uida
nce
byfo
reig
n ex
pert
or o
vers
eas
train
ing
DW
S/D
PD
5U
tiliz
ing
geog
raph
ical
info
rmat
ion
syst
em (G
IS)
Rec
eivi
ng te
chni
cal g
uida
nce
byfo
reig
n ex
pert
or o
vers
eas
train
ing
DPD
6C
ondu
ctin
g w
ater
qua
lity
anal
ysis
inac
cord
ance
with
the
inte
rnat
iona
lO
n th
e Jo
b Tr
aini
ngD
E
7U
pgra
ding
info
rmat
ion
tech
nolo
gy fo
ren
cour
agin
g ra
tiona
lizat
ion
ofm
anag
emen
tO
vers
eas
train
ing
DM
IS
Perf
orm
ance
Mea
sure
2
Act
iviti
esSu
bjec
t
Intro
duci
ng in
tern
atio
nal a
ccou
ntin
gsy
stem
1
Establishment ofEffective Water
DistributionHuman Resources Development for Existing Staff
Esta
blis
hing
effi
cien
t ope
ratio
n sy
stem
for w
ater
sup
ply
faci
litie
s
Shor
t-ter
m
2006
2007
2008
2009
Mid
-term
Long
-
Res
pons
ible
ter m
2010
2011
-20
16
N
otes
:
・ D
MSS
: Div
isio
nal M
anag
er S
uppo
rt Se
rvic
es,
・ D
SCS:
Dep
artm
ent o
f Sal
es a
nd C
usto
mer
Ser
vice
s
・ D
FM: D
epar
tmen
t of F
inan
cial
Man
agem
ent,
・ D
IA: D
epar
tmen
t of I
nter
nal A
udit
・
DA
: Dep
artm
ent o
f Adm
inis
tratio
n ,
・
DW
S: D
epar
tmen
t of W
ater
Sup
ply
・
DPD
: Dep
artm
ent o
f Pla
nnin
g &
Des
ign
, ・
DE:
Dep
artm
ent o
f Env
ironm
ent
・
DM
IS: D
epar
tmen
t of M
anag
emen
t Inf
orm
atio
n Sy
stem
s, ・
GM
: Gen
eral
Man
ager
・ D
MFS
: Div
isio
nal M
anag
er F
inan
ce &
Sal
es ,
・ D
MES
: Div
isio
nal M
anag
er E
ngin
eerin
g Se
rvic
es
Sour
ce :
JIC
A S
tudy
Tea
m

The Study for Rehabilitation and Improvement of Solomon Islands Water Authority’s Water Supply and Sewerage Systems
Final Report : Summary Report (G-13)
G3 Action Plan for Water Supply and Sewerage Facility Improvement
In 2004, SIWA prepared the “Water Supply Capital Works Plan” for the period from 2006 to 2016. Therefore, the action plan for the water supply and sewerage facility improvement has been prepared, taking into account the Capital Works Plan by SIWA.
The outline of the action plan for the water supply and sewerage facility improvement is as shown in Table G3-1 and the detail of the plan is shown in Table G3-2.
Table G3-1 Outline of Action Plan for Water Supply and Sewerage Facility Improvement Short-term Mid-term Long-term Area Item to be Implemented 2006~2007 2008~2010 2011~2016
[Water Supply] Implementation of mid-term facility improvement plan
Replacement of the existing equipment
Expansion of water distribution network
Replacement of meters [Sewerage]
Honiara
Implementation of mid-term facility improvement plan
Expansion of water distribution network
Replacement of filters for water treatment facility
Replacement of pumps Replacement of motors
Noro
Replacement of meters Implementation of mid-term facility improvement plan
Expansion of distribution reservoir
Replacement of riser main Installation of booster pumps
Auki
Expansion of water distribution network
Installation of disinfection facility
Replacement of pumps Expansion of distribution reservoir
Expansion of water distribution network
Tulagi
Replacement of meters
Expected Project Cost(x 1,000 SI$) 16,746 77,226 20,791 Source : SIWA and JICA Study Team

The Study for Rehabilitation and Improvement of Solomon Islands Water Authority’s Water Supply and Sewerage Systems
Final Report : Summary Report(G-14)
Tabl
e G
3-2
Act
ion
Plan
for
Wat
er S
uppl
y an
d Se
wer
age
Faci
lity
Impr
ovem
ent (
1/10
) (U
nit :
SI$
) 20
0620
0720
0820
0920
1020
1120
1220
1320
1420
1520
16A
. HO
NIA
RA
A-1
. Sou
rce
Dev
elop
men
tW
ater
Sup
ply
Syst
em1.
Tas
ahe
New
Bor
efie
ld1,
711,
346
1,71
1,34
61,
711,
346
in th
e M
id-te
rm 8
00m
3 /day
x 4
bor
esFa
cilit
y2.
Titi
nge
New
Bor
efie
ld,
1,72
9,00
01,
729,
000
1,72
9,00
0Im
prov
emen
t (M
FI)
800
m3 /d
ay x
4 b
ores
Plan
by
JIC
A S
tudy
3. S
kylin
e N
ew B
oref
iels
1,55
4,00
01,
554,
000
1,55
4,00
0(O
ptio
n J-
1) 8
00m
3 /day
x 4
bor
es4.
Bor
derli
ne N
ew B
oref
ield
1,86
9,00
01,
869,
000
1,86
9,00
0 8
00m
3 /day
x 4
bor
esA
-2. W
ater
Tre
atm
ent
1. D
isin
fect
ion
Plan
t for
New
Bor
efie
lds
Tasa
he N
ew B
oref
ield
634,
737
634,
737
634,
737
Titin
ge N
ew B
oref
ield
Skyl
ine
New
Bor
efie
ldBo
rder
line
New
Bor
efie
ld2.
Dis
infe
ctio
n Pl
ant f
or E
xist
ing
Bore
field
Mat
anik
o Bo
refie
ld45
4,30
045
4,30
045
4,30
0K
ombi
to E
U B
oref
ield
Pana
tina
Bor
efie
ld3.
Inte
rmed
iate
Wat
er T
reat
men
t Fac
ility
Whi
le R
iver
Gra
vity
Sys
tem
2,81
1,49
42,
811,
494
2,81
1,49
4R
ove
Sprin
gK
ombi
to S
prin
gA
-3. P
umpi
ng st
atio
n1.
Tas
ahe
New
Bor
efie
ldTa
sahe
to T
asah
e Pr
eser
voir
344,
155
344,
155
344,
155
2. T
iting
e N
ew B
oref
ield
Titin
ge T
o Ti
tinge
Res
ervo
ir32
6,20
032
6,20
032
6,20
0
3. S
kylin
e N
ew B
oref
ield
Skyl
ine
To S
kylin
e R
eser
voir
326,
200
326,
200
326,
200
4. B
orde
rline
New
Bor
efie
ldBo
rder
line
To B
orde
rline
Res
ervo
ir32
6,20
032
6,20
032
6,20
0A
-4. D
istr
ibut
ion
Stor
age
1. U
pper
Tas
ahe
Res
ervo
ir (1
,600
m3 )
461,
447
461,
447
461,
447
2. T
iting
e R
eser
voir
(1,4
00m
3 )Fr
om T
iting
e N
ew B
oref
ield
387,
800
387,
800
387,
800
3. S
kylin
e SI
WA
Res
ervo
ir (1
,550
m3 )
From
Sky
line
New
Bor
efie
ld42
4,20
042
4,20
042
4,20
0
4. L
ower
Wes
t Kol
aa R
eser
voir
(455
m3 )
From
Mat
anik
o Bo
refie
ld14
7,70
014
7,70
014
7,70
0
5. P
anat
ina
Res
ervo
ir (2
,000
m3 )
From
Pan
atin
a Bo
refie
ld70
1,40
070
1,40
070
1,40
0A
-5. D
istr
ibut
ion
Mai
ns1.
Tas
ahe
New
Bor
efie
ld to
Tas
ahe
Res
ervo
i PV
C m
ain,
250
mm
, 1.0
km16
9,80
616
9,80
616
9,80
6
2. T
asah
e D
istri
butio
n M
ain
PVC
mai
n, 5
0~10
0mm
, 4.9
km33
1,15
133
1,15
133
1,15
1
3. R
ove
Sprin
g D
istrib
utio
n M
ain
PVC
mai
n, 2
00m
m, 1
.5km
202,
300
202,
300
202,
300
4. T
iting
e N
ew B
oref
ield
to T
iting
ePV
C m
ain,
100
~250
mm
, 3.3
km38
8,50
038
8,50
038
8,50
0 R
eser
voir
Ris
ing
Mai
n S
kylin
e N
ew B
oref
ield
to S
kylin
e R
eser
voir
Ris
ing
Mai
n T
iting
e D
istrib
utio
n M
ain
5. S
kylin
e D
istri
butio
n M
ain
PVC
mai
n, 5
0~25
0mm
, 4.8
km50
8,50
050
8,50
050
8,50
0
6. B
orde
rline
New
Bor
efie
ld to
Bor
derli
nePV
C m
ain,
50~
300m
m, 9
.8km
811,
900
811,
900
811,
900
Res
ervo
ir R
isin
g M
ain
Bor
derli
ne D
istrib
utio
n M
ain
7. P
anat
ina
Dist
ribut
ion
Mai
nPV
C m
ain,
100
~150
mm
, 3.2
km25
1,80
025
1,80
025
1,80
0
Long
Ter
mU
rban
Cen
ter
Item
Det
ail D
escr
iptio
nSh
ort T
erm
Mid
-Ter
m
So
urce
: SI
WA
and
JIC
A S
tudy
Tea
m

The Study for Rehabilitation and Improvement of Solomon Islands Water Authority’s Water Supply and Sewerage Systems
Final Report : Summary Report(G-15)
Tabl
e G
3-2
Act
ion
Plan
for
Wat
er S
uppl
y an
d Se
wer
age
Faci
lity
Impr
ovem
ent (
2/10
) (U
nit :
SI$
) 20
0620
0720
0820
0920
1020
1120
1220
1320
1420
1520
16B
. HO
NIA
RA
B-1
. Sou
rce
Gen
eral
1. D
evel
op N
ew S
ourc
eR
efer
to "
A. H
ON
IAR
A W
ater
Sup
ply
Syst
em"
(A-1
)
2. T
elem
etry
Sys
tem
500,
000
B-2
. Tre
atm
ent
1. W
ater
Tes
ting
Equi
pmen
tC
hem
ical
test
ing
equi
pmen
tB
-3. E
xist
ing
Syst
em1.
Exp
ecte
d N
etw
ork
Rep
lace
men
t50
0,00
030
0,00
013
0,56
013
0,56
016
8,24
916
8,24
916
8,24
916
8,24
92.
Iden
tifie
d N
etw
ork
Rep
lace
men
tR
efer
to A
-5B
-4. N
ew A
reas
1. P
roje
cted
New
Net
wor
k95
0,00
050
0,00
0R
efer
to A
-51,
282,
728
1,28
2,72
81,
603,
873
1,60
3,87
31,
603,
873
1,60
3,87
3
B-5
. Met
ers
Bulk
flow
met
ers
100,
000
50,0
0020
,000
Res
iden
tial m
eter
s70
0,00
070
0,00
059
5,44
061
3,70
263
1,84
565
0,10
766
8,25
074
2,25
476
4,94
478
7,57
281
0,31
9B
-6. R
esid
entia
l Hou
sing
Tuva
ruhu
reno
vatio
nsR
enov
ate
3 bl
ocks
12
room
s6
resid
entia
l hou
ses
300,
000
300,
000
2 ex
ecut
ive
hous
es50
0,00
0
Gen
eral
man
ager
s res
iden
ce10
0,00
0H
ende
rson
dev
elop
men
t (49
hou
ses)
Kom
biva
lu d
evel
opm
ent (
5 ho
uses
)20
0,00
070
0,00
0B
-7. O
ffice
s and
Sto
res
Ren
ovat
e Tu
varu
hu w
orks
hop
Ren
ovat
e ex
istin
g of
fices
to st
ores
200,
000
2,00
0,00
0an
d bu
ild n
ew o
ffice
B-8
. Pla
ntR
epla
cem
ent v
ehic
les
600,
000
1,00
0,00
024
0,00
024
0,00
024
0,00
024
0,00
024
0,00
024
0,00
024
0,00
024
0,00
024
0,00
0Ti
p tru
ckW
ater
tank
er50
0,00
0
Trai
ler m
ount
ed d
rillin
g rig
1,00
0,00
0
B-9
. Oth
er e
quip
men
tR
epla
cem
ent -
com
pute
rs90
,000
49,0
0049
,000
49,0
0049
,000
49,0
0049
,000
49,0
0049
,000
49,0
0049
,000
Info
rmat
ion
Syst
ems U
pgra
de50
0,00
0
Long
Ter
mU
rban
Cen
ter
Item
Det
ail D
escr
iptio
nSh
ort T
erm
Mid
-Ter
m
So
urce
: SI
WA
and
JIC
A S
tudy
Tea
m

The Study for Rehabilitation and Improvement of Solomon Islands Water Authority’s Water Supply and Sewerage Systems
Final Report : Summary Report(G-16)
Tabl
e G
3-2
Act
ion
Plan
for
Wat
er S
uppl
y an
d Se
wer
age
Faci
lity
Impr
ovem
ent (
3/10
) (U
nit :
SI$
) 20
0620
0720
0820
0920
1020
1120
1220
1320
1420
1520
16C
. HO
NIA
RA
C-1
. Sou
rce
Dev
elop
men
tW
hite
Riv
er G
ravi
ty1.
Cat
chm
ent M
anag
emen
t Pla
nD
evel
op d
raft
Obt
ain
lega
l adv
ice
Publ
ic e
duca
tion
5,00
05,
000
5,00
05,
000
5,00
05,
000
5,00
05,
000
5,00
05,
000
Inst
alla
tion
of si
gns
2. In
vest
igat
ion
of W
hite
Riv
er S
prin
g2
wee
k in
put b
y sp
ecia
list
C-2
. Tre
atm
ent
1. F
iltra
tion
Inst
all c
artri
dge
filtra
tion
syst
em2.
Disi
nfec
tion
Purc
hase
bac
k-up
pum
pR
epla
cem
ent o
f pum
p10
,000
10,0
00C
-3. R
eser
voir
s Dev
elop
men
t1.
New
Tan
ksR
efer
to "
A. H
ON
IAR
A W
ater
Sup
ply
Syst
em"
(A-4
)C
-4. P
umps
1. N
ew W
hite
Riv
er P
ump
Stat
ion
- Em
erge
ncy
supp
ly to
Tas
ahe
Tank
200,
000
2. S
tand
by G
ener
ator
C-5
. Pip
elin
e D
evel
opm
ent
1. R
ealig
n Pi
pe W
ater
Cro
ssin
g (s
ecur
e pi
pelin
e)2.
New
Pip
elin
e co
nnec
ting
Whi
te R
iver
Tan
k to
Tas
ahe
Tank
300,
000
C-6
. Hou
ses
1. C
aret
aker
hou
ses
60,0
00
Long
Ter
mU
rban
Cen
ter
Item
Det
ail D
escr
iptio
nSh
ort T
erm
Mid
-Ter
m
So
urce
: SI
WA
and
JIC
A S
tudy
Tea
m

The Study for Rehabilitation and Improvement of Solomon Islands Water Authority’s Water Supply and Sewerage Systems
Final Report : Summary Report(G-17)
Tabl
e G
3-2
Act
ion
Plan
for
Wat
er S
uppl
y an
d Se
wer
age
Faci
lity
Impr
ovem
ent (
4/10
) (U
nit :
SI$
) 20
0620
0720
0820
0920
1020
1120
1220
1320
1420
1520
16D
. HO
NIA
RA
D-1
. Sou
rce
Dev
elop
men
tW
hite
Riv
er1.
Res
tore
JIC
A B
ores
-Kom
bito
Hig
h Le
vel
2. D
evel
op N
ew B
oreh
oles
at M
atan
iko
to in
crea
se c
apac
ity3.
Dev
elop
Mat
anik
o G
alla
ry S
ourc
e20
0,00
04.
Inve
stig
ate
Kov
i Sin
khol
e to
redu
ce c
hanc
es o
f blo
ckag
eD
-2. T
reat
men
t1.
Filt
ratio
nIn
stal
l car
tridg
e fil
tratio
n sy
stem
2. D
isin
fect
ion
Puch
ase
back
-up
pum
pR
epla
cem
ent o
f pum
p10
,000
10,0
003.
Inte
grat
e tre
atm
ent p
lant
for w
ater
pur
ifica
tion
Ref
er to
"A
. HO
NIA
RA
Wat
er S
uppl
y Sy
stem
" (A
-2)
D-3
. Res
ervo
irs D
evel
opm
ent
1. N
ew T
anks
Ref
er to
"A
. HO
NIA
RA
Wat
er S
uppl
y Sy
stem
" (A
-4)
D-4
. Pum
ps1.
Whi
te R
iver
Pum
p St
atio
nM
otor
- m
ajor
ser
vice
50,0
0010
,000
Mot
or -
repl
acem
ent
30,0
00
Mot
or -
maj
or s
ervi
ce50
,000
10,0
00
Mot
or -
repl
acem
ent
30,0
00
Mot
or -
maj
or s
ervi
ce10
,000
10,0
00
Mot
or -
repl
acem
ent
30,0
00
2. JI
CA
Mat
anik
o Bo
res
Rep
lace
men
t - 0
.43m
3 /min
x 1
00m
H x
11k
W50
,000
Rep
lace
men
t - 0
.43m
3 /min
x 1
00m
H x
11k
W50
,000
Rep
lace
men
t - 0
.43m
3 /min
x 1
00m
H x
11k
W50
,000
Rep
lace
men
t - 0
.43m
3 /min
x 1
00m
H x
11k
W50
,000
Rep
lace
men
t - 0
.43m
3 /min
x 1
00m
H x
11k
W50
,000
Mot
or -
maj
or s
ervi
ce10
,000
Mot
or -
repl
acem
ent
100,
000
15,0
00
3. E
xplo
ring
Alte
rnat
ives
Pow
er S
ourc
es -
Sola
r, W
ater
and
Oil
50,0
00
4. T
elem
etry
Sys
tem
100,
000
D-5
. Pip
elin
e D
evel
opm
ent
Link
Kom
bito
JIC
A b
ores
to E
ast K
olaa
Tan
kR
epla
ce W
est K
olaa
to E
ast K
oaa
pipe
line
200,
000
Inve
stig
ate
and
asse
ss M
atan
iko
unde
r wat
erC
ross
ing
Link
Sky
line
to R
ove
Gra
vity
Sys
tem
100,
000
Long
Ter
mU
rban
Cen
ter
Item
Det
ail D
escr
iptio
nSh
ort T
erm
Mid
-Ter
m
So
urce
: SI
WA
and
JIC
A S
tudy
Tea
m

The Study for Rehabilitation and Improvement of Solomon Islands Water Authority’s Water Supply and Sewerage Systems
Final Report : Summary Report(G-18)
Tabl
e G
3-2
Act
ion
Plan
for
Wat
er S
uppl
y an
d Se
wer
age
Faci
lity
Impr
ovem
ent (
5/10
) (U
nit :
SI$
) 20
0620
0720
0820
0920
1020
1120
1220
1320
1420
1520
16E
. HO
NIA
RA
E-1
. Sou
rce
Dev
elop
men
tR
ove
Sprin
g1.
Cat
chm
ent M
anag
emen
t Pla
n2.
Reh
abili
tate
Sou
rce
Rev
eget
atio
nC
onst
ruct
ion
of D
am W
alls
Rep
lace
Fen
cing
of p
erim
eter
of s
ourc
e3.
Dev
elop
New
Bor
ehol
esE
-2. T
reat
men
t1.
Filt
ratio
nIn
stal
l Car
tridg
e Fi
ltrat
ion
Syst
em2.
Disi
nfec
tion
Purc
hage
bac
k-up
pum
pR
epla
cem
ent o
f pum
p10
,000
10,0
00
3. N
ew T
reat
men
t Pla
ntR
efer
to "
A. H
ON
IAR
A W
ater
Sup
ply
Syst
em"
(A-2
)20
0,00
0E
-3. R
eser
voir
s D
evel
opm
ent
1. N
ew T
anks
New
600
m3 T
ank
Rep
lace
men
t - L
enga
kiki
Tan
k ro
of20
0,00
0
2. P
umps
Rep
lace
men
t - 0
.6m
3 /min
x 8
0mH
x 1
1kW
50,0
00
Rep
lace
men
t - 0
.6m
3 /min
x 8
0mH
x 1
1kW
50,0
00
Rep
lace
men
t - 0
.6m
3 /min
x 8
0mH
x 1
1kW
50,0
00
Rep
lace
men
t - 0
.6m
3 /min
x 8
0mH
x 1
1kW
50,0
00
Mot
or -
maj
or s
ervi
ce50
,000
Mot
or -
repl
acem
ent
15,0
00E
-4. S
tand
by G
ener
ator
E-5
. Pip
elin
e D
evel
opm
ent
Rep
lace
pip
elin
e fr
om R
ove
Sour
ce to
Le
ngak
iki T
ank
100,
000
Rea
lignm
ent o
f Gra
vity
line
100,
000
Long
Ter
mU
rban
Cen
ter
Item
Det
ail D
escr
iptio
nSh
ort T
erm
Mid
-Ter
m
So
urce
: SI
WA
and
JIC
A S
tudy
Tea
m

The Study for Rehabilitation and Improvement of Solomon Islands Water Authority’s Water Supply and Sewerage Systems
Final Report : Summary Report(G-19)
Tabl
e G
3-2
Act
ion
Plan
for
Wat
er S
uppl
y an
d Se
wer
age
Faci
lity
Impr
ovem
ent (
6/10
) (U
nit :
SI$
) 20
0620
0720
0820
0920
1020
1120
1220
1320
1420
1520
16F.
HO
NIA
RA
F-1.
Sou
rce
Dev
elop
men
tPa
natin
a1.
Dev
elop
men
t of N
ew B
ores
Ref
er to
"A
. HO
NIA
RA
Wat
er S
uppl
y Sy
stem
" (A
-1)
2. C
atch
men
t Man
agem
ent P
lan
Inst
alla
tion
of si
gns
Rev
eget
atio
n3.
Sec
ure
Kom
bito
Sou
rce
Dam
40,0
004.
Inve
stig
ate
Lung
a R
iver
as a
new
sour
ce5.
Inve
stig
ate
Mbo
ko a
s an
alte
rnat
ive
sour
ce10
,000
F-2.
Tre
atm
ent
Pana
tina-
Kom
bito
Sou
rce
1. F
iltra
tion
Inst
all c
artri
dge
filtra
tion
syst
em2.
Disi
nfec
tion
Purc
hase
bac
k-up
pum
pR
epla
cem
ent o
f pum
p10
,000
10,0
0010
,000
10,0
00F-
3. R
eser
voir
s Dev
elop
men
t1.
New
Tan
ksR
e pla
cem
ent 9
00m
3ta
nkN
ew 9
00m
3ta
nkN
ew 6
00m
3 tank
150,
000
Rep
lace
men
t - S
ICH
E K
ukum
cam
pus t
ank
100,
000
F-4.
Pum
ps1.
Pan
atin
a Pu
mpi
ng S
tatio
nR
epla
cem
ent -
Gru
ndfo
s bor
es p
ump
(BH
3)50
,000
50,0
00
Rep
lace
men
t - G
rund
fos b
ores
pum
p (B
H2)
50,0
0050
,000
Rep
lace
men
t - G
rund
fos b
ores
pum
p (B
H1)
150,
000
2. K
ombi
to B
ores
Rep
lace
men
t - S
outh
ern
Cro
ss b
ore
pum
pM
otor
- m
ajor
serv
ice
10,0
00
Mot
or -
repl
acem
ent
10,0
00R
epla
cem
ent -
JIC
A 0
.53m
3x
80m
H x
11k
WR
epla
cem
ent -
JIC
A 0
.53m
3x
80m
H x
11k
W3.
Sta
ndby
Gen
erat
or30
0,00
04.
Tel
emet
ry S
yste
m5.
Pip
elin
e D
evel
opm
ent
Am
plic
atio
n of
pip
elin
e be
hind
Hot
Bre
ad K
itche
n10
0,00
0
Long
Ter
mU
rban
Cen
ter
Item
Det
ail D
escr
iptio
nSh
ort T
erm
Mid
-Ter
m
So
urce
: SI
WA
and
JIC
A S
tudy
Tea
m

The Study for Rehabilitation and Improvement of Solomon Islands Water Authority’s Water Supply and Sewerage Systems
Final Report : Summary Report(G-20)
Tabl
e G
3-2
Act
ion
Plan
for
Wat
er S
uppl
y an
d Se
wer
age
Faci
lity
Impr
ovem
ent (
7/10
) (
Uni
t : S
I$)
2006
2007
2008
2009
2010
2011
2012
2013
2014
2015
2016
G. H
ON
IAR
AG
-1. S
ourc
e D
evel
opm
ent
Mat
anik
o1.
Dev
elop
men
t of N
ew B
ores
Hiri
ng o
f dril
ling
rig15
0,00
0
Hiri
ng o
f pum
p te
st e
quip
men
t10
,000
100m
x 6
" bor
e ca
sing
50,0
00
6" b
ore
pum
p 30
L/s a
t 100
mH
100,
000
2. C
atch
men
t Man
agem
ent P
lan
Inst
alla
tion
of si
gns
Prot
ectio
n of
exi
stin
g bo
reho
les
3. R
ehab
ilita
tion
Infil
tratio
n G
alle
ryG
-2. T
reat
men
t1.
New
Wat
er T
reat
men
t Pla
nt2.
Disi
nfec
tion
Ref
er to
"A
. HO
NIA
RA
Wat
er S
uppl
y Sy
stem
" (A
-2)
10,0
0010
,000
G-3
. Res
ervo
irs D
evel
opm
ent
1. N
ew T
anks
Lo
wer
Wes
t Kol
aa T
ank
1Lo
wer
Wes
t Kol
aa T
ank
220
0,00
0R
epla
ce fe
nsin
gG
-4. P
umps
1. M
atan
iko
Pum
ping
Sta
tion
and
Bore
sR
epla
cem
ent -
BH
1 bo
re p
ump
50,0
0050
,000
Rep
lace
men
t - B
H2
bore
pum
p50
,000
Hig
h lif
t pum
p (K
elly
and
Lev
is 65
x40-
200)
50,0
00
15k
W m
otor
- m
ajor
serv
ice
10,0
00
15k
W m
otor
- re
plac
emen
t 15
,000
Hig
h lif
t pum
p (S
outh
ern
Cro
ss 6
5x40
-200
)10
0,00
0
15k
W m
otor
- m
ajor
serv
ice
10,0
00
15k
W m
otor
- re
plac
emen
t 15
,000
Hig
h lif
t pum
p (S
outh
ern
Cro
ss 1
00x6
5-20
0) 3
0kW
mot
or -
maj
or se
rvic
e 10
,000
30k
W m
otor
- re
plac
emen
t 15
,000
2. S
tand
by G
ener
ator
750,
000
3. U
pgra
de o
f Pum
p St
atio
nPi
pew
orks
Switc
hboa
rdFe
ncin
gG
-5. P
ipel
ine
Dev
elop
men
tC
ross
con
nect
ion
of S
kylin
e to
Wes
t Kol
aa20
0,00
0
Long
Ter
mU
rban
Cen
ter
Item
Det
ail D
escr
iptio
nSh
ort T
erm
Mid
-Ter
m
So
urce
: SI
WA
and
JIC
A S
tudy
Tea
m

The Study for Rehabilitation and Improvement of Solomon Islands Water Authority’s Water Supply and Sewerage Systems
Final Report : Summary Report(G-21)
Tabl
e G
3-2
Act
ion
Plan
for
Wat
er S
uppl
y an
d Se
wer
age
Faci
lity
Impr
ovem
ent (
8/10
) (U
nit :
SI$
) 20
0620
0720
0820
0920
1020
1120
1220
1320
1420
1520
16H
. HO
NIA
RA
H-1
. Sew
age
Out
fall
Syst
emC
yclo
ne p
roof
oce
an p
ipel
ine
& o
utfa
lls7,
000,
000
5,41
8,00
0Se
wer
age
Syst
emPu
mpi
ng st
atio
nin
the
Mid
-term
H-2
. Slu
dge
Tre
atm
ent F
acili
tySl
udge
dry
ing
bed
938,
000
Faci
lity
Sept
ic ta
nkIm
prov
emen
t (M
FI)
H-3
. Pro
cure
men
t of O
pera
tion
Vac
uum
truc
k6,
300,
000
Plan
by
JIC
A S
tudy
Equ
ipm
ent
Jet c
lean
ing
truck
for s
ewer
pip
eW
heel
load
er fo
r slu
dge
disp
osal
I. N
OR
OI-
1. S
ourc
e D
evel
opm
ent
1. C
atch
men
t Man
agem
ent P
lan
Rep
airin
g of
sign
sI-
2. T
reat
men
tR
epla
cem
ent o
f fill
er m
ater
ial (
20m
3 )13
0,00
010
0,00
0
Disi
nfec
tion
- pum
p10
,000
I-3.
Res
ervo
irs
New
900
m3 ta
nkI-
4. P
umps
Stan
dby
- hig
h lif
t pum
p8,
500
Rep
lace
men
t - m
otor
Maj
or se
rvic
e - m
otor
10,0
0010
,000
Rep
lace
men
t - ri
ver p
ump
Rep
lace
men
t - ri
ver p
ump
60,0
00
I-5.
Sta
ndby
Gen
erat
or20
0,00
0
I-6.
New
Are
asIn
stal
latio
n of
new
retic
ulat
ion
area
s50
,000
50,0
0096
,255
95,9
6996
,255
95,9
6996
,255
114,
535
114,
535
114,
535
114,
535
I-7
Mis
cella
neou
sD
omes
tic m
eter
s45
,000
50,0
0064
,937
66,5
6068
,302
69,9
2571
,667
77,3
2979
,334
81,3
3983
,344
Bulk
flow
met
ers
35,0
00N
ew re
siden
tial h
ouse
New
stor
es/o
ffice
200,
000
New
veh
icle
200,
000
Long
Ter
mU
rban
Cen
ter
Item
Det
ail D
escr
iptio
nSh
ort T
erm
Mid
-Ter
m
So
urce
: SI
WA
and
JIC
A S
tudy
Tea
m

The Study for Rehabilitation and Improvement of Solomon Islands Water Authority’s Water Supply and Sewerage Systems
Final Report : Summary Report(G-22)
Tabl
e G
3-2
Act
ion
Plan
for
Wat
er S
uppl
y an
d Se
wer
age
Faci
lity
Impr
ovem
ent (
9/10
) (U
nit :
SI$
) 20
0620
0720
0820
0920
1020
1120
1220
1320
1420
1520
16J.
TU
LAG
IJ-
1. S
ourc
e D
evel
opm
ent
Prel
imin
ary
desig
n - e
arth
fill d
amEa
rth fi
ll da
m (5
m h
igh,
30m
long
)50
,000
Inst
alla
tion
of si
gns
J-2.
Tre
atm
ent
Tota
l uni
t - c
hrol
inat
ion
equi
pmen
t and
shed
50,0
00
J-3.
Res
ervo
irs
Rep
lace
men
t 600
m3 ta
nk50
,000
Rep
lace
men
t 10m
3ta
nkJ-
4. P
umps
Rep
lace
men
t of p
ump
stat
ion
Rep
lace
men
t - m
otor
15,0
00
Maj
or se
rvic
e - m
otor
10,0
00N
ew st
andg
y hi
gh li
ft pu
mp
Rep
lace
men
t - m
otor
15,0
00
Maj
or se
rvic
e - m
otor
10,0
00N
ew fl
oat c
ontro
l sys
tem
J-5.
Risi
ng M
ains
Am
plifi
catio
n of
risin
g m
ain
J-6.
Exi
stin
g Sy
stem
Rep
lace
men
t of e
xist
ing
netw
ork
20,0
00
J-7.
New
Are
asIn
stal
latio
n of
new
retic
ulat
ion
area
s7,
230
6,78
46,
962
7,23
07,
319
7,49
87,
765
7,94
48,
122
8,39
0
J-8.
Misc
ella
neou
sD
omes
tic m
eter
s15
,000
20,0
0019
,323
19,8
2720
,404
20,8
7121
,405
22,0
1122
,571
23,1
4023
,781
Bulk
flow
met
ers
10,0
00
New
stor
es/o
ffic
e50
,000
Reh
abili
tate
resid
entia
l hou
sing
Can
oe a
nd o
utbo
ard
60,0
0050
,000
K. A
UK
IK
-1. S
ourc
e D
evel
opm
ent
MFI
Pla
n1.
New
Bor
efie
ld, 6
00m
3 /day
x 2
bor
esTo
be
loca
ted
at th
e tra
nsm
issio
pum
p st
atio
n 1,
162,
000
1,16
2,00
0by
JIC
A S
tudy
site
(Low
Lev
el T
ank)
Long
Ter
mU
rban
Cen
ter
Item
Det
ail D
escr
iptio
nSh
ort T
erm
Mid
-Ter
m
So
urce
: SI
WA
and
JIC
A S
tudy
Tea
m

The Study for Rehabilitation and Improvement of Solomon Islands Water Authority’s Water Supply and Sewerage Systems
Final Report : Summary Report(G-23)
Tabl
e G
3-2
Act
ion
Plan
for
Wat
er S
uppl
y an
d Se
wer
age
Faci
lity
Impr
ovem
ent (
10/1
0)
(Uni
t : S
I$)
2006
2007
2008
2009
2010
2011
2012
2013
2014
2015
2016
L. A
UK
IL
-1. S
ourc
e D
evel
opm
ent
Ref
er to
"K
. AU
KI M
FI P
lan
by J
ICA
Stu
dy"
L-2
. Res
ervo
irs
New
900
m3 ta
nkN
ew 4
50m
3ta
nkL
-3. P
umps
Ren
ovat
e ga
llery
sour
ce p
ump
stat
ion
Ren
ovat
e K
wai
bala
sour
ce p
ump
stat
ion
Rep
lace
men
t - b
oost
er p
ump
(Kw
aiba
la)
Stan
dby
- boo
ster
pum
p (K
wai
bala
)R
epla
cem
ent -
boo
ster
pum
p (g
alle
ry)
Stan
dby
- boo
ster
pum
p (g
alle
ry)
L-4
. Risi
ng M
ains
New
tran
sfer
mai
n (a
llow
3km
of 1
50m
m P
VC
)N
ew tr
ansf
er m
ain
(allo
w 1
km o
f 200
mm
PV
C)
L-5
. Exi
stin
g Sy
stem
Am
plifi
catio
n of
del
iver
y m
ain
Rep
lace
men
t of e
xist
ing
netw
ork
69,3
5369
,353
69,3
53
L-6
. New
Are
asIn
stal
latio
n of
new
retic
ulat
ion
area
s20
,000
57,6
6057
,491
57,4
9172
,075
72,0
7572
,245
72,0
75
L-7
. Misc
ella
neou
sD
omes
tic m
eter
s80
,000
50,0
0054
,496
56,1
9157
,949
59,5
8661
,281
68,3
2170
,446
72,6
3374
,701
Bulk
flow
met
ers
20,0
00N
ew re
siden
tial h
ouse
New
stor
es/o
ffice
200,
000
New
veh
icle
200,
000
8,48
5,00
08,
260,
583
18,7
53,7
2426
,497
,700
31,9
74,7
812,
678,
556
3,69
9,63
53,
820,
412
3,79
7,97
13,
475,
708
3,31
8,26
7
Sum
mar
yU
rban
Cen
ters
2006
2007
2008
2009
2010
2011
2012
2013
2014
2015
2016
HO
NIA
RA
7,13
0,00
07,
524,
000
18,3
92,5
7624
,990
,838
30,5
04,9
812,
367,
395
3,37
5,53
83,
458,
376
3,38
1,06
63,
103,
694
2,94
1,44
1N
OR
O66
0,00
046
0,00
016
1,19
217
2,52
916
4,55
716
5,89
417
6,42
219
1,86
421
3,86
919
5,87
419
7,87
9A
UK
I 50
0,00
013
9,35
312
3,84
91,
287,
544
1,27
7,60
911
7,07
711
8,77
214
0,39
614
2,52
114
4,87
814
6,77
6TU
LAG
I19
5,00
013
7,23
076
,107
46,7
8927
,634
28,1
9028
,903
29,7
7660
,515
31,2
6232
,171
Tota
l8,
485,
000
8,26
0,58
318
,753
,724
26,4
97,7
0031
,974
,781
2,67
8,55
63,
699,
635
3,82
0,41
23,
797,
971
3,47
5,70
83,
318,
267
To b
e im
plem
ente
d by
SIW
A's
budg
et a
nd o
r don
or's
assis
tanc
eTo
be
impl
emen
ted
by A
DB
proj
ect
Long
Ter
m
Ann
ual P
roje
cted
Cap
ital W
orks
Urb
an C
ente
rIte
mD
etai
l Des
crip
tion
Shor
t Ter
mM
id-T
erm
So
urce
: SI
WA
and
JIC
A S
tudy
Tea
m

The Study for Rehabilitation and Improvement of Solomon Islands Water Authority’s Water Supply and Sewerage Systems
Final Report : Summary Report (G-24)
G4 Action Plan for Leakage Reduction
Leakage (or real loss) in the water supply system is one of the most important factors which affects the management of water supply utility. Reduction of the leakage will lead to the following improvement;
Reduction of water distribution volume Reduction of the operating cost (electricity cost, disinfection cost, etc.) Elimination of the necessity of new water source development in the future
Through the pilot project for establishment of leakage reduction indicator, leakage reduction rate per unit length (m3/km/day) has been obtained as explained in section F2.2 of PART F.
On condition that the mid-term facility implementation plan is implemented by 2010 and SIWA executes regularly the replacement of pipelines for leakage reduction, action plan for leakage reduction was formulated as shown in Table G4-1.
Table G4-1 Action Plan for Leakage Reduction by Pipe Replacement Short Term Mid Term Long Term Item Unit
2005 2006 2007 2008 2009 2010 2011 2012 2013 2014 2015 2016Water Demand (or Distributed)*1 - Demand With Leakage Reduction m3/day 25,719 26,590 27,504 28,477 29,513 30,587 30,684 30,850 31,016 31,182 31,350 31,510(Design production capacity) 25,719 25,719 25,719 25,719 30,957 30,957 30,957 30,957 30,957 30,957 30,957- Demand Without Leakage Reduction m3/day 25,706 27,047 28,468 29,990 31,615 33,368 35,230 37,244 39,408 41,736 44,243 46,944
Leakage of the Year m3/day 10,288 10,545 10,517 10,489 10,468 12,416 12,169 11,632 11,091 10,471 9,800 9,085Pipe Length to be Replaced km/year 0.95 0.95 0.95 0.95 0.95 2.0 2.0 2.0 2.0 2.0 2.0
Leakage Reduction Rate m3/km/day 300 300 300 300 300 300 300 300 300 300 300
Leakage Reduction Volume m3/day 285 285 285 285 285 600 600 600 600 600 600Leakage With Replacement m3/day 10,288 10,259 10,232 10,204 10,183 12,131 11,569 11,032 10,491 9,871 9,200 8,485Leakage Without Replacement m3/day 11,089 11,957 12,896 13,911 15,015 16,206 17,505 18,916 20,451 22,122 23,942Leakage Ratio
- With Replacement % 40 40 40 40 40 40 38 36 34 32 29 27 - Without Replacement*2 % 40 41 42 43 44 45 46 47 48 49 50 51 Effective Ratio (with replacement) % 60 60 60 60 60 60 62 64 66 68 71 73
Population in Service Area*3 66,402 68,726 71,131 73,621 76,198 78,865 81,625 84,482 87,439 90,499 93,667 96,945Served Ratio % 70 71 73 75 76 78 80 82 84 85 87 90Served Population*4 46,221 48,948 51,836 54,894 58,117 61,520 65,150 68,994 73,064 77,375 81,940 86,775Per Capita Consumption - Domestic LCD 164 164 164 164 164 164 164 164 164 164 164 164 Water Consumption - Domestic m3/day 7,596 8,045 8,519 9,022 9,551 10,118 10,707 11,339 12,008 12,717 13,467 14,261- Commercial and Others m3/day 7,835 7,913 7,992 8,072 8,153 8,235 8,317 8,400 8,484 8,569 8,655 8,741
Total m3/day 15,431 15,958 16,512 17,094 17,705 18,352 19,024 19,739 20,492 21,286 22,122 23,003Per Capita Demand LCD 334 326 319 311 305 298 292 286 280 275 270 265 Design Production Capacity*5 m3/day 25,719 25,719 25,719 25,719 25,719 30,957 30,957 30,957 30,957 30,957 30,957 30,957
Notes : 1. Water Demand = Water Consumption/(1-Leakage Ratio/100) 2. Leakage ratio without taking leakage reduction measures is assumed to be increased annually by 1.0% . 3. Annual growth rate of population is 3.5% . 4. Served population is assumed to be increased annually by 5.9% based on the past records. 5. Design production capacity in and after 2010 is the capacity proposed in this study.
Source : JICA Study Team A substantial length of transmission and distribution pipelines will be replaced in accordance with the mid-term facility improvement plan. Therefore, in order to avoid duplication of the pipe replacement, it is recommended that SIWA start large scale leakage reduction work by replacing pipes after the implementation of the mid-term facility plan. Based on the above action plan, SIWA is required to conduct the replacement of pipes with significant leakage of about 1.0 km per year to keep the current leakage ratio of 40% until the implementation of the mid-term facility improvement plan. In order to achieve the target leakage ratio of 27% in 2016, SIWA has to perform pipe replacement of 2.0km every year after the year 2011.
In case SIWA has sufficient budget and starts large scale reduction work, they should follow the mid-term facility plan prepared in this study.

The Study for Rehabilitation and Improvement of Solomon Islands Water Authority’s Water Supply and Sewerage Systems
Final Report : Summary Report (G-25)
Figure G4-1 shows the water demand, both with and without leakage reduction respectively. In case leakage reduction measures are not taken, new water source development of 16,000m3/day will be required in 2016. On the other hand, assuming leakage reduction measures are properly implemented, no new water source development will be required.
Production Capacity
15000
20000
25000
30000
35000
40000
45000
50000
55000
2005 2006 2007 2008 2009 2010 2011 2012 2013 2014 2015 2016 (Year)
Water Demand (m3/day)
Production capacity
Demand with leakagereductionDemand without leakagereduction
Amount of new water source to bedeveloped without leakage reductionin 2016 : approx. 16,000m3/day
Source : JICA Study Team
Figure G4-1 Water Demand Forecast up to 2016


