PART 4 FINANCIAL REPORTING STANDARDS AND FINANCIAL STATEMENTS · PART 4 FINANCIAL REPORTING...
81
PART 4 FINANCIAL REPORTING STANDARDS AND FINANCIAL STATEMENTS This part contains financial statements prepared in accordance with external reporting standards and discusses budget concepts. The external standards used in the budget are the Australian Bureau of Statistics accrual Government Finance Statistics framework and the Australian Accounting Standards. This part includes reconciliation statements which explain how the two sets of financial statements compare. This part also discusses a range of factors that pose a risk to the actual budget outcome in future years. These risks include changes in parameters, fiscal risks and contingent liabilities. Statement 8: Financial Reporting Standards and Budget Concepts ............. 8-1 Statement 9: Government Finance Statistics Statements .............................. 9-1 Statement 10: Australian Accounting Standards Financial Statements................................................................................... 10-1 Statement 11: Statement of Risks...................................................................... 11-1
Transcript of PART 4 FINANCIAL REPORTING STANDARDS AND FINANCIAL STATEMENTS · PART 4 FINANCIAL REPORTING...

PART 4 FINANCIAL REPORTING STANDARDS AND FINANCIAL STATEMENTS
This part contains financial statements prepared in accordance with external reporting standards and discusses budget concepts. The external standards used in the budget are the Australian Bureau of Statistics accrual Government Finance Statistics framework and the Australian Accounting Standards.
This part includes reconciliation statements which explain how the two sets of financial statements compare.
This part also discusses a range of factors that pose a risk to the actual budget outcome in future years. These risks include changes in parameters, fiscal risks and contingent liabilities.
Statement 8: Financial Reporting Standards and Budget Concepts .............8-1
Statement 9: Government Finance Statistics Statements ..............................9-1
Statement 10: Australian Accounting Standards Financial Statements...................................................................................10-1
Statement 11: Statement of Risks......................................................................11-1
8-1
STATEMENT 8: FINANCIAL REPORTING STANDARDS AND BUDGET CONCEPTS
This statement describes the financial accounting frameworks relevant to the Australian Government.
Accrual GFS framework ............................................................................................8-2 Nature of the GFS framework ......................................................................................8-2 Operating statement.....................................................................................................8-3 Balance sheet...............................................................................................................8-4 Cash flow statement.....................................................................................................8-5 Statement of other economic flows (reconciliation of net worth) .................................8-7 Sectoral classifications.................................................................................................8-8
Australian Accounting Standard Reporting Framework, including AAS 31.........................................................................................................................8-9
Reconciliation of GFS and AAS aggregates .........................................................8-10

8-2
STATEMENT 8: FINANCIAL REPORTING STANDARDS AND BUDGET CONCEPTS
The Charter of Budget Honesty Act 1998 requires that the Budget be based on external reporting standards. Accordingly, the major external standards used in the Budget are the Australian Bureau of Statistics (ABS) accrual Government Finance Statistics (GFS) framework and Australian Accounting Standards (AAS), including Australian Accounting Standard No. 31 Financial Reporting by Governments (AAS 31). The major fiscal aggregates (including the fiscal and underlying cash balances) are based on the accrual GFS framework.
The Charter also requires that departures from applicable external reporting standards be identified. These are disclosed in Appendix A to Statement 2, the introduction to Statement 9 and Note 1 in Statement 10.
ACCRUAL GFS FRAMEWORK
The GFS reporting framework is a specialised financial reporting system designed to support economic analysis of the public sector. It allows comprehensive assessments to be made of the economic impact of government and is consistent with international statistical standards (the System of National Accounts 1993 (SNA93) and the International Monetary Fund’s (IMF) Government Finance Statistics Manual 2001).1
GFS financial statements are contained in Statements 2 and 9.
Nature of the GFS framework The accrual GFS framework is based on an integrated recording of flows and stocks. Flows reflect the creation, transformation, exchange, transfer or extinction of economic value. They involve changes in the volume, composition or value of a unit’s assets, liabilities and net worth. Stocks refer to a unit’s holdings of assets, liabilities and net worth at a point in time.
The framework distinguishes between two types of flows: transactions and other economic flows.
• Transactions result from mutually agreed interactions between economic entities. Despite their compulsory nature, taxes are transactions deemed to occur by mutual agreement between the government and the taxpayer. Transactions that increase or
1 Additional information on the Australian accrual GFS framework is available in the
ABS publication Australian System of Government Finance Statistics: Concepts, Sources and Methods, 2003 (Cat. No. 5514.0.55.001).
Statement 8: Financial Reporting Standards and Budget Concepts
8-3
decrease net worth (assets minus liabilities) are reported as revenue and expenses respectively in the operating statements.2
• Other economic flows represent changes to the value of stocks that do not result from a transaction. Other economic flows arise from price movements (revaluations) and volume changes, including interest and exchange rate movements, and phenomena such as discoveries, depletion and destruction.
The GFS conceptual framework comprises a number of separate statements, each of which draws out analytical aggregates or balances of particular economic significance. Together, these aggregates provide for a thorough understanding of the financial position of the public sector. The GFS statements reported in the Budget are the operating statement, balance sheet, cash flow statement and statement of other economic flows.
Under the accrual GFS framework, flows are recorded in the period in which they occurred. As a result, prior period outcomes may be revised where information arises that could reasonably be expected to have been known in the past, is material in at least one of the affected periods and can be reliably assigned to the relevant period(s).
Operating statement The operating statement presents details of transactions in GFS revenues, GFS expenses and the net acquisition of non-financial assets (net capital investment) for an accounting period.
GFS revenues arise from transactions that increase net worth and GFS expenses arise from transactions that decrease net worth. GFS revenues less GFS expenses gives the GFS net operating balance. The net operating balance is comparable to the National Accounts concept of government saving plus capital transfers.
The net acquisition of non-financial assets (net capital investment) measures the change in the Australian Government’s stock of non-financial assets due to transactions. As such, it measures the net effect of purchases, sales and consumption (depreciation of fixed assets and use of inventory) of non-financial assets during an accounting period.
Net acquisition of non-financial assets equals gross fixed capital formation, less depreciation, plus changes (investment) in inventories, plus other transactions in non-financial assets.
2 Not all transactions impact on net worth. For example, transactions in financial assets and
liabilities do not impact on net worth as they represent the swapping of assets and liabilities on the balance sheet.

Part 4: Financial Reporting Standards and Financial Statements
8-4
• Gross fixed capital formation comprises purchases less sales of fixed assets (such as buildings) and net acquisitions of fixed assets under finance leases.
• Depreciation measures consumption of fixed assets, such as through physical deterioration or normal obsolescence, as they are used in production.
• Changes in inventories measures investment in new inventory stocks less use of current inventories.
• Other transactions in non-financial assets comprise mainly (for the Australian Government general government sector) changes in the value of work-in-progress and software assets, and transactions in non-reproducible, intangible assets (such as telecommunications spectrum).
Fiscal balance
The fiscal balance (or GFS net lending/borrowing) is the net operating balance less net capital investment. Thus, the fiscal balance includes the impact of net expenditure (effectively purchases less sales) on non-financial assets rather than consumption (depreciation) of non-financial assets.3
The fiscal balance measures the Australian Government’s investment-saving balance. It measures in accrual terms the gap between government savings plus net capital transfers, and investment in non-financial assets. As such, it approximates the contribution of the Australian Government general government sector to the balance on the current account in the balance of payments.
A fiscal balance surplus indicates the Australian Government is lending to other sectors. A fiscal balance deficit indicates the Australian Government is using the financial resources of other sectors. Thus, fiscal balance can be viewed as a global indicator of the financial impact of Australian Government operations on the rest of the economy.
Balance sheet The balance sheet shows stocks of assets, liabilities and GFS net worth. Net debt is also reported in the balance sheet.
Assets represent instruments or entities:
• over which ownership rights are enforced by an economic entity; and
3 The net operating balance includes consumption of non-financial assets because depreciation
is a GFS expense. Depreciation also forms part of net capital investment, which (in the calculation of fiscal balance) offsets the inclusion of depreciation in the net operating balance.
Statement 8: Financial Reporting Standards and Budget Concepts
8-5
• from which economic benefits may be derived by their owners from holding them or using them over a period of time.
Liabilities represent obligations to provide economic value to other institutional units.
Net debt
Net debt is the sum of selected financial liabilities (deposits held, advances received, government securities, loans and other borrowing) less the sum of selected financial assets (cash and deposits; advances paid; and investments, loans and placements). Net debt does not include superannuation or superannuation related liabilities. Net debt is a common measure of the strength of a government’s financial position. High levels of net debt impose a call on future revenue flows to service that debt.
Net interest payments is a concept related to net debt. Net interest payments is a cash measure defined as interest payments on gross debt less interest received. Net interest payments are affected by the volume of net debt and by interest rates.
Net worth
The net worth of the general government sector is defined as assets less liabilities. Apart from the effect of revaluations and volume changes (recorded in the statement of other economic flows), changes in general government sector net worth reflect the net operating balance. For the public financial corporations and public non-financial corporations sectors, net worth is defined as assets less liabilities less shares and other contributed capital. Net worth is an economic measure of wealth, reflecting the contribution of the Australian Government to the wealth of Australia.
The net worth measure is a more comprehensive indicator of a government’s overall financial position than net debt as it incorporates a government’s non-financial assets, such as land and other fixed assets, as well as certain financial assets and liabilities not captured by the net debt measure, most notably accrued employee superannuation liabilities. For example, a limitation of the net debt measure is that the sale of physical assets decreases net debt, with proceeds from sales increasing financial assets. Net worth recognises this increase in financial assets is funded by a decrease in physical assets. Net worth itself, however, also has limitations. It can be volatile, some non-financial assets can be difficult to measure and changes can reflect circumstances beyond the direct control of the Government.
Cash flow statement The cash flow statement identifies how cash is generated and applied in a single accounting period. Cash means cash on hand (notes and coins held and deposits held at call with a bank or other financial institution) and cash equivalents (highly liquid investments that are readily convertible to cash on hand at the investor’s option and overdrafts considered integral to the cash management function).

Part 4: Financial Reporting Standards and Financial Statements
8-6
The cash flow statement reflects a cash basis of recording (rather than an accrual basis) where information is derived indirectly from underlying accrual transactions and movements in balances. This, in effect, means that transactions are captured when cash is received or when cash payments are made. Cash transactions are identified specifically because cash management is considered an integral function of accrual budgeting.
Underlying cash balance
The underlying cash balance plus Future Fund earnings (GFS surplus/deficit) is the cash counterpart of the fiscal balance, reflecting the Australian Government’s cash investment-saving balance. This measure is conceptually equivalent under the current accrual framework and the previous cash framework. For the general government sector, the underlying cash balance is calculated as shown below.
Net cash flows from operating activities plus Net cash flows from investments in non-financial assets less
Net acquisitions of assets acquired under finance leases and similar arrangements4
equals GFS surplus/deficit less Future Fund earnings equals Underlying cash balance
The Government is reporting the underlying cash balance net of Future Fund earnings from 2005-06 onwards because the earnings will be reinvested to meet future superannuation payments and are therefore not available for current spending. However, Future Fund earnings are included in the fiscal balance because superannuation expenses relating to future cash payments are recorded in the fiscal balance estimates.
Expected Future Fund earnings are separately identified in the Australian Government cash flow statement in Statement 2 Appendix B and the historic tables in Statement 13.
4 The underlying cash balance treats the acquisition and disposal of non-financial assets in the
same manner regardless of whether they occur by purchase/sale or finance lease —acquisitions reduce the underlying cash balance and disposals increase the underlying cash balance. However, finance leases do not generate cash flows at the time of acquisition or disposal equivalent to the value of the asset. As such, net acquisitions of assets under finance leases are not shown in the body of the cash flow statement but are reported as a supplementary item for the calculation of the underlying cash balance.
Statement 8: Financial Reporting Standards and Budget Concepts
8-7
An underlying cash surplus reflects the extent to which cash is not pre-committed to funding the Australian Government’s unfunded superannuation liability and is available to the Australian Government to either increase its financial assets or decrease its liabilities (assuming no revaluations and other changes occur). An underlying cash deficit measures the extent to which the Australian Government requires cash for current period expenditure, either by running down its financial assets or drawing on other sectors’ cash reserves.
Headline cash balance
The headline cash balance is calculated by adding net cash flows from investments in financial assets for policy purposes and Future Fund earnings to the underlying cash balance.
Cash flows from investments in financial assets for policy purposes include equity transactions and net advances.5 Equity transactions include equity injections into controlled businesses and privatisations of government businesses. Net advances include net loans to the states, net loans to students under the Higher Education Contribution Scheme (HECS) and contributions to international organisations that increase the Australian Government’s financial assets.
Statement of other economic flows (reconciliation of net worth) The statement of other economic flows outlines changes in net worth driven by economic flows other than GFS revenues and GFS expenses. Accordingly, the GFS system includes a fourth financial statement that presents changes in net worth in an accounting period due to other economic flows (the effect of transactions is reported in the operating statement). Other economic flows, GFS revenues and GFS expenses sum to the total change in net worth during a period.6
Other economic flows are changes in the value of assets or liabilities due to price movements or volume changes. Most other economic flows for the Australian Government general government sector arise from price movements in its assets and liabilities, including:
• changes in the value of investments in commercial entities, including through changes in share prices;
• writedowns in asset values, such as through greater allowances for bad and doubtful debts;
5 Cash flows from investments in financial assets for policy purposes were called net advances
under the cash budgeting framework. 6 The ABS publication Australian System of Government Finance Statistics: Concepts, Sources and
Methods, 2003 (Cat. No. 5514.0.55.001) calls the statement of other economic flows the ‘Statement of Stocks and Flows’.

Part 4: Financial Reporting Standards and Financial Statements
8-8
• changes in the valuation of superannuation and employee compensation liabilities due to economic and demographic changes; and
• valuation changes due to movements in foreign exchange rates and interest rates.
The Australian Government also has a small number of volume changes, including assets recognised for the first time and changes to assets and liabilities flowing from reclassifications and accounting policy changes.
Sectoral classifications To assist in analysing the public sector, GFS data are presented by institutional sector. GFS distinguishes between the general government sector, the public non-financial corporations sector and the public financial corporations sector, as shown in Figure 1.
Figure 1: Institutional structure of the public sector
Total public sector
Public financial corporations
Public non-financial corporationsGeneral government sector
Total non-financialpublic sector
(Includes Reserve Bank of Australia and other borrowing authorities)
(Government departments and agencies that provide non-market public services and are funded mainly through taxes)
(Provide goods and services to consumers on a commercial basis, are funded largely by the sale of these goods and services and are generally legally distinguishable from the governments that own them)
Budget reporting focuses on the general government sector. The general government sector provides public services that are mainly non-market in nature and for the collective consumption of the community, or involve the transfer or redistribution of income. These services are largely financed through taxes and other compulsory levies, although user charging and external funding have increased in recent years. This sector comprises all government departments, offices and some other bodies.

Statement 8: Financial Reporting Standards and Budget Concepts
8-9
The public non-financial corporations sector comprises bodies that provide goods and services that are mainly market, non-regulatory and non-financial in nature, and are financed predominantly through sales to the consumers of these goods and services. In general, public non-financial corporations are legally distinguishable from the governments that own them. Australian Government public non-financial corporations include Telstra, Australia Post and the Australian Government Solicitor.
Together the general government sector and the public non-financial corporations sector comprise the non-financial public sector.
The GFS coverage of the public sector also includes public financial corporations. Public financial corporations are public sector bodies that engage in financial intermediation services or auxiliary financial services and are able to incur financial liabilities on their own account (such as taking deposits, issuing securities or providing insurance services). This sector includes the Reserve Bank of Australia, the Export Finance and Insurance Corporation and Medibank Private. Information on public financial corporations is not included in the budget papers as public financial corporations undertake financial intermediation, which is a fundamentally different function from that performed by other public entities. Under the Uniform Presentation Framework, public financial corporations information is only required to be reported in budget outcome statements.
The total public sector comprises all sectors of government — general government, the public non-financial corporations sector and the public financial corporations sector.
AUSTRALIAN ACCOUNTING STANDARD REPORTING FRAMEWORK, INCLUDING AAS 31
AAS 31 Financial Reporting by Governments requires accrual-based general purpose financial reports showing assets, liabilities, revenues, expenses and cash flows, for each government and the entities it controls. Reporting under this framework is intended to provide a consolidated overview of the financial performance and financial position of the Government.
AAS 31 requires, with some stated exceptions, compliance with all other applicable Australian Accounting Standards.
There are three main financial statements required by AAS 31. These are:
• a statement of financial performance, which includes an operating result;
• a statement of financial position, which shows net assets; and
• a statement of cash flows, which includes net increase/decrease in cash held.

Part 4: Financial Reporting Standards and Financial Statements
8-10
In addition to these financial statements, notes to the financial statements are required. These notes include a summary of accounting policies, disaggregated information and other disclosures required by Australian Accounting Standards.
A full set of financial statements for the general government sector, with notes showing disaggregated information, can be found in Statement 10. This includes a note disclosing the anticipated impacts of the Australian Equivalents to International Financial Reporting Standards for the Australian Government from 2005-06.
RECONCILIATION OF GFS AND AAS AGGREGATES
There is a general consistency of treatment of the elements of financial statements between GFS and AAS. Both frameworks are based on the concept of economic events that give rise to stocks and flows. As a result, the definitions of stocks are broadly similar under the two frameworks and relate to the control of economic benefits, while flows are defined with reference to changes in stocks.
The GFS and AAS definitions of the scope of the public sector agree in almost all cases, with AAS 31 recommending the same segmentation of the public sector into general government, public non-financial corporations and public financial corporations sectors.
Transactions are generally treated in a similar manner by GFS and accounting standards; however, where GFS is a framework designed to facilitate macro-economic analysis, AAS is designed for general purpose financial reporting. The different objectives of the two systems lead to some variation in the treatment of certain items. This differing treatment relates predominantly to the definitions of revenues and expenses under the two frameworks.
In particular, revaluations of assets and liabilities are classified differently under the AAS and GFS standards. Major revaluations include writedowns of bad and doubtful debts (excluding those that are mutually agreed), changes in the valuation of superannuation liabilities and gains and losses due to changes in foreign exchange rates and interest rates.
Under AAS reporting, valuation changes generally affect revenues or expenses and therefore the operating result. However, under GFS reporting, revaluations are not considered to be transactions (that is, they are considered to be other economic flows) and accordingly do not form part of revenues or expenses. Therefore, most revaluations are not taken into account in the calculation of the GFS net operating balance or fiscal balance. However, revaluations still impact on GFS assets and liabilities, as can be seen in the statement of other economic flows.
Some of the major differences between the GFS and AAS treatments of transactions are outlined in Table 1. Further information on the differences between the two systems is

Statement 8: Financial Reporting Standards and Budget Concepts
8-11
provided in the ABS publication Australian System of Government Finance Statistics: Concepts, Sources and Methods, 2003 (Cat. No. 5514.0.55.001).
Table 1: Selected differences between AAS and GFS reporting standards Issue AAS Treatment GFS Treatment
Asset writedowns Treated as part of operating expenses. Treated as revaluations (other economic flows), except for mutually agreed writedowns, and therefore not included in expenses.
Gains and losses on assets
Treated as part of operating revenues/expenses.
Treated as revaluations (other economic flows) and therefore not included in revenues/expenses.
Provisions for bad and doubtful debts
Treated as part of operating expenses and included in the balance sheet as an offset to assets.
Act of creating provisions is not considered an economic event and is therefore not considered an expense or included in the balance sheet. The Australian Government departs from this latter requirement (see Appendix A to Statement 2).
Interest flows related to swaps and other financial derivatives
Treated as operating revenues and expenses.
Treated as other economic flows and so not included in revenues and expenses.
Acquisition of defence weapons platforms
Treated as capital expenditure. Defence weapons platforms appear as an asset on the balance sheet. Depreciation expense on assets is recorded in the operating statement.
Treated as an expense at the time of acquisition. Defence weapons platforms do not appear as an asset on the balance sheet and no depreciation is recorded in the operating statement.
Valuation of assets and liabilities
Classes of assets and liabilities are measured using a range of methods. The predominant methods for valuing different asset classes include historic cost and market value.
Individual assets and liabilities are measured at current market value based on current market prices or a suitable proxy where market prices are not available.
Finance leases Treats finance leases as if an asset were purchased from borrowings. That is, the lease payment is split into an interest component (which is shown as an operating expense) and a principal component. The asset and the liability are recorded on the balance sheet. This convention does not apply to the cash flow statement, which does not record the acquisition of the asset or the liability.
As per the accounting standard, except that the GFS cash flow statement includes the acquisition of the asset as a supplementary item for the calculation of the surplus/deficit and underlying cash balance.
Following the broad strategic direction of the Financial Reporting Council, the Australian Accounting Standards Board is currently pursuing harmonisation of GFS and AAS. The Australian Accounting Standards Board continues its deliberations in order to harmonise AAS and GFS. A converged financial reporting framework will reduce confusion associated with the publication of two sets of financial statements and improve the readability of government budget and outcome reports.

Part 4: Financial Reporting Standards and Financial Statements
8-12
Table 2 reconciles GFS revenue and expenses with their AAS counterparts.
Table 2: Reconciliation of GFS and AAS revenue and expenses
2004-05 2005-06 2006-07 2007-08 2008-09$m $m $m $m $m
GFS revenue (Statement 9) 238,966 252,511 262,942 275,675 289,846less GST revenue for states and territories 36,300 38,000 40,060 42,270 44,520GFS revenue (Statement 2) 202,666 214,511 222,882 233,405 245,326plus asset revenue recognised for the first time 623 124 92 58 58plus foreign exchange gains 0 0 0 0 0plus other economic revaluations 134 416 303 257 148plus proceeds from the sale of assets 823 491 11,655 11,730 11,668plus swap interest revenue 2,165 2,327 2,250 1,869 1,387AAS revenue (Statement 10) 206,411 217,869 237,182 247,319 258,587
GFS expenses (Statement 9) 230,667 243,521 254,116 266,825 280,153less GST grants to states and territories 35,550 37,340 39,200 41,320 43,480less GST mutually agreed writedowns 105 100 110 105 105GFS expenses (Statement 2) 195,012 206,081 214,806 225,400 236,568plus actuarial revaluations 937 0 0 0 0plus net writedown of assets/bad and
doubtful debts 3,026 1,584 1,697 1,723 1,557plus foreign exchange losses 384 0 0 0 0plus other economic adjustments 44 0 0 0 0plus value of assets sold 770 460 2,026 2,121 2,031plus swap interest expense 1,985 2,225 2,154 1,792 1,317plus defence weapons platforms depreciation 2,517 2,132 2,166 2,234 2,304less defence weapons platforms investment 3,064 3,408 3,775 3,988 4,112plus AusAid IDA/ADF expenses 506 0 0 265 237plus ETM adjustment for expenses 1,741 0 0 0 0
AAS expenses (Statement 10) 203,858 209,074 219,074 229,549 239,902
Estimates Projections
Table 3 reconciles the accounting operating result to the GFS net operating balance and the fiscal balance (GFS net lending).
The AAS net operating result is equal to AAS revenues less expenses. Similarly, GFS revenues less expenses equal the GFS net operating balance. Consequently, the reconciliation between the AAS operating result before extraordinary items and the GFS net operating balance relates directly to differences in the definitions of revenues and expenses which are shown in Table 2.
The second part of the Table 3 reconciliation shows the adjustment for net capital investment required to derive the fiscal balance from the GFS net operating balance.
As discussed previously, the fiscal balance is calculated as the net operating balance less net capital investment. This is a useful economic indicator as it represents the gap between government saving (less capital transfers) and investment and so is included at the end of the GFS operating statement. In AAS, there is no equivalent measure to

Statement 8: Financial Reporting Standards and Budget Concepts
8-13
the fiscal balance. That is, the AAS statement of financial performance stops at the operating result and includes no information on net capital investment.
Table 3: Reconciliation of AAS net operating result and fiscal balance
2004-05 2005-06 2006-07 2007-08 2008-09$m $m $m $m $m
AAS operating result before extraordinary items (Statement 10) 2,554 8,794 18,108 17,770 18,685
Net differences from revenue and expense definitions 5,746 196 -9,282 -8,921 -8,992
GFS net operating balance (Statement 9) 8,300 8,990 8,826 8,850 9,693less purchase of property, plant and
equipment and intangibles 5,550 6,324 6,145 6,411 6,212less assets acquired under finance leases 7 4 23 5 4less other non-financial assets 99 191 179 -110 -89less increase in inventories 374 340 473 273 270plus defence weapons platforms investment 3,064 3,408 3,775 3,988 4,112plus proceeds from sales of property, plant
and equipment and intangibles 422 291 175 250 188plus depreciation and amortisation 4,409 4,272 4,418 4,575 4,665less weapons depreciation 2,517 2,132 2,166 2,234 2,304
Fiscal balance (GFS net lending)(Statement 9)(a) 7,648 7,970 8,208 8,848 9,957Impact of GST -645 -560 -750 -845 -935
Fiscal balance (GFS net lending)(Statement 2)(a) 7,003 7,410 7,458 8,003 9,022
Estimates Projections
(a) The fiscal balance estimates in Statement 9 are higher than those presented in Statement 2, as
explained in the introduction to Statement 9.


9-1
STATEMENT 9: GOVERNMENT FINANCE STATISTICS STATEMENTS
The financial tables presented in this statement are prepared in accordance with the Australian Bureau of Statistics (ABS) accrual Government Finance Statistics (GFS) framework.
The Australian, state and territory governments have an agreed framework — the Accrual Uniform Presentation Framework — for the presentation of government financial information on a basis consistent with the ABS GFS publication. This statement presents Australian Government data on an ABS GFS basis, as required by the Accrual Uniform Presentation Framework, except for the departures (other than in relation to the treatment of goods and services tax (GST)) detailed in Appendix A to Statement 2.
In accordance with Accrual Uniform Presentation Framework requirements, this statement also contains an update of the Australian Government’s Loan Council Allocation.
Government Finance Statistics Statements............................................................9-4 Appendix A: Australian Loan Council Allocation .......................................................9-15

9-2
STATEMENT 9: GOVERNMENT FINANCE STATISTICS STATEMENTS
Financial tables presented in this statement are prepared in accordance with the Australian Bureau of Statistics (ABS) accrual Government Finance Statistics (GFS) framework.
The tables include an operating statement, balance sheet and cash flow statement for the Australian Government general government, public non-financial corporations and total non-financial public sectors. A statement of other economic flows is also included for the Australian Government general government sector.
The Australian, state and territory governments have an agreed framework — the Accrual Uniform Presentation Framework — for the presentation of government financial information on a basis consistent with the ABS GFS publication. This statement presents Australian Government data on an ABS GFS basis, as required by the Accrual Uniform Presentation Framework, except for the departures (other than in relation to the treatment of goods and services tax (GST)) detailed in Appendix A to Statement 2.
The only difference between the Australian Government general government sector statements in Statement 2 and this statement is the treatment of the GST. The clear policy intent of the Intergovernmental Agreement on the Reform of Commonwealth-State Financial Relations, is that GST is collected by the Australian Taxation Office, as an agent for the states and territories (the states), and appropriated to the states. Consequently, it is not shown as Australian Government revenue in other parts of this document. However, the tables in this statement show GST as taxation revenue and payments to the states as grant expenses.
As a result of the different treatments of GST related transactions, the fiscal balance, net operating balance and net worth estimates in this statement differ from those reported elsewhere in this document. This difference represents the effect of GST revenue accrued but not yet received and, therefore, not yet paid or payable to the states (as GST obligations to the states are on a cash basis).1 The GFS cash surplus/deficit is not affected and provides identical results under both treatments of GST receipts.
The general government sector fiscal balance and net worth include an allowance, through the contingency reserve, for the anticipated impact of Australian Equivalents to International Financial Reporting Standards. The Australian Government general government sector fiscal balance increases by $57 million in 2005-06 due to lower expenses with minor impacts in the forward years. Australian Government general
1 Table 3 in Statement 8 shows the difference in the net operating and fiscal balance estimates resulting from the two treatments. The change in expenses when moving between the two GFS presentations of the estimates is less than the change in revenue.

Statement 9: Government Finance Statistics Statements
9-3
government sector net worth reduces by around $1.3 billion in 2005-06 and the forward years.
Transactions between the Australian Government general government and public non-financial corporations are included in the relevant tables, but removed from the total non-financial public sector tables as they are transactions internal to that sector.
Public access communication assets, computer software and other intangibles are recorded at historic costs, as market value information, or suitable proxies for market value, are not readily observable. This affects the public non-financial corporations sector balance sheet, but does not affect the general government sector balance sheet.
Statement 8 provides reconciliations between key GFS aggregates and their Australian Accounting Standards counterparts.
In accordance with Accrual Uniform Presentation Framework requirements, this statement also contains an update of the Australian Government’s Loan Council Allocation.
Part 4: Financial Reporting Standards and Financial Statements
9-4
GOVERNMENT FINANCE STATISTICS STATEMENTS
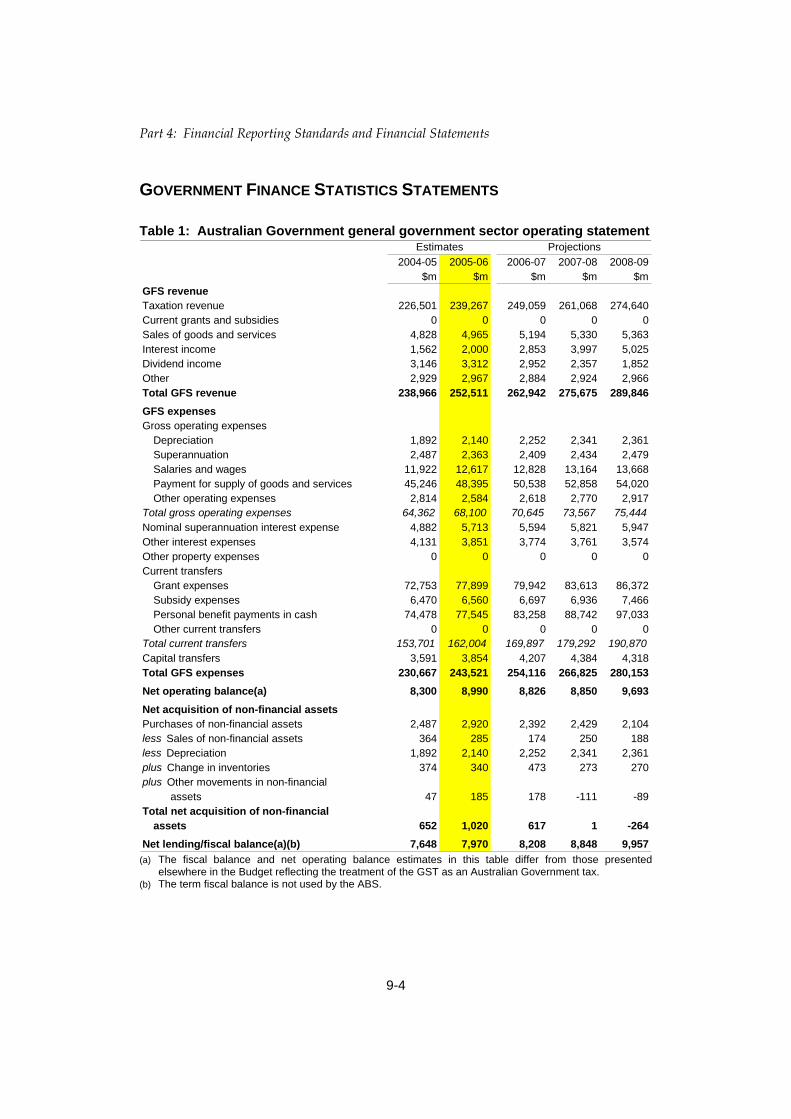
Table 1: Australian Government general government sector operating statement
2004-05 2005-06 2006-07 2007-08 2008-09$m $m $m $m $m
GFS revenueTaxation revenue 226,501 239,267 249,059 261,068 274,640Current grants and subsidies 0 0 0 0 0Sales of goods and services 4,828 4,965 5,194 5,330 5,363Interest income 1,562 2,000 2,853 3,997 5,025Dividend income 3,146 3,312 2,952 2,357 1,852Other 2,929 2,967 2,884 2,924 2,966Total GFS revenue 238,966 252,511 262,942 275,675 289,846GFS expensesGross operating expenses
Depreciation 1,892 2,140 2,252 2,341 2,361Superannuation 2,487 2,363 2,409 2,434 2,479Salaries and wages 11,922 12,617 12,828 13,164 13,668Payment for supply of goods and services 45,246 48,395 50,538 52,858 54,020Other operating expenses 2,814 2,584 2,618 2,770 2,917
Total gross operating expenses 64,362 68,100 70,645 73,567 75,444Nominal superannuation interest expense 4,882 5,713 5,594 5,821 5,947Other interest expenses 4,131 3,851 3,774 3,761 3,574Other property expenses 0 0 0 0 0Current transfers
Grant expenses 72,753 77,899 79,942 83,613 86,372Subsidy expenses 6,470 6,560 6,697 6,936 7,466Personal benefit payments in cash 74,478 77,545 83,258 88,742 97,033Other current transfers 0 0 0 0 0
Total current transfers 153,701 162,004 169,897 179,292 190,870Capital transfers 3,591 3,854 4,207 4,384 4,318Total GFS expenses 230,667 243,521 254,116 266,825 280,153Net operating balance(a) 8,300 8,990 8,826 8,850 9,693Net acquisition of non-financial assetsPurchases of non-financial assets 2,487 2,920 2,392 2,429 2,104less Sales of non-financial assets 364 285 174 250 188less Depreciation 1,892 2,140 2,252 2,341 2,361plus Change in inventories 374 340 473 273 270plus Other movements in non-financial
assets 47 185 178 -111 -89Total net acquisition of non-financial
assets 652 1,020 617 1 -264Net lending/fiscal balance(a)(b) 7,648 7,970 8,208 8,848 9,957
Estimates Projections
(a) The fiscal balance and net operating balance estimates in this table differ from those presented
elsewhere in the Budget reflecting the treatment of the GST as an Australian Government tax. (b) The term fiscal balance is not used by the ABS.
Statement 9: Government Finance Statistics Statements
9-5
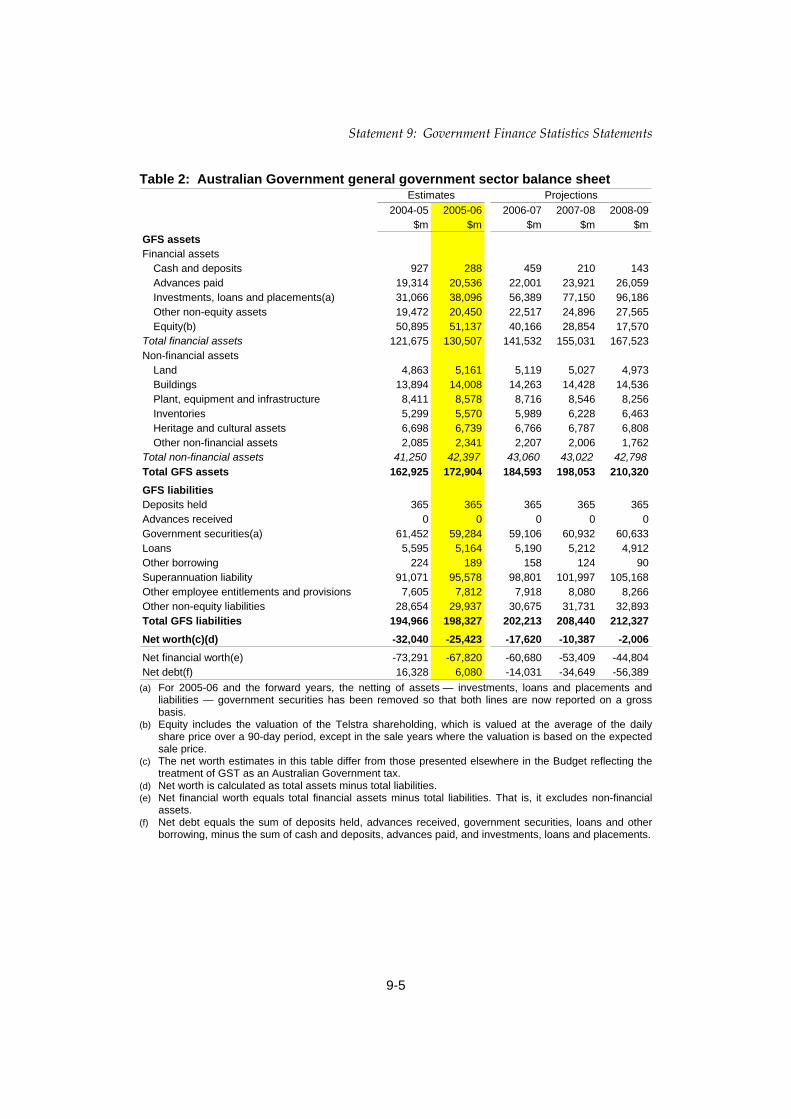
Table 2: Australian Government general government sector balance sheet
2004-05 2005-06 2006-07 2007-08 2008-09$m $m $m $m $m
GFS assetsFinancial assets
Cash and deposits 927 288 459 210 143Advances paid 19,314 20,536 22,001 23,921 26,059Investments, loans and placements(a) 31,066 38,096 56,389 77,150 96,186Other non-equity assets 19,472 20,450 22,517 24,896 27,565Equity(b) 50,895 51,137 40,166 28,854 17,570
Total financial assets 121,675 130,507 141,532 155,031 167,523Non-financial assets
Land 4,863 5,161 5,119 5,027 4,973Buildings 13,894 14,008 14,263 14,428 14,536Plant, equipment and infrastructure 8,411 8,578 8,716 8,546 8,256Inventories 5,299 5,570 5,989 6,228 6,463Heritage and cultural assets 6,698 6,739 6,766 6,787 6,808Other non-financial assets 2,085 2,341 2,207 2,006 1,762
Total non-financial assets 41,250 42,397 43,060 43,022 42,798Total GFS assets 162,925 172,904 184,593 198,053 210,320GFS liabilitiesDeposits held 365 365 365 365 365Advances received 0 0 0 0 0Government securities(a) 61,452 59,284 59,106 60,932 60,633Loans 5,595 5,164 5,190 5,212 4,912Other borrowing 224 189 158 124 90Superannuation liability 91,071 95,578 98,801 101,997 105,168Other employee entitlements and provisions 7,605 7,812 7,918 8,080 8,266Other non-equity liabilities 28,654 29,937 30,675 31,731 32,893Total GFS liabilities 194,966 198,327 202,213 208,440 212,327Net worth(c)(d) -32,040 -25,423 -17,620 -10,387 -2,006Net financial worth(e) -73,291 -67,820 -60,680 -53,409 -44,804Net debt(f) 16,328 6,080 -14,031 -34,649 -56,389
Estimates Projections
(a) For 2005-06 and the forward years, the netting of assets — investments, loans and placements and
liabilities — government securities has been removed so that both lines are now reported on a gross basis.
(b) Equity includes the valuation of the Telstra shareholding, which is valued at the average of the daily share price over a 90-day period, except in the sale years where the valuation is based on the expected sale price.
(c) The net worth estimates in this table differ from those presented elsewhere in the Budget reflecting the treatment of GST as an Australian Government tax.
(d) Net worth is calculated as total assets minus total liabilities. (e) Net financial worth equals total financial assets minus total liabilities. That is, it excludes non-financial
assets. (f) Net debt equals the sum of deposits held, advances received, government securities, loans and other
borrowing, minus the sum of cash and deposits, advances paid, and investments, loans and placements.
Part 4: Financial Reporting Standards and Financial Statements
9-6
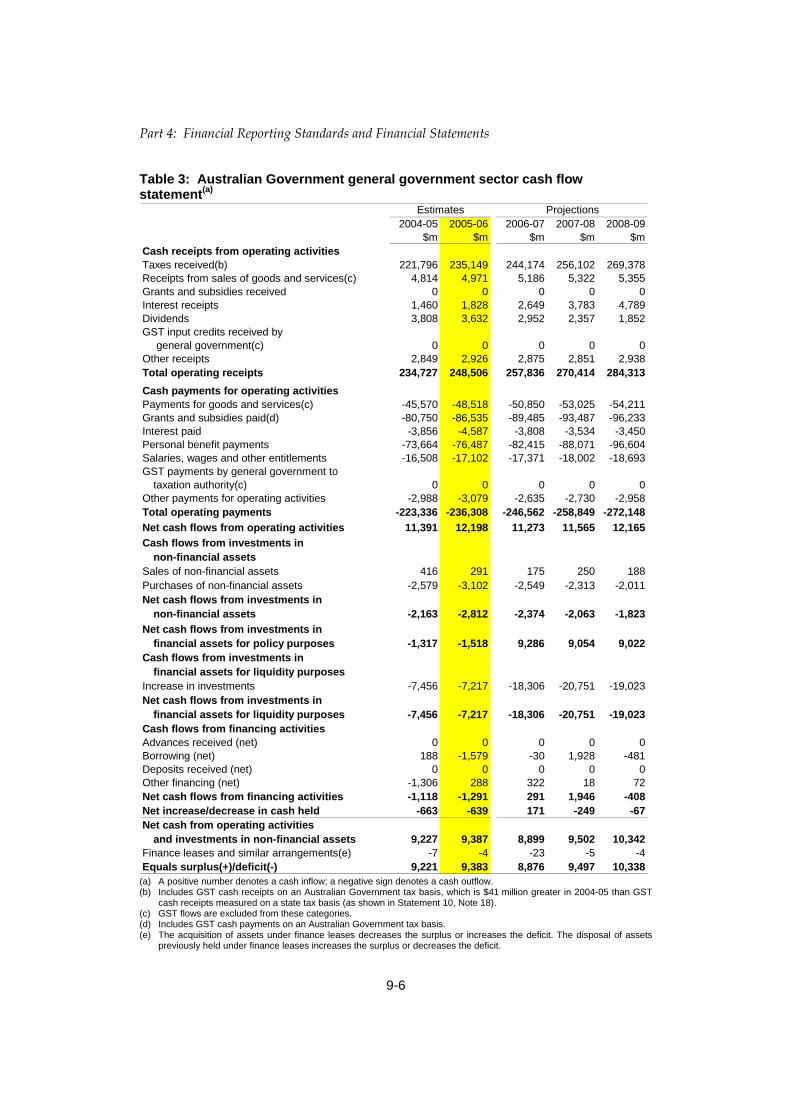
Table 3: Australian Government general government sector cash flow statement(a)
2004-05 2005-06 2006-07 2007-08 2008-09$m $m $m $m $m
Cash receipts from operating activitiesTaxes received(b) 221,796 235,149 244,174 256,102 269,378Receipts from sales of goods and services(c) 4,814 4,971 5,186 5,322 5,355Grants and subsidies received 0 0 0 0 0Interest receipts 1,460 1,828 2,649 3,783 4,789Dividends 3,808 3,632 2,952 2,357 1,852GST input credits received by
general government(c) 0 0 0 0 0Other receipts 2,849 2,926 2,875 2,851 2,938Total operating receipts 234,727 248,506 257,836 270,414 284,313Cash payments for operating activitiesPayments for goods and services(c) -45,570 -48,518 -50,850 -53,025 -54,211Grants and subsidies paid(d) -80,750 -86,535 -89,485 -93,487 -96,233Interest paid -3,856 -4,587 -3,808 -3,534 -3,450Personal benefit payments -73,664 -76,487 -82,415 -88,071 -96,604Salaries, wages and other entitlements -16,508 -17,102 -17,371 -18,002 -18,693GST payments by general government to
taxation authority(c) 0 0 0 0 0Other payments for operating activities -2,988 -3,079 -2,635 -2,730 -2,958Total operating payments -223,336 -236,308 -246,562 -258,849 -272,148Net cash flows from operating activities 11,391 12,198 11,273 11,565 12,165Cash flows from investments in
non-financial assetsSales of non-financial assets 416 291 175 250 188Purchases of non-financial assets -2,579 -3,102 -2,549 -2,313 -2,011Net cash flows from investments in
non-financial assets -2,163 -2,812 -2,374 -2,063 -1,823Net cash flows from investments in
financial assets for policy purposes -1,317 -1,518 9,286 9,054 9,022Cash flows from investments in
financial assets for liquidity purposesIncrease in investments -7,456 -7,217 -18,306 -20,751 -19,023Net cash flows from investments in
financial assets for liquidity purposes -7,456 -7,217 -18,306 -20,751 -19,023Cash flows from financing activitiesAdvances received (net) 0 0 0 0 0Borrowing (net) 188 -1,579 -30 1,928 -481Deposits received (net) 0 0 0 0 0Other financing (net) -1,306 288 322 18 72Net cash flows from financing activities -1,118 -1,291 291 1,946 -408Net increase/decrease in cash held -663 -639 171 -249 -67Net cash from operating activities
and investments in non-financial assets 9,227 9,387 8,899 9,502 10,342Finance leases and similar arrangements(e) -7 -4 -23 -5 -4Equals surplus(+)/deficit(-) 9,221 9,383 8,876 9,497 10,338
Estimates Projections
(a) A positive number denotes a cash inflow; a negative sign denotes a cash outflow. (b) Includes GST cash receipts on an Australian Government tax basis, which is $41 million greater in 2004-05 than GST
cash receipts measured on a state tax basis (as shown in Statement 10, Note 18). (c) GST flows are excluded from these categories. (d) Includes GST cash payments on an Australian Government tax basis. (e) The acquisition of assets under finance leases decreases the surplus or increases the deficit. The disposal of assets
previously held under finance leases increases the surplus or decreases the deficit.

Statement 9: Government Finance Statistics Statements
9-7
Table 4: Australian Government general government sector statement of other economic flows (reconciliation of net worth)
2004-05 2005-06 2006-07 2007-08 2008-09$m $m $m $m $m
Opening net worth -36,165 -32,040 -25,423 -17,620 -10,387Opening net worth adjustments(a) -1,741 0 0 0 0Adjusted opening net worth -37,906 -32,040 -25,423 -17,620 -10,387Change in net worth from operating
transactions 8,300 8,990 8,826 8,850 9,693Change in net worth from other
economic flowsRevaluation of equity(b) 1,301 261 322 -19 4Net writedowns of assets
(including bad and doubtful debts) -2,423 -1,737 -1,955 -2,018 -1,646Assets recognised for the first time 23 94 80 58 58Liabilities recognised for the first time 0 0 0 0 0Actuarial revaluations -937 0 0 0 0Net foreign exchange gains -384 0 0 0 0Net swap interest received 180 102 96 77 70Market valuation of debt -195 371 303 257 148Other economic revaluations(c) 2 -1,463 131 29 53
Total other economic flows -2,433 -2,373 -1,022 -1,616 -1,313Closing net worth -32,040 -25,423 -17,620 -10,387 -2,006
Estimates Projections
(a) Decrease in net worth arising from a change in recognition of family tax benefits and other expenses
from a cash to an accrual basis. (b) Revaluations of equity reflects changes in the market valuation of commercial entities, including a
change in the value of the Telstra shareholding which is valued at the average of the daily share price over a 90-day period, except in the sale years where the valuation is based on the expected sale price. This line also reflects any equity revaluations at the point of disposal or sale.
(c) Largely reflects revaluation of assets and liabilities and Australian Equivalents to International Financial Reporting Standards adjustments.

Part 4: Financial Reporting Standards and Financial Statements
9-8
Table 5: Australian Government public non-financial corporations operating statement
2004-05 2005-06$m $m
GFS revenueCurrent grants and subsidies 353 358Sales of goods and services 26,221 27,307Interest income 117 112Other 1 1Total GFS revenue 26,693 27,778GFS expensesGross operating expensesDepreciation 3,561 3,919Salaries, wages and other entitlements 5,810 5,957Other operating expenses 11,486 12,394Total gross operating expenses 20,857 22,270Interest expenses 322 466Other property expenses 1,674 2,095Current transfersTax expenses 2,071 2,055Other current transfers 0 0Total current transfers 2,071 2,055Capital transfers 0 0Total GFS expenses 24,924 26,886Net operating balance 1,769 892Net acquisition of non-financial assetsPurchases of non-financial assets 4,412 4,604less Sales of non-financial assets 159 51less Depreciation 3,561 3,919plus Change in inventories 24 43plus Other movements in non-financial assets -420 1Total net acquisition of non-financial assets 295 679Net lending/fiscal balance(a) 1,475 213
Estimates
(a) The term fiscal balance is not used by the ABS.
Statement 9: Government Finance Statistics Statements
9-9
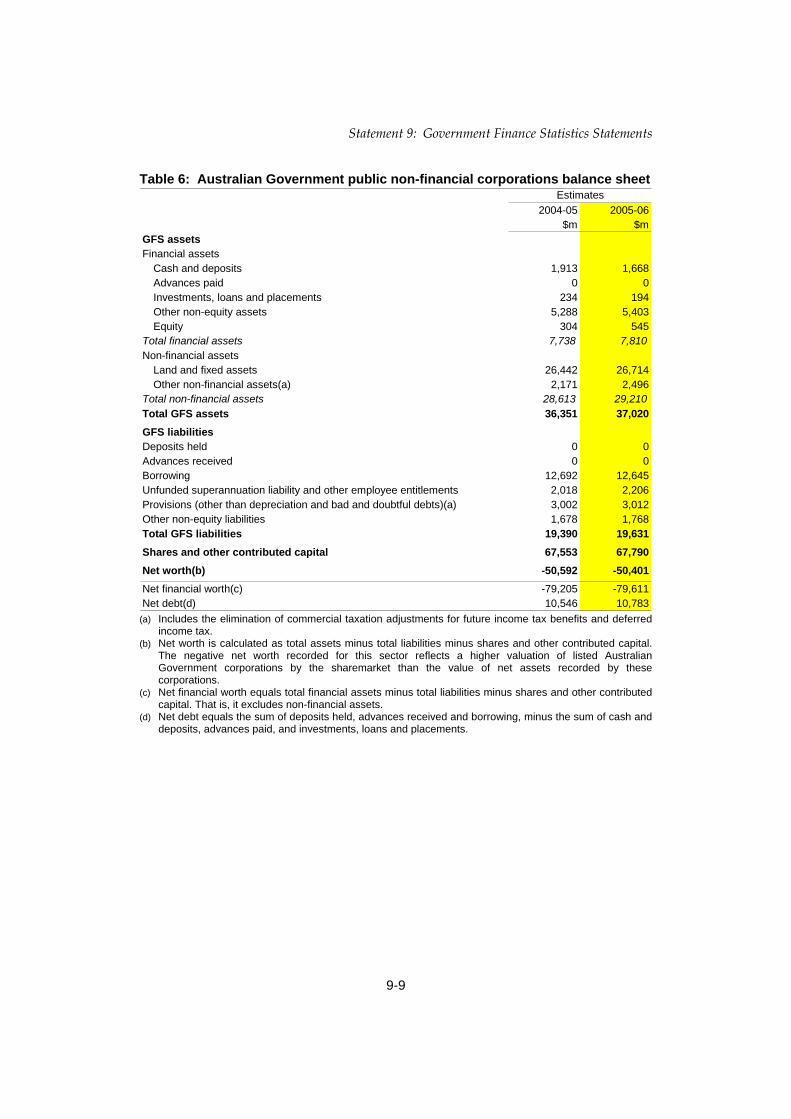
Table 6: Australian Government public non-financial corporations balance sheet
2004-05 2005-06$m $m
GFS assetsFinancial assets
Cash and deposits 1,913 1,668Advances paid 0 0Investments, loans and placements 234 194Other non-equity assets 5,288 5,403Equity 304 545
Total financial assets 7,738 7,810Non-financial assets
Land and fixed assets 26,442 26,714Other non-financial assets(a) 2,171 2,496
Total non-financial assets 28,613 29,210Total GFS assets 36,351 37,020GFS liabilitiesDeposits held 0 0Advances received 0 0Borrowing 12,692 12,645Unfunded superannuation liability and other employee entitlements 2,018 2,206Provisions (other than depreciation and bad and doubtful debts)(a) 3,002 3,012Other non-equity liabilities 1,678 1,768Total GFS liabilities 19,390 19,631Shares and other contributed capital 67,553 67,790Net worth(b) -50,592 -50,401Net financial worth(c) -79,205 -79,611Net debt(d) 10,546 10,783
Estimates
(a) Includes the elimination of commercial taxation adjustments for future income tax benefits and deferred
income tax. (b) Net worth is calculated as total assets minus total liabilities minus shares and other contributed capital.
The negative net worth recorded for this sector reflects a higher valuation of listed Australian Government corporations by the sharemarket than the value of net assets recorded by these corporations.
(c) Net financial worth equals total financial assets minus total liabilities minus shares and other contributed capital. That is, it excludes non-financial assets.
(d) Net debt equals the sum of deposits held, advances received and borrowing, minus the sum of cash and deposits, advances paid, and investments, loans and placements.
Part 4: Financial Reporting Standards and Financial Statements
9-10
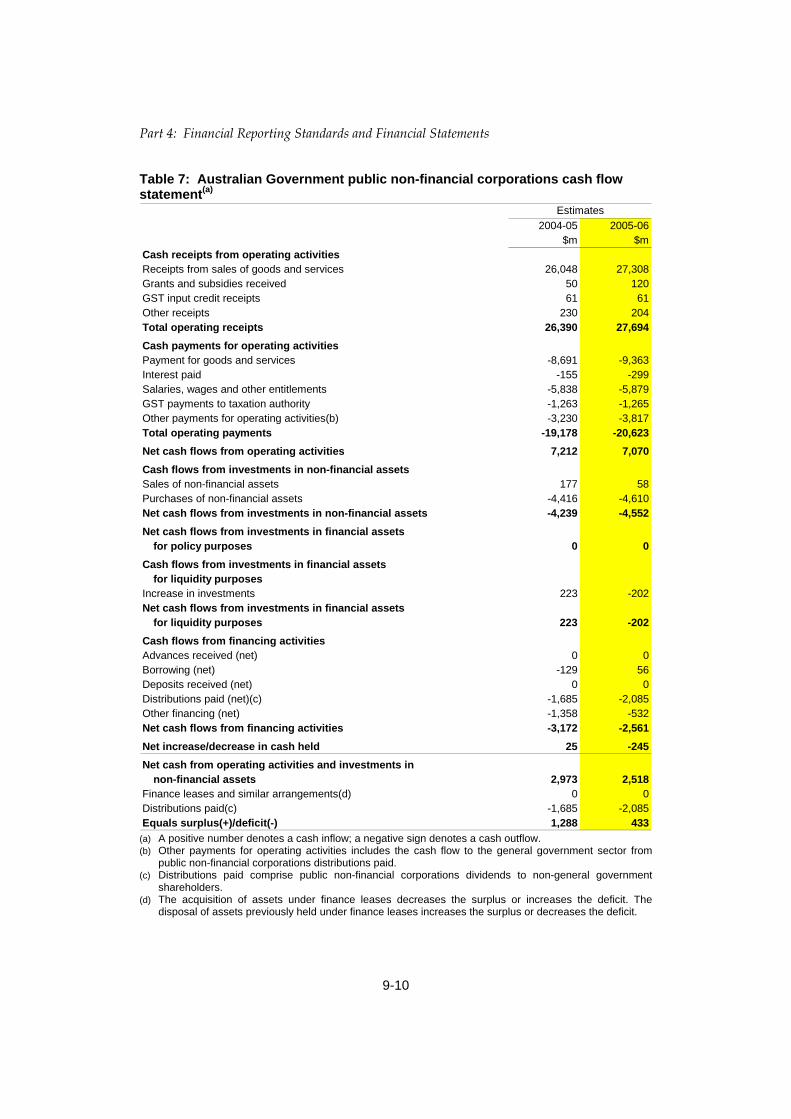
Table 7: Australian Government public non-financial corporations cash flow statement(a)
2004-05 2005-06$m $m
Cash receipts from operating activitiesReceipts from sales of goods and services 26,048 27,308Grants and subsidies received 50 120GST input credit receipts 61 61Other receipts 230 204Total operating receipts 26,390 27,694Cash payments for operating activitiesPayment for goods and services -8,691 -9,363Interest paid -155 -299Salaries, wages and other entitlements -5,838 -5,879GST payments to taxation authority -1,263 -1,265Other payments for operating activities(b) -3,230 -3,817Total operating payments -19,178 -20,623Net cash flows from operating activities 7,212 7,070Cash flows from investments in non-financial assetsSales of non-financial assets 177 58Purchases of non-financial assets -4,416 -4,610Net cash flows from investments in non-financial assets -4,239 -4,552Net cash flows from investments in financial assets
for policy purposes 0 0Cash flows from investments in financial assets
for liquidity purposesIncrease in investments 223 -202Net cash flows from investments in financial assets
for liquidity purposes 223 -202Cash flows from financing activitiesAdvances received (net) 0 0Borrowing (net) -129 56Deposits received (net) 0 0Distributions paid (net)(c) -1,685 -2,085Other financing (net) -1,358 -532Net cash flows from financing activities -3,172 -2,561Net increase/decrease in cash held 25 -245Net cash from operating activities and investments in
non-financial assets 2,973 2,518Finance leases and similar arrangements(d) 0 0Distributions paid(c) -1,685 -2,085Equals surplus(+)/deficit(-) 1,288 433
Estimates
(a) A positive number denotes a cash inflow; a negative sign denotes a cash outflow. (b) Other payments for operating activities includes the cash flow to the general government sector from
public non-financial corporations distributions paid. (c) Distributions paid comprise public non-financial corporations dividends to non-general government
shareholders. (d) The acquisition of assets under finance leases decreases the surplus or increases the deficit. The
disposal of assets previously held under finance leases increases the surplus or decreases the deficit.

Statement 9: Government Finance Statistics Statements
9-11
Table 8: Australian Government total non-financial public sector operating statement
2004-05 2005-06$m $m
GFS revenueTaxation revenue 224,431 237,212Current grants and subsidies 0 0Sales of goods and services 30,513 31,667Interest income 1,679 2,112Dividend income 1,143 819Other 2,930 2,968Total GFS revenue 260,695 274,778GFS expensesGross operating expenses
Depreciation 5,453 6,059Superannuation 2,540 2,454Salaries and wages 17,732 18,574Payment for supply of goods and services 53,878 57,331Other operating expenses 3,076 2,854
Total gross operating expenses 82,679 87,272Nominal superannuation interest expense 4,882 5,713Other interest expenses 4,454 4,317Other property expenses 1,674 2,095Current transfers
Grant expenses 72,753 77,899Subsidy expenses 6,117 6,201Personal benefit payments in cash 74,478 77,545Other current transfers 0 0
Total current transfers 153,348 161,646Capital transfers 3,591 3,854Total GFS expenses 250,627 264,896Net operating balance(a) 10,069 9,882Net acquisition of non-financial assets Purchases of non-financial assets 6,899 7,524less Sales of non-financial assets 523 336less Depreciation 5,453 6,059plus Change in inventories 397 384plus Other movements in non-financial assets -373 186Total net acquisition of non-financial assets 946 1,699Net lending/fiscal balance(a)(b) 9,123 8,183
Estimates
(a) The fiscal balance and net operating balance estimates in this table differ from those presented
elsewhere in the Budget reflecting the treatment of the GST as an Australian Government tax. (b) The term fiscal balance is not used by the ABS.

Part 4: Financial Reporting Standards and Financial Statements
9-12
Table 9: Australian Government total non-financial public sector balance sheet
2004-05 2005-06$m $m
GFS assetsFinancial assets
Cash and deposits 2,840 1,956Advances paid 19,314 20,536Investments, loans and placements 31,300 38,290Other non-equity assets 24,745 25,837Equity 14,663 14,909
Total financial assets 92,863 101,529Non-financial assets
Land and fixed assets 65,607 66,769Other non-financial assets 4,256 4,837
Total non-financial assets 69,863 71,607Total GFS assets 162,726 173,136GFS liabilitiesDeposits held 365 365Advances received 0 0Government securities 61,452 59,284Loans 5,595 5,164Other borrowing 12,916 12,834Unfunded superannuation liability and other employee entitlements 100,694 105,595Other provisions 6,868 7,019Other non-equity liabilities 26,451 27,682Total GFS liabilities 214,341 217,943Shares and other contributed capital 31,017 31,017Net worth(a) -82,633 -75,824Net financial worth(b) -152,496 -147,431Net debt(c) 26,874 16,863
Estimates
(a) Net worth is calculated as total assets minus total liabilities minus shares and other contributed capital.
The negative net worth recorded for this sector partly reflects a higher valuation of listed Australian Government corporations by the sharemarket than the value of net assets recorded by these corporations.
(b) Net financial worth equals total financial assets minus total liabilities minus shares and other contributed capital. That is, it excludes non-financial assets.
(c) Net debt equals the sum of deposits held, advances received, government securities, loans and other borrowing, minus the sum of cash and deposits, advances paid, and investments, loans and placements.

Statement 9: Government Finance Statistics Statements
9-13
Table 10: Australian Government total non-financial public sector cash flow statement(a)
2004-05 2005-06$m $m
Cash receipts from operating activitiesTaxes received 218,469 231,838Receipts from sales of goods and services(b) 30,846 32,262Grants and subsidies received 0 0Interest receipts 1,578 1,940Dividends 1,805 1,139GST input credit receipts(b) 0 0Other receipts 2,961 3,019Total operating receipts 255,659 270,197Cash payments for operating activitiesPayments for goods and services(b) -54,192 -57,812Grants and subsidies paid -80,700 -86,414Interest paid -4,011 -4,886Personal benefit payments -73,664 -76,487Salaries, wages and other entitlements -22,345 -22,980GST payments to taxation authority(b) 0 0Other payments for operating activities -2,144 -2,348Total operating payments -237,056 -250,929Net cash flows from operating activities 18,603 19,269Cash flows from investments in non-financial assetsSales of non-financial assets 593 349Purchases of non-financial assets -6,996 -7,712Net cash flows from investments in non-financial assets -6,402 -7,364Net cash flows from investments in financial assets
for policy purposes -1,317 -1,518Cash flows from investments in financial assets
for liquidity purposesIncrease in investments -7,233 -7,419Net cash flows from investments in financial assets
for liquidity purposes -7,233 -7,419Cash flows from financing activitiesAdvances received (net) 0 0Borrowing (net) 59 -1,523Deposits received (net) 0 0Distributions paid (net)(c) -1,685 -2,085Other financing (net) -2,664 -244Net cash flows from financing activities -4,290 -3,852Net increase/decrease in cash held -638 -884
Net cash from operating activities and investments in non-financial assets 12,201 11,905
Finance leases and similar arrangements(d) -7 -4Distributions paid(c) -1,685 -2,085Equals surplus(+)/deficit(-) 10,509 9,815
Estimates
(a) A positive number denotes a cash inflow; a negative sign denotes a cash outflow. (b) GST flows are excluded from these categories. (c) Distributions paid comprise public non-financial corporations dividends to non-general government shareholders. (d) The acquisition of assets under finance leases decreases the surplus or increases the deficit. The disposal of assets
previously held under finance leases increases the surplus or decreases the deficit.

Part 4: Financial Reporting Standards and Financial Statements
9-14
Table 11: Australian Government general government sector taxation revenue by source
2004-05 2005-06$m $m
Taxes on income, profits and capital gainsIncome and capital gains levied on individuals 109,220 112,820Income and capital gains levied on enterprises 47,160 54,460Income taxes levied on non-residents 0 0
Total taxes on income, profits and capital gains 156,380 167,280Taxes on employers' payroll and labour force 3,297 3,580Taxes on property 14 14
Taxes on the provision of goods and servicesSales/goods and services tax 37,480 39,230Excises and levies 22,814 23,284Taxes on international trade 5,714 5,071Other 0 0
Total taxes on the provision of goods and services 66,008 67,585Taxes on use of goods and performance of activities 803 808Total GFS taxation revenue 226,501 239,267
Estimates
Table 12: Australian Government purchases of non-financial assets by function
2004-05 2005-06 2006-07 2007-08 2008-09$m $m $m $m $m
General public services 831 1,029 680 875 567Defence 615 1,202 589 654 1,000Public order and safety 224 190 169 150 166Education 16 12 12 15 12Health 103 99 88 83 83Social security and welfare 219 285 254 215 171Housing and community amenities 8 36 50 44 41Recreation and culture 263 4 260 217 212Fuel and energy 3 4 4 3 4Agriculture, forestry and fishing 27 32 25 33 33Mining, manufacturing and construction 30 37 38 35 29Transport and communications -65 -206 38 36 36Other economic affairs 210 184 198 174 182Other purposes 5 14 -12 -107 -431
General government purchases of non-financial assets 2,487 2,920 2,392 2,429 2,104
Estimates Projections

Statement 9: Government Finance Statistics Statements
9-15
APPENDIX A: AUSTRALIAN LOAN COUNCIL ALLOCATION
Under Loan Council arrangements, every year the Australian Government and each state and territory nominate a Loan Council Allocation. A jurisdiction’s Loan Council Allocation incorporates:
• the estimated non-financial public sector underlying cash balance (made up from the general government and public non-financial corporations sector balances);
• net cash flows from investments in financial assets for policy purposes; and
• memorandum items, which involve transactions that are not formally borrowings but nevertheless have many of the characteristics of borrowings.
Loan Council Allocation nominations are considered by the Loan Council, having regard to each jurisdiction’s fiscal position and reasonable infrastructure requirements, as well as the macroeconomic implications of the aggregate figure.
As set out in Table 13, the Australian Government’s 2005-06 Loan Council Allocation Budget update is a $8,432 million surplus. This compares with the Australian Government’s nominated, and Loan Council endorsed, Loan Council Allocation surplus of $5,972 million.
Table 13: Australian Government’s Loan Council Allocation Budget update for 2005-06
2005-06 2005-06 Nomination Budget Estimate
$m $mGeneral government sector cash deficit(+)/surplus(-) -4,459 -9,383Public non-financial corporations sector cash deficit(+)/surplus(-) -1,914 -433Non-financial public sector cash deficit(+)/surplus(-) -6,374 -9,815less Net cash flows from investments
in financial assets for policy purposes(a) -1,441 -1,518plus Memorandum items(b) -1,039 -135Loan Council Allocation -5,972 -8,432
(a) Such transactions involve the transfer or exchange of a financial asset and are not included within the cash deficit/surplus. However, the cash flow from investments in financial assets for policy purposes has implications for a government’s call on financial markets.
(b) For the Australian Government, memorandum items include the change in net present value (NPV) of operating leases (with NPV greater than $5 million) and over-funding of superannuation.

10-1
STATEMENT 10: AUSTRALIAN ACCOUNTING STANDARDS FINANCIAL STATEMENTS
This statement provides financial tables prepared on an accrual basis in accordance with applicable Australian Accounting Standards (AAS), including Australian Accounting Standard No. 31 Financial Reporting by Governments, except where departures from the standards are identified in Note 1.
A reconciliation between the Australian Government’s general government AAS 31 and Government Finance Statistics (GFS) revenue, expenses and operating results is provided in Statement 8.
Australian Accounting Standards Financial Statements.....................................10-2
Notes to the AAS Financial Statements.................................................................10-5
Appendix A: Additional agency statistics ..........................................................10-15
10-2
STATEMENT 10: AUSTRALIAN ACCOUNTING STANDARDS FINANCIAL STATEMENTS
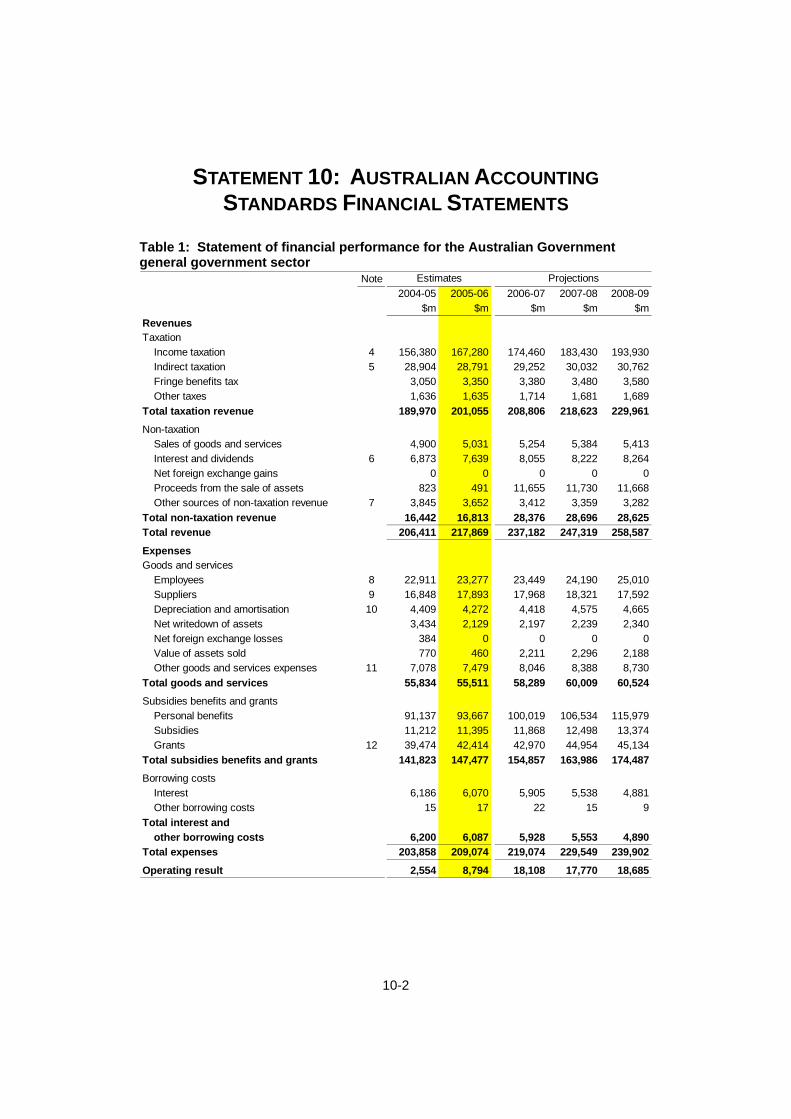
Table 1: Statement of financial performance for the Australian Government general government sector
Note2004-05 2005-06 2006-07 2007-08 2008-09
$m $m $m $m $mRevenuesTaxation
Income taxation 4 156,380 167,280 174,460 183,430 193,930Indirect taxation 5 28,904 28,791 29,252 30,032 30,762Fringe benefits tax 3,050 3,350 3,380 3,480 3,580Other taxes 1,636 1,635 1,714 1,681 1,689
Total taxation revenue 189,970 201,055 208,806 218,623 229,961Non-taxation
Sales of goods and services 4,900 5,031 5,254 5,384 5,413Interest and dividends 6 6,873 7,639 8,055 8,222 8,264Net foreign exchange gains 0 0 0 0 0Proceeds from the sale of assets 823 491 11,655 11,730 11,668Other sources of non-taxation revenue 7 3,845 3,652 3,412 3,359 3,282
Total non-taxation revenue 16,442 16,813 28,376 28,696 28,625Total revenue 206,411 217,869 237,182 247,319 258,587
ExpensesGoods and services
Employees 8 22,911 23,277 23,449 24,190 25,010Suppliers 9 16,848 17,893 17,968 18,321 17,592Depreciation and amortisation 10 4,409 4,272 4,418 4,575 4,665Net writedown of assets 3,434 2,129 2,197 2,239 2,340Net foreign exchange losses 384 0 0 0 0Value of assets sold 770 460 2,211 2,296 2,188Other goods and services expenses 11 7,078 7,479 8,046 8,388 8,730
Total goods and services 55,834 55,511 58,289 60,009 60,524Subsidies benefits and grants
Personal benefits 91,137 93,667 100,019 106,534 115,979Subsidies 11,212 11,395 11,868 12,498 13,374Grants 12 39,474 42,414 42,970 44,954 45,134
Total subsidies benefits and grants 141,823 147,477 154,857 163,986 174,487Borrowing costs
Interest 6,186 6,070 5,905 5,538 4,881Other borrowing costs 15 17 22 15 9
Total interest and other borrowing costs 6,200 6,087 5,928 5,553 4,890
Total expenses 203,858 209,074 219,074 229,549 239,902
Operating result 2,554 8,794 18,108 17,770 18,685
Estimates Projections
Statement 10: Australian Accounting Standards Financial Statements
10-3
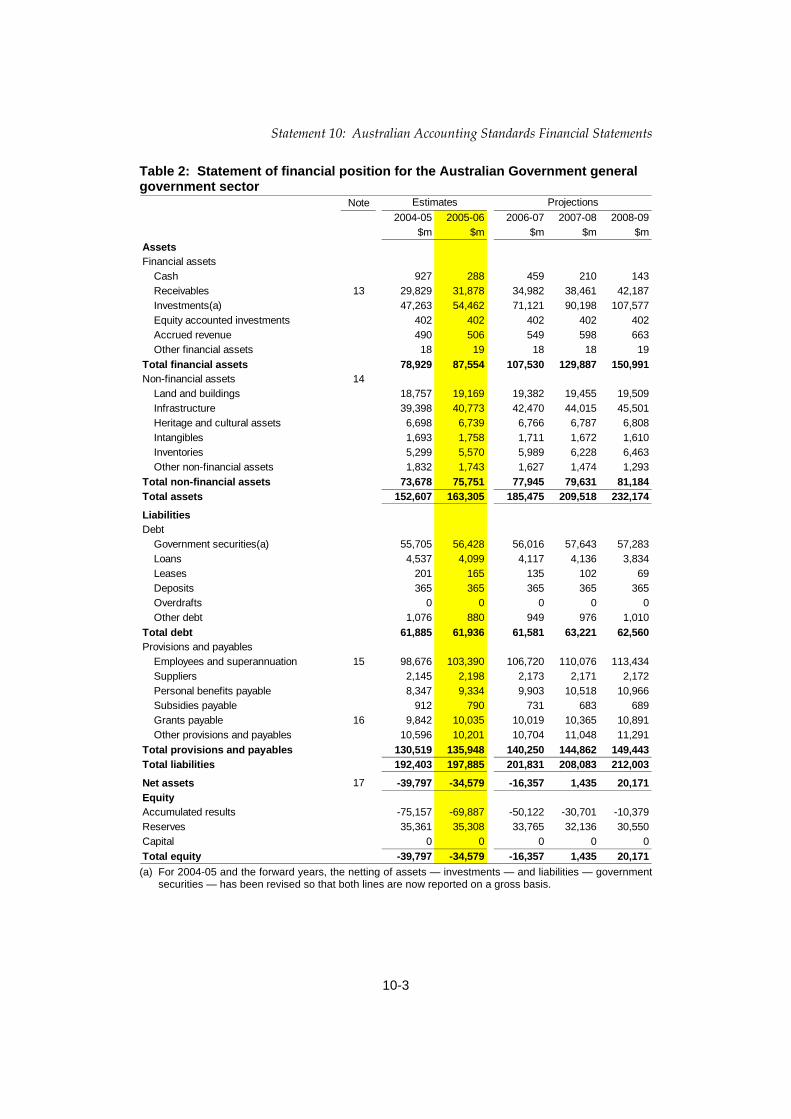
Table 2: Statement of financial position for the Australian Government general government sector
Note2004-05 2005-06 2006-07 2007-08 2008-09
$m $m $m $m $mAssetsFinancial assets
Cash 927 288 459 210 143Receivables 13 29,829 31,878 34,982 38,461 42,187Investments(a) 47,263 54,462 71,121 90,198 107,577Equity accounted investments 402 402 402 402 402Accrued revenue 490 506 549 598 663Other financial assets 18 19 18 18 19
Total financial assets 78,929 87,554 107,530 129,887 150,991Non-financial assets 14
Land and buildings 18,757 19,169 19,382 19,455 19,509Infrastructure 39,398 40,773 42,470 44,015 45,501Heritage and cultural assets 6,698 6,739 6,766 6,787 6,808Intangibles 1,693 1,758 1,711 1,672 1,610Inventories 5,299 5,570 5,989 6,228 6,463Other non-financial assets 1,832 1,743 1,627 1,474 1,293
Total non-financial assets 73,678 75,751 77,945 79,631 81,184Total assets 152,607 163,305 185,475 209,518 232,174
LiabilitiesDebt
Government securities(a) 55,705 56,428 56,016 57,643 57,283Loans 4,537 4,099 4,117 4,136 3,834Leases 201 165 135 102 69Deposits 365 365 365 365 365Overdrafts 0 0 0 0 0Other debt 1,076 880 949 976 1,010
Total debt 61,885 61,936 61,581 63,221 62,560Provisions and payables
Employees and superannuation 15 98,676 103,390 106,720 110,076 113,434Suppliers 2,145 2,198 2,173 2,171 2,172Personal benefits payable 8,347 9,334 9,903 10,518 10,966Subsidies payable 912 790 731 683 689Grants payable 16 9,842 10,035 10,019 10,365 10,891Other provisions and payables 10,596 10,201 10,704 11,048 11,291
Total provisions and payables 130,519 135,948 140,250 144,862 149,443Total liabilities 192,403 197,885 201,831 208,083 212,003
Net assets 17 -39,797 -34,579 -16,357 1,435 20,171EquityAccumulated results -75,157 -69,887 -50,122 -30,701 -10,379Reserves 35,361 35,308 33,765 32,136 30,550Capital 0 0 0 0 0Total equity -39,797 -34,579 -16,357 1,435 20,171
Estimates Projections
(a) For 2004-05 and the forward years, the netting of assets — investments — and liabilities — government
securities — has been revised so that both lines are now reported on a gross basis.

Part 4: Financial Reporting Standards and Financial Statements
10-4
Table 3: Statement of cash flows for the Australian Government general government sector
Note2004-05 2005-06 2006-07 2007-08 2008-09
$m $m $m $m $mOperating activitiesCash received
Taxation 18 186,133 197,763 204,915 214,727 225,845Sales of goods and services 5,087 5,231 5,445 5,581 5,614Interest 3,537 4,147 4,921 5,753 6,252Dividends 3,808 3,632 2,952 2,357 1,852GST input credit receipts 2,908 2,844 2,882 2,976 3,018Other 2,931 2,971 2,875 2,851 2,938
Total operating cash received 204,405 216,588 223,988 234,244 245,520Cash used
Payments to employees 19,496 19,617 20,006 20,731 21,551Payments to suppliers 20,255 21,054 21,342 21,581 20,951Subsidies paid 10,127 10,906 11,325 11,944 12,766Personal benefits 88,867 92,610 99,176 105,863 115,550Grant payments 38,352 41,922 42,924 44,582 44,587Interest and other financing costs 5,995 6,832 5,938 5,657 5,043GST payments to taxation authority 120 120 122 123 124Other 6,859 7,942 7,943 8,352 8,661
Total operating cash used 190,072 201,005 208,776 218,834 229,233Net cash from operating activities 14,333 15,583 15,212 15,410 16,287Investing activitiesCash received
Proceeds from asset sales program 0 0 11,280 11,280 11,280Proceeds from sales of property,
plant and equipment and intangibles 422 291 175 250 188Net loans, advances and HECS 0 0 0 0 0Other net investing cash received 401 200 200 200 200
Total investing cash received 823 491 11,655 11,730 11,668Cash used
Purchase of property, plant and equipment and intangibles 5,652 6,506 6,327 6,301 6,122
Net loans, advances and HECS 1,135 1,365 1,831 2,062 2,141Other net investing cash paid 7,854 7,422 18,687 21,126 19,380
Total investing cash used 14,640 15,293 26,846 29,488 27,643Net cash from investing activities -13,818 -14,802 -15,191 -17,758 -15,976Financing activities Cash received
Net cash received from currency issues 0 0 0 0 0
Other 0 199 233 209 139Total financing cash received 0 199 233 209 139Cash used
Net repayments of borrowings -188 1,579 30 -1,928 481Other 1,366 40 53 38 37
Total financing cash used 1,178 1,619 83 -1,890 518Net cash from financing activities -1,178 -1,420 150 2,099 -379Net increase/decrease in cash held 3 -663 -639 171 -249 -67
Estimates Projections
Statement 10: Australian Accounting Standards Financial Statements
10-5
NOTES TO THE AAS FINANCIAL STATEMENTS
Note 1: External reporting standards and accounting policies
The Charter of Budget Honesty Act 1998 requires that the budget be based on external reporting standards and that departures from applicable external reporting standards be identified.
The financial statements included in this statement have been prepared on an accrual basis in accordance with applicable Australian Accounting Standards (AAS), including AAS31 Financial Reporting by Governments (AAS31).
AAS requires governments to prepare accrual based general purpose financial reports. This means that assets, liabilities, revenues and expenses are recorded in financial statements when transactions have an economic impact on the government, rather than when the cash flow associated with these transactions occurs. Consistent with AAS, a statement of financial performance, a statement of financial position and a statement of cash flows have been prepared for the budget year and the three forward years.
AAS will change from 2005-06, with the introduction of Australian Equivalents to International Financial Reporting Standards (AEIFRS). The tables in this Statement are presented on the basis of Australian Accounting Standards as at the date of preparation of the Budget. However, the amounts presented in these financial statements have been adjusted to include the material, reliably estimable impacts from the application of AEIFRS.
The accounting policies in this statement are generally consistent with the requirements of AAS. While the scope for financial reporting recommended in AAS 31 is the whole of government (that is, the Australian Government public sector), in accordance with the Charter of Budget Honesty Act 1998, the presentation covers the general government sector only. This statement includes notes showing disaggregated information.
AAS would suggest the gross amount of goods and services tax (GST) be included in the Australian Government’s financial statements. However, under the Intergovernmental Agreement on the Reform of Commonwealth-State Financial Relations, GST is collected by the Australian Taxation Office as an agent for the states and territories (the states), and appropriated to the states. Therefore, accrued GST revenues and associated payments to the states are not recorded in the financial statements.

Part 4: Financial Reporting Standards and Financial Statements
10-6
Note 2: Impacts of Australian Equivalents to International Financial Reporting Standards
The Financial Reporting Council has issued a strategic direction requiring reporting entities in Australia to adopt international accounting standards for reporting periods beginning on or after 1 January 2005. This will involve replacing relevant existing standards with Australian Equivalents to International Financial Reporting Standards (AEIFRS).
The Australian Accounting Standards Board (AASB) has issued the full suite of standards that will apply under AEIFRS including AAS 31 Financial Reporting by Governments.
Material estimated impacts on and movements in these financial statements, as if prepared under AEIFRS, are detailed below.1 The impacts are largely the result of estimating the impact of applying AASB 116 Property, Plant and Equipment, AASB 119 Employee Benefits, AASB 138 Intangible Assets, AASB 139 Financial Instruments: Recognition and Measurement, and AASB 140 Investment Properties.
The estimated impacts on the Statement of Financial Performance arising from the application of AEIFRS suggest positive impacts to the operating result of $435 million in 2005-06, $320 million in 2006-07, $327 million in 2007-08, and $218 million in 2008-09.
The estimated impacts on the Statement of Financial Position arising from the application of AEIFRS to net assets indicate a negative movement in net assets of $2.93 billion in 2005-06, reducing to a negative movement of $2.15 billion by 2008-09.
There are no cash flow impacts arising from the application of AEIFRS.
The material components of the impacts on these statements are disclosed below.
AASB 116 Property, Plant and Equipment requires that the cost of an item of property, plant or equipment include an estimate of the costs of dismantling and removing the asset, and restoring the site on which the asset was situated. AASB 116 requires these costs to be capitalised into the value of the respective assets and an associated provision established.
The yearly impacts on depreciation, borrowing costs and suppliers expenses resulting from applying AASB 116 are a decrease to operating results of $36.1 million in 2005-06, $30.2 million in 2006-07, $26.7 million in 2007-08 and $25.8 million in 2008-09. The cumulative impact on land and buildings, infrastructure, plant and equipment, and provisions result in a negative movement in net assets of $26.2 million in 2005-06, $14.2 million in 2006-07, $13.7 million in 2007-08 and $15.3 million in 2008-09.
1 These impacts do not include those relating to the Department of Defence, as reliable estimates were not available for the preparation of the 2005-06 Budget estimates.
Statement 10: Australian Accounting Standards Financial Statements
10-7
AASB 119 Employee Benefits will require changes in the measurement and recognition of employee annual leave entitlements and superannuation benefits.
The yearly impacts on employee expenses and borrowing costs of applying AASB 119 result in an increase to operating results of $58 million in 2005-06, $2 million in 2006-07, $55 million in 2007-08 and $56 million in 2008-09. The cumulative impact on employee provisions results in a negative movement in net assets of $1.03 billion in 2005-06, $1.03 billion in 2006-07, $0.98 billion in 2007-08 and $0.92 billion in 2008-09.
AASB 138 Intangible Assets does not permit intangibles to be measured at valuation unless there is an active market for such an asset. Where intangibles are recorded at valuation, Australian Government entities will derecognise the valuation component of the carrying amount of these assets on adoption of the AEIFRS. These impacts mainly relate to internally developed software.
The yearly impacts on depreciation and amortisation expense of applying AASB 138, result in an increase to operating results of $13 million in 2005-06, $10 million in 2006-07, $8 million in 2007-08 and $7 million in 2008-09. The cumulative impacts on intangible assets result in a negative movement in net assets of $49 million in 2005-06, $39 million in 2006-07, $31 million in 2007-08 and $23 million in 2008-09.
AASB 139 Financial Instruments: Recognition and Measurement states that when a financial asset or financial liability is recognised initially, an entity shall measure it at its fair value plus, in the case of a financial asset or financial liability not at fair value through profit or loss, transaction costs that are directly attributable to the acquisition or issue of the financial asset or financial liability.
The yearly impacts on gains of applying AASB 139 increases operating results by $371 million in 2005-06, $303 million in 2006-07, $257 million in 2007-08 and $148 million in 2008-09. The cumulative impacts on Government securities and payables result in a negative movement in net assets of $2.04 billion in 2005-06, $1.68 billion in 2006-07, $1.39 billion in 2007-08 and $1.22 billion in 2008-09.
AASB 140 Investment Property requires investment properties to be separately reported, with all movements to the assets fair value recognised in the operating result. Investment properties held at fair value will not be depreciated.
The yearly impacts on gains and depreciation expense of applying AASB 140 increases operating results by $34 million in 2005-06, $36 million in 2006-07, $37 million in 2007-08 and $37 million in 2008-09. The cumulative impacts on land and buildings and asset reserves result in a negative movement in net assets of $205 million in 2005-06, $234 million in 2006-07, $263 million in 2007-08 and $293 million in 2008-09.

Part 4: Financial Reporting Standards and Financial Statements
10-8
Note 3: Reconciliation of cash
2004-05 2005-06 2006-07 2007-08 2008-09$m $m $m $m $m
Operating result (revenues less expenses) 2,554 8,794 18,108 17,770 18,685less Revenues not providing cash
Foreign exchange gains 0 0 0 0 0 Gains from asset sales programme 0 0 9,439 9,421 9,472 Gains from sale of assets 53 31 4 13 8 Other 1,005 891 812 778 690
Total revenues not providing cash 1,058 922 10,256 10,212 10,170plus Expenses not requiring cash
Increase/(decrease) in employee entitlements 3,536 3,616 3,330 3,357 3,358 Depreciation/amortisation expense 4,409 4,272 4,418 4,575 4,665 Provision for bad and doubtful debts 384 486 556 610 648 Provision for diminution in value of assets 837 96 76 56 53 Losses from asset sales programme 0 0 0 0 0 Losses from sale of assets 0 0 0 0 0 Foreign exchange losses 384 0 0 0 0 Other 3 -54 15 31 -13
Total expenses not requiring cash 9,553 8,417 8,395 8,630 8,711plus Cash provided by working capital items
Decrease in inventories 0 0 0 0 0 Decrease in receivables 0 0 0 0 0 Decrease in other financial assets 0 0 0 46 10 Decrease in other non-financial assets 329 321 29 0 0 Increase in benefits subsidies and grants payable 3,921 1,220 587 987 1,001 Increase in suppliers' liabilities 0 8 0 0 0 Increase in other provisions and payables 289 0 231 20 8
Total cash provided by working capital items 4,539 1,548 847 1,052 1,020less Cash used by working capital items
Increase in inventories 373 164 351 195 199 Increase in receivables 670 769 1,424 1,577 1,759 Increase in other financial assets 51 30 23 0 0 Increase in other non-financial assets 0 0 0 10 1 Decrease in benefits subsidies and grants payable 0 122 59 48 0 Decrease in other provisions and payables 0 1,170 0 0 0 Decrease in suppliers' liabilities 162 0 25 1 0
Total cash used by working capital items 1,255 2,254 1,882 1,830 1,959equals Net cash from/(to) operating activities 14,333 15,583 15,212 15,410 16,287
plus Net cash from/(to) investing activities -13,818 -14,802 -15,191 -17,758 -15,976
Net cash from operating activities andinvestment 515 781 21 -2,348 311plus Net cash from/(to) financing activities -1,178 -1,420 150 2,099 -379
equals Net (decrease)/increase in cash -663 -639 171 -249 -67
Estimates Projections

Statement 10: Australian Accounting Standards Financial Statements
10-9
Note 3(a): Consolidated Revenue Fund
The estimated and projected cash balances reflected in the statement of financial position for the Australian Government general government sector (Table 2) include the reported cash balances controlled and administered by Australian Government agencies subject to the Financial Management and Accountability Act 1997 and the reported cash balances controlled and administered by entities, subject to the Commonwealth Authorities and Companies Act 1997 (CAC Act), that implement public policy through the provision of primarily non-market services.
Revenues or monies raised by the Executive Government automatically form part of the Consolidated Revenue Fund by force of section 81 of the Australian Constitution. For practical purposes, total Australian Government general government sector cash, less cash controlled and administered by CAC Act entities, plus special public monies, represents the Consolidated Revenue Fund referred to in section 81 of the Australian Constitution. On this basis, the balance of the Consolidated Revenue Fund is shown below.
2004-05 2005-06 2006-07 2007-08 2008-09$m $m $m $m $m
Total general government sector cash (Statement 10) 927 288 459 210 143
less CAC Agency cash balances 859 202 220 167 120plus Special public monies 81 81 82 82 82Balance of Consolidated Revenue Fund
at 30 June 149 167 321 125 105
Estimates Projections
Further information on the Consolidated Revenue Fund is included in Budget Paper No. 4, Agency Resourcing 2005-06.
Note 4: Income taxation revenue
2004-05 2005-06 2006-07 2007-08 2008-09$m $m $m $m $m
Individuals and other witholding taxGross income tax withholding 97,990 101,140 106,780 114,300 122,430Gross other individuals 23,640 25,440 25,990 27,180 28,960less Refunds 13,700 15,000 15,810 16,580 17,830
Total individuals and other witholding tax 107,930 111,580 116,960 124,900 133,560
Companies 40,610 48,040 50,140 50,780 52,360Superannuation funds
Contributions and earnings 5,090 5,070 5,380 5,770 6,220Surcharge 1,290 1,240 350 210 270
Total superannuation funds 6,380 6,310 5,730 5,980 6,490Petroleum resource rent tax 1,460 1,350 1,630 1,770 1,520Total income taxation revenue 156,380 167,280 174,460 183,430 193,930
Estimates Projections

Part 4: Financial Reporting Standards and Financial Statements
10-10
Note 5: Indirect taxation revenue
2004-05 2005-06 2006-07 2007-08 2008-09$m $m $m $m $m
Excise dutyPetroleum and other fuel products 13,620 13,980 14,270 14,590 14,840Crude oil 650 620 580 580 580Other excise 7,740 7,890 8,000 8,120 8,250
Total excise duty revenue 22,010 22,490 22,850 23,290 23,670
Customs duty revenue 5,714 5,071 5,062 5,322 5,592
Other indirect tax revenue 1,180 1,230 1,340 1,420 1,500
GST 36,300 38,000 40,060 42,270 44,520less transfers to states and territories
in relation to GST revenue 36,300 38,000 40,060 42,270 44,520GST revenue 0 0 0 0 0
Mirror taxes 347 366 384 402 422less transfers to states and territories
in relation to mirror tax revenue 347 366 384 402 422Mirror tax revenue 0 0 0 0 0
Indirect tax revenue 28,904 28,791 29,252 30,032 30,762
Estimates Projections
Note 6: Interest and dividend revenue
2004-05 2005-06 2006-07 2007-08 2008-09$m $m $m $m $m
InterestInterest from other governments
State and Territory debt 29 17 15 14 10Housing agreements 174 170 166 162 158
Total interest from other governments 203 187 181 176 168Interest from other sources
Swap interest 2,165 2,327 2,250 1,869 1,387Advances 17 3 3 3 3Deposits 0 0 0 0 0Bills receivable 6 6 6 6 5Bank deposits 188 187 185 180 182Indexation of HECS receivable and other
student loans 319 370 387 431 484Other 828 1,248 2,092 3,202 4,183
Total interest from other sources 3,524 4,140 4,922 5,690 6,243
Total interest 3,727 4,327 5,103 5,866 6,411
DividendsDividends from controlled entities 3,126 3,293 2,911 2,337 1,833Other dividends 19 19 41 20 20
Total dividends 3,146 3,312 2,952 2,357 1,852
Total interest and dividend revenue 6,873 7,639 8,055 8,222 8,264
Estimates Projections

Statement 10: Australian Accounting Standards Financial Statements
10-11
Note 7: Other sources of non-taxation revenue
2004-05 2005-06 2006-07 2007-08 2008-09$m $m $m $m $m
Assets now recognised 623 124 92 58 58Gains on derivative financial instruments 0 371 303 257 148Industry contributions 290 264 245 228 208International Monetary Fund related revenue 38 41 41 41 41Royalties 783 828 745 771 811Seigniorage 106 112 102 106 106Other 2,005 1,913 1,884 1,898 1,909
Total other sources of non-taxation revenue 3,845 3,652 3,412 3,359 3,282
Estimates Projections
Note 8: Employee expenses
2004-05 2005-06 2006-07 2007-08 2008-09$m $m $m $m $m
Salaries and wages(a) 11,922 12,617 12,828 13,164 13,668Leave and other entitlements 1,404 1,425 1,447 1,512 1,534Separations and redundancies 75 65 65 67 68Workers compensation premiums 0 0 0 0 7Other (including superannuation) 9,509 9,170 9,108 9,447 9,734
Total employee expenses 22,911 23,277 23,449 24,190 25,010
Estimates Projections
(a) Salaries and wages do not include superannuation.
Note 9: Suppliers expenses
2004-05 2005-06 2006-07 2007-08 2008-09$m $m $m $m $m
Supply of goods and services 14,738 15,721 15,664 15,986 15,324Operating lease rental expenses 1,687 1,699 1,716 1,749 1,710Other 423 474 588 585 558
Total supplier expenses 16,848 17,893 17,968 18,321 17,592
Estimates Projections
Note 10: Depreciation and amortisation expenses
2004-05 2005-06 2006-07 2007-08 2008-09$m $m $m $m $m
DepreciationSpecialist military equipment 2,517 2,132 2,166 2,234 2,304Buildings 532 591 603 623 640Heritage and cultural assets 43 44 44 46 47Other infrastructure, plant and equipment 986 1,133 1,189 1,238 1,266
Total depreciation 4,078 3,899 4,002 4,141 4,257Total amortisation 331 373 416 434 408Total depreciation and amortisation expenses 4,409 4,272 4,418 4,575 4,665
Estimates Projections

Part 4: Financial Reporting Standards and Financial Statements
10-12
Note 11: Other goods and services expenses
2004-05 2005-06 2006-07 2007-08 2008-09$m $m $m $m $m
Health care payments 4,238 4,574 4,847 5,155 5,452Development cooperation program 1,312 1,353 1,369 1,368 1,425Other 1,528 1,552 1,831 1,865 1,853
Total other goods and services expenses 7,078 7,479 8,046 8,388 8,730
Estimates Projections
Note 12: Grants expenses
2004-05 2005-06 2006-07 2007-08 2008-09$m $m $m $m $m
State and territory governments 25,320 27,319 27,474 28,543 29,135Non-profit organisations 1,541 1,498 1,599 1,651 1,674Overseas 1,040 531 438 854 832Private sector 1,423 1,735 1,290 1,146 1,102Local governments 318 444 412 391 389Multi-jurisdictional sector 5,347 5,789 6,002 6,172 6,318Other 4,485 5,098 5,755 6,197 5,684
Total grant expenses 39,474 42,414 42,970 44,954 45,134
Estimates Projections
Note 13: Receivables
2004-05 2005-06 2006-07 2007-08 2008-09$m $m $m $m $m
Taxes receivable 11,519 12,890 14,811 16,707 18,758Advances and loans 11,879 12,429 13,270 14,127 14,809Other receivables 6,431 6,559 6,901 7,626 8,620
Total receivables 29,829 31,878 34,982 38,461 42,187
Estimates Projections

Statement 10: Australian Accounting Standards Financial Statements
10-13
Note 14: Total non-financial assets
2004-05 2005-06 2006-07 2007-08 2008-09$m $m $m $m $m
Land and buildingsLand 4,863 5,161 5,119 5,027 4,973Buildings 13,894 14,008 14,263 14,428 14,536
Total land and buildings 18,757 19,169 19,382 19,455 19,509Infrastructure
Specialist military equipment 30,988 32,195 33,753 35,468 37,245Other 8,411 8,578 8,716 8,546 8,256
Total infrastructure 39,398 40,773 42,470 44,015 45,501Intangibles
Computer software 1,585 1,662 1,624 1,597 1,550Other 108 96 87 75 61
Total intangibles 1,693 1,758 1,711 1,672 1,610Heritage and cultural assets 6,698 6,739 6,766 6,787 6,808Total heritage and cultural assets 6,698 6,739 6,766 6,787 6,808Inventories 5,299 5,570 5,989 6,228 6,463Total inventories 5,299 5,570 5,989 6,228 6,463Other non-financial assets
Prepayments 1,440 1,160 1,131 1,141 1,142Other 392 583 496 334 151
Total other non-financial assets 1,832 1,743 1,627 1,474 1,293
Total non-financial assets 73,678 75,751 77,945 79,631 81,184
Estimates Projections
Note 15: Employee and superannuation liabilities
2004-05 2005-06 2006-07 2007-08 2008-09$m $m $m $m $m
Superannuation 90,691 95,175 98,375 101,547 104,695Leave and other entitlements 4,271 4,283 4,293 4,275 4,337Accrued salaries and wages 117 160 188 219 235Workers compensation claims 1,484 1,454 1,391 1,391 1,356Separations and redundancies 34 37 38 38 39Workers compensation premiums 1,702 1,854 1,962 2,083 2,199Other 376 427 472 523 573
Total employee and superannuation liabilities 98,676 103,390 106,720 110,076 113,434
Estimates Projections
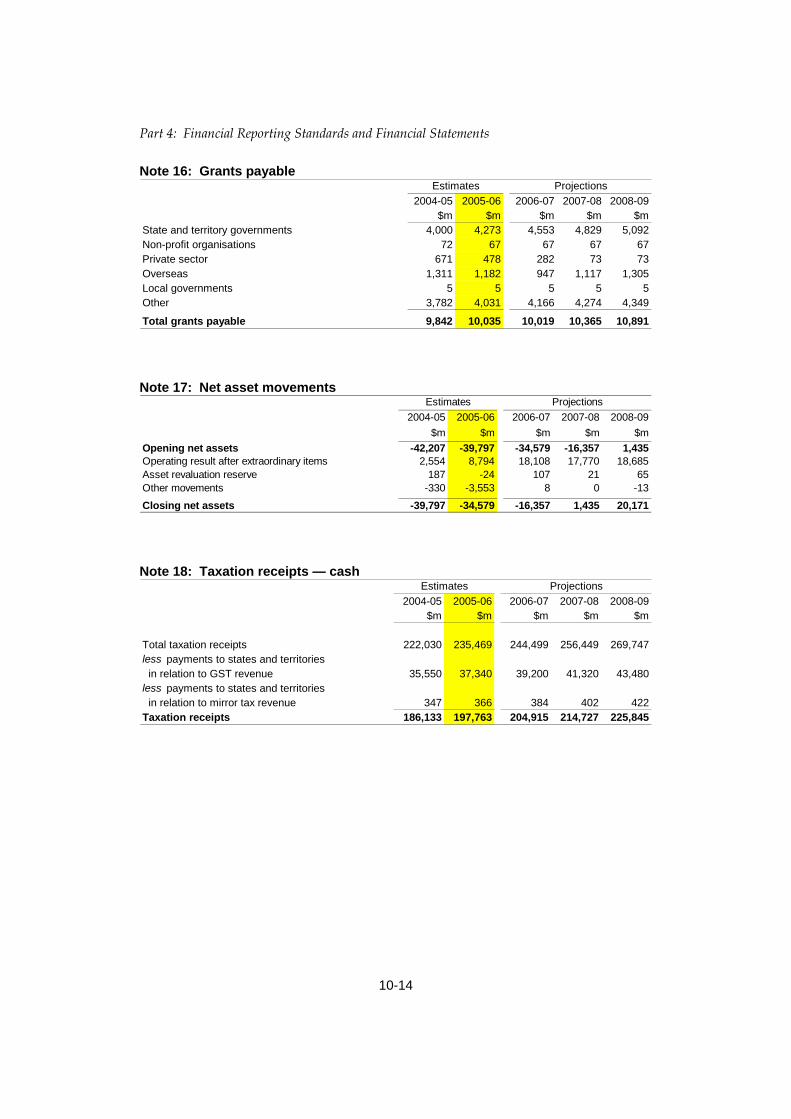
Part 4: Financial Reporting Standards and Financial Statements
10-14
Note 16: Grants payable
2004-05 2005-06 2006-07 2007-08 2008-09$m $m $m $m $m
State and territory governments 4,000 4,273 4,553 4,829 5,092Non-profit organisations 72 67 67 67 67Private sector 671 478 282 73 73Overseas 1,311 1,182 947 1,117 1,305Local governments 5 5 5 5 5Other 3,782 4,031 4,166 4,274 4,349
Total grants payable 9,842 10,035 10,019 10,365 10,891
Estimates Projections
Note 17: Net asset movements
2004-05 2005-06 2006-07 2007-08 2008-09$m $m $m $m $m
Opening net assets -42,207 -39,797 -34,579 -16,357 1,435Operating result after extraordinary items 2,554 8,794 18,108 17,770 18,685Asset revaluation reserve 187 -24 107 21 65Other movements -330 -3,553 8 0 -13
Closing net assets -39,797 -34,579 -16,357 1,435 20,171
Estimates Projections
Note 18: Taxation receipts — cash
2004-05 2005-06 2006-07 2007-08 2008-09$m $m $m $m $m
Total taxation receipts 222,030 235,469 244,499 256,449 269,747less payments to states and territories in relation to GST revenue 35,550 37,340 39,200 41,320 43,480less payments to states and territories in relation to mirror tax revenue 347 366 384 402 422Taxation receipts 186,133 197,763 204,915 214,727 225,845
Estimates Projections

Statement 10: Australian Accounting Standards Financial Statements
10-15
APPENDIX A: ADDITIONAL AGENCY STATISTICS
Table A1: General government expenses by agency
2004-05 2005-06 2006-07 2007-08 2008-09$m $m $m $m $m
Agriculture, Fisheries and Forestry
Department of Agriculture, Fisheries and Forestry 1,973 1,901 1,718 1,574 1,340Grains Research and Development Corporation 127 132 131 131 112Dairy Structural Adjustment Fund 56 45 35 24 15Total 2,156 2,078 1,884 1,729 1,467Attorney-General'sAttorney-General's Department 580 631 665 708 696Australian Customs Service 936 981 999 1,003 1,014Australian Federal Police 865 1,018 1,011 1,009 831Family Court of Australia 130 137 138 139 140High Court of Australia 12 14 14 14 14Total 2,523 2,782 2,828 2,873 2,696Communications, Information
Technology and the ArtsDepartment of Communications, Information
Technology and the Arts 747 800 647 577 524Australian Broadcasting Authority (Administered) 17 18 18 18 18Australian Broadcasting Corporation 1011 1016 1004 1018 1016Australian Communications Authority (Administered) 59 61 60 60 60Australian Sports Commission 167 187 200 188 170National Archives of Australia 70 68 68 68 68National Gallery of Australia 48 46 47 48 49National Library of Australia 67 68 68 69 69National Museum of Australia 44 44 44 45 46Special Broadcasting Service Corporation 212 234 228 228 233Total 2,442 2,543 2,385 2,319 2,252DefenceDepartment of Defence 19,108 19,034 18,956 19,890 20,340Defence Material Organisation 0 7,125 7,133 7,641 7,921Defence Housing Authority 719 748 858 915 926Department of Veterans' Affairs 10,569 10,967 11,285 11,624 11,908Australian War Memorial 38 39 40 39 41Total 30,434 37,914 38,271 40,109 41,135Education, Science and Training Department of Education, Science and Training 17,297 19,590 20,670 21,643 22,316Australian National Training Authority 763 0 0 0 0Australian Research Council 574 581 595 596 611Australian Nuclear Science and Technology
Organisation 154 158 172 166 181Commonwealth Scientific and Industrial
Research Organisation 909 963 1,025 1,071 1,077Total 19,696 21,292 22,462 23,476 24,184
Estimates Projections

Part 4: Financial Reporting Standards and Financial Statements
10-16
Table A1: General government expenses by agency (continued)
2004-05 2005-06 2006-07 2007-08 2008-09$m $m $m $m $m
Employment and Workplace RelationsDepartment of Employment and Workplace Relations 17,549 25,730 27,142 28,424 29,254Comcare 332 244 290 303 316Total 17,881 25,974 27,432 28,727 29,570Environment and HeritageDepartment of Environment and Heritage 784 832 892 858 454Bureau of Meteorology 208 224 231 237 239Total 992 1,056 1,123 1,094 693
Family and Community Services Department of Family and Community Services 51,467 44,498 46,906 48,893 51,404Total 51,467 44,498 46,906 48,893 51,404
Finance and AdministrationDepartment of Finance and Administration 6,327 5,746 6,129 6,243 6,297Australian Electoral Commission 228 106 110 228 109Future Fund Management Agency 0 6 8 8 8Department of Human Services 758 1,403 1,574 1,601 1,615Centrelink 2,259 2,306 2,332 2,435 2,492Health Insurance Commission 594 567 576 586 599Total 10,165 10,135 10,729 11,101 11,121
Foreign Affairs and TradeDepartment of Foreign Affairs and Trade 1,009 957 923 988 923AusAID 2,214 1,749 1,668 2,083 2,119Australian Trade Commission 330 373 355 347 348Total 3,553 3,079 2,946 3,418 3,389
Health and AgeingDepartment of Health and Ageing 36,776 39,148 40,908 43,072 45,078National Blood Authority 554 578 577 578 578Total 37,331 39,726 41,485 43,650 45,657
Immigration and Multicultural and Indigenous Affairs
Department of Immigration and Multicultural and Indigenous Affairs 2,192 1,802 1,813 1,828 1,871
Aboriginal and Torres Strait Islanders Land Fund 0 0 0 0 0Aboriginal and Torres Strait Islander Services 0 0 0 0 0Total 2,192 1,802 1,813 1,828 1,871
Industry, Tourism and Resources Department of Industry, Tourism
and Resources 1,872 2,071 1,862 1,804 1,814Tourism Australia 165 163 159 162 114Total 2,038 2,235 2,021 1,966 1,928
ParliamentDepartment of Parliamentary Services 158 160 163 165 167Total 158 160 163 165 167
Prime Minister and CabinetDepartment of Prime Minister and Cabinet 88 99 119 115 72National Water Commission 11 326 570 560 201Total 99 426 690 675 273
Estimates Projections
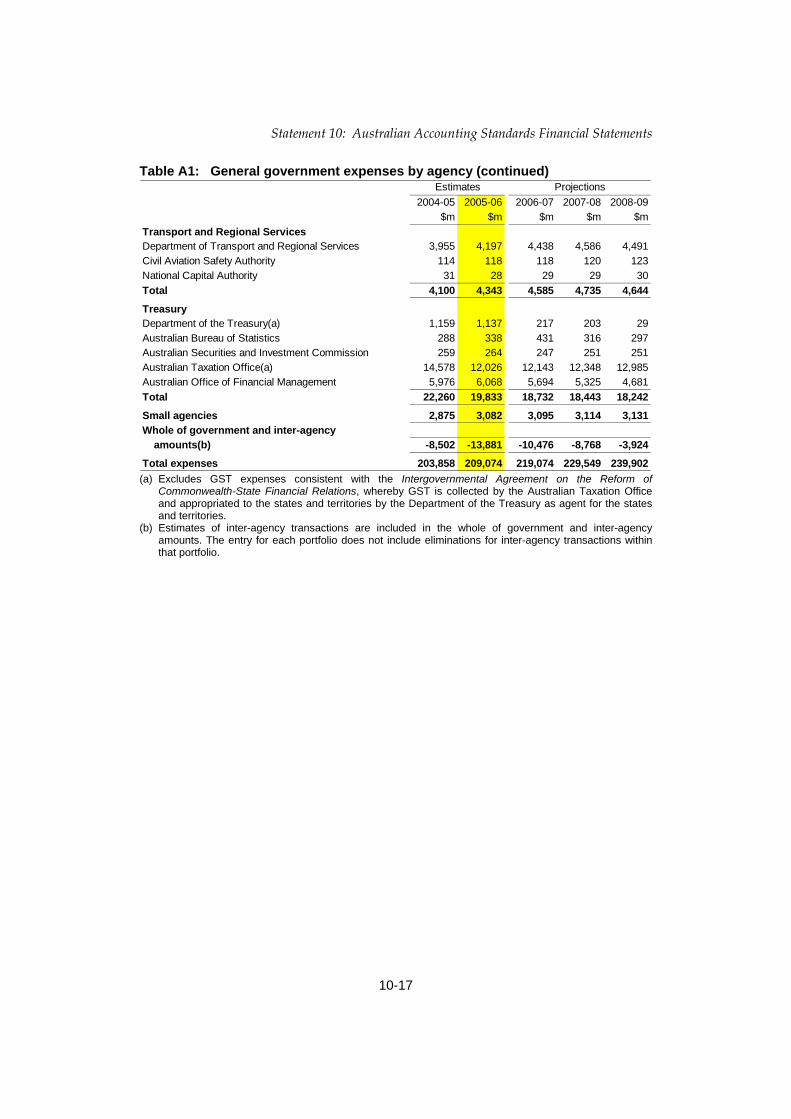
Statement 10: Australian Accounting Standards Financial Statements
10-17
Table A1: General government expenses by agency (continued)
2004-05 2005-06 2006-07 2007-08 2008-09$m $m $m $m $m
Transport and Regional ServicesDepartment of Transport and Regional Services 3,955 4,197 4,438 4,586 4,491Civil Aviation Safety Authority 114 118 118 120 123National Capital Authority 31 28 29 29 30Total 4,100 4,343 4,585 4,735 4,644
TreasuryDepartment of the Treasury(a) 1,159 1,137 217 203 29Australian Bureau of Statistics 288 338 431 316 297Australian Securities and Investment Commission 259 264 247 251 251Australian Taxation Office(a) 14,578 12,026 12,143 12,348 12,985Australian Office of Financial Management 5,976 6,068 5,694 5,325 4,681Total 22,260 19,833 18,732 18,443 18,242
Small agencies 2,875 3,082 3,095 3,114 3,131Whole of government and inter-agency
amounts(b) -8,502 -13,881 -10,476 -8,768 -3,924
Total expenses 203,858 209,074 219,074 229,549 239,902
Estimates Projections
(a) Excludes GST expenses consistent with the Intergovernmental Agreement on the Reform of
Commonwealth-State Financial Relations, whereby GST is collected by the Australian Taxation Office and appropriated to the states and territories by the Department of the Treasury as agent for the states and territories.
(b) Estimates of inter-agency transactions are included in the whole of government and inter-agency amounts. The entry for each portfolio does not include eliminations for inter-agency transactions within that portfolio.

Part 4: Financial Reporting Standards and Financial Statements
10-18
Table A2: Departmental expenses by agency
2004-05 2005-06 2006-07 2007-08 2008-09$m $m $m $m $m
Agriculture, Fisheries and ForestryDepartment of Agriculture, Fisheries and Forestry 515 501 485 480 468Grains Research and Development Corporation 127 132 131 131 112Dairy Structural Adjustment Fund 0 0 0 0 0Total 642 632 616 611 580Attorney-General'sAttorney-General's Department 202 188 180 170 159Australian Customs Service 935 978 996 1,000 1,011Australian Federal Police 865 1,018 1,011 1,009 831Family Court of Australia 130 137 138 139 140High Court of Australia 12 14 14 14 14Total 2,145 2,336 2,340 2,332 2,156Communications, Information
Technology and the ArtsDepartment of Communications, Information
Technology and the Arts 121 120 121 119 120Australian Broadcasting Authority (Administered) 17 18 18 18 18Australian Broadcasting Corporation 925 930 918 932 930Australian Communications Authority (Administered) 59 61 60 60 60Australian Sports Commission 167 187 200 188 170National Archives of Australia 70 68 68 68 68National Gallery of Australia 48 46 47 48 49National Library of Australia 67 68 68 69 69National Museum of Australia 44 44 44 45 46Special Broadcasting Service Corporation 212 234 228 228 233Total 1,730 1,777 1,773 1,775 1,762DefenceDepartment of Defence 16,670 16,495 16,417 17,250 17,701Defence Material Organisation 0 7,125 7,133 7,641 7,921Defence Housing Authority 719 748 858 915 926Department of Veterans' Affairs 329 324 321 314 307Australian War Memorial 38 39 40 39 41Total 17,756 24,732 24,768 26,159 26,895Education, Science and TrainingDepartment of Education, Science and Training 367 431 434 436 434Australian National Training Authority 15 0 0 0 0Australian Research Council 14 15 15 15 16Australian Nuclear Science and Technology
Organisation 154 158 172 166 181Commonwealth Scientific and Industrial
Research Organisation 909 963 1,025 1,071 1,077Total 1,459 1,567 1,646 1,688 1,707
Estimates Projections

Statement 10: Australian Accounting Standards Financial Statements
10-19
Table A2: Departmental expenses by agency (continued)
2004-05 2005-06 2006-07 2007-08 2008-09$m $m $m $m $m
Employment and Workplace RelationsDepartment of Employment and Workplace Relations 1,061 1,463 1,521 1,618 1,617Comcare 332 244 290 303 316Total 1,393 1,706 1,812 1,920 1,933Environment and HeritageDepartment of Environment and Heritage 335 351 344 325 256Bureau of Meteorology 208 224 231 237 239Total 543 575 574 562 495
Family and Community Services Department of Family and Community Services 2,348 1,470 1,443 1,434 1,472Total 2,348 1,470 1,443 1,434 1,472
Finance and AdministrationDepartment of Finance and Administration 372 426 592 576 552Australian Electoral Commission 184 106 110 181 109Future Fund Management Agency 0 6 8 8 8Department of Human Services 252 466 482 491 503Centrelink 2,259 2,306 2,332 2,435 2,492Health Insurance Commission 594 567 576 586 599Total 3,660 3,878 4,101 4,277 4,264
Foreign Affairs and TradeDepartment of Foreign Affairs and Trade 726 708 703 768 704AusAID 75 79 75 75 75Australian Trade Commission 194 203 195 196 197Total 995 990 972 1,040 976
Health and AgeingDepartment of Health and Ageing 568 543 528 528 533National Blood Authority 8 10 10 10 9Total 576 553 537 537 542
Immigration and Multicultural and Indigenous Affairs
Department of Immigration and Multicultural and Indigenous Affairs 1,016 1,064 1,088 1,119 1,155
Aboriginal and Torres Strait Islanders Land Fund 0 0 0 0 0Aboriginal and Torres Strait Islander Services 0 0 0 0 0Total 1,016 1,064 1,088 1,119 1,155
Industry, Tourism and Resources Department of Industry, Tourism and Resources 312 298 285 280 271Tourism Australia 165 163 159 162 114Total 477 461 444 441 385
ParliamentDepartment of Parliamentary Services 118 120 122 124 126Total 118 120 122 124 126
Prime Minister and CabinetDepartment of Prime Minister and Cabinet 62 87 107 103 60National Water Commission 5 10 10 10 10Total 67 98 118 113 70
Estimates Projections

Part 4: Financial Reporting Standards and Financial Statements
10-20
Table A2: Departmental expenses by agency (continued)
2004-05 2005-06 2006-07 2007-08 2008-09$m $m $m $m $m
Transport and Regional ServicesDepartment of Transport and Regional Services 185 207 206 203 204Civil Aviation Safety Authority 114 118 118 120 123National Capital Authority 20 20 20 20 20Total 319 344 344 344 348
TreasuryDepartment of the Treasury 174 184 177 170 172Australian Bureau of Statistics 288 338 431 316 297Australian Securities and Investment Commission 214 222 205 207 207Australian Taxation Office 2,445 2,502 2,484 2,502 2,536Australian Office of Financial Management 8 8 8 8 8Total 3,129 3,254 3,306 3,203 3,219
Small agencies 2,875 3,082 3,095 3,114 3,131Whole of government and inter-agency
amounts(a) 0 -43 -227 -506 -577
Total departmental expenses 41,248 48,595 48,872 50,289 50,638
Estimates Projections
(a) Estimates of inter-agency transactions are included in the whole of government and inter-agency
amounts. The entry for each portfolio does not include eliminations for inter-agency transactions within that portfolio.
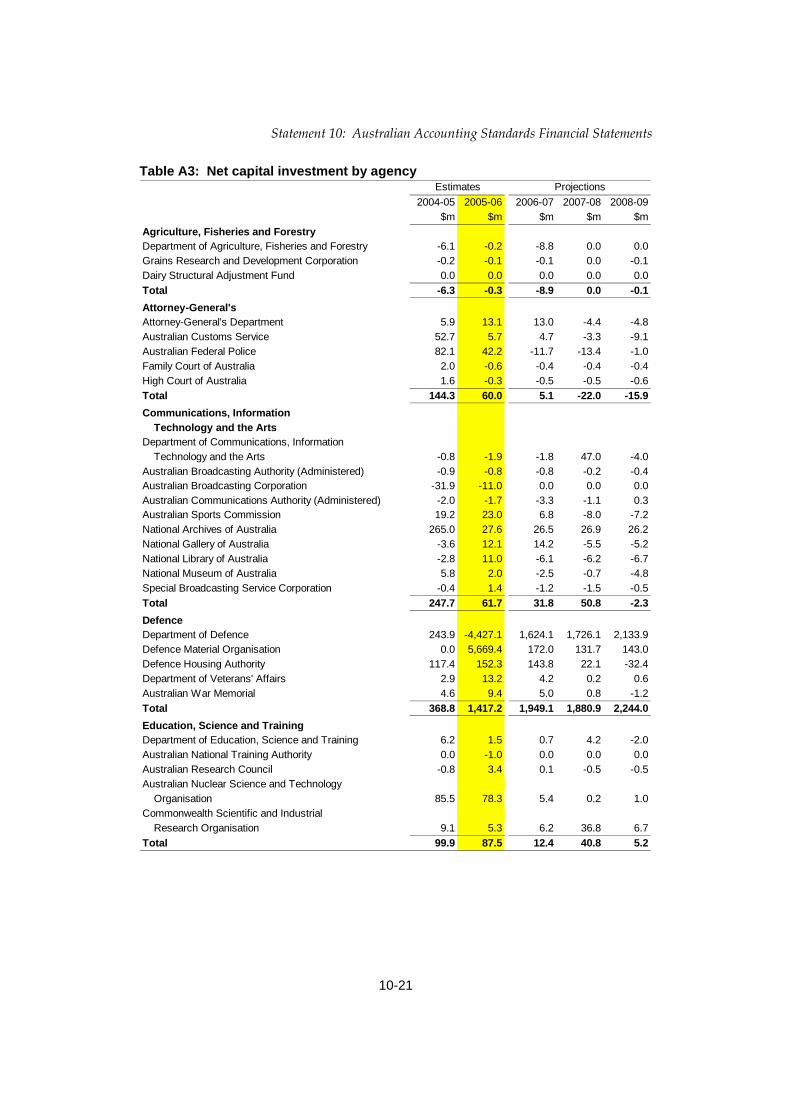
Statement 10: Australian Accounting Standards Financial Statements
10-21
Table A3: Net capital investment by agency
2004-05 2005-06 2006-07 2007-08 2008-09$m $m $m $m $m
Agriculture, Fisheries and ForestryDepartment of Agriculture, Fisheries and Forestry -6.1 -0.2 -8.8 0.0 0.0Grains Research and Development Corporation -0.2 -0.1 -0.1 0.0 -0.1Dairy Structural Adjustment Fund 0.0 0.0 0.0 0.0 0.0Total -6.3 -0.3 -8.9 0.0 -0.1Attorney-General'sAttorney-General's Department 5.9 13.1 13.0 -4.4 -4.8Australian Customs Service 52.7 5.7 4.7 -3.3 -9.1Australian Federal Police 82.1 42.2 -11.7 -13.4 -1.0Family Court of Australia 2.0 -0.6 -0.4 -0.4 -0.4High Court of Australia 1.6 -0.3 -0.5 -0.5 -0.6Total 144.3 60.0 5.1 -22.0 -15.9Communications, Information
Technology and the ArtsDepartment of Communications, Information
Technology and the Arts -0.8 -1.9 -1.8 47.0 -4.0Australian Broadcasting Authority (Administered) -0.9 -0.8 -0.8 -0.2 -0.4Australian Broadcasting Corporation -31.9 -11.0 0.0 0.0 0.0Australian Communications Authority (Administered) -2.0 -1.7 -3.3 -1.1 0.3Australian Sports Commission 19.2 23.0 6.8 -8.0 -7.2National Archives of Australia 265.0 27.6 26.5 26.9 26.2National Gallery of Australia -3.6 12.1 14.2 -5.5 -5.2National Library of Australia -2.8 11.0 -6.1 -6.2 -6.7National Museum of Australia 5.8 2.0 -2.5 -0.7 -4.8Special Broadcasting Service Corporation -0.4 1.4 -1.2 -1.5 -0.5Total 247.7 61.7 31.8 50.8 -2.3DefenceDepartment of Defence 243.9 -4,427.1 1,624.1 1,726.1 2,133.9Defence Material Organisation 0.0 5,669.4 172.0 131.7 143.0Defence Housing Authority 117.4 152.3 143.8 22.1 -32.4Department of Veterans' Affairs 2.9 13.2 4.2 0.2 0.6Australian War Memorial 4.6 9.4 5.0 0.8 -1.2Total 368.8 1,417.2 1,949.1 1,880.9 2,244.0Education, Science and TrainingDepartment of Education, Science and Training 6.2 1.5 0.7 4.2 -2.0Australian National Training Authority 0.0 -1.0 0.0 0.0 0.0Australian Research Council -0.8 3.4 0.1 -0.5 -0.5Australian Nuclear Science and Technology
Organisation 85.5 78.3 5.4 0.2 1.0Commonwealth Scientific and Industrial
Research Organisation 9.1 5.3 6.2 36.8 6.7Total 99.9 87.5 12.4 40.8 5.2
Estimates Projections

Part 4: Financial Reporting Standards and Financial Statements
10-22
Table A3: Net capital investment by agency (continued)
2004-05 2005-06 2006-07 2007-08 2008-09$m $m $m $m $m
Employment and Workplace RelationsDepartment of Employment and Workplace Relations 17.2 39.6 6.3 1.8 -11.9Comcare 0.4 -0.1 0.0 0.0 0.0Total 17.5 39.5 6.3 1.8 -11.9Environment and HeritageDepartment of Environment and Heritage -4.9 -2.7 -5.3 -11.5 -11.7Bureau of Meteorology 15.1 8.2 11.7 15.0 5.2Total 10.2 5.5 6.5 3.5 -6.4
Family and Community Services Department of Family and Community Services -33.2 2.5 1.3 1.7 1.6Total -33.2 2.5 1.3 1.7 1.6
Finance and AdministrationDepartment of Finance and Administration 74.1 230.0 -129.2 29.5 -64.6Australian Electoral Commission -4.9 1.0 3.0 -1.1 -0.2Future Fund Management Agency 0.0 1.0 0.0 0.0 0.0Department of Human Services 50.1 -4.6 1.7 -3.7 -10.3Centrelink 49.5 28.1 19.9 -6.6 -12.1Health Insurance Commission 14.9 0.8 -1.9 -3.1 -5.1Total 183.8 256.3 -106.6 15.1 -92.3
Foreign Affairs and TradeDepartment of Foreign Affairs and Trade -36.3 221.1 212.9 43.1 -18.7AusAID 5.1 1.5 5.3 -2.4 -2.9Australian Trade Commission 0.1 8.2 6.6 3.5 -1.5Total -31.1 230.8 224.9 44.3 -23.1
Health and AgeingDepartment of Health and Ageing -48.2 -32.6 -35.5 -9.3 -7.5National Blood Authority 1.2 1.9 0.2 -0.4 -0.4Total -47.0 -30.7 -35.3 -9.7 -7.9
Immigration and Multicultural and Indigenous Affairs
Department of Immigration and Multicultural and Indigenous Affairs 42.5 3.9 280.8 -32.7 69.5
Aboriginal and Torres Strait Islanders Land Fund 0.0 0.0 0.0 0.0 0.0Aboriginal and Torres Strait Islander Services -48.1 0.0 0.0 0.0 0.0Total -5.6 3.9 280.8 -32.7 69.5
Industry, Tourism and Resources Department of Industry, Tourism and Resources 16.4 -4.1 1.5 2.2 1.9Tourism Australia 5.1 -0.9 -0.7 -2.7 -1.9Total 21.5 -5.0 0.8 -0.5 0.0
ParliamentDepartment of Parliamentary Services -4.2 -27.9 -33.9 -33.7 -34.4Total -4.2 -27.9 -33.9 -33.7 -34.4
Prime Minister and CabinetDepartment of Prime Minister and Cabinet 1.8 8.2 12.6 -5.2 -1.7National Water Commission 2.0 -0.3 -0.3 -0.3 -0.3Total 3.8 7.9 12.3 -5.5 -2.0
Estimates Projections

Statement 10: Australian Accounting Standards Financial Statements
10-23
Table A3: Net capital investment by agency (continued)
2004-05 2005-06 2006-07 2007-08 2008-09$m $m $m $m $m
Transport and Regional ServicesDepartment of Transport and Regional Services 15.6 60.7 -1.9 -6.9 -8.4Civil Aviation Safety Authority 14.0 4.5 -2.4 -3.8 -5.9National Capital Authority 1.7 6.3 3.4 0.7 1.3Total 31.4 71.6 -0.9 -9.9 -13.0
TreasuryDepartment of the Treasury -154.1 -217.6 9.8 6.4 1.2Australian Bureau of Statistics 0.0 9.9 -5.0 -0.6 -9.4Australian Securities and Investment Commission 1.9 -1.1 -4.0 -2.0 -0.3Australian Taxation Office 19.7 37.0 28.3 16.3 8.1Australian Office of Financial Management -0.8 -0.8 1.2 -0.6 -0.6Total -133.3 -172.6 30.3 19.6 -1.1
Small agencies 42.8 45.6 54.1 50.6 57.8Whole of government and inter-agency
amounts(a) -1.6 19.7 -236.8 -308.6 -614.8
Total net capital investment 909.4 2,073.1 2,193.3 1,686.1 1,553.0
Estimates Projections
(a) Estimates of inter-agency transactions are included in the whole of government and inter-agency
amounts. The entry for each portfolio does not include eliminations for inter-agency transactions within that portfolio.

Part 4: Financial Reporting Standards and Financial Statements
10-24
Table A4: Capital appropriations by portfolio
2004-05 2005-06 2006-07 2007-08 2008-09$m $m $m $m $m
Agriculture, Fisheries and ForestryDepartment of Agriculture, Fisheries and Forestry 6 0 0 0 0Grains Research and Development Corporation 0 0 0 0 0Dairy Structural Adjustment Fund 0 0 0 0 0Total 6 0 0 0 0Attorney-General'sAttorney-General's Department 9 13 9 0 0Australian Customs Service 42 16 17 12 10Australian Federal Police 30 44 14 12 11Family Court of Australia 2 0 0 0 0High Court of Australia 0 0 0 0 0Total 83 73 40 24 21Communications, Information
Technology and the ArtsDepartment of Communications, Information
Technology and the Arts 0 0 0 0 0Australian Broadcasting Authority (Administered) 0 3 0 0 0Australian Broadcasting Corporation 0 0 0 0 0Australian Communications Authority (Administered) 0 28 0 0 0Australian Sports Commission 12 21 11 0 0National Archives of Australia 0 0 0 0 0National Gallery of Australia 4 4 22 4 4National Library of Australia 4 7 1 1 1National Museum of Australia 1 1 3 5 1Special Broadcasting Service Corporation 6 6 5 4 3Total 26 70 42 14 9DefenceDepartment of Defence 393 1,121 1,512 1,612 2,018Defence Material Organisation 0 0 0 0 0Defence Housing Authority 0 125 0 0 0Department of Veterans' Affairs 2 6 1 1 1Australian War Memorial 7 3 0 0 0Total 402 1,255 1,513 1,613 2,019Education, Science and TrainingDepartment of Education, Science and Training 8 0 0 0 0Australian National Training Authority 0 0 0 0 0Australian Research Council 0 0 0 0 0Australian Nuclear Science and Technology
Organisation 43 20 0 0 0Commonwealth Scientific and Industrial
Research Organisation 0 0 0 0 0Total 51 20 0 0 0
Estimates Projections

Statement 10: Australian Accounting Standards Financial Statements
10-25
Table A4: Capital appropriations by portfolio (continued)
2004-05 2005-06 2006-07 2007-08 2008-09$m $m $m $m $m
Employment and Workplace RelationsDepartment of Employment and Workplace Relations 26 46 13 6 0Comcare 0 0 0 0 0Total 26 46 13 6 0
Environment and HeritageDepartment of Environment and Heritage 0 5 2 0 0Bureau of Meteorology 9 13 17 17 5Total 9 18 19 17 5
Family and Community Services Department of Family and Community Services 1 1 0 0 0Total 1 1 0 0 0
Finance and AdministrationDepartment of Finance and Administration 988 1,044 965 880 958Australian Electoral Commission 2 2 1 1 2Future Fund Management Agency 0 16,138 0 0 0Department of Human Services 0 0 0 0 0Centrelink 38 54 26 15 0Health Insurance Commission 20 4 2 1 0Total 1,048 17,242 994 898 960
Foreign Affairs and TradeDepartment of Foreign Affairs and Trade 82 77 71 87 1AusAID 97 36 29 16 8Australian Trade Commission 6 9 8 5 0Total 185 122 108 107 9
Health and AgeingDepartment of Health and Ageing 60 58 56 48 48National Blood Authority 0 0 0 0 0Total 60 58 57 48 48
Immigration and Multicultural and Indigenous Affairs
Department of Immigration and Multicultural and Indigenous Affairs 60 31 33 25 42
Aboriginal and Torres Strait Islanders Land Fund 0 0 0 0 0Aboriginal and Torres Strait Islander Services 0 0 0 0 0Total 60 31 33 25 42
Industry, Tourism and Resources Department of Industry, Tourism and Resources 172 26 13 34 8Tourism Australia 1 0 0 0 0Total 173 26 13 34 8
ParliamentDepartment of Parliamentary Services 12 0 0 0 0Total 12 0 0 0 0
Prime Minister and CabinetDepartment of Prime Minister and Cabinet 3 10 18 0 0National Water Commission 2 0 0 0 0Total 5 10 18 0 0
Estimates Projections

Part 4: Financial Reporting Standards and Financial Statements
10-26
Table A4: Capital appropriations by portfolio (continued)
2004-05 2005-06 2006-07 2007-08 2008-09$m $m $m $m $m
Transport and Regional ServicesDepartment of Transport and Regional Services 99 21 7 6 5Civil Aviation Safety Authority 0 0 0 0 0National Capital Authority 2 2 2 2 2Total 101 23 9 8 7
TreasuryDepartment of the Treasury 347 89 77 57 36Australian Bureau of Statistics 0 1 1 1 0Australian Securities and Investment Commission 12 1 0 0 0Australian Taxation Office 8 0 0 0 0Australian Office of Financial Management 161,362 142,625 141,575 138,394 140,570Total 161,729 142,717 141,653 138,451 140,606
Small agencies 0 0 0 0 0Whole of government and inter-agency
amounts(a) 0 0 0 0 0
Total capital appropriations 163,976 161,713 144,512 141,243 143,733
Estimates Projections
(a) Estimates of inter-agency transactions are included in the whole of government and inter-agency
amounts. The entry for each portfolio does not include eliminations for inter-agency transactions within that portfolio.
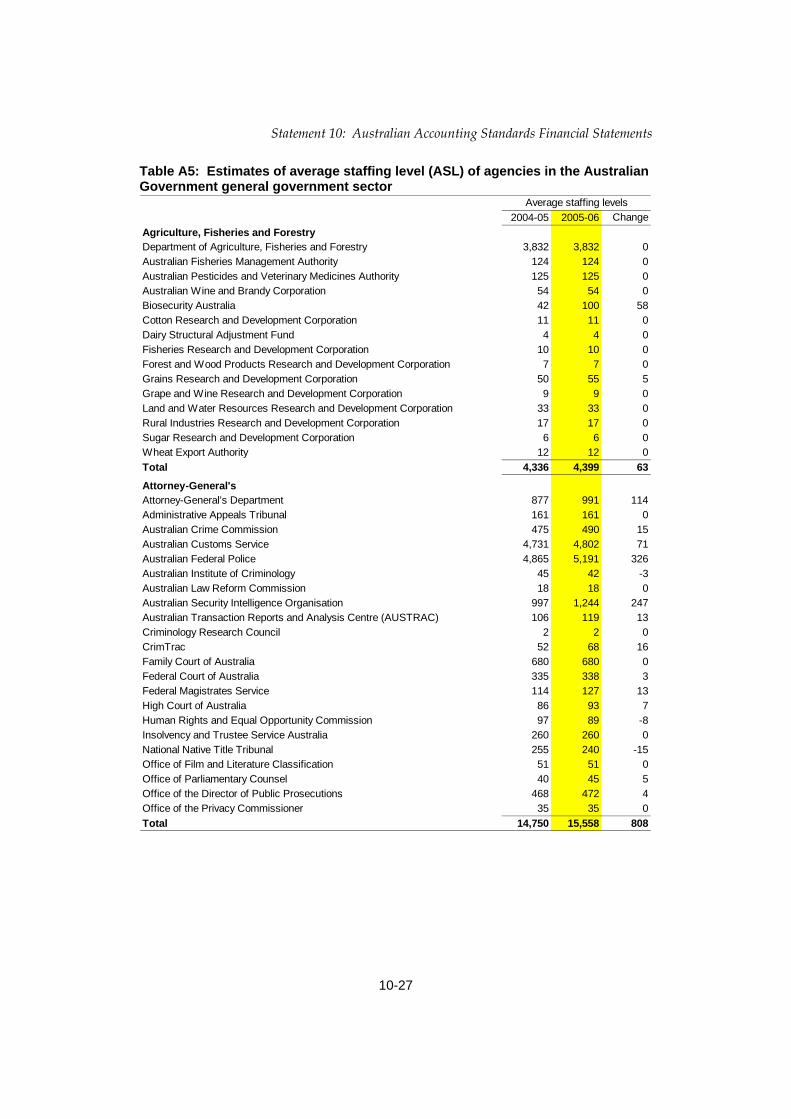
Statement 10: Australian Accounting Standards Financial Statements
10-27
Table A5: Estimates of average staffing level (ASL) of agencies in the Australian Government general government sector
2004-05 2005-06 ChangeAgriculture, Fisheries and ForestryDepartment of Agriculture, Fisheries and Forestry 3,832 3,832 0Australian Fisheries Management Authority 124 124 0Australian Pesticides and Veterinary Medicines Authority 125 125 0Australian Wine and Brandy Corporation 54 54 0Biosecurity Australia 42 100 58Cotton Research and Development Corporation 11 11 0Dairy Structural Adjustment Fund 4 4 0Fisheries Research and Development Corporation 10 10 0Forest and Wood Products Research and Development Corporation 7 7 0Grains Research and Development Corporation 50 55 5Grape and Wine Research and Development Corporation 9 9 0Land and Water Resources Research and Development Corporation 33 33 0Rural Industries Research and Development Corporation 17 17 0Sugar Research and Development Corporation 6 6 0Wheat Export Authority 12 12 0Total 4,336 4,399 63
Attorney-General'sAttorney-General’s Department 877 991 114Administrative Appeals Tribunal 161 161 0Australian Crime Commission 475 490 15Australian Customs Service 4,731 4,802 71Australian Federal Police 4,865 5,191 326Australian Institute of Criminology 45 42 -3Australian Law Reform Commission 18 18 0Australian Security Intelligence Organisation 997 1,244 247Australian Transaction Reports and Analysis Centre (AUSTRAC) 106 119 13Criminology Research Council 2 2 0CrimTrac 52 68 16Family Court of Australia 680 680 0Federal Court of Australia 335 338 3Federal Magistrates Service 114 127 13High Court of Australia 86 93 7Human Rights and Equal Opportunity Commission 97 89 -8Insolvency and Trustee Service Australia 260 260 0National Native Title Tribunal 255 240 -15Office of Film and Literature Classification 51 51 0Office of Parliamentary Counsel 40 45 5Office of the Director of Public Prosecutions 468 472 4Office of the Privacy Commissioner 35 35 0Total 14,750 15,558 808
Average staffing levels

Part 4: Financial Reporting Standards and Financial Statements
10-28
Table A5: Estimates of average staffing level (ASL) of agencies in the Australian Government general government sector (continued)
2004-05 2005-06 ChangeCommunication, Information Technology and the ArtsDepartment of Communications, Information Technology and the Arts 770 803 33Australia Business Arts Foundation 28 30 2Australia Council 135 135 0Australian Broadcasting Authority 112 112 0Australian Broadcasting Corporation 4,200 4,200 0Australian Communications Authority 410 399 -11Australian Film Commission 275 278 3Australian Film Television and Radio School 148 158 10Australian Government Information Management Office 33 0 -33Australian National Maritime Museum 100 105 5Australian Sports Commission 551 628 77Australian Sports Drug Agency 38 47 9Bundanon Trust 12 14 2Film Australia 53 55 2National Archives of Australia 420 452 32National Gallery of Australia 230 228 -2National Library of Australia 451 449 -2National Museum of Australia 220 225 5Netalert 4 4 0Special Broadcasting Service 798 790 -8Total 8,988 9,111 124DefenceDepartment of Defence 17,973 13,282 -4,691Military Reserves 20,250 20,150 -100Permanent Military 52,008 52,000 -8Defence Housing Authority 750 750 0Defence Materiel Organisation 0 4,448 4,448Department of Veterans' Affairs 2,487 2,468 -19Australian War Memorial 278 282 4Total 93,746 93,380 -366Education, Science and TrainingDepartment of Education, Science and Training 1,835 2,000 165Australian Institute of Aboriginal and Torres Strait Islander Studies 108 110 2Australian Institute of Marine Science 162 168 6Australian National Training Authority 83 0 -83Australian Nuclear Science and Technology Organisation 835 838 3Australian Research Council 64 76 12Commonwealth Scientific and Industrial Research Organisation 6,016 6,030 14Total 9,103 9,222 119Employment and Workplace RelationsDepartment of Employment and Workplace Relations 2,735 3,160 425Australian Industrial Registry 249 257 8Comcare 333 348 15Equal Opportunity for Women in the Workplace Agency 21 21 0Indigenous Business Australia 47 126 79National Occupation Health and Safety Commission 50 0 -50Total 3,435 3,912 477
Average staffing levels

Statement 10: Australian Accounting Standards Financial Statements
10-29
Table A5: Estimates of average staffing level (ASL) of agencies in the Australian Government general government sector (continued)
2004-05 2005-06 ChangeEnvironment and HeritageDepartment of the Environment and Heritage 1,464 1,612 148Australian Greenhouse Office 58 0 -58Bureau of Meteorology 1,413 1,355 -58Director of National Parks 275 275 0Great Barrier Reef Marine Park Authority 180 179 -1National Oceans Office 15 0 -15Office of the Renewable Energy Regulator 10 11 1Sydney Harbour Federation Trust 46 50 4Total 3,461 3,482 21Family and Community ServicesDepartment of Family and Community Services 1,770 1,770 0Aboriginal Hostels Limited 385 385 0Australian Institute of Family Studies 55 55 0Total 2,210 2,210 0Finance and AdministrationDepartment of Finance and Administration 1,056 1,248 192Australian Electoral Commission 807 775 -32Commonwealth Grants Commission 48 48 0Commonwealth Superannuation Administration (ComSuper) 384 384 0Department of Human Services 4,508 4,613 105Centrelink 23,400 22,950 -450Health Insurance Commission 5,150 5,050 -100Total 35,353 35,068 -285Foreign Affairs and TradeDepartment of Foreign Affairs and Trade 3,138 3,161 23AusAID 510 482 -28Australian Trade Commission 1,056 1,094 38Australia-Japan Foundation 6 6 0Australian Centre for International Agricultural Research 62 63 1Total 4,772 4,806 34Health and AgeingDepartment of Health and Ageing 3,805 3,927 122Aged Care Standards and Accreditation Agency 151 191 40Australian Institute of Health and Welfare 186 192 6Australian Radiation Protection and Nuclear Safety Agency 122 126 4Food Standards Australia New Zealand 126 122 -4General Practice Education and Training Limited 27 29 2National Blood Authority 34 40 6National Institute of Clinical Studies Australia Limited 18 22 4Private Health Insurance Administration Council 13 15 2Private Health Insurance Ombudsman 8 8 0Professional Services Review 35 30 -5Total 4,525 4,702 177Immigration and Multicultural and Indigenous AffairsDepartment of Immigration and Multicultural and Indigenous Affairs 5,692 5,747 55Migration Review Tribunal 174 174 0Refugee Review Tribunal 190 190 0Indigenous Land Corporation 130 130 0Torres Strait Regional Authority 50 50 0Total 6,236 6,291 55
Average staffing levels

Part 4: Financial Reporting Standards and Financial Statements
10-30
Table A5: Estimates of average staffing level (ASL) of agencies in the Australian Government general government sector (continued)
2004-05 2005-06 ChangeIndustry Tourism and ResourcesDepartment of Industry, Tourism and Resources 1,742 1,750 8Geoscience Australia 626 646 20IP Australia 775 795 20National Offshore Petroleum Safety Authority 13 34 21Tourism Australia 245 245 0Total 3,401 3,470 69
ParliamentDepartment of Parliamentary Services 845 845 0Department of the House of Representatives 166 166 0Department of the Senate 169 169 0Total 1,180 1,180 0
Prime Minister and CabinetDepartment of the Prime Minister and Cabinet 375 450 75Australian National Audit Office 290 300 10Australian Public Service Commission 187 179 -8National Water Commission 22 52 30Office of National Assessments 95 125 30Office of the Commonwealth Ombudsman 102 102 0Office of the Inspector-General of Intelligence and Security 6 7 1Office of the Official Secretary to the Governor-General 83 91 8Total 1,160 1,306 146
Transport and Regional ServicesDepartment of Transport and Regional Services 1,038 1,192 154Australian Maritime Safety Authority 237 241 4Civil Aviation Safety Authority 680 650 -30National Capital Authority 86 87 1Total 2,041 2,170 129
TreasuryDepartment of the Treasury 890 934 44Australian Bureau of Statistics 2,652 2,711 59Australian Competition and Consumer Commission 481 511 30Australian Office of Finance Management 34 35 1Australian Prudential Regulation Authority 561 572 11Australian Securities and Investments Commission 1,571 1,534 -37Australian Taxation Office 20,800 20,792 -8Corporations and Market Advisory Committee 3 3 0Inspector General of Taxation 6 6 0National Competition Council 20 20 0Productivity Commission 200 200 0Total 27,218 27,318 100
Average staffing levels
(a) This table includes estimates of ASL provided by general government sector agencies. ASL figures
reflect the average number of employees receiving salary or wages over the financial year, with adjustments for casual and part-time staff, to show the full-time equivalent. This also includes non-uniformed staff and overseas personnel.


11-1
STATEMENT 11: STATEMENT OF RISKS
A range of factors may influence the actual budget outcome in future years. The Charter of Budget Honesty Act 1998 requires these factors be disclosed in a Statement of Risks in each Budget and Mid-Year Economic and Fiscal Outlook. This statement outlines the fiscal risks and the contingent liabilities which may affect the budget balances.
Risks to the budget..................................................................................................11-2
Fiscal risks — revenue ............................................................................................11-5
Fiscal risks — expenses..........................................................................................11-6
Contingent liabilities — quantifiable......................................................................11-7
Contingent liabilities — unquantifiable ...............................................................11-11

11-2
STATEMENT 11: STATEMENT OF RISKS The forward estimates of revenue and expenses in the 2005-06 Budget incorporate assumptions and judgments based on the best information available at the time of publication. A range of factors may influence the actual budget outcome in future years. The disclosure of these factors in this statement increases the transparency of the fiscal projections and ensures they remain ‘on-balance’ estimates.
Events that could affect fiscal outcomes include:
• changes in economic and other parameters;
• matters not included in the fiscal forecasts because of uncertainty about their timing, magnitude and/or likelihood; and
• the realisation of contingent liabilities.
RISKS TO THE BUDGET
Economic and other parameters The revenue and expense estimates and projections are based on a range of economic and other parameters. If the economic outlook was to differ from that presented in Statement 3, the revenue and expense estimates and projections would also change. Statement 3 discusses risks to the economic forecasts. Statement 2 discusses the sensitivity of revenue and expense estimates to changes in the major economic parameters.
Fiscal risks Fiscal risks are general developments or specific events that may affect the fiscal outlook. Some developments or events simply raise the possibility of some fiscal impact. In other cases, some fiscal impact may be reasonably certain, but it will not be included in the forward estimates because the timing or magnitude is not known. Fiscal risks may affect expenses and/or revenue and may be positive or negative on revenue, expenses and/or the budget balance.
Statement 11: Statement of Risks
11-3
Contingent liabilities Contingent liabilities are defined by the accounting standard AASB 1044, which came into effect on 1 July 2002. Broadly, they represent possible costs to the Australian Government arising from past events that the outcome of future events will confirm. Contingent liabilities include loan guarantees, non-loan guarantees, warranties, indemnities, uncalled capital and letters of comfort. These possible costs are in addition to those recognised as liabilities in the consolidated financial statements of the Australian Government general government sector.
The Australian Government’s major exposure to contingent liabilities arises from legislation guaranteeing certain liabilities of Australian Government controlled financial institutions (the Reserve Bank of Australia and the Export Finance and Insurance Corporation) and the now fully privatised Commonwealth Bank of Australia.
Strategies to manage these exposures aim to ensure the underlying strength and viability of the entities, so that the guarantees are not triggered. Similar strategies may be adopted in relation to entities not subject to explicit guarantees.
Another class of contingent liability is uncalled capital, which reflects a financial commitment to an institution where no promissory note is issued by the Australian Government. Uncalled capital is primarily associated with international financial institutions such as the International Bank for Reconstruction and Development, the Asian Development Bank, the European Bank for Reconstruction and Development and the Multilateral Investment Guarantee Agency. When promissory notes are issued, such as in the case of the International Monetary Fund, the amounts are recorded in the general government balance sheet, so contingent liabilities (or assets) are not shown for those amounts.
Details of fiscal risks and contingent liabilities Fiscal risks and contingent liabilities with a possible impact on the forward estimates greater than $20 million in any one year, or $40 million over the forward estimates period, are listed below.
Information on fiscal risks takes account of Parliament’s decisions and other developments until the close of parliamentary business on 30 April 2005. In general, information on contingent liabilities is based on information provided by Australian Government departments and agencies and is current to 31 March 2005 (or later as indicated). However, in some cases, earlier dates are used and are noted in the relevant section.
Information on contingent liabilities is also provided in the annual financial statements of departments and non-budget entities.

Part 4: Financial Reporting Standards and Financial Statements
11-4
Table 1: Summary of changes to Statement of Risks since 2004-05 Budget and Mid-Year Economic and Fiscal Outlook
Specific risks — revenue Status Renegotiation of withholding tax rates in certain Australian double tax treaties Modified
Fiscal risks — expenses
Agriculture, Fisheries and Forestry Exceptional Circumstances assistance for drought affected farmers Modified
Contingent liabilities — quantifiable
Defence Guarantees Modified
Employment and Workplace Relations Special Employee Entitlements Scheme for Ansett group employees Deleted
Finance and Administration Australian Industry Development Corporation Modified ComLand Limited Deleted
Foreign Affairs and Trade Export Finance and Insurance Corporation Modified
Industry, Tourism and Resources Timor Sea Designated Authority — litigation New
Transport and Regional Services Maritime industry reform Modified
Treasury Guarantees under the Commonwealth Bank Sale Act 1995 Modified Reserve Bank of Australia — guarantee Modified Uncalled capital subscriptions — international financial institutions Modified
Various Asbestos related disease claims Deleted
Contingent liabilities — unquantifiable Attorney-General’s
Southern Ocean surveillance Modified
Communications, Information Technology and the Arts New South Wales Councils Deleted
Defence Military Superannuation and Benefits Scheme — indemnity New
Education, Science and Training Australian Nuclear Science and Technology Organisation — delays in the commissioning of Replacement Research Reactor Deleted
Australian Nuclear Science and Technology Organisation — indemnity New

Statement 11: Statement of Risks
11-5
Table 1: Summary of changes to Statement of Risks since 2004-05 Budget and Mid-Year Economic and Fiscal Outlook (continued)
Contingent liabilities — unquantifiable (continued)
Finance and Administration Australian Technology Group — directors’ indemnities New ComLand Limited — directors’ indemnities Modified ComLand Limited — land remediation Deleted ComLand Limited — site contamination New Health Insurance Commission Deleted Members of Parliament Staff Employee Entitlements Deleted Potential claims relating to superannuation benefits New Sydney Airports Corporation Limited, Bankstown, Camden and Hoxton Park Airports — directors’ indemnities Modified
Tuggeranong Office Park Pty Ltd Deleted Tuggeranong Office Park Pty Ltd — shareholder indemnity New Indemnities relating to other former asset sales, privatisations and IT outsourcing projects Modified
Health and Ageing CSL Limited Modified
Industry, Tourism and Resources Litigation New
Transport and Regional Services Deep vein thrombosis action Modified Tripartite deeds relating to the sale of Federal leased airports Modified
Treasury Terrorism insurance — commercial cover Modified
Note: Risks appearing in this Statement but not listed in the table above are substantially unchanged since disclosed in Budget Paper No. 1, Budget Strategy and Outlook 2004-05, Statement 11 or in Mid-Year Economic and Fiscal Outlook 2004-05, Appendix D.
FISCAL RISKS — REVENUE
The Government’s revenue and policy measure forecasts, like all forecasts, are subject to a margin of error.
Over the past 20 years, the errors associated with the forecasts of cash receipts have not been significantly different from zero and there has been no bias towards either understatement or overstatement. Over this period, the average error was 0.6 per cent, with the errors varying around this average by 2.7 percentage points. There are not enough data to assess the forecasting performance for accrual revenue.
However, in recent years revenue has grown more strongly than forecast. The revenue forecasting methodology has been adjusted from this Budget to align the revenue forecasts and projections more closely to recent experience (see Box 1, Statement 5).

Part 4: Financial Reporting Standards and Financial Statements
11-6
While many of the forecasts are reported to the nearest million dollars for budget accounting purposes, they should not be interpreted as implying an equivalent level of forecast precision.
The general and specific risks influencing the accuracy of the revenue forecasts are outlined below.
General risks The estimates and projections of revenue are subject to a number of general pressures that can affect taxation collections. These general pressures include tax avoidance, developments in communications technology and workplace arrangements, court decisions and Australian Taxation Office rulings. These pressures may result in a shift in the composition of taxation collected from the various tax bases and/or a change in the size of the tax base. The revenue forecasts include an appropriate allowance for these factors, given the data available.
Specific risks Renegotiation of withholding tax rates in certain Australian double tax treaties
The Australian Government is renegotiating its double tax treaties with several countries. Depending on the negotiated outcomes, changes to these treaties could have positive or negative revenue effects.
FISCAL RISKS — EXPENSES
Agriculture, Fisheries and Forestry Exceptional Circumstances assistance for drought-affected farmers
Exceptional Circumstances assistance is available, subject to eligibility criteria, to drought-affected farmers by way of interest rate subsidies and/or income support. The forward estimates assume that there will be neither new drought declarations nor extensions of existing declarations. A return to severe drought conditions could result in higher than expected expenses for these forms of assistance. It is not possible to quantify the cost arising from such potential developments as this depends on intensity, duration and scale of future drought conditions.
Finance and Administration Asset sales — Telstra
The forward estimates include the effect of the sale of the Australian Government’s shareholding in Telstra, noting that the level of proceeds will depend, inter alia, on the prevailing levels of world equity markets at the time of sale and that the timing of the sale could be adjusted if market levels are considered unlikely to provide an
Statement 11: Statement of Risks
11-7
appropriate return to taxpayers. The sale is conditional on the Government being satisfied that arrangements are in place to deliver adequate telecommunications services, particularly in rural and regional Australia. The sale is also dependent on the passage of legislation through the Parliament.
Health and Ageing Medicare Benefits Schedule and Pharmaceutical Benefits Scheme
From time to time items are added to or removed from the Medicare Benefits Schedule and Pharmaceutical Benefits Scheme schedules, so major new developments in medicines or medical procedures could result in increases in expenses that exceed the provision in the forward estimates. Similarly, significant shifts in Pharmaceutical Benefits Scheme usage patterns and/or doctors’ charging patterns for Medicare Benefits Schedule services could result in increases in expenses that exceed the provision in the forward estimates. It is not possible to quantify the fiscal risk arising from such potential developments.
Immunisation funding mechanism
Future vaccine technology will result in new vaccines substituting for those already in use (for example, multivalent vaccines which combine several vaccines into one) and, as a consequence, could result in higher unit costs of vaccine within the routine schedule of vaccinations. Potential costs cannot be precisely quantified at this stage.
Transport and Regional Services Airservices Australia
On 31 August 2004, the Minister for Transport and Regional Services, pursuant to section 16 of the Airservices Act 1995 (the Act), gave a direction to Airservices Australia (AA), which requires AA to provide an operating control tower and approach radar control services in certain volumes of airspace. Section 16(4) of the Act provides that AA may seek reimbursement from the Australian Government for any financial detriment it suffers as a result of complying with a direction. At this time, the quantum or nature of any financial detriment is uncertain, as is the nature of any consequent fiscal risk to the budget.
CONTINGENT LIABILITIES — QUANTIFIABLE
Attorney-General’s Indemnities relating to the Air Security Officer programme
The Australian Government has entered into indemnity agreements with Australian airlines that agree to fly aircraft with Air Security Officers on board. The indemnity agreements limit the Australian Government’s exposure up to a maximum of $2 billion per incident. The indemnity applies to the extent that any loss is not covered by

Part 4: Financial Reporting Standards and Financial Statements
11-8
existing relevant insurance policies held by the airline and only applies where the airline(s) can prove that an action on the part of an Air Security Officer under or in connection with the Air Security Officer programme caused a loss.
Defence Guarantees
Defence carries an extensive range of guarantees and undertakings, normally of a short-term nature, relating to business, training activities and other arrangements involving contracts, agreements and other Defence activities. Indemnities issued cover potential losses or damages for which the Australian Government would be liable.
There are 130 instances of contingencies that are unquantifiable, and 188 instances of quantifiable contingencies to the value of $4.8 billion. While these contingencies are considered remote, they have been reported in aggregate for completeness.
Finance and Administration Australian Industry Development Corporation
Under the Australian Industry Development Corporation Act 1970 certain obligations of the Australian Industry Development Corporation (AIDC) are guaranteed by the Australian Government. As at 31 December 2004, AIDC’s contingent liabilities, subject to Australian Government guarantee, were approximately $126 million in respect of guarantees and credit risk facilities.
In addition, AIDC had outstanding Australian Government guaranteed borrowings which totalled approximately $537 million as at the most current valuation of 31 December 2004. These borrowing obligations have been matched by AIDC’s holdings of Australian Government guaranteed securities of similar value, largely eliminating the Australian Government’s guarantee exposure. These securities were purchased on-market by UBS Warburg and paid to AIDC as consideration for UBS Warburg’s purchase of AIDC Limited’s (a subsidiary of AIDC) financial assets. UBS AG, the international parent company that has taken over from UBS Warburg, manages this borrowing portfolio on behalf of AIDC. The UBS AG arrangement also provides a guarantee to cover any cash flow differences between the interest rate and maturity profiles of the matched borrowings and securities, together with any exchange rate movements in the borrowings. The Australian Government’s contingent exposure to these borrowings is therefore negligible and is consequently recorded as zero.
Litigation
The Department of Finance and Administration is involved in litigation where a counter-claim for damages has been lodged against the Australian Government. The counter-claim, which will be vigorously defended by the Australian Government,

Statement 11: Statement of Risks
11-9
seeks damages of $4.3 billion although the basis for this amount is yet to be fully provided.
Sale of Sydney Airports Corporation Limited
An indemnity has been provided to Southern Cross Airports Corporation as purchaser of the Sydney Airports Corporation Limited in the event of a liability arising under Chapter 3 of the Duties Act 1997 (New South Wales) by reason of the sale of shares in Sydney Airports Corporation Limited constituting a relevant acquisition in a land-rich private corporation. In the event the liability arises it is estimated to be between $221.2 million and $282.8 million.
Foreign Affairs and Trade Export Finance and Insurance Corporation
The Australian Government guarantees the due payments by the Export Finance and Insurance Corporation (EFIC) of money that is, or may at any time become, payable by EFIC to any body other than the Australian Government. The Australian Government also has in place a $200 million callable capital facility available to EFIC on request to cover liabilities, losses and claims. The Australian Government’s total contingent liability is $3.5 billion, comprising EFIC’s liabilities to third parties ($2.9 billion) and EFIC’s overseas investments insurance, contracts of insurance and guarantees ($546 million).
Immigration and Multicultural and Indigenous Affairs Immigration detention services
The contract with GSL (Australia) Pty Ltd (previously Group 4 Falck Global Solutions Pty Ltd) commenced on 1 September 2003. The Australian Government has agreed to limit GSL’s exposure under the liability regime of the contract. While the general contract requires GSL to indemnify the Australian Government for certain claims of losses, the Australian Government has agreed to share the risk. Subject to certain conditions, GSL has been indemnified against claims of losses above a fixed amount to a capped amount. Where claims exceed the cap in any financial year, responsibility for the excess reverts to GSL.
A further limitation of liability has been provided in relation to loss or damage to Australian Government property or equipment as a result of the actions of detainees. Under the contract, GSL’s liability for detainee damage is subject to an annual limit, unless claims of losses exceed an agreed cap.
Industry, Tourism and Resources Timor Sea Designated Authority — litigation
PetroTimor, a subsidiary of the Portuguese registered company Oceanic Exploration, was granted a concession for petroleum exploration in an area of the Timor Sea by

Part 4: Financial Reporting Standards and Financial Statements
11-10
Portugal in 1974. Following Indonesia’s annexation of East Timor, PetroTimor ceased operations. With the subsequent Timor Gap Treaty between Australia and Indonesia (and now the Timor Sea Treaty between Australia and Timor-Leste), Oceanic Exploration is arguing that its rights have been alienated and it is currently seeking damages against the Timor Sea Designated Authority up to US$30 billion (the Australian Government share of which could be up to US$3 billion) through the United States Court for the District of Columbia.
Transport and Regional Services Maritime industry reform
On 18 August 1998, the Australian Government provided a guarantee to cover borrowings made by the Maritime Industry Finance Company Limited to finance redundancy-related payments in the stevedoring and maritime industries. Outstanding borrowings covered by the guarantee are $107.1 million.
Treasury Guarantees under the Commonwealth Bank Sale Act
Under the terms of the Commonwealth Bank Sale Act 1995, the Australian Government has guaranteed various superannuation and other liabilities amounting to around $12.8 billion. Of this amount, $9.3 billion was attributable to liabilities of the Commonwealth Bank of Australia at 30 September 2004 and $3.5 billion was attributable to liabilities of the Commonwealth Bank Officers’ Superannuation Corporation at 30 June 2004.
Reserve Bank of Australia — guarantee
This contingent liability relates to the Australian Government’s guarantee of the liabilities of the Reserve Bank of Australia. It is measured as the Bank’s total liabilities excluding capital, reserves and Australian Government deposits. The major component of the Bank’s liabilities are notes (that is, currency) on issue. Currently, notes on issue amount to $36.1 billion and the total guarantee is $43.8 billion.
International financial institutions — uncalled capital subscriptions
This contingent liability relates to the value of the uncalled portion of the Australian Government’s shares in the International Bank for Reconstruction and Development (US$2.8 billion — estimated value A$3.6 billion), the Asian Development Bank (US$2.4 billion — estimated value A$3.2 billion), the European Bank for Reconstruction and Development (US$81.7 million plus €77.5 million — estimated value A$235.6 million), and the Multilateral Investment Guarantee Agency (US$26.5 million — estimated value A$34.3 million).

Statement 11: Statement of Risks
11-11
CONTINGENT LIABILITIES — UNQUANTIFIABLE
Attorney-General’s Native title agreements — access to geospatial data
The Australian Government has entered into agreements with state and territory government bodies and/or their agents to access their geospatial data. The data is essential to support the National Native Title Tribunal in achieving its outcome. Under these agreements, the Australian Government provides indemnities against third party claims arising from errors in the data.
Native title costs
The Australian Government has offered to assist the states in meeting compensation costs associated with native title. The amounts that might be paid by the Australian Government will be subject to the terms of financial assistance agreements being negotiated with the states, and liabilities arising from the 1998 amendments to the Native Title Act 1993. The Australian Government’s liability cannot be quantified due to uncertainty about the number and effect of compensable acts, both in the past and in the future, and the value of native title affected by those acts. Similarly, it is not possible to quantify the liability for compensable acts for which the Australian Government may be directly liable.
The Australian Government has also offered to assist the states with the costs of bodies performing native title functions under state legislation. The extent of this assistance will depend on the existence of such bodies, the timing of their recognition and the extent of their use.
Southern Ocean surveillance
The Australian Government has entered into contractual arrangements with P&O Maritime Services for the provision of maritime charter services until June 2006 to facilitate the Australian Customs Service and the Department of Agriculture, Fisheries and Forestry armed patrols of Australia’s exclusive economic zone in the Southern Ocean.
The Australian Government will indemnify P&O Maritime Services against certain claims arising from the discharge of firearms or munitions, or where a steaming party is deployed to crew a seized vessel back to an Australian port. Whether those indemnity arrangements are maintained once the measure Southern Ocean surveillance — continuation is in place will depend on the outcome of contractual negotiations for the continued provision of maritime charter services.

Part 4: Financial Reporting Standards and Financial Statements
11-12
Communications, Information Technology and the Arts Art Indemnity Australia
Art Indemnity Australia is a programme through which the Australian Government indemnifies cultural objects loaned to exhibitions displayed in Australian museums and galleries. The exact amounts involved will vary with the exchange rate applying at the time any claim for loss or damage to an artwork or heritage object loaned from overseas is paid, and the extent of any loss or damage. Most of the Australian Government risk in indemnifying exhibitions is insured through Comcover. Uninsurable risk continues to be borne solely by the Australian Government.
Defence ADI Limited — officers and directors’ indemnities
Under the sale agreements for ADI Limited, the Australian Government had indemnified the directors, officers and employees for claims and legal costs associated with assistance related to the sale of the Australian Government’s shares in the company. The Australian Government has provided an indemnity to ADI Limited for uninsured losses relating to specific heads of claims.
ASC Pty Ltd — Australian Government indemnities provided to Electric Boat Corporation under the Services Agreement
In early October 2002 the Department of Defence entered into a Services Agreement with Electric Boat Corporation (EB) and its subsidiary Electric Boat Australia (EBA) to provide technical and commercial support to ASC Pty Ltd as it transitioned from being a producer of submarines to an agency for through-life support. EB/EBA staff commenced at ASC Pty Ltd on 14 October 2002. The Services Agreement will run for three years with up to four annual extensions.
Under this agreement, EB and EBA were provided with a warranty by the Australian Government and ASC Pty Ltd that they had the right to provide EB/EBA with confidential and other information and the Australian Government provided an indemnity to EB and EBA against claims arising from a breach of that warranty.
The Australian Government also indemnified EB and EBA against claims arising from property loss or personal injury resulting from a defect in the operation or performance of a Collins Class submarine, other than caused by unlawful conduct, gross negligence or wilful misconduct of EB or EBA, against claims exceeding the greater of US$1 million or profit earned by EB under the agreement.
HMAS Melbourne and HMAS Voyager damages claims
Former crew members of HMAS Melbourne have instituted legal proceedings against the Australian Government claiming damages for injuries allegedly caused by the HMAS Voyager/HMAS Melbourne collision on 10 February 1964. One hundred and twenty seven claims remain current. Eighty six of the current claims are statute barred
Statement 11: Statement of Risks
11-13
under applicable state laws. In those cases, the plaintiffs will require an extension of time prior to progressing their claims for damages. A number of dependency claims arising from that collision have also been foreshadowed by the dependants of deceased former members of the crew of HMAS Voyager. Further claims are likely to be made in connection with the collision.
Litigation cases
The Department of Defence is involved in a wide range of litigation and other claims for compensation and/or damages that may result in litigation where the matters have yet to be finalised by negotiation or, where required, litigation. Various claims, the subject of cases that have yet to be heard, are part heard or are subject to an appeal, await a decision on what (if any) damages and/or costs should be paid to the claimant. The litigated and non-litigated claims include common law liability claims and claims arising from complaints to the Human Rights and Equal Opportunity Commission. The litigation includes asbestos claims and claims from injury resulting from the F-111 Deseal/Reseal programmes. Claims have been received for damage caused by the use of Defence Practice Areas and from the presence of unexploded World War II ordnance. In total there are about 400 claims at present, with a value in excess of $145 million. There is identified potential for claims within the above from known incidents of non-military asbestos exposure and the F-111 Deseal/Reseal project of some 130 claims with a value of some $30 million.
Military Superannuation and Benefits Scheme — indemnity
The Military Superannuation and Benefits Scheme (MSBS) provides occupational superannuation benefits for members of the Australian Defence Force. Much of the day-to-day administration associated with the MSBS is conducted by ComSuper. Under the Military Superannuation and Benefits Act 1991 the actions of ComSuper and its Commissioner are deemed to be those of the Military Superannuation and Benefits Board (MSB Board). Defence will indemnify the MSB Board for certain specified claims that are made in relation to acts of ComSuper and/or its Commissioner that are not recoverable elsewhere.
Education Science and Training Australian Nuclear Science and Technology Organisation — indemnity
The Australian Government has indemnified the Australian Nuclear Science and Technology Organisation and its officers from liability that might be incurred from the conduct of activities authorised under the Australian Nuclear Science and Technology Organisation Act 1987. This indemnity is additional to the commercial insurance covers obtained from the Comcover Insurance Pool and other insurers.

Part 4: Financial Reporting Standards and Financial Statements
11-14
Finance and Administration Australian Industry Development Corporation — board members’ and management indemnity
The Australian Government has indemnified the Corporation’s board members and management against civil claims relating to employment and conduct as directors and management of subsidiary companies. Liability is subject to the terms of the indemnities.
ASC Pty Ltd — Australian Government shareholding
The Australian Government has indemnified Barry AC Hilson and BACH Pty Ltd in relation to liabilities arising from assistance provided to the Australian Government during the conduct of a review of the Australian Government’s shareholding in ASC Pty Ltd. This indemnity is ongoing.
ASC Pty Ltd — directors’ indemnities
The Australian Government has indemnified the members of the board of ASC Pty Ltd for any claims and all legal costs arising from the result of the directors acting in accordance with the board’s tasks and responsibilities as defined under the indemnity.
The Australian Government has indemnified the ASC Directors for any claim made against them as a result of complying with ASC’s obligations under the Process Agreement between the Electric Boat Corporation (EBC), the Australian Government and ASC; and under the Services Agreement between ASC, the Australian Government, EBC and Electric Boat Australia.
Australian Technology Group — directors’ indemnities
The Australian Government has indemnified Australian Government officials appointed as directors of the Australian Technology Group for liabilities relating to any action taken in their capacity as a director of the company. This includes any reasonable legal costs and expenses incurred by a director even after they have ceased to be a director.
ComLand Limited — directors’ indemnities
Ongoing indemnities have been provided to former directors of ComLand Ltd, the former General Manager of ComLand Ltd and to DBYB Pty Ltd, against liabilities incurred in respect of assistance provided to the Australian Government during the ComLand scoping study and subsequent sale process.
ComLand Limited — site contamination
Footscray Land Limited is indemnified until 31 December 2019 in respect of certain contamination claims exceeding $7.5 million in aggregate at its Edgewater (Maribyrnong) site. St Marys Land Limited is indemnified until 31 December 2024 in

Statement 11: Statement of Risks
11-15
respect of certain contamination claims and costs exceeding $25 million in aggregate at its St Marys (western Sydney) site.
Employment National Limited — board members’ and Chief Executive Officer’s indemnity
Indemnities by the Australian Government have been provided to Employment National Limited board members and the Chief Executive Officer to protect against civil claims relating to their employment and conduct as directors. These indemnities are ongoing.
Indemnities for the Reserve Bank of Australia and private sector banks
Under agencies’ contracts for transactional banking services, the Australian Government has indemnified the Reserve Bank of Australia and contracted private sector banks. These banks are indemnified against loss and damage arising from error or fraud by the agency, or transactions made by the bank with the authority of the agency.
Potential claims relating to superannuation benefits
On 4 March 2005, the Supreme Court of the Australian Capital Territory found against the Commonwealth of Australia on a claim for negligence and breach of contract relating to superannuation benefits for a former employee of the Department of the Interior. This is considered to be a test case for several hundred named potential plaintiffs. In addition there is potential for more claims to arise from other former employees. An appeal against the decision of the ACT Supreme Court was lodged in March 2005.
Sydney Airports Corporation Limited, Bankstown, Camden and Hoxton Park Airports — directors’ indemnities
The Australian Government has indemnified each member of the board of directors of Sydney Airports Corporation Limited, Bankstown Airport Limited, Camden Airport Limited, and Hoxton Park Airport Limited against claims and costs incurred arising from the conduct of the directors in relation to the sale, or scoping study for the sale, of these airports. Where certain company insurances or indemnities exist for the directors in relation to a claim, the Australian Government indemnity cannot be called upon.
Tuggeranong Office Park Pty Ltd — shareholder indemnity
As part of the arrangements for Tuggeranong Office Park, the Australian Government can acquire the shares of the Tuggeranong Office Park Pty Ltd for $100 subject to certain conditions. In its capacity as purchaser of the shares, the Australian Government has indemnified each Shareholder for all ‘losses, liabilities, costs, expenses and damages’ incurred by virtue of their shareholding. If a capital gains tax liability were to accrue to the Shareholders, the Australian Government may be required to reimburse the Shareholders. The Department of Finance and Administration will be seeking advice from the Australian Tax Office on this issue.
Part 4: Financial Reporting Standards and Financial Statements
11-16
Indemnities relating to other former asset sales, privatisations and IT outsourcing projects
Ongoing indemnities have been given in respect of a range of asset sales, privatisations and IT outsourcing projects that have been conducted by the Department of Finance and Administration (Finance), and the former Office of Asset Sales and Commercial Support and its predecessors. The probability of an action being made under one of these indemnities diminishes over time. Details of indemnities in respect of the other asset sales and privatisations have been provided in previous Budget and Mid-Year Economic and Fiscal Outlook papers, and previous annual reports for Finance and the Office of Asset Sales and Commercial Support.
Indemnities (including the year they were raised) are still current for: ADI Ltd (1998), Australian Airlines (1991), Australian Industry Development Corporation (1996), Australian Multimedia Enterprise (1997), Australian National Rail Commission and National Rail Corporation Ltd (1997 and 2000), Commonwealth Accommodation and Catering Services (1988), Commonwealth Bank of Australia (1993 to 1996), Commonwealth Funds Management and Total Risk Management (1996 to 1997), Essendon Airport Ltd (2001), Federal Airports Corporation’s Airports (1995 to 1997), Home Loans Insurance Commission Ltd (1996), Health Insurance Commission (2000), National Transmission Network (1999), Telstra (1996 and 1999), Wool International (1999). The Department does not currently expect any action to be taken in respect of these indemnities.
Foreign Affairs and Trade Export Finance and Insurance Corporation — board members’ and senior management indemnities
The Australian Government has provided certain indemnities to Export Finance and Insurance Corporation (EFIC) board members and senior management to protect against civil claims and legal expenses for unsuccessful criminal claims relating to the implementation of EFIC’s alliance/divestment of its short-term export credit insurance business.
Health and Ageing Blood and blood products liability cover
A National Managed Fund (NMF) has been established which pools the liability risks associated with the supply of blood and blood products by the Australian Red Cross Blood Service (ARCBS) between the Australian Government, the ARCBS and the states and territories. The NMF is covered by a Memorandum of Understanding (MoU) between the Australian Government, states and territories, and the ARCBS. This will be amended to incorporate the operations of the Jurisdictional Blood Committee (JBC) and the National Blood Authority. The MoU provides for the parties to contribute to the NMF taking into account potential claims payments; the level of funds in the NMF and investment earnings; and a prudential allowance for liabilities incurred but not yet

Statement 11: Statement of Risks
11-17
the subject of claims. If there are insufficient funds to cover claim costs, the JBC considers a report provided by the National Funds Manager to determine the level of funds required. Each party must contribute funds, as determined by JBC, in accordance with allocation provisions prevailing at the time. Under the MoU, the blood and blood products liability cover for the ARCBS remains in force until all parties agree to terminate the arrangements from an agreed date.
CSL Limited
CSL Limited is indemnified against claims made by persons who contract specified infections from specified products and against employees contracting asbestos-related injuries. CSL Limited has unlimited cover for most events that occurred before the sale of CSL Limited on 1 January 1994, but has more limited cover for a specified range of events that occurred during the operation of the Plasma Fractionation Agreement, from 1 January 1994 to 31 December 2004. Where alternative cover was not arranged by CSL Limited, the Australian Government may have a contingent liability. Given the open-ended nature of some of the indemnities, damages and risk cannot be quantified. No similar indemnities have been given to CSL Limited in the new Plasma Products Agreement operating from 1 January 2005.
Medical Indemnity Exceptional Claims Scheme
In May 2003 the Prime Minister announced the Medical Indemnity Exceptional Claims Scheme to assume liability for 100 per cent of any damages payable against a doctor that exceeds a specified level of cover provided by that doctor’s medical indemnity insurer, currently $20 million. These arrangements will apply to payouts related to either a single large claim or to multiple claims that in aggregate exceed the cover provided by the doctor’s medical indemnity insurer, and will apply to claims notified under contracts-based cover since 1 January 2003.
Indemnity relating to smallpox vaccine
On 12 December 2002, the Australian Government took possession of an initial shipment of 50,000 doses of smallpox vaccine. This vaccine, to be used only in emergency situations, was the only type available for large-scale purchase and was manufactured using older style technology. The Government granted an indemnity to the manufacturer covering possible adverse events that could result from the use of the vaccine.
Immigration and Multicultural and Indigenous Affairs Separation of Aboriginal children from their families in the Northern Territory
Earlier laws, policies and practices in relation to the Australian Government’s administration of the Northern Territory led to the separation of certain Indigenous children from their families. There are currently over 2,000 plaintiffs with claims pending against the Australian Government for (unspecified) damages in relation to alleged forcible and wrongful separations (mostly by the children of those allegedly

Part 4: Financial Reporting Standards and Financial Statements
11-18
forcibly and wrongfully removed). Two claims have proceeded to trial. Both were unsuccessful.
Claim of unlawful detention on Nauru
On 16 December 2003, 325 plaintiffs claiming to be detained on Nauru commenced an action in the Supreme Court of Victoria. The claim alleges that the plaintiffs have been detained at the request of, or by agents of, the Australian Government, and that the detention amounts to false imprisonment. The plaintiffs seek a declaration that they have been falsely imprisoned by the Australian Government, an injunction to restrain the Australian Government or its agents from continuing to detain the plaintiffs, and damages. The case has not yet been listed for hearing.
Industry, Tourism, and Resources Liability for damages caused by space activities
Under the United Nations Convention on International Liability for Damage Caused by Space Objects, the Australian Government is liable to pay compensation for damage caused to nationals of other countries by space objects launched from, or by, Australia. The Australian Government requires the responsible party for a space activity approved under the Space Activities Act 1998 to insure against liability for damage to third parties for an amount not less than the maximum probable loss, up to a maximum of $750 million. Under the Space Activities Act, the Australian Government also accepts liability for damage suffered by Australian nationals, to a maximum value of $3 billion above the insured level.
Litigation
The Department of Industry, Tourism and Resources is involved in litigation concerning the Textile, Clothing and Footwear (TCF) Strategic Investment Programme (SIP). The TCF SIP is an entitlement-based programme that provides grants to support eligible capital investment and product innovation by TCF firms. The litigation relates to disputed claims of eligibility under the TCF SIP. There are potential risks associated with flow-on claims and the risk cannot yet be accurately quantified.
Snowy Hydro Limited — directors’ indemnities
The Australian Government has, together with the co-shareholder Governments of New South Wales and Victoria, indemnified the members of the board of Snowy Hydro Limited for liabilities arising from entering into agreements to implement corporatisation of the Snowy Mountains Hydro-Electric Scheme, and from liabilities to Snowy Hydro Limited at corporatisation. The indemnity will apply to liabilities arising within five years of corporatisation, and for which a claim is notified to the Governments within eleven years of the corporatisation date of 28 June 2002.

Statement 11: Statement of Risks
11-19
Snowy Hydro Limited — water releases
The Australian, New South Wales and Victorian Governments have indemnified Snowy Hydro Limited for liabilities arising from water releases in the Snowy River below Jindabyne Dam, where these releases are in accordance with the water licence and related regulatory arrangements agreed between the three Governments. The indemnity will apply to liabilities for which a claim is notified within 20 years from 28 June 2002.
The Australian, New South Wales and Victorian Governments will provide financial support to the company, if this is necessary, to avoid the company breaching its loan covenants to fund the cost of civil works required to address a cold water pollution offence. The undertaking applies for seven years from 28 June 2002.
Transport and Regional Services Deep vein thrombosis action
The Civil Aviation Safety Authority (CASA) has been named in a number of writs, which allege that CASA was negligent in not making air travellers aware of the risks of deep vein thrombosis during long periods of immobility. There have been 484 writs issued against CASA, spanning 1995 to 2002. The Australian Government’s exposure is limited to claims for the years 1995 to 5 July 1998, as CASA was covered by a Commonwealth Deed of Indemnity in relation to the performance of its regulatory functions. Ninety-nine writs have been issued against CASA which are covered by the Deed of Indemnity. The remaining writs are covered by CASA’s commercial insurance.
A test case (Povey v Qantas and British Airways and CASA) is currently before the High Court on appeal from the Victorian Supreme Court. However, until the High Court proceedings have been finalised, it is not possible to determine what (if any) liability CASA may have in relation to deep vein thrombosis.
Maritime Industry Finance Company Limited — board members’ indemnity
Indemnities for Maritime Industry Finance Company Limited board members have been provided to protect them against civil claims relating to their employment and conduct as directors.
Tripartite deeds relating to the sale of Federal leased airports
Tripartite deeds apply to 12 Federal leased airports (Adelaide, Alice Springs, Bankstown, Brisbane, Canberra, Coolangatta, Darwin, Launceston, Melbourne, Perth, Sydney and Townsville). The tripartite deeds between the Australian Government, the airport lessee company and financiers provide for limited step-in rights for the financiers in circumstances when the airport lease is terminated to enable the financiers to correct the circumstances that triggered such a termination event.

Part 4: Financial Reporting Standards and Financial Statements
11-20
Treasury Housing Loans Insurance Corporation — guarantee
The Australian Government sold the Housing Loans Insurance Corporation (HLIC) on 12 December 1997 and has assumed all residual contingencies. The principal amount covered by the guarantee and the balances outstanding are unable to be reliably measured. The guarantee relates essentially to the HLIC’s contracts of mortgage insurance and any borrowings approved by the Treasurer up to the time of sale.
Terrorism insurance — commercial cover
The Terrorism Insurance Act 2003 (the Act) established a scheme for replacement terrorism insurance covering damage to commercial property including associated business interruption and public liability. The scheme plans to accumulate approximately $300 million from reinsurance premiums paid to the Australian Reinsurance Pool Corporation (ARPC) to help meet administrative expenses and future claims. The Commonwealth guarantees to pay any liabilities of the ARPC, but the Treasurer must declare a reduced payout rate to insureds if the Commonwealth’s liability would otherwise exceed $10 billion.