PART 3: TRAINER’S GUIDE - Home | ENN · 3 TRAINER’S GUIDE HTP, Version 2, 2011 Micronutrient...
42
PART 3 : TRAINER’S GUIDE The trainer’s guide is part three of four parts contained in this module. It is NOT a training course. Rather it provides guidance on how to design a training course by giving tips and examples of tools that the trainer can adapt. The trainer’s guide should only be used by experienced trainers to help develop a training course which meets the needs of a specific audience. The trainer’s guide is linked to the technical information found in part two of the module. Module 4 is about micronutrient malnutrition. It aims to help participants learn about a range of diseases that can be caused by micronutrient deficiencies, recognise the common signs and symptoms of these diseases, and understand the importance of good nutrition for avoiding these important public health problems. The module can used to provide a practical training for field workers involved in assessing micronutrient malnutrition. It can also provide a short practical briefing on different aspects of micronutrient malnutrition for senior managers. Navigating your way round these materials The trainer’s guide is divided into six sections. 1. Tips for trainer provide pointers on how to prepare for and organise a training course. 2. Learning objectives sets out examples of learning objectives for this module that can be adapted for a particular participant group. 3. Testing knowledge contains an example of a questionnaire that can be used to test participants’ knowledge of micronutrient malnutrition, either at the start or at the end of a training course. 4. Classroom exercises provide examples of practical exercises that can be carried out in a classroom context either by participants individually or in groups. 5. Case studies contain examples of case studies that can be used to get participants thinking through real-life scenarios. 6. Field-based exercises outline ideas for field visits that may be carried out during a longer training course. 1 HTP, Version 2, 2011 Micronutrient malnutrition MODULE 4
Transcript of PART 3: TRAINER’S GUIDE - Home | ENN · 3 TRAINER’S GUIDE HTP, Version 2, 2011 Micronutrient...

PART 3: TRAINER’S GUIDE
The trainer’s guide is part three of four parts contained in this module. It is NOT a training course. Rather it provides guidance onhow to design a training course by giving tips and examples of tools that the trainer can adapt. The trainer’s guide should onlybe used by experienced trainers to help develop a training course which meets the needs of a specific audience. The trainer’sguide is linked to the technical information found in part two of the module.
Module 4 is about micronutrient malnutrition. It aims to help participants learn about a range of diseases that can be caused bymicronutrient deficiencies, recognise the common signs and symptoms of these diseases, and understand the importance ofgood nutrition for avoiding these important public health problems. The module can used to provide a practical training forfield workers involved in assessing micronutrient malnutrition. It can also provide a short practical briefing on different aspectsof micronutrient malnutrition for senior managers.
Navigating your way round these materialsThe trainer’s guide is divided into six sections.
1. Tips for trainer provide pointers on how to prepare for and organise a training course.
2. Learning objectives sets out examples of learning objectives for this module that can be adapted for a particularparticipant group.
3. Testing knowledge contains an example of a questionnaire that can be used to test participants’ knowledge ofmicronutrient malnutrition, either at the start or at the end of a training course.
4. Classroom exercises provide examples of practical exercises that can be carried out in a classroom context either byparticipants individually or in groups.
5. Case studies contain examples of case studies that can be used to get participants thinking through real-life scenarios.
6. Field-based exercises outline ideas for field visits that may be carried out during a longer training course.
1HTP, Version 2, 2011
Micronutrient malnutritionMODULE 4

2
TRAINER’S GUIDE
HTP, Version 2, 2011
MODULE 4 Micronutrient malnutrition
CONTENTS
1. Tips for trainers
2. Learning objectives
3. Testing knowledge
Exercise 1: What do you know about micronutrient malnutrition?
Handout 1a: What do you know about micronutrient malnutrition? Questions
Handout 1b: What do you know about micronutrient malnutrition? Answers
4. Classroom exercises
Exercise 2: Identifying clinical signs of micronutrient deficiency diseases
Handout 2a: Photo cards of micronutrient deficiency diseases
Handout 2b: Test cards for micronutrient deficiency diseases
Handout 2c: Answers for test cards
Exercise 3: Analysing the nutrient content of a planned food aid ration
Handout 3a: Analysing the nutrient content of a planned food aid ration. Questions
Handout 3b: Food composition table
Handout 3c: Analysing the nutrient content of a planned food aid ration. Answers
Exercise 4: Analysing on-site distribution monitoring (Food basket monitoring) data
Handout 4a: Analysing on-site distribution monitoring (Food basket monitoring) data. Questions
Handout 4b: Onsite Distribution Monitoring data
Handout 4c: Analysing on-site distribution monitoring (Food basket monitoring) data. Answers
5. Case studies
Exercise 5: Planning an outbreak investigation
Handout 5a: Planning an outbreak investigation
Handout 5b: Planning an outbreak investigation (Model answer)
6. Field-based exercises
Exercise 6: Micronutrient malnutrition risk assessment
Handout 6a: Micronutrient malnutrition risk assessment (Trainer guide)

3
TRAINER’S GUIDE
HTP, Version 2, 2011
MODULE 4Micronutrient malnutrition
1. Tips for trainers
Step 1: Do the reading!• Read Parts 1 and 2 of this module.
• Familiarise yourself with the technical terms from the glossary.
• Read through the key documents recommended for each exercise
Step 2: Know your audience!• Find out about your participants in advance of the training:
° How many participants will there be?
° Do any of the participants already have experience in micronutrient malnutrition?
° Could participants with micronutrient malnutrition experience be involved in the sessions by preparing a case studyor contribute through describing their practical experience?
Step 3: Design the training!• Decide how long the training will be and therefore what activities you can cover within the time available. In general the
following guide can be used:
° A 90-minute classroom-based training can provide a basic overview.
° A half-day classroom-based training can provide an overview of micronutrient malnutrition and include somepractical exercises.
° A one-day classroom-based training can provide a more in-depth understanding of micronutrient malnutrition andinclude a number of practical exercises and/or one case study.
° A three to eight-day classroom plus field-based training can provide a full training in order to carry out an actualassessment suitable for a particular context. This would include case studies and field practical exercises.
• Identify appropriate learning objectives. This will depend on your participants, their level of understanding andexperience, and the aim and length of the training.
• Decide exactly which technical points to cover based on the learning objectives that you have identified.
• Divide the training into manageable ‘chunks’. One session should generally not last longer than an hour.
• Ensure the training is a good mix of activities i.e. mix PowerPoint presentations in plenary with more active participationthrough classroom-based exercises, mix individual work with group work.

4
TRAINER’S GUIDE
HTP, Version 2, 2011
MODULE 4 Micronutrient malnutrition
Step 4: Get prepared!• Prepare PowerPoint presentations with notes (if they are going to be used) in advance and do a trial run.
Recommended PowerPoint presentations that can be used or adapted are indicated in the exercises.
• Prepare exercises and case studies. These can be based on the examples given in this trainers’ guide but should beadapted for the particular training context.
• Prepare material for the participants (one copy each) to be given out at the start of the training. This should include:
° Timetable showing break times (coffee and lunch) and individual sessions
° Parts 1 and 2 from this module
• Ensure participants are provided with pens and paper, and calculator (if necessary).
REMEMBER
People remember 20% of what they are told, 40% of what they are told and read, and 80% of what they find out forthemselves.
People learn differently. They learn from what they read, what they hear, what they see, what they discuss with othersand what they explain to others. A good training is therefore one that offers a variety of learning methods which suit thevariety of individuals in any group. Such variety will also help reinforce messages and ideas so that they are more likelyto be learned.

5
TRAINER’S GUIDE
HTP, Version 2, 2011
MODULE 4Micronutrient malnutrition
2. Learning objectives
Below are examples of learning objectives for a session on micronutrient malnutrition. Trainers may wish to develop alternativelearning objectives that are appropriate to the particular participant group. The number of learning objectives should be limited;up to five per day of training is appropriate. Each exercise should be related to at least one of the learning objectives.
Examples of learning objectives
At the end of the training participants will:
• Have a basic understanding of the causes of micronutrient malnutrition
• Be able to recognise the common clinical signs of micronutrient deficiency disease
• Understand the indirect and direct approaches to assessing the risk and level of deficiency in a population
• Understand the meaning and significance of nutrient intake values
• Be able to calculate the micronutrient content of a food aid ration by hand
• Know how to use NutVal software to calculate the micronutrient content of a food aid ration
• Know how to calculate results from on-site distribution monitoring data
• Understand the importance of intra household food distribution in determining the risk of micronutrient malnutrition
• Be able to plan and carry out an investigation of a suspected outbreak of a micronutrient deficiency disease

6
TRAINER’S GUIDE
HTP, Version 2, 2011
MODULE 4 Micronutrient malnutrition
3. Testing knowledge
This section contains exercises that can be used to test participants’ knowledge of micronutrient malnutrition either at the startor at the end of a training session. The exercises could be adapted by the trainer to make them as relevant as possible to theparticipant group.
Exercise 1: What do you know about micronutrient malnutrition?
What is the learning objective?
• To test participants’ knowledge about micronutrient malnutrition
When should this exercise be done?
• Either at the start of a training session to establish the knowledge level.
• Or at the end of a training session to check how much participants’ have learnt.It is possible to use the first six questions at the start and the last six at the end.
How long should the exercise take?
• 25 minutes
What materials are needed?
• Handout 1a: What do you know about micronutrient malnutrition? Questionnaire
• Handout 1b: What do you know about micronutrient malnutrition? Answers (the answers can be read outto save on paper)
What does the trainer need to prepare?
• Familiarize yourself with the questionnaire and answers.
• Add your own questions and answers based on your knowledge of the participants and their knowledge.
Instructions
Step 1: Give each participant a copy of Handout 1a.
Step 2: Give participants 15 minutes to complete the whole questionnaire or 10 minutes for half of it.
Step 3: Give each participant a copy of Handout 1b or read out the answers.
Step 4: Give participants ten minutes to mark their own questionnaires and clarify the answers where necessary.

7
TRAINER’S GUIDE
HTP, Version 2, 2011
MODULE 4Micronutrient malnutrition
Handout 1a: What do you know about micronutrient malnutrition? QuestionnaireTime for completion: 15 minutes
Answer all the questions. (Choose one answer only for each question)
1. Which of the following sentences about micronutrients is true? Circle the correct answer
a) Micronutrients include proteins, fat and carbohydrate.
b) Micronutrients include vitamins and minerals that are essential for the healthy functioning of the human bodybut they are only required in small amounts.
c) Micronutrients are required in large amounts to prevent obesity.
2. What is pellagra? Circle the correct answer
a) A disease caused by a deficiency in niacin (vitamin B3).
b) A disease caused by a deficiency in ascorbic acid (vitamin C).
c) A rough area on the skin caused by a gunshot wound.
3. Iron deficiency is likely to lead to which symptom? Circle the correct answer
a) Pain in the leg joints
b) Double vision
c) Tiredness
4. Goitre is a clinical sign of which micronutrient deficiency? Circle the correct answer
a) Vitamin A
b) Iron
c) Iodine
5. Which of the following can cause anaemia? Circle the correct answer
a) Eating beans
b) Malaria
c) Catching a cold
6. Which of the following sentences is true? Circle the correct answer
a) Outbreaks of micronutrient deficiency disease happened in the past but are no longer seen
b) Modern food aid operations always supply adequate diets
c) Micronutrient deficiency disease is an ongoing public health problem
7. What is scurvy? Circle the correct answer
a) A disease caused by a deficiency in niacin (vitamin B3).
b) A disease caused by a deficiency in ascorbic acid (vitamin C).
c) A disease caused by a deficiency of vitamin D.
8. A deficiency in riboflavin (vitamin B2) can cause which clinical sign? Circle the correct answer
a) Bowlegs
b) Oedema
c) Angular stomatitis

8
TRAINER’S GUIDE
HTP, Version 2, 2011
MODULE 4 Micronutrient malnutrition
9. Which of these people is most likely to suffer from a micronutrient deficiency? Circle the correct answer
a) A women with a mixed diet of cereals, beans, vegetables and milk
b) A man who only eats maize porridge most days of the week
c) A child who eats adequately fortified blended food
10. Which of these statements about onsite monitoring of food aid distributions is true? Circle the correct answer
a) It monitors whether people are getting the planned ration
b) It reduces work for the implementing agency
c) It should always be done by the same agency that distributes the food ration
11. Which of these statements about doing a micronutrient malnutrition assessment is true? Circle the correct answer
a) A standard nutrition cluster survey is always the best way to assess micronutrient deficiencies
b) You will always save time by only consulting hospital records
c) Data on food aid distributions, case reports, and survey results may all be useful
12. Which of these statements about biochemical tests for micronutrient malnutrition is true? Circle the correct answer
a) A biochemical test is always better than using clinical signs
b) Easy to do biochemical tests are available for all micronutrient deficiencies
c) Biochemical tests can be useful for confirming a diagnosis and for measuring the extent of sub-clinical deficiency

9
TRAINER’S GUIDE
HTP, Version 2, 2011
MODULE 4Micronutrient malnutrition
Handout 1b: What do you know about micronutrient malnutrition? Answers
1. b)
2. a)
3. c)
4. c)
5. b)
6. c)
7. b)
8. c)
9. b)
10. a)
11. c)
12. c)

10
TRAINER’S GUIDE
HTP, Version 2, 2011
MODULE 4 Micronutrient malnutrition
What is the learning objective?
• Be able to recognise the common clinical signs of micronutrient deficiency disease
When should this exercise be done?
• After completing the first part of the module on the main micronutrients and their associated diseases.
How long should the exercise take?
• 25 minutes
What materials are needed?
• Handout 2a: Photo cards of micronutrient deficiency diseases
• Handout 2b: Test cards for micronutrient deficiency diseases
• Handout 2c: Answers for test cards
What does the trainer need to prepare?
• Familiarise yourself with the clinical signs shown on the photo-cards and test-cards.
• If using the PowerPoint files arrange for a data projector.
• If using the paper versions print copies in colour for use by participants.
• If using the laminated cards you will need to group participants together so they can share the training materials.Note: PowerPoint – MNDPhotoCards.ppt can be downloaded from http://www.ucl.ac.uk/cihd/research/nutrition/tools
Instructions
Step 1: Show the participants the Photo Cards and discuss the clinical signs that are seen for each micronutrientdeficiency disease.
Step 2: Remove the Photo Cards.
Step 3: Show the participants the Test Cards and ask them to identify and write down the clinical signs that they see.
Step 4: Provide the answers to the Test Cards and discuss with the participants.
4. Classroom exercises
This section provides examples of practical exercises that can be carried out in a classroom context either by participants indi-vidually or in groups. Practical exercises are useful to break up plenary sessions where the trainer has done most of the talkingas they provide an opportunity for participants to engage actively in the session. The choice of classroom exercises will dependupon the learning objectives and the time available. Trainers should adapt the exercises presented in this section to make themappropriate to the particular participant group. Preferably, trainers should use case examples with which they are familiar.
Exercise 2: Identifying clinical signs of micronutrient deficiency diseases

11
TRAINER’S GUIDE
HTP, Version 2, 2011
MODULE 4Micronutrient malnutrition
Handout 2a: Photo cards of micronutrient deficiency diseases
Photo card 1
Iron Deficiency Anaemia
Pale mucous membranes in the eye and the tongue are signs of anaemia.You may see these signs in males and females of all ages

12
TRAINER’S GUIDE
HTP, Version 2, 2011
MODULE 4 Micronutrient malnutrition
Photo card 2
Vitamin A Deficiency – Xeropthalmia
Bitots spots (X1B) are foamy white areas on the white of the eye. Be careful not toconfuse them with other types of eye problems. These signs will most often be seen inchildren.
Corneal Xerosis (X2) Keratomalacia (X3)

13
TRAINER’S GUIDE
HTP, Version 2, 2011
MODULE 4Micronutrient malnutrition
Photo card 3
Iodine Deficiency – Goitre examination
Goitre can be examined by looking or by feeling the neck (palpating)The visible goitres seen in the 2 pictures on the top left are Grade 2
Iodine deficiency can also causedevelopmental problems in childrensuch cretinism

14
TRAINER’S GUIDE
HTP, Version 2, 2011
MODULE 4 Micronutrient malnutrition
Photo card 4
Thiamine Deficiency – Beriberi Riboflavin Deficiency – Ariboflavinosis
Oedema is seen in the wet form of beriberi. Lesions of the mouth are seen in riboflavinHowever, it is also caused by general deficiency. They are called angular stomatitismalnutrition and can be seen in children if the fissures are at the corners of the mouthand adults. and cheilosis they are elsewhere on the lips.

15
TRAINER’S GUIDE
HTP, Version 2, 2011
MODULE 4Micronutrient malnutrition
Photo card 5
Niacin Deficiency – Pellagra
Butterfly sign
A symmetrical rash (dermatitis) which is on both sides of the body, and on skin normally exposedto sunlight is a sign of pellagra. Check the face, neck, hands, arms and legs.
Casal’snecklace

16
TRAINER’S GUIDE
HTP, Version 2, 2011
MODULE 4 Micronutrient malnutrition
Photo card 6
Vitamin C Deficiency – Scurvy
Bleeding around the bases of the hair on the legs(Perifollicular hemorrhage) and the gums in betweenthe teeth are signs of scurvy. There may be areas of bruising(ecchymoses) as seen in the second photo.There may also be swelling of the bone joints.

17
TRAINER’S GUIDE
HTP, Version 2, 2011
MODULE 4Micronutrient malnutrition
Beading of the rib cage(rachitic rosary)
Photo card 7
Vitamin D deficiency – Rickets
Harrison’sGroove orPigeon Chest
Spinaldeformity
Bow legs

18
TRAINER’S GUIDE
HTP, Version 2, 2011
MODULE 4 Micronutrient malnutrition
Handout 2b: Test cards for micronutrient deficiency diseases
Test Card 1

19
TRAINER’S GUIDE
HTP, Version 2, 2011
MODULE 4Micronutrient malnutrition
Test Card 2

20
TRAINER’S GUIDE
HTP, Version 2, 2011
MODULE 4 Micronutrient malnutrition
Test Card 3

21
TRAINER’S GUIDE
HTP, Version 2, 2011
MODULE 4Micronutrient malnutrition
Test Card 4

22
TRAINER’S GUIDE
HTP, Version 2, 2011
MODULE 4 Micronutrient malnutrition
Test Card 5

23
TRAINER’S GUIDE
HTP, Version 2, 2011
MODULE 4Micronutrient malnutrition
Test Card 6

24
TRAINER’S GUIDE
HTP, Version 2, 2011
MODULE 4 Micronutrient malnutrition
Handout 2c: Answers for test cards
For each photo Test Card the main clinical sign, micronutrient deficiency disease, and deficient nutrient is listed below:
Test Card 1 – Bitots Spots (X1B) – Xeropthalmia – Vitamin A Deficiency
Test Card 2 – Bilateral dermatitis on the arms – Pellagra – Vitamin B3 (niacin) Deficiency
Test Card 3 – Goitre – Iodine Deficiency Disorder – Iodine Deficiency
Test Card 4 – Perifollicular haemorrhage – Scurvy – Vitamin C Deficiency
Test Card 5 – Angular stomatitis – Ariboflavinosis – Vitamin B2 (riboflavin) Deficiency
Test Card 6 – Casal’s Necklace – Pellagra – Vitamin B3 (niacin) Deficiency

25
TRAINER’S GUIDE
HTP, Version 2, 2011
MODULE 4Micronutrient malnutrition
Exercise 3: Analysing the nutrient content of a planned food aid ration
What is the learning objective?
• Be able to calculate the micronutrient content of a food aid ration by hand
When should this exercise be done?
• After the main concepts about micronutrients have been introduced
How long should the exercise take?
• 45 to 60 minutes
What materials are needed?
• Handout 3a: Analysing the nutrient content of a planned food aid ration. Questions
• Handout 3b: Food composition table
• Handout 3c: Analysing the nutrient content of a planned food aid ration. Answers
• Participants will need electronic pocket calculators
What does the trainer need to prepare?
• Familiarise yourself with the calculations and results before the session and ensure handouts are available and theparticipants will have calculators ready.
Instructions
Step 1: Give each participant a copy of handouts 3a and 3b, explain the exercise, and let them work through it.Provide individual support to participants as required.
Step 2: When participants have completed the calculation attempt provide a copy of handout 3c andhold a discussion to address any important questions and confirm that participants understoodthe exercise and results.
26
TRAINER’S GUIDE
HTP, Version 2, 2011
MODULE 4 Micronutrient malnutrition
Handout 3a: Analysing the nutrient content of a planned food aid ration. QuestionsTime for completion: 30 to 60 minutes
Read the following questions and attempt the calculations
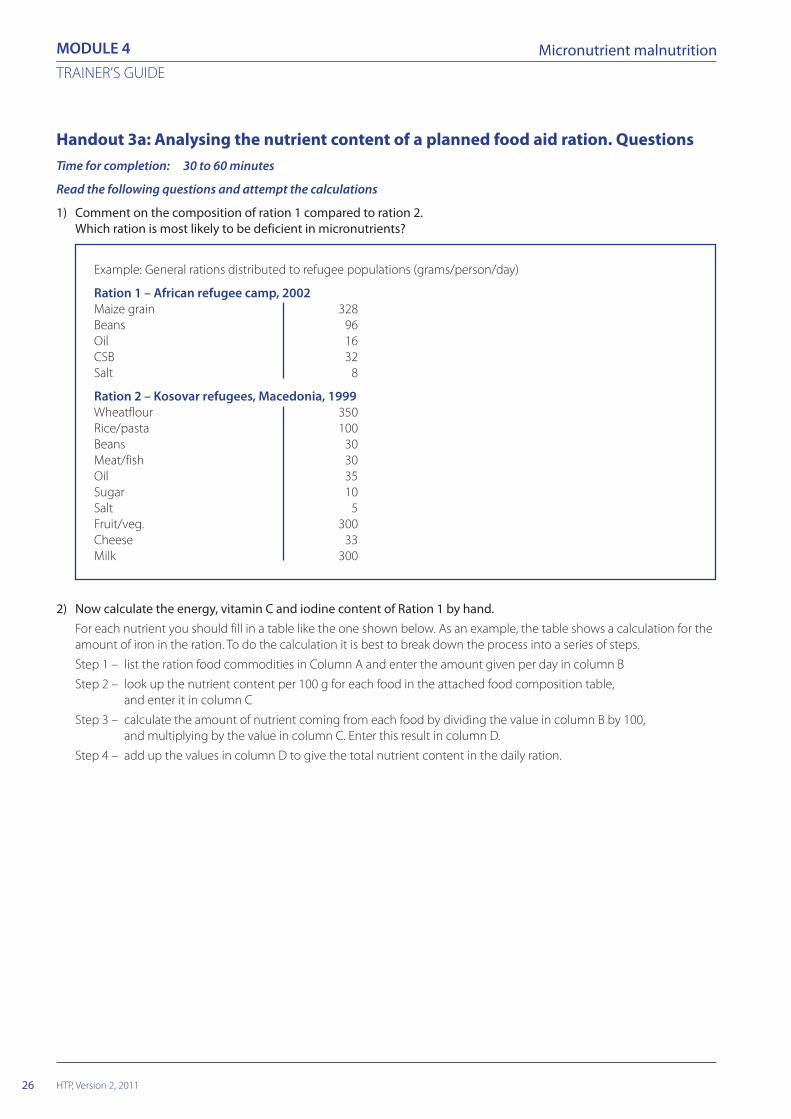
1) Comment on the composition of ration 1 compared to ration 2.Which ration is most likely to be deficient in micronutrients?
Example: General rations distributed to refugee populations (grams/person/day)
Ration 1 – African refugee camp, 2002Maize grain 328Beans 96Oil 16CSB 32Salt 8
Ration 2 – Kosovar refugees, Macedonia, 1999Wheatflour 350Rice/pasta 100Beans 30Meat/fish 30Oil 35Sugar 10Salt 5Fruit/veg. 300Cheese 33Milk 300
2) Now calculate the energy, vitamin C and iodine content of Ration 1 by hand.For each nutrient you should fill in a table like the one shown below. As an example, the table shows a calculation for theamount of iron in the ration. To do the calculation it is best to break down the process into a series of steps.
Step 1 – list the ration food commodities in Column A and enter the amount given per day in column B
Step 2 – look up the nutrient content per 100 g for each food in the attached food composition table,and enter it in column C
Step 3 – calculate the amount of nutrient coming from each food by dividing the value in column B by 100,and multiplying by the value in column C. Enter this result in column D.
Step 4 – add up the values in column D to give the total nutrient content in the daily ration.

27
TRAINER’S GUIDE
HTP, Version 2, 2011
MODULE 4Micronutrient malnutrition
Amount in daily ration Nutrient content Nutrient content in dailyCommodity (A) (g/person/day) (B) per 100g (C) ration D = (B/100) x C
Maize grain 328 2.7 8.9
Beans 96 8.2 7.9
Oil 16 0.0 0.0
CSB 32 12.8 4.1
Salt 8 0.0 0.0
Total 20.9mg
In this case the answer for iron is 20.9mg per/person/day
Calculation of the iron content of the ration
Now do the calculation for the energy, vitamin C and iodine content of Ration 1.
3) If NutVal software is available, use it to calculate the nutrient content of Ration 1 and Ration 2.

28
TRAINER’S GUIDE
HTP, Version 2, 2011
MODULE 4 Micronutrient malnutrition
Handout 3b: Food composition table
Nutrient content per 100 grams of raw uncooked food*
* Nutritional values are taken from the spreadsheet application NutVal 2006.^ Vitamin A-fortified according to WFP specifications§ Formulated according to WFP specifications~ Iodized according to WFP specifications (specifications define a range of 4450-7500µg iodine/100 g salt)
Vitamin VitaminB1 B2 Vitamin
Vitamin (Thia- (Ribo- B3 VitaminEnergy Protein Fat Calcium Iron Iodine A mine) flavin) (Niacin) C
Commodity Kcal (g) (g) (mg) (mg) µg µg RE (mg) (mg) (mg) (mg)
Maize 350 10.0 4.0 7 2.7 0 0 0.39 0.20 2.2 0
Beans (dried) 335 20.0 1.2 143 8.2 0 0 0.50 0.22 6.2 0
Oil^ 885 0.0 100.0 0 0.0 0 900 0.00 0.00 0.0 0
CSB§ 400 18.0 6.0 181 12.8 2 501 0.44 0.70 10.0 50
Salt~ 0 0 0 0 0 6,000 0 0.00 0.00 00.0 0

29
TRAINER’S GUIDE
HTP, Version 2, 2011
MODULE 4Micronutrient malnutrition
Handout 3c: Analysing the nutrient content of a planned food aid ration. Answers
1) Comparing Ration 1 and Ration 2 reveals the much more diverse contents of ration 2. Ration 1 contains only 5 items andincludes no animal products, fruit or vegetables. In contrast, Ration 2 contains 10 different items that include meat/fish,milk and fruit/vegetables. Without doing any calculations it would be expected that Ration 1 is most likely to be deficientin micronutrients.
2) The tables and calculation for the energy, iodine and vitamin C content of ration 1 should look like this:
Calculation of the energy content of the ration (kcal)
Amount in daily ration Energy content Energy content in dailyCommodity (A) (g/person/day) (B) per 100g (C) ration D = (A/100) x B
Maize grain 328 350 1148
Beans 96 335 142
Oil 16 885 142
CSB 32 400 128
Salt 8 0 0
Total 1740 Kcal
Calculation of the iodine content of the ration (µg)
Amount in daily ration Nutrient content Nutrient content in dailyCommodity (A) (g/person/day) (B) per 100g (C) ration D = (A/100) x B
Maize grain 328 0 0.00
Beans 96 0 0.00
Oil 16 0 0.00
CSB 32 2 0.64
Salt 8 6,000 480.00
Total 481µg
Calculation of the vitamin C content of the ration (mg)
Amount in daily ration Nutrient content Nutrient content in dailyCommodity (A) (g/person/day) (B) per 100g (C) ration D = (A/100) x B
Maize grain 328 0 0
Beans 96 0 0
Oil 16 0 0
CSB 32 50 16
Salt 8 0 0
Total 16mg
30
TRAINER’S GUIDE
HTP, Version 2, 2011
MODULE 4 Micronutrient malnutrition
Exercise 4: Analysing on-site distribution monitoring (Food basket monitoring) data
What is the learning objective?
• Know how to calculate results from on-site distribution monitoring data.
When should this exercise be done?
• When exercise 3 has been completed.
How long should the exercise take?
• 45 to 60 minutes
What materials are needed?
• Handout 4a: Analysing on-site distribution monitoring (Food basket monitoring) data. Questions
• Handout 4b: Onsite Distribution Monitoring data
• Handout 4c: Analysing on-site distribution monitoring (Food basket monitoring) data. Answers
• Participants will need electronic pocket calculators.If available, access to computer with NutVal software should be provided. The latest version of NutVal can bedownloaded from http://www.nutval.net
What does the trainer need to prepare?
• Familiarise yourself with the calculations and results before the session and ensure handouts are available andthe participants will have calculators ready.
Instructions
Step 1: Give each participant a copy of handouts 4a and 4b, explain the exercise, and let them work through it.Provide individual support to participants as required.
Step 2: When participants have completed the calculation, attempt provide a copy of handout 4c andhold a discussion to address any important questions and confirm that participants understood the exerciseand results.

31
TRAINER’S GUIDE
HTP, Version 2, 2011
MODULE 4Micronutrient malnutrition
Handout 4a: Analysing on-site distribution monitoring (Food basket monitoring)data. Questions
1. Using data collected during On-site Distribution Monitoring (OSDM), calculate the average amount of each ofthe commodities that were received by the beneficiaries during a food aid distribution in a refugee camp.
2. Using the form provided (handout 4b), compare the energy content of the ration actually received bythe 10 beneficiaries with the energy content of the planned ration.
3. If available, use NutVal software to calculate the micronutrient content of the average ration that was received.
4. Comment on the micronutrient content of the ration. Compare the content of the received ration with the nutrientcontent of the planned ration.

32
TRAINER’S GUIDE
HTP, Version 2, 2011
MODULE 4 Micronutrient malnutritionH
ando
ut 4
b:O
nsit
e D
istr
ibut
ion
Mon
itor
ing
data
Her
e is
som
e ex
ampl
e da
ta fr
om a
n O
n-sit
e D
istrib
utio
n M
onito
ring
(Foo
d Ba
sket
Mon
itorin
g) fo
rm, c
olle
cted
in a
refu
gee
cam
p in
Sou
ther
n Af
rica
durin
g 20
04. T
he sa
mpl
esiz
e in
this
mon
itorin
g pr
ogra
mm
e w
as 6
0. F
or th
is ex
erci
se, o
nly
data
on
the
first
10
sam
ples
are
show
n. C
alcu
late
the
resu
lts a
nd fi
ll in
the
miss
ing
num
bers
in th
e em
pty
cells
belo
w. (
Mai
ze h
as a
n en
ergy
con
tent
of 3
50 k
cal/1
00 g
ram
s; Be
ans 3
35 k
cal/1
00 g
ram
s; an
d O
il 88
5 kc
al/1
00 g
ram
s. Th
e en
ergy
con
tent
of s
alt i
s, of
cou
rse,
0.)
Num
ber o
f day
s co
vere
d by
this
dis
trib
utio
n: 1
5Ra
tion
plan
ned
for t
his
dist
ribut
ion
Com
mod
ity
Mai
zeBe
ans
Vege
tabl
e oi
lSa
ltTo
tal k
cal/p
erso
n/da
y
Gra
ms/
pers
on/d
ay40
012
020
10
kcal
/per
son/
day
90%
of t
he ta
rget
ed ra
tion
=kc
al/p
erso
n/da
y
110%
of t
he ta
rget
ed ra
tion
=kc
al/p
erso
n/da
y
Dis
trib
utio
n M
onito
ring
Dat
a
gram
s/kc
al/
gram
s/kc
al/
gram
s/kc
al/
gram
s/To
tal k
cal/
Fam
ilyFa
mily
Mai
zepe
rson
/pe
rson
/Be
ans
pers
on/
pers
on/
Vege
tabl
epe
rson
/pe
rson
/Sa
ltpe
rson
/pe
rson
/N
umbe
rSi
ze(k
g)da
yda
y(k
g)da
yda
yoi
l (kg
)da
yda
y(k
g)da
yda
y
11
9.7
2.5
0.25
0.15
26
36.0
10.5
1.45
1.05
34
24.0
10.0
1.00
0.50
45
30.9
7.2
1.37
0.75
57
40.0
10.3
1.70
0.95
65
27.6
7.2
1.30
0.75
76
32.0
8.7
1.60
0.90
82
11.0
5.8
1.80
0.90
97
37.5
18.5
1.83
0.93
107
47.5
10.5
1.70
0.95
Aver
age

33
TRAINER’S GUIDE
HTP, Version 2, 2011
MODULE 4Micronutrient malnutrition
Han
dout
4c:
Ana
lysi
ng o
n-si
te d
istr
ibut
ion
mon
itor
ing
(Foo
d ba
sket
mon
itor
ing)
dat
a. A
nsw
ers
to Q
uest
ion
1 an
d 2
Show
n be
low
is th
e O
n-sit
e D
istrib
utio
n M
onito
ring
data
form
with
the
answ
ers f
illed
in. C
ompa
re it
with
you
rs to
mak
e su
re y
ou d
id th
e ca
lcul
atio
n co
rrect
ly.
Num
ber o
f day
s co
vere
d by
this
dis
trib
utio
n: 1
5Ra
tion
plan
ned
for t
his
dist
ribut
ion
Com
mod
ity
Mai
zeBe
ans
Vege
tabl
e oi
lSa
ltTo
tal k
cal/p
erso
n/da
y
Gra
ms/
pers
on/d
ay40
012
020
10
kcal
/per
son/
day
1400
402
177
019
79
90%
of t
he ta
rget
ed ra
tion
=17
81kc
al/p
erso
n/da
y
110%
of t
he ta
rget
ed ra
tion
=21
77kc
al/p
erso
n/da
y
Mon
itorin
g D
ata
gram
s/kc
al/
gram
s/kc
al/
gram
s/kc
al/
gram
s/To
tal k
cal/
Fam
ilyFa
mily
Mai
zepe
rson
/pe
rson
/Be
ans
pers
on/
pers
on/
Vege
tabl
epe
rson
/pe
rson
/Sa
ltpe
rson
/pe
rson
/N
umbe
rSi
ze(k
g)da
yda
y(k
g)da
yda
yoi
l (kg
)da
yda
y(k
g)da
yda
y
11
9.7
647
2,26
32.
516
755
80.
250.
2517
0.15
102,
969*
*
26
36.0
400
1,40
010
.511
739
11.
451.
4516
1.05
121,
933
34
24.0
400
1,40
010
.016
755
81.
001.
0017
0.50
82,
106
45
30.9
412
1,44
27.
296
322
1.37
1.37
180.
7510
1,92
5
57
40.0
381
1,33
310
.396
329
1.70
1.70
160.
959
1,80
5
65
27.6
368
1,28
87.
296
322
1.30
1.30
170.
7510
1,76
3*
76
32.0
356
1,24
48.
797
324
1.60
1.60
180.
9010
1,72
6*
82
11.0
367
1,28
35.
819
364
81.
801.
8060
0.90
302,
462*
*
97
37.5
357
1,25
018
.517
659
01.
831.
8317
0.93
919
94
107
47.5
452
1,58
310
.510
033
51.
701.
7016
0.95
920
62
Aver
age
414
1,44
913
143
812
2075
*Th
ese
fam
ilies
rece
ived
less
than
90%
of t
he p
lann
ed e
nerg
y co
nten
t of t
he ra
tion
**Th
ese
fam
ilies
rece
ived
mor
e th
an 1
10%
of t
he p
lann
ed e
nerg
y co
nten
t of t
he ra
tion

34
TRAINER’S GUIDE
HTP, Version 2, 2011
MODULE 4 Micronutrient malnutritionIn
terp
reta
tion
From
the
resu
lts th
at y
ou h
ave
calc
ulat
ed b
y ha
nd w
e ca
n lo
ok a
t the
effi
cien
cy o
f the
dist
ribut
ion
syst
em fo
r del
iver
ing
a ra
tion
with
an
adeq
uate
ene
rgy
cont
ent.
We
can
see
that
the
aver
age
amou
nt re
ceiv
ed (2
075
kcal
) was
with
in th
e ac
cept
able
lim
its o
f 90-
110%
of t
he p
lann
ed ra
tion.
How
ever
, 4/1
0 (4
0%) o
f the
ben
efic
iarie
s re
ceiv
ed g
reat
erth
an o
r les
s tha
n th
e pl
anne
d am
ount
so th
e eq
uity
of t
he sy
stem
shou
ld b
e im
prov
ed.
Plea
se n
ote
we
only
incl
uded
dat
a on
10
bene
ficia
ries i
n th
is ex
erci
se to
save
tim
e. A
nor
mal
on-
site
dist
ribut
ion
mon
itorin
g pr
ogra
mm
e sh
ould
use
a sa
mpl
e siz
e of
at l
east
30 b
enef
icia
ries a
t eac
h di
strib
utio
n sit
e. B
enef
icia
ries s
houl
d be
rand
omly
sam
pled
usin
g a
syst
emat
ic (i
nter
val)
sam
ple
or a
sim
ple
rand
om sa
mpl
e.
This
data
doe
s not
tell
you
abou
t the
mic
ronu
trie
nt c
onte
nt o
f the
ratio
n an
d ho
w it
com
pare
s with
the
plan
ned
ratio
n. To
wor
k ou
t the
mic
ronu
trie
nt c
onte
nt b
y ha
nd w
ould
be ti
me
cons
umin
g an
d a
softw
are
tool
such
as N
utVa
l is r
ecom
men
ded.

35
TRAINER’S GUIDE
HTP, Version 2, 2011
MODULE 4Micronutrient malnutrition
Han
dout
4c:
Ana
lysi
ng o
n-si
te d
istr
ibut
ion
mon
itor
ing
(foo
d ba
sket
mon
itor
ing)
dat
a. A
nsw
ers
to Q
uest
ion
3 an
d 4
(Nut
Val a
naly
sis)
Anal
ysis
of th
e co
nten
t of t
he p
lann
ed ra
tion
and
rece
ived
ratio
n, c
alcu
late
d fro
m th
e on
-site
dist
ribut
ion
resu
lts, is
show
n be
low
. The
se re
sults
are
wha
t you
shou
ld se
e if
usin
gN
utVa
l 200
6 so
ftwar
e. R
esul
ts c
alcu
late
d us
ing
othe
r ver
sions
may
diff
er.
Ratio
n N
ame
or R
efer
ence
: Pla
nned
Rat
ion
Ratio
nTh
ia-
Ribo
-g/
pers
on/
Ener
gyPr
otei
nFa
tCa
lciu
mIr
onIo
dine
VIT.
Am
ine
flavi
nN
iaci
nVI
T. C
Ratio
n co
nten
tsda
ykc
alg
gm
gm
gµg
µg R
Em
gm
gm
g N
Em
g
Mai
ze g
rain
, whi
te40
01,
400
4016
2810
.80
01.
540.
808.
80
Bean
s, dr
ied
120
402
241
172
9.8
00
0.60
0.26
7.4
0
Oil,
vege
tabl
e (W
FP sp
ecs.)
2017
70
200
0.0
018
00.
000.
000.
00
Salt,
iodi
sed
(WFP
spec
s.)10
00
00
0.0
600
00.
000.
000.
00
Ratio
n to
tal
550
1,97
964
3720
020
.760
018
02.
141.
0716
.20
Safe
leve
l of i
ntak
e2,
100
2,10
052
.540
450
22.0
150
500
0.90
1.40
13.9
28
% o
f req
uire
men
ts su
pplie
d94
%12
2%94
%44
%94
%40
0%36
%23
8%76
%11
7%0%
by ra
tion
% o
f ene
rgy
supp
lied
13%
17%
by p
rote
in o
r fat

36
TRAINER’S GUIDE
HTP, Version 2, 2011
MODULE 4 Micronutrient malnutritionRa
tion
Nam
e or
Ref
eren
ce: A
vera
ge R
esul
ts fr
om O
n-Si
te D
istr
ibut
ion
Mon
itorin
g
Ratio
nTh
ia-
Ribo
-g/
pers
on/
Ener
gyPr
otei
nFa
tCa
lciu
mIr
onIo
dine
VIT.
Am
ine
flavi
nN
iaci
nVI
T. C
Ratio
n co
nten
tsda
ykc
alg
gm
gm
gµg
µg R
Em
gm
gm
g N
Em
g
Mai
ze g
rain
, whi
te41
41,
449
41.4
1729
11.2
00
1.59
0.83
9.1
0
Bean
s, dr
ied
131
439
26.2
218
710
.70
00.
660.
298.
10
Oil,
vege
tabl
e (W
FP sp
ecs.)
2118
60.
021
00.
00
189
0.00
0.00
0.0
0
Salt,
iodi
sed
(WFP
spe
cs.)
120
0.0
00
0.0
720
00.
000.
000.
00
Ratio
n to
tal
578
2,07
464
.039
216
22.0
720
189
2.25
1.12
17.2
0
Safe
leve
l of i
ntak
e2,
100
2,10
052
.540
450
22.0
150
500
0.90
1.40
13.9
28
% o
f req
uire
men
ts su
pplie
d99
%12
9%98
%48
%10
0%48
0%38
%25
0%80
%12
4%0%
by ra
tion
% o
f ene
rgy
supp
lied
13%
17%
by p
rote
in o
r fat
Inte
rpre
tatio
n
It ca
n be
seen
that
with
bot
h th
e pl
anne
d an
d re
ceiv
ed ra
tion
ther
e ar
e la
rge
defic
its in
mic
ronu
trie
nt c
onte
nt. T
he ra
tion
cont
ains
no
vita
min
C a
t all ,
and
is se
rious
ly d
efic
ient
in ri
bofla
vin,
cal
cium
and
vita
min
A. T
here
is a
lso a
n ex
cess
ive
amou
nt o
f iod
ine
bein
g pr
ovid
ed v
ia fo
rtifi
ed sa
lt. T
he e
nerg
y co
nten
t is a
lso sl
ight
ly lo
wer
than
it sh
ould
be
and
the
fat c
onte
nt is
inad
equa
te. C
lear
ly, t
his r
atio
n pl
an n
eeds
r evi
sing

37
TRAINER’S GUIDE
HTP, Version 2, 2011
MODULE 4Micronutrient malnutrition
What is the learning objective?
• To explore how to plan and carry out an investigation of a suspected outbreak of a micronutrientdeficiency disease.
When should this exercise be done?
• After the main concepts have been introduced and the exercises 2 and 3 have been completed.
How long should the exercise take?
• 60 to 90 minutes
What materials are needed?
• Handout 5a: Planning an outbreak investigation
• Handout 5b: Planning an outbreak investigation (Model answer)
What does the trainer need to prepare?
• Read and familiarise yourself with the scenario, questions, and answers.
• Photocopy handouts or prepare overheads.
Instructions
Step 1: Give each participant a copy of handout 4a
Step 2: Divide the participants into groups of 5 people (Maximum)
Step 3: Give the groups 30 minutes to answer the questions and prepare a presentation of their answers
Step 4: Give each group 5 minutes for feedback in plenary
Step 5: Discuss the results
Discussion points for feedback in plenary
➡ What additional ideas did people come up with?
➡ How practical are the suggestions for collecting information?
➡ What resources would be needed to conduct the investigation?
➡ What are the possible and appropriate responses to an outbreak of a micronutrient deficiency disease?
5. Case Studies
One case study is presented in this section. Case studies are useful for getting participants to think through real-life scenarios.They also provide an opportunity for participants to work in a group and develop their analytical and decision-making skills.Trainers should develop their own case studies which are contextually appropriate to the particular participant group. Preferablytrainers should use scenarios with which they are familiar.
Exercise 5: Planning an outbreak investigation
38
TRAINER’S GUIDE
HTP, Version 2, 2011
MODULE 4 Micronutrient malnutrition
Handout 5a: Planning an outbreak investigation
Time for completion: 30 minutes
Working in groups, read the following case example, address the questions and prepare a brief presentation ofyour discussion.
Scenario
You are asked to investigate a suspected outbreak of pellagra in a refugee camp in east Africa. At the start of your assessmentyou are given the following information:
An initial case of pellagra has been identified in a supplementary feeding programme (SFP) run by a nutrition NGO. UNHCR hasrequested a full assessment. A preliminary assessment has already been conducted by a national nutrition institute and hasidentified about 30 cases from a convenience sample of 200 school children. This has raised considerable concern.
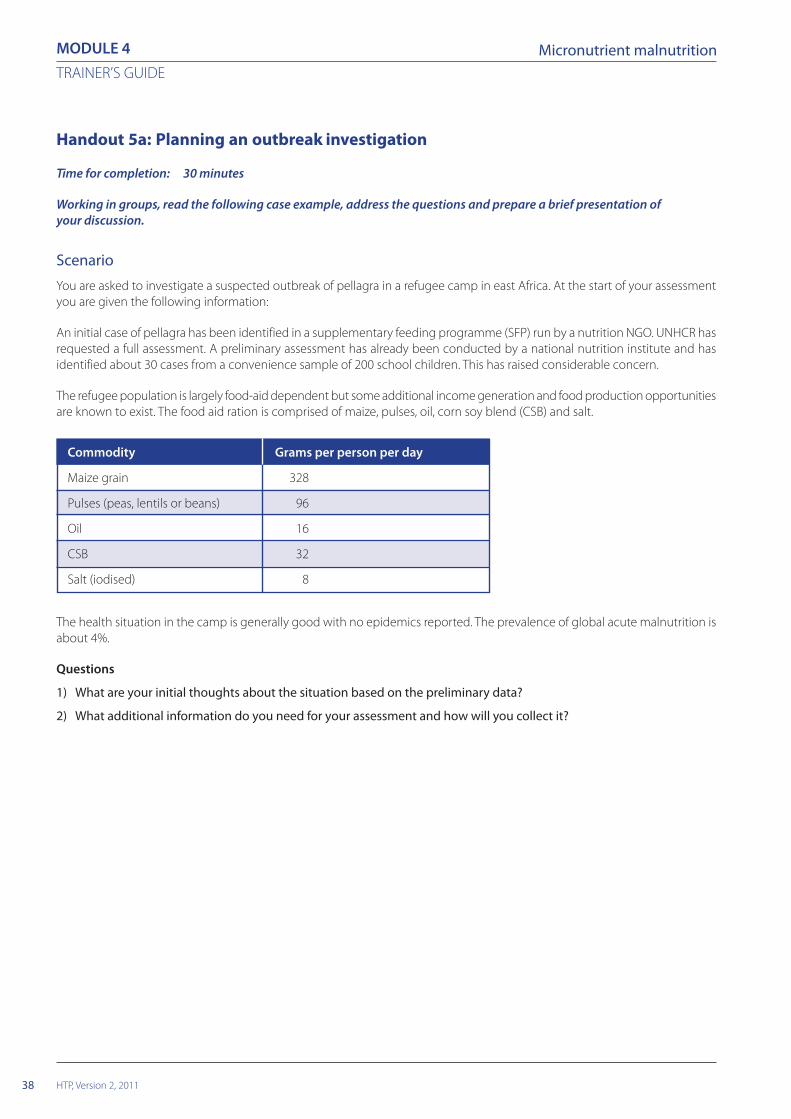
The refugee population is largely food-aid dependent but some additional income generation and food production opportunitiesare known to exist. The food aid ration is comprised of maize, pulses, oil, corn soy blend (CSB) and salt.
Commodity Grams per person per day
Maize grain 328
Pulses (peas, lentils or beans) 96
Oil 16
CSB 32
Salt (iodised) 8
The health situation in the camp is generally good with no epidemics reported. The prevalence of global acute malnutrition isabout 4%.
Questions
1) What are your initial thoughts about the situation based on the preliminary data?
2) What additional information do you need for your assessment and how will you collect it?

39
TRAINER’S GUIDE
HTP, Version 2, 2011
MODULE 4Micronutrient malnutrition
Handout 5b: Planning an outbreak investigation (Model answer)
Question 1From the available data, the general situation regarding health and nutrition appears quite good with a low prevalence of GAMand no epidemics reported. The general ration appears reasonable at first site with the inclusion of pulses and fortified blendedfood.
However, the prevalence of pellagra identified in the school children is alarmingly high at 15%. As a reference, the proposedWHO cut-off for a severe public health situation is 5%. A further investigation is urgently required.
Question 2In any outbreak investigation it is important to organise and prioritise the information you need to collect. The table belowsummarises some of the key information that you would need to collect and possible sources for the information.
In addition to collecting this information it would be important to revisit the cases identified in the original assessment toconfirm the diagnosis. Documenting cases with digital photography is very useful but remember to observe the need toobtain patients consent and preserve confidentiality.
To quantify the existence or extent of the problem it may be necessary to conduct a quantitative survey at the household level.Note that adults are more at risk of pellagra than children so a standard anthropometric nutrition survey is not an appropriatedesign for a survey of pellagra.
Collection of urine samples for laboratory analysis has proven useful in previous investigations of pellagra outbreaks. However,you will need to seek expert advice if you decide to collect biological samples for analysis.
Information required Reason Source
What was the Case Definition used in It is critical to understand how The report describing the initialthe original investigation? cases were identified and, if doing assessment or follow up
a further investigation yourself, communication with field staff and/orto come up with a practical case the national nutrition institute.definition that can be used in thecontext in which you are workingand is as sensitive and specificas possible.
What is the CMR (crude mortality rate) You need to understand if there Health information system (HIS),and U5MR (under 5 mortality rate) has been an increase in mortality survey reports.in the camp? in the camp as this might be
associated with a severe outbreakof pellagra.
What is the general health situation It is important to investigate if Health facility records. Interviews within the camp? there has been an increase in community health workers and other
admissions to health facilities or medical staff.morbidity in the community.Pellagra causes diarrhoea,dementia, insomnia and symptomsof anxiety, as well as dermatitis.These signs and symptoms mayhave been observed withoutpeople knowing they were causedby pellagra.

40
TRAINER’S GUIDE
HTP, Version 2, 2011
MODULE 4 Micronutrient malnutrition
Information required Reason Source
What is the niacin content of the food A general ration low in niacin is Analysis of planned and received foodaid ration? a major risk factor for pellagra. If rations using NutVal or other software.
more than 5% of the populationhas a dietary intake of niacinequivalents < 5mg/day thesituation is classified by WHOas a public health problem.
What does the On-site Distribution While the planned ration may, or OSDM records from the health andMonitoring (OSDM) data and post- may not, contain adequate niacin nutrition implementing NGO, ordistribution monitoring data say about and other nutrients you need to Government or UNHCR records. Ifthe reliability of the food aid ration? understand what ration the OSDM data is not available then try to
refugees have actually been access food supply and distributionreceiving. OSDM data is useful for records from WFP or other partners.that purpose. As with all datasources you need to makea judgement as to the reliability ofthe data and its source.
Is the food aid ration sold or People may sell food or exchange Post-distribution monitoring recordsexchanged for other items? it to obtain other essential items. from WFP or other agencies.
The amount received ata distribution may not be theamount used in thehousehold kitchen.
How do people use the food aid ration Understanding how people utilise Reports from nutrition and healthin the kitchen and how do they food is just as important as NGOs, direct observations, interviewsdistribute it within the household? understanding how much people and focus group discussions.
have access to. Food preparationmethods can have a major impacton the consumption ofmicronutrients. Intra-householddistribution is a major determinantof which population groups maybe at risk of nutritional deficiencies.
How widespread and important are An appreciation of people’s Reports from NGOs, directincome generation and food livelihoods is important to observations, interviews and focusproduction activities in the camp? understand what other food group discussions.
sources people may have access to.
41
TRAINER’S GUIDE
HTP, Version 2, 2011
MODULE 4Micronutrient malnutrition
What is the learning objective?
• To allow participants to observe food aid monitoring and health information systems in an establishedrefugee camp.
When should this exercise be done?
• After completion of the module material including the previous exercises.
How long should the exercise take?
• 1 to 2 days, or as dictated by local circumstances.
What materials are needed?
• Letters of agreement with the NGO or UN agency hosting the visit.
• Permission from the training institution for the visit to go ahead.
• Risk assessment forms prepared and completed by the trainer prior to the field trip.
• Handout 6a: Micronutrient malnutrition risk assessment (Trainer’s guide)
What does the trainer need to prepare?
• A full itinerary for the field visit
• A plan for transportation, accommodation, meals and refreshments for participants.
• A briefing sheet for the participants on the local situation including safety and security procedures.
• Ensure that participants are suitably dressed and equipped for the field visit, and have note pads and pens.
• Prior to the visit work in a group with the participants to construct an observation checklist of things to look outfor, e.g. method used to select beneficiaries for OSDM, number of refugee households with access to homegardens, provision of micronutrient supplements at health facilities.
Discussion points for feedback in plenary
➡ General impressions of the filed site visited.
➡ Detailed observations on the risk of micronutrient malnutrition in the site visited.Ideas for improving the technical content and management of the programme.
6. Field based exercises
This section outlines ideas for exercises that can be carried out as part of a field visit. Field visits require a lot of preparation. Anorganisation that is actively involved in programming has to be identified to ‘host’ the visit. This could be a government agency,an international NGO or a UN agency. The agency needs to identify an area that can be easily and safely visited by participants.Permission has to be sought from all the relevant authorities and care taken not to disrupt or take time away from programmeactivities. Despite these caveats, field-based learning is probably the best way of getting over information that will be rememberedby participants.
Exercise 6: Micronutrient malnutrition risk assessment

42
TRAINER’S GUIDE
HTP, Version 2, 2011
MODULE 4 Micronutrient malnutrition
Handout 6a: Evaluation of a general food distribution (Trainer’s guide)
The following is a suggested activity that should be adapted to fit the local context.Arrange a visit to a refugee camp to observe general ration distribution, on-site distribution monitoring, post distribution moni-toring, and how data is collected for the health information system. If possible, data should be collected and analysed formicronutrient content and energy and macronutrient sufficiency.
• For all fieldwork and visits a risk assessment must be undertaken to look at the risks involved to the course participants,local staff and beneficiaries.
• Every effort must be taken to minimise disruption to the on-going work of the programme.
• Trainers and students must act with tact and discretion and avoid open criticism of any program activities they see.Observations should be discussed with trainers at the end of the field visit.
Key Observation Points for participants(To be adapted according to the local situation)
1. What is in the general food aid ration?
2. Are any complementary food items distributed?
3. Is there a supplementary feeding programme?
4. Which agencies are involved in food aid delivery and distribution?
5. What distribution and targeting mechanisms do they use?
6. Are non-food items distributed?
7. Is On-site Distribution Monitoring (Food basket monitoring) done?
8. Is Post-Distribution Monitoring done?
9. Which agencies are involved?
10. Who analyses the data?
11. Who is responsible for assessing the data and taking programme decisions?
12. What alternative food sources are available to the camp residents?
13. What income generation activities, if any, are available?
14. Which markets, if any, do the refugees have access to?
15. What health facilities do refugees have access to?
16. Which agencies run them?
17. Do staff have knowledge of micronutrient deficiency diseases?
18. Is there a Health Information System (HIS)?
19. Who is responsible for the HIS?
20. Are micronutrient deficiencies recorded in the HIS?