Part 2: ssr202 ERISS Research Summary 2009-2010 · Web viewThe number of data points (n) for...
86
Part 2: Ranger – Rehabilitation
Transcript of Part 2: ssr202 ERISS Research Summary 2009-2010 · Web viewThe number of data points (n) for...

Part 2: Ranger – Rehabilitation

KKN 2.2.1 Landform design
Assessing the geomorphic stability of the Ranger trial landform
J Lowry, TJ Coulthard1, G Staben & A Beraldo
IntroductionThe Ranger trial landform, to the north-west of the tailings storage facility (TSF) at Ranger mine, was constructed by Energy Resources of Australia (ERA) during late 2008 and early 2009 (Figure 1). The trial landform covers a total area of 8 hectares and was constructed to allow ERA to test landform design and revegetation strategies to assist in the development of a robust rehabilitation strategy once mining and milling have finished. Specifically, the landform was designed to test two types of potential final cover layers: waste rock alone; and waste rock blended with approximately 30% v/v fine-grained weathered horizon material (laterite).
Figure 1 Location of the elevated trial landform (bottom right of photograph) at Ranger mine
During 2009, the Supervising Scientist Division constructed four erosion plots (30 m x 30 m) on the trial landform surface, with two plots in the area of waste rock, and two in the area of laterite-waste rock blend (Figure 2). The plots were physically isolated from runoff from the rest of the landform area by engineered borders. The erosion plots were constructed to enable:
1 measurement of erosion rates through time to assess effects of different surface treatments and vegetation establishment strategies.
2 generation of input data for predictive computer modelling of the long-term geomorphic behaviour of the proposed landform designs.
3 determination of loads of key contaminants present in the dissolved and fine suspended-sediment fractions available for export from the trial landform via the surface water runoff pathway.
1 Department of Geography, University of Hull, Hull, HU6 7RX, UK
2

Assessing the geomorphic stability of the Ranger trial landform (J Lowry, TJ Coulthard, G Staben & A Beraldo)
Full details of the construction of the erosion plots and description of the monitoring infrastructure installed are provided in a companion paper in this volume (Monitoring of erosion and solute loads from the Ranger trial landform – Saynor et al, following paper).
It is intended that the geomorphic stability of the trial landform will be assessed through the use of landform evolution models such as CAESAR (Cellular Automaton Evolutionary Slope and River), which will integrate field data and measurements collected in the erosion plots with digital elevation data that have been collected through survey or laser scanning of the landform.
Figure 2 Layout of the plots on the trial landform. Plots 1 and 2 occur on waste rock; plots 3 and 4 have laterite substrate.
Progress/resultsTwo topographic surveys of the trial landform were completed during 2009–2010. The first manual survey using a Topcon GTS-220 Total Station was undertaken in December 2009 prior to the onset of heavy rains. A total of 1737 elevation points were collected across the surface at approximately 5-metre intervals and used to generate a medium resolution (5 metre) digital elevation model (DEM) (Figure 3).
Figure 3 Digital Elevation Model of trial landform (with overlaid 0.1 m contour lines) produced from the December 2009 survey

KKN 2.2.1 Landform design
During the course of this survey, it was noted that the vegetation growth that will occur over the next few years will progressively compromise line-of-sight or optical surveying methods. Consequently, it will be necessary in the future to employ survey technologies capable of penetrating through vegetation cover to measure ground level (for example, LIDAR – Light Detection and Ranging).
A second survey was undertaken in June 2010 during the early dry season using a Leica ScanStation2 terrestrial laser scanning instrument and differential GPS. In contrast to the earlier manual point survey, the use of the laser scanner enabled both surface elevation data as well as surface features (such as the current status of vegetation communities) to be captured.
Twenty-five scans were made across the landform (Figure 4). Three scans were undertaken within each of the erosion plots, at a scan resolution of 2 cm. A further 13 scans were made across the landform at a coarser resolution of 20 cm.
The very-high resolution DEM generated by the laser scanner was acquired to underpin several components of eriss’s minesite rehabilitation research. Specifically, it provides the digital elevation input data needed for the CAESAR and Siberia landform evolution models that are being used to test the long-term stability of the trial landform against the erosive effects of high intensity rainfall events.
Further high resolution surveys will be required in the event of major erosive activity or other significant changes occurring to the structure of the landform.
Figure 4 Locations (marked by triangles) of scanning laser instrument. Inset shows an example of the type of composite digital image synthesised from multiple images captured at each scan location.
To date, DEMs with a horizontal resolution of 20 cm have been extracted from the laser scan data sets for Erosion Plot 1 and Erosion Plot 2 (Figure 5). The DEM for Plot 2 spans an elevation range of 1.24 m between the highest and lowest points in the plot, whilst the elevation range for Plot 1 is 0.97m. At this resolution, the rip lines, individual boulders and shallow depressions are clearly visible.
The DEM of each erosion plot was rotated by 137o to ensure that drainage flowed from west to east (a CAESAR pre-requisite), and then processed to ensure that the DEMs were pit-filled and hydrologically corrected. Pit filling was important in order to remove data artefacts,

Assessing the geomorphic stability of the Ranger trial landform (J Lowry, TJ Coulthard, G Staben & A Beraldo)
which included remnants of vegetation (peaks) as well as artificial depressions, or sinks from the DEM. The DEMs were hydrologically corrected to ensure that water drained in the correct direction.
In July 2010, the model was modified by Professor Coulthard (the author of CAESAR) to enable it to simulate erosion and deposition at the erosion-plot scale. This represents a significant enhancement to the model. A comparison of the results predicted by CAESAR with the field-measured erosion data will be presented in SSD’s next annual report.
Figure 5 High resolution digital elevation model of erosion plot 2. Lighter colours represent areas of greater elevation. Riplines, boulders (light) and pits (dark) visible on surface.
Steps for completionThe following steps are required to complete this project:
1 Cleaning and collation of 2009–10 wet-season rainfall and sediment load data for the erosion plots on the trial landform,
2 Simulations of the 2009–10 wet-season using the CAESAR model and comparison with the field-measured data,,
3 Extension of modelling to other erosion plots on the trial landform and extrapolation of results to the broader Ranger trial landform
4 Further CAESAR simulations of erosion plots 1 and 2 including simulating the effects of changing slope angle and investigating the effects of extreme rainfall event scenarios.
5 Ongoing publication of results in SSD internal and annual reports, in peer-reviewed journal articles and at national and international conferences
6 Continued collection of field measurements through to 2014 to provide a time series record of changes that occur as the landform evolves and vegetation develops.
ReferenceSaynor MJ, Evans KG & Lu P 2009. Erosion studies of the Ranger revegetation trial plot
area. In eriss research summary 2007–2008. eds Jones DR & Webb A, Supervising Scientist Report 200, Supervising Scientist, Darwin NT, 125–195.

KKN 2.2.1 Landform design
Monitoring of erosion and solute loads from the Ranger trial landform
M Saynor, K Turner, K Tayler & R Houghton
IntroductionA trial landform of approximately 200 m x 400 m was constructed during late 2008 and early 2009 by Energy Resources of Australia Ltd (ERA) adjacent to the north-western wall of the tailings storage facility (TSF) at Ranger mine (Figure 1). The trial landform will be used to test landform designs and revegetation strategies to assist ERA develop a robust rehabilitation strategy for the site once mining and milling have finished.
The landform was designed to test two types of potential final cover layers:
1 Waste rock alone.
2 Waste rock blended with approximately 30% v/v fine-grained weathered horizon material (laterite).
The landform is divided into six treatment areas (Figure 2). Each treatment was designed to test different planting methods and substrate types as follows:
1 Tube stock planted in waste rock material2 Direct seeded in waste rock material3 Direct seeded in waste rock mixed with laterite to a depth of 2 m4 Direct seeded in waste rock mixed with laterite to a depth of 5 m5 Tube stock planted in waste rock mixed with laterite material to a depth of 2 m 6 Tube stock planted in waste rock mixed with laterite material to a depth of 5 m
Figure 1 Location of the elevated trial landform at the Ranger mine
6

Monitoring of erosion and solute loads from the Ranger trial landform (M Saynor, K Turner, K Tayler & R Houghton)
Figure 2 Layout of the plots on the trial landform
MethodsSurface sediment collectionDuring the 2009 dry season, surface samples were collected by spade to a maximum depth of 10 cm from 12 locations over the trial landform surface to characterise the particle size distribution (for locations see Figure 2). For all 12 samples, more than half of each sample (by weight) (53–78%) was larger than 2.0 mm in diameter showing the influence of the waste rock on the composition of the cover treatments. The fraction greater than 2.0 mm from surface soil on the natural surrounding Koolpinyah surface is a generally no greater than 10%.
Erosion plotsFour erosion plots (30 m x 30 m) (location marked by cross hatched small squares on Figure 2) were constructed on the landform surface and physically isolated by engineered borders from runoff from the rest of the area. Plots 1 and 2 are located in the waste rock only surface treatment, whereas plots 3 and 4 were located in waste rock blended with approximately 30% v/v fine-grained weathered horizon material.
Half-section 300 mm diameter U-PVC stormwater pipes were placed at the down slope ends of the plots to catch runoff and channel it through rectangular broad-crested (RBC) flumes (Figure 3) where rainfall event triggered discharge is measured. A reservoir (stilling basin) is located upstream of the inlet to each flume to trap coarser material eroded from the plot. Plot construction is described in detail in Saynor et al (2009).
The outlet of each erosion plot is instrumented with the following sensors:
pressure transducer and shaft encoder to measure stage height
a turbidity probe
electrical conductivity probes located at the inlet to the stilling well and in the entry to the flume to provide a measure of the concentrations of dissolved salts in the runoff
an automatic water sampler to collect event based samples
a data logger with mobile phone telemetry connection.

KKN 2.2.1 Landform design
Figure 3 Runoff through flume on trial landform erosion plot 3 during a storm event
A rain gauge was also installed at the downstream end of each plot near the instrument shelter. Data acquired during the 2009–10 wet season were downloaded daily by mobile phone access and then stored in the hydrological database Hydstra.
During the 2009–10 wet season runoff, turbidity (surrogate of fine suspended sediment), bedload (coarser material deposited in the stilling basin) and EC (surrogate of water quality) were measured. The first rainfall event of 26 mm occurred on 23/9/09 and the last significant rainfall event of 21.6 mm occurred on 28/8/10. The total rainfall for the 2009–10 wet season (averaged across the four plots) was 1505 mm.1 The hydrologic water year runs from beginning of September until the end of August (Chiew & Wang 1999, Moliere et al 2002).
During rainfall induced runoff events water samples were collected by automatic water samplers triggered by pre-programmed increases in stage height, turbidity and EC. The trial landform was visited once a week to collect the water samples and the bedload. This task was shared between staff from SSD and ERA, with the allocation of staff resources and workplan defined in a formal memorandum of understanding between SSD and ERA. SSD was responsible for processing and analysis of all of the samples collected for the sediment transport component of the project; ERA was responsible for chemical analysis of the water samples.
ResultsSediment transport
Fine suspended sedimentTurbidity provides a measure of the concentration of fine suspended sediment. It is this fine material that is of most immediate relevance from the perspective of the potential for downstream environmental impact of material eroded from a newly constructed mine landform.
1 The rainfall values presented here are slightly higher than those presented in the 2009–10 Supervising Scientist Annual Report as there was un-seasonal rain in August which forms part of the 2009–10 hydrologic water year.

Monitoring of erosion and solute loads from the Ranger trial landform (M Saynor, K Turner, K Tayler & R Houghton)
An example of concurrent typical turbidity events occurring across each of the four erosion plots in response to a rainfall event is shown in Figure 4 below. The magnitude of the pulses for the waste rock plots (plots 1 and 2) are generally similar to one another and lower than the pulses observed for the mixed waste rock and laterite plots (plots 3 & 4). Throughout the season, the turbidity measured at plot 3 was consistently higher than that measured at plot 4.
Figure 4 Rainfall induced turbidity events occurring between 4 and 11am on 13 April 2010. Top panel shows the cumulative rainfall and flume water level (surrogate of flow) for plot 2. The bottom panel
displays the continuous turbidity data from each of the four erosion plots.
Water samples were collected during rainfall events using autosamplers activated using a combination of pre-programmed stage height, EC and turbidity values. All samples triggered by turbidity were analysed for total suspended sediment (TSS) concentration (sediment fraction between 63 µm and 0.45 µm). The TSS concentration was determined by firstly passing the water sample through a 63 µm sieve and then filtering a standard volume through a 0.45 µm filter. The weight of the dried residue on the filter paper was then measured. The TSS data will be used to define the relationship between TSS and turbidity measured in situ, allowing estimation of continuous TSS concentration from the continuous turbidity data.
The TSS is the most readily transportable fraction of sediment and is a key indicator of landform surface erosion rates. Selected TSS samples will be analysed for associated trace metal concentrations (including uranium and radium) to derive the loads of sediment-associated contaminants transported from each of the erosion plots during the 2009–10 wet season.

KKN 2.2.1 Landform design
BedloadThe coarser bedload material is deposited in both the half pipe defining the downslope boundary of the plot and in the stilling basin upstream of the flume. The total amount of bedload collected from each plot over the wet season is shown in Table 1. Similar amounts of bedload material were washed from each of the plots, with no systematic difference between the two surface treatments.
Table 1 Total bedload collected for 2009–10 wet season1
Erosion plot Basin (kg) Half-pipe (kg) Total (kg)
EP1 24.5 72.7 97.2
EP2 9.7 119.3 129.0
EP3 16.3 87.1 103.4
EP4 65.3 58.1 123.4
1 The bedload values presented here are slightly higher than those presented in the 2009-2010 Supervising Scientist Annual Report as there was un-seasonal rain in August which caused runoff from the erosion plots.
The particle size distributions measured for bedload samples collected on 17/03/2010 and 15/04/2010 are provided in Table 2 and show the influence of rainfall event magnitude. Sieving was used for size classification above 63 µm. The hydrometer (gravity settling) method was used for more detailed classification (not shown here) of the less than 63 µm fraction.
Table 2 Bedload particle size distribution data (dry weight basis) for samples collected on 17 March 2010 and 15 April 2010
Sample erosion plot Sample date Sample
mass (kg) % > 2.00 mm% < 2.00 mm
% > 0.063 mm % < 0.063 mm
EP1 17/03/2010 1.5 18.7 73.6 7.7
EP2 17/03/2010 1.9 17.9 59.7 22.4
EP3 17/03/2010 1.3 28.2 61.0 10.8
EP4 17/03/2010 1.5 15.0 75.1 9.9
EP1 15/04/2010 14.4 33.3 61.7 5.0
EP2 15/04/2010 15.2 24.6 63.7 11.7
EP3 15/04/2010 12.9 53.6 44.5 1.9
EP4 15/04/2010 12.4 45.2 52.2 2.6
The rainfall events that produced the amounts of bedload reported in Table 2 are shown in Table 3. The bedload collected on 17/3/10 resulted from 49 mm of rainfall over 4 events and was correspondingly much lower in mass than the bedload collected from 15/4/10 which was the result of 254 mm of rainfall over 8 events.
Table 3 Rainfall events during the week prior to bedload collection
Sample date
Total rain (mm)
No of events
Event 1 (mm)
Event 2 (mm)
Event 3 (mm)
Event 4 (mm)
Event 5 (mm)
Event 6 (mm)
Event 7 (mm)
Event 8 (mm)
17/3/10 49 4 5 16 9 15
15/4/10 254 8 58 5 11 47 30 41 25 26

Monitoring of erosion and solute loads from the Ranger trial landform (M Saynor, K Turner, K Tayler & R Houghton)
Solute transportEC sensors were installed at the entrance and the exit of the sediment settling basin at each of the erosion plots. The information from both of the sensors was used to derive event-based EC data for each site over the 2009–10 wet season. The behaviour of EC observed over an event will be determined by the condition of the basin preceding the rainfall. Two possible conditions apply for this system:
1. The basin was empty and clean prior to rainfall, in which case the EC is indicating the composition of surface runoff throughout the event.
2. The basin was full prior to rainfall, in which case the EC trace measured at the exit to the basin could be impacted by ‘stale’ water that has remained in the basin between rainfall events.
Condition 1 events give a clear indication of the surface runoff water quality. Condition 2 events are confounded due to the mixing of the surface runoff with ‘stale’ water in the basin that has accumulated from a varying number of antecedent events. While the majority of events occurring throughout the wet season occurred under condition 2, the potential confounding caused by the ‘stale’ water can be removed by comparison of the EC values measured at the entrance and the exit of the basin. The time at which the two EC readings converge will indicate when complete flushing of the ‘stale’ water has occurred. Detailed analysis of the time series EC data for the condition 2 events is still in progress. Consequently the results reported here will focus on condition 1 events.
Thirteen condition 1 events occurred during the 2009–10 wet season. However, the intensity of the rainfall and associated runoff volume for the majority of these events was low, with only five of the 13 events falling in the upper 50th percentile of rainfall volume and intensity for the season. As a result, these events only generated a small volume of flow through the flumes and were generally short lived. Figure 5 shows summary statistics describing the peak (maximum) EC values recorded for each of the 13 events for plots 2 and 4, representing the waste rock and waste rock mixed with laterite, respectively. The box and whisker plot shows that the medians and general distribution of the peak EC values for each plot are similar. The scatter plot shows that the response of peak EC values as a function of total rainfall (up to 35mm only) for each event are similar for both plots, indicating that the total amount of solutes derived from both treatments are similar for condition 1 events.
42
100
80
60
40
20
0
Erosion Plot
Peak
EC
(μS/
cm)
Peak EC
Figure 5 Box plot summarising the mean, maximum, minimum, third quartile and first quartiles of the maximum first flush EC values; and scatter plot of the maximum first flush EC values
and total event rainfall
Water samples were collected for chemical analysis from each of the erosion plots using autosamplers, which were activated using a combination of stage height and EC triggers. The
35302520151050
100
80
60
40
20
0
Total Event Rainfall (mm)
Peak
EC
(µS/
cm)
24
PlotErosion
Peak EC vs Total Event Rainfall

KKN 2.2.1 Landform design
EC-triggered samples were analysed by ERA in its on-site laboratory for a suite of trace elements and major ions. The results obtained for filtered Mg, SO4 and U only are presented here (Figure 6) since these solutes are the most relevant for potential environmental impact from the site. The box plots in Figure 6 show the concentration means and ranges measured for each of the three solutes in the water from each of the four plots.
4321
12
10
8
6
4
2
0
Plot
Mg
(mg/
L)
Mg (mg/ L)
4321
120
100
80
60
40
20
0
Plot
SO4
(mg/
L)
SO4 (mg/ L)
4321
160
140
120
100
80
60
40
20
0
Erosion Plot
EC (µ
S/cm
)
EC (µS/ cm)
Figure 6 Box plots showing the mean, maximum, minimum, third quartile and first quartile values of Mg, SO4 and U concentration and EC measured in the water samples collected from each plot over the
2009–10 wet season. The number of data points (n) for erosion plots 1, 2, 3 and 4 are 54, 76, 67 and 86, respectively.
The information in Figure 6 shows that:
EC exhibits similar behaviour to Mg and SO4, indicating that these ions are major contributors to the EC of the surface runoff from each plot
Plots one, two and four all show similar water concentration ranges for both Mg and SO4
(and hence EC). However, plot three has a broader range and maximum values at least double that of each of the other plots
The highest concentrations of U were measured runoff from plots one and four, noting that the majority of U concentrations were less than 30 µg/L and that the means, except for plot two, were less than 6 µg/L, which is the current ecotoxicologically derived limit for U in Magela Creek.
Being a composite of all of the data, the box plot summaries do not demonstrate the dynamic range of concentrations that occur through a rainfall event. To do this, individual events need to be analysed. Figures 7 and 8 show examples of the time series concentrations of Mg and U measured through two rainfall events that produced sustained flow through the installed flumes.
The concentrations of Mg are very similar between the two plots for these events. There is a difference in EC between 0530 and 0700h in Figure 7. However, this particular event represents the low end of the EC range (0–700 S/cm) measured over the wet season so the effect on solute load of the differences observed between the two plots for this event is low. Generally, further data analysis is required to statistically define the significance of such variation.

Monitoring of erosion and solute loads from the Ranger trial landform (M Saynor, K Turner, K Tayler & R Houghton)
Figure 7 Rainfall event occurring between 4 and 7 am on 1 February 2010. Rainfall, EC, Mg, U and flume level from plots two and four are shown for comparison between wasterock and laterite treatments.
Figure 8 Rainfall event occurring between 3 and 4 pm on 23 March 2010. Rainfall, EC, Mg, U and flume level from plots two and four are shown for comparison between waste rock and laterite treatments.

KKN 2.2.1 Landform design
Future workConsiderable resources are being devoted to processing, collating and analysing the large amounts of data produced from the trial landform during the 2009–10 wet season. Examples have been provided in this report of the wide range of information that is being produced by the project. The findings will be used to inform analysis of the suitability of options for the design and revegetation of the final rehabilitated Ranger site.
During Q1 and Q2 of the 2010–11 financial year it is anticipated that runoff loads of solutes, suspended sediment and bedload material will be derived for each of the plots, enabling quantitative comparison of the behaviours of the two types of surface treatments. These results will be documented in the next eriss Research Summary.
The scope of the trial landform monitoring program for the 2010–11 wet season will be refined using the findings from the 2009–10 season, with more selective sampling and analysis of the runoff streams.
ReferencesChiew FHS & Wang QJ 1999. Hydrological analysis relevant to surface water storage at
Jabiluka. Supervising Scientist Report 142, Supervising Scientist, Canberra.
Moliere DR, Boggs GS, Evans KG, Saynor MJ & Erskine WD 2002. Baseline hydrology characteristics of the Ngarradj catchment, Northern Territory. Supervising Scientist Report 172, Supervising Scientist, Darwin NT.
Saynor MJ, Evans KG & Lu P 2009. Erosion studies of the Ranger revegetation trial plot area. In eriss research summary 2007–2008. eds Jones DR & Webb A, Supervising Scientist Report 200, Supervising Scientist, Darwin NT, 125–195.

KKN 2.2.4 Geomorphic behaviour and evolution of the landscape
Assess the impact of extreme rainfall events on Ranger rehabilitated landform geomorphic
stability using the CAESAR landscape evolution model
JBC Lowry, TJ Coulthard1 & GR Hancock2
IntroductionThe ability to predict the stability of post-mining landscapes through time scales ranging from decades to thousands of years is a critical element in the assessment of the rehabilitation practices of uranium mines. Erosion may lead to increased sediment loads and the transport of other mine-related contaminants off site and into downstream waterways.
Computer modelling is an important tool to assist in the understanding of the interactions between geomorphology and erosion and hydrologic process because of its ability to explore the sensitivity of a mine landform to a wide range of design and climate variables. Simulations of the impact of extreme rainfall events on a conceptual rehabilitated landform of the Ranger minesite using the CAESAR landscape evolution model have been previously reported at the 22nd ARRTC meeting in October 2008 and in Evans et al (2010).
During 2009–10 significant progress was made in collaboration with Professor Coulthard to enhance the capacity of the CAESAR model to simulate erosion in areas with different surface conditions/soil grain size distributions.
Progress/resultsDuring the 2009–10 year significant progress was made in enhancing the capacity of the CAESAR model to simulate the geomorphic evolution of mining landforms composed of multiple surface cover treatments or soil grainsize distributions. Previously CAESAR had only been able to model surfaces with a uniform grainsize/surface treatment. As a result of enhancements made to the model by Professor Tom Coulthard (the author of CAESAR) during his October 2009 visit to Darwin, up to five different surface cover treatments are now able to be used in a single simulation.
For the purposes of this study, the CAESAR model was applied to a conceptual rehabilitated landform (Figure 1) of the Ranger mine supplied by ERA. An outline of current mine infrastructure has been overlain for reference over the surface of the conceptual landform in Figure 1. The surface has low relief (<50 m) and comprises a north-south ridge between backfilled Pit 3 and the Tailings Pond, and an east-west ridge between backfilled Pit 1 and the southern wall of the Tailings Pond.
The digital elevation model of the conceptual landform produced by ERA was supplied in raster format with a 20 m cell size. The cell size defines the minimum size of features that are
1 1 Department of Geography, University of Hull, Hull, HU6 7RX, UK2 2 School of Environmental & Life Sciences, The University of Newcastle, Callaghan, NSW 2308, Australia
15

KKN 2.2.4 Geomorphic behaviour and evolution of the landscape
represented on the surface of the landform, and hence that are able to be included and tracked through the modelling process.
The dataset was processed to ensure that the DEMs were pit-filled and hydrologically corrected. Pit filling was important in order to remove data artefacts, such as artificial depressions, or sinks from the DEM. The DEMs were hydrologically corrected to ensure that water drained in the correct direction. Drainage features were generated from the dataset using hydrological modelling tools in the ArcGIS environment. Due to the limited resolution of the DEM, the drainage features were assigned a minimum width of 40 metres (ie two 20 m ‘pixels’).
Figure 1 Conceptual rehabilitated landform utilised by CAESAR. Existing infrastructure is superimposed for reference.
Initial test simulations used particle size distribution (PSD) data (Figure 2) obtained from field measurements of four different types of surfaces relevant to the Ranger situation. These PSDs represent a natural soil surface; waste rock and waste rock plus laterite cover treatments used on the Ranger trial landform (see Saynor et al this volume, for a description of the trial landform); and a 50–150 mm mix representing coarse-grained material of between 50–150 mm diameter that would be used to line drains conveying runoff from the landform. The particle size distribution of a natural surface was represented by soil collected from an undisturbed vegetated area of the Gulungul Creek catchment (see Map 2 for the location of this creek). In this context it should be noted that it is only the PSD of the extracted soil that is being input into the model, and not the actual landscape properties (ie an intact soil profile stabilised by vegetative cover).
The final key inputs required for CAESAR are rainfall event data (mm/hr). Rainfall data collected at the Jabiru airport between 1972 and 2006 and aggregated into a 21 year continuous sequence were used for the simulations reported here.

Assess the impact of extreme rainfall events on Ranger rehabilitated landform geomorphic stability using the CAESAR landscape evolution model (JBC Lowry, TJ Coulthard & GR Hancock)
Figure 2 Particle size distribution for the different surface conditions used in CAESAR simulations
Three scenarios, each incorporating two surface treatments, were simulated using the particle size data for the different surface conditions. The drainage lines were fixed as the 50–150 type for all simulations with the broad area of the landform surface comprising the second treatment ‘natural’, waste rock, waste rock plus laterite). As stated above the drainage lines were assigned a uniform width of 40 m, with the PSD characteristics of the 50–150 mix. The areas representing each of the different surface types are shown in Figure 3.
Figure 3 Areas of surface treatments modelled in CAESAR
50-150 mix

KKN 2.2.4 Geomorphic behaviour and evolution of the landscape
As shown in Table 1, the initial simulations run for each of the treatments indicate very similar outputs of eroded sediment for the areas composed of waste rock and waste rock mixed with laterite, reflecting the quite similar particle size distribution of these two cases. In contrast, areas simulating the PSD of the natural surface were predicted to more erodable. This was to be expected since the smaller (more erodable) grainsizes comprised a bigger proportion of the material. As stated above this is not meant to be a simulation of the erodability of a natural land surface in the area of the mine since the material is not in its environmental context. Future work will investigate the effect of stabilisation produced by self-armouring processes and the development of vegetation.
Table 1 Mean annual sediment yield produced from different surface treatments
Surface material Sediment yield
Natural 22086 m3 2.212 mm / yr
Waste rock 7644 m3 0.766 mm / yr
Laterite mix 8144 m3 0.816 mm / yr
A uniform width of 40 m, covered with the 50–150 mix, was assumed for the constructed drainage lines used for each of the simulations. However, the modelling predicted drainage channel widening of up to 160 m. The extent of this change indicates that very close attention will need to be paid to the engineering design specification and construction of these drainage features such that they will be able to accommodate the volume of flow coming from the surfaces of the landform, Attention will also need to be paid to the potential for at least temporary infill of the channels (and hence reduction in capacity) as a result of the erosion and in-channel deposition of sediment from the landform.
The different results produced by the initial simulations clearly demonstrate that is it is possible for CAESAR to model two surface conditions at the same time. Further work is required to create scenarios which realistically depict the configuration and different surface treatments of the final landform eg Pit 1 area covered by waste rock versus the area of the tailings dam covered by natural vegetation and laterite.
During the 2009–10 year, a paper ‘Assessing the impact of extreme rainfall events on the geomorphic stability of a conceptual rehabilitated landform in the Northern Territory of Australia’ was presented at the Fourth International Conference on Mine Closure in Perth in September 2009 (Lowry et al 2009). In addition, collaborative research with Associate Professor Greg Hancock comparing the Siberia and CAESAR models resulted in the publication of a paper in the Journal of Earth Surface Processes and Landforms (Hancock et al 2010).

Assess the impact of extreme rainfall events on Ranger rehabilitated landform geomorphic stability using the CAESAR landscape evolution model (JBC Lowry, TJ Coulthard & GR Hancock)
Figure 4 Areas of erosion / deposition on (a) surface with natural/Koolpinyah PSD and (b) waste rock PSD characteristics. A similar result to the waste rock only was produced by the laterite plus waste rock mixture. Lighter colours indicate areas of shallow erosion (0.05–0.2 m), indicating widening of channel.
-1.5 - -0.6
-0.6 – 0.2
-0.2 - -0.05
-0.05 - 0.04
0.04 – 0.97
0.97 – 2.35
2.35 – 4.28
Erosion and deposition (m)
(a)
(b)

KKN 2.2.4 Geomorphic behaviour and evolution of the landscape
Steps for completionFurther work on the application of the CAESAR model to assessing closure design proposals for the Ranger site is awaiting the development and supply of a more refined rehabilitated landform design by ERA. Work on analysing and identifying extreme rainfall scenarios for input to the model has been delayed due to the absence of critical staff in the 2009–10 year. The focus for development and application of CAESAR in 2010–11 will be the application of it to the high resolution time series flow and turbidity data that are being produced from the erosion plots on the trial landform. It is also anticipated that ERA will be requesting a geomorphic assessment to be done of design proposals for the capping of Pit#1, the approval for which is likely to be requested in early 2011.
The following steps are required to complete this project:
1 Use the results obtained from the Ranger Trial Landform to calibrate/validate landform evolution model performance.
2 Define the duration and intensity characteristics for extreme rainfall events and apply these to simulations to conduct a risk assessment of landform stability.
3 Compare long-term erosion rates measured on natural undisturbed sites with CAESAR and Siberia simulations for those sites.
4 Apply the CAESAR model to the final landform design. 5 Assess the importance of vegetation development to landform stability, and enhance the
ability of CAESAR to account for the effects of developing vegetation. This is a significant area of research that will be expedited by the data being obtained each year from the trial landform, tracking the effects of vegetation cover as it progressively matures.
ReferencesEvans KG, Hancock GR, Lowry JBC & Coulthard TJ 2010. Assess the impact of extreme
rainfall events on Ranger rehabilitated landform geomorphic stability using the CAESAR landscape evolution model. In eriss research summary 2008–2009. eds Jones DR & Webb A, Supervising Scientist Report 201, Supervising Scientist, Darwin NT, 113–114.
Hancock GR, Lowry JBC, Coulthard TJ, Evans KG & Moliere DR 2010. A catchment scale evaluation of the SIBERIA and CAESAR landscape evolution models. Earth Surface Processes and Landforms 35(8), 863–876.
Lowry JBC, Evans KG, Coulthard TJ, Hancock GR & Moliere DR 2009. Assessing the impact of extreme rainfall events on the geomorphic stability of a conceptual rehabilitated landform in the Northern Territory of Australia. In Proceedings of the Fourth International Conference on Mine Closure, eds A Fourie & M Tibbett, 9–11 September 2009, Perth, Australian Centre for Geomechanics, 203–212.

KKN 2.2.5 Radiological characteristics of the final landform
Pre-mining radiological conditions at Ranger mine
A Bollhöfer, A Esparon & K Pfitzner
IntroductionThe ICRP (2007) recommends that the total annual effective radiation dose to a member of the public from practices such as uranium mining should not exceed 1 milli Sievert (mSv). This dose is in addition to the natural pre-mining background dose and includes the external gamma, inhalation and ingestion pathways. In a high natural background area such as the area around the Ranger mine, determining an additional dose due to mining activities presents a challenge, especially when pre-mining data are scarce and focus on delineating the extent and location of an orebody, rather than determining area-wide radiological conditions.
Pre-mining radiological conditions need to be quantified so that post-mining changes can be assessed in the context of the success of rehabilitation from a radiological perspective. Historical airborne gamma surveys (AGS), coupled with ground truthing surveys, have the potential to provide a powerful tool for an area-wide assessment of pre-mining terrestrial gamma dose rates. AGS and ground truthing surveys have been commissioned and used for regional assessments of radiological conditions at rehabilitated and historic minesites elsewhere in the Alligator Rivers Region (Martin et al 2006, Bollhöfer et al 2008). Whilst a pre-mining AGS was flown over the Alligator Rivers Region, including the Ranger site, in 1976, no ground radiological data of the resolution and spatial coverage needed to calibrate the AGS data are available from that time. The novelty of this project is to use recently-measured, high resolution ground data from an appropriate undisturbed radiologically anomalous area to calibrate the AGS survey data for this anomaly, and then to use the calibrated 1976 AGS to infer pre-mining radiological conditions over the whole Ranger lease.
Methods1976 AGS data were acquired from Rio Tinto by the NT Government and are available in the public domain (the Alligator Geophysical Survey,1976. This subset, or complete NT-wide grids can be downloaded from the Geophysical Archive Data Delivery System (GADDS) at http://www.geoscience.gov.au). Data were re-processed in 2000 by the Northern Territory Geological Survey (NTGS) and then resampled by NTGS at a pixel size of 70 m in 2003. While the line spacing of the survey was 300 m, the flying height is unknown. The 1976 AGS has been used to identify undeveloped radiological analogues in the vicinity of the Ranger lease as potential candidates for ground truthing. A comparison of signal intensity with known uranium occurrences in the MODAT database (NTGS 2007) suggested that Anomaly 2 to the south of the Ranger lease (Figure 1 ) may be a suitable analog site for Ranger pre-mining radiological conditions as it exhibits a strong airborne gamma signal in the 1976 data, has not been mined, nor is it influenced by operations associated with the Ranger mineral lease.
In addition, Energy Resources of Australia (ERA) has made available to SSD, data from an AGS that was flown in 1997 at a low flying height (50 m) and a higher spatial resolution (200 m line spacing) than the 1976 survey. This data set was used to further refine extensive
21

KKN 2.2.5 Radiological characteristics of the final landform
groundtruthing fieldwork conducted in the 2007 to 2009 dry seasons to establish the exact location and intensities of the Anomalies immediately to the south of the Ranger lease. During the course of the recent ground survey work approximately 2000 external gamma dose rate measurements have been made using environmental dose rate meters, in addition to the determination of soil uranium, thorium and potassium activity concentrations via gamma spectrometry at selected sites.
Anomaly 2
Figure 1 2006 Quickbird image of the Ranger mine showing the location of the three radiometric anomalies of Anomaly 2
Dry season radon exhalation rates were measured using conventional charcoal cups, with 3 charcoal cups deployed at each of 25 sites for a period of three days. The charcoal cups were then analysed using the SSD NaI gamma detector. In addition, external gamma dose rates were measured and soil scrape samples were taken at the 25 sites for high resolution gamma spectrometry analyses. Track etch detectors were deployed for three months at these sites to measure dry season airborne radon concentration and to establish whether there is a correlation between airborne radon concentration and radon exhalation flux or soil 226Ra activity concentrations. At some of the sites, track etch detectors were deployed at various

Pre-mining radiological conditions at Ranger mine (A Bollhöfer, A Esparon & K Pfitzner)
heights to represent the breathing zones of a person lying down with the head slightly raised, sitting and standing.
Results
Groundtruthing of the airborne gamma surveyFigure 2 shows the results from the 1997 ERA AGS data (total counts) compared with external gamma dose rate measurements (µGy∙hr-1) from SSD’s groundtruthing. Hegge et al (1980) identified three separate radiometric highs that characterise Anomaly 2. It is apparent that the groundtruthing survey has clearly distinguished these three highs, Anomalies 2A (in the middle) and 2B (to the northeast), and a third Anomaly further to the southwest. These anomalies also show in the 1997 AGS.
Figure 2 1997 AGS data (courtesy of ERA, left) and the results of the on ground gamma dose rate measurements (right) performed from 2007 to 2009, overlaid on a 2006 Quickbird image of the area
immediately south of the Ranger lease
Maximum uranium concentrations at the surface of Anomaly 2A are greater than 6000 mg/kg and maximum gamma dose rates measured at 1m height exceed 20 µGy∙hr-1. Typical environmental background uranium concentrations in the vicinity are 4–6.5 mg/kg and background gamma dose rates, including the cosmogenic background, are approximately 0.16 µGy∙hr-1.
To groundtruth an AGS, the data acquired in the field (gamma dose rates, uranium, thorium, and/or potassium concentrations) are plotted against the count rates from the respective channels in the AGS. As the groundtruthed data at Anomaly 2 have been acquired at a much higher resolution than both the 1997 and 1976 AGS data, the image is much ‘sharper’, and it is thus essential to determine appropriate 2-dimensional smoothing algorithms which allow a comparison to be made between the groundtruthed and the AGS data. Ground-based data are typically smoothed by averaging such that the resolution is similar to that of the AGS.

KKN 2.2.5 Radiological characteristics of the final landform
An algorithm to smooth the groundtruthed data has been developed using MatLab. The best correlation between the 1997 AGS and the ground based dataset (averaging over a circular footprint) is achieved after applying a small spatial shift and using a smoothing radius of ~80 m for the ground data. To take into account the fact that the aircraft was in motion as data were being acquired, more work is currently underway to use an ellipsoidal footprint to further refine the smoothing of the ground data.
RadonRadon (222Rn) is a radioactive noble gas and part of the 238U decay series. It emanates from soils and rocks, and exhalation is generally higher for fine grained soils rich in its parent, 226Ra. Once airborne, the shortlived radon decay products (218Po, 214Pb, 214Bi) are produced by the decay of radon and it is these decay products that deliver a radiation dose to humans and animals following inhalation, rather than the radon gas itself.
To determine the source strength, or radon flux, expected for an undisturbed uranium anomaly, radon flux densities have been measured across the Anomaly 2 area. Sampling locations are indicated by the black dots in Figure 2. In addition soil 226Ra activity concentrations were measured at these sites to investigate whether they can be used as a proxy to predict radon flux from the area (Szegvary et al 2007) (Figure 2).
Figure 3 shows the geometric means of the radon flux densities versus the soil 226Ra activity concentrations measured at the sampling sites, both plotted on a logarithmic scale. The sampling sites have been distinguished according to soil type (identified by visual inspection in the field) and sampling location, so that results are plotted for fine gravel, loamy sand and coarse gravel/rocks on top of the anomalies. It appears that radon exhalation does not change significantly with increasing 226Ra activity concentration of the soil directly above the outcropping anomaly, with typical radon flux densities (geometric mean) of 5.6 ± 2.4 Bq∙m-2∙s-1, similar to values measured above the Ranger #1 and #3 orebodies before mining commenced (2.5–4.1 Bq∙m-2∙s-1) (Mudd 2004). For soil 226Ra activity concentrations in the lower range of 10–2500 Bq∙kg-1, radon flux densities can be predicted by multiplying the measured soil 226Ra activity concentrations by 2.2 g∙m-2∙s-1. This value is similar to the value reported earlier for non-compacted fine grains in the region close to the minesite (2.7 ± 0.4 g∙m-2∙s-1) (Lawrence et al 2009).
radium [Bq/kg]10 100 1000 10000 100000
rado
n [m
Bq/
m2 /s
]
1
10
100
1000
10000loamy sand fine gravelAnomaly 14
15
1324
16
Rn = (2.20+-0.96)*Ra
R2 = 0.55p < 0.005
Figure 3 Radon flux densities plotted versus soil radium activity concentrations measured at Anomaly 2. The solid line is a linear fit to the data, the dotted line represents the 95% confidence interval.

Pre-mining radiological conditions at Ranger mine (A Bollhöfer, A Esparon & K Pfitzner)
Figure 4 shows the radon concentration measured at three different heights at various sites across the area surveyed, and the corresponding soil 226Ra activity concentrations. Whereas radon flux from the soil into air varies by three orders of magnitude, the radon activities measured in air (Bq∙m-3) at 1.5 m height vary much less, indicating rapid aerial dispersion and effective mixing at this height. The typical dry season radon concentration (geometric mean) 1.5 m above the area investigated is ~150 Bq∙m3, which is about 5 times higher than typical dry season radon concentration measured at Jabiru. There is still a positive correlation between the radon concentration at 1.5 m height and the 226Ra activity concentrations in the underlying soil (p < 0.005; R2 = 0.4), but radon concentration only increases slightly above the 150 Bq∙m3, rising by ~1 Bq∙m-3 for every 370 Bq∙kg-1 increase in soil 226Ra activity concentration. Wet season radon concentrations in air are generally lower than the values cited above, as previously determined at other areas in the Alligator Rivers Region (Martin et al 2004).
The figure illustrates that at areas away from ‘hot spots’, radon concentration is relatively uniform vertically, but concentrations, and thus inhalation doses, are higher when sitting or lying in close vicinity to the outcropping uranium anomalies that have high 226Ra activity concentrations. This potential exposure route and its dependence on height need to be factored into the broader land use requirements of local indigenous people when assessing potential doses to humans prior to any mining.
0
20
40
60
80
100
120
140
160
0 200 400 600 800 1000 1200 1400 1600 1800 2000
Rn [Bq/m3]
heig
ht [c
m]
1100001060012303814
Ra-226 [Bq/kg]
Figure 4 Radon concentration in air for various heights (30 cm, 50 cm, 150 cm) above the ground
Future workThe correlation between historical AGS data from Anomaly 2 and recent ground truthed data from the area will allow determination of average external gamma dose rates across the Ranger lease area before mining commenced at the site. The spatial resolution of the extrapolated dose rates will be limited by the resolution of the AGS, which is at least 1 ha for the 1976 AGS. However, this resolution will suffice to determine pre-mining averages across orebodies 1 and 3, and other areas on the lease. The behaviour of radon in the vicinity of Anomaly 2 has also been studied, and the results will allow the determination of doses from the inhalation of radon progeny above the pre-mining footprint at Ranger, using appropriate UNSCEAR (2000) and ICRP equilibrium and dose conversion factors, respectively.
The potential contribution from the dust inhalation pathway still needs to be established and a separate study is currently underway to quantify the resuspension of dust in naturally vegetated areas. Published resuspension factors for the region (Akber 1992) are comparatively high and need to be verified before radionuclide activity volume concentrations in air (Bq m 3) can be inferred from soil radionuclide activity concentrations extrapolated from the AGS survey data.

KKN 2.2.5 Radiological characteristics of the final landform
Further work is required to develop algorithms to upscale the results from the high resolution groundtruthing, to account for the motion of the aircraft as data were being acquired for the 1976 AGS .The original raw data for the 1976 survey have now been acquired for re-analysis since there was concern about artefacts that may have been introduced into the processed data set that had been originally supplied to SSD by the Northern Territory Government. Once data analysis is complete, the radiological conditions on ground around Anomalies 2A and 2B will be correlated with the pre-mining 1976 airborne signal to infer the area-wide radiological conditions at the Ranger lease area before mining commenced.
ReferencesAkber RA 1992. Suspension of dust in the vicinity of Ranger Uranium Mine: An estimate for
the land application area. In Proceedings of the Workshop on Land Application of Effluent Water from Uranium Mines in the Alligator Rivers Region. Jabiru 11–13 September 1991, Supervising Scientist for the Alligator Rivers Region, AGPS, Canberra, 267–288.
Bollhöfer A, Pfitzner K, Ryan B, Martin P, Fawcett M & Jones DR 2008. Airborne gamma survey of the historic Sleisbeck mine area in the Northern Territory, Australia, and its use for site rehabilitation planning. Journal of Environmental Radioactivity 99, 1770–1774.
Hegge MR, Mosher DV, Eupene GS & Anthony PJ 1980. Geologic setting of the East Alligator uranium deposits and prospects. In Uranium in the Pine Creek Geosyncline. Proceedings of the International Uranium Symposium on the Pine Creek Geosyncline . International Atomic Energy Agency, Vienna, 259–272.
ICRP 2007. The 2007 Recommendations of the International Commission on Radiological Protection. Annals of the International Commission on Radiological Protection Publication 103, Elsevier, Amsterdam.
Lawrence CE, Akber RA, Bollhöfer A & Martin P 2009. Radon-222 exhalation from open ground on and around a uranium mine in the wet-dry tropics. Journal of Environmental Radioactivity 100, 1–8.
Martin P, Tims S, Ryan B & Bollhöfer A 2004. A radon and meteorological measurement network for the Alligator Rivers Region, Australia. Journal of Environmental Radioactivity 76, 35–49.
Martin P, Tims S, McGill A, Ryan B & Pfitzner K 2006. Use of airborne -ray spectrometry for environmental assessment of the rehabilitated Nabarlek uranium mine, northern Australia. Environmental Monitoring and Assessment 115, 531–553.
Mudd GM 2004. A compendium of radon data for the rehabilitation of Australian uranium projects. In Tailings and Mine Waste ‘04, Proceedings of the Eleventh Tailings and Mine Waste Conference, 10–13 October 2004, Vail, Colorado, USA, Taylor & Francis Group, Balkema, Leiden, 247–260.
NTGS 2007. MODAT, mineral occurrence database [electronic resource (CD)]. Northern Territory Geological Survey, Darwin. ISSN 1445-5358.
Szegvary T, Leuenberger MC & Conen F 2007. Predicting terrestrial 222Rn flux using gamma dose rate as a proxy. Atmos. Chem Phys. 7, 2789–2795.
UNSCEAR 2000. Sources and effects of ionizing radiation. UN Publication E.00.IX.3, United Nations Scientific Committee on the effects of atomic radiation, New York, USA.

KKN 2.2.5 Radiological characteristics of the final landform
Radon exhalation from a rehabilitated landform
A Bollhöfer & J Pfitzner
IntroductionClosure criteria for the rehabilitation of Ranger uranium mine need to incorporate radiological aspects to ensure that exposure of the public to radiation after rehabilitation of the mine is as low as reasonably achievable. As the inhalation of radon is likely to be a significant contributor to radiological dose (Supervising Scientist 2007), particularly in the vicinity of the rehabilitated landform, radon exhalation and its temporal variability need to be estimated. As the radon exhalation rate may change as the final landform evolves after rehabilitation of the site, experimental opportunities have been sought to provide data about the variation in radon emanation rates from relevant areas of the minesite. In particular, ERA’s trial landform (Saynor et al 2009) provides a unique opportunity to track emanation rates over many years. The project will enable eriss and ERA to more confidently predict a long-term radon exhalation flux from a rehabilitated landform and contribute to the development of closure criteria for the site.
The aim of this project is to determine radon (222Rn) exhalation flux densities for various combinations of cover types (two) and re-vegetation strategies (two) on the trial landform and to investigate long term changes in radon exhalation rates. Specifically, the 222Rn exhalation from the four erosion plots (30 m 30 m) constructed by SSD (Saynor et al 2010) will be measured over several years to investigate whether there are any temporal changes of radon exhalation, taking into account weathering of the rock, erosion and compaction effects, and the effect of developing vegetation on the landform.
MethodsConventional charcoal canisters (or ‘radon cups) are used to measure radon exhalation flux densities. The charcoal canisters used are a standard brass cylindrical design with an internal diameter of 0.070 m, depth 0.058 m and a wall thickness of 0.004 m. Details on the charcoal canister methodology are provided in Bollhöfer et al (2006) and Lawrence (2006).
Construction of the trial landform was completed late in the 2008–09 wet season. Since then, irrigation water has been regularly applied to all areas apart from a 40 m buffer strip that contains the SSD erosion plots. As soil moisture content has a substantial effect on radon exhalation, and because the irrigation water may contain significant concentrations of radium, radon exhalation flux density was measured from the four SSD erosion plots only, which were not irrigated nor affected by spray drift from the irrigation (Saynor, pers comm)
To obtain a true average radon exhalation flux density from the uneven and heterogeneous surface of the four erosion plots, radon cups were placed randomly over the surface. One experimenter would throw a bag filled with sand over his shoulder. The second experimenter would note where the bag first hit the ground, this being the selected location for charcoal cup placement. If placed on rocks, the rim of the charcoal cup was sealed using putty. This is in contrast to many other studies where radon cups are placed at ‘convenient’ locations where they can easily be embedded into the finer grained soil. Fine grained material exhibits higher radon exhalation flux densities than solid rock (Lawrence et al 2009). Hence, results of radon
27

KKN 2.2.5 Radiological characteristics of the final landform
exhalation measurements can potentially be skewed if the sampling design is not random (Bollhöfer et al 2006).
The location and a description of the four erosion plots where measurements are being taken are shown on Figure 1 and in Table 1, respectively, and are further described in Saynor et al (2010). Generally, 15–20 radon cups were deployed randomly across each erosion plot and were exposed for four days in May 2009, and for three days each in September 2009, February 2010 and May 2010. The charcoal cups were collected after exposure, sealed and sent to the SSD Darwin laboratories, where they were analysed using a NaI gamma detector.
Soil samples have been collected from the surface of the erosion plots, and from the troughs and basins installed at the plots to collect run-off and sediment. The samples were size fractionated (<63 μm and 63 μm – 2 mm), and the two size fractions analysed via gamma spectrometry using HPGe gamma detectors. The methods for gamma spectrometry are described in Murray et al (1987), Marten (1992) and Esparon and Pfitzner (2010).
Progress to dateRadon cups were deployed before the trial landform was constructed to determine the radon exhalation from the substrate underlying the constructed landform. Radon flux densities from the pre-construction substrate follow a log-normal distribution with a range from 24 to 144 mBq∙m-2∙s-1 and geometric mean and median both equal to 73 mBq∙m -2∙s-1. This is similar to the average (±1SD) late dry season radon flux density of 64 ±25 mBq∙m -2∙s-1, which was previously determined for the region (Todd et al 1998).
Radon exhalation flux density measurements now cover one full seasonal cycle. A plot of the results is presented in Figure 1.
May 10Feb 10Sep 09May 09
250
200
150
100
50
0
mBq/m
2/s
Plot 1
May 10Feb 10Sep 09May 09
250
200
150
100
50
0
mBq/m
2/s
Plot 2
May 10Feb 10Sep 09May 09
250
200
150
100
50
0
mBq/m
2/s
Plot 3
May 10Feb 10Sep 09May 09
250
200
150
100
50
0
mBq/m
2/s
Plot 4
Figure 1 Locations of the radon exhalation measurements conducted in 2009 (30 April–4 May, 14–19
September) and 2010 (2–5 February, 14–17 May). The right hand figure shows the median and 1st and 3rd percentiles, respectively, of the radon exhalation flux densities measured. Whiskers show the range
of the measured data, individual datapoints indicate outliers.

Radon exhalation from a rehabilitated landform (A Bollhöfer & J Pfitzner)
Generally, radon flux densities measured from the four un-irrigated erosion plots are lower than those measured on the ground prior to landform construction, most likely due to the rocky nature of the trial landform with typical rock sizes reaching up to 300 mm or more in diameter. As noted above, radon exhalation from fine grained soils is greater than that emanating from solid rock.
The radon exhalation shows a seasonal variation typical of the region (Lawrence et al 2009) with radon exhalation flux densities lower during the wet season compared to the dry season. Average wet season radon exhalation flux density (February 10) across the four plots were 7(4) ± 1 mBq∙m-2∙s-1 (average (geomean) ± SE). Dry season radon exhalation flux densities were approximately four times higher at 26(12) ± 5 mBq∙m-2∙s-1 and 27(13) ± 6 mBq∙m-2∙s-1, respectively, for erosion plots 1 and 3; five times higher at 34(18)±5 mBq∙m-2∙s-1 for erosion plot 2; and 7 times higher at 46(22)±10 mBq∙m-2∙s-1 for erosion plot 4.
Table 1 Description of the four erosion plots and average radon flux densities measured on the surface in 2009–10
Treatment 222Rn flux density [mBq∙m-2∙s-1]
Arithmetic (geometric) average ± std error
May 2009 Sep 2009 Feb 2010 May 2010
RUM_EP1 Waste rock material planted with tube stock
22(14) ± 11 14(7) ± 8 7(4) ± 3 43(21) ± 25
RUM_EP2 Waste rock material planted by direct seeding
41(26) ± 16 15(7) ± 9 8(5) ± 4 45(28) ± 20
RUM_EP3 30% lateritic material mixed with waste rock (2 m), direct seeding
19(13) ± 7 14(9) ± 8 5(3) ± 2 51(21) ± 35
RUM_EP4 30% lateritic material mixed with waste rock (2 m), tube stock.
18(13) ± 7 40(19) ± 32 6(3) ± 4 83(42) ± 51
To determine if there is a relationship between radon exhalation flux density at the surface and activity concentration in the soil, activity concentrations were measured in samples taken from the surface of the four erosion plots. These surface soils were taken from various locations on the erosion plots and then combined to produce a composite for analysis. The less than 2 mm fraction was analysed. In addition, eroded material was collected after a storm event on 11 November 2009. The erosion products were collected from the troughs around each erosion plot, and also from the basins (Saynor et al 2010) at the exit to each of the plots. They were then size fractionated into the <63 μm fraction and the >63 μm and < 2 mm size fraction.
As expected, soil activity concentrations were higher in the silt and clay fraction (<63 μm) than in the sand fraction (>63 μm, <2 mm) (Figure 2). Eroded sediment activity concentrations were generally lower in erosion products collected from erosion plot 1 compared with erosion plot 2, in agreement with activity concentration measurements conducted on waste rock material collected directly from the surface of the two plots. The 226Ra activity concentrations measured in the surface soil samples from the two plots were 193 and 422 Bq∙kg-1. The higher soil activity concentration partly explains the higher average dry season radon exhalation flux densities measured from erosion plot 2 compared with erosion plot 1 (both treated with waste rock only) (see Table 1).

KKN 2.2.5 Radiological characteristics of the final landform
0
100
200
300
400
500
600
700
EP1 surfa
ce
EP1bas
in < 63
EP1bas
in > 63
EP1trough <
63
EP1trough >
63
EP2 surfa
ce
EP2bas
in < 63
EP2bas
in > 63
EP2trough <
63
EP2trough >
63
EP3 surfa
ce
EP3bas
in < 63
EP3bas
in > 63
EP3trough <
63
EP3trough >
63
EP4 surfa
ce
EP4bas
in < 63
EP4bas
in > 63
EP4trough <
63
EP4trough >
63
Bq/
kg
U-238 Ra-226 Ra-228
EP1 EP2 EP3 EP4
Figure 2 238U, 226Ra and 228Ra activity concentrations measured in soils and erosion products from erosion plots (EP) 1–4
The two erosion plots treated with 30% lateritic material mixed with waste rock (EP3 and EP4) showed little difference in 226Ra activity concentrations in the <63 μm fraction of eroded material (average of 440 and 444 Bq∙kg-1). The >63 μm fraction from erosion plot 3 exhibited higher 226Ra activity concentrations (160 Bq∙kg-1) compared with plot 4 (120 Bq∙kg-1), in agreement with activity concentration measurements of the surface soil samples of 330 and 260 Bq∙kg-1, respectively. The reason for the much higher dry season radon exhalation flux density from erosion plot 4 compared with the three other plots is unknown, but may be due to a higher proportion of fines as compared with erosion plot 3, or a higher soil porosity. These possibilities are currently being investigated.
Future workRadon exhalation surveys across the four erosion plots will continue to be conducted every 4 months to investigate seasonal and long term temporal changes in radon exhalation from the trial landform. In addition, soil samples will be collected from the four erosion plots annually and radionuclide activity concentrations will be measured in the <63 μm fraction and the >63 μm, < 2 mm size fractions.
ReferencesBollhöfer A, Storm J, Martin P & Tims S 2006. Geographic variability in radon exhalation at
a rehabilitated uranium mine in the Northern Territory, Australia. Environmental Monitoring and Assessment 114, 313–330.
Esparon A & Pfitzner J 2010. Visual Gamma – Gamma Analysis Manual. Internal Report 539, December, Supervising Scientist, Darwin.
Lawrence CE 2006. Measurement of 222Rn exhalation rates and 210Pb deposition rates in a tropical environment. PhD Thesis. Queensland University of Technology, Brisbane.

Radon exhalation from a rehabilitated landform (A Bollhöfer & J Pfitzner)
Lawrence CE, Akber RA, Bollhöfer A & Martin P 2009. Radon-222 exhalation from open ground on and around a uranium mine in the wet-dry tropics. Journal of Environmental Radioactivity 100, 1–8.
Marten R 1992. Procedures for routine analysis of naturally occurring radionuclides in environmental samples by gamma-ray spectrometry with HPGe detectors. Internal report 76, Supervising Scientist for the Alligator Rivers Region, Canberra. Unpublished paper.
Murray AS, Marten R, Johnston A & Martin P 1987. Analysis for naturally occurring radionuclides at environmental concentrations by gamma spectrometry. Journal of Radioanalytical and Nuclear Chemistry Articles 115, 263–288.
Saynor MG, Evans KG & Lu P 2009. Erosion studies of the Ranger revegetation trial plot area. In eriss research summary 2007–2008. eds Jones DR & Webb A, Supervising Scientist Report 200, Supervising Scientist, Darwin NT, 125–129.
Saynor M, Turner K, Houghton R & Evans K 2010. Revegetation trial and demonstration landform – erosion and chemistry studies. In eriss research summary 2008–2009. eds Jones DR & Webb A, Supervising Scientist Report 201, Supervising Scientist, Darwin NT, 109–112.
Supervising Scientist 2007. Annual Report 2006–2007. Supervising Scientist, Darwin NT.
Todd R, Akber RA & Martin P 1998. 222Rn and 220Rn activity flux from the ground in the vicinity of Ranger Uranium Mine. Internal report 279, Supervising Scientist, Canberra. Unpublished paper.

KKN 2.5.1 Development and agreement of closure criteria from ecosystem establishment perspective
Development of surface water quality closure criteria for Ranger billabongs using macroinvertebrate community data
C Humphrey, K Turner & D Jones
Background and aimsThis paper provides a status report on the development of surface water quality closure criteria (for operations and closure) for Ranger billabongs using macroinvertebrate community data. Specifically, the study aims to quantify macroinvertebrate community structure across a gradient of water quality disturbance in the Alligator Rivers Region (ARR) so as to provide a basis for developing surface water quality closure criteria for Georgetown and Coonjimba Billabongs (Map 3).
After the Ranger mine ceases operations disturbed areas will need to be rehabilitated to a condition consistent with the values of Kakadu National Park (KNP), and ultimately to be at a standard suitable for incorporation back into the Park. Ideally, in the case of natural waterbodies, this would mean that their post-rehabilitation environmental values should be consistent with the expectations of the traditional owners of the land, and hence be consistent with those of similar, undisturbed habitats of KNP.
Following mine-site closure, there is the potential for delivery of solutes and suspended sediment from the rehabilitated mine landform. These solutes and sediments may impact on the ecological values of adjacent waterbodies if they are not maintained at appropriate concentrations. Hence, a key objective of the closure planning process will be to produce a rehabilitation design for the disturbed areas such that the delivery of solutes and suspended sediment from the disturbed footprint in the minesite catchments (eg Corridor and Georgetown Creeks) will not compromise the post closure environmental objectives for the waterbodies.
In this project, the structure of lentic macroinvertebrate communities is being used as the environmental response indicator for developing water quality closure criteria for waterbodies adjacent to the mine-site. Specifically, the work is being directed at Georgetown Billabong (GTB) which is the largest natural and still largely unimpacted waterbody in close proximity to the operational mine area. During each wet season Georgetown Billabong receives low level inputs of mine-derived solutes from Corridor Creek (Map 2).
The approach to deriving such criteria from local biological response data follows that outlined in the Australian and New Zealand Water Quality Guidelines (ANZECC & ARMCANZ 2000). Briefly, if the post-closure condition in Georgetown Billabong is consistent with similar undisturbed (reference) billabong environments of Kakadu, then the range of water quality that supports this ecological condition (as measured by suitable surrogate biological indicators) may be used for this purpose.
32

Development of surface water quality closure criteria for Ranger billabongs using macroinvertebrate community data(C Humphrey, K Turner & D Jones)
Summary of studies conducted between 2006 and 2009
Results of macroinvertebrate sampling in billabongs and other waterbodiesMacroinvertebrates have been collected from mainly macrophyte (water column) habitat in GTB several times, including 1978 (pre-mining), 1995, 1996 and 2006. On the first three of these occasions, the macroinvertebrate communities of this billabong consistently resembled those of reference waterbodies in the ARR, suggesting that the historical water quality regime in GTB was compatible with the maintenance of the aquatic ecosystem values of KNP.
In 2006, macroinvertebrates were collected from both macrophyte and benthic (sediment) habitats in GTB with the samples from each habitat being processed separately. Whilst the aggregated data showed essentially no difference between macroinvertebrate communities of GTB and reference billabongs, and hence were in agreement with the results from the previous surveys, when the macrophyte and benthic data were analysed separately it was found that the sediment-dwelling communities were less diverse in GTB than in reference waterbodies (Humphrey et al 2009). This raised the question as to whether the lower diversity of benthic macroinvertebrates in GTB could have been the result of accumulation of mine-derived solutes in the sediments and flagged the need to specifically investigate this issue.
Sediment U concentrations along GTB in 2007In 2007–08, an investigation commenced to determine whether the lower benthic diversity in GTB was related to mine inputs or habitat type. In this context it should be noted that the concentration of U in GTB has always been higher than in reference waterbodies in the region. This higher value is likely the result of downstream transport of erosion products from the top of the Ranger 1 orebody in the upper catchment of GTB.
The most recent work has involved studies of sediment chemistry and sediment physical structure. Sediment samples collected from four littoral sites along the western side of GTB in 2007 (Figure 1) showed concentrations of U (mean of all samples ~42 mg/kg, range 30–63 mg/kg, n = 11) higher than U concentrations previously measured by ERA and others (Iles & Klessa 2008, Humphrey et al 2009, 2010) in GTB over the past 25 years. This raised the possibility that there could have been a substantial rise in the mean U concentration between 2001 and the present, noting that the 2007 samples were specifically collected from the western edge, rather than a mix of western-edge and central billabong locations as previously.
Identification of outstanding sediment chemistry characterisation required for GTBBecause of (1) a substantial gap of 5 years in the collection of U sediment data between 2001 and 2007, (2) differences in locations within GTB at which samples have been collected over time, and (3) differences in methods of chemical analysis, it was unclear whether there had actually been a recent rise in U across the billabong as a whole. To address these questions, the following investigations were initiated: (i) re-analysis of U using similar methods to the 2007–08 study, in a number of GTB sediment samples collected in 2006 by ERAES (ERA Environmental Strategy), (ii) sampling of a lateral transect across the billabong in 2009 to determine the profile of U concentrations across the waterbody, (iii) different chemical analysis methods for U extraction in selected historical samples (to quantify dependence of U extraction

KKN 2.5.1 Development and agreement of closure criteria from ecosystem establishment perspective
on the various analytical methods used in the past), and (iv) the dependence of U concentration on particle size, as well as mineralogical characterisation, using selected historical samples.
Characterising physical properties of GTB sedimentsThe littoral sediments in GTB consist mainly of fine cracking clays, and are generally devoid of surface vegetation during the dry season when the sediment exposed around the gently sloping margins undergoes desiccation-induced cracking. Of the billabongs sampled, these conditions appeared to be unique to Georgetown and Coonjimba Billabongs, and suggest that the physical nature of the sediments may be an important factor contributing to the low diversity of benthic organisms. The very fine particle size of suspended sediments in GTB relative to other billabongs was noted by Walker and Tyler (1982). Should these sediments dry out substantially and harden when exposed in the dry season, life stages of benthic organisms adapted to seeking refuge in sediments upon exposure and drying may not be able to persist. Moreover and once re-wetted in the wet season, such sediments may not rapidly return to a sufficiently softened and yielding form for residence by sediment-dwelling organisms. To resolve this potential compaction issue, a program of measuring sediment penetration resistance (using a penetrometer) was initiated.
Figure 1 Map of Georgetown Billabong showing four sampling locations from which sediments were collected in August 2007 for chemical analysis
The results of these investigations, together with a dedicated field assessment of U sediment toxicity that is currently underway (see Harford et al 2010, pp 32–36 in this volume) will determine whether or not the lower benthic macroinvertebrate diversity in GTB is related to current mining activities. If unrelated to mining activities, it would confirm that the historical

Development of surface water quality closure criteria for Ranger billabongs using macroinvertebrate community data(C Humphrey, K Turner & D Jones)
water record can be used to derive closure criteria that are protective of both lentic and benthic macroinvertebrate communities, notwithstanding there has been an increase in solute loads in the billabong between 1996 and the present (2010).
Progress to dateWhilst there have been some delays, because of higher priorities elsewhere in the environmental chemistry work program, in several aspects of the work program originally proposed for 2009–10, good progress has been made.
1. Processing of sediment samples collected in 2006 by ERAESOf all the archived samples from this sampling program, only one has a matching collection location and particle size distribution common to the samples that have previously been collected and analysed by ERA and others. Processing and chemical analysis of this sample are underway.
2. Cross-billabong metal concentrations in sedimentSediment samples were collected from GTB along a transect located at the northern (downstream) end of the billabong near the Georgetown-Magela Creek confluence (gauge board site) in May 2009. The western starting point of the transect was at location A (Figure 1), at the littoral margin on the western side, which coincided with one of eriss’s macroinvertebrate sampling sites from 2006. This sampling was conducted in order to quantify the extent of cross-billabong variation of metal concentrations and thereby ascertain whether sample location was having a critical influence on the concentrations of U present in the sediment.
A single sample of the top 5 cm of sediment was collected at each location along the transect. A trowel was used in shallow waters, and an Ekman grab in deeper waters where hand collection was not possible. The < 63 µm fraction was separated for analysis since this fraction is considered to be the most relevant for biological interaction with benthic biota. The proportion of the < 63 µm fraction in each sample is shown in Table 1. A strong acid digest (nitric/perchloric) was used for consistency with previous strong acid digest methods that had been used. The results showed a substantial gradient in U concentration across GTB from highest on the western side (closest to the minesite), to lowest on the eastern side, adjacent to Magela Creek (Figure 2).
Table 1 Fraction of fine sediment (< 63 µm) in samples collected along an W-E transect (starting at A in Figure 1) of Georgetown Billabong in May 2007
Location (metres from western edge) Proportion of sediment sample < 63 µm (%)
0 61
10 86
20 80
30 80
40 92
50 21
60 40
70 47
80 81
90 77

KKN 2.5.1 Development and agreement of closure criteria from ecosystem establishment perspective

Development of surface water quality closure criteria for Ranger billabongs using macroinvertebrate community data(C Humphrey, K Turner & D Jones)
The eastern side of the billabong closest to Magela Creek receives greater flushing by Magela Creek during high flow events, and thus is less likely to accumulate U-enriched particles originating from further upstream in the GTB catchment. Additionally the water column would likely be more diluted towards the eastern edge resulting in lower U concentrations in the water column and hence less uptake by the sediment. Both of these mechanisms could explain the lower concentrations on the eastern side.
0
5
10
15
20
25
30
35
40
0 10 20 30 40 50 60 70 80 90
Sampling distance along cross-section (m)
Ura
nium
con
cent
ratio
n (m
g/kg
)
West EastWes
Figure 2 Uranium concentration of sediments collected along a transect in GTB (west to east) in May 2009. Uranium extracted using Nitric/perchloric digest of <63 µm fraction. A single sample was collected
at each location.
The marked gradient in sediment U concentrations across GTB highlights potential problems in assessing time series data obtained from samples that have been collected at a number of different locations (eg the interannual trends reported in Humphrey et al 2009). In this context it should be noted that most of the previous samples were collected towards the western edge of the billabong at its downstream end.
It is critical that both the location in GTB, and time of year when samples were collected, are reported otherwise apparent trends could be the result of spatial artefacts created by sampling near the water’s edge, given that this position depends on when in the season the sampling is done. For example, a sediment sample collected from GTB in November 1978 upstream of the transect at A referred to in Figure 1 – but in a similar central channel location across the billabong (east to west) and with similar fine silt and clay characteristics – had a U concentration of 16 mg/kg (Noller & Hart 1993). This value is very similar to the contemporary value reported for the corresponding central location (downstream), sampled in 2009 (Figure 1).
The above discussion indicates the need to conduct a dedicated sediment sampling and chemical analysis program in GTB which would include sampling across a number of transects located along the billabong. This characterisation would provide a more robust reference condition against which to quantify future changes in sediment U concentrations and for designing an effective monitoring program to detect such changes.

KKN 2.5.1 Development and agreement of closure criteria from ecosystem establishment perspective
3. Comparison of sediment digest methodsSediment digest methods will be compared using a common set of samples to determine if the historical data need to be ‘normalised’ to account for differences in sediment digest efficiency factors. If required, this normalisation should remove or substantially reduce variation in U results introduced by the use of different digest methods through time.
Samples collected from GTB in proximity to the gauge board in 2007 by SSD will be analysed for total U concentration using X-Ray Fluorescence and Gamma Spectrometry methods. U extraction efficiencies for the different acid digest extraction techniques used by SSD and ERAES through time will also be determined. This work will be carried out in early 2011.
4. Physical characteristics of sediments in billabongs A penetrometer was used to measure the extent of compaction of exposed (dry season) littoral sediments (Figure 2). The hypothesis being tested was that billabongs dominated by fine-grained sediment (GTB and Coonjimba Billabong) would contain more compacted sediments than other sandier reference billabongs.
Figure 2 Penetrometer being used in Malabanbandju Billabong
Exposed sediment penetration studies were carried out at Sandy, Buba, Anbangbang, Malabanbandju, Wirnmuyurr, Corndorl, Gulungul, Baralil and Georgetown Billabongs and Jabiru Lake between 19th and 21st September 2010. Ranger retention ponds RP1 and RP2 and Coonjimba Billabong downstream of RP1 were measured on 14 th October 2010. At each of the waterbodies, penetration was measured along transects perpendicular to the water’s edge at 5 sites coinciding with the locations from which macroinvertebrate samples had been collected in May 2006 (the last time that a comprehensive macroinvertebrate survey had been undertaken for the billabongs). These data are awaiting analysis.
Pending the outcome of sediment-related studies described above, the water quality record for 2006 has been included in the database used to derive an acceptable ceiling water quality sufficient to protect the macroinvertebrate communities of GTB post-closure. The combined 1995, 1996 and 2006 data (corresponding to years for which macroinvertebrate data were obtained) have been used to derive provisional water quality closure criteria for the water column (Jones et al 2008). Of course, the meeting of numerical closure values specified for a

Development of surface water quality closure criteria for Ranger billabongs using macroinvertebrate community data(C Humphrey, K Turner & D Jones)
limited range of measured water quality parameters needs to be considered in the context of providing reassurance that the aquatic ecosystem is actually remaining protected from post-closure impacts. Thus periodic post-closure surveys of macroinvertebrate communities should be part of the post-closure monitoring regime for natural waterbodies downstream of the rehabilitated Ranger ‘footprint’.
Any new data arising from periodic sampling of macroinvertebrates from GTB during the operational phase will contribute to a rolling assessment and potential refinement of the currently-proposed water quality closure criteria. The results from the companion U in sediment toxicity study (Harford et al, pp 32–36 this volume) will also inform the setting of water quality criteria for GTB, ensuring water quality criteria are not relaxed to thresholds that could adversely impact upon sediment quality, by virtue of the adsorption to sediment of U initially present (at concentrations lower than that required to protect lentic macroinvertebrates) in the water column.
ReferencesANZECC & ARMCANZ 2000. Australian and New Zealand guidelines for fresh and marine
water quality. National Water Quality Management Strategy Paper No 4. Australian and New Zealand Environment and Conservation Council & Agriculture and Resource Management Council of Australia and New Zealand, Canberra.
Harford A, van Dam R, Humphrey C, Jones D, Simpson S, Stauber J, Gibb K & Streten-Joyce C 2011. The toxicity of uranium to sediment biota of Magela Creek backflow billabong environments. In eriss research summary 2009–2010. eds Jones DR & Webb A, Supervising Scientist Report 202, Supervising Scientist, Darwin NT, 32–36.
Humphrey C, Turner K & Jones D 2009. Developing water quality closure criteria for Ranger billabongs using macroinvertebrate community data. In eriss research summary 2007–2008. eds Jones DR & Webb A, Supervising Scientist Report 200, Supervising Scientist, Darwin NT, 130–135.
Humphrey C, Jones D & Turner K 2010. Development of surface water quality closure criteria for Ranger billabongs using macroinvertebrate community data. In eriss research summary 2008–2009. eds Jones DR & Webb A, Supervising Scientist Report 201, Supervising Scientist, Darwin NT, 140–142.
Iles M & Klessa DA 2008. Characterisation of Ranger Wetland and Billabong Sediments. Volume 1, A Literature and Data Review for the Period 1981–2002. Prepared for ERA Ltd by EWL Sciences Pty Ltd.
Jones D, Humphrey C, Iles M & van Dam R 2008. Deriving surface water quality closure criteria – an Australian uranium mine case study, In Proceedings of Minewater and the Environment, 10th International Mine Water Association Congress, eds N Rapantova & Z Hrkal, June 2–5, Karlovy Vary, Czech Republic, 209–212.
Noller BN & Hart BT 1993. Uranium in sediments from the Magela Creek catchment, Northern Territory, Australia. Environmental Technology 14, 649-656.
Walker TD & Tyler PA 1982. Chemical characteristics and nutrient status of billabongs of the Alligator Rivers Region, NT. Open file record 27, Supervising Scientist for the Alligator Rivers Region, Canberra. Unpublished paper.

KKN 2.5.1 Development and agreement of closure criteria from ecosystem establishment perspective
Effects of fine suspended sediment on billabong limnology
C Humphrey, D Buckle & D Jones
Background and aimsThis paper provides an update on a study designed to assess the effects of fine suspended sediment on billabong limnology, initially reported in Buckle et al (2010). The project is part of a portfolio of projects that are progressing the development of local water quality criteria relevant to both mine operations and mine closure.
As reported by Buckle et al (2010), the project aims to review, determine and infer the effects of fine suspended sediment on billabong limnology (physico-chemistry, primary production) using field water quality and biological effects data from both historic as well as new investigations.
The findings from the study will be used as:
i a component of a multiple lines of evidence approach to assessing effects of suspended sediment on tropical freshwater biota (complementing a current laboratory-based project developing ecotoxicological test procedures for suspended sediment – ‘The effects of suspended sediment on tropical freshwater biota’, Harford et al 2010); and
ii to assist with developing suspended sediment/turbidity surface water guideline criteria for both the operational and closure phases of the Ranger minesite.
Suspended sediment has been identified as an aquatic ecosystem stressor that will most likely assume greater significance in the future, as a consequence of major disturbances of surface materials occurring during rehabilitation works on the Ranger site (Harford et al 2010). Billabongs immediately downstream of Ranger are at greatest risk from erosion of fine particulate matter. For example, Humphrey (1985) and Nanson et al (1990) document high suspended solids loadings and significant sedimentation in Coonjimba Billabong as a consequence of the failure of new earthwork structures after an intense rain-storm event that occurred over the Ranger site in February 1980.
The most recent investigations have monitored the effects on billabong limnology of natural increases in turbidity that occur over the late dry season in shallow backflow billabongs adjacent to Ranger. Turbidity may disrupt a number of ecosystem functions, with one of the best-documented of these being primary (plant) production through attenuation of light. It was hypothesised that a threshold value of turbidity, above which important billabong photosynthetic functions are disrupted, may be able to be inferred from the data. This field-observed threshold would complement the findings from laboratory studies.
Data from previous limnological studies conducted in the region have been reviewed to examine possible relationships between turbidity, chlorophyll-a and dissolved oxygen. The field investigation conducted in Georgetown Billabong (GTB) during the dry season of 2009 (Buckle et al 2010) used in situ continuous (5 minute intervals) measurements of dissolved oxygen and turbidity, near-surface and at depth, for the period May to October/November 2009 (with the aim of encompassing the period of significant dry season increase in turbidity
40
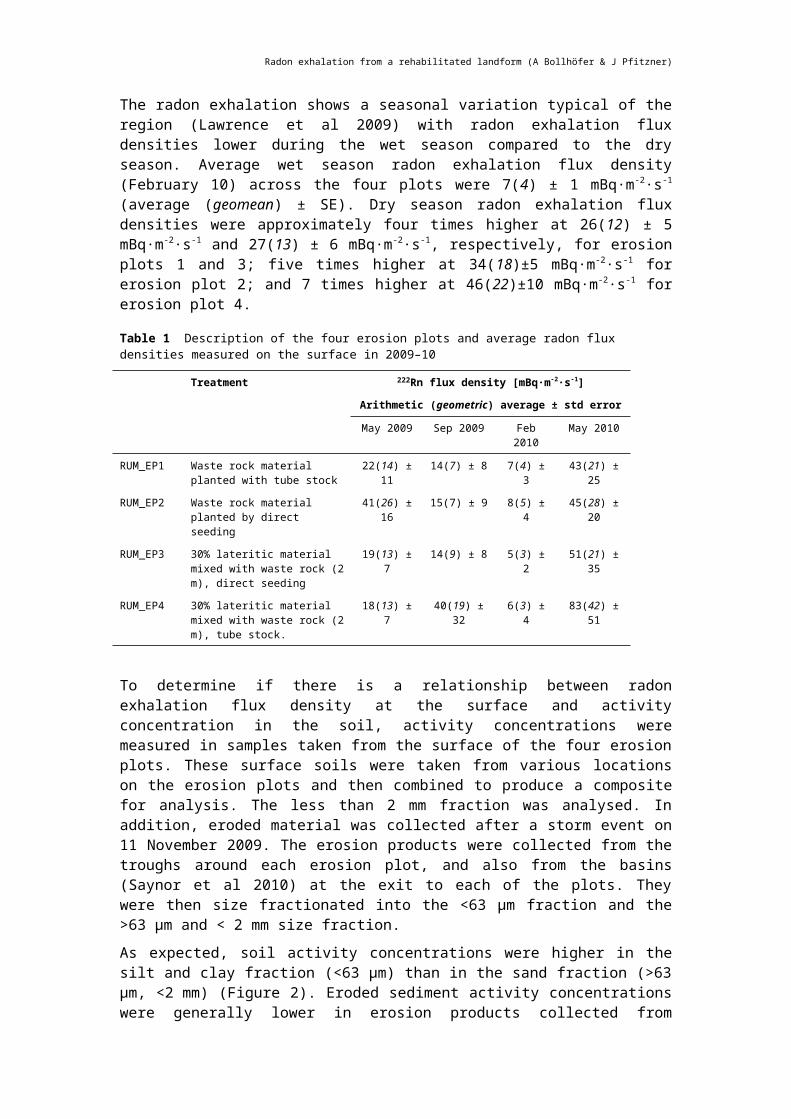
Effects of fine suspended sediment on billabong limnology (C Humphrey, D Buckle & D Jones)
in the billabong). Depth profiles of water quality parameters and photosynthetically available radiation (PAR), together with surface and depth samples for chlorophyll-a (phytoplankton abundance) and dissolved organic carbon (produced by decay of plant matter and contributing to biological oxygen demand) determinations, were collected fortnightly over this period. The grab samples were also analysed for suspended sediment (SS) concentrations (0.45–63 μm fraction) to provide a correlation between turbidity and SS.
The major outcome from the review of historical data and analysis of data collected in 2009 was the unimodal relationship observed between near-surface chlorophyll-a and turbidity (Buckle et al 2010). For the data collected in 1980–81 by Humphrey and Simpson (1985), phytoplankton production appeared to be inhibited at turbidity values around 50 NTU. While the 2009 data appeared to support the historical threshold effect discerned in the 1980–81 data, the relationship was less evident due to the generally lower turbidity values observed in 2009 (only one turbidity value recorded above 30 NTU; Buckle et al 2010). Given the lack of turbidity values above 30 NTU for the 2009 dry season and the changed (lower) turbidity conditions observed since 1981 in GTB (Figure 1), Buckle et al (2010) recommended further sampling of chlorophyll-a and turbidity through the 2010 dry season in order to capture a higher turbidity period in the event that this occurred.
Progress during 2010Regular grab samples of water for turbidity measurement were collected from Georgetown Billabong through the 2010 dry season. ERA turbidity data were also examined regularly to identify any increase in turbidity over 30 NTU. To have a noticeable influence on phytoplanktonic growth, sustained periods of increased turbidity would be required. Hence short (< 7 days) duration events over 30 NTU were not sampled.
Monthly turbidity data from 1980 and 1981 (Humphrey and Simpson 1985), data collected between 1982 and 2008 by Energy Resources of Australia (ERA), as well as data collected during 2009 and 2010 by eriss and ERA, are shown in Figure 1.
0
50
100
150
200
250
300
Jan
Feb
Mar Ap
r
May Jun
Jul
Aug
Sep
Oct
Nov
Dec
Month
Ave
rage
turb
idity
(N
TU)
19801981Avg 1982-200820092010
Figure 1 Average monthly turbidity (NTU) for Georgetown Billabong from 1980 to 2010. eriss data used for 1980, 1981 and 2009 (June – October). Energy Resources of Australia data used for 1982–
2008 and November 2009 – November 2010.

KKN 2.5.1 Development and agreement of closure criteria from ecosystem establishment perspective
Possible reasons for the reduction in late dry season turbidity in Georgetown Billabong surface waters between 1980 and the present were discussed in Buckle et al (2010). Suffice it to say that the relatively low late dry season turbidity that was observed in 2009 was again seen in the 2010 dry season (Figure 1). While turbidity will be again monitored in the 2011 dry season it is quite possible that turbidity levels much greater than 30 NTU in Georgetown Billabong will now be the exception rather than the rule as they were in the 1980s and 1990s. In this event the 1980s data will be the most appropriate to use to discern the effects of turbidity upon phytoplanktonic production.
Further workGeorgetown Billabong will be monitored in the 2011 dry season to check whether any sustained periods of turbidity above 30 NTU occur. In this event dissolved oxygen and turbidity profiles will be frequently measured and grab water samples will be collected for determination of chlorophyll-a. Determining the proportion of organic and inorganic material contributing to the suspended sediment should also be considered to provide additional insights into the effect of algal self shading.
It should be noted that the material that has been presented to date (Buckle et al (2010) and above) represents only a subset of that collected mainly in 2009. Analysis of the complete dataset is yet to be completed and may yield more insights than have been discerned to date.
ReferencesBuckle D, Humphrey C & Jones D 2010. Effects of fine suspended sediment on billabong
limnology. In eriss research summary 2008–2009. eds Jones DR & Webb A, Supervising Scientist Report 201, Supervising Scientist, Darwin NT, 143–149.
Harford A, Saynor M, van Dam A, Hogan A & White D 2010. The effects of fine suspended sediment on tropical freshwater biota. In eriss research summary 2008–2009. eds Jones DR & Webb A, Supervising Scientist Report 201, Supervising Scientist, Darwin NT, 32–36.
Humphrey CL 1985. Recent history of Coonjimba Billabong. In Alligator Rivers Region Research Institute Annual Research Summary 1984–85. Supervising Scientist for the Alligator Rivers Region, Australian Government Publishing Service Canberra 1985, 48–49.
Humphrey CL & Simpson RD 1985. The biology and ecology of Velesunio angasi (Bivalvia: Hydiidae) in the Magela Creek, Northern Territory (4 parts). Open file record 38, Supervising Scientist for the Alligator Rivers Region, Canberra. Unpublished paper.
Nanson GC, East TJ, Roberts RG, Clark RL & Murray AS 1990. Quaternary evolution and landform stability of Magela Creek catchment, near the Ranger Uranium Mine, northern Australia. Open file record 63, Supervising Scientist for the Alligator Rivers Region, Canberra. Unpublished paper.

KKN 2.5.2 Characterisation of terrestrial and aquatic ecosystem types at analogue sites
Use of vegetation analogues to guide planning for rehabilitation of the Ranger minesite
C Humphrey, G Fox, G Staben & J Lowry
Background and aimsCharacterisation of plant communities from appropriate natural analogue sites will assist in selection of species for revegetation of the Ranger mine landform following decommissioning of the site. The characteristics of these communities will also assist in developing numerical performance measures (closure criteria) against which the success of the revegetation can be tracked. For the range of key vegetation community types that represent the spectrum of environments likely to be found across the rehabilitated footprint, relationships between the occurrence of such communities and key geomorphic features (eg soil type, slope, effective soil depth, etc.) of the landscape need to be identified. By identifying the key environmental features that are associated with particular vegetation community types, either (i) the conditions required to support these communities or, alternatively, (ii) the community types that best suit particular environmental conditions, may be specified for the rehabilitated landform at Ranger.
Data previously obtained by eriss and ERA Environmental Strategy (ERAES, formerly Earth Water Life Sciences) on plant communities in the ARR, including data from reference and analogue sites, have been used to identify and characterise target communities that will provide a basis for rehabilitation and subsequent post-closure monitoring. The collective data from analogue/reference sites are being used to derive plant-environment relationships with the aim of developing predictive models based upon physical and chemical input variables.
Studies conducted between 2003 and 2009The following points summarise the vegetation surveying and modelling carried out between 2003 and 2009:
1 Gathering of plant community data by ERAES from 20 plots located in a small analogue area (400 ha) to the east of the Ranger site, the ‘Georgetown analogue site’ (Hollingsworth & Meek 2003), and modelling (by ERAES) of key species according to major landform characteristics (Hollingsworth et al 2007).
2 Gathering of plant community data by eriss from additional areas of the ARR, including hill slopes and lowland sites near Ranger minesite (from Brennan 2005) as well as woodland areas of low relief in the Gulungul Creek catchment (from Staben et al 2009). Multivariate classification of the combined ERAES (from 1 above) and eriss data, representing 121 sites, identified three main vegetation community types, Melaleuca woodland, mixed eucalypt woodland and dry mixed eucalypt woodland (Humphrey & Fox 2010).
3 Collection by eriss and ERAES in 2006 of soil physical and chemical characteristics from hill slope in the broader ARR (Brennan 2005) and Georgetown analogue sites, from 1 above. An analysis was performed to identify possible soil property-plant relationships
43

KKN 2.5.2 Characterisation of terrestrial and aquatic ecosystem types at analogue sites
for these natural analogue sites. However, at best, only weak relationships were found between soil properties and vegetation communities, indicating that physical landscape and landform features were likely to be more critical determinants of community type (Humphrey et al 2009).
4 The modelling conducted by ERAES in item 1 above, did not include the full suite of soil physical and chemical characteristics that had been collected for the analogue sites. Potential problems were also identified with the landscape physical characterisation variables (eg slope angle and length) used in the modelling (Humphrey & Fox 2010). This work used a synthesised Digital Elevation Model (DEM), the source components of which are being reassessed for accuracy and applicability by eriss (see below).
Studies conducted since 2009The three major vegetation groups identified from the 121-site data set referred to above (item 2), were all found to occur within the relatively small Georgetown analogue area that had been used by ERAES in its original classification studies (see item 1 above). Thus, rather than continuing with plant-environment modelling over the large geographical area represented by the combined eriss and ERAES ARR data set, a decision was made to use the smaller Georgetown analogue area as the basis for acquisition of more detailed future survey data required for modelling purposes. By geographically restricting the area of focus, other sources of variation that may have confounded previous comparisons (eg altitude, parent soil type, broad geographical separation) can be removed.
A workplan was presented to ARRTC at its April 2010 (25 th) meeting that proposed the following tasks:
1. Conduct additional plant surveys on the Georgetown analogue area to increase the number of sites represented in some of the currently under-represented classification groups in this area.
2. Further characterise, for inclusion in modelling, the soil properties of sites associated with the different vegetation classification groups represented in the analogue area. (This could include soil properties not previously measured.)
3. Produce a DEM with appropriate resolution for the analogue area and from this re-derive a full suite of landscape variables for inclusion in the terrain modelling analysis. This task is necessary because the original terrain analysis conducted by ERAES used a DEM that was likely of insufficient accuracy to capture the shallow slopes characterising the analogue area. Derivation of the descriptive physical features is especially important given that the landform design criteria contained in the ERA closure model were based on this former terrain analysis.
4. Undertake analyses of the substrate/soil chemistry data from the newly-constructed trial landform and from the various historical rehabilitation trial sites on the Ranger minesite to assess the potential of different types of mine-derived materials to sustain plant communities.
5. Using the data acquired from 1 to 4 above, assess if there are any significant relationships between plant community/species and environmental variables that can be used for predictive purposes. Recently-developed more powerful multivariate techniques will be used to reanalyse the data to determine if more subtle plant-environment relationships had been missed by previous (ie PRIMER BIOENV-based) analyses.

Use of vegetation analogues to guide planning for rehabilitation of the Ranger minesite (C Humphrey, G Fox, G Staben & J Lowry)
The additional vegetation surveys of the Georgetown analogue site in 1 above were conducted between 30th August and 5th September 2010. Fifty sites were selected, with the site locations generated randomly in ARCMap and stratified within five different 5 m contour intervals. Consistent with previous surveys, at each site, every tree and shrub within a 20 m x 20 m plot above 2 metres in height was identified to species level. Height and diameter of each stem at breast height was measured. Canopy cover and ground cover (green grass, dry grass, leaf litter, wood, bare/burnt ground and resprout) along five transects within the plot were also measured with a densitometer.
Landform terrain variables for the 50 sites will be derived from a LiDAR image acquired by ERA in November 2010 for the Georgetown analogue study area. The imagery will be used to produce a very-high resolution DEM with a vertical accuracy of 0.15 metres and a horizontal accuracy of 0.25 m in areas of clear and open terrain. The DEM will be used to produce contours over the study area at an interval of 0.5 metres. In addition to the very high resolution provided by this dataset, a further key advantage of this DEM over earlier DEMs used for ecological modelling of the study area is that the provenance and accuracy of the dataset are clearly defined. This improves the confidence in the landform parameters that will derived for ecological modelling.
Analysis of the vegetation survey data gathered in 2010 is presently underway and is expected to be completed by March 2011. At the time of preparing this report, eriss had just received the LiDAR imagery from ERA. The more comprehensive plant and landform data that will be produced from the recently completed acquisitions should provide a more robust basis for landform design, for specification of closure criteria, and for design of post-rehabilitation monitoring programs.
ReferencesBrennan K 2005. Quantitative descriptions of native plant communities with potential for use
in revegetation at Ranger uranium mine. Internal Report 502, August, Supervising Scientist, Darwin. Unpublished paper.
Hollingsworth ID & Meek IK 2003. Ecosystem reconstruction for the Ranger Mine final landform – phase 2 target ecosystem closure criteria. ERAES Report for ERA Ranger Mine.
Hollingsworth ID, Humphrey C & Gardiner M 2007. Revegetation at Ranger: An analysis of vegetation types and environmental trends in analogue areas. EWL Sciences Pty Ltd. Darwin.
Humphrey C, Fox G & Lu P 2009. Use of vegetation analogues to guide planning for rehabilitation of the Ranger minesite. In eriss research summary 2007–2008. eds Jones DR & Webb A, Supervising Scientist Report 200, Supervising Scientist, Darwin NT, 136–146.
Humphrey C & Fox G 2010. Use of vegetation analogues to guide planning for rehabilitation of the Ranger minesite. In eriss research summary 2008–2009. eds Jones DR & Webb A, Supervising Scientist Report 201, Supervising Scientist, Darwin NT, 150–154.
Staben G, Saynor MJ, Moliere DR, Hancock GR & Evans KG 2009. Assessment of the significance of extreme events in the Alligator Rivers Region – impact of Cyclone Monica on Gulungul Creek catchment, Ranger minesite and Nabarlek area. In eriss research summary 2007–2008. eds Jones DR & Webb A, Supervising Scientist Report 200, Supervising Scientist, Darwin NT, 12–19.

KKN 2.5.3 Establishment and sustainability of ecosystems on mine landform
Charles Darwin University seed biology research
S Bellairs1 & M McDowell1
IntroductionCharles Darwin University (CDU) staff are undertaking seed biology research to optimise germination of local native species to support the rehabilitation of the Ranger minesite. The project involves collaboration between the CDU researchers and staff from eriss, Energy Resources of Australia (ERA), Kakadu Native Plant Suppliers (KNPS), Earth Water Life Sciences (EWLS) (now ERA), Greening Australia and Top End Seeds (TES).
ERA is required to sustainably establish a range of local native species on rehabilitated areas at the Ranger minesite. According to the applicable Environmental Requirements for rehabilitation, the company is required to establish an environment similar to the adjacent areas of Kakadu National Park, using local native plant species similar in density and abundance to those existing in adjacent areas of the Park.
To rehabilitate the areas impacted by the mine footprint, large numbers of plants comprising a broad range of species will be required. Therefore, effective techniques will be needed to source, store and germinate seeds, whether for direct seeding or for production of tube stock. KNPS are both providing seeds and producing tube stock for current rehabilitation areas using nursery facilities in Jabiru. They are collecting seeds from the local area to produce native plants that are adapted to local conditions.
Most Australian species germinate poorly from seeds unless specific seed treatments are applied, since they have seed dormancy mechanisms that prevent or delay germination, except in response to specific cues. However, pre-treatment information is lacking for the vast majority of NT species. Very little information is known about the seed biology of the local (ARR) species, including how to optimise viability of seeds during collection, how to store the seeds, or how to overcome dormancy and germinate the seeds (Bellairs 2007, Bellairs & Ashwath 2007). Tropical flora species are likely to differ in their seed biology responses to environmental cues compared to those of other Australian flora. Therefore, although information from southern Australian studies can be used as a guide, for most species, results obtained for similar southern species are unlikely to be directly applicable. KNPS is also identifying species that are difficult to germinate as part of its nursery operations.
The aim of the project has been to investigate seed viability, germination, dormancy and storage for up to 50 species that occur on the Ranger mine lease that have been identified as potentially important for rehabilitation. The project aims to develop protocols for effective seed storage and germination.
ApproachSeed lots are being supplied by KNPS or from Top End Seeds and Greening Australia when KNPS is unable to provide supplies of seeds. While most seed lots have been obtained from
1 School of Environmental & Life Sciences, Charles Darwin University, NT 0909.
46

Charles Darwin University seed biology research (S Bellairs & M McDowell)
KNPS, factors such as unusual rainfall patterns and cyclones have prevented KNPS from supplying seeds during some seasons and so alternate supplies have been obtained. It is also becoming evident that collection of seeds in sufficient quantities for many of the species is and will be more difficult than originally anticipated. TES collection data indicate that seed lots for some species have not been able to be collected for periods of up to seven years in spite of being able to be collected for several years before and after.
Testing of seeds is being carried out by CDU research staff under standard conditions, in laboratory incubators, to control light, temperature and moisture variations. In this manner, the most effective treatments may be accurately identified without having to use large quantities of seeds. Factors being tested include seed viability following collection, the types of dormancy mechanism(s) present, effective treatments to overcome dormancy and seed longevity under various storage conditions.
Progress to dateThis seed biology project commenced in July 2006. eriss, EWLS, KNPS and CDU project staff met and chose 50 priority species based on (i) their abundance in the Georgetown analogue sites (data provided by EWLS), (ii) their difficulty in propagation (information provided by Peter Christophersen (KNPS)), and (iii) preference for perennial species not likely to create a fire risk on the rehabilitation areas. This list was reviewed in December 2008 and a major review and re-prioritisation carried following the July 2009 project meeting.
Following the July 2009 meeting, a more objective prioritisation process was carried out, based upon the ranking of relative abundance of plant species of each life-form (trees, shrubs and ground cover), and the success to date in collecting and propagating the various species based upon the collective experience of EWLS, KNPS and CDU. For this ranking and scoring approach, EWLS used species quantitative abundance data from combined EWLS and eriss vegetation analogue surveys (Humphrey et al 2007). Separately for trees and shrubs, stem density values were used to rank the species. Then each species was assessed as to whether: (i) tubestock have been used for revegetation at Ranger and Jabiluka; (ii) whether seeds have been successfully germinated by KNPS or CDU; and (iii) whether seeds were available from KNPS. Note that the assessment that germination was observed and seeds were able to be collected was applied if this occurred on at least one occasion. It does not necessarily imply that germination will occur consistently or that seeds are reliably available. Thus in future, there may well be seed biology issues to be overcome with those species which are not considered a priority for seed biology research. Nevertheless, research needs for these species have a lower priority than species for which no knowledge is available. Herb and grass species were ranked according to plant biomass (g dry mass m-2) data from Brennan (2005). These species were then assessed as to whether (i) plants have been recorded as natural recruits in revegetation at Ranger (primarily in the ‘heritage’ revegetation site on the east of the tailings dam wall); (ii) whether seeds have been germinated successfully by KNPS or CDU; and (iii) whether seeds are currently available from KNPS.
The most obvious observation from this reprioritisation is the dearth of seed biology information available for shrubs and ground cover species compared to the greater information available for trees. Thus the focus for seed biology research has shifted to shrubs and groundcover species. However, we do not imply that that seed biology issues have necessarily been overcome for all of species that have been removed from the priority list as a result of this reassessment. For reliable future rehabilitation, further testing of seed lots of all

KKN 2.5.3 Establishment and sustainability of ecosystems on mine landform
species to be used for trials is recommended, at the very least until quantitative data are acquired for three or more seed lots.
As of November 2010, the CDU researchers have investigated the seed biology of 41 priority species. Where CDU has not been able to source seed lots of the priority species, local seeds of other species in the same genus have been obtained and tested. To date 19 other species have been investigated. Priority species supplied by KNPS include 9 seed lots from 8 species in 2006, 14 lots from 14 species in 2007, no seed lots in 2008, 8 lots from 7 species in 2009 and 13 lots from 11 species in 2010. However, very few seeds (< 350) were available for four lots in 2010. Thirty-three other seed lots of priority species have been supplied by other organisations or collected by CDU and a total of 102 seed lots have been supplied or collected. Seed collection is difficult for many of these species and obtaining seeds is made more difficult by considerable seasonal variability in production of mature seeds and by impacts of fire. Obtaining sufficient seeds for large rehabilitation areas is likely to be challenging, even with greater resourcing. Where poor availability of seed stock is identified as a problem, other commercial sources of seed from outside of the ARR might be sought although provenance issues will need to be resolved.
Meetings have been held six monthly to present data and discuss progress. Other meetings between KNPS and CDU have been held in Jabiru to maximise information and technology transfer and assist with identification of species and timing of seed collection. The third annual report was provided in December 2009 (Bellairs & McDowell 2009) updating the previous reports (Bellairs & Crawford 2007, Bellairs & McDowell 2008) and the fourth annual report will be provided in December 2010. An Access database has been developed to store the seed biology data. The research work will continue to test new species and new seed lots of existing species. CDU research training program funding has been used to carry out more detailed work on some of the species.
All of the species have been able to be germinated with appropriate treatment, but some lots have had low viability, especially for some of the grasses. In some cases morphological features that indicate viable seeds have been identified. For some of the species there is substantial reduction in viability over a year but for others there is little decline in viability across several years and thus collection over several years and storage of seed lots is an option for obtaining sufficient seeds. Some species are time consuming to treat to allow germination and the efficiency of other means of propagation could be investigated.
ReferencesBellairs SM 2007. Seed biology of plants of the Australian wet/dry tropics and implications
for Ranger minesite rehabilitation. Internal Report 523, March, Supervising Scientist, Darwin. Unpublished paper.
Bellairs SM & Ashwath N 2007. Seed biology of tropical Australian plants. In Seeds: biology, development and ecology. eds SW Adkins, S Ashmore & SC Navie, CABI Publishing, Oxford UK, 416–427.
Bellairs SM & Crawford J 2007. Seed biology research to optimise germination of local native species to support the rehabilitation of the Ranger minesite. Annual report 2006– 2007. School of Science and Primary Industries, Charles Darwin University, Darwin NT.
Bellairs SM & McDowell M 2008. ERA Ranger Uranium Mine Seed Biology Project. Annual Report 2007–2008. School of Environmental and Life Sciences, Charles Darwin University, Darwin NT.
48

Charles Darwin University seed biology research (S Bellairs & M McDowell)
Bellairs SM & McDowell M 2009. Seed biology research to optimise germination of local native species to support the rehabilitation of the Ranger minesite. Third annual report on progress 2008–2009. School of Environmental and Life Sciences, Charles Darwin University, Darwin NT.
Brennan K 2005. Quantitative descriptions of native plant communities with potential for use in revegetation at Ranger uranium mine. Internal Report 502, August, Supervising Scientist, Darwin. Unpublished paper.
Humphrey C, Hollingsworth I, Gardener M & Fox G 2007. Use of analogue plant communities as a guide to revegetation and associated monitoring of the post-mine landform at Ranger. In eriss research summary 2005–2006. eds Jones DR, Evans KG & Webb A, Supervising Scientist Report 193, Supervising Scientist, Darwin NT, 84–86.

KKN 2.5.4 Radiation exposure pathways associated with ecosystem re-establishment
Bush food concentration ratio and ingestion dose assessment database
B Ryan, C Doering & A Bollhöfer
IntroductionCustomary harvesting by local people of terrestrial bush foods from former mine impacted areas is ultimately likely to become more prevalent following the rehabilitation of the Ranger uranium mine. Bush foods encompass fruits, yams and other flora and fauna. Given the radiological nature of the site the ingestion pathway needs to be taken into account as part of the post rehabilitation radiological dose assessment. This dose assessment is an essential component of the International Standards of Practice (ICRP 2007) required for the operation and rehabilitation of radiological sites, including uranium (U) mines. The results from the assessment will also provide the means for communicating to the local people any issues associated with the consumption of bushfoods obtained from the site.
While little work has been done on the uptake of radionuclides into traditional bush foods across Australia as a whole (see for example Johansen & Twining, 2010), eriss has been measuring activity concentrations of natural-series radionuclides in local bush foods, including animal and plant tissues, in the Alligator Rivers Region (ARR) for more than 25 years. Early studies up to 1997 focused on aquatic environments, resulting in a relatively comprehensive knowledge base for aquatic bush food items in the ARR (Johnston 1987; Martin et al 1995; Martin et al 1998). This knowledge base has been supplemented by more recent studies on some terrestrial bush food items such as buffalo and pig (Martin et al 1998), fruit and yams (Martin & Ryan 2004) and other terrestrial flora and fauna (Ryan et al 2005, Ryan et al 2009). The primary purpose of these data collections has been to facilitate assessment of the possible ingestion dose to local Aboriginal people and provide assurance that there is no unacceptable radiation risk from bush foods obtained from areas affected by past and present uranium mining activities in the region. The data can also be used to calculate concentration ratios, which provide a measure of extent to which radionuclides can be taken up from water or soil into the edible portions of bush foods.
The large amount of data on natural-series radionuclides in bush foods that has been accrued by eriss in the past 25 years has been stored across various media types and file locations. The aim of this project is to firstly check and confirm the reliability of individual data points and then to collate all the validated data in one database to ensure its accessibility and longevity. This database will facilitate access to the material by other researchers across the organisation and outside, and considerably streamline the conduct of site specific assessments of potential ingestion doses to humans from the consumption of bush foods.
MethodsA Microsoft Access database is being developed as a central repository for existing and future eriss data on radionuclide activity concentrations in bush foods (ie plant and animals tissues) and in associated environmental media (eg soil and water). The design of the database will support desktop investigations of regional and site specific variability in radionuclide
50

Bush food concentration ratio and ingestion dose assessment database (B Ryan, C Doering & A Bollhöfer)
accumulation in local bush foods by allowing calculation of concentration ratios. It will also support assessments of the potential committed effective dose to a critical group (or ‘Representative Person’) from the ingestion of natural-series radionuclides in bush foods.
ResultsA fit-for-purpose database framework has been developed using eriss in-house expertise.
More than 1500 individual records containing information on radionuclide activity concentration in various plant and animal tissues, as well as in environmental media, have been retrieved from original source files, quality checked, and entered into the database. All the records have associated geospatial information to enable spatial analysis at a later date and to facilitate incorporation of the data into a bush food geospatial information system (see paper by Walden in this volume, pp 133–135).
The radionuclides that have been analysed in tissue and media samples over the past 25 years are shown in Table 1. It should be noted, however, that not all radionuclides were analysed in all samples. Ryan et al (2005) found that in terms of radiological dose for a mine rehabilitation situation 226Ra, 210Pb and 210Po are of greater importance than the thorium and uranium isotopes. Consequently, analyses for uranium and thorium are conducted less frequently because of their lower dose conversion factors. Radioactive equilibrium of progeny radionuclides in the dietary items is assumed for dose assessment purposes, unless direct measurements of progeny are available.
Table 1 Radionuclides analysed in tissue and media samples of the Alligator Rivers Region
238U-series 232Th-series 235U-series
238U 232Th 227Ac
234U 228Ra
234Th 228Th
230Th
226Ra
210Pb
210Po
The database can be queried to return statistical information on concentration ratio (including arithmetic mean, standard deviation, range and number) for a specified combination of biota, tissue, radionuclide and site, eg buffalo-kidney-210Po-Ranger. It also returns the individual records of radionuclide activity concentration in the tissue and media samples that underpin the calculation. A screenshot of the front-end of the database for concentration ratio queries is shown in Figure 1.
The concentration ratio, expressed as the ratio of radionuclide activity concentration in tissue to that in environmental media, is a key parameter used to predict the uptake of radionuclides by human and non-human biota from the environment. Human dose assessment methods use tissue-to-media concentration ratios to estimate radionuclide accumulation in the edible parts of food items. Non-human biota dose assessment methods use organism-to-media concentration ratios to predict the average whole body radionuclide uptake in plants and animals. The main purpose of measurements by eriss of radionuclide activity concentration in bush foods has been to derive tissue-to-media concentration ratios for various

KKN 2.5.4 Radiation exposure pathways associated with ecosystem re-establishment
radionuclide/food combinations. Although this is primarily in order to assess potential ingestion dose to humans, the measurements are also potentially useful to ascertain organism-to-media concentration ratio for some non-human species. This is needed to determine radiation dose rates to plants and animals using existing biota dose assessment tools such as ERICA and RESRAD-BIOTA (Beresford et al 2010).
Figure 1 Screenshot of data base concentration ratio and activity concentrations [mBq∙kg-1] in food stuffs (Passiflora foetida collected on Ranger lease as an example) in the wet dry tropics
Whilst developing various ingestion dose models and scenarios pertinent to the Alligator Rivers Region it has become apparent that the models should be site specific and take account of local dietary habits, land use and the land use expectations of local people. It has also become apparent that the use of generic concentration ratios for quantifying radionuclide accumulation in food items, such as those given by the International Atomic Energy Agency (IAEA 2010) that are based largely on Northern Hemisphere species, may not be appropriate to the situation in the Alligator Rivers Region. The IAEA, for instance, suggests an average concentration ratio for radium in the tissue of freshwater fish of 4 (IAEA 2010), whereas average tissue-to-water concentration ratio for radium for fish in the Alligator Rivers Region can range from 60 (Archer fish, Toxotes chatareus) to 1000 (Bony bream, Nematalosa erebi) (Martin et al 1995). Consequently, the models used to assess ingestion dose to humans should make use of region specific concentration ratios.
Hypothetical diets for local people have been established by combining information from several sources including a questionnaire developed by eriss and distributed to local Aboriginal people in 2006, information provided by a local supplier of meats to Aboriginal outstations and data gained from the eriss Kakadu bush food project over the last 13 years (Ryan et al 2008). This dietary information, combined with concentration ratios and activity concentrations, can be used to estimate the pre-mining, operational and post-rehabilitation ingestion doses to people at various locations in the ARR and surrounding regions.
52

Bush food concentration ratio and ingestion dose assessment database (B Ryan, C Doering & A Bollhöfer)
Future workThe ingestion dose assessment calculation function of the database is currently being refined to allow estimates of ingestion doses to be made from existing tissue concentration ratios and model diets. It is also anticipated that an additional add-on to the database will be developed to allow retrieval of whole body-to-media concentration ratios that are needed to determine radiation doses to fauna and flora using existing biota dose assessment tools such as the ERICA tool.
AcknowledgmentsAndrew Esparon for coding the database and all personnel involved with sample collection, preparation and analysis of bush foods over the last ~30 years.
ReferencesBeresford NA, Hosseini A, Brown JE, Cailes C, Beaugelin-Seiller A, Barnett CL &
Copplestone D 2010. Assessment of risk to wildlife from ionising radiation: can initial screening tiers be used with a high level of confidence? Journal of Radiological Protection 30, 265–281.
IAEA 2010. Handbook of parameter values for the prediction of radionuclide transfer in terrestrial and freshwater environments. Technical Reports Series 472, International Atomic Energy Agency, Vienna.
ICRP 2007. The 2007 Recommendations of the International Commission on Radiological Protection. International Commission on Radiological Protection Publication 103, Elsevier Ltd.
Johansen MP & Twining JR 2010. Radionuclide concentration ratios in Australian terrestrial wildlife and livestock: data compilation and analysis. Radiation and Environmental Biophysics. DOI 10.1007/s00411-010-0318-9.
Johnston A 1987. Radiation exposure of members of the public resulting from operations of the Ranger Uranium Mine. Technical memorandum 20, Supervising Scientist for the Alligator Rivers Region, AGPS, Canberra.
Martin P, Hancock GJ, Johnston A & Murray AS 1995. Bioaccumulation of radionuclides in traditional Aboriginal foods from the Magela and Cooper Creek systems. Research report 11, Supervising Scientist for the Alligator Rivers Region, AGPS, Canberra.
Martin P, Hancock GJ, Johnston A & Murray AS 1998. Natural-series radionuclides in traditional north Australian Aboriginal foods. Journal of Environmental Radioactivity 40, 37–58.
Martin P & Ryan B 2004. Natural-series radionuclides in traditional Aboriginal foods in tropical northern Australia: A review. TheScientificWorldJOURNAL 4, 77–95.
Ryan B, Martin P & Iles M 2005. Uranium-series radionuclides in native fruits and vegetables of northern Australia. Journal of Radioanalytical and Nuclear Chemistry 264(2), 407–412.
Ryan B, Medley P & Bollhöfer A 2008. Bioaccumulation of radionuclides in terrestrial plants on rehabilitated landforms. In eriss research summary 2006–2007. eds Jones DR, Humphrey C, van Dam R & Webb A, Supervising Scientist Report 196, Supervising Scientist, Darwin NT, 99–103.
Ryan B, Bollhöfer A & Medley P 2009. Bioaccumulation of radionuclides in terrestrial plants on rehabilitated landforms. In eriss research summary 2007–2008. eds Jones DR & Webb A, Supervising Scientist Report 200, Supervising Scientist, Darwin NT, 152–159.

KKN 2.5.4 Radiation exposure pathways associated with ecosystem re-establishment
The Bushtucker database
D Walden
IntroductionFor the past 30 years the concentrations of radionuclides in traditional bushfoods, known as ‘bushtucker’, have been measured by SSD from many locations for a wide range of species. The database currently contains in excess of 1500 records. It continues to be updated on an annual basis with data produced from routine monitoring programs and opportunistic collection (for example, from areas associated with the rehabilitation of the old mine workings in the South Alligator River Valley or provided by, or with the assistance of, local indigenous people) of samples. Although the methodology and findings have been the subject of several journal and conference papers, as well as previous SSD Annual Reports and Research Summaries, there has been no prior integration of this material in an easily accessible spatially enabled format.
Newly available spatial technologies such as the 3-Dimensional virtual Earth/Globe viewing programs (hereafter referred to as virtual globe) such as Google Earth, Arc Explorer and Arc Globe offer a means to integrate and display this complex information in a user friendly format that is able to be accessed by both the local people of the area and the wider public. . The virtual globe software is free for non-commercial applications and is easily downloaded from the internet, making it generally available to the community.
The virtual globe environment will allow the user to navigate around the Alligator Rivers Region using high resolution satellite imagery, and ‘fly’ to sampling sites to view available information. This gives the user a unique perspective of the terrain and appreciation of where the sampling sites are located relative to uranium mines, populated places and favoured bushtucker hunting and gathering sites. This approach to data presentation could be followed for other spatially-based datasets (for example, soils and vegetation) acquired by eriss.
Scope of workThree platforms are being developed – two for public viewing and a third for internal research use only. The first public viewing product is a Keyhole Mark-up Language file (KML) that contains all of the virtual globe features such as callout boxes, terrain flyovers, audio narration and internet page hyperlinks. This compressed file will be available as a standalone download from the internet or on a CD if necessary. It is simply loaded into the virtual globe program and the information tour starts automatically. KML files can also be loaded into web-based viewers such as Google Maps, Bing Maps, Yahoo Maps and Whereis.com to name a few.
The second public viewing product for non-internet users is a movie that has been created in a virtual globe environment and copied to a DVD. The movie will take the viewer on a tour of the bushtucker sampling sites with audio narration and ‘pop-up’ information appearing along the way.
There is a need for caution when presenting data of this nature to the public because interpretation of the results is usually complex and there is potential for confusing or misleading interpretations to be made from individual data points. In the event of data having
54

The Bushtucker database (D Walden)
been published previously in reports or papers, links will be provided to this reference source since they typically contain more detailed explanations and interpretations of the data.
The third ‘internal use only’ product would be similar to the first product but would contain all of the detailed radionuclide information. This product will enable SSD research staff to readily locate all of the available information in a spatial context and facilitate the use of the data across the Division.
Progress/resultsWork on development of the KML files and construction of the internet pages is complete except for photographs of some species. These components provide the basis for all three outputs from this phase of the project. Inclusion of a narration audio (with the possibility of developing a local language version) is being investigated to enhance the quality of the presentation and help guide users through the myriad of sites, species sampled for radionuclides and other features in the presentation.
Figure 1 shows a sample Google Earth image with a callout box containing a graphic, text and links to, in this case, the catchments and major sites where bushtucker has been sampled. Subsequent links point to the species sampled (see Figure 2 for example). Other links provide information about the uranium deposits/mines in the region, a map of all sites and samples collected at them, and a virtual tour of the region and the bushtucker samples.
The dialog box displayed in Figure 2, contains icons that provide a clickable link to web pages with information on measured radionuclides, aspects of the species’ biology and available information on how local Aboriginal people may catch and prepare the food. Both English and Gundjeihmi language names for the species are provided. Gundjeihmi is the major local indigenous language group.
Figure 1 Google Earth snapshot with an information callout box and customised icons
55

KKN 2.5.4 Radiation exposure pathways associated with ecosystem re-establishment
Figure 2 Another Google Earth snapshot showing a callout box with icons for the bushtucker species sampled at that site. Ranger uranium mine and the Arnhemland escarpment can be seen in the distance.
Steps for completion1 Script the content for the narration audio.
2 Add the audio to the presentation.
3 Produce a DVD movie of the Google Earth tour.
4 Commence liaison with the Web and Intranet Management Section (WIMS) of the Department regarding the uploading of the associated bushtucker websites to the Department’s internet site.
5 Upload the KML files to the SSD internet.
56

KKN 2.7.1 Ecological risk assessments of the rehabilitation and post rehabilitation phases
Remote sensing framework for environmental monitoring within the Alligator Rivers Region
R Bartolo, G Staben, K Pfitzner, J Lowry & A Beraldo
IntroductionBroad scale characterisation of landscapes in the Alligator Rivers Region (ARR) is required to be able to place the land surface status of operating and rehabilitated minesites into a regional context. To date there is little information on landscape ecology variables (in the context of rehabilitation, close out and known risks and threats) and their scale of interaction. Application of remote sensing technologies to address this knowledge gap requires the development of a remote sensing monitoring framework. The framework will provide the basis for most efficiently and cost effectively acquiring the required data.
Progress/ResultsIn May 2010, a systematic remote sensing data capture, incorporating full ground control and coincident spectral data collection, was done of the Magela floodplain and Ranger uranium mine. The data capture was undertaken in collaboration with the Tropical Rivers and Coastal Knowledge research hub’s Theme 5.3 project (Food webs and biodiversity: river–floodplain food web studies). Three World-View 2 images covering 730 km2 of the Magela Creek catchment were acquired. Table 1 shows the spectral bandwidth resolution of the satellite’s sensor. The spatial resolution supplied is 0.5 m for the panchromatic band and 2.0 m for the multispectral bands.
Table 1 Spectral bands for the world-view 2 sensor
Sensor band Wavelength
Panchromatic 450–800 nm
Coastal 400–450 nm
Blue 450–510 nm
Green 510–580 nm
Yellow 585–625 nm
Red 630–690 nm
Red Edge 705–745 nm
Near-IR1 770–895 nm
Near-IR2 860–1040 nm
The following scene parameters and data format were requested from the supplier: nadir angle less than 20º; cloud cover threshold 0–15%; and 16 bit data format. The potential capture dates for the imagery provided were May 6, 11, 14, 22 and 25. In order to ensure all required field and calibration data were available at the time of image capture, locational positioning and spectral calibration needed to be collected. Therefore, ground targets with accurate known locations had
57

KKN 2.7.1 Ecological risk assessments of the rehabilitation and post rehabilitation phases
to be deployed prior to 6 May and suitable spectral calibration targets had to be in position, with spectral characteristics measured as close as possible to the time of image acquisition.
Historically, there has been poor ground control for acquiring remote sensing data for the Magela Creek floodplain. High accuracy ground control is especially important in this case given the very low topographic relief of the area. This was achieved for the current capture by collecting 33 ground control points across the image acquisition area (Figure 1a).
Twenty-seven 3.5 x 3.5 m square silver-coloured tarpaulins were positioned on the ground prior to the image acquisition window and six image objects (features such as cross roads evident in previous image data) were selected for measurement. The centre of each of the tarpaulins and image objects were measured with a dGPS (Figure 1c) to within 12 mm x,y accuracy. These ground control points enable accurate orthorectification of the imagery.
Figure 1 Distribution of Ground Control Points (GCPs) across the WV-2 imagery, (b) example of a tarpaulin GCP (site 2) captured by the WV-2 satellite in the panchromatic band, (c) collection of the
dGPS data from the site 2 GCP
Atmospheric correction of satellite imagery using an empirical line method requires that high quality spectral measurements of suitable ground targets are acquired as close as possible to the time (in this case 11:15 am on May 11 and 22) of image acquisition. After testing, using
58
(a)
(c)
(b)

Remote sensing framework for environmental monitoring within the Alligator Rivers Region (R Bartolo, G Staben, K Pfitzner, J Lowry, A Beraldo
laboratory measurements of reflectance spectra, the suitability of various industrial products as ground targets, four materials were chosen to represent dark and bright targets. These were: black synthetic upholstery material (2% reflectance); silver plastic weave tarpaulin (23% reflectance); white plastic weave tarpaulin (67% reflectance); and Tyvec, a building insulation product (95% reflectance). The targets needed to be sufficiently large enough to be detected in the satellite imagery (Figure 2).
Figure 2 Left: Calibration tarpaulins as captured by the WV-2 satellite (panchromatic band, Middle: photographs of targets set up on Brockman Oval at Jabiru, Right: the spectral signal of each
tarpaulin as measured by the ASD SpecPro spectrometer
Prior to the 11:15 am satellite overpass, the four target types were deployed on Brockman Oval, Jabiru. During the satellite overpass, atmospheric solar irradiance data were collected using the ASD FieldSpecPro Spectrometer. Following the measurement of the solar irradiance data, multiple measurements of each of the four ground targets were collected. To assess the accuracy of the empirical line method for calibration of the WV-2 data, spectra of various invariant targets such as deep water, bare earth and well-maintained golf greens were also collected. These spectra were measured on the day of the overpass.
The majority (95%) of the areas of the three requested scenes were captured with the specified scene parameters (nadir angle of 13.8º and total cloud cover <2%) on 11 May. The remaining 5% of one of the scenes was captured on 22 May (nadir angle of 11.6º). All 27
59
Black synthetic upholstery
Silver plastic weave tarpaulin
White plastic weave tarpaulin
Tyvec

KKN 2.7.1 Ecological risk assessments of the rehabilitation and post rehabilitation phases
ground control tarpaulins were visible in the imagery. Figure 1 (b) shows an example of how ground targets appear in the imagery.
Future workTo produce a quality final product suitable for high resolution mapping of vegetation and habitat types, orthorectification of the imagery, atmospheric correction and the development of mapping applications will be required. This work will be done over the next year.
60

61